ileal microbiota of growing pigs fed different dietary ... · phytase content and subjected to...
TRANSCRIPT

B. U. Metzler-Zebeli, W. Vahjen, T. Baumgärtel, M. Rodehutscord and R. Mosenthin
phytase content and subjected to ileal pectin infusionIleal microbiota of growing pigs fed different dietary calcium phosphate levels and
doi: 10.2527/jas.2008-1560 originally published online Oct 9, 2009; 2010.88:147-158. J Anim Sci
http://jas.fass.org/cgi/content/full/88/1/147the World Wide Web at:
The online version of this article, along with updated information and services, is located on
www.asas.org
at Serials/Acq. Dept., Library on May 31, 2010. jas.fass.orgDownloaded from

ABSTRACT: Two experiments with growing pigs were conducted to determine the effects of dietary P and Ca levels, phytase supplementation, and ileal pectin infusion on changes in bacterial populations in the ileum and on ileal and fecal fermentation patterns. Growing pigs (BW 30.1 ± 1.3 kg) were fitted with sim-ple T-cannulas at the distal ileum and were fed a low-P corn-soybean meal control diet (3 g of P/kg), or the control diet supplemented with either 15 g of monocal-cium phosphate (MCP)/kg (Exp. 1) or 1,000 phytase units of phytase/kg (Exp. 2). Daily infusion treatments consisted of either 60 g of pectin dissolved in 1.8 L of demineralized water or 1.8 L of demineralized water as a control infusion, infused via the ileal cannula. In each experiment, 8 barrows were assigned to 4 dietary treat-ments according to a double incomplete 4 × 2 Latin square design. The dietary treatments in Exp. 1 were the control diet with water infusion, the control diet with pectin infusion, the MCP diet with water infusion, or the MCP diet with pectin infusion. In Exp. 2, the pigs received the same control treatments as in Exp. 1 and the phytase diet in combination with water or pectin infusion. Gene copy numbers of total bacteria, Lactobacillus spp., Lactobacillus reuteri, Lactobacillus amylovorus/Lactobacillus sobrius, Lactobacillus muco-
sae, Enterococcus spp., Enterococcus faecium, Entero-coccus faecalis, bifidobacteria, the Clostridium coccoides cluster, the Clostridium leptum cluster, the Bacteroides-Prevotella-Porphyrmonas group, and Enterobacteriaceae were determined by quantitative PCR in DNA extracts of ileal digesta. In Exp. 1, addition of MCP reduced ile-al gene copy numbers of Enterococcus spp. (P = 0.048), E. faecium (P = 0.015), and the C. leptum cluster (P = 0.028), whereas pectin infusion enhanced (P = 0.008) ileal d-lactate concentration. In Exp. 2, supplemental phytase led to greater ileal gene copy numbers of the C. coccoides (P = 0.041) and C. leptum (P = 0.048) clusters and the Bacteroides-Prevotella-Porphyrmonas group (P = 0.033), whereas it reduced (P = 0.027) fecal n-butyrate concentration. Pectin infusion reduced (P = 0.005) ileal gene copy number of the C. leptum cluster. In conclusion, ileal bacterial populations and fermenta-tion patterns are susceptible to changes in the intesti-nal availability of Ca and P as well as to the supply of pectin as a fermentable substrate. Greater intestinal Ca availability decreased the numbers of some gram-positive bacteria, whereas greater P availability in the small intestine caused by phytase activity enhanced the growth of strictly anaerobic bacteria.
Key words: bacteria, calcium phosphate, pectin, phytase, pig, real-time polymerase chain reaction
©2010 American Society of Animal Science. All rights reserved. J. Anim. Sci. 2010. 88:147–158 doi:10.2527/jas.2008-1560
Ileal microbiota of growing pigs fed different dietary calcium phosphate levels and phytase content and subjected
to ileal pectin infusion1
B. U. Metzler-Zebeli,*† W. Vahjen,‡ T. Baumgärtel,§ M. Rodehutscord,* and R. Mosenthin*2
*Institute of Animal Nutrition, University of Hohenheim, 70599 Stuttgart, Germany; †Department of Agricultural, Food and Nutritional Science, University of Alberta, Edmonton, Alberta, Canada, T6G 2P5; ‡Institute of Animal Nutrition, Veterinary Faculty of the Free University of Berlin,
14195 Berlin, Germany; and §Institute of Agricultural and Nutritional Sciences, Martin-Luther-University Halle-Wittenberg, 06120 Halle (Saale), Germany
1 This work was supported in part by grants of the German Re-search Foundation (Bonn, Germany, MO 1406/16-1 and RO 1217/5-1) and BASF (Ludwigshafen, Germany). The German National Academic Foundation (Bonn, Germany) is gratefully acknowledged for providing a scholarship to B. U. Metzler-Zebeli. Appreciation is extended to H. Brehm and M. Steffl of the University of Hohenheim
for performing intestinal surgery and to R. J. Christopherson of the University of Alberta for editing this manuscript.
2 Corresponding author: [email protected] October 14, 2008.Accepted September 24, 2009.
147
at Serials/Acq. Dept., Library on May 31, 2010. jas.fass.orgDownloaded from

INTRODUCTION
The intestinal microbiota and its metabolic activities are considered to be important factors for animal health and performance in growing pigs (Gaskins, 2001). Di-etary factors such as type and inclusion level of fer-mentable carbohydrates (Owusu-Asiedu et al., 2006; Metzler et al., 2009), but also the supply of minerals, including Ca and P, have been shown to be impor-tant modulators of microbial fermentation in rats (Ten Bruggencate et al., 2004), ruminants (Komisarczuk et al., 1987), and pigs (Metzler et al., 2008). Because of environmental concerns, there is constant progress to reduce P excretion by reducing the dietary P content in pig diets, supplementing microbial phytase, or in-troducing reduced-phytate crops into diet formulation (Knowlton et al., 2004; Veum et al., 2007). However, changing the dietary P and Ca supply may affect the bacterial community inhabiting the different segments of the gastrointestinal tract (GIT) of the pig, as shown in studies with rats. A greater dietary intake of Ca and P increased the numbers of ileal and fecal lactobacilli and reduced those of Salmonella enterica serovar Enter-itidis in rats (Ten Bruggencate et al., 2004), but data for pigs are missing. In pigs, bacterial cellulase activ-ity in feces was decreased by dietary phytase addition (Metzler et al., 2008), indicating changes in bacterial composition and activity, particularly with regard to fermentable carbohydrate degradation. Thus, it was hy-pothesized that a different supply of minerals, such as Ca and P, and fermentable carbohydrates may change the bacterial populations in the small intestine and the fermentation patterns in the ileum and colon of pigs. Therefore, the objective of this study was to determine the effect of different dietary levels of Ca and P and microbial phytase supplementation either without or in combination with an ileal infusion of pectin as a fermentable substrate on the ileal microbiota and on microbial metabolites in ileal digesta and feces.
MATERIALS AND METHODS
The research protocol was approved by the German Ethical Commission of Animal Welfare of the Provin-cial Government of Baden-Wuerttemberg. Care of the animals used in this experiment was in accordance with the guidelines issued by German Regulation for Care and Treatments of Animals (Lorz and Metzger, 1999).
Animals and Dietary Treatments
The experiment was conducted at the Institute of Animal Nutrition of the University of Hohenheim (Stut-tgart, Germany). Pigs in the present study were housed and fed as previously described in detail by Metzler et al. (2008). Briefly, 2 experiments with 8 barrows (Ger-man Landrace × Piétrain) each were conducted. At an average BW of 30.7 ± 0.8 kg and 29.5 ± 1.5 kg in Exp. 1 and 2, respectively, the pigs were surgically fitted at
the distal ileum with a simple T-cannula made from ultra-high-molecular-weight polyethylene according to the procedures adapted from Li et al. (1993). The pigs were housed individually in stainless steel metabolic crates (0.8 × 1.5 m), and were able to move around freely and have visual contact with each other. Each crate was equipped with a low-pressure drinking nipple, which allowed free access to demineralized water. The room temperature was kept at 22 ± 2°C. During the 10-d recuperation period after surgery, the feed allow-ance was gradually increased from 100 to 1,000 g/d.
In both experiments, a control diet (Table 1), based on corn and soybean meal, was formulated to meet or exceed nutrient requirements for pigs according to Deutsche Landwirtschaftsgesellschaft (1991) recom-mendations, but with a daily P supply below the actual requirement of the animal (Metzler et al., 2008). The feedstuffs were ground to pass a 3.0-mm mesh screen before incorporation into the diets. In both experi-ments, a suspension of highly methylated apple pectin (Apple Pectin Classic AU 202, Herbstreith and Fox KG, Neuenbürg, Germany; P, 0.08%, and Ca, 0.2%) was in-fused into the ileal cannula by means of a syringe. Be-fore the infusions, pectin was suspended in demineral-ized water at a ratio of 1:30 (wt/wt) and was kept in a water bath at approximately 40°C before being infused. A total of 60 g of pectin was infused 3 times daily, with equal amounts at 0830, 1330, and 1630 h. The amount of pectin infused was gradually increased from 10 to 60 g/d within the first 8 d of each experimental period. A total of 1.8 L/d of demineralized water was infused as a control treatment into the ileal cannula of pigs that did not receive the pectin infusion.
In Exp. 1, the 4 dietary treatments were the control diet with ileal infusion of water or pectin, and the con-trol diet supplemented with 15 g/kg of monocalcium phosphate (MCP) together with ileal infusion of water or pectin. The addition of MCP to the control diet at the expense of cornstarch resulted in dietary P (7.98 g/kg of DM) and Ca (11.49 g/kg of DM) content that exceeded the P and Ca requirements of growing pigs by approximately 60 and 90%, respectively (Deutsche Landwirtschaftsgesellschaft, 1991). In Exp. 2, the 4 dietary treatments included the control treatments of Exp. 1; in addition, the control diet was supplement-ed with 1,000 phytase units of phytase/kg (where 1 phytase unit is defined as the amount of enzyme that liberates 1 mmol of inorganic P/min from 5.1 mM so-dium phytate at 37.0°C and pH 5.5; Natuphos, BASF AG, Ludwigshafen, Germany) in combination with il-eal infusion of water or pectin. Microbial phytase was added to the control diet at the expense of corn starch. In both experiments, the pigs were fed twice daily, in equal amounts at each meal, at 0700 and 1900 h. The diets were fed at a rate of approximately 2.1 times the maintenance requirement for ME (i.e., 106 kcal/kg of BW0.75), which corresponded to 1,000 and 1,200 g/d (as-fed basis) in experimental periods I and II of both experiments, respectively.
Metzler-Zebeli et al.148
at Serials/Acq. Dept., Library on May 31, 2010. jas.fass.orgDownloaded from

Experimental Design and Collection Procedures
Both experiments were arranged according to a dou-ble incomplete (4 treatments × 2 periods) Latin square design. Each dietary treatment was allotted to 2 out of 8 pigs in experimental periods I and II of both ex-periments, which resulted in 4 observations per treat-ment. The dietary treatments were randomized among pigs in both experimental periods to balance for simple first-order carryover effects of one treatment into the following treatment period. Each experimental period comprised 22 d, which included an adaptation period of 15 d. During each experimental period, total col-lection of feces began at 0700 h on d 16 and ended at 0700 h on d 21. Feces were collected using 3-L polyeth-ylene bags and a silicon ring, which was attached at the anal region by means of skin adhesive (Medical Ad-hesive, Hollister, Libertyville, IL) and sticking plaster. After taking subsamples of fresh feces for the analysis of short-chain fatty acids (SCFA), feces were stored at −32°C until analysis. Fecal samples for DNA analysis were collected separately by means of rectal stimulation twice at 1100 h on d 2 and 3 of total feces collection. The samples were stored in sterile 15-mL tubes. Ileal digesta were collected for a total of 24 h during two 12-h intervals: from 0700 to 1900 h on d 21 and from 1900 to 0700 h on d 22. The collection procedure was adapted from the method of Li et al. (1993) by using plastic tubing attached to the barrel of the cannula by elastic bands. Every 2 h, subsamples of ileal digesta of approximately 50 mL were collected for the determina-tion of SCFA and lactate. Subsamples for DNA analy-sis were taken separately and stored in sterile 15-mL tubes. Samples for DNA analysis of ileal digesta and feces were transferred directly to an ice-water bath for a maximum of 10 min and then immediately stored at −75°C. The subsamples of ileal digesta for SCFA and lactate determination were stored at +4°C until the end of each 12-h digesta collection period. Thereafter, they were pooled within pigs and stored at −32°C until SCFA and lactate analyses.
Analytical Methods
Real-Time PCR Assays. Total nucleic acids were extracted from ileal and fecal samples according to the method described in detail by Vahjen et al. (2007). In short, 1 g of sample was sheared with glass beads in a 4 M guanidinium isothiocyanate solution with a bead beater. After phenol-chloroform extraction, crude nu-cleic acids were collected by isopropanol precipitation and purified with commercial spin columns (Machery-Nagel, Düren, Germany).
Primer sequences are given in Table 2. All primers were purchased from MWG Biotech (Straubing, Ger-many). A stratagene MX3000p instrument (Stratagene, Amsterdam, the Netherlands) was used for PCR am-plification and fluorescent data collection. The mas-
ter mix consisted of 12.5 µL of Brilliant SYBR Green QPCR Master Mix (Stratagene) or 12.5 µL of Hot-StartTaq Master Mix (Qiagen, Hilden, Germany) for Taqman assays, 0.5 µL of each primer (10 µM), 0.75 µL of ROX reference dye (1:500 diluted), and 10.75 µL of water. One microliter of sample was added before PCR amplification. The PCR products with correct melting temperature profiles were randomly (n = 3 per primer pair) checked by agarose gel electrophoresis (2%). Am-plification involved 1 cycle at 95°C for 15 min for initial denaturation, followed by 40 cycles of denaturation at 95°C for 15 s, primer annealing at the optimal tem-peratures (see Table 2) for 30 s, and extension at 72°C for 30 s. Calibration standards were developed using a series of autoclaved sow feces samples as the most complex sample matrix spiked with different bacterial species and known cell numbers (109 to 103 cells/g of fresh matter), as outlined by Vahjen et al. (2007). The calibration samples consisted of 81 reference and isolate strains, and are given in detail by Vahjen et al. (2007). The strains not mentioned in that study were Bacte-roides fragilis DSM 2151, Bacteroides thetaiotaomicron DSM 2079, Bacteroides vulgatus DSM 1447, Clostridium butyricum DSM 10702, Clostridium cellulovorans DSM 3052, Clostridium coccoides DSM 935, and Clostridium leptum DSM 752. After extraction and purification, these extracts were used as PCR calibration samples,
Table 1. Ingredients and analyzed chemical composi-tion of the control diet in Exp. 1 and 2 (as-fed basis)
Item Amount
Ingredient, % Corn 57.3 Soybean meal 14.0 Cornstarch 10.0 Sugar beet pulp 5.0 Potato protein 5.0 Dried egg white 3.0 Soybean oil 2.0 Limestone 1.2 P-free vitamin-mineral premix1 1.0 Dextrose 1.0 dl-Methionine 0.1 l-Tryptophan 0.1 TiO2 0.3Analyzed chemical composition, % of DM DM 89.3 CP 20.0 Lys 1.1 P 0.3 Ca 0.8 NDF 12.3 ME,2 Mcal/kg 3.75
1Vitamin-mineral premix (BASU-Mineralfutter GmbH, Bad Sulza, Germany) provided per kilogram of diet: vitamin A, 4,000 IU; vitamin D3, 500 IU; vitamin E, 15 IU; menadione, 150 µg; thiamine, 1.7 mg; riboflavin, 2.5 mg; pyridoxin, 3 mg; cobalamin, 18 µg; pantothenic acid, 10 mg, niacin, 15 mg; folic acid, 0.25 mg; biotin, 20 µg; choline chloride, 500 mg; Ca, 1.5 g; Na, 1 g; Mg, 500 mg; Zn, 100 mg; Fe, 100 mg; Mn, 20 mg; Cu, 6 mg; Co, 75 µg; I, 200 µg; Se, 300 µg.
2Calculated according to Deutsche Landwirtschaftsgesellschaft (1991).
Calcium phosphate and gut microbiota 149
at Serials/Acq. Dept., Library on May 31, 2010. jas.fass.orgDownloaded from
and results are expressed as log10 16S ribosomal DNA gene copies per gram of fresh matter.
Chemical Analyses. For analysis of d- and l- lac-tic acid, a commercially available photometric test kit (Boehringer, Ingelheim am Rhein, Germany) was used. Short-chain fatty acid concentrations were measured by gas chromatography (HP 6890 Plus GC-System, Hewlett-Packard GmbH, Waldbronn, Germany) using 4-methyl-iso-valerianic acid as the internal standard. The preparation of samples was performed according to the method of Zijlstra et al. (1977). Ileal samples from day and night collection were pooled per animal and homogenized. Samples of diets were finely ground to pass through a 1.0-mm mesh screen (Laboratory Retsch mill, Haan, Germany) before analysis of proxi-mate nutrients, P, and Ca according to the method of the Verband Deutscher Landwirtschaftlicher Un-tersuchungs- und Forschungsanstalten (Naumann and Bassler, 1997).
Statistical Analysis
Data were analyzed by ANOVA using the MIXED procedure (SAS Inst. Inc., Cary, NC). Fixed effects in-
cluded animal and treatment effects. Period and ani-mal within a square were considered random effects, assuming a compound symmetry variance-covariance structure (type = cs). In Exp. 1, orthogonal contrasts were used to test the effects of ileal pectin application (pectin vs. water infusion), MCP addition (MCP vs. control diet), and the interaction of pectin infusion × MCP diet. In Exp. 2, orthogonal contrasts were used to examine the effects of ileal pectin application (pectin vs. water infusion), phytase supplementation (phytase vs. control diet), and the interaction of pectin infusion × phytase diet. Degrees of freedom were approximated using the Kenward-Rogers method (DDFM = kr). A probability level of P ≤ 0.05 was defined as a significant difference, and trends were discussed up to P < 0.10.
RESULTS
Pigs recovered well from surgery and remained healthy throughout the experiments. No feed refusals occurred. The average BW of pigs was 30.7 ± 0.8 kg and 29.5 ± 1.5 kg at surgery and 53.0 ± 2.8 and 52.8 ± 1.9 kg at the conclusion of Exp. 1 and 2, respectively.
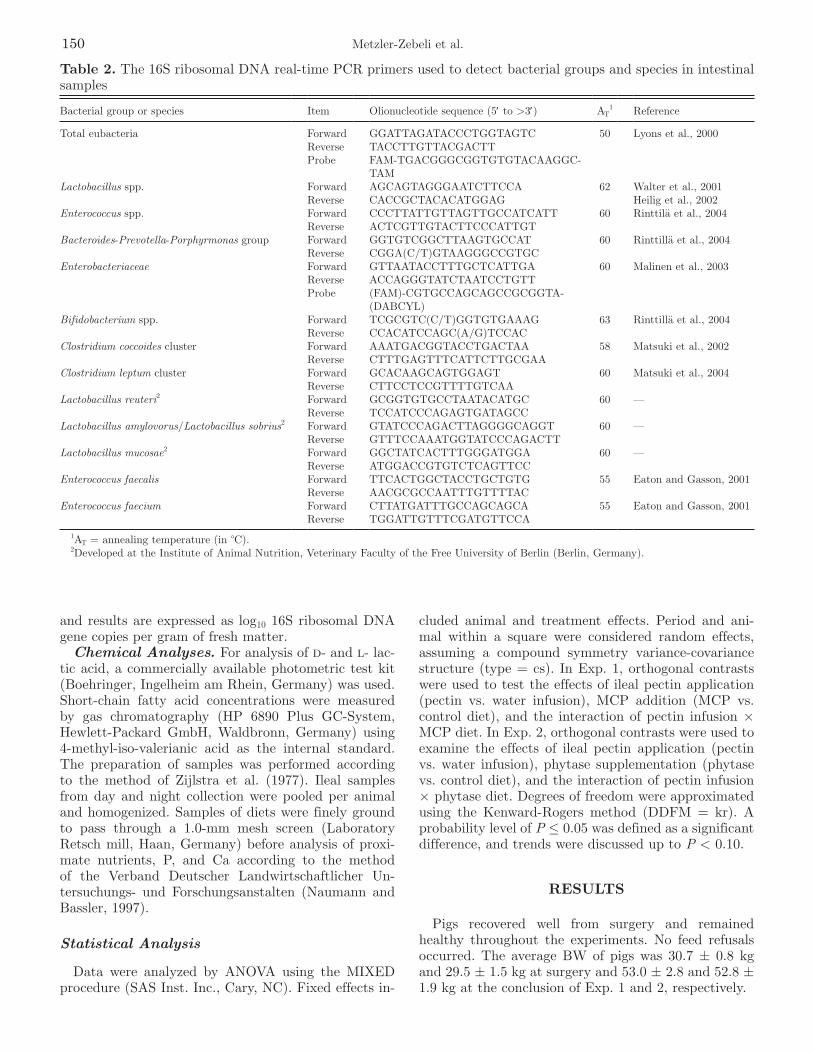
Table 2. The 16S ribosomal DNA real-time PCR primers used to detect bacterial groups and species in intestinal samples
Bacterial group or species Item Olionucleotide sequence (5′ to >3′) AT1 Reference
Total eubacteria Forward GGATTAGATACCCTGGTAGTC 50 Lyons et al., 2000 Reverse TACCTTGTTACGACTT Probe FAM-TGACGGGCGGTGTGTACAAGGC-
TAM
Lactobacillus spp. Forward AGCAGTAGGGAATCTTCCA 62 Walter et al., 2001 Reverse CACCGCTACACATGGAG Heilig et al., 2002Enterococcus spp. Forward CCCTTATTGTTAGTTGCCATCATT 60 Rinttilä et al., 2004 Reverse ACTCGTTGTACTTCCCATTGT Bacteroides-Prevotella-Porphyrmonas group Forward GGTGTCGGCTTAAGTGCCAT 60 Rinttillä et al., 2004
Reverse CGGA(C/T)GTAAGGGCCGTGC Enterobacteriaceae Forward GTTAATACCTTTGCTCATTGA 60 Malinen et al., 2003 Reverse ACCAGGGTATCTAATCCTGTT Probe (FAM)-CGTGCCAGCAGCCGCGGTA-
(DABCYL)
Bifidobacterium spp. Forward TCGCGTC(C/T)GGTGTGAAAG 63 Rinttillä et al., 2004 Reverse CCACATCCAGC(A/G)TCCAC Clostridium coccoides cluster Forward AAATGACGGTACCTGACTAA 58 Matsuki et al., 2002 Reverse CTTTGAGTTTCATTCTTGCGAA Clostridium leptum cluster Forward GCACAAGCAGTGGAGT 60 Matsuki et al., 2004 Reverse CTTCCTCCGTTTTGTCAA Lactobacillus reuteri2 Forward GCGGTGTGCCTAATACATGC 60 — Reverse TCCATCCCAGAGTGATAGCC Lactobacillus amylovorus/Lactobacillus sobrius2 Forward GTATCCCAGACTTAGGGGCAGGT 60 — Reverse GTTTCCAAATGGTATCCCAGACTT Lactobacillus mucosae2 Forward GGCTATCACTTTGGGATGGA 60 — Reverse ATGGACCGTGTCTCAGTTCC Enterococcus faecalis Forward TTCACTGGCTACCTGCTGTG 55 Eaton and Gasson, 2001 Reverse AACGCGCCAATTTGTTTTAC Enterococcus faecium Forward CTTATGATTTGCCAGCAGCA 55 Eaton and Gasson, 2001 Reverse TGGATTGTTTCGATGTTCCA
1AT = annealing temperature (in °C).2Developed at the Institute of Animal Nutrition, Veterinary Faculty of the Free University of Berlin (Berlin, Germany).
Metzler-Zebeli et al.150

Exp. 1
Bacterial Numbers. Total bacterial populations and Lactobacillus spp. in ileal digesta were not affected by pectin infusion (P = 0.778) or by addition of MCP (P = 0.579) to the diet (Table 3). However, there was a trend (P = 0.073) for an interaction of pectin infusion × MCP diet on the gene copy number of total fecal bacte-ria. Pectin infusion increased the gene copy number of total bacteria in pigs fed the control diet, whereas pec-tin infusion in combination with supplemental MCP re-duced the total bacterial gene copy number. There was a decrease in ileal populations of Enterococcus spp. (P = 0.048), Enterococcus faecium (P = 0.015), and the C. leptum cluster (P = 0.028), and a trend toward reduced gene copy numbers for Lactobacillus reuteri (P = 0.062) and Lactobacillus mucosae (P = 0.069) with MCP in the diet. Moreover, pectin infusion tended to increase the ileal gene copy numbers of E. faecium (P = 0.086), Enterococcus faecalis (P = 0.084), and bifidobacteria (P = 0.077). There was an interaction of pectin infusion and MCP diet for the gene copy number of E. faecium (P = 0.005). For pigs fed the control diet, pectin infu-sion reduced the gene copy number of E. faecium, but E. faecium was increased when the pigs were fed the MCP diet. There was also a trend (P = 0.077) toward an interaction of pectin infusion and MCP addition on the gene copy number of bifidobacteria. Pectin infusion increased the number of bifidobacteria in pigs fed the control diet, but decreased bifidobacteria in pigs fed the MCP diet. The gene copy number of Enterobacteriaceae
was not affected by either MCP addition (P > 0.203) or pectin infusion (P > 0.291).
Microbial Metabolites. Dry matter content of ileal digesta was not affected by dietary MCP supple-mentation (P > 0.383) or pectin infusion (P > 0.806; Table 4). Similarly, addition of MCP (P > 0.285) and pectin infusion (P > 0.667) did not affect ileal SCFA concentrations. A greater molar proportion (P = 0.031) of acetate was measured in ileal digesta samples of pigs fed the MCP diet. Infusion of pectin increased (P = 0.008) ileal d-lactate levels and tended (P = 0.082) to increase the molar proportion of isobutyrate. In fe-ces, pectin infusion increased (P = 0.045) n-valerate concentration and tended (P = 0.096) to increase its molar proportion (Table 5). Similarly, pectin tended to increase concentrations of total SCFA (P = 0.072) and acetate (P = 0.064) in feces.
Exp. 2
Bacterial Numbers. There was a trend (P = 0.071) for an interaction of pectin infusion and phytase addition to the diet on total bacteria in ileal diges-ta (Table 6). Pectin infusion decreased the gene copy number of total bacteria in pigs fed the control diet but enhanced the gene copy number of total bacteria when phytase was added to the diet. In contrast, to-tal bacterial populations in feces tended (P = 0.076) to be reduced by phytase supplementation. There were no effects of phytase diet (P = 0.549 to P = 0.961) or pectin infusion (P = 0.683 to P = 0.754) on gene
Table 3. Effects of dietary monocalcium phosphate (MCP) supplementation and ileal pectin infusion on total bacteria in ileal digesta and feces and on bacterial populations (log10 16S ribosomal DNA gene copies/g of fresh matter) in the ileum of growing pigs (Exp. 1)
Item
Treatment1
Contrast, P-valueControl diet MCP diet
SEMWater2 infusion
Pectin3 infusion
Water infusion
Pectin infusion
Pectin vs. water infusion
MCP vs. control
diet
Pectin infusion × MCP diet
Total bacteria Ileum 9.6 10.1 9.2 9.4 0.92 0.778 0.579 0.855 Feces 10.9 11.4 11.8 10.9 0.28 0.549 0.412 0.073Ileal digesta Lactobacillus spp. 10.3 10.0 8.4 9.3 0.77 0.667 0.123 0.767 Lactobacillus reuteri 8.0 7.7 7.4 6.7 0.39 0.222 0.062 0.512 Lactobacillus amylovorus/Lactobacillus sobrius 5.8 5.9 1.9 6.5 1.64 0.164 0.401 0.914 Lactobacillus mucosae 8.3 8.4 7.3 6.6 0.69 0.683 0.069 0.440 Enterococcus spp. 7.3 7.7 7.0 6.7 0.29 0.801 0.048 0.449 Enterococcus faecium 6.4 6.1 5.5 6.2 0.08 0.086 0.015 0.005 Enterococcus faecalis 4.7 7.0 5.7 6.6 0.66 0.084 0.433 0.243 Clostridium coccoides cluster 5.9 5.3 5.3 5.5 5.49 0.823 0.725 0.909 Clostridium leptum cluster 6.2 5.9 4.9 5.0 0.41 0.805 0.028 0.478 Bifidobacteria 5.5 8.6 6.6 6.5 0.79 0.077 0.529 0.077 Bacteroides-Prevotella-Porphyrmonas group 1.7 2.0 2.4 3.2 0.88 0.525 0.289 0.835 Enterobacteriaceae 7.6 7.5 7.7 8.5 0.35 0.291 0.203 0.494
1Values are least squares means of 4 observations per treatment.2A total of 1.8 L of demineralized water was infused per day.3Pectin was suspended in 1.8 L of demineralized water at a ratio of 1:30 (wt/wt).
Calcium phosphate and gut microbiota 151
at Serials/Acq. Dept., Library on May 31, 2010. jas.fass.orgDownloaded from

Table 4. Effects of dietary monocalcium phosphate (MCP) supplementation and ileal pectin infusion on DM content (g/kg), concentrations of lactate (µmol/g of fresh matter), and concentrations and molar proportions of short-chain fatty acids (SCFA; µmol/g of fresh matter) in ileal digesta of growing pigs (Exp. 1)
Item
Treatment1
Contrast, P-valueControl diet MCP diet
SEMWater2 infusion
Pectin3 infusion
Water infusion
Pectin infusion
Pectin vs. water infusion
MCP vs. control diet
Pectin infusion × MCP diet
DM, g/kg 10.7 10.7 10.2 10.5 0.43 0.806 0.383 0.768Concentration, µmol/g of fresh matter d- + l-Lactate 42.5 42.5 22.0 34.7 11.04 0.667 0.285 0.616 d-Lactate 4.5 13.7 0.7 13.0 1.95 0.008 0.325 0.487 l-Lactate 37.9 28.9 21.3 21.8 11.96 0.774 0.359 0.699 Total SCFA 33.7 35.7 47.6 38.4 9.96 0.734 0.441 0.431 Acetate 31.1 29.7 44.1 27.1 8.98 0.468 0.612 0.455 Propionate 4.1 3.5 4.3 2.3 0.80 0.236 0.556 0.416 n-Butyrate 1.9 1.6 2.7 0.8 0.77 0.325 0.979 0.362 Isobutyrate 0.2 0.2 0.3 0.2 0.08 0.425 0.581 0.430 n-Valerate ND4 ND ND ND — — — — Isovalerate 0.3 0.4 0.6 0.3 0.15 0.739 0.324 0.216SCFA molar proportion, % Acetate 82.7 83.8 85.2 87.9 11.53 0.224 0.031 0.489 Propionate 12.3 10.5 8.9 7.4 1.71 0.449 0.106 0.954 n-Butyrate 4.2 4.3 4.3 3.4 0.74 0.673 0.647 0.487 Isobutyrate 0.4 0.5 0.4 0.5 0.03 0.082 0.369 0.126 n-Valerate ND ND ND ND — — — — Isovalerate 0.6 0.9 1.0 1.0 0.13 0.487 0.166 0.254
1Values are least squares means of 4 observations per treatment.2A total of 1.8 L of demineralized water was infused per day.3Pectin was suspended in 1.8 L of demineralized water at a ratio of 1:30 (wt/wt).4ND = below detection level.
Table 5. Effects of dietary monocalcium phosphate (MCP) supplementation and ileal pectin infusion on DM con-tent (g/kg) and on concentrations and molar proportions of short-chain fatty acids (SCFA; µmol/g of fresh matter) in feces of growing pigs (Exp. 1)
Item
Treatment1
Contrast, P-valueControl diet MCP diet
SEMWater2 infusion
Pectin3 infusion
Water infusion
Pectin infusion
Pectin vs. water infusion
MCP vs. control diet
Pectin infusion × MCP diet
DM, g/kg 36.7 35.9 38.8 34.6 1.59 0.247 0.816 0.412Concentration, µmol/g of fresh matter Total SCFA 103.1 138.5 108.1 130.7 10.82 0.072 0.887 0.983 Acetate 57.5 79.7 64.1 75.1 5.88 0.064 0.867 0.374 Propionate 22.5 27.8 22.3 27.0 2.14 0.131 0.850 0.885 n-Butyrate 11.9 15.6 10.3 14.2 1.73 0.151 0.462 0.958 Isobutyrate 2.9 4.0 3.1 3.8 0.47 0.176 0.947 0.724 n-Valerate 2.9 4.8 3.0 4.3 0.49 0.045 0.683 0.602 Isovalerate 5.4 7.1 5.4 6.3 1.07 0.340 0.712 0.738SCFA molar proportion, % Acetate 56.3 57.2 59.8 57.5 1.53 0.712 0.260 0.331 Propionate 21.8 20.1 20.4 20.9 0.75 0.542 0.731 0.205 n-Butyrate 11.2 11.2 9.2 10.6 1.02 0.606 0.261 0.534 Isobutyrate 2.8 2.9 2.8 2.9 0.26 0.824 0.915 0.970 n-Valerate 2.9 3.4 2.7 3.2 0.22 0.096 0.540 0.982 Isovalerate 5.1 5.2 4.9 4.8 0.63 0.985 0.685 0.885
1Values are least squares means of 4 observations per treatment.2A total of 1.8 L of demineralized water was infused per day.3Pectin was suspended in 1.8 L of demineralized water at a ratio of 1:30 (wt/wt).
Metzler-Zebeli et al.152
at Serials/Acq. Dept., Library on May 31, 2010. jas.fass.orgDownloaded from

copy numbers of the lactobacillus group and species as well as on Enterococcus spp. in ileal digesta. However, supplemental phytase decreased (P = 0.002) the gene copy number of E. faecium, whereas pectin increased (P = 0.045) the number of E. faecium. Supplementation of phytase increased the gene copy number of E. faecalis (P = 0.047) and those of the C. coccoides (P = 0.041) and C. leptum (P = 0.048) clusters and the Bacteroides-Prevotella-Porphyrmonas group (P = 0.033). Moreover, phytase tended (P = 0.071) to increase the gene copy number of Enterobacteriaceae. Pectin infusion, in turn, decreased (P = 0.005) the gene copy number of the C. leptum cluster and tended to decrease the gene copy number of the Bacteroides-Prevotella-Porphyrmonas group (P = 0.061). Furthermore, there was a trend (P = 0.062) for an interaction of pectin infusion × phytase on the gene copy number of Enterobacteriaceae. Pectin infusion in pigs fed the control diet tended to cause a smaller gene copy number of Enterobacteriaceae, but with a trend toward greater numbers after phytase sup-plementation.
Microbial Metabolites. Dry matter content of ileal digesta and feces and of ileal concentrations of SCFA and lactate were not affected by dietary phytase supplementation (P = 0.111 to P = 0.972) and ileal pectin infusion (P = 0.150 to P = 0.989; Table 7). In contrast, supplemental phytase reduced fecal concen-tration of n-butyrate (P = 0.027) and its molar propor-tion (P = 0.039; Table 8). Similarly, concentrations of total SCFA (P = 0.080), isobutyrate (P = 0.080), and
isovalerate (P = 0.054) tended to be less in feces of pigs fed the phytase diet.
DISCUSSION
Bacterial Numbers
Feeding of low-P diets and dietary supplementation of exogenous microbial phytase to further improve P utilization are frequently practiced in pig production. However, little information is available on the response of the bacterial community inhabiting the GIT of pigs to differences in intestinal Ca and P availability caused by variations in dietary Ca and P supplies. In the pres-ent study, the ileum was targeted to study the effects of different dietary Ca and P supplies and of phytase supplementation as the terminus of the major area of nutrient absorption in the pig. There, microbial com-munities are less complex than in more distal regions, and biologically relevant effects of diet might be more easily identified (Hill et al., 2005). Overall, estimated values for total bacteria, Lactobacillus spp., Enterococ-cus spp., bifidobacteria, the C. coccoides and C. lep-tum clusters, the Bacteroides-Prevotella-Porphyrmonas group, and Enterobacteriaceae in ileal digesta samples were in the range of those described previously (e.g., Branner et al., 2004; Castillo et al., 2008; Metzler et al., 2009). However, a 2.7- and 1.4-fold increase in to-tal dietary P and Ca content, respectively, after MCP supplementation of the control diet reduced the pro-
Table 6. Effects of dietary phytase supplementation and ileal pectin infusion on total bacteria in ileal digesta and feces and bacterial populations (log10 16S ribosomal DNA gene copies/g of fresh matter) in the ileum of growing pigs (Exp. 2)
Item
Treatment1
Contrast, P-valueControl diet Phytase diet
SEMWater2 infusion
Pectin3 infusion
Water infusion
Pectin infusion
Pectin vs. water infusion
Phytase vs. control
diet
Pectin infusion ×
phytase diet
Total bacteria Ileum 9.9 8.3 9.3 10.9 0.71 0.978 0.220 0.071 Feces 11.9 11.7 10.7 11.3 0.55 0.768 0.076 0.313Ileal digesta Lactobacillus spp. 10.4 10.2 9.9 10.6 0.54 0.698 0.892 0.366 Lactobacillus reuteri 7.2 7.3 7.2 7.4 0.47 0.754 0.961 0.873 Lactobacillus amylovorus/Lactobacillus sobrius 5.6 5.6 3.9 5.4 1.47 0.683 0.549 0.625 Lactobacillus mucosae 8.8 8.3 8.4 8.3 0.73 0.736 0.822 0.774 Enterococcus spp. 7.3 6.2 6.4 7.1 0.38 0.654 0.924 0.061 Enterococcus faecium 6.3 6.2 5.1 5.8 0.12 0.045 0.002 0.146 Enterococcus faecalis 4.9 5.7 7.2 5.4 0.39 0.217 0.047 0.159 Clostridium coccoides cluster 5.0 3.9 5.9 5.3 0.49 0.117 0.041 0.925 Clostridium leptum cluster 5.6 3.7 6.3 5.5 0.33 0.005 0.048 0.126 Bifidobacteria 8.4 7.8 7.5 7.9 0.24 0.726 0.135 0.126 Bacteroides-Prevotella-Porphyrmonas 2.9 1.0 3.7 3.4 0.54 0.061 0.033 0.232 Enterobacteriaceae 6.9 5.7 6.6 8.1 0.43 0.718 0.071 0.062
1Values are least squares means of 4 observations per treatment.2A total of 1.8 L of demineralized water was infused per day.3Pectin was suspended in 1.8 L of demineralized water at a ratio of 1:30 (wt/wt).
Calcium phosphate and gut microbiota 153
at Serials/Acq. Dept., Library on May 31, 2010. jas.fass.orgDownloaded from

Table 7. Effects of dietary phytase supplementation and ileal pectin infusion on DM content (g/kg), concentra-tions of lactate (µmol/g of fresh matter), and concentrations and molar proportions of short-chain fatty acids (SCFA; µmol/g of fresh matter) in ileal digesta of growing pigs (Exp. 2)
Item
Treatment1
Contrast, P-valueControl diet Phytase diet
SEMWater2 infusion
Pectin3 infusion
Water infusion
Pectin infusion
Pectin vs. water infusion
Phytase vs. control
diet
Pectin infusion ×
phytase diet
DM, g/kg 9.7 11.0 8.7 9.8 0.73 0.150 0.111 0.911Concentration, µmol/g of fresh matter d- + l-Lactate 43.8 35.7 35.3 42.7 3.85 0.954 0.851 0.092 d-Lactate 8.5 8.4 4.5 9.2 1.89 0.357 0.415 0.253 l-Lactate 35.2 27.3 30.7 33.6 3.16 0.527 0.784 0.138 Total SCFA 28.1 30.8 31.1 26.9 3.03 0.806 0.884 0.288 Acetate 22.8 27.5 26 21.4 3.63 0.989 0.696 0.241 Propionate 2.8 2.6 2.9 2.1 0.47 0.423 0.677 0.557 n-Butyrate 1.6 1.8 1.7 1.7 0.41 0.790 0.972 0.862 Isobutyrate 0.1 0.1 0.1 0.1 0.02 0.767 0.871 0.392 n-Valerate 0.2 0.2 0.2 0.2 0.06 0.885 0.977 0.474 Isovalerate 0.2 0.2 0.2 0.2 0.02 0.437 0.605 0.270SCFA molar proportion, % Acetate 82.1 85.3 83.6 83.3 1.31 0.392 0.838 0.229 Propionate 10.4 7.9 9.5 8.3 1.10 0.218 0.811 0.559 n-Butyrate 6.0 5.4 5.4 6.6 0.70 0.741 0.626 0.245 Isobutyrate 0.3 0.3 0.3 0.3 0.06 0.891 0.619 0.910 n-Valerate 0.7 0.7 0.8 0.8 0.16 0.960 0.631 0.919 Isovalerate 0.6 0.5 0.5 0.7 0.11 0.525 0.479 0.107
1Values are least squares means of 4 observations per treatment.2A total of 1.8 L of demineralized water was infused per day.3Pectin was suspended in 1.8 L of demineralized water at a ratio of 1:30 (wt/wt).
Table 8. Effects of dietary phytase supplementation and ileal pectin infusion on DM content (g/kg) and on con-centrations and molar proportions of short-chain fatty acids (SCFA; µmol/g of fresh matter) in feces of growing pigs (Exp. 2)
Item
Treatment1
Contrast, P-valueControl diet Phytase diet
SEMWater2 infusion
Pectin3 infusion
Water infusion
Pectin infusion
Pectin vs. water infusion
Phytase vs. control
diet
Pectin infusion ×
phytase diet
DM, g/kg 38.6 35.6 35.8 34.9 1.09 0.143 0.112 0.244Concentration, µmol/g of fresh matter Total SCFA 126.9 120.1 104.9 95.3 11.03 0.561 0.080 0.901 Acetate 68.3 65.2 62.3 56.3 5.71 0.531 0.236 0.800 Propionate 23.6 25.9 19.2 16.5 3.57 0.889 0.118 0.448 n-Butyrate 17.4 12.7 9.8 8.4 1.98 0.255 0.027 0.423 Isobutyrate 4.2 3.8 3.2 3.3 0.34 0.728 0.080 0.556 n-Valerate 5.8 4.6 3.7 4.7 1.06 0.923 0.350 0.345 Isovalerate 7.6 8.0 5.9 6.2 0.70 0.700 0.054 0.955SCFA molar proportion, % Acetate 53.8 54.5 59.7 59.6 2.70 0.930 0.092 0.885 Propionate 18.2 21.3 18.8 17.3 1.46 0.183 0.329 0.158 n-Butyrate 13.9 10.6 8.9 8.7 1.28 0.312 0.039 0.264 Isobutyrate 3.3 3.2 3.1 3.4 0.20 0.835 0.916 0.317 n-Valerate 4.8 3.7 3.6 4.7 0.71 0.960 0.922 0.169 Isovalerate 6.0 6.7 5.9 6.3 0.79 0.590 0.776 0.856
1Values are least squares means of 4 observations per treatment.2A total of 1.8 L of demineralized water was infused per day.3Pectin was suspended in 1.8 L of demineralized water at a ratio of 1:30 (wt/wt).
Metzler-Zebeli et al.154
at Serials/Acq. Dept., Library on May 31, 2010. jas.fass.orgDownloaded from

liferation of Enterococcus spp., E. faecium, and the C. leptum cluster and, as a tendency, decreased the num-bers of L. reuteri and L. mucosae determined at the distal ileum, but total bacterial numbers were not af-fected. Thus, it can be concluded from the present re-sults that the increase in dietary calcium phosphate content up to 150% of the requirement of growing pigs (Deutsche Landwirtschaftsgesellschaft, 1991) may in-hibit the proliferation of specific bacterial species in the upper GIT of pigs when compared with pigs fed the control diet marginal in P. Previously, it has been documented that calcium phosphate in mammalian saliva protects against bacterial overgrowth in dental mucus (Hicks et al., 2003; Becker, 2005). However, in rats an increase in dietary calcium phosphate content tended to promote the growth of ileal lactobacilli by 0.4 to 0.6 log units (Bovee-Oudenhoven et al., 1999) and significantly increased cell counts of fecal lactobacilli by 0.9 to 1.6 log units (Ten Bruggencate et al., 2004). The authors attributed this effect to the ability of the calcium phosphate complex to precipitate cytotoxic fatty and secondary bile acids because these are known to inhibit the growth of various intestinal bacteria, in-cluding lactobacilli (Kurdi et al., 2006). However, it has to be emphasized that bile acids originating from rats (tauro-conjugated bile) and pigs (glyco-conjugated bile) differ in the way they bind to calcium phosphate (Van der Meer and De Vries, 1985); this may explain, in part, the different results obtained in rats (Bovee-Oudenhoven et al., 1999; Ten Bruggencate et al., 2004) and in the present study with pigs.
The addition of phytase to the diet did not affect the gene copy numbers of enterococci and lactobacilli in ileal digesta, although the intestinal availability of phytate-bound P, but not that of Ca, was enhanced (Metzler et al., 2008). These findings suggest that di-etary Ca, rather than P, may act as a growth-inhibiting factor for specific intestinal bacteria. Increasing the concentration of free Ca ions may reduce the adhesion potential of specific bacterial species, resulting in de-creased colonization of mucosal areas because of com-petition for the same binding sides with other bacteria species, as recently demonstrated in vitro for Lactoba-cillus spp. (Larsen et al., 2007). Bacterial adhesion to the intestinal mucosa is considered an important fac-tor for bacterial colonization because it prevents wash-out of bacteria, especially in the small intestine, where digesta flow rates are relatively fast (Erickson et al., 1992; Rojas and Conway, 1996). Moreover, addition of Ca inhibited intercellular adhesion of and biofilm for-mation by cocci such as Staphylococcus aureus under in vitro conditions (Arrizubieta et al., 2004). In fact, several cell wall components of gram-positive bacteria, including proteins, exopolysaccharides, and lipoteichoic acid, bind to Ca (Rose, 2000; Ridgen et al., 2003). Ac-cordingly, in the present study, MCP supplementation of the pig diet reduced mainly gram-positive bacteria, such as lactobacilli, enterococci, and members of the C. leptum cluster. Calcium is known to promote nonspe-
cific interactions such as neutralization of the electrical double layer between bacterial cells as well as specific adhesive interactions with protein and polysaccharide adhesion molecules at the cell surface (Geesey et al., 2000). Because dietary Ca induces gastric acid secre-tion by stimulating gastrin release (Floor et al., 1991), it cannot be ruled out that the resulting decrease in gastric pH may have inhibited the adhesion of lactoba-cilli to the stomach mucosa as well. In fact, Ouwehand et al. (2001) reported that adhesion of the probiotic strains Lactobacillus brevis PEL 1 and L. reuteri ING1 to intestinal mucus was reduced by exposure to low pH in vitro.
Addition of phytase increased the ileal numbers of strictly anaerobic bacteria, such as the C. coccoides cluster, the C. leptum cluster, and the Bacteroides-Pre-votella-Porphyrmonas group, and tended to enhance those of Enterobacteriaceae. These findings might be associated with the greater availability of phytate-bound P in the small intestine (Metzler et al., 2008). Moreover, the gene copy number of Enterococcus spp. was not affected by addition of phytase; however, the number of E. faecium was less, whereas those of E. faecalis populations were greater compared with the control treatment.
Interestingly, ileal infusion of pectin altered the growth of some of the bacterial groups and species in-vestigated in ileal digesta. In fact, there was a trend toward greater gene copy numbers, amounting to 0.3 to 1.6 log units for E. faecium, E. faecalis, and bifidobac-teria in the MCP experiment (Exp. 1) and for E. fae-cium in the phytase experiment (Exp. 2), whereas the gene copy number of the C. leptum cluster was reduced and those of the Bacteroides-Prevotella-Porphyrmonas group tended to be reduced by 1.1 to1.4 log units in the phytase experiment (Exp. 2). These changes in the composition of the bacterial community may be because the passage of digesta from the ileum to the cecum is regulated through the ileocecal sphincter. In fact, emptying of the distal ileum into the cecum is as-sociated with propulsive phasic contractions that are regulated by stimulants in digesta (e.g., SCFA; Fich et al., 1989). Thus, there may have been sufficient time for the bacteria to hydrolyze at least part of the in-fused pectin, thereby altering the composition of bacte-rial groups at the distal ileum. However, studies with intact pigs have shown a physiological ceco-ileal reflux occurring approximately 8 times per hour, which may induce a natural contamination of ileal contents by the cecal microbiota (Cuche and Malbert, 1998). This may also explain the observed changes in composition of the bacterial community at the distal ileum of pigs. Gener-ally, pectin is hydrolyzed by different intestinal bacte-rial groups, including Bacteroides spp., clostridia, and bifidobacteria (Dongowski et al., 2002; Olano-Martin et al., 2002). This is in agreement with the trend of increased ileal numbers of bifidobacteria in the MCP experiment (Exp. 1), but not in the phytase experiment (Exp. 2). In contrast, pectin infusion tended to reduce
Calcium phosphate and gut microbiota 155
at Serials/Acq. Dept., Library on May 31, 2010. jas.fass.orgDownloaded from

the Bacteroides-Prevotella-Porphyrmonas group and de-creased the C. leptum cluster in the phytase experiment (Exp. 2), but not in the MCP experiment (Exp. 1). The discrepancy among the results of this study and in the literature (Dongowski et al., 2002; Olano-Martin et al., 2002) may be due to differences in the degree of methy-lation of the pectin sources used in these experiments. Accordingly, Dongowski et al. (2002) used citrus pectin with a degree of methylation in the range of 34 to 93% in studies with rats and in vitro, whereas Olano-Mar-tin et al. (2002) examined low- and highly methylated apple pectin with a degree of methylation of 8 and 66% under in vitro conditions, respectively. Comparison of the results of both studies revealed that pectin-degrad-ing bacteria generally grow better on low-methylated pectin. In the present study, according to the specifica-tion of the manufacturer, highly methylated apple pec-tin with a degree of methylation of 68 to 72% was used, likely slowing its bacterial breakdown (Olano-Martin et al., 2002). The gene copy number of E. faecium tended to rise when pectin was ileally infused. This is in con-trast to recent findings (Metzler et al., 2009) in which the numbers of E. faecium decreased when 25% pectin was included in the diet. To our knowledge, no galac-turonase activity has been reported for E. faecium to date; therefore, other pectin-degrading bacteria, such as clostridia, Bacteroides-like bacteria, and bifidobacte-ria, and lactobacilli, such as Lactobacillus sobrius (Ola-no-Martin et al., 2002; Konstantinov et al., 2005), may have hydrolyzed pectin, with E. faecium strains being able to utilize these hydrolysis products.
Dietary MCP addition, phytase supplementation, or infusion of pectin into the distal ileum did not af-fect the gene copy number of Enterobacteriaceae. This is in agreement with the results of a recent study by Metzler et al. (2009), which demonstrated that inclu-sion of 25% highly methylated apple pectin to a low-P corn- and soybean meal-based diet did not affect the number of Enterobacteriaceae. Similarly, Högberg et al. (2004) failed to detect changes in the diversity of coliform populations in the distal ileum after includ-ing soluble and insoluble nonstarch polysaccharides in diets for pigs. However, when culturing techniques were used, soluble fermentable carbohydrates such as guar gum have previously been reported to stimulate the growth of Enterobacteriaceae in pigs (Durmic et al., 1998; Owusu-Asiedu et al., 2006).
Although molecular techniques have been widely ac-cepted for the analysis of intestinal bacterial popula-tions, results need to be interpreted with caution. For instance, the mean values for the gene copy number of total eubacteria in the present study were exceeded by the mean values for Lactobacillus spp. gene copy number in pigs receiving the control treatments in the MCP experiment (Exp. 1) and for all treatments in the phytase experiment (Exp. 2). This is likely related to the type of assay used because the amplification of gene copies for eubacteria was based on probe hybridization, whereas the Lactobacillus spp. group was measured by
primer annealing. Some Lactobacillus spp. species may have steric hindrance at the point of probe hybridiza-tion, which may lead to weaker fluorescence signals than by primer annealing. Moreover, real-time PCR is biased by DNA from dead bacteria that are amplified and hence quantified, and by the multiplicity of 16S ribosomal RNA genes per genome in bacteria (Fogel et al., 1999). Overall, differences between the 2 experi-ments may be attributed to variations in the bacterial community among individual pigs, which are strongly homeostatic and characteristic for the host from which the digesta sample was obtained (Zoetendal et al., 1998; Hill et al., 2005).
Microbial Metabolites
Dietary supplementation of MCP and phytase as well as ileal infusion of pectin had no effect on ileal SCFA concentrations. However, the increased molar propor-tion of acetate to total SCFA in the distal ileum of pigs fed the MCP diet may indicate changes in microbial fermentative activity because of the greater Ca and P supplies. Pectin infusion enhanced ileal d-lactate re-covery in the MCP experiment (Exp. 1), but not in the phytase experiment (Exp. 2), suggesting changes in absorption of lactate because of altered digesta viscos-ity, the metabolic activity of lactic acid bacteria, or the metabolic activity of bacteria using lactic acid. At the fecal level, n-valerate concentrations were enhanced, and there was a trend toward greater concentrations of acetate in the MCP experiment (Exp. 1), resulting in a trend toward greater total SCFA when pectin was in-fused as a fermentable substrate. The molar SCFA pro-portions, in turn, were not different between the diets, although pectin is known as an important precursor of acetate (Macfarlane and Macfarlane, 2003).
Dietary phytase addition reduced microbial butyrate concentrations in the large intestine because both fecal n-butyrate concentration and its molar proportion to total SCFA in feces were significantly decreased in pigs fed the phytase diet compared with control animals. This is in agreement with the trend toward reduced concentrations of total SCFA, branched-chain fatty ac-ids, and gene copy number of total bacteria in the feces of pigs fed the phytase diet. There is evidence that be-cause of the release of phytate-bound P, the absorption of P up to the distal ileum is improved, thereby reduc-ing the amount of P entering the large intestine (Met-zler et al., 2008). Consequently, the P availability for bacterial assimilation in the large intestine is decreased. In this context, the present findings may be in accor-dance with observations made in ruminants where P depletion reduces the fermentative activity and growth of rumen bacteria, resulting in decreased production of SCFA and bacterial protein synthesis; the cellulolytic and hemicellulolytic flora are particularly affected (Du-rand and Komisarczuk, 1988; Wider, 2005). Finally, it should be mentioned that the assessment of true meta-bolic activity (i.e., determination of SCFA and lactate)
Metzler-Zebeli et al.156
at Serials/Acq. Dept., Library on May 31, 2010. jas.fass.orgDownloaded from

is biased because fermentation products such as lactate or acetate may act as substrates, thereby modifying the concentrations of these fermentation products. More-over, 95% of the SCFA produced are absorbed from the large intestine during its transit through the gut (Cummings, 1981).
In conclusion, results of the present study indicate that the composition and metabolic activity of the in-testinal microbiota are susceptible not only to ferment-able carbohydrates, but also to changes in the intestinal availability of Ca and P because of differences in di-etary Ca and P supplies. It appears that an increase in the amount of intestinal Ca may reduce the population densities of some specific bacterial species belonging to lactobacilli, enterococci, and the C. leptum cluster, whereas greater intestinal phytate-P availability in the small intestine after phytase supplementation appears to stimulate the growth of strictly anaerobic bacteria. Butyrate fermentation in the large intestine appeared to be less in pigs fed the phytase-supplemented low-P diet. Because of the important role of butyrate in stimu-lating the proliferation of epithelial cells, mucus release, and water and mineral absorption in the large intestine (Tsukahara et al., 2006), further research is warranted to elucidate whether butyrate-producing bacteria are affected by reduced P content in the large intestine.
LITERATURE CITED
Arrizubieta, M. J., A. Toledo-Arana, B. Amorena, J. R. Penades, and I. Lasa. 2004. Calcium inhibits Bap-dependent multicellu-lar behavior in Staphylococcus aureus. J. Bacteriol. 186:7490–7498.
Becker, P. M. 2005. Physiological Achilles’ heels of enteropathogenic bacteria in livestock. Curr. Issues Intest. Microbiol. 6:31–54.
Bovee-Oudenhoven, I. M., M. L. Wissink, J. T. Wouters, and R. van der Meer. 1999. Dietary calcium phosphate stimulates intestinal lactobacilli and decreases the severity of a salmonella infection in rats. J. Nutr. 129:607–612.
Branner, G. R., B. M. Böhmer, W. Ehrhardt, J. Henke, and D. A. Roth-Maier. 2004. Investigation on the precaecal and faecal di-gestibility of lactulose and inulin and their influence on nutrient digestibility and microbial characteristics. Arch. Anim. Nutr. 58:353–366.
Castillo, M., S. M. Martin-Orúe, J. A. Taylor-Pickard, J. F. Pérez, and J. Gasa. 2008. Use of mannan-oligosaccharides and zinc chelate as growth promoters and diarrhea preventative in wean-ing pigs: Effects on microbiota and gut function. J. Anim. Sci. 86:94–101.
Cuche, G., and C. H. Malbert. 1998. Relationships between cecoil-eal reflux and ileal motor patterns in conscious pigs. Am. J. Physiol. 274:G35–G41.
Cummings, J. H. 1981. Short chain fatty acids in the human colon. Gut 22:763–779.
Deutsche Landwirtschaftsgesellschaft [German Agricultural Society]. 1991. DLG-Futterwerttabellen für Schweine. 6 Auflage. DLG-Verlag, Frankfurt am Main, Germany.
Dongowski, G., A. Lorenz, and J. Proll. 2002. The degree of meth-ylation influences the degradation of pectin in the intestinal tract of rats and in vitro. J. Nutr. 132:1935–1944.
Durand, M., and S. Komisarczuk. 1988. Influence of major minerals on rumen microbiota. J. Nutr. 118:249–260.
Durmic, Z., D. W. Pethick, J. R. Pluske, and D. J. Hampson. 1998. Changes in bacterial populations in the colon of pigs fed dif-ferent sources of dietary fibre, and the development of swine
dysentery after experimental infection. J. Appl. Microbiol. 85:574–582.
Eaton, T. J., and M. J. Gasson. 2001. Molecular screening of En-terococcus virulence determinants and potential for genetic exchange between food and medical isolates. Appl. Environ. Microbiol. 67:1628–1635.
Erickson, A. K., J. A. Willgobs, S. Y. McFarland, D. A. Benfield, and D. H. Francis. 1992. Identification of two porcine brush border glycoproteins that bind the K88ac adhesion of Escheri-chia coli and correlation of these glycoproteins with adhesive phenotype. Infect. Immun. 60:983–988.
Fich, A., S. F. Phillips, N. S. Hakim, M. L. Brown, and A. R. Zins-meister. 1989. Stimulation of ileal emptying by short-chain fatty acids. Dig. Dis. Sci. 34:1516–1520.
Floor, M. K., S. Jahangeer, C. D’Ambrosio, and O. Alabaster. 1991. Serum gastrin increases with increasing dietary calcium but not with increasing dietary fat or fiber in Fischer-344 rats. J. Nutr. 121:863–868.
Fogel, G. B., C. R. Collins, J. Li, and C. F. Brunk. 1999. Prokaryotic genome size and SSU rDNA copy number: Estimation of mi-crobial relative abundance from a mixed population. Microb. Ecol. 38:93–113.
Gaskins, H. R. 2001. Intestinal bacteria and their influence on swine growth. Pages 585–608 in Swine Nutrition. 2nd ed. A. J. Lewis and L. L. Southern, ed. CRC Press, Boca Raton, FL.
Geesey, G. G., B. Wigglesworth-Cooksey, and K. E. Cooksey. 2000. Influence of calcium and other cations on surface adhesion of bacteria and diatoms: A review. Biofouling 14:195–205.
Heilig, H. G. H. J., E. G. Zoetendal, E. E. Vaughan, P. Marteau, A. D. L. Akkermans, and W. M. de Vos. 2002. Molecular diversity of Lactobacillus spp. and other lactic acid bacteria in the hu-man intestine as determined by specific amplification of 16S ribosomal DNA. Appl. Environ. Microbiol. 68:114–123.
Hicks, J., F. Garcia-Godoy, and C. Flaitz. 2003. Biological factors in dental caries: Role of saliva and dental plaque in the dynamic process of demineralization and remineralization (part 1). J. Clin. Pediatr. Dent. 28:47–52.
Hill, J. E., S. M. Hemmingsen, B. G. Goldade, T. J. Dumonceaux, J. Klassen, R. T. Zijlstra, S. H. Goh, and A. G. van Kessel. 2005. Comparison of ileum microflora of pigs fed corn-, wheat, or barley-based diets by chaperonin-60 sequencing and quantita-tive PCR. Appl. Environ. Microbiol. 71:867–875.
Högberg, A., J. E. Lindberg, T. Leser, and P. Wallgren. 2004. In-fluence of cereal non-starch polysaccharides on ileo-caecal and rectal microbial populations in growing pigs. Acta Vet. Scand. 45:87–98.
Knowlton, K. F., J. S. Radcliffe, C. L. Novak, and D. A. Emmerson. 2004. Animal management to reduce phosphorus losses to the environment. J. Anim. Sci. 82:E173–E195.
Komisarczuk, S., R. J. Merry, and A. B. McAllan. 1987. Effect of different levels of phosphorus on rumen microbial fermentation and synthesis determined using a continuous culture technique. Br. J. Nutr. 57:279–290.
Konstantinov, S. R., H. Smidt, and W. M. de Vos. 2005. Representa-tional difference analysis and real-time PCR for strain-specific quantification of Lactobacillus sobrius sp. nov. Appl. Environ. Microbiol. 71:7578–7581.
Kurdi, P., H. W. van Veen, H. Tanaka, I. Mierau, W. N. Konings, G. W. Tannock, F. Tomita, and A. Yokota. 2006. Cholic acid is ac-cumulated spontaneously, driven by membrane ΔpH, in many lactobacilli. Appl. Environ. Microbiol. 182:6525–6528.
Larsen, N., P. Nissen, and W. G. Willats. 2007. The effect of calcium ions on adhesion and competitive exclusion of Lactobacillus ssp. and E. coli O138. Int. J. Food Microbiol. 114:113–119.
Li, S., W. C. Sauer, and M. Z. Fan. 1993. The effect of dietary crude protein level on amino acid digestibility in early-weaned pigs. J. Anim. Physiol. Anim. Nutr. (Berl.) 70:26–37.
Lorz, A., and E. Metzger. 1999. Tierschutzgesetz: Tierschutzgesetz mit allgemeiner Verwaltungsvorschrift, Rechtsverordnungen und Europäische Übereinkommen; Kommentar. 5. Neubear-beite Aufl., Munich, Germany.
Calcium phosphate and gut microbiota 157
at Serials/Acq. Dept., Library on May 31, 2010. jas.fass.orgDownloaded from

Lyons, S. R., A. L. Griffen, and E. J. Leysi. 2000. Quantitative real-time PCR for Porphyromonas gingivalis and total bacteria. J. Clin. Microbiol. 38:2362–2365.
Macfarlane, G. T., and S. Macfarlane. 2003. Regulation of short-chain fatty acid production. Proc. Nutr. Soc. 62:67–72.
Malinen, E., A. Kassinen, T. Rinttilä, and A. Palva. 2003. Compari-son of real-time PCR with SYBR Green I or 5′-nuclease assays and dot-blot hybridization with rDNA-targeted oligonucleotide probes in quantification of selected faecal bacteria. Microbiol-ogy 149:269–277.
Matsuki, T., K. Watanabe, J. Fujimoto, Y. Miyamoto, T. Takada, K. Matsumoto, H. Oyaizu, and R. Tanaka. 2002. Development 16S rRNA-gene-targeted group-specific primers for the detec-tion and identification of predominant bacteria in human feces. Appl. Environ. Microbiol. 68:5445–5451.
Matsuki, T., K. Watanabe, J. Fujimoto, T. Takada, and R. Tanaka. 2004. Use of 16S rRNA gene-targeted group-specific primers for real-time PCR analysis of predominant bacteria in human faeces. Appl. Environ. Microbiol. 70:7220–7228.
Metzler, B. U., R. Mosenthin, T. Baumgärtel, and M. Rodehutscord. 2008. The effect of dietary phosphorus and calcium level, phytase supplementation and ileal infusion of pectin on the chemical composition and carbohydrase activity of fecal bacte-ria and the level of microbial metabolites in the gastrointestinal tract of pigs. J. Anim. Sci. 86:1544–1555.
Metzler, B. U., W. Vahjen, T. Baumgärtel, M. Rodehutscord, and R. Mosenthin. 2009. Effects of specific fermentable carbohy-drates on the ileal microbiota in pigs. Anim. Feed Sci. Technol. 148:68–89.
Naumann, K. R., and R. Bassler. 1997. Die chemische Untersuchung von Futtermitteln. Verband Deutscher Landwirtschaftlicher Un-tersuchungs- und Forschungsanstalten, Darmstadt, Germany.
Olano-Martin, E., G. R. Gibson, and R. A. Rastall. 2002. Compari-son of the in vitro bifidogenic properties of pectins and pectic-oligosaccharides. J. Appl. Microbiol. 93:505–511.
Ouwehand, A. C., E. M. Tuomola, S. Tölkkö, and S. Salminen. 2001. Assessment of adhesion properties of novel probiotic strains to human intestinal mucus. Int. J. Food Microbiol. 64:119–126.
Owusu-Asiedu, A., J. F. Patience, B. Laarveld, A. G. van Kessel, P. H. Simmins, and R. T. Zijlstra. 2006. Effects of guar gum and cellulose on digesta passage rate, ileal microbiota, energy and protein digestibility, and performance of grower pigs. J. Anim. Sci. 84:843–852.
Rigden, D. J., M. J. Jedrzejas, O. V. Moroz, and M. Y. Galperin. 2003. Structural diversity of calcium-binding proteins in bacte-ria: Single-handed EF-hands? Trends Microbiol. 11:295–297.
Rinttilä, T., A. Kassinen, E. Malinen, L. Krogius, and A. Palva. 2004. Development of an extensive set of 16S rDNA-targeted
primers for quantification of pathogenic and indigenous bac-teria in faecal samples by real-time PCR. J. Appl. Microbiol. 97:1166–1177.
Rojas, M., and P. L. Conway. 1996. Colonization by lactobacilli of piglet small intestinal mucus. J. Appl. Bacteriol. 81:474–480.
Rose, R. K. 2000. The role of calcium in oral streptococcal aggrega-tion and the implications for biofilm formation and retention. Biochim. Biophys. Acta 1475:76–82.
Ten Bruggencate, S. J. M., I. M. J. Bovee-Oudenhoven, M. L. G. Lettink-Wissink, M. B. Katan, and R. van der Meer. 2004. Dietary fructo-oligosaccharides and inulin decrease resistance of rats to salmonella: Protective role of calcium. Gut 53:530–535.
Tsukahara, T., K. Hashizume, H. Koyama, and K. Ushida. 2006. Stimulation of butyrate production through the metabolic in-teraction among lactic acid bacteria, Lactobacillus acidophilus, and lactic acid-utilizing bacteria, Megasphaera elsdenii, in por-cine cecal digesta. Anim. Sci. J. 77:454–461.
Vahjen, W., D. Taras, and O. Simon. 2007. Effect of the probiotic Enterococcus faecium NCIMB10415 on cell numbers of total Enterococcus spp., E. faecium and E. faecalis in the intestine of piglets. Curr. Issues Intest. Microbiol. 8:1–8.
Van der Meer, R., and H. T. De Vries. 1985. Differential binding of glycine- and taurine-conjugated bile acids to insoluble calcium phosphate. Biochem. J. 229:265–268.
Veum, T. L., D. R. Ledoux, and V. Raboy. 2007. Low-phytate bar-ley cultivars improve the utilization of phosphorus, calcium, nitrogen, energy, and dry matter in diets fed to young swine. J. Anim. Sci. 85:961–971.
Walter, J., C. Hertel, G. W. Tannock, C. M. Lis, K. Munro, and W. P. Hammes. 2001. Detection of Lactobacillus, Pediococcus, Leuconostoc, and Weissella species in human faeces by using group-specific PCR primers and denaturing gradient gel elec-trophoresis. Appl. Environ. Microbiol. 67:2578–2585.
Wider, J. 2005. Untersuchungen in vitro zum Phosphor-Bedarf von Mikroorganismen im Pansen. PhD Diss. Rheinische Friedrich-Wilhelms-Universität Bonn, Bonn, Germany.
Zijlstra, J. B., J. Beukema, B. G. Wolthers, B. M. Byrne, A. Groen, and J. Dankert. 1977. Pretreatment methods prior to gas chro-matographic analysis of volatile fatty acids from faecal samples. Clin. Chim. Acta 78:243–250.
Zoetendal, E. G., A. D. L. Akkermans, and W. M. de Vos. 1998. Temperature gradient gel electrophoresis analysis of 16S rRNA from human fecal samples reveals stable and host-specific communities of active bacteria. Appl. Environ. Microbiol. 64:3854–3859.
Metzler-Zebeli et al.158

References http://jas.fass.org/cgi/content/full/88/1/147#BIBL
This article cites 48 articles, 23 of which you can access for free at:
at Serials/Acq. Dept., Library on May 31, 2010. jas.fass.orgDownloaded from