iiiiiiiiiii ii - apps.dtic.mil · final scientific report, ... instead of using a piezoelectric...
TRANSCRIPT

AD-A093 939 BRISTOL UNIV (ENeLAND) 94 H WILLS PHYSICS LAB F/C 11/1STATES OF STRESS AND STRAIN IN ADHESIVE JOINTS INCLUDING PHOTOE--ETC(U)NOV 80 K H ASHBEE. N R FARRAR, N K KITSON AFSR77-38
UNC7LASSIFIED AFOSR-TR-80-1358 NL
IIIIIIIIIII II

7K; XFOSR ' 8 8 13 5
Grant Number: AFOSR-77-34480
STATES OF STRESS AND STRAIN IN ADHESIVE JOINTS
M INC'UDING PHOTOELASTIC IMAGING OF DEFECTS IN ADHERENDS
N R Farrar~~N K Kitson "
S A Low
A N'earsJ P Sargent
T W TurnerK H G Ashbee
H H Wills Physics Laboratory, Bristol University, England
November 30th 1980
Final Scientific Report, September 30th 1977 - September 30 1980
Approved for public release; distribution unlimited
prepared for
o
UNITED STATES AIR FORCE
AIR FORCE OFFICE OF SCIENTIFIC RESEARCH
Building 410, Bolling Air force Base, D.C. 20332
and
- - EUROPEAN OFFICE OF AEROSPACE D I~DTIC
RESEARCH AND DEVELOPMENT ELECTE
223/231 Old 'arylebone Road, London NWI 5TH
S D
APproved for public role '3,
ibutiOn nlimited
8 0 1~29 0 d

SECURITY CLASSIFICATION OF
REP T DOCUMENTATION PAGE READ INSTRUCTIoNS• LIKI.'ORE COMPLIETING FORM
P -2. GOVT ACCESSION NO. 3 RECIPIENT'S CATALI,"M)R
O S TR 8 13 587 1 4-,&7?. 9 LOh,4. TITLE (and Sbtitle) -COVERED
STATES 01 STRISS AND STRAIN IN ADIIESIVE ,INT'S :FINAL 3(. Sep* 77-5(1 :epd 80
INCLUIDING IIOTDELASTIC IIMAGING 01" DIFIECT, [N [IPONt)jGG REPORT/N.AADIIE }HEND. , / 01______ j e
- AUTHOR(s) - .. ' b CONTRACT OR GRANT NUMBER(s)
fie( ',f HBEI': NR AIRAR N E' ,II'SON, S, A.Ow 'FOSIR-77L37'8 I..A'MEA PSGNR
9. PERFORMING ORGANIZATION NAIAL AND ADDRESS 1L. nr. UAREA 6 WORK UNIT NUMBERS
Hf If WIILS PHYSICS LABORATD0YV IHRLSTOL UNIVERSITY 61121:
ENGLAND A4 2301112II. CONTROLLING OFFICE NAME AND ADDRESS 12. REPORT DATE 05 .,,
AIR FOVICE OFFICE OF SCIENTIFIC RESEAUCH November 30 1,)80 Z~
BOLLING AFB DC 20332 3, NUMBER OF PAGES62
14. MONITORING AGENCY NAME 8 AODRESS(il dilIet-t from Cm-rhIroIin OIfice) IS. SECURITY CLASS. (o this epr))
, ,J , _NCLAS. IIE). . ISa. DECLASSIFICATION DOWNGRADING
SCHEDULE
16. DISTRIBUTION STATEMENT (of this Report)
Approved for public release; distribution unlimited
17. DISTRIBUTION STATEMENT (of the abstAlCt eneet'ed f,, - k Z0, It djlfep,-1 fromI Report)
lB. SUPPLEMENTARY NOTES
19. KEY WORDS (Continue on reverse side it necessary and Identf, hv block numberI
EPOXY DEFE;CTS
ADHIII'S VE JOINTSFRACTURE, All';CIIANICSPH1OTOELASTIC IMAGING
?0.'*BSTRACT (Contln,,e on reverse side II necessary and Identify by block numnber)
-' Water migration across the thin epoxv layer it, model adhesive joinI s causes
strongly inhomogeneous swelling. The swelling is the principal causc ofstress syst ems which are being examined by analysis of the patterns ofNewton's rings formed between a glass cover slip and an optical flat.Enhancement of water migration by normal stresses of the order of a ki lobar 0.1is reported. The development of a self-stressed fracture mechanics test
piece, designed to investigate water uptake by adhesives, is reported.Photoelastic imaging of ultrasonic waves can be utilized to itvestil;at. V
DD I J 1473 EDITION OF I NOV65 IS OBSOLETE U A.l n/.-.SECURITY CLASSIFICATION OF THIS PAGE (When Date Entared)

SECU~tY rCLASSIFICATION OFOIO~iiA
Sdefects i ri opaque sol ids . Ins tead of isinjg a p iezoelectri c de tec or, there fleet ed sourid from a defect i s actnally observed iii a vi sualii blr~ ioc kof quartz, after propaeatinig from the spec imen to the block acros!; atiacoustic couplinig. V'xpcrirnciits and a comiputer model are described.
LAcess ton ForNTI'S GRA&IDTIC TABUnannouncedJustification-
Di st ribution/
Availabili -t y Cde s
'Avail nnd/orDist Special
SECURYYCLAkSSIFICAIWllO'AVU~f~r .

SU1MARY
Water migration across the thin epoxy layer in model adhesive jointscauses strongly inhomogeneous swelling. The swelling is the principal
cause of stress systems which are being examined by analysis of thepatterns of Newton's rings formed between a glass cover slip and an
optical flat. Enhancement of water migration by normal stresses of the
order of a kilobar is reported.
The development of a self-stressed fracture mechanics test piece, designed
to investigate water uptake by adhesives, is reported.
Photoelastic imaging of ultrasonic waves can be utilized to investigate
defects in opaque solids. Instead of using a piezoelectric detector, the
reflected sound from a defect is actually observed in a visualizing blockof quartz, after propagating from the specimen to the block across an
acoustic coupling. Experiments and a computer model are described.
AIR FORCE OFFT(?] OF srNTIFlC R .Rc (AS,)NOTICi OF TRANSMITTAL TO DDCThI3 teeb c ,2 e,.'prt .: boe reviewed and .s
pprovced 1ol- rt, e -e AY A R 190 -2 (7b .OistI'qtUtioll iz; luilijitod, (b)A. D. BLOS Itochulcal Iml'ormation Officer
.-...- .

TABLE OF CONTENTS
Section Page
LIST OF FIGURES
1. INTRODUCTION 1
2. NEWTON'S RINGS EXPERIMENT 3
2.1 EXPERIMENTATION 3
2.2 WATER ABSORPTION MODEL 6
2.3 RESULTS AND DISCUSSION 17
3. SELF STRESSED FRACTURE MECHANICS TEST-PIECE 21
3.1 TIE ELASTIC DISC IN PLANE STRAIN 21
3.2 EXPERIMENTATION 25
3.3 RESULTS AND DISCUSSION 28
4. PHOTOELASTIC IMAGING OF DEFECTS 29
4.1 COMPUTER MODEL 29
4.2 VISUALIZED SOUND EXPERIMENTS 31
4.3 RESULTS AND DISCUSSION 32
I

LIST OF FIGURES
No.
1. Experimental arrangement of Newton's rings apparatus.
2. General view of ambient temperature apparatus.
3. High temperature (<100 0 C) apparatus.
4. Mark II hot water apparatus.
5. Inhomogeneous swelling associated with water uptake.
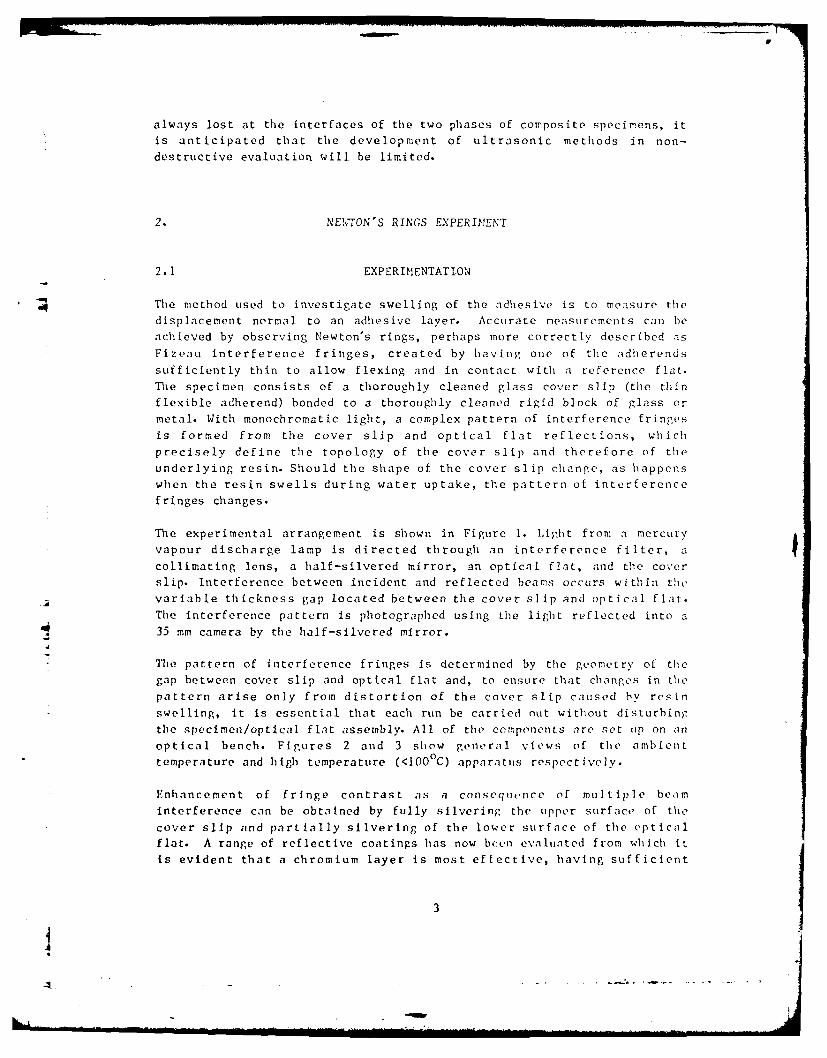
6. Sequence of interference patterns showing the swelling and
debonding of FM 1000 epoxy resin film adhesive during immersion
in water at 800 C.
7. Migration of the shoulder in a Newton's ring (Q) and of a pointon the debonding crack (0). 20 0 C water.
8. Diffusion rate for an FM 1000 adhesive joint between anodized
titanium and glass cover slip.
9. Diffusion rate for an FM 1000 adhesive joint between stainless
steel and glass cover slip.
10. Migration distance of the ist Moir6 fringe for Redux 312/5 0,and FM 73M A , against the square root of time.
11. Graph showing the relative concentration across one diameter of amodel adhesive joint.
12. Plot of RlC /(gIC)max - specimen A.12.c
13. Plot of lC / iC)max - specimen B.
14. Plot of [c / C)max - specimen C.
15. Plot of 0c /(IC)max - specimen D.
16. Computer model representation.
17. Flow diagram of program REFPATH.
1.

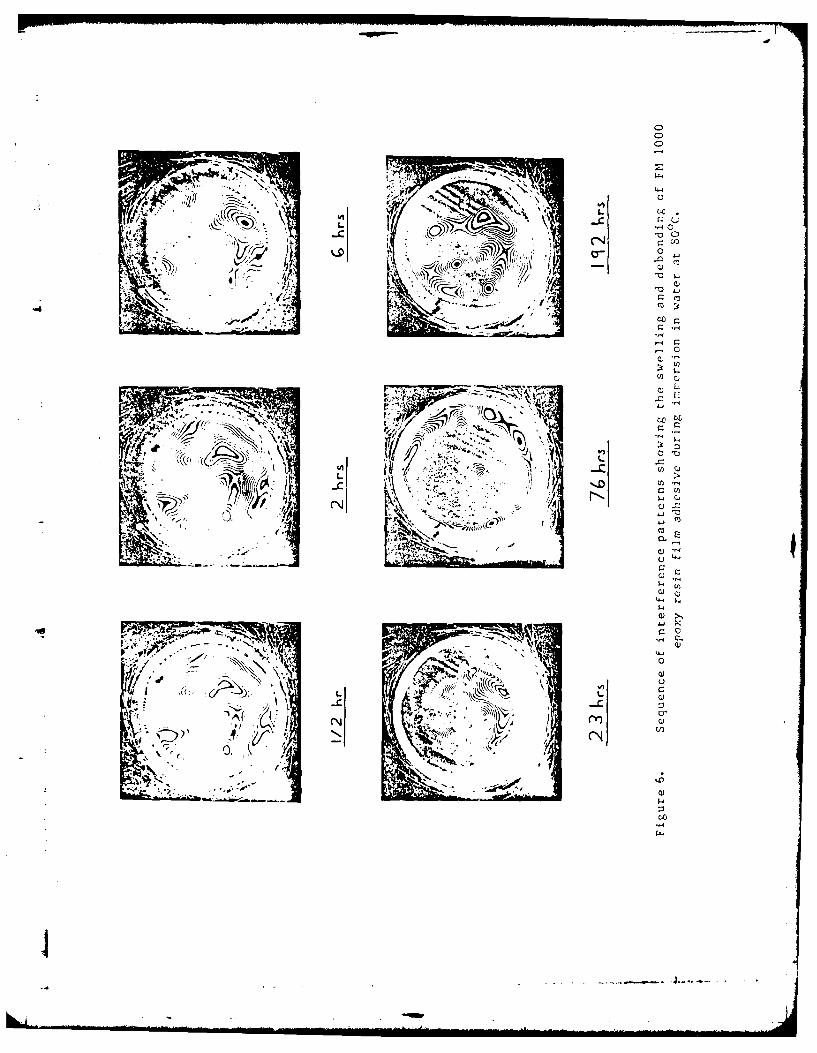
18. SYMVU representation for steel specimen with 1 mm radius hole.
19. Schematic diagram of photoelastic system.
20. Position of longitudinal and shear wavefronts vs. delay.
21. Computer simulation.
22. Computer simulation.
23. Experimental vs. theoretical delays.
24. Computer simulation.
25. Computer simulation.
26. Computer simulation.
27. Interference pattern from reflected shear wave (LSS) from a I mm
radius hole in steel (multiflash).
28. Computer simulation of Figure 27.
4I
I. I

a
1. •INTRODUCT ION
Water migration rates in resin layers, sufficiently thin to be
representative of the resin between adherends in an adhesive joint, were
studied with support from the US Army -European Research Office under grant
number DA-ERO-76-G-068. Both polyester and epoxy resin samples containingentrapped air bubbles were cast between glass microscope slides and
immersed in water. The times at which droplets of water appeared inside
the air bubbles, distributed at varying distances from the edge of the
resin layer, were noted allowing the. rates of water uptake to bedetermined. The results, reported in a seminar presented by K 11 C Ashbee
at AM"IRC, Watertown, Mass on 23 July 1976, give diffusion coefficients of
10 4 cm s I for polyesters and '10- cm s for epoxies; both faster th:in
the published diffusion coefficients in the bulk resin, by about an orderof magnitude.
During the first year of tenure of AFOSR-77-3448, careful consideration
was piven to the mechanisms which might explain the apparent enhancement
of water migration. Four possibilities are:
(i) increased water flow through channels or crazes associated with the
infrastructure ef the interfacial region,
(ii) stress enhanced migration resulting from the stresses induced by
shrinkage that accompanies curing,
(iii) stress enhanced migration caused by differential contraction on
cooling from the curing temperature,
(iv) stress enhanced migration effected by the stress system produced by
resin swelling on water uptake.
Evidence in support of the first of these hypotheses has not been found,and recent studies involving microscopic examination certainly have
revealed some characteristic of channels had they been present.
Similarly, the second possibility is a most unlikely mechanism, for curing
takes place above Tg where dimensional changes will almost certainly be
taken up by viscoelastic flow. Some stress system will remain from the
third mechanism although partial relief of the forces is anticipated by
self adjustment of the glue line thickness, but a more import ant source of
stress is that of the fourth mechanism above. This swelling of the resin
due to water uptake has been shown to be strongly Inhomogeneous, and is
believed to be the principal cause of stress fields which account for the
significant changes in the diffusion rates in fibre reinforced resins.
AL -
4i

The Newton' rings experiment which has been devel ed to investigate
water diffusion is the most precise way of investigating water migration
in stressed epoxies, and a theoretical model has been devised to probe the
physical mechanisms. The classical diffusion equation has been modified
by introducing a stress induced flux term, and the influence of internalstresses en the activation energy is considered. The epoxy resin, at
operating temperatures substantially below the glass transition, is
treated as purely elastic.
The urgent need for a fracture mechanics test, which might be used to
observe the effects of water uptake on KIC in adhesive joints, was made
Aevident at the workshop on structural adhesives, organised by AFOSR and
held at Vought Corporation, Grand Prairie, Texas in December 1977. Some
useful ideas have been developed and after discarding the original test-
piece, the validity of the latest self-stressed fracture mechanics test-
piece has been shown. There are still some interesting features of the
stress system to be analysed, as there are differences between the theory
and practical considerations. For example, the theory requires a set of
boundary conditions which cannot be achieved in practice, but can be
approximated to by the application of a quite different stress system.
When the test is carried out the stress system should revert to that which
is used in the theoretical approach, but a doubt has arisen that this
transition does in fact occur. This work is however at an advanced stage
and is continuing unsupported by outside funds.
Much of the work associated with water uptake causing resin swelling, and
with fracture mechanics tests results in defects of one kind or another,
and a need arose to generate direct evidence for the location and size of
such defects. In view of the progress made in previous photoelastic
imaging experiments relating to a project on the physical mechanisms
responsible for the weathering of epoxy resins and GFR epoxy resins(US Army grant DA-ERO-76-G-068) a natural development was to use
photoelastic imaging of interference caused by defects. The interference
patterns are generated in ultrasonic wave trains and carry information
which allow cracks, voids, and holes to be located. By acoustically
coupling a specimen to a transparent visualizing block, information about
defects in opaque specimens can be found. Attention has been focused on a
computer model which investigates the waves originating from a transducer
probe and those waves which emanate from a defect or fault.
A series of tests has proceeded in parallel with the computer model, but
as attempts have been made to detect smaller and smaller defects,
increased frequency requirements have led to difficulties. At frequencies
above 10 MHz there is a significant increase in the attentuatlon of the
ultrasound, and resin based specimens including those for adhesive joints
and film composites dissipate the stress waves rapidly. With some energy
2
41
always lost at the interfaces of the two phases of composite specimens, itis anticipated that the development of ultrasonic methods in non-destructive evaluation will be limited.
2. NE-IJON'S RINGS EXPERINENT
2.1 EXPERIMENTATION
4The method used to investigate swelling of the adhesive is to measure the
displacement normal to an adhesive layer. Accurate measurements can he
achieved by observing Newton's rings, perhaps more correctly described as
Fizeau interference fringes, created by having one of the adherends
sufficiently thin to allow flexing and in contact witi a reference flat.
Ie specimen consists of a thoroughly cleaned glass cover slip (the thin
flexible adherend) bonded to a thoroughly cleaned rigid block of glass or
metal. With monochromatic light, a complex pattern of interference fringes
is formed from the cover slip and optical flat reflections, which
precisely define the topology of the cover slip and therefore of the
underlying resin. Should the shape of the cover slip change, as happens
when the resin swells during water uptake, the pattern of interference
fringes changes.
The experimental arrangement is shown in Figure 1. Light from a mercury
vapour discharge lamp is directed through an interference filter, a
collimating lens, a half-silvered mirror, an optical flat, and the cover
slip. Interference between incident and reflected beams occurs within the
variable thickness gap located between the cover slip and optical flat.
The interference pattern is photographed using the light reflected into a
35 mm camera by the half-silvered mirror.
The pattern of interference fringes is determined by the geometry of the
gap between cover slip and optical flat and, to ensure that changes in the
pattern arise only from distortion of the cover slip caused by resin
swelling, it is essential that each run be carried out without disturbing
the specimen/optical flat assembly. All of the components are set tip on an
optical bench. Figures 2 and 3 show general views of the ambient
temperature and high temperature (<100 0 C) apparatus respectively.
Enhancement of fringe contrast as a consequence of multiple beam
interference can be obtained by fully silvering the upper surface of the
cover slip and partially silvering of the lower surface of the opticalflat. A range of reflective coatings has now been evaluated from which it
is evident that a chromium layer is most effective, having sufficient
3

water resistance to withstand a full length boiling water test. The main
disavantages of a chromium layer are that it obscures direct observations
of the adhesive and is difficult to remove should it need renewing. An
alternative and very successful method for securing multiple beam
interference and hence for improving fringe definition has been realised
by using i wedge shaped optical flat. With a wedge angle of 40 the image
of the Newton's rings does not coincide with reflections from other glass
or water surfaces. The wedge is made from flint glass with refractive
index 1.65 and has been incorporated into a mark II version of the hot
water apparatus designed to permit undisturbed tests at any fixed
temperature between ambient and 1000 C. This is shown in Figure 4.
Whilst direct observation of this interference pattern can be used to
measure increments of swelling, the changing geometry is obtained directly.
by s,,perimposing successive images of the pattern photographed during
water uptake, on the pattern photographed before swellin .
Superimposition produces Moire' fringes, the development of which
faithfully follows any changes in the shape of the cover slip.
Moire fringes are generated when patterns with nearly identical periodic
structures are made to overlap. In this instance, photographic ima.es of
the interference pattern form the periodic structures and differences in
the pattern, seen on comparing the image photographed before swelling with
images taken during swelling, gives rise to the Moir effect. In Figure
2, the Moir fringes are the circumferential lines running around the rim
of the specimen and are superimposed upon the interference pattern. (It
should be noted that the broad dark almost parallel bands running across
the specimen are due to tilting with respect to the optical flat). As
water diffuses into the specimen, new interference fringes are generated
at the edge and migrate towards the centre, each fringe representing the
locus of points of constant displacement normal to the joint. Similarly in
4 the Moir pattern, a new Moir! fringe is generated and migrates in from
the edge of the specimen whenever a new interference fringe is generated.
Thus successive Moire fringes map out the loci of positions which differ
in displacement normal to the joint by half a wavelength. Hence the number
of Moirb fringes N to have passed a given point is simply related to the
normal displacement of the joint w by:
w= N2 u
where \ = wavelength of light
= refractive index of the immersion liquid
4
.,

Specimens usually took the form of a circular glass cover slip bonded to arigid block of metal such as stainless steel or anodised titanium.However, some specimens were manufactured using cover slips which wereboth square in outline and of different thickness. This was done in orderto investigate the effects of varying the mechanical constraint
attributable to cover slip geometry.
2.2 WATER ABSORPTION MODEL
Consider the adhesive specimen of the previous Section in cylindrical
polar courdinates and assume axial symmetry.
Let J(r,t) denote the flux of water molecules passing perpendicular
through a reference surface ot unit area during unit time. J may be
expressel in terms of the local mass velocity u__ of the water molecule by
J(r,t) = c(r,t).u(r,t)
where c(r,t) is the local concentration of water molecules, at time t. N:omechanism of migration need be specified at this point.
The aim is to investigate the influence of the internal stress field whichcauses changes in both c(r,t) and u(r,t).
Fick's second law,
xx
gives the concentration of a diffusing species in one dimension. D, thediffusion coefficient can often be taken as constant, but in the diffusion
of polymers it is a function of concentration. When extensive swelling of
a polymer is caused by the penetrant, non-Fickian diffusion has been
observed, Kwei and Zupko (1969), Alfrey et al (1966).
Non-Fickian behaviour may be directly related to the influence of the
changing polymer structure on the solubility and differential mobility, ormay result from the internal stresses exerted by one part of the medium onanother as diffusion proceeds. Polymers usunly have a wide spectrum ofrelaxation times associated with structural changes and a sorption process
will be influenced by those segmental motions which occur at about thesame rate or slower than the motivating diffusion process. Alfrey, Gurnee
and Lloyd (1966) proposed a useful classification according to therelative rates of diffusion and polymer relaxation. Three classes are
distinguished:
I

(I) Fickian diffusion in which the rate of diffusion is much less than
that of relaxation.(II) Diffusion in which the rate is very rapid compared with the
relaxation process.(III) Non-Fickian or anomalous diffusion which occurs when the diffusion
and relaxation rates are comparable.
The following assumptions are made in the development:
Epoxy resins are assumed to be isotropic and homogeneous.
The specimen is treated as having axial symmetry at all times.-4 Activated diffusion forms the main contribution to the migration of water
molecules within the epoxy.
No increased migration of water takes place along the glass/epoxyinterface due to any deterioration of interfacial bonding.
Water uptake produces stresses which are not sufficiently large to formmicrocracks and channels.
Effects of gravity are negligible.
The epoxy resin behaves as perfectly elastic for the internal stresses and
strains caused by water uptake.The elastic constants are unchanged by the water concentrations
encountered in the epoxy resin.
The compressive forces at the rim of the specimen resulting frominhomogenpous swelling have negligible effect on the saturation
concentration at the outer surface, and that this equilibrium saturation
concentration is reached instantaneously.
In the following, two different models for the effect of stress on wateruptake will be considered. It will become apparent that a very important
quantity in such models is the concentration gradient. A largeconcentration gradient implies a large flux of water molecules by Fick's
First Law, which gives
J =-D c 2.1
3~x
In addition, however, a large concentration gradient implies a large
stress-field and thus possibly a significant stress-induced flux. Insubsequent paragraphs consideration will be given to the effect of thestress-field on the mobility and thus on the diffusion coefficient D. A
stress-induced flux term in Fick's First Law will also be introduced.
It will be convenient to use the word "system" to refer to the epoxy resincontained between the cover-slip and the microscope slide plus any watermolecules that have diffused into it. The word "specimen" will refer tothe complete model adhesive joint, i.e. the epoxy resin plus the glass
t6
4d
-AI

d
cover-slip and microscope slide.
Now consider a water molecule within the epoxy resin. On average it will
make 4 jumps per unit time with a distance 6 per jump. Ilien tile diffusion
coefficient will be given by an expression similar to
D =1 6 2
6
Now 5 the jump distance will clearly depend onl thet state of thle system;that is, one would expect the jump distance In a region under compression
to be less than that in an unstressed region. It will be i!;sumed for the
I 4] moment, however, that the jump distance remains constant and considerationwill be given to the effect of stress on the number of jurips per unit
time, .
Let vf denote that volume within the system whiclh is effectivelv free to adiffusing species to occupy without the necessity to perform work on the
surrounding polymer molecules. For an unstressed specimen one would expectthis volume to vary throughout the system as a result of the fluctuations
in thermal energy of the constituent polymer molecules. ThCerecfore,consider the mean value of vf, to be denoted by vf, which will be referred
to as the "free volume". In a region of the polymer which is under
compression vf would be expected to decrease from its unstressed value and
in a region under tension one would anticipate vf to increase. Thus for a
system in which there exists a stress-field
Vf = vf (r,z,t)
Now returning to , the number of jumps per unit time, one can see that
= f(Ethvf).4
where F denotes the thermal energy of the water molecule bein .considered and f is a function to be determined. If the effective volume
of the water molecule, Vw, in the system is greater than tile free voluro.
Vf then work will. have to be done on the polymer molecules surrounding the
free volume to permit the water molecule to jump. The energy to performthis work must come from the thermal fluctuation.. The probabi I ity that
the water molecule has thermal energy I" Is proport iolla I to theBoltzmann factor e-E th/KT. Now for a jump to occur one mus;t have E' th
E* where E* denotes the energy equivalent of the minimum performc.d work in
jumping plus, possibly, some constant energy term. Hence the probability
of jump Pr is proportional to
4 7

-F/ -T EhI AT{feE 'th/k dE' th,111f "e t dE' th
E, 0
giving Pr - e - E* / kT where E* is called the activation energy of the process.
Hence e-E*kT and, subsequently, from 2.2 one obtains D eE*/kT
If one assumes that variations in the jump distance 6 have a negligible
effect on D compared to variations in 4 then a possible expression for the
diffusion coefficient would be
D = D0 e-E*/kT 2.3
An alternative way of analysing the diffusional jump is to think of the
fluctuations in local free volume vf due to the thermal fluctuations of
the energy of the polymer chains. Then a water molecule will only jump if
a sufficiently large free volume vf (= v w ) exists adjacent to its present
site. Thinking in terms of the free volume as consisting of discrete,
independent entities one may use the term hole instead of free volume. Ifan energy Eh is associated with a hole of size vf then the probability
that a hole of size vf can be found is, according to the Boltzmann
distribution, proportional to exp(-En/kT). The average size of a hole in
the material is then given by the following expression
Vf = { f ' vfe - Eh/kT dvfl/1Je E f / k T dvf}
Also the fraction of holes having volume vw or greater is
I fEh/krdv }/{f-e-Eh/kTdvf 1 2.4
SVw o
In writing equation 2.4 one is assuming that the holes are discrete and
independent but in reality this is not so. Even if an individual hole maynot be large enough to accommodate a diffusing molecule, the co-operative
motion of several neighbouring molecules may allow two or more holes to
merge into one hole large enough for a diffusional jump to occur. Thus the
fluctuations in free volume will be brought about by complex
-A configurational changes of the polymer molecules and one would anticipate
-- 4 that an expression involving the various degrees of freedom available to
the polymer molecules would be obtained instead of 2.3. This is in facttrue and many expressions have been proposed (see, for example, Crank and
Park (1968] and Barrer [1941]).
Returning to equation 2.3 it is assumed that E* can be written in the form
E* = E + E 2.5
where Ew is the energy equivalent of the work done by a water molecule in
a diffusional jump and Fc is some constant energy term which includes that
part of the energy required by the water molecule to change locations even
8
I

W4,-*ANN_ VA mom-~ - -- -
____ ___ -. ~ -.- - - ~ ..--- "z-
Qi ims MOO-.----. ,. *
-. -- --. r-- - -- ~ - -* 4- *-Z--2
, .' L.. - -- - - - - -
X !I ...................

if the free volume is equal to or greater than tile volume vw. Consider aspherical cavity of radius rf at the centre of a sphere of large radius R.
Let rf and rw be given by
vf = 4 trf3, v w = , rw3
3 3
It will be assumed that a suitable approximation for Ew is
EW = Prf + r w (v w - 7f) 2.6
where Prf - r w is the pressure required to change tile radius of the
central cavity from rf to rw . Using elasticity theory one obtains
Prf + rw = 217 {n(r,t) - } 2.7( l+v )
where n = rw/rf > 1.
Now clearly as water molecules migrate through the system, and a
continuously changing stress-field is set up, then the free volume f willchange from its initial unstressed value Vfi" In order to estimate thiq
change in free volume vf consider a thin spherical shell of thickness s
where vf is represented by the spherical interior of this shell.
Assuming that rf is small then i/3oii(r,z,t) is approximately the average
value of the normal component of stress over the surface of the shell with
centre at a point (r,z) at time t. Thus it is reasonable to take the
pressure Ps at the surface to be given by
Ps (r,z,t) = -1I/3ii(r,z,t)
where O, is assumed known, and determined by elasticity theory. To remove
rhe z-dependence of this pressure consider an average over the z-
coordinate:h
Ps(r,t) = -1/3hfoii(r,z,t)dz
0
where oi = Trr + o06 + ozz and h is the thickness of the system. Assuming
tile thickness of the shell to be small relative to r elasticity theory
yields
u -Ps (1 - v) rf
2Es
9
- o

Thus the new free volume vfn is obtained from the old free volume fohy
fn = 4__ ((3v fo) 1/3 + UP
3 47E
Vf- f -X(f) l/3p)S 2.8
where X = 3(3_)1/3 (1 - v)4n 2E
Thus combining 2.3, 2.5, 2.7 and 2.8 one obtains
D = D' exp[-X(n- ){v w V fo + r. Ps}]
kT 2.9
when vw > Vfn' where
f4/3, 3D o exp[-Ec/kT], 2E, (Vf 4 /3nrfo
h rw (1+v) Sand Ps -1/3hfuji dz
0
If vw 4 'fn then D = Doexp[-Ec/kT] and no swelling should be observed.
Having investigated the effect of stress on the mobility and hence thediffusion coefficient, the possibility of a stress-induced flux will now
be considered. It should be noted that these two models proposed, aredifferent ways of modelling the same effect, i.e. the effect of the
internal stress-field, resulting from water uptake, on the subsequentwater migration. An attempt to combine the two models would be incorrect.
Firstly irreversible thermodynamics will be used to derive an equation forthe migrtion of water molecules which incorporates a term which can beinterpreted as a stress-induced flux. The equation to be derived issimilar to that proposed by Frisch et al (1969) to model Case II swelling
(see Page 3).
Consider an element of volume V of the system. Let there by n molecules ofwater in this volume, with velocity vi and denote their centre of mass
velocity by vw"
Then v = Vi
Let the centre of mass velocity of the polymer molecules be v p. Then thecentre of mass velocity ve of all molecules within the volume V will be
given by
10

P c = PwYw +ppYp
. where pw and p are the densities of the water molecules and the polymermolecules respectively and p - Pw + p"p The flux of water molecules
defined with respect to the centre of mass frame is given by
-w = C w(Vw -j Vc p)
where cw (the concentration of water molecu les) =Pw/p and theconservation of mass gives
pDc i + V.(pJ) = 0 i = w,pDt 2.10
where D = + Vc .VDt 6t
It will be assumed that the equation of motion may be written in the
form: -
+ pi j (i,j = 1,2,3)
Dt k= 6x
by analogy with fluid dynamics, where pij is the stress tensor, and theforces Fk will be assumed zero. Th)e energy equation for u, the energy perunit mass, with the exclusion of the centre of mass kinetic energy is
-11 (I(V )2 + u) = -(P1 )-C ii(V_d~i )
Dt 2 ax.
Elimination of (vc)2 using the equation of motion gives
pt. = Pij (%_C) i (i,j : 1,2,3) 2.11Dt xj
The Second Law of lhermodynamics gives
T PS = DU + pP - T2 1 k l)fk
Dt Dt Dt k=w,p Dt 2.12
where pw and Mw are the chemical potential and total mass of the wat or
molecules, respectively; p p and M are the chemical potential and total
mass of the polymor olecules, rep ectively; S is the total entropy and 1I
the total energy. Ile quantity, p, in 2.12, denoting the pressure can bedefined to be equal to - 1 /3Pii, and for convenience let
-,11

Pij = -p6ij + dij 2.13
where dii = 0.
Changing to intensive quantities 2.12 becomes
T Ds _i + pPv - F~k D--k
Dt Dt Dt k=w,p Dt 2.14
Now substituting 2.13 into 2.11 gives
pD_u = -p V.V c + d ij L(~V )i (i,j =1,2,3)
- Dt l xj
But = -V-2 Dv = -pV.ycDt Dt
thus Du = -p Dv + dij (V )
Dt Dt F ax 2.15
Introducing 2.10 and 2.15 into 2.14 gives
pT Ds=d..-(V).+ I (P .1k) (ij 1,2,3) 2.16
Dt Ox. k=w,p
Now diffusion is an irreversible phenomcinon which can be expressed to a
first approximation by linear phen6menological relations of the generaltype
mJi r Lik Xk (i = 1,2, ... , m)
k=1
for an m-component system where J. denotes the flux of the ith component,INA Xi denotes a "force" (e.g. concentration gradient, potential gradient),
and the coefficients Lik (i,k = 1,2,... ,m) are called thephenomenological coefficients (see, for example, Bearman and Kirkwood
(1958), Bearman (1958), De Groot (1951).
Now 2.16 can be rewritten in the form
p Ds F V.(Ipe) + dij o(v )i + E J
Dt k=w,p T T 6xy k-w,p T 2.17
where =-PV11k 2.18
for isothermal diffusion.
* 12

Note the term d ( ) will have no inf luence on the form of the
T xj
phenomenological relations
~ =L tw +Ltp~J LWWW + Lw- X
-p pp-p
since the force in this term (i.e. (V c) /cx ) has a ten:;orial character
and cannot give rise to vectorial fluxes Ji (Lrie's theorem).
Now it can be shown (See De Groot [1951)) that
ww wp L pw + pp 0,Lww = , L +Lp = 0.
so that J = -J = Lww(X - X p) 2.lq--w -p ww -
Alternatively, since it was already known that J = -J one could haveused this in deriving 2.17 to give . = -Pg (ow -p ),X 1 0 yielding thesame results. Using 2.18 and 2.19 one obtains
Jw = Lww(-pgp w + pVp )
= Lwwp [( p - It)) Vp + ( ! (p -1 )1 %7CL (p w p w W
ap T1C w kCw TiP 2.20
Now Cwdp + C dp = 0 at constant T and p ( - the Cihs-Diiojm rl,t lon1also Cw + C =. p Now it is expected that C p Cwt then
p4 pPp P))(( L ( -~ = - (+% ,,1cw T P C p ( TI-- p w
3Cw TlP
also
0 1 << _TIC 0 p TIC w
13

Thus 2.20 becomes
- - p[( L,,,) Vp + (olw) V C1 2.21O p TIC w 04w TiP
For non-ideal systems the chemical potential of the ith component takes
the form
Ii = Ci(pT) + RT log fiCi 2.22
where Ci(p,T) is independent of composition, Ci denotes the concentrationand fi is the activity coefficient, due to G N Lewis (see for example,
Prigogine (1967]). Substituting 2.22 into 2.21 one obtains
j, - Lp [( Z). Vp + RT VC.p T Cw
Now Fick's First Law gives
J - DVC
therefore let the diffusion coefficient be defined by
D = LwwpRT 2.23
Cw
Then the flux of water molecules in the epoxy resin is given by
Jw = -D(VCw + C ( Cw) Vp)
RT 6p T 2.24
where the term (W)4 Tp T
will depend on the interaction forces between the water molecules and
their neighbouring polymer molecules.
An alternative method of deriving an equation of the form 2.24 is to
consider the probability of a water molecule jumping to the right or to
the left (in one-dimension). For simplicity consider the one-dimensional
case only, with position co-ordinate x. Suppose thnt the pressure in theepoxy resin p( - 3o p) decreases with increasing x - co-ordinate.
4 14

Then the probability of a water molecule jumping to the right, to a siteat x + Ax, is given by an expression of the form
PR = Aexp(-(al + a 2 P(x + Ax)}/kT]
using equation 2.9. Similarly the probability of a water molecule jumpingto the left, to a site at x - Ax, is given by an expression of the form
L exp[-{al + a 2 P(x - Ax))/kT]
Thus the flux of water molecules due to the stress-field is given by
J S = IL(PR - PL )
= pAa, {p(x - Ax) - p(x + Ax))
kT
-2pAn,, 6 ~pkT O
where Ax has been replaced by 6 the mean jump distance and i is some
suitable proportionality factor.
Then the total f lux, denoted by JTOT' will be of the form
JTOT = -D (Lc + ac _)ax 3x
similar to 2.24
15

2.3 RESULTS ANT) DISCUSSION
After the first two years of experimental work the models described in theprevious Section were set up. These two models of the possible effect ofan internal stress field on water migration in epoxy resins, can berepresented by the following two equations:
-{a 1+a2p(r,t) )/kTc = V. [D e VC)
and 0c = V.[D(VC + cxVp)]3 t
where a, and a, are constants with x assumed constant. For both models itis important to have a knowledge of the pressure distribution p(r,t) whichmay be obtained from elasticity theory. oi (r,t) is most conveniont Ilyarrived at by applying numerical methods such as finite difference orfinite element methods. Thus one can proceed to values of p(r,t) - -1/3c7from i ich th e values of the constants can he determined by matchinecomputed concentrations, for a given time, to experimentally evaluated
concentrations.
It is possible as a first approximation to use the normal stressesnecessary to return the cover slip to its initial shape as the pressure,and here we could apply A E H1 Love's equation
.4p = RIV
where u) = 6(0) is the axial displacement, p the normal stress (pressure)and R the flexural rigidity. The cover slip is treated as a thin plate.
The exact nature of the effect of the cover slip on the stress field ishowever a major consideration, since replacement of the cover slip withanother microscope slide would allow little deformation and surfacestresses would become more significant.
The effect of the cover slip is not at all obvlous as it is chosen for itsflexibility but the tangential stresses exerted by the cover slip couldform an important constraint on the system.
The first long term test was made at room temperature on a joint between acover slip ard cleaned, but not anodised. SIC alumilin"I. A generalpurpose epoxy resin containing entrapped air [ubbles was used as adhesive.Hereafter, this adhesive will be referred to as adhesive A. Its full
4 16

identity, including hardener and accelerator, and the curing schedule 1u.,Odfor it, are given inl Table 1.
RFSIN SYSTEM PRO1PORTIoNS CE 1 CUR E
p.b.w.Ciba Geigy
MY 750 (Diglvcid\ I etherof bisphenol A) 100
2 houirs 4 hours4A IIY 917 (Methyl tet rahyvdro- "It a t
ph tha lie anhyd ride) 85 1 Oo~C 1 o0C
DY 062 (Triamyl armonium
phenate) 2
Bloomingdale
1 hourM 1000 (Nylon mcdified at
B epoxy film) 170VC
2 hours I hourBR 1009/49 (Phenolic primer) a t a t
20'C 700 t:
C Ciba Geigy (modified epoxy film)
1/2 hour at 120c)CRedux 312/5
D Bloomingdale
I houir it 12 2UCYElM 73M (modified epoxy film)
Table 1. Adhesives ind Curing Schedules.
17

Later tests were carried out on joints between a cover slip and substrates
of both stainless steel and anodized titanium using the commerially
available adhesive film system designated B in Table 1. All metal
surfaces were cleaned and, where applicable, treated in accordance with
commercially accepted practice. The metal based specimens were supplied
by Westland Helicopters Ltd in the form of cleaned and pre-primed coupon
specimens.
For tests employing the adhesive film systems designated C and D in Table
I both adherends were glass. Preparation of the glass cover slip surfaces
is less well standardised. The fundamental problem is removal of oxides
of low surface energy. Chemical attack by common oxidising agents, e.g.
nitric acid and hydrogen peroxide certainly remove a large fraction of
these oxides. So too does exposure to the oxidising region of a naked
flame. Sand blasting in order to roughen the surface and promote
mechanical linkages, and application of coupling agents (silanes) have
also been recommended. However, no combination of these treatments has
yet produced a joint which, when it eventually debonds after prolonged
exposure to water in the absence of externally applied stress, leaves
fracture surfaces which do not include large areas of glass/adhesive
interface.
In joints manufactured using liquid resin, a reproducible plue line
thickness was achieved by simply allowing the cover slip to sink under itsown weight. In joints made using solid adhesive film, the glue line
thickness was controlled by clamping during the cure process.
Adjacent rings of the same colour (black or white) .aire loci of points for
which the optical path length, in the space between cover slip and optical
flat, differs by one wavelength. By the same token, a displacement in the
pattern of Newton's rings by an amount equal to one ring, width corresponds
to a change in path length equal to one wavelength. By observing changes
in the number of rings between fixed markers, such as entrapped air
bubbles, displacements normal to the joint during water uptake can be
measured to an accuracy of A/4. If required, displacements which are at
least as small as N/lO can be measured by superimposition of images in
order to create Moir6 patterns.
The water concentration, and hence the swelling associated with water
uptake, eventually saturates and thereafter a shoulder separating fully
saturated from less than fully saturated resin, progressively moves
Inwards from the rim of the joint. This is shown schematically in Figure
5c. Figure 6 shows a sequence of images obtained, showing the development
of swelling in a joint manufactured between anodized titanium and a glass
cover slip using adhesive B and immersed in distilled water at
approximately 800 C.
18
4

To maintain contact with the outer ring of uniformly swollen adhesive
(Figure 5c), the adherends would each need to bend with curvature that is
opposite to that inside the shoulder. Failure to adopt such "S" wise
bending manifests itself as an interfacial crack, the occurrence of which
is revealed as patches of bright contrast at the rim in Figure 6.
The positions of well-defined points in the patterns of Newton's rings may
be measured as functions of time. Figure 7 shows a plot of the shoulder
defining the extent of water saturation, and of the crack edge as
functions of (time) for an aluminium joint manufactured with adhesive A
- and immersed in distilled water at 20 C.
Figure 8 shows a plot )f the shoulder defining the extent of, water ingress
form the experiment reported in Figure 6.
Figure 9 shows a similar plot for a spec!men manufactured using adhesive B
but with a stainless steel substrate and for an immersion water
temperature of 80 0 C. From the marked similarity in the results for
anodized titanium and stainless steel it is concluded that the deformation
is wholly within the adhesive and is independent of the adherend. Moir
patterns, generated by superimposition of interference patterns before and
after swelling were used to obtain the data in Figure 10. These specimv'ns
were manufactured from adhesives C and D and measurements were made at a
range of temperatures between ambient and 100 0 C.
If migration of water occurs at low water concentrations and is governed
by Fick's law, plots of migration distance as a function of (time) / 2
should approximate to straight lines. The data points for specimens
manufactured with adhesives A and B certainly do not approximate to
straight lines. However those manufactured with adhesives C and D and
which were studied using the more precise Moire measuring technique do
suggest Fickian behaviour although the slopes of the graphs indicate
activation energies that are much higher than normally expected for epoxy
resins.
To draw a comparison of this apparent Fickian behaviour in the specimens
with the theory, we can solve Fick's law in cylindrical polar coordinates,
assuming axial symmetry:
(C = _2c + I )c
6T = 6R R 3R
where T = Dt/a 2 , R = ra, C = c/cSAT with D a constant diffusion
coefficient.
19
II

By using a suitable substitution this equation is Bessel's of order zero,and a solution may be found. For small values of T, the infinite series is
slow to converge and computation is impractical. As T increases however,
it is possible to obtain series which converge quite rapidly. Such aseries has been used to obtain the theoretical curve of FitLire 11 for aRedux 312/5 epoxy at 62 C where the time is 334 hours. It was foundexperimentally that full saturation was represented by 14 fringes and theexperimental results have been included in the Figure 11.
4
20
t1

By using a suitable substitution this equation is Bessel's of order zero,
and a solution may be found. For small values of T, the infinite series is
slow to converge and computation is impractical. As T increases however,
it is possible to obtain series which converge quite rapidly. Such a
series has been used to obtain the theoretical curve of Figure 11 for a
Redux 312 '5 epoxy at 62 0 C where the time is 334 hours. It was found
experimentally that full saturation was represented by 14 fringes and the
experimental results have been included in the Figure 11.
2

3. SELF STR ESSED FRACTURE MECIJANICS TESI-PIECF
3.1 THE ELASTIC DISC IN PLANE STRAIN
The disc consists of a circle of aluminium which in plane polar co-
ordinates is defined by the relations Ofr~a and O',In2s. It is stres sed byremoving a ;cctor O;rla, 2n-Q.<027t and making an adhesive joint when the
gap has bec:i closed. Assuming that plane stress conditions are met, it isnecessary to calculate the stress intensity factor, KI , and the formationenergy, W, for the crack c~r~a, 0 = 0. Tlis has been done by
superimposing the solutions of the resulting stress with thos;e of KI and Vfor a traction-free circumference and a symmetrical pressure loadin',.
The Airy function given by Mitchell (1899), Eshelby (1966)
T'(r,0) = a + b0 nr + c 0 r 2 + d0r 2 nr 3.1
may be used to find the stress and displacement fields:
-rr (r,) = b0 r2 + 2c + d0 (1 + 2 lnr) 3.2
orO(r,O) = 0 3.3
ooo(r,0) = -bor 2 + 2c 0 + d0 (3 + 2 lnr) 3.14
.r(r,O) = El{ -b 0 (I+v)r-I+2co(1-v)r+2d0 (1-v)r lnr-d 0 (l+v)r} 3.5
and
uO(r,O) = 4E'-1 d0 rO 3.6
Since the solution is required to satisfy the conditions
W 0 rr (a,O) = OrO(aO) = 0, 0 0 n2
(ii) uO(r, 2,t) = rQ and
(i) U r and no are bounded at r = 0, we see that bo O,d = El/0 1
and c -(EP/8s) In(a/e).
21
4 . ... ... . . . . . . .I. . . ."i4- -H -| .. . I I I "

Therefore
T = i r 2 ln(r/a V'e) 3.7
8
and
000 (r,O) = F {1 + In(r/a) 3.84n
It follows that we may write o(r) = p0 f(r/a)
where Po = F2/4t
and f(p) = I +Inp
To find KI and W the dimensionless quantities p r/a (already introduced)may be used
Spp(p,0) = Orr (r,0), sPO(p,O) = Orp(r,O), s0 0 (p,0) = oon(r,n) 3.9
P0 P0 po
u(p,0) = Eu (r,0) and v(p,0) = Eun(r,0)
then, by making use of a symmetry argument, it Is easily shown that theproblem to find KI and 1 may be stated as follows:
Solve the dimensionless, plane stress equations of elasticity in the semi-
disc Op~l, 0<04n subject to the conditions
i) le stresses and displacements are bounded at r = 0
Ii) sP (1,0) = s P(1,O) = 0, O<O<tiii) sPO(p',o) = s 0 (p, t) 0,o<Ptliv) v(p,a) = O, 8 p !v) v(pO) = 0, O<p~c
vi) sOO(p,O) = - (I + log p), c<p~lvii) limit ?ov(p,O) <
p+I h
By slightly modifying the results in section 2 of Tweed and Rooke (1973)
It can be slmown that there is a solution of the equntions of elastiityin the given region, which satisfies the conditions (I) throuph (v) and issuch that
Iq22

SOO (p O) 1 fP(t) M( t)dt, O<P4 1 3. 10
and
pv(p,0) = _2 P(t) dt ,c<p'8 3.11
where P(t) is an arbitrary function of t
and
M(p't) 1 + (t2 21 + t(t 2 - )- t + t -1 3.12tp t1-pt)3 (I -pt)
2 (I -pt)
It follows that conditions (vi) and (vii) will be satisfied also if P(t)is a solution of the singular integral equation.
I1 f P(t)M(p_,t)dt =-(1 + log p), .13
71J /(-t(-)
c
with subsidiary condition
P(1) = 0 3. 14
The stress intensity factor K1 and the crack formation energy 14 aredefined by the equations
K I limit .'2i(r-ac) FE bu,(r,0) 3.15
r+ac+ 2 or
and
aW =f P0E1 + log(r/a)] uo(r,0)dr 3.16
ac
respectively. Therefore, by 3.10 and 3.11 we see that
KI PO p0 ___ P(c) 3.17
1c
23

d
and
W 2p2a2 tP(t)lopt dt 3.181/ ((-t) (t-c)J
E
C
Let Ko and 1 o be the stress intensity factor and formition energyrespectively of a crack of length 2(a-ac) in an infinite elastic solid,
when the crack is opened by a uniform pressure pOP then after Sneddon and
Lowengrub (1969)
K 0 P ia(1-c) 3.19
and
Wo = n22 (1-c) 2 3.20E
Therefore
K /2 P(c) 3.21K I-c0
and
i = -2 ft P(t) log t dt 22
Wo (I-c) 2 J[ (l-t) (t-c) IC
Also of interest is the strain energy release rate (() which is
defined by
() 1 = 1 KI2 3.2361 E
where = a(1-c) Is the crack length.
If we define
I K 2 = p 2 Ta(1-) 3. 24
E E
then"12 2 P 2 (c) 3. 2,
K°2 (j)- 2
Numerical solutions to equation 3.5 are found by the Cail s-(ihbysh,,v
24

°:quadrature technique, Erdogan and Cupta (1972), and tile ratio Y /Ko us ing
Chebyshev-Lagrange interpolation. lhe Gaussian quadrature formula is usedto deterrine d/(7t
3.2 EXPERIMFENTATION
A pilot scheme was executed to investigate the parameters controlling the
design of the self stressed fracture mechanics test-piece. SIC aluminium
discs, 3" (7.6 cm) diameter, 1/16" (0.16 cm) thick with a 50 sector
removed, provided the first test-pieces. In practice the sector in the
pilot test-pieces was closed by deforming the disc into a cone which,44 after joining the cut faces, was flattened by clamping between a pair of
plattens. The theory demands boundary conditions that naturally set the
shear stresses and radial component of stress at the free surface to Zero,
and that the sector is closed up simply by the 9E component of stress.
These original test-pieces were found to be stressed beyond the elastic
limit in some areas of the discs and further aggravation came from
buckling. Mitchell and Head (1961.) calculated that a disclinated plate9will buckle if the angle flbuckle exceeds 13 (thickness/radius) . For the
original disc, "(b = 1°20 ", therefore buckling presents a problem. It
became necessary to optimise the three parameters:
(i) sector cut out angle
(ii) disc radius
(iii) disc thickness.
Variations in (i) and (ii) lead to difficulties in preparing a sound joint
and thus, the thickness was increased to 3/16" (0.48 cm) which removes all
chance of buckling. The discs could not now be manufactured by punching,
each having to be machined, and although this will lead to a more
expensive specimen, it should be borne in mind that the test-piece can be
used many times as it functions wholly within the elastic regime.
Closing the gap to allow a joint to be made at the cut has been very
carefully examined. A custom built chain wrench closes the gap too
quickly, and a range of differing gaps were tried to solve the problem. To
compensate for the pinching effect a parallel sided cut was effected using
a range of gap widths. This reversed the pinching effect in that cI ,ntire
occurred first at the circumference. A series of tests was also carried
out where the elastic limit was exceeded and the amount of plastic
deformation was monitored. The data from these results allowed the
dimensions of a wedge to be determined which would maximize the amount of
elastic strain energy stored in the disc, and allow the two faces to close
up evenly within the no buckling requirement. The wedge dimensions were
25
I-- ..-.. aa-- mS... . . .

set at 1.1 mm (0.046") at the circumference and 0.75 mm (0.032") at tile
inner edge, giving a sector angle approximately equal to 10.
The cleaning process carried oat immediately prior to the adhesive joint
formation was as follows:
TIME TEMPERATURE(mins) (0C)
I. Chlorinated solvent(carbon tetrachloride) 5 .mbient
2. Non-silicated alkaline cleaner
(0.1 molar sodium hydroxide) 10-15 63
3. Tap water immersion 2 ;IMbient
4. Tap water immersion 5 38-60
5. Deoxidiser (170 ml nitric acid
30 ml hydrofluoric acid, 800 ml water) 10-15 ambient
6. Tap water immersion 2 arbiont
7. Deionised water spray - ambient
8. Phosphoric acid 9-11% by wt in
deionised water ambient
Apply voltage for 1 minute. Step to 10 volts
after 2-5 minutes. Maintain for 20-25 minutes
9. Tap water spray 10-15 ambient
10. Defonised water spray 2 ambient
11. Dry in air 30 80
12. Cool in air 120 ambient
13. Prime within 120 min -
14. Dry in air 30 ambient
15. Dry in air 60 123
26.1

The cleaned aluminium test discs had the epoxy resin strip or layer ofpaste positioned between the opposing faces of the wedge cut out, with
restraining plates on each side of the discs to maintain flatness during
the closing operation. Standardisation was achieved using a torque wrench
set at 16 ft-lb. Immediately on closure, the restraining plates were
removed and the prepared joints gelled and cured. The manufacturer's data
sheets were strictly followed for both cure times and temperaitures.
Examination of the joints revealed reasonable reproduction of the bond
line thickness, approximately the thickness of the resin strips used,
0.25 mm. The proprietary adhesive resin film most extensively employed wasFM73M, but others which were tested in the experimental programme were
Redux312/5, and DLS468/DLS476.
The length of crack when present, was measured and the disc was then
immersed in boiling water for varying periods of time. After eaichimmersion the length of crack was measured. This process was repeated
until the crack had propagated the full length of the glue line, with
frequent water changing to avoid contamination. On examining the crack itwas always found that the crack length was different when viewed from tho
two sides of the disc. For the purpose of evaluation, the average value ofthe crack length read from both sides was noted. Also, near the crack tip
it became increasingly difficult to distinguish where the crack actually
finished, a result of the hairline nature of the crack. When the crack
length was apparently shorter in the glue line after further boilinp, thelength of crack was taken to be the distance to the end of the last crack.
With some discs that did not initially crack on release of the clamp anattempt was made to induce a starter crack in the glue line by either
sawing a small nick at the periphery of the joint, or l-• immtrsing thediscs in liquid nitrogen to increase the stress field in the disc by
contraction of the aluminium. Unfortunately, neither method proved to lesuccessful.
A series of experiments were performed using a perspex disc of similar
dimensions to the aluminium specimens. The object here was to use a
photoelastic method to study the stress field during crack growth.
Initiation of the crack has proved difficult and satisfactory monitoringof the stress field during propagation is presently under study.
Two undergraduate students, Gilbert and Longdeon, .ork ng here In Bri:;tol
have become particularly interested in the experimental ea iluatfon of the
fracture mechanics test-piece and are taking this piece of interest in)'
research a stage further.
27I4 . .. . -i.

3.3 RESULTS AND DISCUSSION
On release of the chain-wrench clamp from around the ftres.ed disc, cracklengths vary according to the epoxy resin adhesive formulation used to
make the joint. The crack always propagates the fuill glue-li ie I eni'th(1/a = 1) :,)r resin Redux 312/5, whereas for F2731 ro crack is present inthe joint 1/a = 0). The 1/a values obtained for PIL.4648/1)LS476 are 0, 0,0, 0.40 and 0.82.
Correlation of crack length with independently measured values of_ Ic iS
required in order to generate calibration curves for a given geometry ofself-stressed disc. Available C data for the dry adhesives showvariations, e.g. FM73M has values of 2.38 k.J/,! and 3.67 .j /,, for twodifferent batches. Redux 312/5 and D)LS468/DIS.4'76 both have Ic val.es oit2.8 kJ/M. Using as calibrati.on points, the IC ' Lies for dry -i73 ao dRedux 312/5 and the stable crack lengths measured after r,echinic :lv
introducing started cracks, two values of I/a measured for 1)1.S.()S/D.S"7 oindicate that ( IC)max is 3.65 + 0.55 kJ/M2
Conflict evidently exists between the published data and the resu t s
obtained here; with DIS468/DLS4 76 our self-st ressed di.cs were ound to
crack partially or not at all. With Redux 312/5, the bonds crack o,.'or the
full length of the glue line. With FM73M no cracks are found : iy esti t.
that 9iC Is greater than 2.8 kJ.M 2 . With a view to chariig up thi
dilemma, independent measurements of IC on the part iculr hatch<e ofadhesive films used here are being made at the University of Cambridge.
Results presenting the variation of IC I expres .sed as a froict ion ot( iC)max with water uptake by FM73M are shown in Fi -ures 12 to 1". "J,
specimens were immersed in boiling distil led water. The ti -e for thestarter crack to appear varied from 5 to 130 mins., Exarinat ion of tho
joints after total failure show that propagat ion of the, cracks occurthrough the resin and definitely not at the rosin/aluiiniur lutertace.
28
4

LWI
4. PHOTOELASTIC IMAGING )F DEFECTS
Andrews and Wallis (1977) were first to demonstrate that a lightemitting diode(LED) can be used to illuminate the stress waves travellingin a visualizing block when viewed through crossed polars. The method was
applied to the detection of defects in opaque solids by Hardy, Turner andAshbee (1978). There is a strong reflected component, mode converted,from a dei'-ct which can be observed some distance from the flaw, after thestress wave has travelled from the specimen into the transparent block.This wave interacts with direct waves from the transducer to give
4I interference patterns for which a computer model has been devised byKitson, Low and Turner. All the longitudinal and shear waves emanatingfrom the transducer, the interface and the defect, with and without modeconversion, are investigated.
4.1 COMPUTER MODEL
Figure 16 shows the representation of the model, with a series of' radiatingpoint sources depicting the transducer. An array of points P(x,v) formsthe visualized zone and was originally set at 31 x 31 to conform with
computer graphics. It is assumed that the defect is p rfectly round, thatlongitudinal (L) and shear (S) waves emanate from the transducer pointsources, and that on reflection and refraction both mode converted andunconverted waves emerge. The following relationships hold:
= sinc , sin' = sin
VL VS VS US
where VL and VS are the velocities in the specimen and U, the shearvelocity in the visualizing quartz. Note that the subscripts arc interchangeable for the incident shear wave reflected as longitudinal and for arefracted longitudinal wave. Relative intensities may he evaluated usingthe Zoeppritz equations and an attenuation factor of 1/[ix is included forthe wave amplitude as it travels away from the source. Hence we may findthe exact path which any particular ray travels together with its
amplitude at a point. Each flash of the LED is represented by a sine wave,singly for single flash and several cycles for multi-flash.
The complete picture is built up as follows: each type of wave[longitudinal/shear (LS), long/long/shear (LIS), etc.] Is considered inturn for each transducer point source. The program calculates (1) thepath between the transducer point and a point in the rectangularvisualized array (subject to the path being possible,, (ii) when the soundpulse arrives at the visualizing point, and (iii) the amplitude. The
29
-J4 --- - A

amplitude is then multiplied by the value of the illumination waveform atthat specific time, and repeated for all the points in the rectngle.
Results for all the transducer elements are superimposed, and finally thewhole process repeated for ,:ich wave type in order the simulate thecomplete interference pattern. The final array is normalized to give thenegative or compressive regions the lighter shades of the computersimulation and the positive or tensile regions the darker areas: anormalization analogous to the quarter wave plate.
Two main calcu lation procedures are used in the prosram, RPlATt andDIRCALC. REFPATI, the flow diagram is shown in Figure 17, deals with thepatterns resulting from the wavetypes which are reflected from the defect,whilst DIRCALC handles those direct from the transducer. Any wavetypescan be included, but it is found experimentally that many are of littleimportance and only LLS, LS, and SSS need to be considered. It should beremembered here that the experimental arrangement of the photoelasticmethod helps enormously to reduce the number of wavetvpes which contributeto the visualization. In the direction of principal stress, i.e. thedirection of the stress wave propagation, 45 degrees to the polar axes,only longitudinal waves are visualized, and at 45 degrees to thisdirection, along the polar axes, only transverse waves can be seen. It isin this direction, along the polar axes that we are primarily concerned asit is here that most information is displayed.
The first attempts to display the visualized array by computer graphicstook advantage of SYMAP (SYMAP is a computer program for producing mlpswhich graphically depict spacially disposed quantitative and qualitativeinformation. SYMAP was d1signed and developed by the Labora tory forComputer Graphics at Harvard University, USA] and then SY.'V wa emploedto give a topographical representation of the data. The former programhas the advantage that direct comparisons could be made of the
4i photographic results, but suffered from having only ten levels of shadin g,whereas the latter shows the dislocations very well. Figure 1S shows thecontour map where the maximum pressure is represented by a heirut of 3ins, with a minimum of 0 ins. The viewing point is at an altituide of 30ins with an azimuth of 335 degrees. Dislocations in this context refer tothe line of discontinuities in wavefronts which line run,; in the direct ieonof the stress propagation. A new program was written therefore, fellowinsthe principles of SYMAP, but with facility for 100 shading:. Some ti mewas spent experimenting with different overprinted choract ers in order toget a set of evenly varying shades. It was found that a sub-routinodesigned to interpolate the brightness between the array point,; gave :Ismoother picture when the visualization density map was plotted on theline printer.
30
I

-A
4.2 VISUALIZED SOUND EXPERIMENTS
Figure 19 shows a schematic diagram of the apparatus. The LED sends a
single pulse (single flash) or flashes a number of times in
synchronisation with the ultrasonic frequency (multi-ilash) to illuminate
the stress field in the quartz visualizing block. The birefringence
exhibited by quartz when it is stressed, results in a small component of
light being propagated perpendicular to the axis of the polarizer to give
elliptically polarised light. This contrasts with transmission of the
illuminating pulses through unstressed -egions of the quartz since here
the light remains plane polarised. The analyser, set at 90 degrees to the
polarizer, permits transmission of the small component only so that the
stressed regions are revealed as bright fringes. Bright fringes arise in
both tensile and compressive regions, and, by suitably setting the quarter
wave plate, all the light from the most highly compressed region can be
eliminated. Thus some light can be seen for unstressed regions with the
tensile areas brighter still, the whole picture being built up
stroboscopically at repetition rates up to 3 kHz. Full details of the
experimental approach are given in Hardy, Turner and Ashbee (1978).
The experiments which have been carried out in parallel with the computer
modelling have been mostly single flash, i.e. a single LED pulse for
illumination. Single flash images are difficult to record because they
are so dim, but it is necessary to identify the different wavetypes. A
series of experiments were conducted with no specimen in place in order to
investigate the transducer for accurate computer modelling. For these, $three flashes were used. As the shear waves travel more slowly than the
longitudinal waves, the shear fringes are closer together: a fact which
with their position simplifies the identification of any particular wave..
To investigate the transducer beam, a series of photographs was taken
varying the polar axes, thus compensating for the angular sensitivity of
the optical arrangement. The angular spread of the beam was found to be
approximately 90 degrees.
A number of different transducers have been tried including, two commercial
designs, but the results have been obtained with a transducer designed and
built in the laboratory. It consists essentially of a brass plate 0.9
ins. (2.2 cm) diameter and 5 N /4 thick on to which a 0.4 in. (1.0 cm)
diameter piezo-electric disc is soldered. However, the image is still
complicated by secondary waves arising from reflections within the brass
and disc.
After the initial experiments it appeared that two wavetypes were
contributing to interference patterns seen in the visualized region.
Firstly, the wave reflected from the defect. This is mode converted but
31
I

crosses the interface between specimen and visualizing block without afurther conversion (LSS). Secondly, the direct wave originating as shear
at the transducer and again crossing the interface without mode conversion
(SS). The experiments show, however, that the prominent shear waves leavethe specimen/quartz interface at roughly the same time as the primary
longitudi,. is. To investigate this further, the positions of the primary
longitudinal and shear waves were plotted for a series of different delay
times. Different specimen thicknesses were used for the measurements as
well as readings taken without a specimen. The results shown in Figure 20
strongly suggest that the shear waves arise by way of mode conversion at
the interface, having crossed the specimen as longitudinal waves. Shear4 waves generated from the transducer are apparently unimportant. Different
effects of the quarter wave plate on the two wavetypes account for the
incorrect positioning of the specimen/quartz interface in that Figure.
To establish a baseline from which to judge images from resin specimens a
range of steel specimens have been produced with thicknesses up to I I/4
ins (31.2 mm) each containing a transverse hole 'def,;ct' having diameters
in the range of 0.04 ins (1 mm) to 0.4 ins (10 mm). A 35 mm Nikon F2
photomic camera is used to record the results with an eipht minute
exposure on ASA 400 film for single flash at different delay tir(vs.
The delay time is measured from the original ultrasonic pulse to the I.[
flash, and is the time taken for the sound to travel from the transducer
to the visualized position. The TTL control enables this to be accuratfly
measured, since the delay monostable and thyrister fired ultrasonic wave
are triggered by the same pulse. A digital readout of the delay is usd
which can be checked against the time base of the oscilloscope.
4.3 RESULTS AND DISCUSSIOM
The results are presented in a graphical form which show both experimental
position and the computer simulation. Figures 21 and 22 show the results
for two delays, 8.8 and 13.4 s respectively for steel specimens. The
dotted lines give the position of the computer prcdictIon and the hardlines have been traced from the photograph. They show that the propran
correctly predicts the wavefront spread for both the [S and [S waves. It
is the former which represents 'information' from the defect. Differences
In the lengths of the wavefronts can be attributed to the differences in
the transmission coeffecients. The latter are complicated by the acoustic
coupling at the specimen/quartz interface by a thin film of water.
Broadening of the lower LS wave is caused by the superposition of the LIS
wave i.e. the reflection from the hole without mode conversion.
32i• .

The experimental delay times against the theoretical time required to
align the LS waves is shown in Figure 23. The gradient of unity within 3%
demonstrates further that the program correctly predicts the LS position.
A sequence of tests was undertaken with thicker specimens 1 1/4 ins (31.2
mm) containing a hole 0.3 ins (8 mm)diameter, where the distance between
the hole centre and the transducer, A, w-s varied. Figures 24, 25 and 26
give the results for A = 0.27 ins (7 mm), 0.61 ins (15.6 mm) and 0.95 ins
(24.2 mm) respectively.
The above results refer to single flash which was regarded as tile best
approach for wave indentification, whereas the original approach began
with multiflash. More information is carried in the multiflash picture!s
as the close up of the interference patterns from 0.04 in (I mm) radius
'defect' shows in Figure 27. The multiflash simulation of Figure 28
illustrates the interaction of the LS wave and the LSS wave reflected from
a hole of 0.04 ins (0 mm) radius.
In composite materials it has been possible to calculate both longitudinal
and shear wave velocities by measuring the delays across a known specimen
thickness. Velocity variations have been detected during water uptake and
are attributed to resin plastication and to post curing. Experiments oil
composite laminates containing holes have been less successfil.
Attenuation of the wavetypes is more marked, and the shear wave rapidly
loses energy as it proceeds across a series of interfaces. The problem is
aggravated by higher frequencies, resolution of the fringes being
impossible at frequencies in excess of 10 MHz.
33
i
1-

REFERENCES
Alfrey T, Gurney E F and Lloyd C,' G (1966) J Polym Sei C12, 249
Andrews D R and Wallis L J (1977) Light emitting diode as a short duration
stroboscope-application to visualization of ultrasound. J Phys E 10, 95
Barrer R M (1941) Diffusion in and Through Solids, Cambridge University
Press, Cambridge 1941
Bearman R J and Kirkwood J C (1958) J Chem Phys Vol 78 No 1, 136-145
Crank J S and Park G S (1968) Eds Diffusion in Polymers (Academic Press
London)
De Groot (1951)
Erdogan F and Gupta G D (1972)
Eshelby J D (1966) Brit J Appl Phys 17, 1131-1135
Farrar N R and Ashbee K H G (1978) J Appl Phys 11, 1009-13
Farrar N R, Turner T W and Ashbee K H G (1979) The physical mechanismsresponsible for deterioration in the properties of composite materials.
Proceedings of the Third International Conference on Mechanical Behaviour
of Materials, Cambridge.
Frisch H L, Wang T T and Kwei T K (1969) J Pol Sci 7 A-2, 879
Gutfield R J von and Melcher R L (1977) Appl Phys Lett 30, 257
Hardy G J, Turner T 14 and Ashbee K H G (1978) Detection of defects in
opaque solids using visualized ultrasound. Metal Science 12, 406
Kitson N K, Low S A and Turner T W (1979) "Photoelastic visualisation
experiments and a computer model for non-destructive testing".
Ultrasonics International 79 Conference, Graz, Austria
Kwei T K and Zupko N M (1969) J Pol Sci A-2, 7, 867
Mitchell J If (1899) Proc Lond Math Soc 31, 100
Mitchell and Head (1961)
A

Prigogine I and Nicholis C (1967) J Chem Phys USA Vol 46 No 9 3542
Sargent J P and Ashbee K 11 G (1980) J Adhesion
Sargent J P and Ashbee K H G (1980) Polymer Composites (In press)
Slater E A, Baborovsky V M and Marsh D M (1975) Proceedings of the
Ultrasonics International Conference
Sneddon I N (1945) Proc Roy Soc Lond A187, 65-73
Sneddon I N and Lowengrub M (1969) Crack Problems in the Classical Theory
of Elasticity. Wiley J and Sons NY
Tweed J and Rooke DP (1973) Int J Engng Sci 1i, 65-73
!1
t

4 LL
LLJ Z c I~ _L w o 74o-
LU~ LiF-j
Vf)) U iQO 0
Lcc
4- Ir Z4
L.C)
-Now

ua
Fig1ure 2 General view of ambient temperature aprts

P*4
( 'N~ 4f
Vall

V.--.
'4
4 J
'9,
I'-d'a4
Figure /4* Mark TI hot water apparatil~.
I

Nyo
)
CZto
(N'-( (
CI
0
~C)
'44
I tvI
~1 C
lto
V C

- - - - - - a
14
0'
0
0
-&
u
0
0C
(D C:
0
(.0 0-00
LO4
000 -
N N
0 NL
0 ('0
-00N ~ 0
oww DO] iS
-door

CDC
U
- GT)0)C
0
'4 CO-C
CD
0 C0
CDC
(UJW)[f aDI.SI Cos l

00 -
CDco o
CDp
LL4
0LOCfC)
U.)
LL C)
-- 0
(D)(1) -4--
L-. o C
(I) aospuos;!

0
0 C
I- F)
CD'
0n m1!)
ifl ) 0:u l i o s ji

(/(1
X
0 U -
C-4,
ci,.-
oo C- cz
C)C
UV)CNCJ
100
CD CDU~ljJ4U8)UO3aAIJJE)C

ci,
CY) 0
0)
CD0
CYC)
Ln~CN
CD x )0 D CD
E
CNI

c:
E
Lnc
L.
E
C)T
CY) -
C"4JCD LE)ic
0' Q DC

(Y)
cD'
C
0
0
0
CCD

CD lcD~
a))Cl)
E0
'-4
oJj)
0 CD
ED -4.

Transducer,-Centre
B
,LL
Cradius R te
!S Quartz
rFglure 16. Computer model representation.
II

raycgo t esbihns
eementalsr i m
mpoerntinl
eloment eEYE
IIYES'
us asiiia es ht
thet fo o ue j
A91 0
/
7-/ 'YJ'/IJi'' 'r~
4.3
/ ~"'I
1' / ~z' 'I,
/ / ~ 7t/'.,~~/'-4
/7/)
7%~ ~ §1 / ["/ /,,- . \'~ 'C
~ '~ 0
/ / ~/ J I (7 '~ ' ' 'H
''~/, ,~ 7 - b 4.3(C"7-'A; I C,)
I C)
~1 \i~ /JI / Y/j~, I /v,) I' C)
(/ L ~-
~ .- / F~' 'y~z 'x!,/J7
*--.~-- ~ - ~~*y, ,-- j/. ,,~4,f,, /
- -
-7'
- f
// / C)'-3
> p1 /"-4
I4

EED_ _ _ _ _ _ _ _ i
CL)4
(1)073
-4ciU
CIL L- (A
CZ
0)
-U
-J-
Il- - -E

_0 .90 I-JC-: L. (-+- 0
a) C)
C: ) U) EEE (I)oC 0
4-
4111
00
ox
4
UD Ln C*4'C:
0-W -3jaU W"J '-4 1 OI!~

3x 3cm
(x~y) (150,2.00) cm____
II_
Photgrap Comuterpredctio
___ Photograph- Printout__ Comparison__
Delay 8-8) /
Figure~ ~ ~ ~ 21 optr/iuain

3x3cm
(x,y) (1"50, 2"00) cm
I IL/I,
LSS/#,/] / /
/
/
Photograph Computer prediction
Photograph- Printout Comparison
Delay =13./.,us
Figure 22. Computer simulation.
__ _ _ _ _ _ _ _ _ _ _ _ S ' _ _ /i

18-
16 0Actual 8 0Detay
Ps 00
12o 010- 0
10
8 -
6 0Ie I I I
6 8 10 12 11. 16 18ps -Theoretical Delay--
Figure 23. Experimental vs. theoretical dclays.
.I

4 x 1.cm
(x~y) (3-92,2-00) cm ___ __
LSSV/
LS,
Phoogrph omute prdicio
Photograph-PrnotCmain
A=70m
Fiur 24-optr iuain
- -

4x4 cm
* (xky) =(3-92,2.00)cm____
L S
Phoogap Comute predic/io
Phtgah-Pitu Cmaio
____~~~ =_ 15_6 mm LSFiue 5 omuersmlain

4x 4cm
(x,y)_z(392,2-00) cm_______
L S-
Photgrah Cmputr peditio
Phoogrph Pritou ComparIison_
A = 24-2-m
Figre26. Coputr imuain

Figure 27. Interference pattern from reflected shear wave (LSS)
from a 1 mm radius hole in steel (multiflash).
Figure 28. Computer simu latiton of Fi gure 27 .