iiccaahhee oouuttccoommeess ccaallccuullaattoorr ... · ... with functioning / disability 7 (world...
TRANSCRIPT
iiCCAAHHEE OOuuttccoommeess
CCaallccuullaattoorr
CChhrroonniicc DDiisseeaasseess UUsseerr MMaannuuaall
Monitoring patient status over time using common chronic disease outcome measures
Prepared by Research Team The International Centre for Allied Health Evidence University of South Australia Adelaide, SA 5000

iCAHE Chronic Disease Outcomes Calculator: User Manual
2
Table of Contents
List of Figures 3
List of Tables 3
Glossary of Terms 3
Chapter 1: Introduction 5
Chapter 2: Fatigue/Shortness of Breath Visual Numeric 12
2.1. Body Mass Index 14
2.2. Steps per Day 16
2.3. Blood Pressure 17
Chapter 3: Ability/Functional Scales/Handicap Scales 20
3.1. Health Assessment Questionnaire 20
3.2. Fear-avoidance Beliefs Questionnaire 24
3.3. Resumption of Activities of Daily Living Scale 27
3.4. West Haven Yale Multidimensional Pain Inventory 33
3.5. London Handicap Scale 40
3.6. Voice Handicap Index 45
3.7. Voice Handicap Index-10 48
Chapter 4: Psychological Response Scales 50
4.1. Chronic Disease Self-efficacy Scales 50
4.2. Self-efficacy for Managing Chronic Disease 6 item scale 53
4.3. Perceived Health Competence Scale 55
4.4. Perceived Stress Scale 57
4.5. Arthritis Self-efficacy Scale 60
4.6. Tampa Scale of Kinesiophobia 62
4.7. Pain Self-efficacy Questionnaire 65
4.8. Centre for Epidemiologic Studies Depression Scale 67
4.9. Modified Somatic Perceptions Questionnaire 71
4.10. Kessler Psychological Distress Scale 73
Chapter 5: Diabetes Scales 76
5.1. Glycated Hemoglobin Test 76
5.2. Problem Areas in Diabetes Questionnaire 77
5.3. Perceived Diabetes and Dietary Competence Scale 80
5.4. Staging Questions for Dietary Fat Reduction 82
Chapter 6: Quality of Life Scales 84
6.1. RAND-36 84
Chapter 7: Troubleshooting: using calculator data to assist in treatment decisions, quality
improvement and casenote review 87

iCAHE Chronic Disease Outcomes Calculator: User Manual
3
List of Figures
Figure 1.1: Definitions of the components associated with functioning / disability 7 (World Health Organization 2001) 7 Figure 71: Example of one patient’s progress throughout an episode of care using the CAHE outcomes calculator 87 Figure 7.2: Example of a second patient’s progress throughout an episode of care using the CAHE outcomes calculator 88
List of Tables Table 1.2: Summary of outcome measures contained in the Outcomes Calculator 7 Table 1.3: Contact details of developers of selected outcome measures 8 Table 2.1: BMI calculation in different measurement units 14 Table 2.2: Weight status interpretation for BMI 15 Table 2.3: Classification of Blood Pressure 18 Table 3.1: Weights of items contained in the London Handicap Scale 40 Table 4.1: Internal consistency and test-retest reliability of CDSES 50 Table 4.2: Interpretation of K-10 scores 73
Glossary of Terms
Concurrent validity Validity is established by comparing and new outcome instrument with a criterion measure, or gold standard, both of which are administered at the same time (Streiner and Norman 1995).
Content validity Content validity is defined as ‘the extent to which the content of the instrument appears logically to examine and comprehensively include the full scope of the characteristics or domains it is intended to measure’ (Bowling 1997).
Construct validity The assessment of construct validity is an ongoing process, involving the comparison of outcome instrument findings to other evidence (Beatie 2001, Bowling 1997). In general, construct validity is established through the development of hypotheses concerning the behaviour of the outcome instrument, in various situations and populations.
Face validity Face validity implies ‘whether on the face of it, the instrument appears to be assessing the desired qualities.’ (Streiner and Norman 1995).
Sensitivity to detect change over time
Sensitivity can be defined as the ‘ability to detect change statistically, whether it is relevant (to the patient or clinician) or not.’ (Fortin et al 1995).
Test-retest reliability Test-retest reliability provides information about the extent to which the same results are gained on repeated use of the outcome instrument over time, when no change is expected (Beatie 2001, Simmons et al 1999).
Validity Validity provides evidence that an outcome instrument measures what it is supposed to measure (Andresen 2000, Bowling 1997).

iCAHE Chronic Disease Outcomes Calculator: User Manual
4
References Beatie P (2001): Measurement of health outcomes in the clinical setting: applications to physiotherapy. Physiotherapy Theory
and Practice 17: 173-185. Bowling A (1997): Research methods in health: investigating health and health services. Buckingham: Open University Press. Fortin P, Stucki G and Katz J (1995): Measuring relevant change: an emerging challenge in rheumatological clinical trials.
Arthritis and Rheumatism 38: 1027-1030. Simmons B, Swiontkowski M, Evans R, Amadio P and Cats-Baril W (1999): Outcomes assessment in the information age:
available instruments, data collection and utilization of data. American Academy of Orthopaedic Surgeons Instructional Course lectures 48: 667-685.
Streiner D and Norman G (1995): Health measurement scales: a practical guide to their development and use (2nd
ed.). Oxford: Oxford University Press.
iCAHE Chronic Disease Outcomes Calculator: User Manual
5
Chapter 1: Introduction
Background The Outcomes Calculator has been under development since 1999, in a series of staged research strategies. Preliminary investigations comprised: Wide-spread data collection from over 2000 clinicians regarding current use of measures of health
outcome in clinical practice (Grimmer et al 1998, Grimmer et al 1999) Investigation of requirements of funding bodies regarding health outcomes derived from treatment by
clinicians (Grimmer et al 2000, Grimmer and Milanese 2002) Literature review to assess evidence of validity, reliability, sensitivity to change and clinical utility of
common measures of health outcome used by clinicians, as well as other measures of health outcome that may be useful for clinicians (Bialocerkowski et al 2002, Bialocerkowski et al 2003, Grimmer and Milanese 2002)
Discussions with Australian health clinicians regarding the barriers and facilitators to regular use of health outcomes in clinical practice (Research Committee APA 1999, Grimmer et al 2000)
Evaluation of the content of common measures of outcome and their usage by researchers and clinicians (Bialocerkowski et al 2000, Bialocerkowski et al 2003, Grimmer et al 2000)
Evaluation of high quality measures of outcome for the cervical spine (Kumar and Nyland 2006) for the Australian Physiotherapy Association Cervical Atlas (2006).
The term ‘outcome’ incorporates the health gain and costs associated with treatment. For the management of many conditions, this involves an episode of care (a number of linked occasions of service). Currently the most common type of outcome information is on cost, or number of contacts with the patient. Our investigations highlighted that most clinicians collect no standard information from patients on health outcome, despite this being the most important information required by health funders. What information is collected is non-standardised, collected at variable time frames throughout the episode of care, and is usually handwritten in patient notes, which makes it inefficient and less than useful for clinical benchmarking. The need for a simple, efficient mechanism for collecting standard information routinely on patient progress was identified from our preliminary investigations. The Outcomes Calculator software was developed to address this need. Aim of the Outcomes Calculator
The Outcomes Calculator aims to facilitate the use of standardised outcome measures in clinical practice to monitor change in patient status over time. Patients complete selected outcome measures prior to, or following treatment (without reference to the clinician) and the data can be entered into the Outcomes Calculator by administrative staff. This avoids the potential bias by the clinician and ensures that the patient’s view of their condition is recognised. The Outcomes Calculator automatically computes the score for each outcome measure and uses available norms for comparison (for example: for joint range of motion). Summarising outcome in this way would assist in communicating patient progress, between clinicians, patients and funders.

iCAHE Chronic Disease Outcomes Calculator: User Manual
6
Outcome measures The outcome measures contained within the CAHE Outcomes Calculator Version 4 have been selected based on their psychometric properties (validity, reliability, sensitivity to detect change over time and clinical utility for patient populations with chronic disease conditions). The outcome measures represent a range of aspects of functioning and/ or disability (Grimmer and Milanese 2002), which are measured at the level of body functions / structure, the individual and society, as defined by the International Classification of Functioning (World Health Organization 2001). Table 1.1 provides a schematic overview of the International Classification of Functioning, whist Figure 1.1 provides definitions regarding the components associated with functioning / disability. The outcome measures contained in this Version 4 of the CAHE Outcomes Calculator are presented in Table 1.2. This table defines the level of measurement for each of the outcome measures (according to the World Health Organization’s (2001) International Classification of Functioning definitions). Permission to use the outcome instruments in the calculator has been obtained from each of the developers. Contact details of the instrument developers are enclosed in this manual. This manual also provides some ideas for use of patient details for determining the quality of treatment, using expected benchmarks, population norms, and clinical reasoning.
Table 1.1: An overview of the International Classification of Functioning: functioning and disability
(World Health Organization 2001)
Functioning and Disability Components Body Functions and structures Activities and Participation Domains Body functions
Body structures Life areas
(tasks, actions) Constructs Change in body functions
(physiological) Change in body structures
(anatomical)
Capacity executing tasks in a standard environment
Performance executing tasks in the current environment
Positive aspects Functional and structural integrity Activities Participation
Functioning Negative aspect Impairment Activity limitation
Participation restriction Disability
iCAHE Chronic Disease Outcomes Calculator: User Manual
7
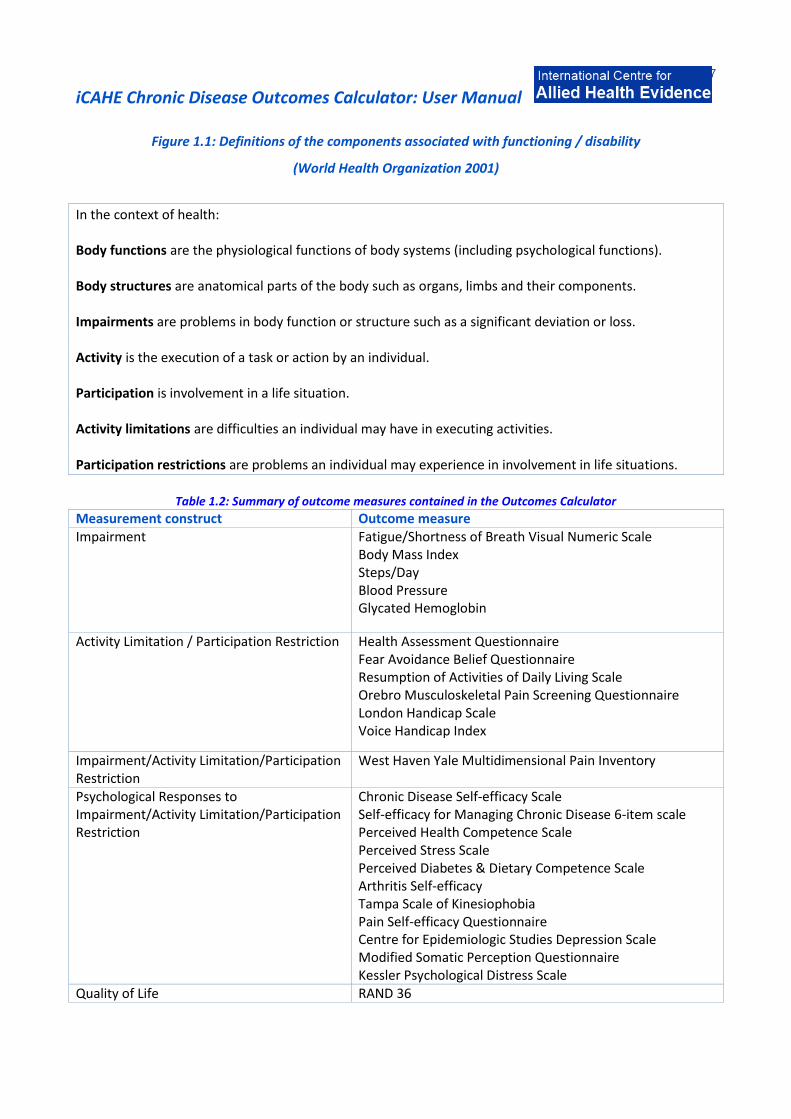
Figure 1.1: Definitions of the components associated with functioning / disability
(World Health Organization 2001)
In the context of health: Body functions are the physiological functions of body systems (including psychological functions). Body structures are anatomical parts of the body such as organs, limbs and their components. Impairments are problems in body function or structure such as a significant deviation or loss. Activity is the execution of a task or action by an individual. Participation is involvement in a life situation. Activity limitations are difficulties an individual may have in executing activities. Participation restrictions are problems an individual may experience in involvement in life situations.
Table 1.2: Summary of outcome measures contained in the Outcomes Calculator
Measurement construct Outcome measure Impairment Fatigue/Shortness of Breath Visual Numeric Scale
Body Mass Index Steps/Day Blood Pressure Glycated Hemoglobin
Activity Limitation / Participation Restriction Health Assessment Questionnaire Fear Avoidance Belief Questionnaire Resumption of Activities of Daily Living Scale Orebro Musculoskeletal Pain Screening Questionnaire London Handicap Scale Voice Handicap Index
Impairment/Activity Limitation/Participation Restriction
West Haven Yale Multidimensional Pain Inventory
Psychological Responses to Impairment/Activity Limitation/Participation Restriction
Chronic Disease Self-efficacy Scale Self-efficacy for Managing Chronic Disease 6-item scale Perceived Health Competence Scale Perceived Stress Scale Perceived Diabetes & Dietary Competence Scale Arthritis Self-efficacy Tampa Scale of Kinesiophobia Pain Self-efficacy Questionnaire Centre for Epidemiologic Studies Depression Scale Modified Somatic Perception Questionnaire Kessler Psychological Distress Scale
Quality of Life RAND 36

iCAHE Chronic Disease Outcomes Calculator: User Manual
8
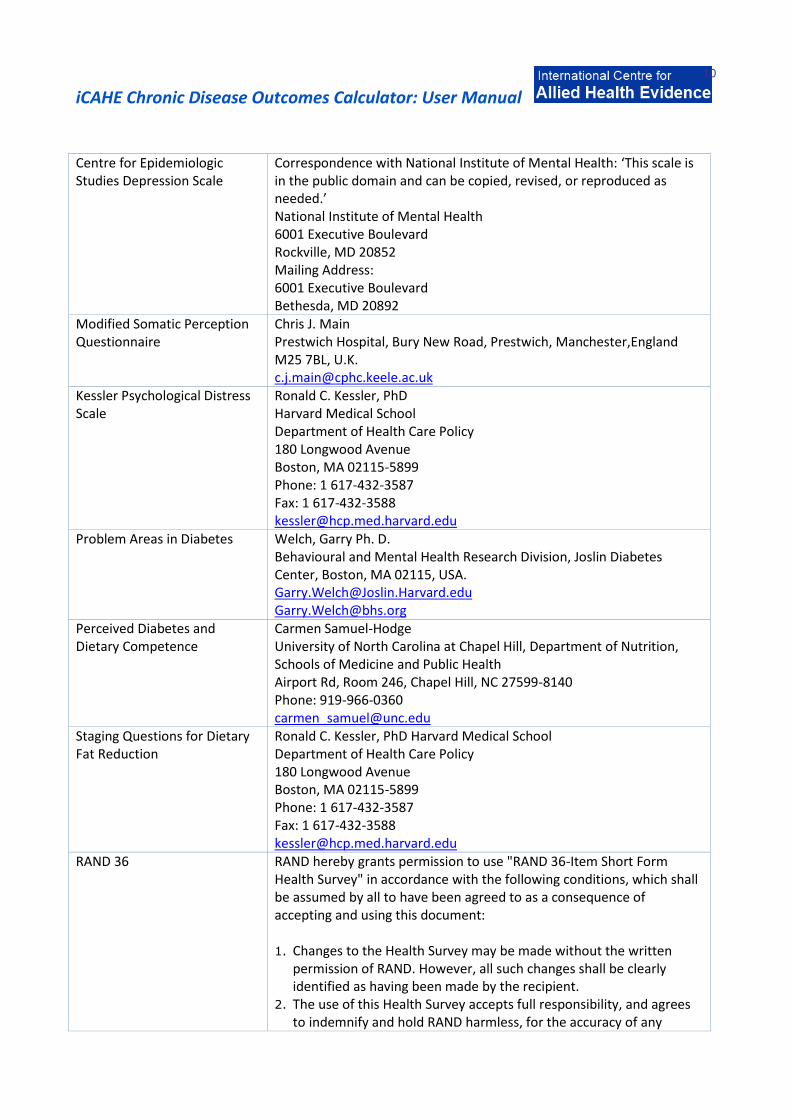
Table 1.3: Contact details of developers of selected outcome measures CAHE has been given permission to use these outcome measures in its Outcomes Calculator by the developers.
Fatigue/Shortness of Breath Visual Numeric Scale
Kate Lorig, R.N., Dr.P.H. Director, Stanford Patient Education Research Center 1000 Welch Road, Suite 204 Palo Alto, CA 94304, USA (650) 723-7935 (650) 725-9422 fax [email protected]
Health Assessment Questionnaire
Leslie Lindzey Administrative Associate Immunology & Rheumatology, Department of Medicine Stanford School of Medicine Phone: 725-4612 [email protected]
Fear Avoidance Belief Questionnaire
Professor Gordon Waddell 6 Heatherbrae Bishopbriggs Glasgow G64 2TA, UK Tel / fax: +44 141 762 2724 [email protected]
Resumption of Activities of Daily Living Scale
Renee Williams, PhD Assistant Professor – School of Rehabilitation Science McMaster University Bldg. T-16, Room 128G 1280 Main St., W. Hamilton Ontario Canada L8S 4K1 [email protected]
Orebro MusculoSkeletal Pain Screening Questionnaire
Steven Linton, PhD Department of Occupational and Environmental Medicine, Orebro University Hospital, Orebro, Sweden [email protected]
West Haven Yale Multidimensional Pain Inventory
Robert D. Kerns, Ph.D. Associate Professor, Departments of Neurology, Psychiatry and Psychology, Yale University 300 George Street New Haven, CT 06511 USA Phone: 203-785-2117 [email protected]
London Handicap Scale Harwood Rowan Department of the Health Care of the Elderly Queen's Medical Centre, Nottingham, UK [email protected]
Voice Handicap Index Barabara Jacobson, PhD Henry Ford Hospital Speech-Language Department 2799 West Grand Boulevard Detroit, Michigan Phone: (313) 9164605

iCAHE Chronic Disease Outcomes Calculator: User Manual
9
Chronic Disease Self-efficacy Scale
Kate Lorig, R.N., Dr.P.H. Director, Stanford Patient Education Research Center 1000 Welch Road, Suite 204 Palo Alto, CA 94304, USA (650) 723-7935 (650) 725-9422 fax [email protected]
Self-efficacy for managing chronic disease 6-item scale
Kate Lorig, R.N., Dr.P.H. Director, Stanford Patient Education Research Center 1000 Welch Road, Suite 204 Palo Alto, CA 94304, USA (650) 723-7935 (650) 725-9422 fax [email protected]
Perceived Health Competence Scale
Wallston, Ken Peabody #90 230 Appleton Place Nashville, TN 37203-5721 Phone: 615-343-3317 Fax: 615-343-2661 [email protected]
Perceived Stress Scale Sheldon Cohen Professor, Psychology Carnegie Mellon University 5000 Forbes Avenue Pittsburgh, PA 15213 [email protected]
Arthritis Self-efficacy Kate Lorig, R.N., Dr.P.H. Director, Stanford Patient Education Research Center 1000 Welch Road, Suite 204 Palo Alto, CA 94304, USA (650) 723-7935 (650) 725-9422 fax [email protected]
Tampa Scale of Kinesiophobia Correspondence with Dr. Steve Wolby (Conducted research on the psychometric properties the English version of the TSK and proposed the TSK-11): ‘TSK was developed by Kori and colleagues in Tampa but didn’t publish much work on this. Permission to use TSK is not required.’ Steve Woby, PhD Research Fellow (joint post) Centre for Rehabilitation Science, University of Manchester Department of Physiotherapy, North Manchester General Hospital [email protected]
Pain Self-efficacy questionnaire
Michael Nicholas A/ Professor, Clinical & Research Psychologist Director of the ADAPT Pain Management Program University of Sydney [email protected]
iCAHE Chronic Disease Outcomes Calculator: User Manual
10
Centre for Epidemiologic Studies Depression Scale
Correspondence with National Institute of Mental Health: ‘This scale is in the public domain and can be copied, revised, or reproduced as needed.’ National Institute of Mental Health 6001 Executive Boulevard Rockville, MD 20852 Mailing Address: 6001 Executive Boulevard Bethesda, MD 20892
Modified Somatic Perception Questionnaire
Chris J. Main Prestwich Hospital, Bury New Road, Prestwich, Manchester,England M25 7BL, U.K. [email protected]
Kessler Psychological Distress Scale
Ronald C. Kessler, PhD Harvard Medical School Department of Health Care Policy 180 Longwood Avenue Boston, MA 02115-5899 Phone: 1 617-432-3587 Fax: 1 617-432-3588 [email protected]
Problem Areas in Diabetes Welch, Garry Ph. D. Behavioural and Mental Health Research Division, Joslin Diabetes Center, Boston, MA 02115, USA. [email protected] [email protected]
Perceived Diabetes and Dietary Competence
Carmen Samuel-Hodge University of North Carolina at Chapel Hill, Department of Nutrition, Schools of Medicine and Public Health Airport Rd, Room 246, Chapel Hill, NC 27599-8140 Phone: 919-966-0360 [email protected]
Staging Questions for Dietary Fat Reduction
Ronald C. Kessler, PhD Harvard Medical School Department of Health Care Policy 180 Longwood Avenue Boston, MA 02115-5899 Phone: 1 617-432-3587 Fax: 1 617-432-3588 [email protected]
RAND 36 RAND hereby grants permission to use "RAND 36-Item Short Form Health Survey" in accordance with the following conditions, which shall be assumed by all to have been agreed to as a consequence of accepting and using this document: 1. Changes to the Health Survey may be made without the written
permission of RAND. However, all such changes shall be clearly identified as having been made by the recipient.
2. The use of this Health Survey accepts full responsibility, and agrees to indemnify and hold RAND harmless, for the accuracy of any

iCAHE Chronic Disease Outcomes Calculator: User Manual
11
translations of the Health Survey into another language and for any errors, omissions, misinterpretations, or consequences thereof.
3. The user of this Health Survey accepts full responsibility, and agrees to indemnify and hold RAND harmless, for any consequences resulting from the use of the Health Survey.
4. The user of the 36-Item Health Survey will provide a credit line when printing and distributing this document acknowledging that it was developed at RAND as part of the Medical Outcomes Study.
No further written permission is needed for use of this Health Survey.
References
Bialocerkowski A, Grimmer K, Bain G (2000): Wrist outcome instruments: a review of content and quality. International Journal of Quality in Health Care; 12: 149-157.
Bialocerkowski A, Grimmer K, Bain G (2003): Validity of the patient-focused wrist outcome instrument: do impairments represent functional ability? Hand Clinics; 19: 449-455.
Burton AK, Tillotson KM (1991): Prediction of the clinical course of low back trouble using multivariate models. Spine; 16: 7-14.
Burton AK, Tillotson M, Main CJ, Hollis S (1995): Psychosocial predictors of outcome in acute and subchronic low back trouble. Spine; 20: 722-728.
Cherkin DC, Deyo RA, Street JH, Barlow W (1996): Predicting poor outcomes for back pain seen in primary care using patients’ own criteria. Spine; 21: 2900-2907.
Croft PR, Papageorgiou AC, Ferry S, Thomas E, Kayson MIV, Silman AJ (1996): Psychological distress and low back pain: evidence from a prospective study in the general population. Spine; 20: 2731-2737.
Frymoyer JW, Cats-Baril W (1987): Predictors of low back pain disability. Clin Orthop; 221: 89-98.
Gatchel RJ, Polatin PB, Mayer TG (1995): The dominant role of psychosocial risk factors in the development of chronic low back pain disability. Spine; 20: 2721-2630.
Grimmer K, Beard M, Bell A, Chipchase L, Edwards E, Fulton I, Gill T (2000): On the constructs of quality physiotherapy. Australian Journal of Physiotherapy; 46:3-7.
Grimmer K, Kerr J, Hughes K, Trott P, Pitt M (1998): An Overview of the Australian Physiotherapy Association Accredited Practice Data Collection 1995-6 Australian Journal of Physiotherapy; 44: 61-63.
Grimmer K, Milanese S (2002): Training Package for Providers of Physical Treatment to Injured Workers: Using Evidence-Based Practice and Treatment Outcomes. Developed for WorkCover NSW (Prevention, Education and Research Grant Scheme).
Grimmer K, Sheppard L, Pitt M, Magarey M, Trott P (1999): Differences in stakeholder expectations in the outcome of physiotherapy management of acute low back pain. International Journal for Quality in Health Care; 11: 155-162.
Grimmer K, Sheppard L, Gill T, Cockington T, Vanduren K, Murphy K, Anderson J, Schilling P (2000): Quality management systems for allied health: a collaborative approach with the Department of Veterans Affairs. ISBN 0 86803 6552, Report prepared for Department of Veterans Affairs.
Research Committee (Vic Branch) APA and invited contributors (1999): Evidence-based practice. Australian Journal of Physiotherapy; 45: 167-171.
Waddell G, Newton M, Henderson I, Somerville D, Main CJ (1993): A fear-avoidance belief’s questionnaire (FABQ) and the role of fear-avoidance beliefs in chronic low back pain and disability. Pain; 52: 157-168.
Waddell G, Somerville D, Henderson I, Newton M (1992): Objective clinical evaluation of physical impairment in chronic low back pain. Spine; 17: 617-628.
World Health Organization (2001): International classification of functioning, disability and health. Geneva: World Health Organization.

iCAHE Chronic Disease Outcomes Calculator: User Manual
12
Chapter 2: Fatigue/Shortness of Breath Visual Numeric
Background The Fatigue and Dyspnea Visual Numeric Scale, a modified version of the Visual Analogue Scale (VAS), is commonly represented as either a 100 mm or a 30 cm line, horizontal or vertical, with only two descriptive phrases at extreme ends: at one end, ‘minimum shortness of breath (SOB)’ or ‘not at all breathless’ at the other, ‘maximum breathlessness’ or worst possible breathlessness.’ Patients choose a point on the line that best represent their current degree of breathlessness. It is a measure to be used serially with the aim of understanding a patient’s perceived shortness of breath.
Scoring The score is the number circled or histogram marked. Scores range from 0 to 10, with the higher score indicating more fatigue. If two consecutive numbers are circled, the higher number is the score (more fatigue) and if two non-consecutive numbers are circled, a score is not given.
0 1 2 3 4 5 6 7 8 9 10
No Severe Fatigue (or SOB) fatigue (or SOB)
Recording The therapist may choose to record change in fatigue/shortness of breath using a graph already printed onto the patient record card that allows them to enter scores in a standard way at each assessment, and evaluate change over time.
Interpretation The fatigue/shortness of breath experienced by patients is assessed on repeated occasions using this scale in order to obtain an understanding of any change in the status of the patient. A decrease in the rating of patients can be interpreted as an improvement in the symptoms of the patient.

iCAHE Chronic Disease Outcomes Calculator: User Manual
13
Validity, reliability and internal consistency Adams et al (1986). confirmed face validity of the 100 mm horizontal VAS with 3 different groups of normal subjects chemically and physically challenged to experience breathlessness. Using a contrasted groups approach (asthmatics and COPD clients representing acute and chronic dyspnea “experiences”), Gift (1989) calculated t-test scores under conditions of severe and mild obstruction as defined by Peak Expiratory Flow Rate. The t values of 12.35 (asthmatics) and 9.73 (COPD) at p<0.01 demonstrated construct validity of the vertical VAS in both populations. In the same study, where the peak expiratory flow rate was used as a criterion against which the vertical VAS was compared, r value obtained was -0.85.
References Adams L, Chronos N, Lane R, Guz A (1986): The measure of breathlessness induced in normal subjects: individual differences. Clinical Science; 70: 131-140. Ritter PL, González VM, Laurent DD, Lorig KR (2006): Measurement of Pain Using the Visual Numeric Scale. Journal of Rheumatology; 33(3): 574-80. Gift AG (1989): Validation of a vertical visual analogue scale as a measure of clinical dyspnea. Rehabilitation Nursing;14:323-325.
iCAHE Chronic Disease Outcomes Calculator: User Manual
14
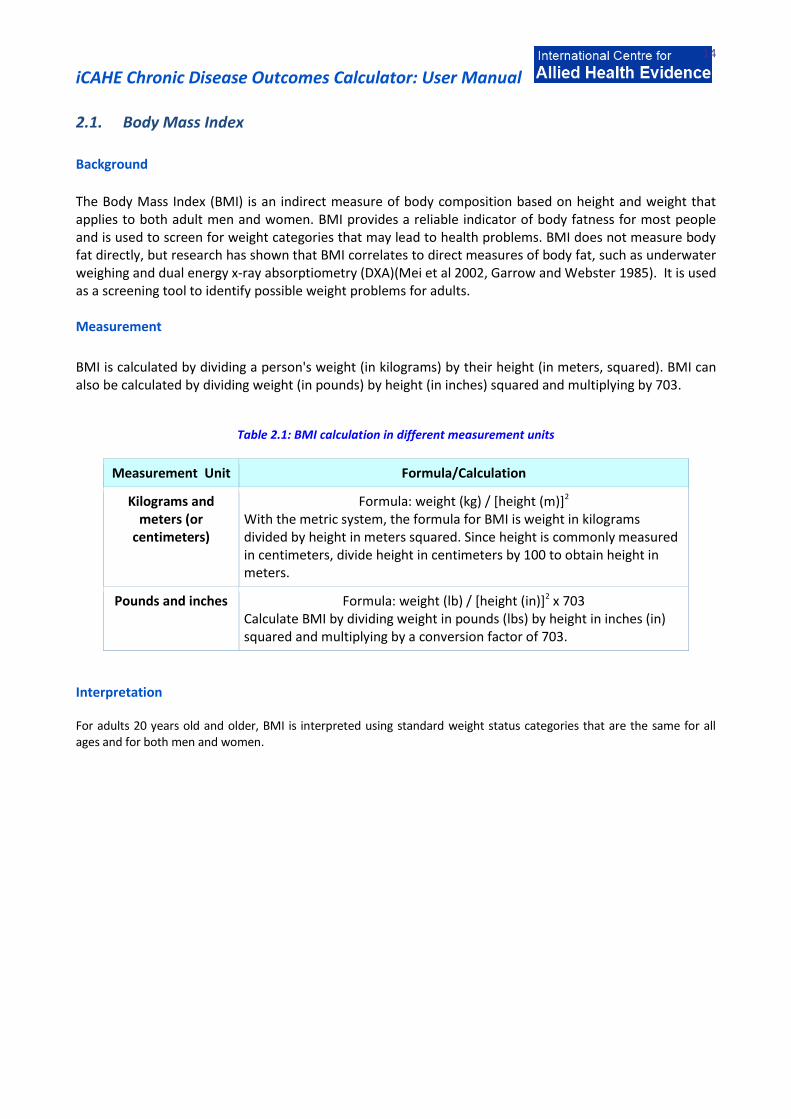
2.1. Body Mass Index
Background
The Body Mass Index (BMI) is an indirect measure of body composition based on height and weight that applies to both adult men and women. BMI provides a reliable indicator of body fatness for most people and is used to screen for weight categories that may lead to health problems. BMI does not measure body fat directly, but research has shown that BMI correlates to direct measures of body fat, such as underwater weighing and dual energy x-ray absorptiometry (DXA)(Mei et al 2002, Garrow and Webster 1985). It is used as a screening tool to identify possible weight problems for adults. Measurement
BMI is calculated by dividing a person's weight (in kilograms) by their height (in meters, squared). BMI can also be calculated by dividing weight (in pounds) by height (in inches) squared and multiplying by 703.
Table 2.1: BMI calculation in different measurement units
Measurement Unit Formula/Calculation
Kilograms and meters (or
centimeters)
Formula: weight (kg) / [height (m)]2 With the metric system, the formula for BMI is weight in kilograms divided by height in meters squared. Since height is commonly measured in centimeters, divide height in centimeters by 100 to obtain height in meters.
Pounds and inches Formula: weight (lb) / [height (in)]2 x 703 Calculate BMI by dividing weight in pounds (lbs) by height in inches (in) squared and multiplying by a conversion factor of 703.
Interpretation For adults 20 years old and older, BMI is interpreted using standard weight status categories that are the same for all ages and for both men and women.

iCAHE Chronic Disease Outcomes Calculator: User Manual
15
Table 2.2: Weight status interpretation for BMI
BMI Weight Status
Below 18.5 Underweight
18.5 – 24.9 Normal
25.0 – 29.9 Overweight
30.0 and Above Obese
Reliability The correlation between the BMI number and body fatness is fairly strong; however the correlation varies by sex, race, and age. These variations include the following examples (Prentice and Jebb 2001, Gallagher et al 1996):
At the same BMI, women tend to have more body fat than men.
At the same BMI, older people, on average, tend to have more body fat than younger adults.
Highly trained athletes may have a high BMI because of increased muscularity rather than increased body fatness.
References Gallagher D, et al (1996): How useful is BMI for comparison of body fatness across age, sex and ethnic groups? American Journal of Epidemiology;143:228–239. Garrow JS, Webster J (1985): Quetelet's index (W/H2) as a measure of fatness. International Journal of Obesity;9:147–153. Mei Z, Grummer-Strawn LM, Pietrobelli A, Goulding A, Goran MI, Dietz WH (2002): Validity of body mass index compared with other body-composition screening indexes for the assessment of body fatness in children and adolescents. American Journal of Clinical Nutrition;7597–985. Prentice AM, Jebb SA (2001); Beyond Body Mass Index. Obesity Reviews; 2(3): 141–7.

iCAHE Chronic Disease Outcomes Calculator: User Manual
16
2.2. Steps per Day
Background
A pedometer is a portable, electronic device used to measure the number of steps a person takes in a day. It is used as a monitoring and motivational tool in the promotion of physical activity. Pedometers are waist-worn step counters that offer a practical means to promote walking by raising awareness and serving as an environmental prompt. Investigations have linked wearing a pedometer to increased activity as well as to other health improvements. A total of 10,000 steps per day (equivalent of 5 miles or 8 km) are recommended by some to be the benchmark for an active lifestyle. Taking 10,000 steps a day may also result in health benefits for healthy adults. Most step counting devices count steps at a walking pace on a flat surface reasonably accurately if the device is placed in its optimal position (usually on a belt clip). If the device is placed in a user’s pocket or handbag, the accuracy is dramatically reduced. Equally, most step counters falsely count steps when a user is driving in their car or other habitual motions that the device encounters throughout the day. The accuracy is also dependent on the step length the user enters.
Validity
Pedometers display good agreement with accelerometers (r=0.80-0.90) (Bassett et al 2000; Kalsheuer 2002; Leenders, Sherman & Nagaraja 2000). The use of inexpensive pedometers should not be recommended because of considerable validity problems, which may damage any investment in good quality pedometers for physical activity health promotion (De Kocher K et al 2006). References Bassett D, Ainsworth BE, Swartz AM, Stratch SJ, O’Brien WL, King GA (2000): Validity of four motion sensors in measuring moderate intensity physical activity. Medicine and Science in Sports and Exercise; 32(Suppl9): S471-480. De Kocher K, Gardon G, De Bourdeaudhuij (2006): Validity of the Inexpensive Stepping Meter in counting steps in free living conditions: a pilot study. British Journal of Sports Medicine;1-3. Kalsheuer LK (2002): Determining the validity of pedometers. Mesa, AZ: Arizona State University. Leenders NYJM, Sherman WM, Nagaraja HN (2000): Comparisons of four methods of estimating physical activity in adult women. Medicine and Science in Sports and Exercise; 32(7): 1320-1326. Tudor-Locke CE (2002): Taking steps toward increased physical activity: Using pedometers to measure and motivate. Research Digest; 3, 1-8.
For long term health and reduced chronic disease risk:
10,000 steps a day
For successful, sustained weight loss: 12,000 – 15,000 steps a day
To build aerobic fitness: Make 3,000 or more of your daily steps fast

iCAHE Chronic Disease Outcomes Calculator: User Manual
17
2.3. Blood Pressure
Background
Blood pressure is a measure of the pressure exerted by the blood in the arteries during the two phases of cardiac cycle: systole and diastole. It is usually measured by an instrument called a sphygmomanometer. Blood pressure is recorded as two numbers, such as 120/80. The larger number indicates the pressure in the arteries as the heart contracts (systolic blood pressure) and the lower number indicates the pressure as the heart relaxes (diastolic blood pressure). The blood pressure is measured in terms of millimetres of mercury (mmHg). Monitoring Auscultatory techniques with aneroid or mercury manometers and automatic oscillometric devices are most commonly used. Measurement under standardized conditions should be taken at least twice and an average of the two recorded at every health-care encounter. Guidelines for monitoring blood pressure: Patients should be seated quietly for at least 5 minutes in a chair (rather than on an exam table) with
their backs supported and their arms bared and supported at heart level. Patients should refrain from smoking or ingesting caffeine during the 30 minutes preceding the measurement. Each patient should be provided, verbally and in writing, with their specific blood pressure numbers and blood pressure goals.
Correct measurement of blood pressure requires the use of a cuff that is appropriate to the size of the upper right arm. The right arm is preferred for consistency and comparison with the standard tables. A technique to establish an appropriate cuff size is to choose a cuff having a bladder width that is approximately 40% of the arm circumference midway between the olecranon and the acromion. Issues of cuff size are especially important in children and obese adults. With the increasing prevalence of obesity, many adults will require a large adult cuff. Those with large, conical arms >41 cm in circumference may require the blood pressure to be measured on their forearm.
Too small an inflatable bladder can lead to false readings of elevated blood pressure in the range of 3.2/2.4 mm Hg to 12/8 mm Hg with as much as 30 mm Hg in the obese. An excessively large bladder may lead to falsely low readings in the range of 10 to 30 mm Hg. The bladder within the cuff should encircle at least 80% of the arm.
The bell of the stethoscope should be lightly placed over the brachial artery pulse, proximal and medial to the cubital fossa, and below the bottom edge of the cuff (ie, about 2 cm above the cubital fossa).
The cuff should be inflated to 30 mm Hg above palpated Systolic Blood Pressure (SBP) and deflated at a rate of 2 to 3 mm Hg/second. Both SBP and Diastolic Blood Pressure (DBP) should be recorded. The first appearance of sound (phase 1) is used to define SBP. The disappearance of sound (phase 5) is used to define DBP in adults. It has been suggested that a detailed account of blood pressure on the initial visit includes position of individual; arm selected; blood pressure monitor used; blood pressure measured on both arms; arm circumference and cuff used; if auscultatory—Korotkoff sounds IV and V, presence of auscultatory gap; emotional state of individual; and time of drug ingestions (O’Brien et al 2003).
Two or more readings separated by 2 minutes should be averaged. If the first two readings differ by more than 5 mm Hg, additional readings should be obtained and averaged.

iCAHE Chronic Disease Outcomes Calculator: User Manual
18
Elevated blood pressure must be confirmed on repeated visits before characterizing an individual as having hypertension. Blood pressure at the high levels tends to fall on subsequent measurement as the result of (1) an accommodation effect (ie, reduction of anxiety by the patient from one visit to the next) and (2) regression to the mean, a nonbiological phenomenon that derives, in part, from mathematical considerations. Blood pressure level is not static but varies even under standard resting conditions. Therefore, a more precise characterization of an individual’s blood pressure level is an average of multiple blood pressure measurements taken repeatedly over several weeks to months.
Especially among older persons and children, SBP is a better predictor of end-organ damage and events (coronary heart disease, CVD, heart failure, stroke, kidney failure, and all-cause mortality) than is DBP. Recently, it has become clear that an elevated pulse pressure (SBP minus DBP), which indicates reduced vascular compliance in large arteries, may be an even better marker of increased cardiovascular risk than either SBP or DBP alone (Konings et al 2002).
Under special circumstances, measuring blood pressure in the supine, sitting, and standing positions (standing quietly for 2 to 5 minutes) may be indicated and helpful in detecting evidence of autonomic dysfunction. A decrease in standing SBP >10 mm Hg when associated with dizziness or fainting is more frequent in older patients with systolic hypertension, diabetes, and those taking diuretics, venodilators (eg, nitrates, alpha-blockers, and sildenafil-like drugs), and some psychotropic drugs. This same recommendation is made for patients taking drugs that exaggerate postural changes in blood pressure (peripheral adrenergic blockers, alpha-blockers, and high-dose diuretics).
Blood pressure must be measured in older persons with special care as some older persons have pseudohypertension (falsely high sphygmomanometer readings) due to excessive vascular stiffness as determined for example by using pulse wave pressure.
Interpretation There are a wide variety of published reference values for both systolic and diastolic pressures. Age and sex are the main determinants of these normative ranges; however, several factors may influence any single measurement.
Table 2.3: Classification of Blood Pressure

iCAHE Chronic Disease Outcomes Calculator: User Manual
19
Validity and reliability Strong evidence suggests that casual blood pressure measurement using the mercury manometer is the "gold standard" for clinical studies, but has important limitations in clinical practice Bailey et al (1991) found 35% of aneroid manometers to be inadequately calibrated. Burke et al (1982) found 30% of aneroid devices with a magnitude of error >4 mm Hg compared with 2% of mercury devices. Mion et al (1998) found 58% aneroid and 21% of mercury manometers to be poorly calibrated. Results of the study by Ali and Rouse (2002) suggest that 17% of mercury and aneroid sphygmomanometers are inaccurate. Four percent showed an error greater than 10 mm Hg. References
Ali S, Rouse A (2002): Practice audits: reliability of sphygmomanometers and blood pressure recording bias. Journal of Human Hypertension;16(5): 359-361. Bailey RH, Knaus VL, Bauer JH (1991): Aneroid sphygmomanometers. Arch Intern Med; 15: 1409-1412. Burke MJ et al (1982): Sphygmomanometers in hospital and family practice: problems and recommendations. Br Med J; 285: 469-471. K/DOQI (2001): Clinical Practice Guidelines on Hypertension and Antihypertensive Agents in Chronic Kidney Disease. Konings CJ, Dammers R, Rensma PL, Kooman JP, Hoeks AP, Kornet L, Gladziwa U, van der Sande FM, Leunissen KM (2002): Arterial wall properties in patients with renal failure. Am J Kidney Dis; 39:1206-1212. Mion D Jr, Pierin AMG (1998): How accurate are sphygmomanometers? J Hum Hypertens; 12: 245-248. O’Brien E, Asmar R, Beilin L, Imai Y, Mallion JM, Mancia G et al (2003): European Society of Hypertension recommendations for conventional, ambulatory and home blood pressure measurement. J Hypertens; 21:821-848.

iCAHE Chronic Disease Outcomes Calculator: User Manual
20
Chapter 3: Ability/Functional Scales/Handicap Scales
3.1. Health Assessment Questionnaire
Background The Health Assessment Questionnaire (HAQ) was designed to measure health outcomes based on the five patient-centred dimensions (death, disability, discomfort, drug toxicity, and dollar costs). The HAQ has been administered and validated in patients with a wide variety of rheumatic diseases, including rheumatoid arthritis, osteoarthritis, juvenile rheumatoid arthritis, lupus, scleroderma, ankylosing spondylitis, fibromyalgia, and psoriatic arthritis. It has been applied to patients with HIV/AIDS, in studies of normal aging, and has also been employed in population-based studies, including the follow-up to the National Health and Nutrition Examination Survey (NHANES). Measurement and scoring Patient must have a score for at least six of the eight categories to allow computation of the disability index; otherwise, it cannot be computed. At least one question in each subscale needs to be completed for the subscale to count in the total score. Guidelines for Scoring:
1. Obtain the sum of the eight category scores: A category score is determined from the highest score of the subcategories or components, except when aids or devices are taken into account. When aids or devices or help are indicated by the patient, the score for the category item is raised from a 0 to a 1 to a 2 (i.e. 0 to a 1, or 1 to a 2, or 2 to a 3)but if the patient’s highest score for that subcategory is 3, it stays a 3. The highest individual question score in each subscale is taken (i.e. disregard all questions with lower scores).
2. Divide the sum by the number of categories answered (range 6-8) This would yield a single disability index score from 0-3. Recording A separate recording sheet is provided to facilitate repeated measures over time. Comparison The HAQ should be completed on repeated occasions of testing, and the scores for both scales should be compared between testing in order to obtain an understanding of any change in the status of the patient.

iCAHE Chronic Disease Outcomes Calculator: User Manual
21
Interpretation No cut-off scores are provided, although higher scores indicate higher level of disability. The functional ability of a patient is assessed on repeated occasions using this scale in order to obtain an understanding of any change in the status of the patient. A decrease in the rating of a patient can be interpreted as an improvement in the functional ability of the patient. Validity, reliability and internal consistency Evaluations of the psychometric properties of HAQ have provided consistent and substantial demonstrations of both its reliability and validity across many applications and in different patient populations. Test-retest correlations demonstrating reproducibility have ranged from 0.87 to 0.99, and correlations between interview and questionnaire formats have ranged from 0.85 to 0.95. There is consensus that HAQ Disability Index possesses face and content validity, and correlations between questionnaire or interview scores and task performance have ranged from 0.71 to 0.95 demonstrating criterion validity. The construct/convergent validity, predictive validity, and sensitivity to change have also been established in numerous observational studies and clinical trials. (Ramey et al 1995) More recently, the HAQ Disability Index was compared with the Western Ontario McMasters Universities Osteoarthritis Index and was found to be similarly and significantly correlated (HAQ: R = 0.67, p < 0.0001). References Bruce B, Fries J (2003): The Stanford health assessment questionnaire (HAQ): a review of its history, issues, progress, and documentation. J Rheumatol; 30(1): 167-178. Bruce B, Fries J (2004): Longitudinal Comparison of the Health Assessment Questionnaire and the Western Ontario and McMaster Universities Osteoarthritis Index. Arthritis Rheum; 51: 730-7. Bruce B, Fries J (2005): The Health Assessment Questionnaire (HAQ). Clin Exp Rheumatol; 23 (Suppl. 39): S14-18. Fries JF, Spitz P, et al (1980): Measurement of patient outcome in arthritis. Arthritis Rheum; 23 (2): 137-45 Ramey D, Fries J, et al (1995): The Health Assessment Questionnaire 1995 - status and review. quality of life and pharmacoeconomics in clinical trials. S. B. Philadelphia: Lippincott-Raven
Publishers; 227-237.

iCAHE Chronic Disease Outcomes Calculator: User Manual
22
Health Assessment Questionnaire: Disability Index
Please indicate using the scale below how your arthritis affected your ability to carry out your daily activities in the past week.
With no
difficulty
With
some
difficulty
With
much
difficulty
Unable
to do
0 1 2 3
Dressing and grooming
Are you able to dress yourself, including shoelaces and
buttons?
Are you able to shampoo your hair?
Arising
Are you able to stand up from a straight chair?
Are you able to get in and out of bed?
Eating
Are you able to cut your meat?
Are you able to lift a full cup or glass to your mouth?
Are you able to open a new milk carton?
Walking
Are you able to walk outdoors on flat ground?
Are you able to walk up five steps?
Hygiene
Are you able to wash and dry your body?
Are you able to take a tub bath?
Are you able to get on and off the toilet?
Reach
Are you able to reach and get down a 2 kg object from
above your head?
Are you able to bend down and pick up clothing from the
floor?
Grip
Are you able to open car doors?
Are you able to open previously opened jars?
Are you able to turn taps off and on?
Activities
Are you able to run errands and shop?
Are you able to get in and out of a car?
Are you able to do chores such as vacuuming or yard work?

iCAHE Chronic Disease Outcomes Calculator: User Manual
23
Please indicate any of the following that you use to do any of the above activities?
Dressing and grooming Devices to assist with dressing
Eating Built up or special utensils
Arising Built up or special chair
Walking Crutches/ Cane / Walker
Hygiene Raised toilet seat / Bathtub bar / Bathtub seat/ Long handled
appliances in bathroom
Reaching Long handled appliances for reach
Grip Jar opener for previously opened jars
Please indicate any categories in which you require assistance from another person?
Dressing or grooming
Arising
Eating
Walking
Hygiene
Reach
Gripping and opening things
Errands and chores
iCAHE Chronic Disease Outcomes Calculator: User Manual
24
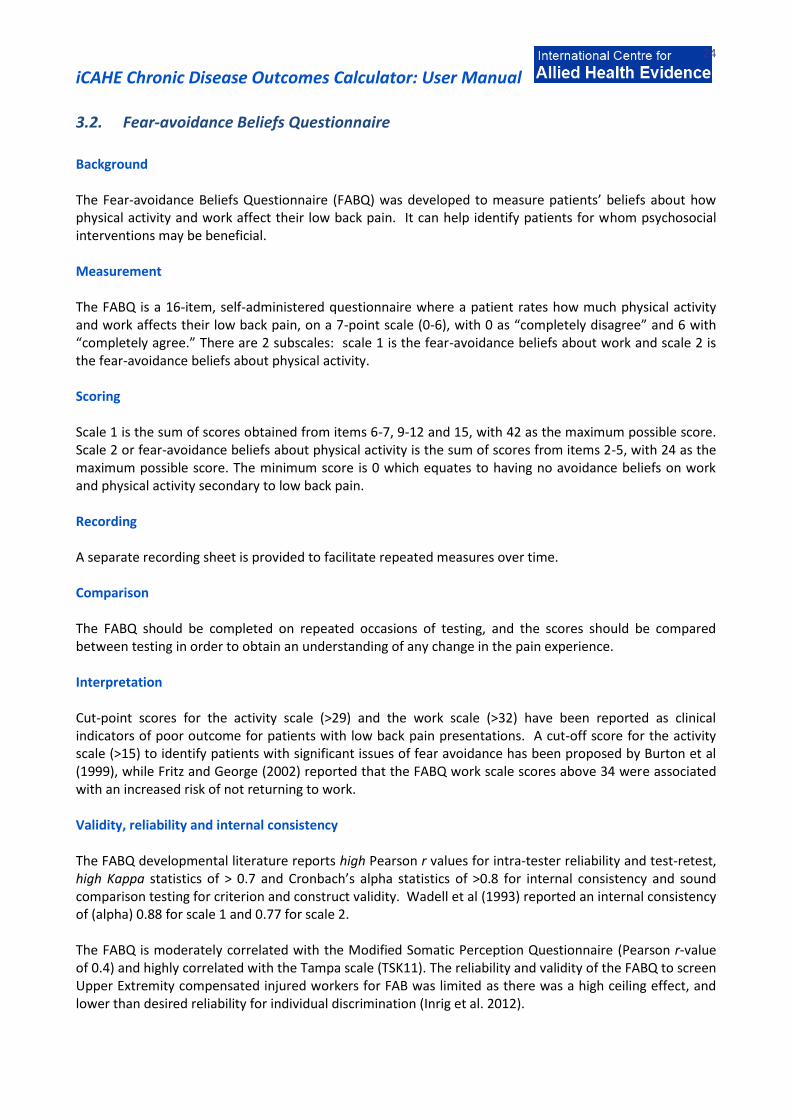
3.2. Fear-avoidance Beliefs Questionnaire
Background The Fear-avoidance Beliefs Questionnaire (FABQ) was developed to measure patients’ beliefs about how physical activity and work affect their low back pain. It can help identify patients for whom psychosocial interventions may be beneficial. Measurement The FABQ is a 16-item, self-administered questionnaire where a patient rates how much physical activity and work affects their low back pain, on a 7-point scale (0-6), with 0 as “completely disagree” and 6 with “completely agree.” There are 2 subscales: scale 1 is the fear-avoidance beliefs about work and scale 2 is the fear-avoidance beliefs about physical activity. Scoring Scale 1 is the sum of scores obtained from items 6-7, 9-12 and 15, with 42 as the maximum possible score. Scale 2 or fear-avoidance beliefs about physical activity is the sum of scores from items 2-5, with 24 as the maximum possible score. The minimum score is 0 which equates to having no avoidance beliefs on work and physical activity secondary to low back pain. Recording A separate recording sheet is provided to facilitate repeated measures over time. Comparison The FABQ should be completed on repeated occasions of testing, and the scores should be compared between testing in order to obtain an understanding of any change in the pain experience. Interpretation Cut-point scores for the activity scale (>29) and the work scale (>32) have been reported as clinical indicators of poor outcome for patients with low back pain presentations. A cut-off score for the activity scale (>15) to identify patients with significant issues of fear avoidance has been proposed by Burton et al (1999), while Fritz and George (2002) reported that the FABQ work scale scores above 34 were associated with an increased risk of not returning to work. Validity, reliability and internal consistency The FABQ developmental literature reports high Pearson r values for intra-tester reliability and test-retest, high Kappa statistics of > 0.7 and Cronbach’s alpha statistics of >0.8 for internal consistency and sound comparison testing for criterion and construct validity. Wadell et al (1993) reported an internal consistency of (alpha) 0.88 for scale 1 and 0.77 for scale 2. The FABQ is moderately correlated with the Modified Somatic Perception Questionnaire (Pearson r-value of 0.4) and highly correlated with the Tampa scale (TSK11). The reliability and validity of the FABQ to screen Upper Extremity compensated injured workers for FAB was limited as there was a high ceiling effect, and lower than desired reliability for individual discrimination (Inrig et al. 2012).

iCAHE Chronic Disease Outcomes Calculator: User Manual
25
References Burton AK, Waddell G, Tillotson KM, Summerton N (1999): Information and advice to patients with back pain can have a positive effect: a randomized controlled trial of a novel educational booklet in primary care. Spine; 24:2484–2491. Crombez G, Vlaeyen JW, Heuts PH, et al (1999): Pain-related fear is more disabling than fear itself: evidence on the role of pain-related fear in chronic back pain disability. Pain; 80: 329-39. Fritz JM, George SZ, Delitto A (2001): The role of fear avoidance beliefs in acute low back pain: relationships with current and future disability and work status. Pain; 94: 7-15. George SZ, Bialosky JE, Fritz JM (2004): Physical Therapist Management of a Patient with Acute Low Back Pain and Elevated Fear-Avoidance Beliefs. Phys Th; 84 (6): 538-549. Hadijistavropoulos HD, Craig KD (1994): Acute and chronic low back pain: cognitive, affective, and behavioral dimensions. J Cons Clin Psych; 62: 341-9. Inrig T, Amy B, Borthwick C (2012): Validity and Reliability of the Fear-Avoidance Beliefs Questionnaire (FABQ) in Workers with Upper Extremity Injuries. Journal of Occupational Rehabilitation 22:59–70. Jacob T, Baras M, Zeev A, et al (2001): Low back pain: reliability of a set of pain measurement tools. Arch Phys Med Rehabil; 82: 735-42. Waddell G, Newton M, Henderson I, Somerville D, et al (1993): A Fear-Avoidance Beliefs Questionnaire (FABQ) and the role of fear-avoidance beliefs in chronic low back pain and disability. Pain; 52(2):157-16.

iCAHE Chronic Disease Outcomes Calculator: User Manual
26
Fear-Avoidance Beliefs Questionnaire
Here are some of the things which other patients have told us about their pain. For each statement please circle any number from 0 to 6 to say how much physical activities such as bending, lifting, walking or driving affect or would affect your back pain.
Completely Unsure Completely
disagree agree 1. My pain was caused by physical activity. 0 1 2 3 4 5 6 2. Physical activity makes my pain worse. 0 1 2 3 4 5 6 3. Physical activity might harm my back. 0 1 2 3 4 5 6 4. I should not do physical activities which (might) make my pain worse. 0 1 2 3 4 5 6 5. I cannot do physical activities which
(might) make my pain worse. 0 1 2 3 4 5 6 The following statements are about how your normal work affects or would affect your back pain.
Completely Unsure Completely
disagree agree 6. My pain was caused by my work or by an accident at work. 0 1 2 3 4 5 6 7. My work aggravated my pain. 0 1 2 3 4 5 6 8. I have a claim for compensation for my pain. 0 1 2 3 4 5 6 9. My work is too heavy for me. 0 1 2 3 4 5 6 10. My work makes or would make my pain worse. 0 1 2 3 4 5 6 11. My work might harm my back. 0 1 2 3 4 5 6 12. I should not do my normal work with my
present pain. 0 1 2 3 4 5 6 13. I cannot do my normal work with my
present pain. 0 1 2 3 4 5 6 14. I cannot do my normal work till my pain is
treated. 0 1 2 3 4 5 6 15. I do not think that I will be back to my normal
work within 3 months. 0 1 2 3 4 5 6 16. I do not think that I will ever be able to go
back to that work. 0 1 2 3 4 5 6

iCAHE Chronic Disease Outcomes Calculator: User Manual
27
3.3. Resumption of Activities of Daily Living Scale
Background The Resumption of Activities of Daily Living (RADL) Scale assesses the extent of recovery from the time of injury to the initiation of treatment, and concurrently with the course of treatment, using the individual's customary level of functioning as a benchmark (Williams 1998). Measurement and scoring The scale consists of 12 items, with scores ranging from 0-100 (0%=not at all, 100%=complete resumption). The total RADL score can be calculated by summing the responses and dividing by the number of items answered. At least 9 out of the 12 items should be answered in order to calculate a total score. Recording A separate recording sheet is provided to facilitate repeated measures over time. Comparison The RADL should be completed on repeated occasions of testing, and the scores should be compared between testing in order to obtain an understanding of any change in the recovery pattern. Interpretation No cut-off scores are provided, although higher scores indicate higher likelihood for resuming activities of daily living. To determine change in status over time, the clinician may compare the subsequent assessment score with the initial or previous score (initial total score – subsequent total score). A minimal change of 16 points (from the maximum of 100 points) represents a clinically important difference. Validity, reliability and internal consistency The RADL developmental literature has strong evidence of psychometric properties, with high internal consistency and test-retest reliability as assessed by high ICC values (0.8) and moderate Pearson r- values (0.4). It also appears to be responsive to change over a 3-week period in a rehabilitation clinic. References Kopec JA (2000): Measuring Functional Outcomes in Persons with Back Pain: A Review of Back-Specific Questionnaires. Spine; 25(24):3110-3114. Williams RM, Myers AM (1998): A new approach to measuring recovery in injured workers with acute low back pain: Resumption of Activities of Daily Living Scale. Physical Therapy; 78(6):613-23.

iCAHE Chronic Disease Outcomes Calculator: User Manual
28
Resumption of Activities of Daily Living Scale Since your injury, to what extent have you resumed your usual activities in each of the following areas? If you do not do an activity, put N/A (non-applicable) beside the scale. As you rate each activity, think of how you are today. Circle the number on the scale for each question. 1. Sleeping patterns
0% 10% 20% 30% 40% 50% 60% 70% 80% 90% 100% Not at all Moderate resumption Complete resumption
2. Sexual activity
0% 10% 20% 30% 40% 50% 60% 70% 80% 90% 100% Not at all Moderate resumption Complete resumption
3. Self-care (e.g. washing, dressing)
0% 10% 20% 30% 40% 50% 60% 70% 80% 90% 100% Not at all Moderate resumption Complete resumption
4. Light household chores (e.g. doing dishes, making beds, preparing meals)
0% 10% 20% 30% 40% 50% 60% 70% 80% 90% 100% Not at all Moderate resumption Complete resumption
5. Heavy household chores (e.g. yardwork, cleaning windows, doing laundry)
0% 10% 20% 30% 40% 50% 60% 70% 80% 90% 100% Not at all Moderate resumption Complete resumption
6. Shopping
0% 10% 20% 30% 40% 50% 60% 70% 80% 90% 100% Not at all Moderate resumption Complete resumption
7. Socialising with friends and family inside your home
0% 10% 20% 30% 40% 50% 60% 70% 80% 90% 100% Not at all Moderate resumption Complete resumption
8. Socialising with friends and family outside your home
0% 10% 20% 30% 40% 50% 60% 70% 80% 90% 100% Not at all Moderate resumption Complete resumption
9. Travelling (in cars, buses, etc) for less than 30 minutes
0% 10% 20% 30% 40% 50% 60% 70% 80% 90% 100% Not at all Moderate resumption Complete resumption
10. Travelling (in cars, buses, etc) for longer than 1 hour
0% 10% 20% 30% 40% 50% 60% 70% 80% 90% 100% Not at all Moderate resumption Complete resumption
11. Engaging in your usual recreational activities
0% 10% 20% 30% 40% 50% 60% 70% 80% 90% 100% Not at all Moderate resumption Complete resumption
12. Engaging in your usual paid employment
0% 10% 20% 30% 40% 50% 60% 70% 80% 90% 100% Not at all Moderate resumption Complete resumption
iCAHE Chronic Disease Outcomes Calculator: User Manual
29
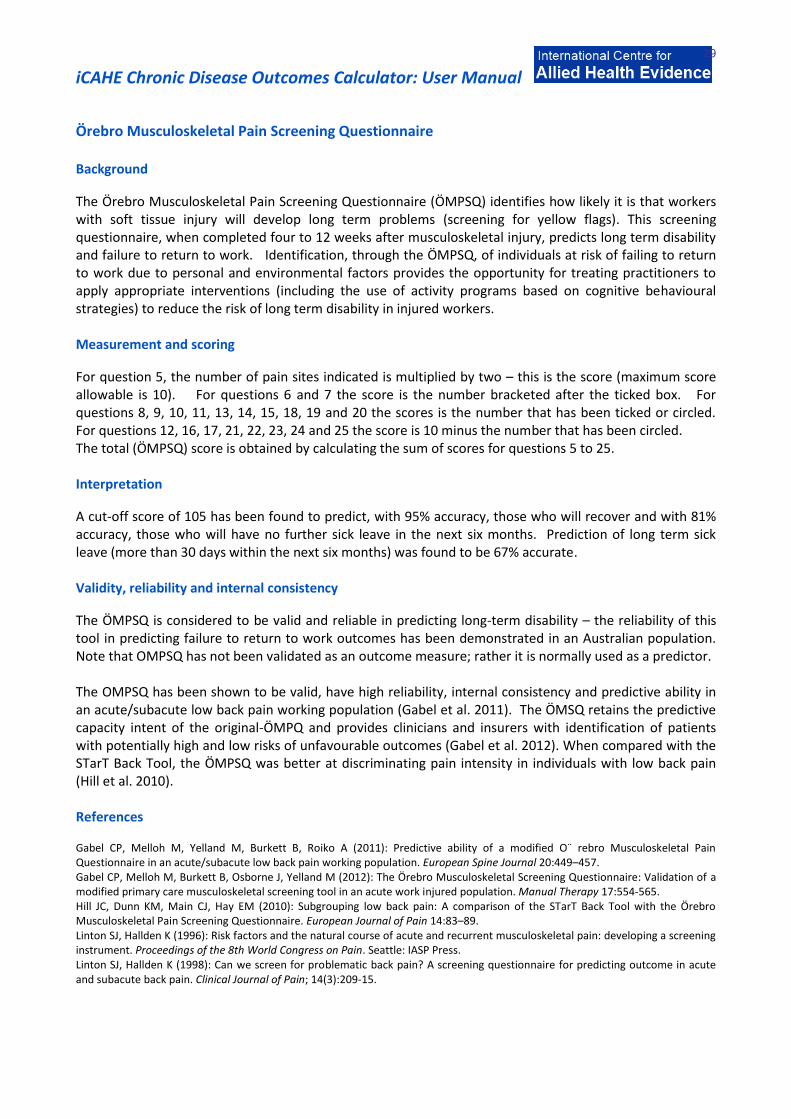
Örebro Musculoskeletal Pain Screening Questionnaire Background
The Örebro Musculoskeletal Pain Screening Questionnaire (ÖMPSQ) identifies how likely it is that workers with soft tissue injury will develop long term problems (screening for yellow flags). This screening questionnaire, when completed four to 12 weeks after musculoskeletal injury, predicts long term disability and failure to return to work. Identification, through the ÖMPSQ, of individuals at risk of failing to return to work due to personal and environmental factors provides the opportunity for treating practitioners to apply appropriate interventions (including the use of activity programs based on cognitive behavioural strategies) to reduce the risk of long term disability in injured workers. Measurement and scoring
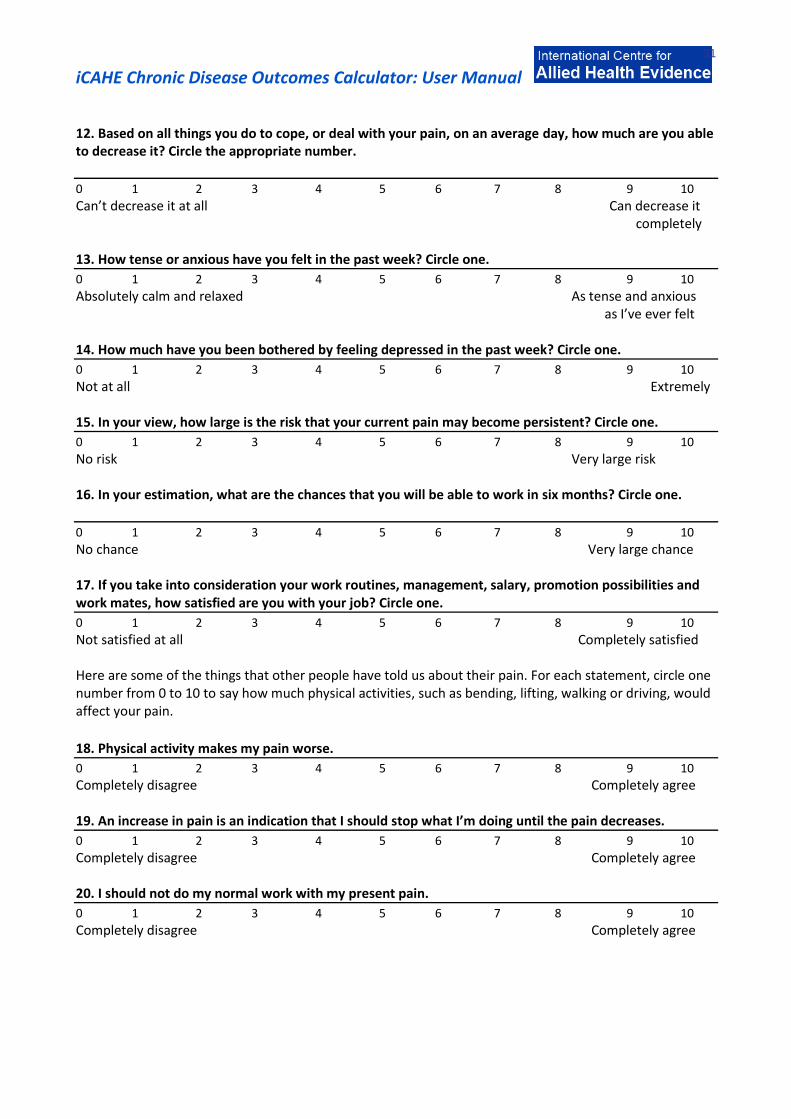
For question 5, the number of pain sites indicated is multiplied by two – this is the score (maximum score allowable is 10). For questions 6 and 7 the score is the number bracketed after the ticked box. For questions 8, 9, 10, 11, 13, 14, 15, 18, 19 and 20 the scores is the number that has been ticked or circled. For questions 12, 16, 17, 21, 22, 23, 24 and 25 the score is 10 minus the number that has been circled. The total (ÖMPSQ) score is obtained by calculating the sum of scores for questions 5 to 25. Interpretation
A cut-off score of 105 has been found to predict, with 95% accuracy, those who will recover and with 81% accuracy, those who will have no further sick leave in the next six months. Prediction of long term sick leave (more than 30 days within the next six months) was found to be 67% accurate. Validity, reliability and internal consistency
The ÖMPSQ is considered to be valid and reliable in predicting long-term disability – the reliability of this tool in predicting failure to return to work outcomes has been demonstrated in an Australian population. Note that OMPSQ has not been validated as an outcome measure; rather it is normally used as a predictor. The OMPSQ has been shown to be valid, have high reliability, internal consistency and predictive ability in an acute/subacute low back pain working population (Gabel et al. 2011). The ÖMSQ retains the predictive capacity intent of the original-ÖMPQ and provides clinicians and insurers with identification of patients with potentially high and low risks of unfavourable outcomes (Gabel et al. 2012). When compared with the STarT Back Tool, the ÖMPSQ was better at discriminating pain intensity in individuals with low back pain (Hill et al. 2010). References Gabel CP, Melloh M, Yelland M, Burkett B, Roiko A (2011): Predictive ability of a modified O¨ rebro Musculoskeletal Pain Questionnaire in an acute/subacute low back pain working population. European Spine Journal 20:449–457. Gabel CP, Melloh M, Burkett B, Osborne J, Yelland M (2012): The Örebro Musculoskeletal Screening Questionnaire: Validation of a modified primary care musculoskeletal screening tool in an acute work injured population. Manual Therapy 17:554-565. Hill JC, Dunn KM, Main CJ, Hay EM (2010): Subgrouping low back pain: A comparison of the STarT Back Tool with the Örebro Musculoskeletal Pain Screening Questionnaire. European Journal of Pain 14:83–89. Linton SJ, Hallden K (1996): Risk factors and the natural course of acute and recurrent musculoskeletal pain: developing a screening instrument. Proceedings of the 8th World Congress on Pain. Seattle: IASP Press. Linton SJ, Hallden K (1998): Can we screen for problematic back pain? A screening questionnaire for predicting outcome in acute and subacute back pain. Clinical Journal of Pain; 14(3):209-15.

iCAHE Chronic Disease Outcomes Calculator: User Manual
30
Örebro Musculoskeletal Pain Screening Questionnaire 1. Name Phone Date
2. Date of Injury Date of birth
3. Male Female 4. Were you born in Australia? Yes No
These questions and statements apply if you have aches or pains, such as back, shoulder or neck pain. Please read and answer questions carefully. Do not take too long to answer the questions, however it is important that you answer every question. There is always a response for your particular situation.
5. Where do you have pain? Place a tick () for all appropriate sites.
Neck Shoulder Arm Upper Back
Lower Back Leg Other (state)
6. How many days of work have you missed because of pain during the past 18 months? Tick (/) one
0 days (1) 1-2 days (2) 3-7 days (3) 8-14days (4)
15-30 days (5) 1 month (6) 2 months (7) 3-6 months (8)
6-12 months (9) over 1 year (10)
7. How long have you had your current pain problem? Tick (/) one.
0-1 weeks (1) 1-2 weeks (2) 3-4 weeks (3) 4-5 weeks (4)
6-8 weeks (5) 9-11 weeks (6) 3-6 months (7) 6-9 months (8)
9-12 months (9) over 1 year (10)
8. Is your work heavy or monotonous? Circle the best alternative.
0 1 2 3 4 5 6 7 8 9 10
Not at all Extremely 9. How would you rate the pain that you have had during the past week? Circle one.
0 1 2 3 4 5 6 7 8 9 10
No pain Pain as bad as it could be
10. In the past three months, on average, how bad was your pain on a 0-10 scale? Circle one.
0 1 2 3 4 5 6 7 8 9 10
No pain Pain as bad as it could be
11. How often would you say that you have experienced pain episodes, on average, during the past three months? Circle one.
0 1 2 3 4 5 6 7 8 9 10
Never Always
iCAHE Chronic Disease Outcomes Calculator: User Manual
31
12. Based on all things you do to cope, or deal with your pain, on an average day, how much are you able to decrease it? Circle the appropriate number.
0 1 2 3 4 5 6 7 8 9 10
Can’t decrease it at all Can decrease it completely 13. How tense or anxious have you felt in the past week? Circle one.
0 1 2 3 4 5 6 7 8 9 10
Absolutely calm and relaxed As tense and anxious as I’ve ever felt
14. How much have you been bothered by feeling depressed in the past week? Circle one.
0 1 2 3 4 5 6 7 8 9 10
Not at all Extremely 15. In your view, how large is the risk that your current pain may become persistent? Circle one.
0 1 2 3 4 5 6 7 8 9 10
No risk Very large risk 16. In your estimation, what are the chances that you will be able to work in six months? Circle one.
0 1 2 3 4 5 6 7 8 9 10
No chance Very large chance 17. If you take into consideration your work routines, management, salary, promotion possibilities and work mates, how satisfied are you with your job? Circle one.
0 1 2 3 4 5 6 7 8 9 10
Not satisfied at all Completely satisfied Here are some of the things that other people have told us about their pain. For each statement, circle one number from 0 to 10 to say how much physical activities, such as bending, lifting, walking or driving, would affect your pain.
18. Physical activity makes my pain worse.
0 1 2 3 4 5 6 7 8 9 10
Completely disagree Completely agree
19. An increase in pain is an indication that I should stop what I’m doing until the pain decreases.
0 1 2 3 4 5 6 7 8 9 10
Completely disagree Completely agree 20. I should not do my normal work with my present pain.
0 1 2 3 4 5 6 7 8 9 10
Completely disagree Completely agree

iCAHE Chronic Disease Outcomes Calculator: User Manual
32
Here is a list of five activities. Circle the one number that best describes your current ability to participate in each of these activities.
21. I can do light work for an hour.
0 1 2 3 4 5 6 7 8 9 10
Can’t do it because of pain problem Can do it without pain being a problem 22. I can walk for an hour.
0 1 2 3 4 5 6 7 8 9 10
Can’t do it because of pain problem Can do it without pain being a problem 23. I can do ordinary household chores.
0 1 2 3 4 5 6 7 8 9 10
Can’t do it because of pain problem Can do it without pain being a problem 24. I can do the weekly shopping.
0 1 2 3 4 5 6 7 8 9 10
Can’t do it because of pain problem Can do it without pain being a problem 25. I can sleep at night.
0 1 2 3 4 5 6 7 8 9 10
Can’t do it because of pain problem Can do it without pain being a problem
iCAHE Chronic Disease Outcomes Calculator: User Manual
33
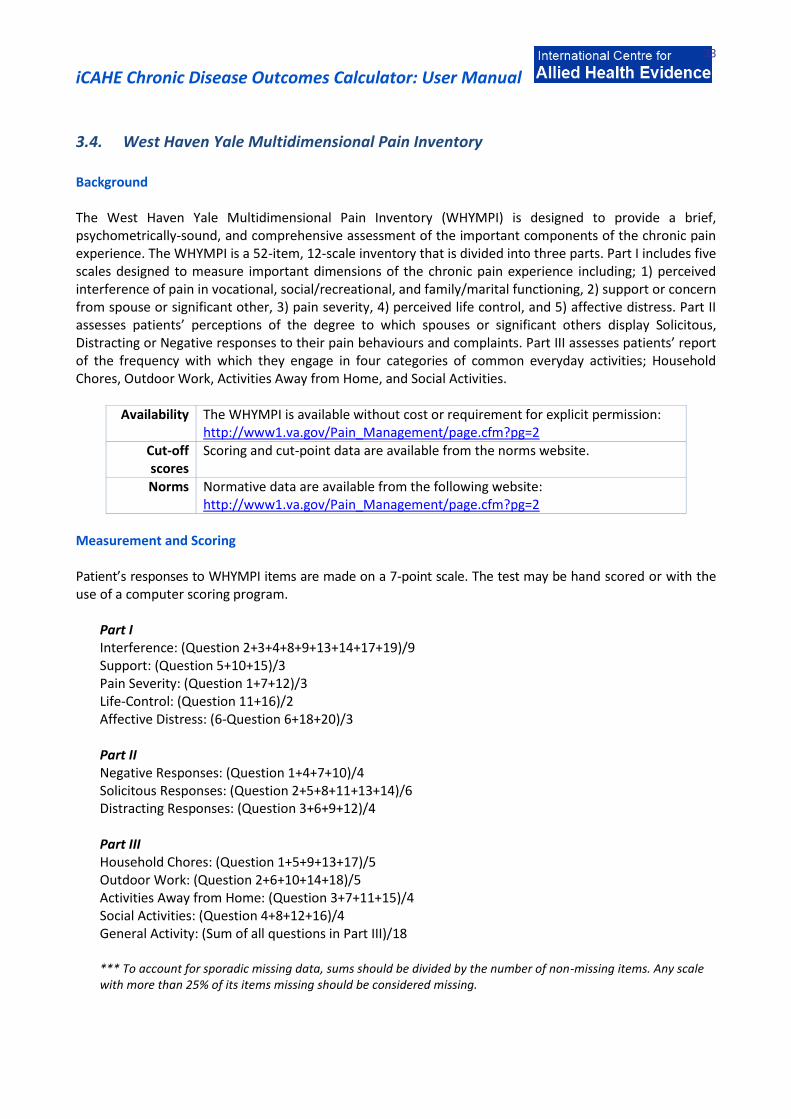
3.4. West Haven Yale Multidimensional Pain Inventory Background The West Haven Yale Multidimensional Pain Inventory (WHYMPI) is designed to provide a brief, psychometrically-sound, and comprehensive assessment of the important components of the chronic pain experience. The WHYMPI is a 52-item, 12-scale inventory that is divided into three parts. Part I includes five scales designed to measure important dimensions of the chronic pain experience including; 1) perceived interference of pain in vocational, social/recreational, and family/marital functioning, 2) support or concern from spouse or significant other, 3) pain severity, 4) perceived life control, and 5) affective distress. Part II assesses patients’ perceptions of the degree to which spouses or significant others display Solicitous, Distracting or Negative responses to their pain behaviours and complaints. Part III assesses patients’ report of the frequency with which they engage in four categories of common everyday activities; Household Chores, Outdoor Work, Activities Away from Home, and Social Activities.
Availability The WHYMPI is available without cost or requirement for explicit permission: http://www1.va.gov/Pain_Management/page.cfm?pg=2
Cut-off scores
Scoring and cut-point data are available from the norms website.
Norms Normative data are available from the following website: http://www1.va.gov/Pain_Management/page.cfm?pg=2
Measurement and Scoring Patient’s responses to WHYMPI items are made on a 7-point scale. The test may be hand scored or with the use of a computer scoring program.
Part I Interference: (Question 2+3+4+8+9+13+14+17+19)/9 Support: (Question 5+10+15)/3 Pain Severity: (Question 1+7+12)/3 Life-Control: (Question 11+16)/2 Affective Distress: (6-Question 6+18+20)/3 Part II Negative Responses: (Question 1+4+7+10)/4 Solicitous Responses: (Question 2+5+8+11+13+14)/6 Distracting Responses: (Question 3+6+9+12)/4 Part III Household Chores: (Question 1+5+9+13+17)/5 Outdoor Work: (Question 2+6+10+14+18)/5 Activities Away from Home: (Question 3+7+11+15)/4 Social Activities: (Question 4+8+12+16)/4 General Activity: (Sum of all questions in Part III)/18
*** To account for sporadic missing data, sums should be divided by the number of non-missing items. Any scale with more than 25% of its items missing should be considered missing.
iCAHE Chronic Disease Outcomes Calculator: User Manual
34
Recording A separate recording sheet is provided to facilitate repeated measures over time. The experience of chronic pain is assessed on repeated occasions using this inventory in order to obtain an understanding of any change in the status of the patient. Validity, reliability and internal consistency Kerns, Turk and Rudy (1985) demonstrated that the internal reliability coefficients of all WHYMPI scales range from .70 to .90; the test-retest reliability of these scales over a 2-week interval range from .62 to .91. The validity of the WHYMPI has been supported by the results of confirmatory and exploratory factor analytic procedures. The procedures revealed that the WHYMPI scales were significantly correlated with several criterion measures of anxiety, depression, marital satisfaction, pain severity, and health locus of control. In a study by Bernstein et al in 1995, WHYMPI was found to have met the standards of reliability and convergent validity, and was thought to be an improvement over current psychometric devices used to this same end. When tested among patients with temporomandibular problems, the internal consistency (Cronbach α) for each and every one of the MPI scales are satisfactory, exceeding the α of .70. References Bernstein IH, Jaremko ME, Hinkley BS (1995): On the utility of the West Haven Yale Multidimensional Pain Inventory. Spine; 20(8), 956-963. Kerns RD, Turk DC, Rudy TE (1985): The West Haven-Yale Multidimensional Pain Inventory (WHYMPI). Pain; 23: 345-356. Andreu Y, Galdon MJ, Durá E, Ferrando M, Pascual J, Turk D, Jiménez Y, Poveda R (2006): An examination of the psychometric structure of the Multidimensional Pain Inventory in temporomandibular disorder patients: a confirmatory factor analysis. Head Face Med; 2:48.

iCAHE Chronic Disease Outcomes Calculator: User Manual
35
West Haven Yale Multidimensional Pain Inventory BEFORE YOU BEGIN, PLEASE ANSWER 2 PRE-EVALUATION QUESTIONS BELOW:
1. Some of the questions in this questionnaire refer to your “significant other”. A significant other is a
person with whom you feel closest. This includes anyone that you relate to on a regular or infrequent basis. It is very important that you identify someone as your “significant other”. Please indicate below who your significant other is (check one):
Spouse Partner/Companion Housemate/Roomate
Friend Neighbour Parent/Child/Other relative
Other (please describe):
2. Do you currently live with this person? YES NO When you answer questions in the following pages about “your significant other”, always respond in reference to the specific person you just indicated above.
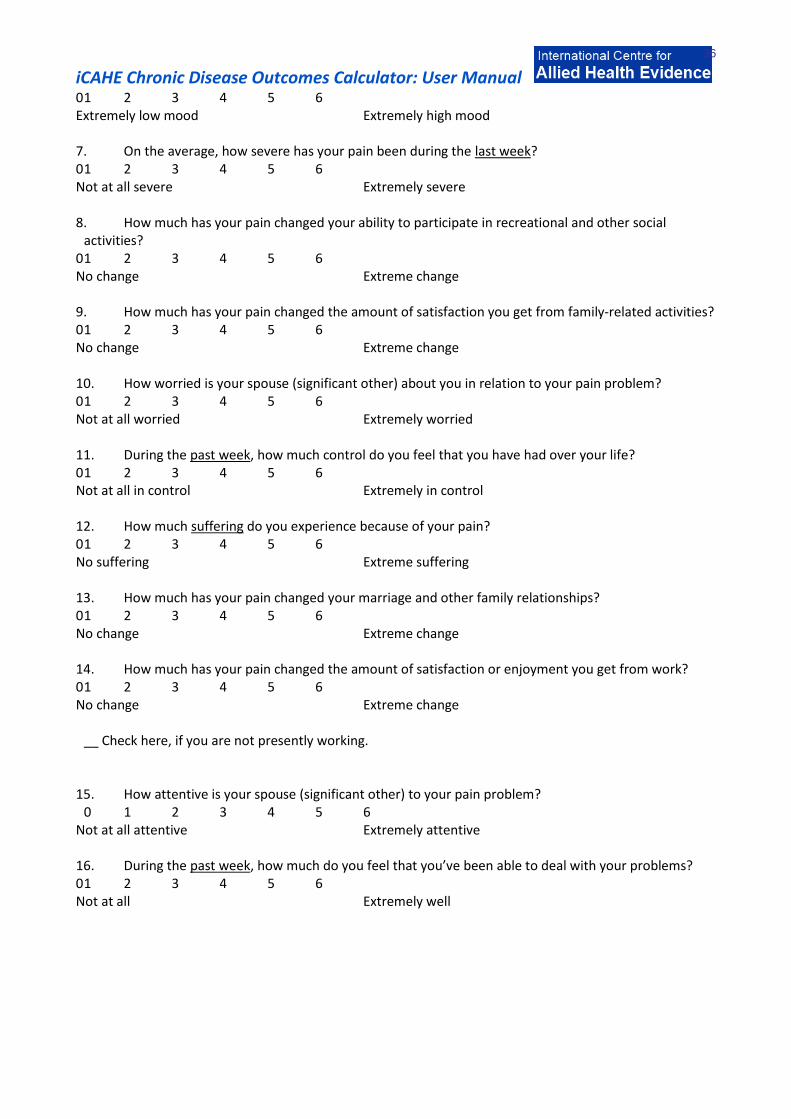
A. In the following 20 questions, you will be asked to describe your pain and how it affects your life. Under each question is a scale to record your answer. Read each question carefully and then circle a number on the scale under that question to indicate how that specific question applies to you.
1. Rate the level of your pain at the present moment. 0 1 2 3 4 5 6 No pain Very intense pain
2. In general, how much does your pain problem interfere with your day to day activities? 0 1 2 3 4 5 6 No interference Extreme interference
3. Since the time you developed a pain problem, how much has your pain changed your ability to work?
0 1 2 3 4 5 6 No change Extreme change ___ Check here, if you have retired for reasons other than your pain problem
4. How much has your pain changed the amount of satisfaction or enjoyment you get from
participating in social and recreational activities? 0 1 2 3 4 5 6 No change Extreme change
5. How supportive or helpful is your spouse (significant other) to you in relation to your pain? 0 1 2 3 4 5 6 Not at all supportive Extremely supportive 6. Rate your overall mood during the past week.
iCAHE Chronic Disease Outcomes Calculator: User Manual
36
0 1 2 3 4 5 6 Extremely low mood Extremely high mood 7. On the average, how severe has your pain been during the last week? 0 1 2 3 4 5 6 Not at all severe Extremely severe 8. How much has your pain changed your ability to participate in recreational and other social
activities? 0 1 2 3 4 5 6 No change Extreme change 9. How much has your pain changed the amount of satisfaction you get from family-related activities? 0 1 2 3 4 5 6 No change Extreme change 10. How worried is your spouse (significant other) about you in relation to your pain problem? 0 1 2 3 4 5 6 Not at all worried Extremely worried 11. During the past week, how much control do you feel that you have had over your life? 0 1 2 3 4 5 6 Not at all in control Extremely in control 12. How much suffering do you experience because of your pain? 0 1 2 3 4 5 6 No suffering Extreme suffering 13. How much has your pain changed your marriage and other family relationships? 0 1 2 3 4 5 6 No change Extreme change 14. How much has your pain changed the amount of satisfaction or enjoyment you get from work? 0 1 2 3 4 5 6 No change Extreme change __ Check here, if you are not presently working. 15. How attentive is your spouse (significant other) to your pain problem? 0 1 2 3 4 5 6 Not at all attentive Extremely attentive 16. During the past week, how much do you feel that you’ve been able to deal with your problems? 0 1 2 3 4 5 6 Not at all Extremely well
iCAHE Chronic Disease Outcomes Calculator: User Manual
37
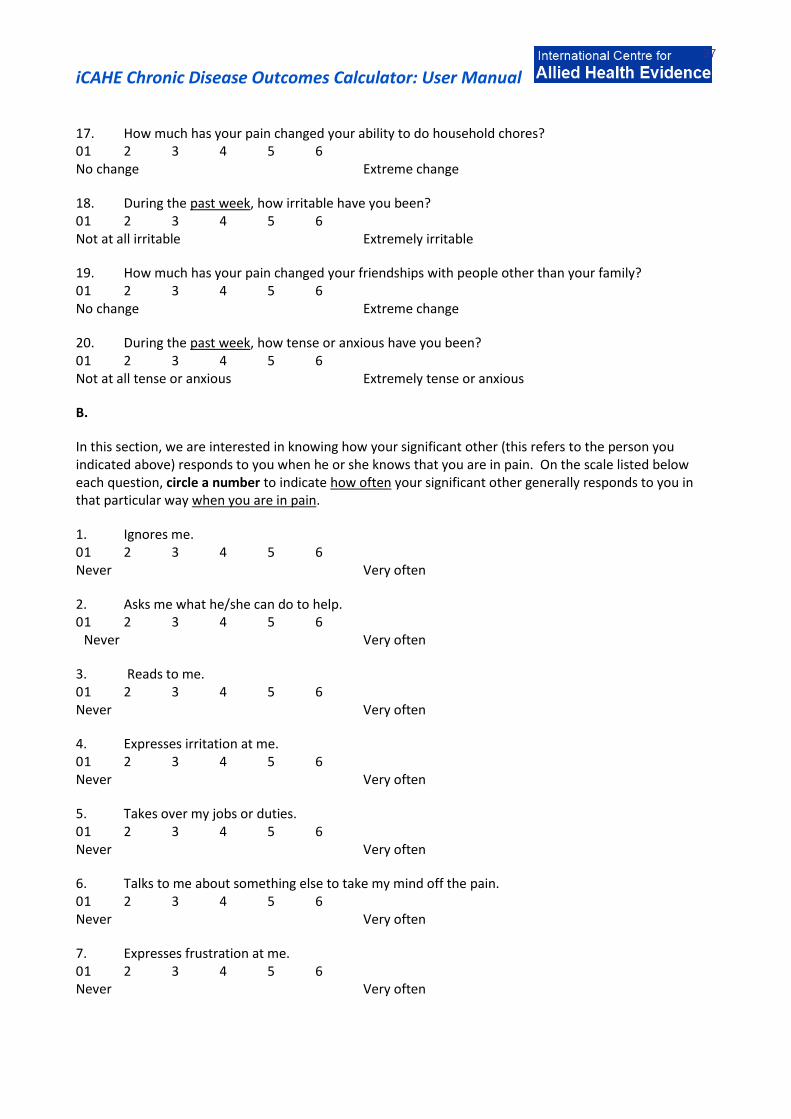
17. How much has your pain changed your ability to do household chores? 0 1 2 3 4 5 6 No change Extreme change
18. During the past week, how irritable have you been? 0 1 2 3 4 5 6 Not at all irritable Extremely irritable
19. How much has your pain changed your friendships with people other than your family? 0 1 2 3 4 5 6 No change Extreme change
20. During the past week, how tense or anxious have you been? 0 1 2 3 4 5 6 Not at all tense or anxious Extremely tense or anxious
B.
In this section, we are interested in knowing how your significant other (this refers to the person you indicated above) responds to you when he or she knows that you are in pain. On the scale listed below each question, circle a number to indicate how often your significant other generally responds to you in that particular way when you are in pain.
1. Ignores me. 0 1 2 3 4 5 6 Never Very often
2. Asks me what he/she can do to help. 0 1 2 3 4 5 6 Never Very often
3. Reads to me. 0 1 2 3 4 5 6 Never Very often
4. Expresses irritation at me. 0 1 2 3 4 5 6 Never Very often
5. Takes over my jobs or duties. 0 1 2 3 4 5 6 Never Very often
6. Talks to me about something else to take my mind off the pain. 0 1 2 3 4 5 6 Never Very often
7. Expresses frustration at me. 0 1 2 3 4 5 6 Never Very often

iCAHE Chronic Disease Outcomes Calculator: User Manual
38
8. Tries to get me to rest. 0 1 2 3 4 5 6 Never Very often
9. Tries to involve me in some activity. 0 1 2 3 4 5 6 Never Very often
10. Expresses anger at me. 0 1 2 3 4 5 6 Never Very often
11. Gets me some pain medications. 0 1 2 3 4 5 6 Never Very often
12. Encourages me to work on a hobby. 0 1 2 3 4 5 6 Never Very often
13. Gets me something to eat or drink. 0 1 2 3 4 5 6 Never Very often
14. Turns on the TV to take my mind off my pain. 0 1 2 3 4 5 6 Never Very often
C. Listed below are 18 common daily activities. Please indicate how often you do each of these activities by circling a number on the scale listed below each activity. Please complete all 18 questions.
1. Wash dishes. 0 1 2 3 4 5 6 Never Very often
2. Mow the lawn. 0 1 2 3 4 5 6 Never Very often
3. Go out to eat. 0 1 2 3 4 5 6 Never Very often
4. Play cards or other games. 0 1 2 3 4 5 6 Never Very often
5. Go grocery shopping. 0 1 2 3 4 5 6 Never Very often

iCAHE Chronic Disease Outcomes Calculator: User Manual
39
6. Work in the garden. 0 1 2 3 4 5 6 Never Very often
7. Go to a movie. 0 1 2 3 4 5 6 Never Very often
8. Visit friends. 0 1 2 3 4 5 6 Never Very often
9. Help with the house cleaning. 0 1 2 3 4 5 6 Never Very often
10. Work on the car. 0 1 2 3 4 5 6 Never Very often
11. Take a ride in a car. 0 1 2 3 4 5 6 Never Very often
12. Visit relatives. 0 1 2 3 4 5 6 Never Very often
13. Prepare a meal. 0 1 2 3 4 5 6 Never Very often
14. Wash the car. 0 1 2 3 4 5 6 Never Very often
15. Take a trip. 0 1 2 3 4 5 6 Never Very often
16. Go to a park or beach. 0 1 2 3 4 5 6 Never Very often
17. Do a load of laundry. 0 1 2 3 4 5 6 Never Very often
18. Work on a needed house repair. 0 1 2 3 4 5 6 Never Very often
iCAHE Chronic Disease Outcomes Calculator: User Manual
40
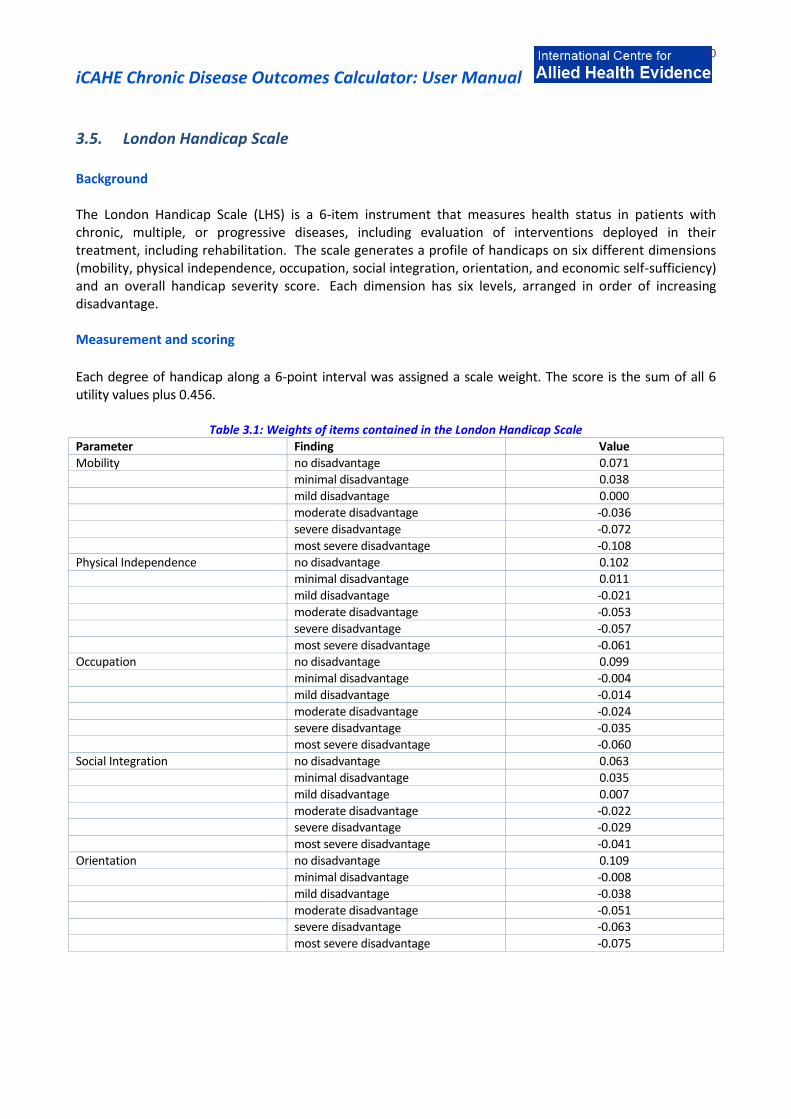
3.5. London Handicap Scale Background The London Handicap Scale (LHS) is a 6-item instrument that measures health status in patients with chronic, multiple, or progressive diseases, including evaluation of interventions deployed in their treatment, including rehabilitation. The scale generates a profile of handicaps on six different dimensions (mobility, physical independence, occupation, social integration, orientation, and economic self-sufficiency) and an overall handicap severity score. Each dimension has six levels, arranged in order of increasing disadvantage. Measurement and scoring
Each degree of handicap along a 6-point interval was assigned a scale weight. The score is the sum of all 6 utility values plus 0.456.
Table 3.1: Weights of items contained in the London Handicap Scale
Parameter Finding Value
Mobility no disadvantage 0.071 minimal disadvantage 0.038
mild disadvantage 0.000
moderate disadvantage -0.036
severe disadvantage -0.072
most severe disadvantage -0.108
Physical Independence no disadvantage 0.102 minimal disadvantage 0.011
mild disadvantage -0.021
moderate disadvantage -0.053
severe disadvantage -0.057
most severe disadvantage -0.061 Occupation no disadvantage 0.099
minimal disadvantage -0.004
mild disadvantage -0.014
moderate disadvantage -0.024
severe disadvantage -0.035 most severe disadvantage -0.060
Social Integration no disadvantage 0.063
minimal disadvantage 0.035
mild disadvantage 0.007
moderate disadvantage -0.022 severe disadvantage -0.029
most severe disadvantage -0.041
Orientation no disadvantage 0.109
minimal disadvantage -0.008
mild disadvantage -0.038
moderate disadvantage -0.051 severe disadvantage -0.063
most severe disadvantage -0.075

iCAHE Chronic Disease Outcomes Calculator: User Manual
41
Economic Self-sufficiency no disadvantage 0.100
minimal disadvantage 0.067
mild disadvantage 0.033 moderate disadvantage -0.023
severe disadvantage -0.067
most severe disadvantage -0.111
The sum of all "no disadvantage" values is 0.544 which when added to 0.456 gives 1.00. The sum of all "most severe disadvantage" values is -0.456 which when added to 0.456 gives 0.00. Recording A separate recording sheet is provided to facilitate repeated measures over time. Comparison The LHS should be completed on repeated occasions of testing, and the scores for both scales should be compared between testing in order to obtain an understanding of any change in the status of the patient. Interpretation The minimum scale value is 0 and the maximum scale value is 1.0. The scale value corresponds to residual function with 1.00 indicating normal function and 0.00 indicating total disability. Validity, reliability and internal consistency Pearson's correlation coefficient between predicted and measured values: 0.98 and Kendall's coefficient of concordance (tau): 1.00. A study by Westergren and Hagell (2006) provided support for the reliability and validity of the LHS instrument for use among neurologically ill patients in Sweden. The London Handicap Scale is a valid and reliable scale for use in stroke in Turkey (Kutlay et al. 2011). Its unweighted raw scores and weighted scores are equivalent and ordinal, but a linear transformation is possible through Rasch analysis.
References
Harwood RH, Rogers A, et al (1994): Measuring handicap: the London handicap scale a new outcome measure for chronic disease. Quality in Health Care; 3: 11-16. Kutlay S, Kucukdeveci AA, Yanik B, Elhan A, Oztuna D (2011): The interval scaling properties of the London Handicap Scale: an example from the adaptation of the scale for use in Turkey*. Clinical Rehabilitation 25: 248–255. Westergren A, Hagell P (2006): Initial Validation of the Swedish version of the London Handicap Scale. Quality of Life Res; 15(7): 1251-1256.

London Handicap Scale
Mobility Getting around Think about how you get from one place to another, using any help, aids, means of transport that you normally have available DOES YOUR HEALTH STOP YOU FROM GETTING AROUND Please tick one box only
NOT AT All
VERY SLIGHTLY
QUITE A LOT
VERY MUCH
ALMOST COMPLETELY
COMPLETELY
You go everywhere you want to, no matter how far away.
You go most places you want, but not all.
You get out of the house but not far away from it.
You don’t go outside but you can move around from room to room
indoors.
You are confined to a single room but you can move around in it.
You are confined to a bed or a chair. There is no-one to move you.
Physical Independence Looking After Yourself Think about things like housework, shopping, looking after money, laundry, getting dressed, washing, shaving, and using the toilet. DOES YOUR HEALTH STOP YOU LOOKING AFTER YOURSELF Please tick one box only
NOT AT All
VERY SLIGHTLY
QUITE A LOT
VERY MUCH
ALMOST COMPLETELY
COMPLETELY
You do everything to look after yourself.
You need a little help now and again.
You need help with some tasks (such as heavy housework or shopping),
but no more than once a day.
You do some things for yourself, but you need help more than once a day.
You can be left alone safely for a few hours.
You need help to be available all the time. You cannot be left alone
safely.
You need help with everything. You need constant attention, day and
night.

iCAHE Chronic Disease Outcomes Calculator: User Manual
43
Occupation Work and Leisure Think about things like work (paid or not), housework, gardening, sports, hobbies, going out with friends, travelling, reading, looking after children, watching television and going on holiday. DOES YOUR HEALTH LIMIT YOUR WORK AND LEISURE Please tick one box only
NOT AT All
VERY SLIGHTLY
QUITE A LOT
VERY MUCH
ALMOST COMPLETELY
COMPLETELY
You do everything you want to do.
You do almost all the things you want to do.
You find something to do almost all the time, but you cannot do some
things for as long as you would like.
You are unable to do a lot of things but you can find something to do
most of the time.
You are unable to do most things, but you can find something to do some
of the time.
You sit all day doing nothing. You cannot keep yourself busy or take part
in any activities.
Social Integration
Getting on with people Think about family, friends, and the people you might meet during normal day. DOES YOUR HEALTH STOP YOU GETTING ON WITH PEOPLE Please tick one box only
NOT AT All
VERY SLIGHTLY
QUITE A LOT
VERY MUCH
ALMOST COMPLETELY
COMPLETELY
You get on well with people, see everyone you want to see, and meet
new people.
You get on well with people but your social life is slightly limited.
You are fine with people you know well but you feel uncomfortable with
strangers.
You get on well with people but you have few friends and little contact
with neighbours. Dealing with strangers is very hard.
Apart from people who look after you, you see no one. You have no
friends and no visitors.
You don’t get on with anyone, not even people who look after you.
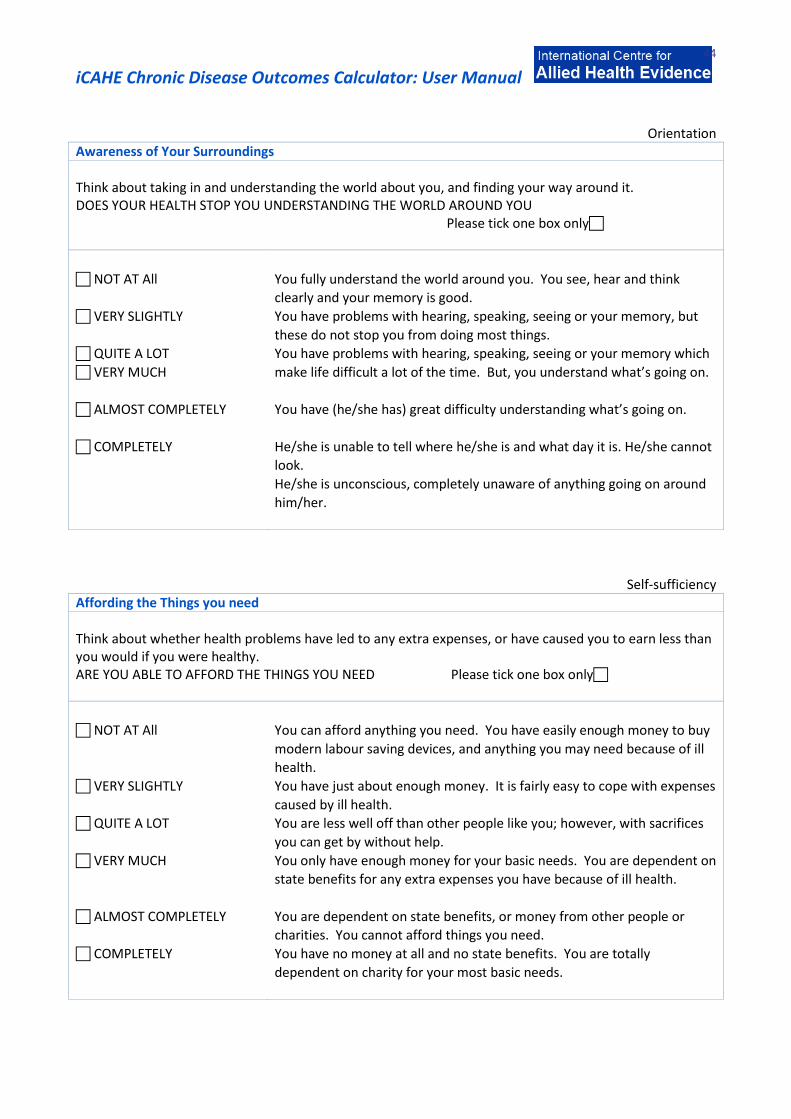
iCAHE Chronic Disease Outcomes Calculator: User Manual
44
Orientation Awareness of Your Surroundings Think about taking in and understanding the world about you, and finding your way around it. DOES YOUR HEALTH STOP YOU UNDERSTANDING THE WORLD AROUND YOU Please tick one box only
NOT AT All
VERY SLIGHTLY
QUITE A LOT
VERY MUCH
ALMOST COMPLETELY
COMPLETELY
You fully understand the world around you. You see, hear and think
clearly and your memory is good.
You have problems with hearing, speaking, seeing or your memory, but
these do not stop you from doing most things.
You have problems with hearing, speaking, seeing or your memory which
make life difficult a lot of the time. But, you understand what’s going on.
You have (he/she has) great difficulty understanding what’s going on.
He/she is unable to tell where he/she is and what day it is. He/she cannot
look.
He/she is unconscious, completely unaware of anything going on around
him/her.
Self-sufficiency Affording the Things you need Think about whether health problems have led to any extra expenses, or have caused you to earn less than you would if you were healthy. ARE YOU ABLE TO AFFORD THE THINGS YOU NEED Please tick one box only
NOT AT All
VERY SLIGHTLY
QUITE A LOT
VERY MUCH
ALMOST COMPLETELY
COMPLETELY
You can afford anything you need. You have easily enough money to buy
modern labour saving devices, and anything you may need because of ill
health.
You have just about enough money. It is fairly easy to cope with expenses
caused by ill health.
You are less well off than other people like you; however, with sacrifices
you can get by without help.
You only have enough money for your basic needs. You are dependent on
state benefits for any extra expenses you have because of ill health.
You are dependent on state benefits, or money from other people or
charities. You cannot afford things you need.
You have no money at all and no state benefits. You are totally
dependent on charity for your most basic needs.

iCAHE Chronic Disease Outcomes Calculator: User Manual
45
3.6. Voice Handicap Index Background The Voice Handicap Index (VHI) was introduced as a tool for measuring the psychosocial consequences of voice disorders. It is also being used in clinical research to evaluate the effectiveness of voice therapy. The VHI is a self-administered instrument consisting of 30 statements on voice-related dysfunction. It consists of three sub-domains measuring emotional-, physical-, and functional-related problems.
Measurement and scoring The self-administered questionnaire consists of 30 items, each rated by the patient on a 5-point Likert scale (0=none to 4=always). The score can be calculated as the sum of the responses to all 30 items. 0-30 indicates minimal amount of disability due to voice problem 31-60 denotes moderate amount of disability 60-120 indicates significant and serious amount of handicap.
Recording A separate recording sheet is provided to facilitate repeated measures over time.
Comparison and Interpretation The VHI is scored from 0-120 with the latter representing the maximum per ceived disability due to voice difficulties based on the patient’s response. The voice handicap of patients is assessed on repeated occasions using this index in order to obtain an understanding of any change in the status of the patient. A decrease in the rating of patients can be interpreted as an improvement in the voice handicap status of the patient.
Validity, reliability and internal consistency Developmental literature revealed good reliability and validity. The VHI has been translated and culturally adapted in several languages. Their psychometric properties have been shown to be sound as follows:
Brazilian Portugese -Proven to be a valid and reliable tool with Cronbach’s =0.88 (Behlau, Santos & Oliveira 2011)
Croatian- Proven to be valid and reliable with Cronbach’s = 0.94 and ICC =0.92 (Bonetti & Bonetti 2013)
Hindi- Found to be a valid and reliable measure with and test retest reliability =0.95 (Datta et al. 2011)
Greek- Found to have high validity and reliability. The overall estimated internal consistency was
excellent (= 0.95) and the estimated ICC for the overall VHI score was 0.96 with 95% confidence interval (CI) from 0.93 to 0.97 (Helidoni et al. 2010).
Swedish- It has been translated and adapted into Swedish for singers. Its validity and reliability (>0.78) has been found to be good in the Swedish singing population (Lamarche et al. 2010).
Arabic- With a significant high internal consistency and reliability (Cronbach’s = 0.97 and r = 0.89, respectively), high item-domain and domain total correlation r = 0.73–0.94 (Malki et al. 2010).

iCAHE Chronic Disease Outcomes Calculator: User Manual
46
Persian- This version of VHI is a valid and reliable questionnaire, which voice therapists may use for completing their evaluation for patients with voice disorders (Moradi et al. 2013).
Arabic- Results showed this measure to be valid and reliable with high internal consistency (Cronbach ’ s alpha r > 0.857 for all scores) & test-retest reliability was found to be strong ( r > 0.87 for all scores) (Saleem & Natour 2010).
Italian- this version was found to be highly reproducible and has excellent clinical validity with internal
consistency = 0.93 and test-retest reliability of r > 0.86 (Schindler et al. 2010).
References Behlau M, Santos LMA, Oliveira G (2011): Cross-Cultural Adaptation and Validation of the Voice Handicap Index Into Brazilian Portuguese. Journal of Voice, 25(3): 354-359. Bonetti A, Bonetti L (2013): Cross-Cultural Adaptation and Validation of the Voice Handicap Index into Croatian. Journal of Voice 27(1): 130e7-e14. Datta R, Sethi A, Singh S, Nilakantan A (2011): Translation and validation of the voice handicap index in Hindi. Journal of Laryngology and Voice 1(1): 12-17. Helidoni ME, Murry T, Moschandreas J, Lionis C, Printza A, Velegrakis GA (2010): Cross-Cultural Adaptation and Validation of the Voice Handicap Index Into Greek. Journal of Voice 24(2): 221-227. Jacobson BH, Johnson A, Grywalski C, Silbergleit A, Jacobson G, Benninger MS, Newman CW (1996): The Voice Handicap Index: Development and Validation. Am J of Speech-Language Pathology; 6:66-70. Lamarche A, Westerlund J, Verduyckt I, Ternstrom S (2010): The Swedish version of the Voice Handicap Index adapted for singers. Logopedics Phoniatrics Vocology 35: 129–137. Malki KH, Mesallum TA, Farahat m, Bukhari M, Murry T (2010): Validation and cultural modification of Arabic voice handicap index. Eur Arch Otorhinolaryngol 267:1743–1751. Moradi N, Pourshahbaz A, Soltani M, Javadipour S, Hashemi H, Soltaninejad N (2013): Cross-Cultural Equivalence and Evaluation of Psychometric Properties of Voice Handicap Index into Persian. Journal of Voice 27(2): 258e15-e22. Saleem AF, Natour YS (2010): Standardization of the Arabic version of the Voice Handicap Index: An investigation of validity and reliability. Logopedics Phoniatrics Vocology 35: 183–188. Schindler A, Ottaviani F, Mozzanica F, Bachmann C, Favero E, Schettino I, Ruoppolo G (2010): Cross-cultural Adaptation and Validation of the Voice Handicap Index Into Italian. Journal of Voice 24(6):708-714.
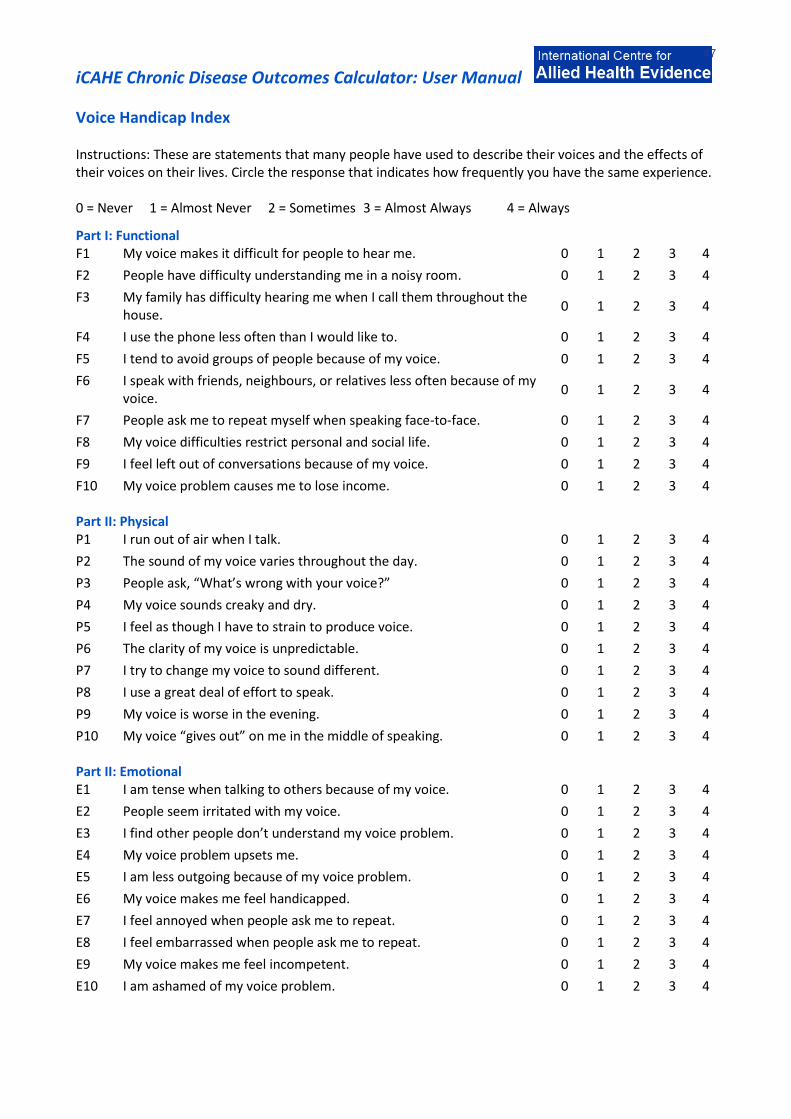
iCAHE Chronic Disease Outcomes Calculator: User Manual
47
Voice Handicap Index
Instructions: These are statements that many people have used to describe their voices and the effects of their voices on their lives. Circle the response that indicates how frequently you have the same experience. 0 = Never 1 = Almost Never 2 = Sometimes 3 = Almost Always 4 = Always
Part I: Functional F1 My voice makes it difficult for people to hear me. 0 1 2 3 4
F2 People have difficulty understanding me in a noisy room. 0 1 2 3 4
F3 My family has difficulty hearing me when I call them throughout the house.
0 1 2 3 4
F4 I use the phone less often than I would like to. 0 1 2 3 4
F5 I tend to avoid groups of people because of my voice. 0 1 2 3 4
F6 I speak with friends, neighbours, or relatives less often because of my voice.
0 1 2 3 4
F7 People ask me to repeat myself when speaking face-to-face. 0 1 2 3 4
F8 My voice difficulties restrict personal and social life. 0 1 2 3 4
F9 I feel left out of conversations because of my voice. 0 1 2 3 4
F10 My voice problem causes me to lose income. 0 1 2 3 4
Part II: Physical P1 I run out of air when I talk. 0 1 2 3 4
P2 The sound of my voice varies throughout the day. 0 1 2 3 4
P3 People ask, “What’s wrong with your voice?” 0 1 2 3 4
P4 My voice sounds creaky and dry. 0 1 2 3 4
P5 I feel as though I have to strain to produce voice. 0 1 2 3 4
P6 The clarity of my voice is unpredictable. 0 1 2 3 4
P7 I try to change my voice to sound different. 0 1 2 3 4
P8 I use a great deal of effort to speak. 0 1 2 3 4
P9 My voice is worse in the evening. 0 1 2 3 4
P10 My voice “gives out” on me in the middle of speaking. 0 1 2 3 4
Part II: Emotional E1 I am tense when talking to others because of my voice. 0 1 2 3 4
E2 People seem irritated with my voice. 0 1 2 3 4
E3 I find other people don’t understand my voice problem. 0 1 2 3 4
E4 My voice problem upsets me. 0 1 2 3 4
E5 I am less outgoing because of my voice problem. 0 1 2 3 4
E6 My voice makes me feel handicapped. 0 1 2 3 4
E7 I feel annoyed when people ask me to repeat. 0 1 2 3 4
E8 I feel embarrassed when people ask me to repeat. 0 1 2 3 4
E9 My voice makes me feel incompetent. 0 1 2 3 4
E10 I am ashamed of my voice problem. 0 1 2 3 4

iCAHE Chronic Disease Outcomes Calculator: User Manual
48
3.7. Voice Handicap Index-10 Background The Voice Handicap Index-10 (VHI-10) is a 10-item, shortened version of the original 30-item Voice Handicap Index. The VHI-10 represents a condensed form of 3 subscales into one shortened scale. For each question, the patient is required to rate each answer using a 5-point scale. The total score indicates the severity of the voice disorder (maximum = 40; minimum = 0). Measurement and scoring It consists of 30 items, each rated by the patient on a 5-point Likert scale (0=none to 4=always). The score can be calculated as the sum of the responses to all 10 items. Recording A separate recording sheet is provided to facilitate repeated measures over time. Comparison and interpretation The VHI-10 is scored from 0-40 with the latter representing the maximum perceived disability due to voice difficulties based on the patient’s response. The voice handicap of patients is assessed on repeated occasions using this index in order to obtain an understanding of any change in the status of the patient. A decrease in the rating of patients can be interpreted as an improvement in the voice handicap status of the patient. Internal consistency Statistical analysis of the VHI and VHI-10 scores from a group of patients representing a wide range of voice disorders showed no statistically significant differences between the VHI and the VHI-10. Irrespective of diagnosis, the correlation between the VHI and the VHI-10 was greater than .90 (P = .01). The Cronbach α of the VHI-10 was 0.89, indicating a high internal consistency. References Deary I, Webb A, Mackenzie, Wilson J, Carding P (YEAR): Short, self-report voice symptom scales: psychometric characteristics of the VHI-10 and the voice performance questionnaire. Otolaryngology – Head and Neck Surgery; 131(3):232-235. Rosen CA, Lee AS, Osborne J, et al (2004): Development and validation of the voice handicap index 10. Laryngoscope; 114(9):1549-56.
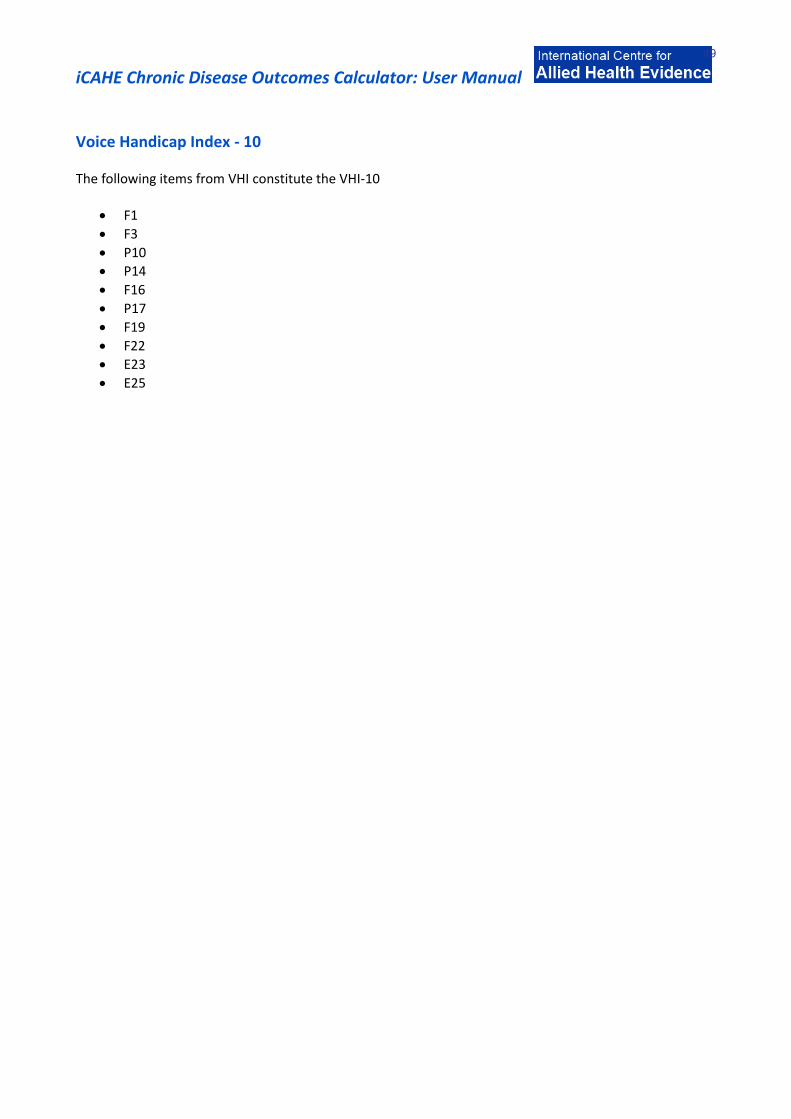
iCAHE Chronic Disease Outcomes Calculator: User Manual
49
Voice Handicap Index - 10 The following items from VHI constitute the VHI-10
F1
F3
P10
P14
F16
P17
F19
F22
E23
E25

iCAHE Chronic Disease Outcomes Calculator: User Manual
50
Chapter 4: Psychological Response Scales:
4.1. Chronic Disease Self-efficacy Scales
Background
The Chronic Disease Self-efficacy Scales (CDSES) measure an individual’s belief that they can manage their chronic condition. It is a 32-item scale that covers several domains that are common across many chronic diseases: symptom control, role function, emotional functioning and communicating with physicians.
Measurement and Scoring
The CDSES is a self-administered questionnaire where a patient rates their confidence in doing certain activities, on a 10-point scale (1-10), with 1 as “not at all confident” and 10 with “totally confident.” The score for each item is the number circled. If two consecutive numbers are circled, the lower number is coded (less self-efficacy). If the numbers are not consecutive, the item is not scored. The score for each scale is the mean of the items. The following guidelines in scoring are observed if there are missing items: For scales with 1-2 items, not scored if any item is missing For scales with 3-4 items, not scored if more one item is missing For scales with 5-6 items, not scored if more than 2 items are missing.
Recording
A separate recording sheet is provided to facilitate repeated measures over time.
Comparison
The CDSES should be completed on repeated occasions of testing, and the scores for both scales should be compared between testing in order to obtain an understanding of any change in the status of the patient.
Interpretation
No cut-off scores are provided, although higher scores indicate higher self-efficacy.
Validity, reliability and internal consistency
Table 4.1: Internal consistency and test-retest reliability of CDSES Scale Internal Consistency Test-retest reliability
Exercise regularly 0.83 0.86 Get information on disease --- 0.72 Obtain help from community, family, friends 0.77 0.85 Communication with physician 0.90 0.88 Manage disease in general 0.87 --- Do chores 0.91 0.86 Do social/recreational activities 0.82 0.84 Manage symptoms 0.91 0.89 Manage shortness of breath --- 0.82 Control/manage depression 0.92 0.82
The CSES in Norwegian has acceptable feasibility, internal consistency and face and construct validity in a sample of Norwegian patients with chronic obstructive pulmonary disease (Bentsen et al. 2010).
References
Bentsen SB, Rokne B, Wentzel-Larsen T, Henriksen AH, Wahl AK (2010): The Norwegian version of the chronic obstructive pulmonary disease self-efficacy scale (CSES): a validation and reliability study. Scand J Caring Sci 24: 600–609.

iCAHE Chronic Disease Outcomes Calculator: User Manual
51
Lorig K, Stewart A, Ritter P, González V, Laurent D, Lynch J (1996): Outcome Measures for Health Education and other Health Care Interventions. Thousand Oaks CA: Sage Publications: 24-25,41-45.
Chronic Disease Self-efficacy Scales
Each question is answered using the following 10cm scale ranging from not at all confident (1) to totally confident (10). The subscales can be summed and reported separately, and an overall average score can be calculated by summing the subtotals and dividing by the number of subscales. Not at all confident Totally confident
1 2 3 4 5 6 7 8 9 10
Score
A Exercise regularly scale
1. How confident are you that you can do gentle exercises for muscle strength and flexibility three to four times per week (range of motion, using weights etc)?
2. How confident are you that you can do aerobic exercise such as walking, swimming or bicycling three to four times each week?
3. How confident are you that you can exercise without making symptoms worse? Subscale Total
B Get information about disease scale
1. How confident are you that you can get information about your disease from community resources?
Subscale Total
C Obtain help from community, family, friends scale
1. How confident are you that you can get family and friends to help you with the things you need (shopping, cooking, transport etc)?
2. How confident are you that you can get emotional support from friends and family (such as listening or talking over your problems)?
3. How confident are you that you can get emotional support from resources other than friends or family, if needed?
4. How confident are you that you can get help with your daily tasks (such as housecleaning, yard work, meals, personal hygiene) from resources other than family or friends, if needed?
Subscale Total
D Communicate with Doctor Scale
1. How confident are you that you can ask your doctor things about your illness that concern you?
2. How confident are you that you can discuss openly with your doctor any personal problems that may be related to your illness?
3. How confident are you that you can work out differences with your doctor when they arise?
Subscale Total
E Managing Disease in General Scale
1. Having an illness often means doing different tasks and activities to manage your condition. How confident are you that you can do all the things that are necessary to manage your condition on a regular basis?
2. How confident are you that you can judge when the changes in your illness mean that you should visit a doctor?

iCAHE Chronic Disease Outcomes Calculator: User Manual
52
3. How confident are you that you can do all the different tasks and activities needed to manage your health condition so as to reduce your need to see a doctor?
4. How confident are you that you can reduce the emotional distress caused by your health condition so that it does not affect your everyday life?
5. How confident are you that you can do things other than just taking medication to reduce how much your illness affects your everyday life?
Subscale Total
F Do Chores Scale
1. How confident are you that you can complete your household chores, such as vacuuming and yard work, despite your health problems?
2. How confident are you that you can get your errands done despite your health problems?
3. How confident are you that you can get your shopping done despite your health problems?
Subscale Total
G Social/Recreational Activities Scale
1. How confident are you that you can continue to do your hobbies and recreation? 2. How confident are you that you can continue to do the things you like to do with friends
and family (such as social visits and recreation)?
Subscale Total
H Manage Symptoms Scale
1. How confident are you that you can reduce your physical discomfort or pain? 2. How confident are you that you can keep the fatigue caused by your disease from
interfering with the things you want to do?
3. How confident are you that you can keep the physical discomfort or pain of your disease from interfering with the things you want to do?
4. How confident are you that you can keep any other symptoms or health problems you have from interfering with the things you want to do?
5. How confident are you that you can control any symptoms or health problems you have so they don’t interfere with the things you want to do?
Subscale Total
I Managing Shortness of Breath Scale
1. How confident are you that you can keep your shortness of breath from interfering with the things you want to do?
Subscale Total
J Control/ Manage Depression Scale
1. How confident are you that you can keep from getting discouraged when nothing you do seems to make any difference?
2. How confident are you that you can keep from getting sad, or down in the dumps? 3. How confident are you that you can keep from feeling lonely? 4. How confident are you that you can do something to make yourself feel better when
you are feeling discouraged?
5. How confident are you that you can do something to make yourself feel better when you are feeling sad, or down in the dumps?
Subscale Total
Average overall
iCAHE Chronic Disease Outcomes Calculator: User Manual
53
4.2. Self-efficacy for Managing Chronic Disease 6 item scale Background The Self-efficacy for Managing Chronic Disease (SEMCD) 6-item Scale is a shortened version of the Chronic Disease Self-efficacy Scales. It contains items taken from several scales developed for the Chronic Disease Self-Management study. The scale covers several domains that are common across many chronic diseases: symptom control, role function, emotional functioning and communicating with physicians. Measurement and scoring The SEMCD is a 6-item, self-administered questionnaire where a patient rates their confidence in doing certain activities on a 10-point scale (1-10), with 1 as “not at all confident” and 10 with “totally confident”. The score for each item is the number circled. If two consecutive numbers are circled, the lower number is coded (less self-efficacy). If the numbers are not consecutive, the item is not scored. The score for the scale is the mean of the six items. If more than two items are missing, the scale is not scored. Recording A separate recording sheet is provided to facilitate repeated measures over time. Comparison The SEMCD should be completed on repeated occasions of testing, and the scores for both scales should be compared between testing in order to obtain an understanding of any change in the status of the patient. Interpretation No cut-off scores are provided, although higher scores indicate higher self-efficacy. Validity, reliability and internal consistency In the study done by Lorig et al (2001), the SEMCD has an internal consistency reliability of 0.91. No data is available for its validity and reliability. References
Lorig KR, Sobel DS, Ritter PL, Laurent D, Hobbs M (2001): Effect of a self-management program for patients with chronic disease. Effective Clinical Practice;4: 256-262.

iCAHE Chronic Disease Outcomes Calculator: User Manual
54
Self-efficacy for Managing Chronic Disease 6 item scale Each question is measured on a 1-10 (10cm) response scale ranging from not at all confident to totally confident. The responses are summed then the total is averaged by dividing by the number of questions which were answered.
Not at all confident Totally confident
1 2 3 4 5 6 7 8 9 10
Score
1. How confident are you that you can keep the fatigue caused by your disease from interfering with the things you want to do?
2. How confident are you that you can keep the physical discomfort or pain of your disease from interfering with the things you want to do?
3. How confident are you that you can keep the emotional distress caused by your disease from interfering with the things you want to do?
4. How confident are you that you can keep any other symptoms of health problems that you have from interfering with the things you want to do?
5. How confident are you that you can do the different tasks and activities needed to manage your health condition so as to reduce your need to see a doctor?
6. How confident are you that you can do things other than just taking medication to reduce how much your illness affects your everyday life?
Total
Average

iCAHE Chronic Disease Outcomes Calculator: User Manual
55
4.3. Perceived Health Competence Scale Background The Perceived Health Competence Scale (PHCS) measures an individual’s view of their competence in taking care of their health. It is a domain-specific measure of the degree to which an individual feels capable of effectively managing their health outcomes. Measurement and scoring The PHCS is an 8-item 5-point Likert scale, with 1 as “strongly disagree” and 5 with “strongly agree.” Items 1, 2, 6, & 7 need to be reverse scored (i.e., 1=5, 2=4, etc.) before summing across all eight items. The score can be calculated as the sum of the responses to all items. Recording A separate recording sheet is provided to facilitate repeated measures over time. Comparison The PHCS should be completed on repeated occasions of testing, and the scores for both scales should be compared between testing in order to obtain an understanding of any change in the status of the patient. Interpretation No cut-off scores are provided, although higher scores indicate higher perceived health competence. Validity, reliability and internal consistency Drawing upon the data obtained from three different populations (young adult students, working adults and persons with chronic illness), the PHCS has substantial evidence of reliability and construct validity. Across all samples, the scale demonstrated excellent internal consistency, with α coefficients ranging from 0.82-0.90. In addition, PCHS has shown good stability – it was highly stable over the period of 1 week and it remained moderately stable over a period of 2.5 years. Within sample, the PCHS was consistently correlated with indicators of health status, with the observed correlations lying roughly in the range of 0.4-0.5. This constant, substantial relationship with health status provides construct validation to the PHCS (Smith et al 1995). Cronbach’s α for a sample of young adults who were enrolled in BEEP (Brookline Early Education Project) was 0.87, suggesting high internal consistency of the PHCS (Palfrey et al 2005). References
Palfrey JS et al (2005): The Brookline Early Education Project: A 25-Year Follow-up Study of a Family-Centered Early Health and Development Intervention. Pediatrics; 116(1): 144-152. Smiths MS, Wallston KA, Smith CA (1995): Development and Validation of the Perceived Health Competence Scale. Health Educ Res; 10(1): 51-64.

iCAHE Chronic Disease Outcomes Calculator: User Manual
56
Perceived Health Competence Scale
INSTRUCTIONS: This is a questionnaire designed to determine the way in which different people view certain important issues related to their health. Each item is a belief statement with which you may agree or disagree. Under each statement is a scale which ranges from strongly disagree (1) to strongly agree (5). Respond to each of the following items by blackening one number on your answer sheet for each, using the response choices listed below. Please try to respond to each item separately in your mind from each other item. Choose your answers thoughtfully and make your answers as true FOR YOU as you can. Please answer every item. There are no "right" or "wrong" answers, so choose the most accurate answer for YOU--not what you think most people would say or do. Strongly Disagree Strongly Agree 1 2 3 4 5 1. It is difficult for me to find effective solutions for health problems that come my way. 2. I find efforts to change things I don't like about my health are ineffective. 3. I handle myself well with respect to my health. 4. I am able to do things for my health as well as most other people. 5. I succeed in the projects I undertake to improve my health. 6. Typically, my plans for my health don't work out well. 7. No matter how hard I try, my health doesn't turn out the way I would like. 8. I'm generally able to accomplish my goals with respect to my health.
iCAHE Chronic Disease Outcomes Calculator: User Manual
57
4.4. Perceived Stress Scale Background The Perceived Stress Scale (PSS) is the most widely used psychological instrument for measuring the perception of stress. It is a measure of the degree to which situations in one’s life are appraised as stressful. The scale also includes a number of direct queries about current levels of experienced stress. Measurement and scoring The PSS is a self-report instrument with a 5-point scale (0-never, 1-almost never, 2-sometimes, 3-fairly often, 4-very often). Scores are obtained by reversing responses (e.g., 0 = 4, 1 = 3, 2 = 2, 3 = 1 & 4 = 0) to the four positively stated items (items 4, 5, 7, & 8) and then summing across all scale items. Recording A separate recording sheet is provided to facilitate repeated measures over time. Interpretation The higher the score, the greater is the perceived stress. Validity, reliability and internal consistency In the developmental literature, PSS has good internal consistency (.84, .85, and .86 for three samples; Cohen et al. 1983). Test-retest correlations are good for short time intervals (.85, 2-day interval) and adequate for longer time intervals (.55, 6-week interval). With respect to validity, the PSS correlates with objective measures of stress and with participants' self-rated impact of stressful events. Perceived stress was also a better predictor of both physical and depressive symptomatology than either the number or impact of life events (Cohen et al. 1983).
In a study by Sharp et al in 2007, the PSS proved to be a valid tool for measuring subjective stress in diverse asthma populations. In a study by Andreou et al. (2011) the Greek translation versions of the PSS version 14 and PSS version 10 exhibited satisfactory psychometric properties and their use for research and health care practice is warranted. The Arabic translated version of the PSS-10 showed reasonably adequate psychometric properties in pregnant and postpartum women (Chaaya et al. 2010). A study conducted to assess the psychometric properties of all three versions of the Chinese PSS (4, 10 & 14) confirmed that all versions were valid and reliable and they recommend the use of PSS-10 for research as it shows a higher reliability and focuses on two components of stress; and the use of PSS-4 if such partition is not essential and space for multiple measures is limited (Leung, Lam & Chan 2010).
The Portuguese version of the PSS-10 was found to be valid and reliable when tested on Brazilian university
teachers with Cronbach’s = 0.83 & test-retest reliability score of 0.86 (Reis, Hino & Rodriguez-Anez 2010). The Simplified Chinese version of the PSS-10 demonstrated adequate psychometric properties for evaluating stress levels in Chinese policewomen with overall Cronbach’s alpha = 0.86, and the test–retest reliability coefficient = 0.68 (Wang et al. 2011). And finally, the Thai version of the PSS-10 also demonstrated excellent
goodness-of-fit for the two factor solution model, as well as good reliability (Cronbach’s =0.85, ICC= 0.82) and validity for estimating the level of stress perception with a Thai population (Wongpakaran & Wongpakaran 2010).

iCAHE Chronic Disease Outcomes Calculator: User Manual
58
References
Andreou E, Alexopoulos EC, Lionis C, Varvogli L, Gnardellis C, Chrousos GP, Darviri C (2011): Perceived Stress Scale: Reliability and Validity Study in Greece. Int. J. Environ. Res. Public Health 8: 3287-3298.
Chaaya M, Osman H, Naassan G, Mahfoud Z (2010): Validation of the Arabic version of the Cohen perceived stress scale (PSS-10) among pregnant and postpartum women. BMC Psychiatry 10:111- 118. Cohen S, Kamarck T, Mermelstein R (1983): A global measure of perceived stress. Journal of Health and Social Behavior; 24: 386-396. Cohen S, Williamson G (1988): Perceived Stress in a Probability Sample of the United States. Spacapan S, Oskamp, S (Eds.) The Social Psychology of Health. Newbury Park, CA: Sage. Leung DYP, Lam T, Chan SSC (2010): Three versions of Perceived Stress Scale: validation in a sample of Chinese cardiac patients who smoke. BMC Public Health 10:513-519. Reis RS, Hino AAF, Rodriguez-Anez CR (2010): Perceived Stress Scale: Reliability and Validity Study in Brazil. Journal of Health Psychology 15(1): 107-114. Sharp LK et al (2007): Assessing the PSS for African American Adults with Asthma and Low literacy. J of Asthma; 44(4):311 – 316. Wang Z, Chen J, Boyd JE, Zhang H, Jia X, Qiu J, Xiao Z (2011): Psychometric Properties of the Chinese Version of the Perceived Stress
Scale in Policewomen. PLoS ONE 6(12):e28610. Wongpakaran N, Wongpakaran T (2010): The Thai version of the PSS-10: An Investigation of its psychometric properties. BioPsychoSocial Medicine 4(6): 1-6.
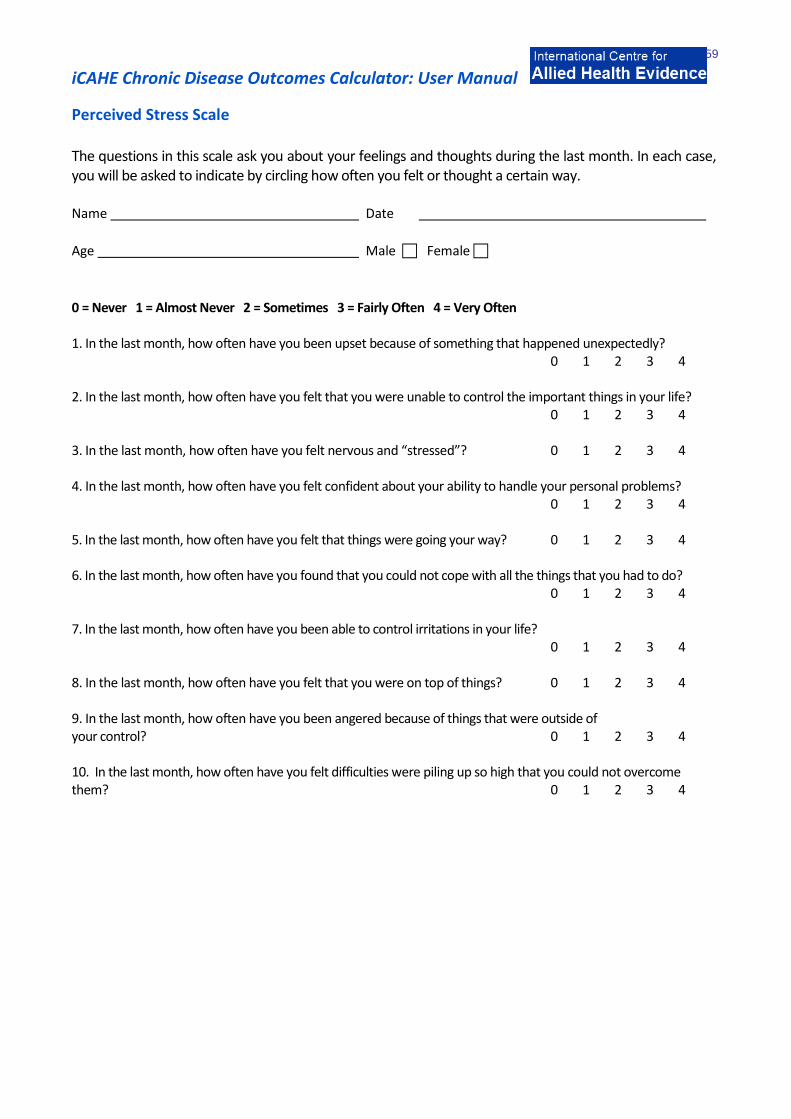
iCAHE Chronic Disease Outcomes Calculator: User Manual
59
Perceived Stress Scale The questions in this scale ask you about your feelings and thoughts during the last month. In each case, you will be asked to indicate by circling how often you felt or thought a certain way. Name Date
Age Male Female
0 = Never 1 = Almost Never 2 = Sometimes 3 = Fairly Often 4 = Very Often 1. In the last month, how often have you been upset because of something that happened unexpectedly? 0 1 2 3 4 2. In the last month, how often have you felt that you were unable to control the important things in your life? 0 1 2 3 4 3. In the last month, how often have you felt nervous and “stressed”? 0 1 2 3 4 4. In the last month, how often have you felt confident about your ability to handle your personal problems? 0 1 2 3 4 5. In the last month, how often have you felt that things were going your way? 0 1 2 3 4 6. In the last month, how often have you found that you could not cope with all the things that you had to do? 0 1 2 3 4 7. In the last month, how often have you been able to control irritations in your life? 0 1 2 3 4 8. In the last month, how often have you felt that you were on top of things? 0 1 2 3 4 9. In the last month, how often have you been angered because of things that were outside of your control? 0 1 2 3 4 10. In the last month, how often have you felt difficulties were piling up so high that you could not overcome them? 0 1 2 3 4
iCAHE Chronic Disease Outcomes Calculator: User Manual
60
4.5. Arthritis Self-efficacy Scale Background The Arthritis Self-efficacy Scale (ASES) is an instrument used to measure patients’ arthritis-specific self-efficacy or patients’ beliefs that they could perform specific tasks or behaviours to cope with the consequences of arthritis. It contains 5 items concerning pain, 9 items on function, and 6 items concerning other symptoms related to rheumatoid arthritis. Items are designed to capture how certain the individual is that they can perform a specific activity or achieve a result. Measurement and scoring Each item on the questionnaire represents a question on which the patient may agree or disagree. Questions are answered using a 10cm-scale ranging from not at all certain (1) to totally certain (10). If two consecutive numbers are chosen for a single item, the lower number (less self-efficacy) is recorded. If the numbers are not consecutive, the item is not scored. If more than 25% of the items are missing, the scale is not scored. The subscales can be summed and reported separately, and an overall average score can be calculated by summing the subtotals and dividing by the number of subscales. Higher scores indicate greater confidence or self-efficacy. Interpretation No cut-off scores are provided, although higher scores indicate higher self-efficacy. Validity, reliability and internal consistency The reliability of the three subscales is good (PSE-Pain 0.76, FSE-Function 0.89, and OSE-Other symptoms 0.87). Item loadings (based on factor analysis or replication sample) are PSE 0.48-0.75, FSE 0.55-0.84, and OSE 0.63- 0.81. Test-retest reliability (2-29 days between retesting) of the three subscales ranged from 0.85-0.90 (PSE 0.87, FSE 0.85, and OSE 0.90). Validity was demonstrated by finding significant correlations among ASES subscales and measures of health status (pain, disability, and depression). Since its development, the ASES has become the gold standard. References Brady TJ (1997): Do common arthritis self efficacy measures really measure self efficacy? Arthritis Care Res;10:1-8. Lorig K, Chastein RL, Ung E, Shoor S, Holman HR (1989): Development and evaluation of a scale to measure perceived self-efficacy in people with arthritis. Arthritis Rheum; 32:37-44. Lorig K, Holman H (1988): Arthritis self-efficacy scales measure self-efficacy. Arthritis Care Res;11:155-7.
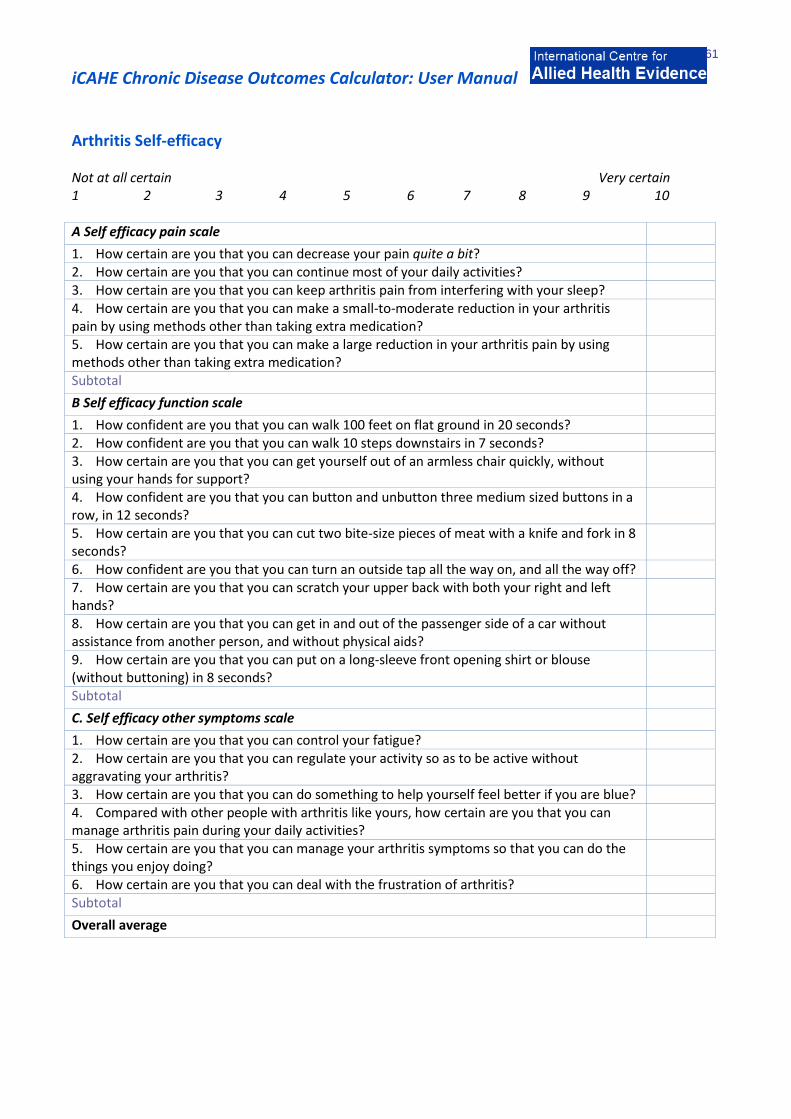
iCAHE Chronic Disease Outcomes Calculator: User Manual
61
Arthritis Self-efficacy Not at all certain Very certain 1 2 3 4 5 6 7 8 9 10 A Self efficacy pain scale
1. How certain are you that you can decrease your pain quite a bit? 2. How certain are you that you can continue most of your daily activities? 3. How certain are you that you can keep arthritis pain from interfering with your sleep? 4. How certain are you that you can make a small-to-moderate reduction in your arthritis pain by using methods other than taking extra medication?
5. How certain are you that you can make a large reduction in your arthritis pain by using methods other than taking extra medication?
Subtotal
B Self efficacy function scale
1. How confident are you that you can walk 100 feet on flat ground in 20 seconds? 2. How confident are you that you can walk 10 steps downstairs in 7 seconds? 3. How certain are you that you can get yourself out of an armless chair quickly, without using your hands for support?
4. How confident are you that you can button and unbutton three medium sized buttons in a row, in 12 seconds?
5. How certain are you that you can cut two bite-size pieces of meat with a knife and fork in 8 seconds?
6. How confident are you that you can turn an outside tap all the way on, and all the way off? 7. How certain are you that you can scratch your upper back with both your right and left hands?
8. How certain are you that you can get in and out of the passenger side of a car without assistance from another person, and without physical aids?
9. How certain are you that you can put on a long-sleeve front opening shirt or blouse (without buttoning) in 8 seconds?
Subtotal
C. Self efficacy other symptoms scale
1. How certain are you that you can control your fatigue? 2. How certain are you that you can regulate your activity so as to be active without aggravating your arthritis?
3. How certain are you that you can do something to help yourself feel better if you are blue? 4. Compared with other people with arthritis like yours, how certain are you that you can manage arthritis pain during your daily activities?
5. How certain are you that you can manage your arthritis symptoms so that you can do the things you enjoy doing?
6. How certain are you that you can deal with the frustration of arthritis? Subtotal
Overall average
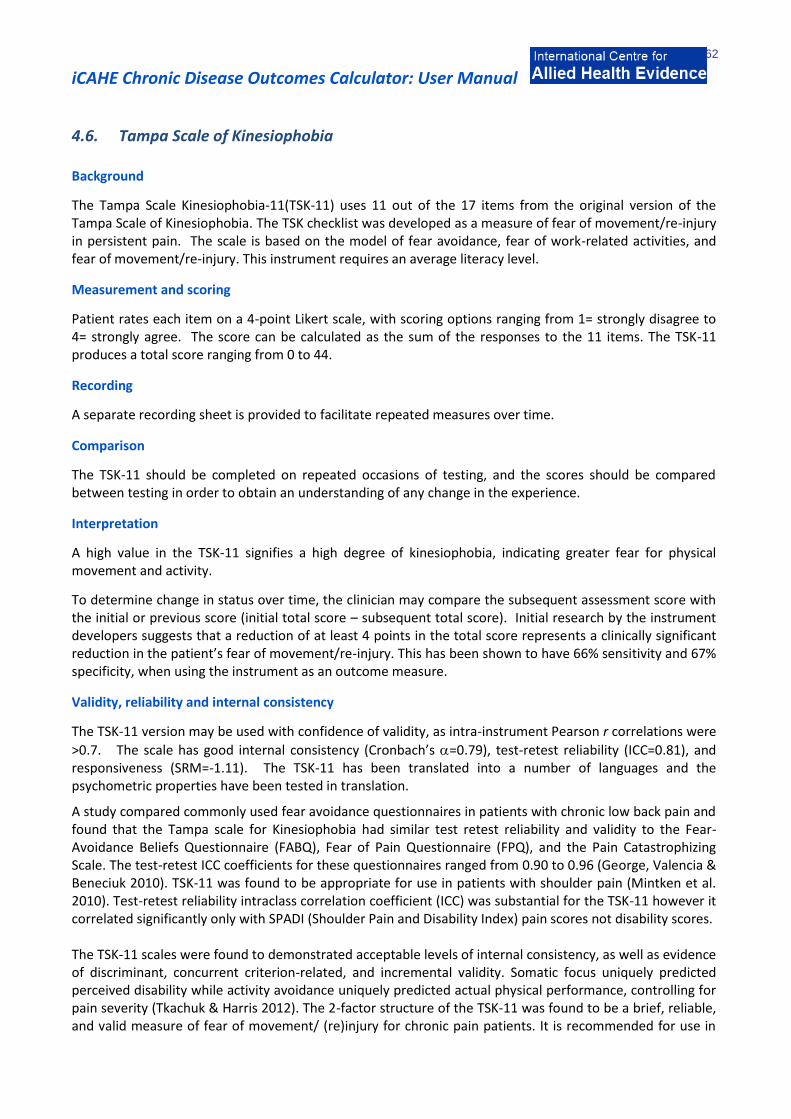
iCAHE Chronic Disease Outcomes Calculator: User Manual
62
4.6. Tampa Scale of Kinesiophobia Background
The Tampa Scale Kinesiophobia-11(TSK-11) uses 11 out of the 17 items from the original version of the Tampa Scale of Kinesiophobia. The TSK checklist was developed as a measure of fear of movement/re-injury in persistent pain. The scale is based on the model of fear avoidance, fear of work-related activities, and fear of movement/re-injury. This instrument requires an average literacy level.
Measurement and scoring
Patient rates each item on a 4-point Likert scale, with scoring options ranging from 1= strongly disagree to 4= strongly agree. The score can be calculated as the sum of the responses to the 11 items. The TSK-11 produces a total score ranging from 0 to 44.
Recording
A separate recording sheet is provided to facilitate repeated measures over time.
Comparison
The TSK-11 should be completed on repeated occasions of testing, and the scores should be compared between testing in order to obtain an understanding of any change in the experience.
Interpretation
A high value in the TSK-11 signifies a high degree of kinesiophobia, indicating greater fear for physical movement and activity.
To determine change in status over time, the clinician may compare the subsequent assessment score with the initial or previous score (initial total score – subsequent total score). Initial research by the instrument developers suggests that a reduction of at least 4 points in the total score represents a clinically significant reduction in the patient’s fear of movement/re-injury. This has been shown to have 66% sensitivity and 67% specificity, when using the instrument as an outcome measure.
Validity, reliability and internal consistency
The TSK-11 version may be used with confidence of validity, as intra-instrument Pearson r correlations were
>0.7. The scale has good internal consistency (Cronbach’s =0.79), test-retest reliability (ICC=0.81), and responsiveness (SRM=-1.11). The TSK-11 has been translated into a number of languages and the psychometric properties have been tested in translation.
A study compared commonly used fear avoidance questionnaires in patients with chronic low back pain and found that the Tampa scale for Kinesiophobia had similar test retest reliability and validity to the Fear-Avoidance Beliefs Questionnaire (FABQ), Fear of Pain Questionnaire (FPQ), and the Pain Catastrophizing Scale. The test-retest ICC coefficients for these questionnaires ranged from 0.90 to 0.96 (George, Valencia & Beneciuk 2010). TSK-11 was found to be appropriate for use in patients with shoulder pain (Mintken et al. 2010). Test-retest reliability intraclass correlation coefficient (ICC) was substantial for the TSK-11 however it correlated significantly only with SPADI (Shoulder Pain and Disability Index) pain scores not disability scores. The TSK-11 scales were found to demonstrated acceptable levels of internal consistency, as well as evidence of discriminant, concurrent criterion-related, and incremental validity. Somatic focus uniquely predicted perceived disability while activity avoidance uniquely predicted actual physical performance, controlling for pain severity (Tkachuk & Harris 2012). The 2-factor structure of the TSK-11 was found to be a brief, reliable, and valid measure of fear of movement/ (re)injury for chronic pain patients. It is recommended for use in
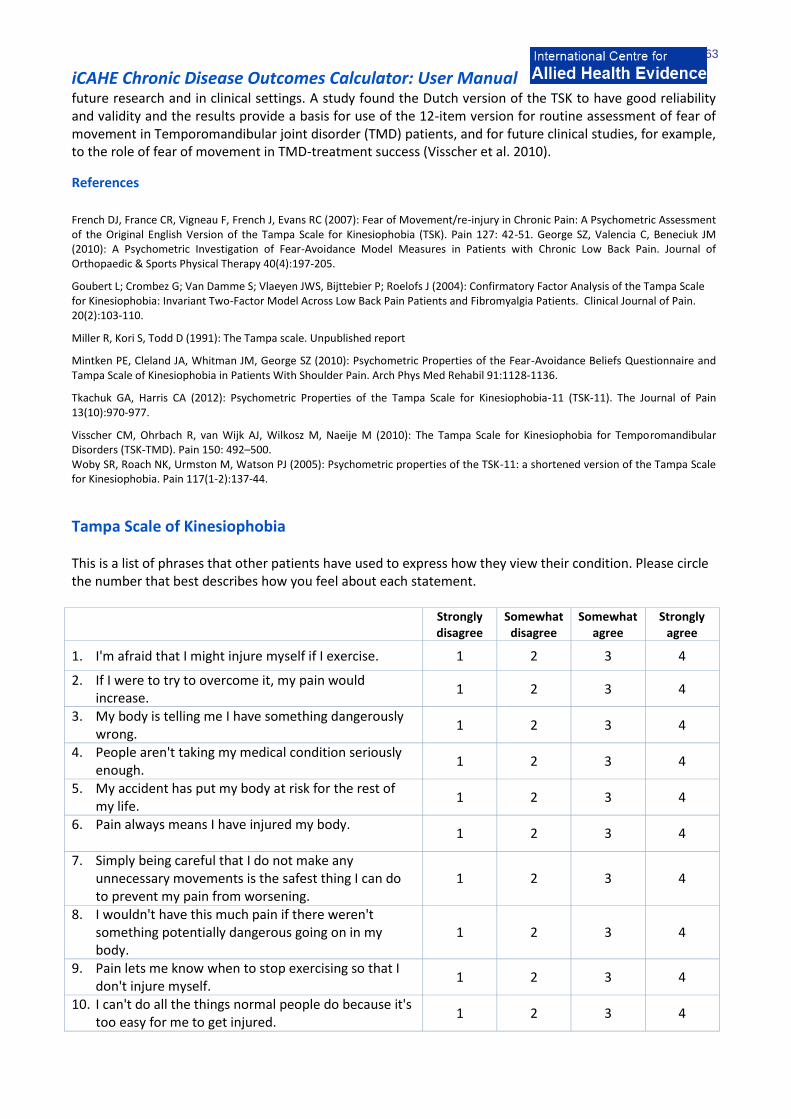
iCAHE Chronic Disease Outcomes Calculator: User Manual
63
future research and in clinical settings. A study found the Dutch version of the TSK to have good reliability and validity and the results provide a basis for use of the 12-item version for routine assessment of fear of movement in Temporomandibular joint disorder (TMD) patients, and for future clinical studies, for example, to the role of fear of movement in TMD-treatment success (Visscher et al. 2010).
References
French DJ, France CR, Vigneau F, French J, Evans RC (2007): Fear of Movement/re-injury in Chronic Pain: A Psychometric Assessment of the Original English Version of the Tampa Scale for Kinesiophobia (TSK). Pain 127: 42-51. George SZ, Valencia C, Beneciuk JM (2010): A Psychometric Investigation of Fear-Avoidance Model Measures in Patients with Chronic Low Back Pain. Journal of Orthopaedic & Sports Physical Therapy 40(4):197-205.
Goubert L; Crombez G; Van Damme S; Vlaeyen JWS, Bijttebier P; Roelofs J (2004): Confirmatory Factor Analysis of the Tampa Scale for Kinesiophobia: Invariant Two-Factor Model Across Low Back Pain Patients and Fibromyalgia Patients. Clinical Journal of Pain. 20(2):103-110.
Miller R, Kori S, Todd D (1991): The Tampa scale. Unpublished report
Mintken PE, Cleland JA, Whitman JM, George SZ (2010): Psychometric Properties of the Fear-Avoidance Beliefs Questionnaire and Tampa Scale of Kinesiophobia in Patients With Shoulder Pain. Arch Phys Med Rehabil 91:1128-1136.
Tkachuk GA, Harris CA (2012): Psychometric Properties of the Tampa Scale for Kinesiophobia-11 (TSK-11). The Journal of Pain 13(10):970-977.
Visscher CM, Ohrbach R, van Wijk AJ, Wilkosz M, Naeije M (2010): The Tampa Scale for Kinesiophobia for Temporomandibular Disorders (TSK-TMD). Pain 150: 492–500. Woby SR, Roach NK, Urmston M, Watson PJ (2005): Psychometric properties of the TSK-11: a shortened version of the Tampa Scale for Kinesiophobia. Pain 117(1-2):137-44.
Tampa Scale of Kinesiophobia This is a list of phrases that other patients have used to express how they view their condition. Please circle the number that best describes how you feel about each statement. Strongly
disagree Somewhat
disagree Somewhat
agree Strongly
agree
1. I'm afraid that I might injure myself if I exercise. 1 2 3 4
2. If I were to try to overcome it, my pain would increase.
1 2 3 4
3. My body is telling me I have something dangerously wrong.
1 2 3 4
4. People aren't taking my medical condition seriously enough.
1 2 3 4
5. My accident has put my body at risk for the rest of my life.
1 2 3 4
6. Pain always means I have injured my body.
1 2 3 4
7. Simply being careful that I do not make any unnecessary movements is the safest thing I can do to prevent my pain from worsening.
1 2 3 4
8. I wouldn't have this much pain if there weren't something potentially dangerous going on in my body.
1 2 3 4
9. Pain lets me know when to stop exercising so that I don't injure myself.
1 2 3 4
10. I can't do all the things normal people do because it's too easy for me to get injured.
1 2 3 4

iCAHE Chronic Disease Outcomes Calculator: User Manual
64
11. No one should have to exercise when he/she is in pain.
1 2 3 4

iCAHE Chronic Disease Outcomes Calculator: User Manual
65
4.7. Pain Self-efficacy Questionnaire Background The Pain Self-efficacy Questionnaire (PESQ) is a 10-item Likert-type questionnaire, designed specifically for chronic pain, where patients are asked to rate their confidence in performing activities despite the presence of pain. Measurement and Scoring The patient rates the 10-item scale with scoring options from 0 (not at all) to 6 (extremely/could not have been worse). The score is calculated by summing the scores for each of the 10 items. PESQ produces a total score ranging from 0-60. Recording A separate recording sheet is provided to facilitate repeated measures over time. Comparison The PESQ should be completed on repeated occasions of testing, and the scores should be compared between testing in order to obtain an understanding of any change in the pain experience. Interpretation There is directional scoring – the higher the scores, the stronger self-efficacy beliefs. There is limited data reporting research project norms. Validity, reliability and internal consistency The PSEQ has high Pearson r values (0.8) for intra-rater reliability, strong Cronbach’s α (0.9) and stability over retest (p>0.05). In a study by Sardá et al (2007), reliability of the PSEQ among chronic pain patients in Brazil has been found to be adequate (split-half correlation was 0.76 and internal consistency was 0.90). Factor analysis indicated the existence of only one factor. Discriminant and concurrent validity were also adequate. The Portuguese version of the PESQ has been confirmed to have strong validity and reliability with a Cronbach’s alpha = 0.88 and Composite reliability = 0.92 (Ferreira-Valente, Pais-Ribeiro & Jensen 2011). References Ferreira-Valente MA, Pais-Ribeiro JL, Jensen MP (2011): Pyschometric properties of the Portuguese Version of the pain self-efficacy questionnaire. Acta Reumatol Port. 36:260-267. Nicholas M (1989): An evaluation of cognitive, behavioural and relaxation treatments for chronic low back pain. Unpublished PhD thesis. Sydney, University of New South Wales. Nicholas MK (2007): The pain self-efficacy questionnaire: Taking pain into account. European Journal of Pain; 11:153-163. Sardá Jr J, Nicholas M, Pimenta C, Asghari
A (2007): Pain-related self-efficacy beliefs in a Brazilian chronic pain patient sample: a
psychometric analysis. Stress and Health; 23(3): 185-190.

iCAHE Chronic Disease Outcomes Calculator: User Manual
66
Pain Self-efficacy Questionnaire Please rate how confident you are that you can do the following things at present, despite the pain. To indicate your answer circle one of the numbers on the scale under each item, where 0 = not at all confident and 6 = completely confident. For example: 0 1 2 3 4 5 6 Not at all Completely confident confident Remember, this questionnaire is not asking whether or not you have been doing these things, but rather how confident you are that you can do them at present, despite the pain. Not at all Completely confident confident 1. I can enjoy things, despite the pain.
0 1 2 3 4 5 6
2. I can do most of the household chores (e.g. tidying-up, washing dishes) despite the pain.
0 1 2 3 4 5 6
3. I can socialise with my friends or family members as often as I used to do, despite the pain.
0 1 2 3 4 5 6
4. I can cope with my pain in most situations.
0 1 2 3 4 5 6
5. I can do some form of work, despite the pain. ("Work" includes housework, paid and unpaid work.)
0 1 2 3 4 5 6
6. I can still do many of the things I enjoy doing, such as hobbies or leisure activities, despite the pain.
0 1 2 3 4 5 6
7. I can cope with my pain without medication.
0 1 2 3 4 5 6
8. I can still accomplish most of my goals in life, despite the pain.
0 1 2 3 4 5 6
9. I can live a normal lifestyle, despite the pain.
0 1 2 3 4 5 6
10. I can gradually become more active, despite the pain.
0 1 2 3 4 5 6
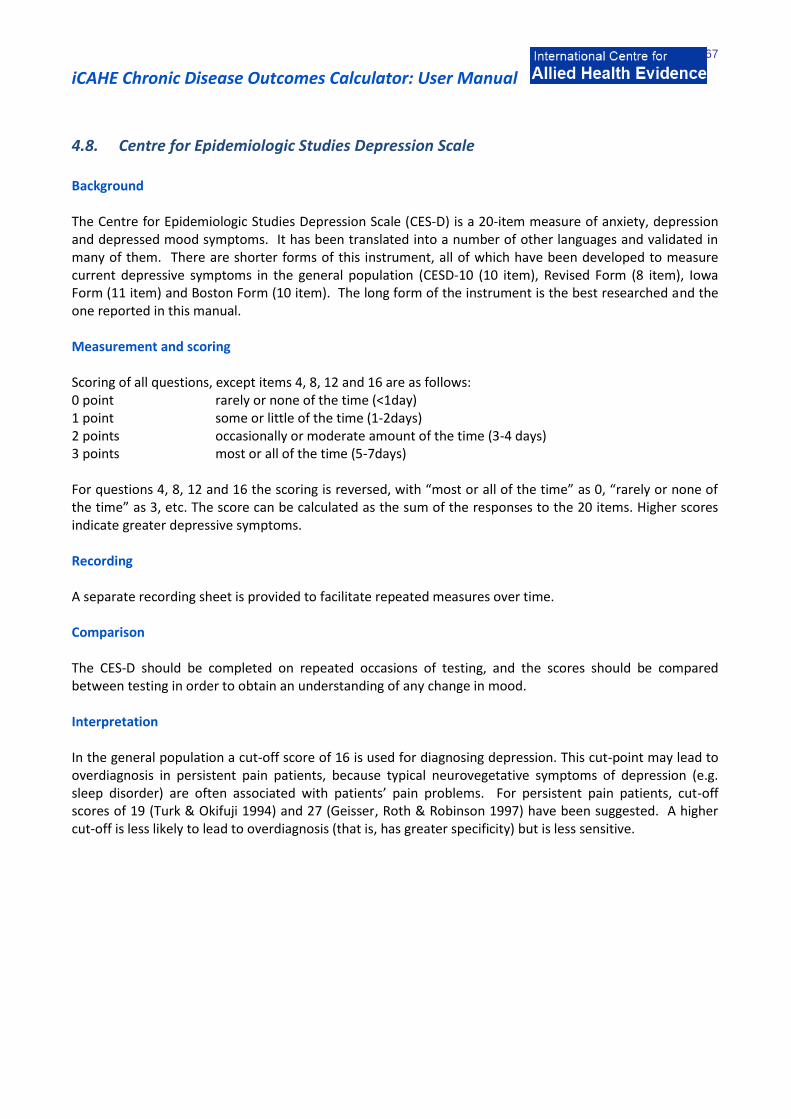
iCAHE Chronic Disease Outcomes Calculator: User Manual
67
4.8. Centre for Epidemiologic Studies Depression Scale Background The Centre for Epidemiologic Studies Depression Scale (CES-D) is a 20-item measure of anxiety, depression and depressed mood symptoms. It has been translated into a number of other languages and validated in many of them. There are shorter forms of this instrument, all of which have been developed to measure current depressive symptoms in the general population (CESD-10 (10 item), Revised Form (8 item), Iowa Form (11 item) and Boston Form (10 item). The long form of the instrument is the best researched and the one reported in this manual. Measurement and scoring Scoring of all questions, except items 4, 8, 12 and 16 are as follows: 0 point rarely or none of the time (<1day) 1 point some or little of the time (1-2days) 2 points occasionally or moderate amount of the time (3-4 days) 3 points most or all of the time (5-7days) For questions 4, 8, 12 and 16 the scoring is reversed, with “most or all of the time” as 0, “rarely or none of the time” as 3, etc. The score can be calculated as the sum of the responses to the 20 items. Higher scores indicate greater depressive symptoms. Recording A separate recording sheet is provided to facilitate repeated measures over time. Comparison The CES-D should be completed on repeated occasions of testing, and the scores should be compared between testing in order to obtain an understanding of any change in mood. Interpretation In the general population a cut-off score of 16 is used for diagnosing depression. This cut-point may lead to overdiagnosis in persistent pain patients, because typical neurovegetative symptoms of depression (e.g. sleep disorder) are often associated with patients’ pain problems. For persistent pain patients, cut-off scores of 19 (Turk & Okifuji 1994) and 27 (Geisser, Roth & Robinson 1997) have been suggested. A higher cut-off is less likely to lead to overdiagnosis (that is, has greater specificity) but is less sensitive.

iCAHE Chronic Disease Outcomes Calculator: User Manual
68
Validity, reliability and internal consistency The CES-D has demonstrated significant responsiveness to change and differentiated between different groups of pain sufferers with p values < 0.05 from ANOVA modelling. This instrument has been compared well with Beck Depression Inventory (BDI) psychologists’ assessment and the Multidimensional Personality Questionnaire (MPQ) for convergent and divergent validity. Among cancer patients (Hann et al 1999), the CES-D was found to have good internal consistency, with alpha coefficients > 0.85 for both groups of women with and without cancer, as well as adequate test-retest reliability in both groups. Construct validity was demonstrated in two ways, via comparisons between the groups and by comparing the CES-D with measures of fatigue, anxiety, and global mental health functioning. The CES-D was established as a valid and reliable measure of depressive symptomatology in this sample of breast cancer patients.
The CESD was found to have good factorial validity and internal consistency to measure depression in adolescents (Bradley, Bagnell & Brannen 2010). An interesting study was conducted on World trade Centre (WTC) rescue/recovery workers to assess the performance of a one-month version of the CES-D (Chiu et al 2010). The CES-D performed well in identifying those at elevated risk and since diagnostic follow-up is time consuming and costly, it is important to correctly distinguish those at elevated risk using a screening tool that has been validated in the population under study. The CES-as a measure of depressive symptom severity in patients with Systemic Sclerosis (Milette et al. 2010).
In order to reflect modern diagnostic criteria and improve upon psychometric limitations of its predecessor, the Center for Epidemiologic Studies Depression Scale Revised (CESD-R) was created (Van Dam & Earleywine 2011). TA study assessing its psychometric properties found it demonstrated high internal consistency, strong factor loadings, and theoretically consistent convergent and divergent validity with anxiety, schizotypy, and positive and negative affect. Results suggest the CESD-R is an accurate and valid measure of depression in the general population with advantages such as free distribution and an a theoretical basis. References Andresen EM, Malmgren JA, Carter WB, Patrick DL (1994): Screening for depression in well older adults: evaluation of a short form of the CES-D. Am J Prev Med; 10(2):77-84. Carpenter JS, Andrykowski MA, Wilson J, Hall LA, Rayens MK, Sachs B, Cunningham LL (1998): Psychometrics for two short forms of the Center for Epidemiologic Studies-Depression Scale. Issues Ment Health Nurs; 19(5):481-94. Geisser ME, Roth RS, Robinson ME (1997): Assessing Depression among Persons with Chronic Pain Using the Center for Epidemiological Studies-Depression Scale and the Beck Depression Inventory: A Comparative Analysis. Clin J Pain; 13(2):163-170. Hann D, Winter K, Jacobson P (1999): Measurement of depressive symptoms in cancer patients: evaluation of the Center for Epidemiological Studies Depression Scale (CES-D). J of Psychosom Res; 46(5):437-43. Radloff LS (1977): The CES-D scale: a self depression scale for research in the general population. Applied Psychological Measurement; 1:385-401. Turk DC, Okifuji A (1994): Detecting depression in chronic pain patients: adequacy of self-reports. Behav Res Ther;32(1):9-16.
Turvey CL, Wallace RB, Herzog R (1999): A revised CES-D measure of depressive symptoms and a DSM-based measure of major depressive episodes in the elderly. Int Psychogeriatr; 11(2):139-48. Issues in Mental Health Nursing 31:408–412.
Carpenter JS, Andrykowski MA, Wilson J, Hall LA, Rayens MK, Sachs B, Cunningham LL (1998): Psychometrics for two short forms of the Center for Epidemiologic Studies-Depression Scale. Issues Ment Health Nurs. 19(5):481-94.
Chiu S, Webber MP, Zeig-Owens R, Gustave J, Lee R, Kelly KJ, Rizzotto L, Prezant DJ (2010): Validation of the Center for Epidemiologic Studies Depression Scale in screening for major depressive disorder among retired firefighters exposed to the World Trade Center disaster. Journal of Affective Disorders 121:212–219.
Geisser ME, Roth RS, Robinson ME (1997): Assessing Depression among Persons with Chronic Pain Using the Center for Epidemiological Studies-Depression Scale and the Beck Depression Inventory: A Comparative Analysis. Clin JPain. 13(2):163-170

iCAHE Chronic Disease Outcomes Calculator: User Manual
69
Hann D, Winter K, Jacobson P (1999) Measurement of depressive symptoms in cancer patients: evaluation of the Center for Epidemiological Studies Depression Scale (CES-D). J of Psychosom Res 46(5):437-43.
Milette K, Hudson, M, Baron M, Thombs BD, Canadian Scleroderma Research Group (2010): Comparison of the PHQ-9 and CES-D depression scales in systemic sclerosis: internal consistency reliability, convergent validity and clinical correlates. Rheumatology 49:789–796.
Radloff LS (1977): The CES-D scale: a self depression scale for research in the general population. Applied Psychological Measurement 1:385-401
Turk DC, Okifuji A (1994): Detecting depression in chronic pain patients: adequacy of self-reports. Behav Res Ther.32(1):9-16
Turvey CL, Wallace RB, Herzog R (1999). A revised CES-D measure of depressive symptoms and a DSM-based measure of major depressive episodes in the elderly. Int Psychogeriatr 11(2):139-48. Van Dam NT, Earleywine M (2011): Validation of the Center for Epidemiologic Studies Depression Scale—Revised (CESD-R): Pragmatic depression assessment in the general population. Psychiatry Research 186: 128–132.

iCAHE Chronic Disease Outcomes Calculator: User Manual
70
Centre for Epidemiologic Studies-Depression Scale
Below is a list of the ways you might have felt or behaved. Please tell me how often you have felt this way during the past week.
During the Past Week
Rarely or none of the time (less than 1 day )
Some or a little of the time (1-2
days)
Occasionally or a moderate amount of
time (3-4 days)
Most or all of the time (5-7
days)
1. I was bothered by things that usually don’t bother me.
2. I did not feel like eating; my appetite was poor.
3. I felt that I could not shake off the blues even with help from my family or friends.
4. I felt I was just as good as other people.
5. I had trouble keeping my mind on what I was doing.
6. I felt depressed.
7. I felt that everything I did was an effort.
8. I felt hopeful about the future.
9. I thought my life had been a failure.
10. I felt fearful.
11. My sleep was restless.
12. I was happy.
13. I talked less than usual.
14. I felt lonely.
15. People were unfriendly.
16. I enjoyed life.
17. I had crying spells.
18. I felt sad.
19. I felt that people dislike me.
20. I could not get “going.”

iCAHE Chronic Disease Outcomes Calculator: User Manual
71
4.9. Modified Somatic Perceptions Questionnaire Background The Modified Somatic Perceptions Questionnaire (MSPQ) is a measure of heightened somatic and autonomic awareness related to anxiety and depression. The MSPQ was developed as a tool to identify clinically significant psychological distress in patients with persistent back pain. Measurement and Scoring The 13-item self-report scale is scored from 0 (not at all) to 3 (extremely/could not have been worse). The score can be calculated as the sum of the responses to the 13 items. The MSPQ produces a total score ranging from 0-39. The higher the score, the more marked the general somatic symptoms. Recording A separate recording sheet is provided to facilitate repeated measures over time. Comparison The MSPQ should be completed on repeated occasions of testing, and the scores should be compared between testing in order to obtain an understanding of any change in the experience. Interpretation Directional interpretation is made of the scores (the higher the score the more psychological distress). High scores may indicate the need for psychological assessment. In the author’s original study a sample of healthy adults scored on average 1.8 points, compared with a mean of 4.9 for patients with back conditions. Limited normative data is reported from research studies on different conditions. Validity, reliability and internal consistency The MSPQ demonstrates strong psychometric properties – with Kappa scores > 0.8 for internal consistency, convergent and divergent validity tested against a range of instruments which measured anxiety and depression (eg MMPI, Zung Depression Rating Scale, MPQ) and discriminative validity within different groups of pain sufferers (p<0.05). References
Deyo RA, Walsh NE, Schoenfeld LS, Ramamurthy S (1989): Studies of the Modified Somatic Perceptions Questionnaire (MSPQ) in patients with back pain. Psychometric and predictive properties. Spine; 14(5):507-10. Main CJ (1983): The Modified Somatic Perception Questionnaire (MSPQ) Journal of Psychosomatic Research; 27(6):503-14.
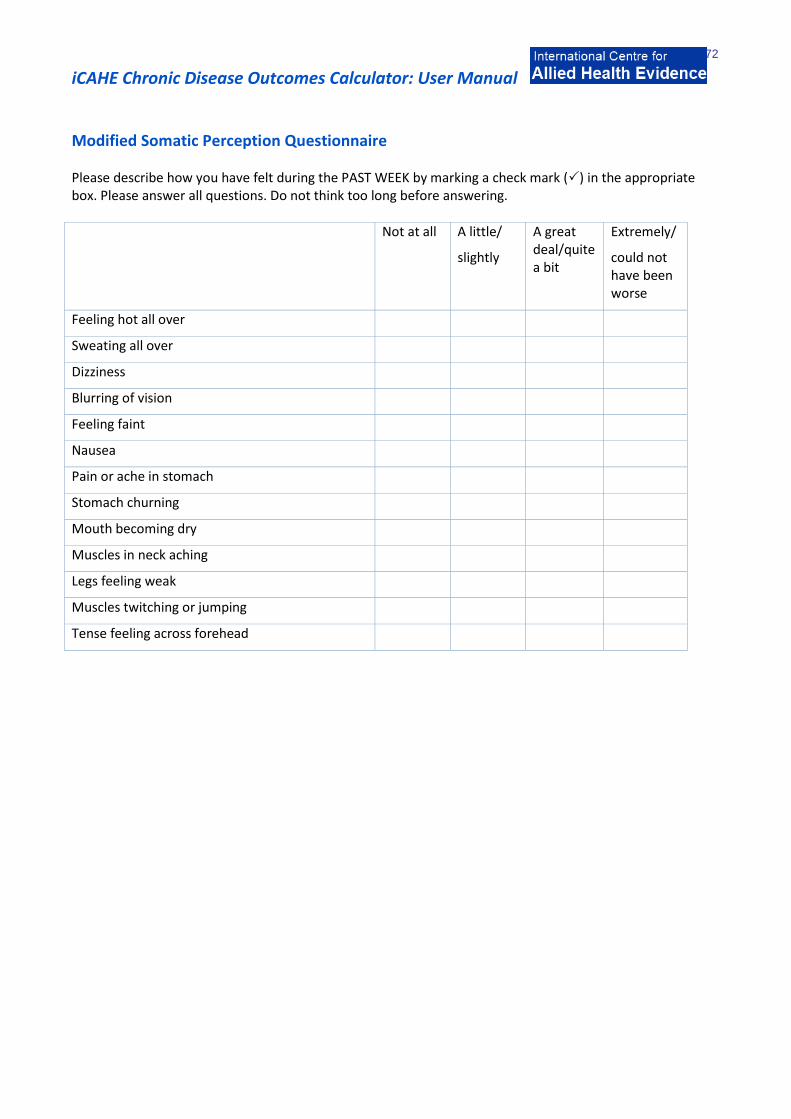
iCAHE Chronic Disease Outcomes Calculator: User Manual
72
Modified Somatic Perception Questionnaire Please describe how you have felt during the PAST WEEK by marking a check mark () in the appropriate box. Please answer all questions. Do not think too long before answering. Not at all A little/
slightly
A great deal/quite a bit
Extremely/
could not have been worse
Feeling hot all over
Sweating all over
Dizziness
Blurring of vision
Feeling faint
Nausea
Pain or ache in stomach
Stomach churning
Mouth becoming dry
Muscles in neck aching
Legs feeling weak
Muscles twitching or jumping
Tense feeling across forehead

iCAHE Chronic Disease Outcomes Calculator: User Manual
73
4.10. Kessler Psychological Distress Scale Background The Kessler Psychological Distress Scale (K10) is a widely reported two-domain, 10-item measure of non-specific psychological distress, primarily intended as a measure of mood, anxiety and depression. The wording is appropriate for use with moderately literate individuals. Measurement and scoring The 10-item scale has 5 response categories, from 1 (none of the time) to 5 (all of the time). The score can be calculated as the sum of the responses to the 10 items. Recording A separate recording sheet is provided to facilitate repeated measures over time. Comparison The K10 should be completed on repeated occasions of testing, and the scores should be compared between testing in order to obtain an understanding of any change in the mood. Interpretation The following cut-off scores have been used to estimate the prevalence of levels of psychological distress in an Australian population health survey.
Table 4.2: Interpretation of K-10 scores
K10 score Likelihood of having a mental disorder
10–19 Likely to be well
20–24 Likely to have a mild mental disorder
25–29 Likely to have a moderate mental disorder
30–50 Likely to have a severe mental disorder
Scores usually decline with effective treatment. Patients whose scores remain above 24 after treatment should be reviewed and specialist referral considered. Validity, reliability and internal consistency The developmental literature reports a significant area under the ROC curve (0.89) related to its sensitivity and specificity, high Cronbach’s alpha in all tests (>0.9) and high intra-rater reliability (Pearson r >0.75). A study confirms the good psychometric characteristics of Kessler’s psychological distress scale when administered to patients admitted to French emergency department for alcohol consumption–related disorders (Arnaud et al. 2010). Another study set out to validate the Dutch version of the K10 as well as an extended version (EK10) in screening for depressive and anxiety disorders in primary care. It reported that the Dutch version of the K10 is appropriate for screening depressive disorders in primary care, while the EK10 is preferred in screening for both depressive and anxiety disorders (Donker et al. 2010).
iCAHE Chronic Disease Outcomes Calculator: User Manual
74
References
Andrews G (2003): Outcome measures suitable for patients with mental disorders seen in general practice. World Health Organization Collaborating Centre in Evidence for Mental Health Policy, UNSW at St Vincents Hospital, Sydney. Arnaud B, Malet L, Teissedre F, Izaute M, Moustafa F, Geneste J, Schmidt J, Llorca PM, Brousse G (2010): Validity Study of Kessler’s Psychological Distress Scales Conducted Among Patients Admitted to French Emergency Department for Alcohol Consumption–Related Disorders. Alcohol Clin Exp Res 34(7): 1235–1245.
Donker T, Comijs H, Cuijpers P, Terluin B, Nolen W, Zitman F, Penninx B (2010): The validity of the Dutch K10 and extended K10 screening scales for depressive and anxiety disorders. Psychiatry Research 176: 45–50.
Kessler RC, Andrews G, Colpe LJ, Hiripi E, Mroczek DK, Normand SLT, Walters EE, Zaslavsky AM (2002): Short screening scales to monitor population prevalences and trends in non-specific psychological distress. Psychological Medicine 32(6):959-76
Kessler RC, Barker PR, Colpe LJ, Epstein JF, Gfroerer JC, Hiripi E, Howes MJ, Normand S-LT, Manderscheid RW, Walters EE, Zaslavsky AM: (2003): Screening for serious mental illness in the general population. Arch Gen Psychiatry 60(2):184-189
Jorm AF, Butterworth P (2006): Changes in psychological distress in Australia over an 8-year period: evidence for worsening in young men. Australian & New Zealand Journal of Psychiatry. 40(1):47-50.
Mond JJ; Hay PJ, Rodgers B, Owen C, Mitchell J (2006): Correlates of the use of purging and non-purging methods of weight control in a community sample of women. Australian & New Zealand Journal of Psychiatry. 40(2):136-142. Osborne RH, Buchbinder R, Ackerman IN (2006): Can a disease-specific education program augment self-management skills and improve Health-Related Quality of Life in people with hip or knee osteoarthritis? BMC Musculoskelet Disord. 7: 90.

iCAHE Chronic Disease Outcomes Calculator: User Manual
75
Kessler Psychological Distress Scale
The following questions ask about how you have been feeling over the past 30 days. For each question, mark the circle under the option that best describes the amount of time you felt that way. None
of the time
A little of the time
Some of the time
Most of the time
All of the time
1. During the last 30 days, about how often did you feel tired out for no good reason?
2. During the last 30 days, about how often did you feel nervous?
3. During the last 30 days, about how often did you feel so nervous that nothing could calm you down?
4. During the last 30 days, about how often did you feel hopeless?
5. During the last 30 days, about how often did you feel restless or fidgety?
6. During the last 30 days, about how often did you feel so restless you could not sit still?
7. During the last 30 days, about how often did you feel depressed?
8. During the last 30 days, about how often did you feel that everything was an effort?
9. During the last 30 days, about how often did you feel so sad that nothing could cheer you up?
10. During the last 30 days, about how often did you feel worthless?
iCAHE Chronic Disease Outcomes Calculator: User Manual
76
Chapter 5: Diabetes Scales 5.1. Glycated Hemoglobin Test Background The Glycated Hemoglobin Test (often called the glycosylated hemoglobin test) or hemoglobin (A1C) is a measurement of the overall control of the diabetic for the previous two to three months. It measures how much glucose is attached to hemoglobin cells. As the hemoglobin floats around in the blood, it picks up glucose in about the same proportion as the glucose that exists in the bloodstream. If the blood glucose is generally running high, the hemoglobin will have more "glucose coating" (glycosylization). If the glucose generally runs low, it will have less. Since the red blood cells have about a two to three month life span in the body before they are recycled, the "glucose coating" of a sample of hemoglobin can be measured. This gives an approximate average of glucose control over the last two to three month period. Interpretation A 1% change in an A1C result reflects a change of about 30 mg/dL (1.67 mmol/L) in average blood glucose. For example, an A1C of 6% corresponds to an average glucose of 135 mg/dL (7.5 mmol/L), while an A1C of 9% corresponds to an average glucose of 240 mg/dL (13.5 mmol/L). The closer a diabetic can keep their A1C to 6%, the better their diabetes is controlled. As the A1C increases, so does the risk of complications. Sensitivity and predictive Value With two-hour plasma glucose as a reference, the sensitivities of glycosylated hemoglobin, fasting plasma glucose, and a combination of glycosylated hemoglobin and fasting plasma glucose equal, respectively, 60.0%, 52.0%, and 40.0%; the specificities 90.9%, 98.7%, and 99.4%; and the predictive value for a positive diagnosis is 34.9%, 76.5%, and 83.3% (Simon et al 1985). References www.labtestsonline.org/understanding/analytes/a1c/test.html Simon D, Coignet M, Thibult N, Senan C, Eschwege E (1985): Comparison Of Glycosylated Hemoglobin And Fasting Plasma Glucose With Two-Hour Post-Load Plasma Glucose In The Detection Of Diabetes Mellitus. American Journal of Epidemiology; 122(4): 589-593. The Diabetes Control and Complications Trial Research Group (1993): The effect of intensive treatment of diabetes on the development and progression of long-term complications in insulin-dependent diabetes mellitus. N Engl J Med;329:977–86.
iCAHE Chronic Disease Outcomes Calculator: User Manual
77
5.2. Problem Areas in Diabetes Questionnaire Background The Problem Areas in Diabetes (PAID) questionnaire is a measure of diabetes-specific emotional distress that was developed by the Joslin Diabetes Center, Boston. This self-administered questionnaire consists of 20 items that cover a range of emotional problems (including guilt, anger, depressed mood, worry, and fear) frequently reported in type 1 and type 2 diabetes. Measurement and scoring Patients are asked to rate the degree to which each item was currently problematic for them on a 5-point Likert Scale. The responses are given a value from 0-4:
0 not a problem 1 minor problem 2 moderate problem 3 somewhat serious problem 4 serious problem
The raw score can be calculated as the sum of the responses to all 20 items then multiplied by 1.25 to produce a total score that ranges from 0-100. Interpretation No cut-off scores are provided, although lower scores indicate lower emotional distress. Validity, reliability and internal consistency Psychometric reports to date on the PAID have shown it to: (i) have consistently high internal reliability (i.e. a = 0.90); (ii) have sound (r = 0.83) 2-month test–retest reliability using a sample of stable patients; (iii) to correlate strongly with a wide range of theoretically related constructs such as general emotional distress, depression, diabetes self-care behaviours, diabetes coping, and health beliefs; and (iv) to be a statistically significant predictor of glycaemic control in a study that tracked a managed care population control for 1 year.
The Norwegian versions of the Problem Areas in Diabetes Scale have satisfactory psychometric properties and can be used to map diabetes-related emotional distress for diagnostic or clinical use (Graue et al. 2012). The Chinese version, PAID-C, is also found to be a reliable and valid measure to determine diabetes related emotional distress in Chinese people with type 2 diabetes (Huang et al. 2010). References
Graue M, Haugstvedt A, Wentzel-Larsen T, Iversen MM, Karlsen B, Rokne B (2012): Diabetes-related emotional distress in adults: Reliability and validity of the Norwegian versions of the Problem Areas in Diabetes Scale (PAID) and the Diabetes Distress Scale (DDS). International Journal of Nursing Studies 49:174–182.
Huang MF, Edwrds H, Courtney M, McDowell J (2010): Validation of the Chinese Version of the Problem Areas in Diabetes (PAID-C) Scale. Diabetes Care 33:38–40. Polonsky WH, Anderson BJ, Lohrer PA, Welch G, Jacobson AM, Aponte JE, Schwartz CE (1995): Assessment of diabetes-related distress. Diabetes Care;18:754-60.

iCAHE Chronic Disease Outcomes Calculator: User Manual
78
van der Ven N, Weinger K, Yi Joyce, Pouwer F, Ader H, van der Ploeg HM, Snoek FJ (2003): The confidence in diabetes self care scale: Psychometric properties of a new measure of diabetes-specific self-efficacy in Dutch and US patients with type 1 diabetes. Diabetes Care;26(3): 713-718. Welch GW, Jacobson AM, Polonsky WH (1997): The Problem Areas in Diabetes Scale: An evaluation of its clinical utility. Diabetes Care; 20(5):760-766.
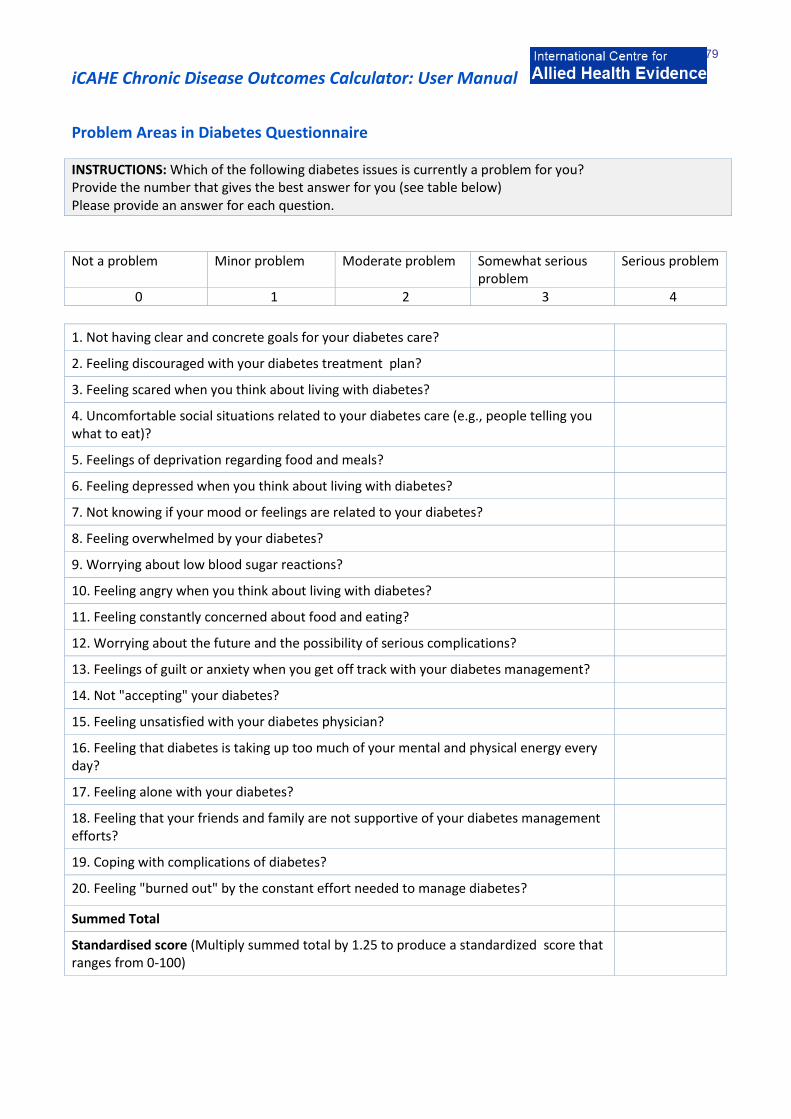
iCAHE Chronic Disease Outcomes Calculator: User Manual
79
Problem Areas in Diabetes Questionnaire
INSTRUCTIONS: Which of the following diabetes issues is currently a problem for you? Provide the number that gives the best answer for you (see table below) Please provide an answer for each question.
Not a problem Minor problem Moderate problem Somewhat serious
problem Serious problem
0 1 2 3 4
1. Not having clear and concrete goals for your diabetes care?
2. Feeling discouraged with your diabetes treatment plan?
3. Feeling scared when you think about living with diabetes?
4. Uncomfortable social situations related to your diabetes care (e.g., people telling you what to eat)?
5. Feelings of deprivation regarding food and meals?
6. Feeling depressed when you think about living with diabetes?
7. Not knowing if your mood or feelings are related to your diabetes?
8. Feeling overwhelmed by your diabetes?
9. Worrying about low blood sugar reactions?
10. Feeling angry when you think about living with diabetes?
11. Feeling constantly concerned about food and eating?
12. Worrying about the future and the possibility of serious complications?
13. Feelings of guilt or anxiety when you get off track with your diabetes management?
14. Not "accepting" your diabetes?
15. Feeling unsatisfied with your diabetes physician?
16. Feeling that diabetes is taking up too much of your mental and physical energy every day?
17. Feeling alone with your diabetes?
18. Feeling that your friends and family are not supportive of your diabetes management efforts?
19. Coping with complications of diabetes?
20. Feeling "burned out" by the constant effort needed to manage diabetes?
Summed Total
Standardised score (Multiply summed total by 1.25 to produce a standardized score that ranges from 0-100)
iCAHE Chronic Disease Outcomes Calculator: User Manual
80
5.3. Perceived Diabetes and Dietary Competence Scale Background The Perceived Diabetes and Dietary Competence Scale (PDDC) was developed to measure perceived health competence adapted to the diabetes context and overall competence in dietary self-management. Underlying constructs in the measures of perceived health competence and diabetes empowerment were used as the theoretical basis for developing the initial set of PDDC items. Measurement and scoring The PDDC is a 20-item questionnaire consisting of 3 subscales (Positive competence, negative dietary competence and negative control), with response options based on 4-point Likert-scale, ranging from disagree a lot (1) to agree a lot (4). Subscale scores are the mean values after reversing the items worded in the negative. The higher the score (after reversing, if on a negative scale), the greater is the competence. Recording A separate recording sheet is provided to facilitate repeated measures over time. Comparison and interpretation The perceived dietary competence of diabetic patients is assessed on repeated occasions using this scale in order to obtain an understanding of any change in the status of the patient. Validity, reliability and internal consistency Developmental study results revealed coefficient alpha of 0.85-0.85, indicating a good internal reliability of the subscales. All PDDC subscales were significantly correlated with perceived health competence in the predicted directions. Correlations between the 3 PDDC scales and dietary self-efficacy were mostly significant – PDDC scales 1 and 2 are significantly related to dietary self-efficacy; scores for the 3 PDDC scales were all significantly related to self-efficacy scores across 5 diabetes regimen behaviours (composite score for behaviours related to testing blood glucose, performing foot care, taking diabetes medicine, following the right diet, and getting some physical activity). The observed relationship between subscale 3 and self-efficacy was weak but reached statistical significance (r=0.16, p<0.05). References Samuel-Hodge C, DeVellis R, Ammerman A, Keyserling T, Elasy T (2002): Reliability and Validity of a Measure of Perceived Diabetes and
Dietary Competence in African American Women with Type 2 diabetes. The Diabetes Educator; 28:979.
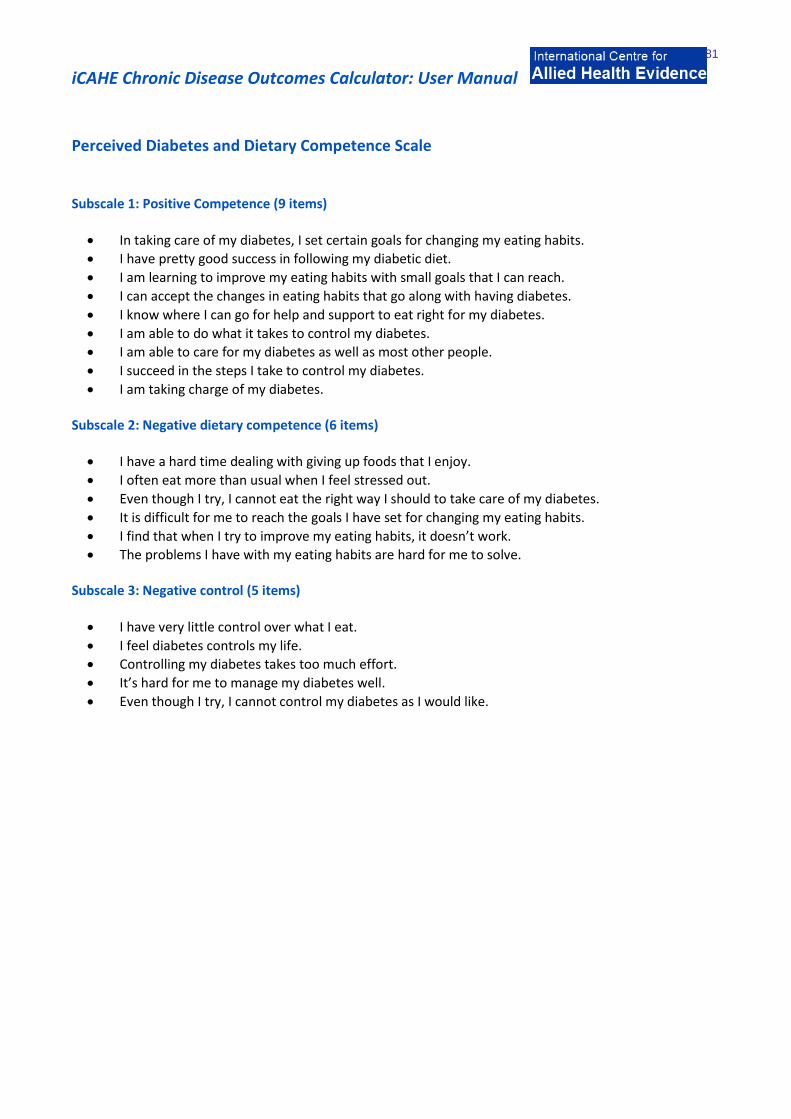
iCAHE Chronic Disease Outcomes Calculator: User Manual
81
Perceived Diabetes and Dietary Competence Scale Subscale 1: Positive Competence (9 items)
In taking care of my diabetes, I set certain goals for changing my eating habits.
I have pretty good success in following my diabetic diet.
I am learning to improve my eating habits with small goals that I can reach.
I can accept the changes in eating habits that go along with having diabetes.
I know where I can go for help and support to eat right for my diabetes.
I am able to do what it takes to control my diabetes.
I am able to care for my diabetes as well as most other people.
I succeed in the steps I take to control my diabetes.
I am taking charge of my diabetes. Subscale 2: Negative dietary competence (6 items)
I have a hard time dealing with giving up foods that I enjoy.
I often eat more than usual when I feel stressed out.
Even though I try, I cannot eat the right way I should to take care of my diabetes.
It is difficult for me to reach the goals I have set for changing my eating habits.
I find that when I try to improve my eating habits, it doesn’t work.
The problems I have with my eating habits are hard for me to solve. Subscale 3: Negative control (5 items)
I have very little control over what I eat.
I feel diabetes controls my life.
Controlling my diabetes takes too much effort.
It’s hard for me to manage my diabetes well.
Even though I try, I cannot control my diabetes as I would like.
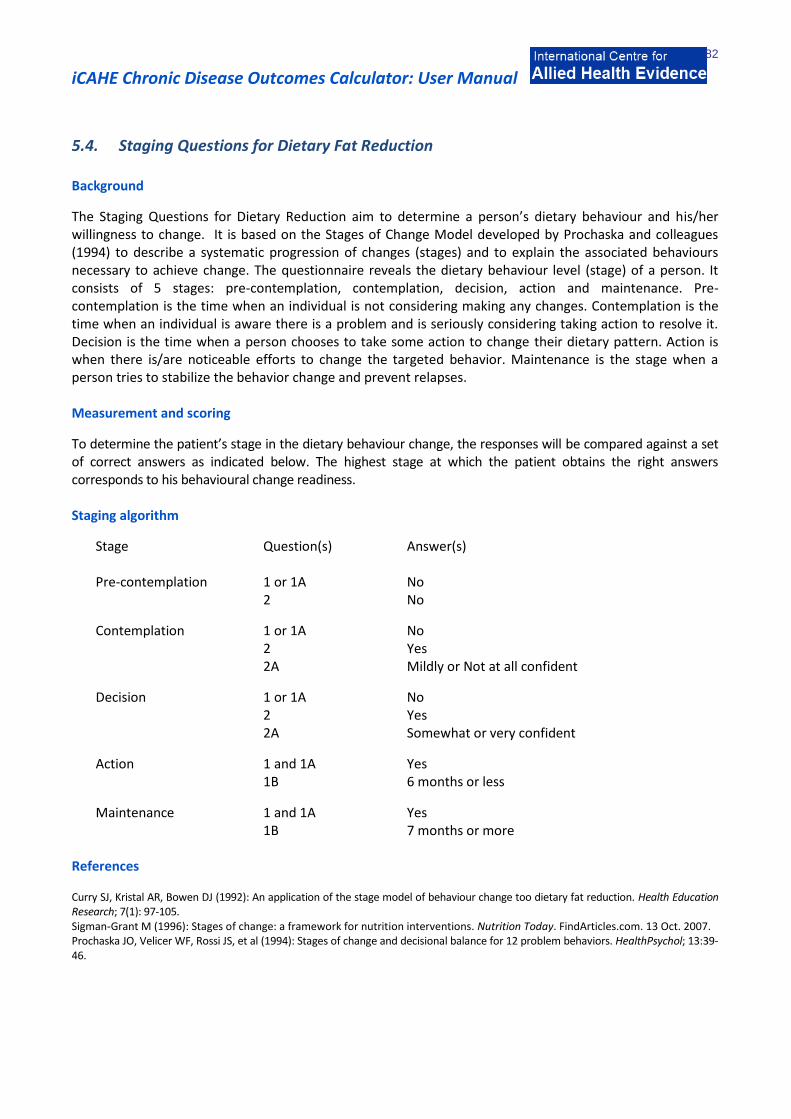
iCAHE Chronic Disease Outcomes Calculator: User Manual
82
5.4. Staging Questions for Dietary Fat Reduction Background
The Staging Questions for Dietary Reduction aim to determine a person’s dietary behaviour and his/her willingness to change. It is based on the Stages of Change Model developed by Prochaska and colleagues (1994) to describe a systematic progression of changes (stages) and to explain the associated behaviours necessary to achieve change. The questionnaire reveals the dietary behaviour level (stage) of a person. It consists of 5 stages: pre-contemplation, contemplation, decision, action and maintenance. Pre-contemplation is the time when an individual is not considering making any changes. Contemplation is the time when an individual is aware there is a problem and is seriously considering taking action to resolve it. Decision is the time when a person chooses to take some action to change their dietary pattern. Action is when there is/are noticeable efforts to change the targeted behavior. Maintenance is the stage when a person tries to stabilize the behavior change and prevent relapses. Measurement and scoring
To determine the patient’s stage in the dietary behaviour change, the responses will be compared against a set of correct answers as indicated below. The highest stage at which the patient obtains the right answers corresponds to his behavioural change readiness. Staging algorithm
Stage Question(s) Answer(s) Pre-contemplation 1 or 1A No 2 No
Contemplation 1 or 1A No 2 Yes 2A Mildly or Not at all confident
Decision 1 or 1A No 2 Yes 2A Somewhat or very confident
Action 1 and 1A Yes 1B 6 months or less
Maintenance 1 and 1A Yes 1B 7 months or more
References Curry SJ, Kristal AR, Bowen DJ (1992): An application of the stage model of behaviour change too dietary fat reduction. Health Education Research; 7(1): 97-105. Sigman-Grant M (1996): Stages of change: a framework for nutrition interventions. Nutrition Today. FindArticles.com. 13 Oct. 2007. Prochaska JO, Velicer WF, Rossi JS, et al (1994): Stages of change and decisional balance for 12 problem behaviors. HealthPsychol; 13:39-46.
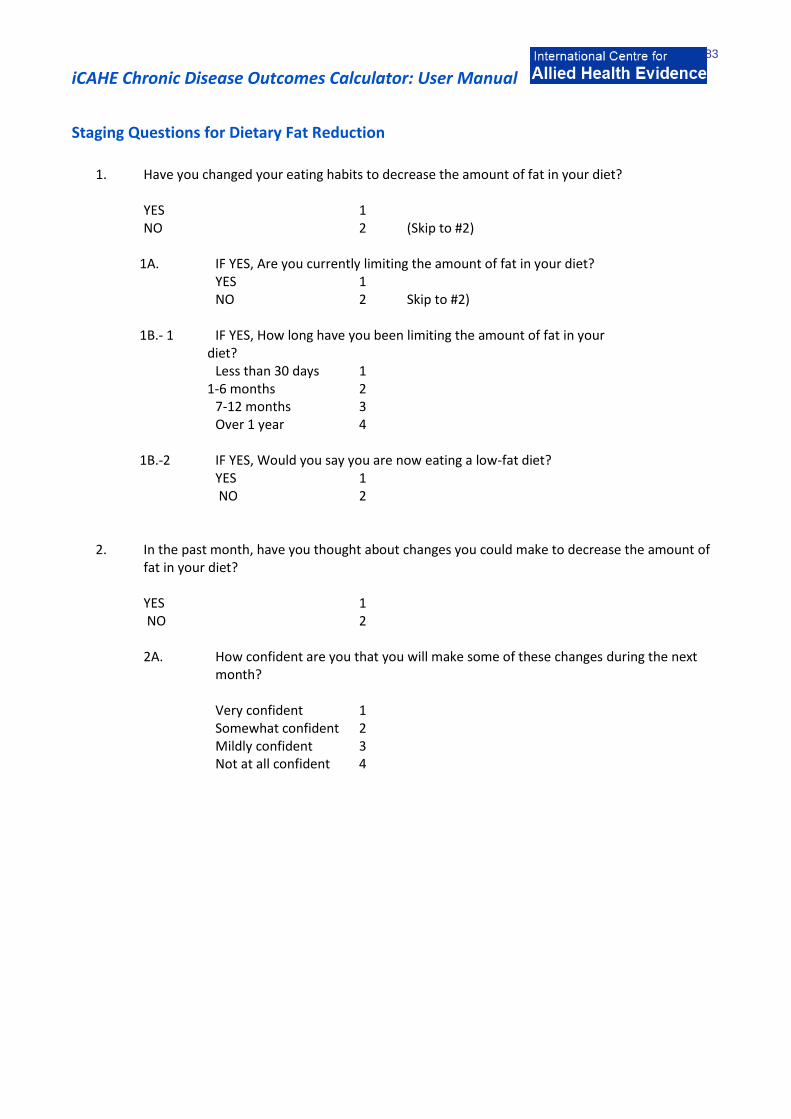
iCAHE Chronic Disease Outcomes Calculator: User Manual
83
Staging Questions for Dietary Fat Reduction
1. Have you changed your eating habits to decrease the amount of fat in your diet?
YES 1 NO 2 (Skip to #2) 1A. IF YES, Are you currently limiting the amount of fat in your diet? YES 1 NO 2 Skip to #2) 1B.- 1 IF YES, How long have you been limiting the amount of fat in your diet? Less than 30 days 1 1-6 months 2 7-12 months 3 Over 1 year 4 1B.-2 IF YES, Would you say you are now eating a low-fat diet? YES 1 NO 2 2. In the past month, have you thought about changes you could make to decrease the amount of
fat in your diet? YES 1 NO 2
2A. How confident are you that you will make some of these changes during the next month?
Very confident 1 Somewhat confident 2 Mildly confident 3 Not at all confident 4

iCAHE Chronic Disease Outcomes Calculator: User Manual
84
Chapter 6: Quality of Life Scales 6.1. RAND-36 Background
The RAND-36 is a widely used health-related quality of life survey instrument which contains eight dimensions of health, namely, physical functioning, social functioning, role limitations (physical problem), role limitations (emotional problem), mental health, vitality, pain and general health perception. The RAND is comprised of 36 items selected from a larger pool of items used in the RAND Medical Outcomes Study. It assesses eight health concepts with multi-item scales (35 items): physical functioning (10 items), role limitations caused by physical health problems (4 items), role limitations caused by emotional problems (3 items), social functioning (2 items), emotional wellbeing (5 items), energy/fatigue (4 items), pain (2 items), and general health perceptions (5 items). An additional single item assesses change in perceived health during the last 12 months. Scoring
Scoring of RAND-36 involves transforming every item linearly to a 0-100 possible range (percent of total possible score) and then averaging all items in the same scale together. Below is a scale that can be used to convert scores.
Item Numbers Original Response Recorded Value 1, 2, 20, 22, 34, 36 1 100
2 75
3 50
4 25
5 0
Item Numbers Original Response Recorded Value 3, 4, 5, 6, 7, 8, 9, 10, 11, 12 1 0
2 50
3 100
Item Numbers Original Response Recorded Value 13, 14, 15, 16, 17, 18, 19 1 0
2 100
Item Numbers Original Response Recorded Value 21, 23, 26, 27, 30 1 100
2 80
3 60
4 40
5 20
6 0
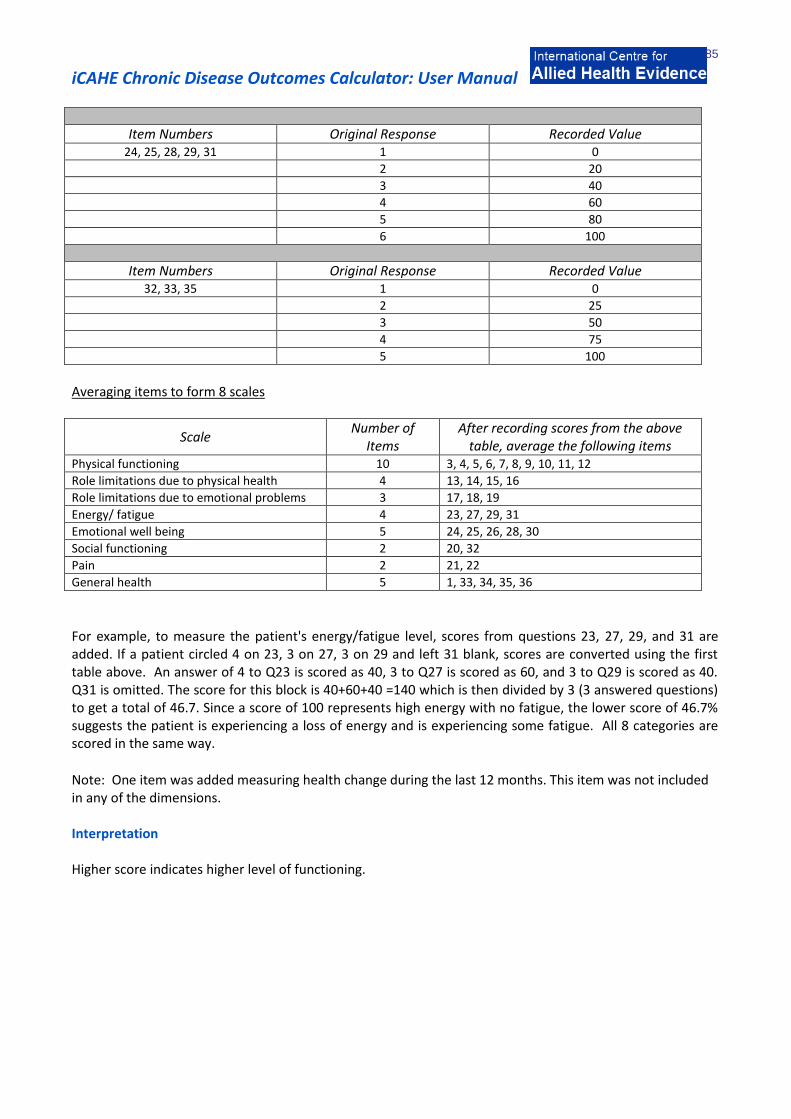
iCAHE Chronic Disease Outcomes Calculator: User Manual
85
Item Numbers Original Response Recorded Value 24, 25, 28, 29, 31 1 0
2 20
3 40
4 60
5 80
6 100
Item Numbers Original Response Recorded Value 32, 33, 35 1 0
2 25
3 50
4 75
5 100
Averaging items to form 8 scales
Scale Number of
Items After recording scores from the above
table, average the following items Physical functioning 10 3, 4, 5, 6, 7, 8, 9, 10, 11, 12
Role limitations due to physical health 4 13, 14, 15, 16
Role limitations due to emotional problems 3 17, 18, 19
Energy/ fatigue 4 23, 27, 29, 31
Emotional well being 5 24, 25, 26, 28, 30
Social functioning 2 20, 32
Pain 2 21, 22
General health 5 1, 33, 34, 35, 36
For example, to measure the patient's energy/fatigue level, scores from questions 23, 27, 29, and 31 are added. If a patient circled 4 on 23, 3 on 27, 3 on 29 and left 31 blank, scores are converted using the first table above. An answer of 4 to Q23 is scored as 40, 3 to Q27 is scored as 60, and 3 to Q29 is scored as 40. Q31 is omitted. The score for this block is 40+60+40 =140 which is then divided by 3 (3 answered questions) to get a total of 46.7. Since a score of 100 represents high energy with no fatigue, the lower score of 46.7% suggests the patient is experiencing a loss of energy and is experiencing some fatigue. All 8 categories are scored in the same way.
Note: One item was added measuring health change during the last 12 months. This item was not included in any of the dimensions. Interpretation Higher score indicates higher level of functioning.

iCAHE Chronic Disease Outcomes Calculator: User Manual
86
Validity, reliability and sensitivity VanderZee et al (1996) examined the psychometric properties of RAND-36 and found the internal consistency of the questionnaire to be high. Alpha values ranged from 0.71-0.93. The convergent and discriminant validity of the RAND-36 was largely supported by data. All the correlations between the corresponding scales of the RAND 36-Item Health Survey and corresponding scales from different instruments are significantly positive. Furthermore, on the whole, correlations between corresponding scales are higher than correlations between non-corresponding scales. In a more recent study by Moorer et al (2001), psychometric properties both of the total RAND-36 and of its subscales, such as uni-dimensionality, differential item functioning, homogeneity and reliabilities were examined. Data were collected from a Dutch population with different chronic illnesses such as multiple sclerosis, rheumatism or COPD. All subscales of the RAND-36 appeared to be uni-dimensional. For the subscales ‘mental health’ and ‘general health perceptions’ some minor indications of differential item function (DIF) for the different chronic illnesses were found. Reliabilities of almost all subscales in all subpopulations were higher than 0.80, while the homogeneities of almost all subscales in all subpopulations were higher than 0.50, indicating ‘strong uni-dimensional, hierarchical scales’. References Hays RD, Morales LS (2001): The RAND-36 measure of health-related quality of life. Annals of Medicine; 33: 350-357. Moorer P, Suurmeijer Th PBM, Molenaar PW (2001): Psychometric properties of the RAND-36 among three chronic diseases (multiple sclerosis, rheumatic diseases and COPD) in the Netherlands. Quality of Research; 10: 637-645. VanderZee KI, Sanderman R, Heyink J, de Haes H (1996): Psychometric Qualities of RAND 36-Item Health Survey 1.0: A Multidimensional Measure of General Health Status. International Journal of Behavioural Medicine; 3(2): 104-122.

iCAHE Chronic Disease Outcomes Calculator: User Manual
87
Chapter 7: Troubleshooting: using calculator data to assist in treatment decisions, quality improvement and casenote review
The data provided by the CAHE Outcomes Calculator allows practitioners to review patient progress throughout, and after completion of, an episode of care. It allows practitioners to consider actual response to treatment, compared with expected response. Expected response may come from an in-house review of clinical outcomes for specific conditions over a cohort of patients treated in the practice, or it could come from peer-developed benchmarks (what do other practices do?), or from the research literature (algorithms of outcome from clinical guidelines for instance). Take as an example of reflection on outcomes throughout an episode of care, the findings from repeated administration of the Oswestry Disability Index, used to measure outcome for a patient with low back pain (Figure 7.1).
Figure 71: Example of one patient’s progress throughout an episode
of care using the CAHE outcomes calculator
=What happened at this
assessment point to
increase the score?
This patient received five treatments for low back pain in an episode of care. The patient’s initial Oswestry score was high, indicating that they rated problems in most domains of the instrument. Improvement was noted throughout the first three treatments in the episode of care, by decreasing scores in repeated administrations of the Oswestry outcomes instrument. On the fourth treatment however, an increased score was found, indicating that the patient’s condition had worsened.
What could have happened to increase the outcomes score on the fourth visit? Perhaps as a result of good response to treatment in treatments 1-3, the therapist suggested returning to work, increasing exercises or increasing activities. These strategies may have resulted in a short-term worsened score. The much improved Oswestry Disability Index outcomes score on treatment 5 however may have resulted from changed treatment approaches following treatment 4 response, such as strategies to assist with remaining at work and reduce physical load, modifying exercises or activities and/ or providing additional treatment or a referral to another practitioner. Reflection on this episode of care outcome for quality improvement purposes should provide the practitioner with assurance that the patient benefited overall, and that a ‘glitch’ observed at treatment 4 was dealt with appropriately.
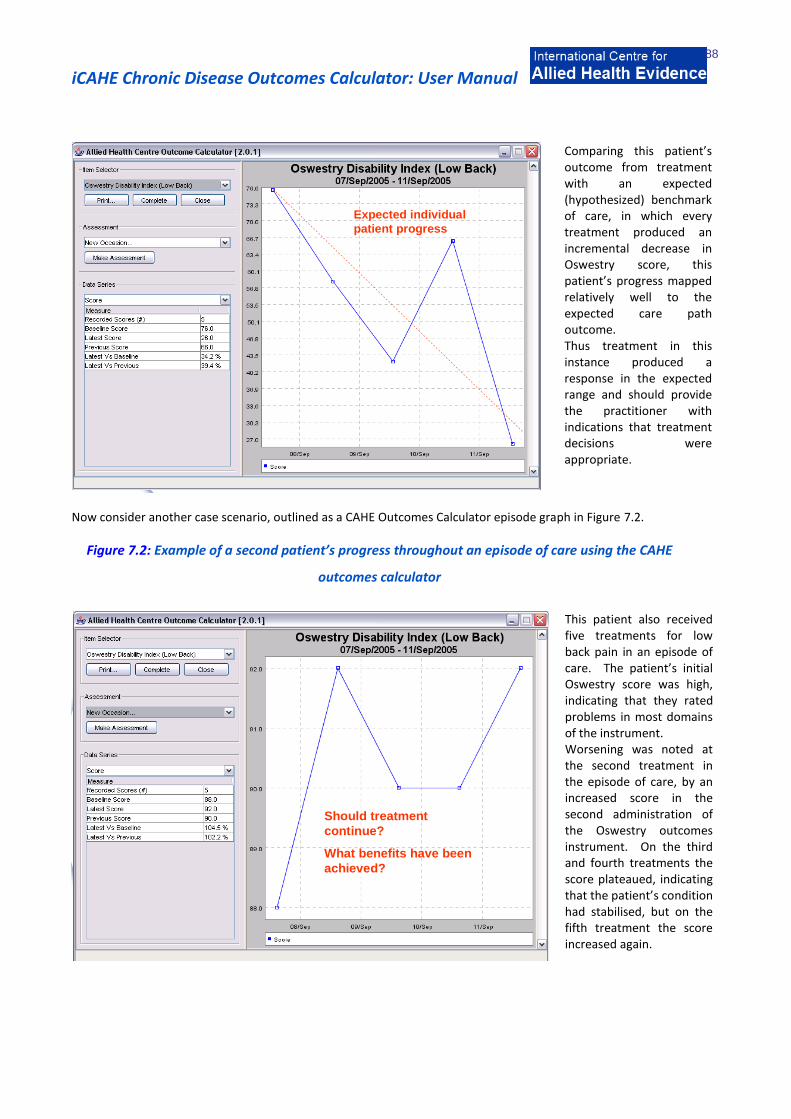
iCAHE Chronic Disease Outcomes Calculator: User Manual
88
Expected individual
patient progress
Comparing this patient’s outcome from treatment with an expected (hypothesized) benchmark of care, in which every treatment produced an incremental decrease in Oswestry score, this patient’s progress mapped relatively well to the expected care path outcome. Thus treatment in this instance produced a response in the expected range and should provide the practitioner with indications that treatment decisions were appropriate.
Now consider another case scenario, outlined as a CAHE Outcomes Calculator episode graph in Figure 7.2.
Figure 7.2: Example of a second patient’s progress throughout an episode of care using the CAHE
outcomes calculator
Should treatment
continue?
What benefits have been
achieved?
This patient also received five treatments for low back pain in an episode of care. The patient’s initial Oswestry score was high, indicating that they rated problems in most domains of the instrument. Worsening was noted at the second treatment in the episode of care, by an increased score in the second administration of the Oswestry outcomes instrument. On the third and fourth treatments the score plateaued, indicating that the patient’s condition had stabilised, but on the fifth treatment the score increased again.

iCAHE Chronic Disease Outcomes Calculator: User Manual
89
Considering the hypothesized progress of outcome scores throughout the episode of care, this patient’s progress did not map well. Improvement was only noted after one treatment, whilst worsening with treatment was noted on two occasions of treatment, and plateauing was noted on two treatments.
In this patient’s case, perhaps this practitioner’s treatment may be inappropriate for the presentation and alternative methods of management should be considered. Certainly this treatment should not continue without a thorough review of the patient’s risk factors for a good outcome, and the therapist’s clinical decision-making. Quality improvement and the CAHE Outcomes Calculator The advantages of the CAHE Outcomes Calculator are that it allows therapists and patients to quantify patient response to treatment using choices of standard outcome measures throughout the episode of care. The response to treatment can be measured at each contact, or at whatever treatment contact intervals are deemed to be appropriate for the condition and the likelihood of response. The response to treatment throughout the episode of care can be compared with expected progress, such as that reported in clinical guidelines, or outlined in clinical indicators (i.e. 60% patients will demonstrate at least 50% improvement in one outcome of care score after five treatments). Use of the quantitative measures of outcome in the CAHE Outcomes Calculator allow quantification of the influence of risk factors on patient outcome, for instance in the example of the second patient, a review of the patient’s clinical signs, therapists’ notes and yellow flags may indicate the reasons as to why this patient’s outcomes were poorer than expected. Use of the episode of care graphs also allow therapists to quantify the influence of different funding models on patient outcome, for instance to compare patients’ responses to treatments, when they are funded by a compensable funding system (such as WorkCover or Motor Accident Insurance) or when they are privately responsible for funding treatment. This data allows practitioners to reflect on why specific individuals did not comply with expected treatment outcomes, and may highlight poor practice, inappropriate benchmarks for specific patients or opportunities for improvement in diagnosis, risk factor identification or care processes.