ii a comparison of fatigue levels among malaysian
TRANSCRIPT

ii
A COMPARISON OF FATIGUE LEVELS AMONG MALAYSIAN SEAFARERS
OF DIFFERENT MARITIME SECTOR
ZAIMI BIN ZAINAL MUKHTAR
A dissertation submitted in partial fulfillment of the
requirements for the award of the degree of
Master of Engineering (Marine Technology)
Faculty of Mechanical Engineering
Universiti Teknologi Malaysia
MAY 2009

iv
To my great Father and Mother, my Dear Wife, my son and daughter whose prayers
always afforded me the power to accomplish this work. To all I dedicate this work
with great respect and love.

v
ACKNOWLEDGEMENT
First and foremost, I thank God Almighty for the love and strength for me to
overcome the hurdles and predicament in life and made me what I am today.
To Associate Professor Dr. Mohd Zamani Bin Ahmad, from the bottom of
my heart, thank you for your encouragement, guidance, critics and concerns. You
have inspired me in many ways. You made me realize that everything is possible.
Thank you for being a teacher, a father and brother to me.
Next, to my beloved wife Pn. Neirul Nisa, my loving kids Nauffal and
Qaisara and also my friends Kamarul Nasser, Shamsul Effendi and Asmawi, thank
you so much for loving and helping me and always being there for me. You have
refreshed me, comforted me and being by my side, all the way discovering my true
self. I love you all so much.
To my friends, thank you for a beautiful friendship. It was a bittersweet
experience and I hope it will last forever. Last but not least, to every one who
participate and contribute directly or indirectly in completing this study. Thank you.
vi
ABSTRACT
This report is to identify the sources of fatigue and fatigue levels of Malaysian
seafarers for different maritime sectors. The objective is to determine the sources of
fatigue among seafarers from different sectors. Questionnaires are used to collect
field data and then analyze using SPSS and MiniTAB. From the analysis, it was
found that fatigue problem is caused by two main factors which are shift of work
and seafarers’ working environment. The result proves the two factors caused
fatigue to seafarers from different sectors where the score of mean for group of
seafarers who work in Port (Mean=3.52 and 4.12), Coastal Container (Mean=3.80
and 3.61), Foreign-Tanker (Mean = 4.05 and 3.91) and Foreign-LNG (Mean =4.05
and 3.85) were classified as high score. Technology used onboard ship is one of the
factor to take into consideration as a tool to overcome the fatigue problem at sea.
The finding shows that respondents in Port (Mean =3.74), Coastal-Container (Mean
=4.11), Foreign-Tanker (Mean = 4.14) and Foreign-LNG (Mean = 3.87) mostly
agreed on the effect of technology at sea based on the high mean score.

vii
ABSTRAK
Laporan ini adalah mengenai kajian statistik terhadap sumber kepada
kelesuan dan tahap kelesuan yang dihadapi oleh pelayar-pelayar Malaysia di dalam
sector maritim yang berbeza. Objektif kajian adalah untuk menentukan sumber
kelesuan bagi kumpulan pelayar yang berlainan sektor. Kaedah soal selidik telah
digunakan bagi mendapatkan data lapangan dan dianalisa dengan menggunakan
SPSS serta perisian MiniTAB. Daripada analisa yang dijalankan, telah didapati
bahawa kelesuan pelayar-pelayar Malaysia adalah disebabkan oleh dua faktor utama
iaitu kesesuaian masa aturan bekerja dan persekitaran tempat bekerja. Keputusan
membuktikan bahawa masalah kelesuan pelayar berpunca daripada dua faktor utama
tersebut dengan markah skor purata yang diperolehi bagi pelayar-pelayar yang
berkhidmat di sektor Pelabuhan (Mean = 3.52 dan 4.12), Kapal Kontena Persisir
(Mean= 3.80 dan 3.61), Kapal Tangki Antarabangsa (Mean =4.05 dan 3.91) dan
Kapal LNG Antarabangsa (Mean = 4.05 dan 3.85) diklasifikasikan sebagai tahap
skor tinggi. Faktor penggunaan teknologi di atas kapal perlu diambil kira dalam
membantu pelaut bagi mengurangkan kadar lesu di lautan. Dapatan kaji selidik
menunjukkan responden di perkhidmatan pelabuhan (Mean = 3.74), Kapal Kontena
Pesisir (4.11), Kapal Tangki Antarabangsa (4.14) dan Kapal LNG Antarabangsa
(Mean = 3.87) kebanyakannya bersetuju bahawa teknologi memberikan kesan
kepada masalah kelesuan berdasarkan skor purata yang tinggi.
viii
TABLE OF CONTENTS
TITLE` PAGE
SUPERVISOR’S DECLARATION i
TITLE PAGE ii
DECLARATION iii
DEDICATION iv
ACKNOWLEDGEMENT v
ABSTRACT vi
ABSTRAK vii
TABLE OF CONTENTS viii
LIST OF FIGURES xiii
LIST OF TABLES xvi
LIST OF NOMENCLATURE xvii
LIST OF APPENDICES xx
1 INTRODUCTION 1
1.1 Background of Study 1
1.2 Problem Statement 3
1.3 Objectives of Research 4
1.4 Scope of Research 4
1.5 Problem Identification 5
1.6 Thesis Organisation 5
1.6.1 Chapter 1 5
1.6.2 Chapter 2 6
ix
1.6.3 Chapter 3 6
1.6.4 Chapter 4 6
1.6.5 Chapter 5 7
1.6.6 Chapter 6 7
1.7 Summary 7
2 LITERATURE REVIEW 8
2.1 Introduction to Fatigue 8
2.2 Concept of Fatigue 10
2.3 Source of Fatigue 11
2.3.1 Crew-specific Factors 13
2.3.2 Management Factors (ashore and
aboard ship)
16
2.3.2.1 Organizational Factors 16
2.3.2.2 Voyage and Scheduling
Factors
17
2.3.3 Ship-Specific Factors 17
2.3.4 Environmental Factors 18
2.4 Effect of Fatigue 19
2.4.1 Physically 21
2.4.2 Emotionally 21
2.4.3 Mentally 22
2.4.4 Performance 22
2.5 Measurement of Fatigue 23
2.6 Maritime Sector in Malaysia 25
2.7 Technology at Sea 27
x
3 RESEARCH METHODOLOGY 30
3.1 Introduction 30
3.2 Identification of Fatigue Source among
Malaysia Seafarers and Maritime Sectors
31
3.3 Development of Hypothesis 33
3.4 Research Instrument 34
3.4.1 Development of Questionnaires 34
3.5 Data Collection 35
3.6 Data Analysis 36
3.7 Data Distribution for Pilot Study 38
3.7.1 Consistency reliability with
Cronbach’s Alpha
38
4 RESULT AND ANALYSIS 40
4.1 Introduction 40
4.2 Demographics Study 41
4.2.1 Rank 41
4.2.2 Sector 42
4.2.3 Location of Work 43
4.2.4 Age 44
4.2.5 Fatigue Evidence According to Rank 45
4.3 Association of Fatigue with Demographic 46
4.3.1 Place of Work Assiciation with
Fatigue
47
4.4 Results on Fatigue Analysis among
Seafarers from Different Maritime Sectors
47
4.4.1 Analysis on Shift of Work by
Location of Work
48

xi
4.4.2 Analysis on Working Environment
by Location of Work
51
4.4.3 Analysis on Effect of Technology by
Location of Work
55
4.4.4 Analysis on Shift of Work by Sector 58
4.4.5 Analysis on Working Environment
by Sector
61
4.4.6 Analysis on Effect of Technology by
Sector
65
4.4.7 Comparison of Technology
Perception Among Maritime Sectors
68
4.4.8 Correlation Between Constructs 70
5 DISCUSSION 71
5.1 Validity of Question and Internal
Consistency Reliability with Cronbach’s
Alpha
72
5.2 Data Distribution 72
5.3 Discussion On Place of Work Association
with Fatigue
73
5.4 Discussion on Fatigue Analysis among
Seafarers from different Maritime Sector
73
5.4.1 Evidence of Fatigue of Seafarers 73
5.4.2 Discussion on Shift of Work by
Maritime Sector
75
5.4.3 Discussion on Working
Environment by Sector
75
5.4.4 Discussion on Effect of Technology 77
5.5 Discussion on ANNOVA & Correlation
Test
78
5.5.1 Annova Test 78
5.5.2 Correlation Test 79
xii
6 CONCLUSION AND RECOMMENDATION
6.1 Overview of the study 80
6.2 Restatement of the objective 81
6.3 Review of the finding 81
6.4 Recommendations and Suggestions 82
7 REFERENCES 81 – 86
8 Appendices 90
A Survey on Fatigue among Malaysian
Seafarers in Different Maritime Sector
B NUMAST Sample of Survey and Report
C Perception of Ship Technology
Questionnaire

xiii LIST OF FIGURES
FIGURE NO. TITLE PAGE
3.1 The flow chart of research methodology 31
4.1 Rank Distribution 42
4.2 Distribution by Sector 43
4.3 Distribution by Location of Work 44
4.4 Distribution by Age 45
4.5 Distribution of Mean Score for different Seafarers
Rank
46
4.6 Graphical Summary for Bridge (Construct 1) 49
4.7 Graphical Summary for Deck (Construct 1) 50
4.8 Graphical Summary for Engine Room (Construct 1) 50
4.9 Graphical Summary for Others (Construct 1) 51
4.10 Graphical Summary for Bridge (Construct 2) 53
4.11 Graphical Summary for Deck (Construct 2) 53
4.12 Graphical Summary for Engine Room (Construct 2) 54
4.13 Graphical Summary for Others(Construct 2) 54
4.14 Graphical Summary for Bridge (Construct 3) 56
4.15 Graphical Summary for Deck (Construct 3) 56
4.16 Graphical Summary for Engine Room (Construct 3) 57
4.17 Graphical Summary for Others (Construct 3) 57
4.18 Graphical Summary for Port (Construct 1) 59
4.19 Graphical Summary for Coastal (Construct 1) 60
4.20 Graphical Summary for Foreign Tanker (Construct 1) 60

xiv
4.21 Graphical Summary for Foreign LNG (Construct 1) 61
4.22 Graphical Summary for Port (Construct 2) 63
4.23 Graphical Summary for Coastal (Construct 2) 63
4.24 Graphical Summary for Foreign Tanker (Construct 2) 64
4.25 Graphical Summary for Foreign LNG (Construct 2) 64
4.26 Graphical Summary for Port (Construct 3) 66
4.27 Graphical Summary for Coastal (Construct 3) 67
4.28 Graphical Summary for Foreign Tanker (Construct 3) 67
4.29 Graphical Summary for Foreign LNG (Construct 3) 68
4.30 ANOVA Test Result for All Sector 69
4.31 ANOVA Tukey’s Test for Maritime Sectors on Effect
of Technology
69
4.32 Correlation Test Result for All Constructs
70

xv
LIST OF TABLES
TABLE NO. TITLE PAGE
2.1 Growth of MASA member fleet 26
3.1 Sample of Likert Scale 35
3.2 Level of mean score 37
3.3 Cronbach’s Alpha Value 38
4.1 Association of Location of Work with Fatigue 47
4.2 Mean and Standard Deviations for Construct: Shift of Work
49
4.3 Mean and Standard Deviations for Construct: Working Environment
52
4.4 Mean and Standard Deviations for Construct: Effect of Technology
55
4.5 Mean and Standard Deviations for Construct: Nature of Work / Shift
58
4.6 Mean and Standard Deviations for Construct: Location/Environment
62
4.7 Mean and Standard Deviations for Construct: Effect of Technology
65

xvi
LIST OF NOMENCLATURE
Abbreviation
α - Cronbach’s Alpha
μ - Mean
σ - Standard Deviation
ρ - Spearman’s rho

xvii
LIST OF APPENDICES
APPENDIX TITLE PAGE
A Survey on Fatigue among Malaysian Seafarers in
Different Maritime Sector
90
B NUMAST Sample of Survey and Report 90
C Perceptions of Ship Technology Questionnaires 90
CHAPTER 1
INTRODUCTION
1.1 Background of Study
It is often said in the industry that 70-80% of maritime accidents are attributable to
human error. What is less well known, however, is that in the majority of these cases, the
factor of which has consistently been identified as a major contributory link in the chain
of events leading to an accident, is fatigue. Because of this, it is important to continue
research into the causes and incidence of fatigue in seafarers (Reyner & Baulk, 1998).
Even though the chain of causation in marine accidents is long and complex, fatigue
has recurrently been identified as either the primary cause or a major contributory factor.
The same is true for near-misses and unsafe practices. Too many accidents result in loss
of life (as in the case of Herald of Free Enterprise) or major incidents of pollution (as in
the Exxon Valdez), as well as representing enormous costs to shipowners, shippers and
society in general. Widely publicised accidents, however, give just a small indication of
the many other incidents attributable to fatigue that go unreported (Reyner & Baulk,
1998).

2
From a report by the National Transportation Safety Board (1999) attempting to
address operator fatigue, seafarers were identified out of the occupational groups included
to have the second highest number of maximum work hours in a 30-day period, behind
rail operators. A study by the National Union of Marine Aviation and Shipping Transport
Officers (NUMAST, 1995) surveyed 1,000 officers; 77% felt that fatigue has significantly
risen in the past 3–10 years, 84% felt that stress was also more prevalent. A further study
by (NUMAST, 2001) surveyed 563 seafarers, 50% of whom indicated that they worked
more than 85 hours in a week and 66% felt that extra manning was necessary to reduce
fatigue. Results from a study of Australian seafarers revealed that 70% of seafarers report
poor to very poor sleep (Parker, et al., 2002).
The Nautical Institute represents about 7,000 members from more than 110
countries and it is from these members and others that we hear what a major concern
fatigue is. In the recent President’s questionnaire, 64 percent of respondents (the highest
level) reported that fatigue was their major concern (followed by manning, 60 per cent;
collision avoidance, 60 per cent and leadership, 54 per cent). Within the last year the
Institute has held five major international conferences in Norway, the UK, India (Mumbai
and Delhi) and Singapore, none of which were targeted at fatigue but in all of which
discussions quickly came round to the problem. Further reports come from MARS, letters
to Seaways, meetings and ship visits. Pilots are quick to recognize fatigue in vessels
arriving in port, with one reporting:
‘It is sometimes obvious that the master on a master-plus-one-mate coaster
is exhausted on occasion. This is exacerbated in poor weather. I have
boarded such vessels and it is not uncommon for the master to be resting
when the pilot boards or disappear soon afterwards, blatantly ignoring his
responsibilities. I could, of course, be argued that it is better he rests and is
available at a more critical point in the passage’(Patraiko, 2006).
However, House (1985) proposed that “most offshore accidents are due neither to
unfamiliar technology nor to particular hazardous weather and climatic conditions.
Rather, like accidents in other industries, they are due to human error and faulty
machinery and equipment” (p.32). Given that the advancements in technology offshore

3
has meant less equipment failures, the role of human error has become more apparent,
with safety experts now estimating that 80-90% of all industrial accidents can be
attributed to ‘human factors’ (Hoyos, 1995).
Early on, (Sutherland & Flin, 1989) proposed that the high offshore accident rate is
due to the conditions and pressures associated with offshore employment. Therefore, it
can be proposed that given the long working hours and demanding shift schedules, fatigue
is a major factor in the cause of many incidents in the offshore oil industry attributed to
human error (Collins, et al., 2000).
The desk study reported above suggests that fatigue may be a causal factor in
collisions and groundings in up to 11 to 23 percent of the cases. In 2003 the Ministry
commissioned an analysis of the reports by the Shipping Council. In this study it was
found that 'fatigue' was third (14%), after 'no watch' (22%) and 'no proper watch' (21%)
when main causes of groundings and collisions were concerned (Houtman, et al., 2005).
The MAIB (Marine Accident Investigation Branch; 2005) concluded in their annual
report that in 2004 there have been a worrying number of merchant ships involved in
collisions or near misses. It was stated that '…while the details of the accidents may vary,
the fundamentals remain depressingly consistent: fatigued crews, due to undermanning;
falsified hours of work records; no dedicated lookout on the bridge; and poor situational
awareness/anticipation/judgement by officers of the watch – classic symptoms of fatigue’
(Houtman, et. al, 2005).
1.2 Problem Statement
Previous researches on fatigue are only carried out in a worldwide range and
there has not been a research focusing on Malaysian seafarers. If there is one, it is not
systematically studying on the Malaysian seafarers’ fatigue. The study conducted by
Osman (2004) that discussed the issues and challenges of Malaysian Seafarers. But

4
his focal point is about the lack of human resource to cope with the expansion of
maritime industry, which is generally related to fatigue problem.
There’re also haven’t any study conducted in identifying the existence of fatigue
and its differences among Malaysian seafarers in different maritime sectors. Hence it is
appropriate to conduct this kind of study knowing the fact that Malaysia is in the track of
becoming one of a well known maritime country.
1.3 Objectives of Research
This study is conducted to accomplish these following objectives:-
i. To identify the sources of fatigue and fatigue level among Malaysian
seafarers
ii. To confirm the effect of technology to fatigue among seafarers.
1.4 Scope of Research
This research is carried out under these scopes:-
i. Analyses are based on demographic
ii. Research on various types of maritime sectors including offshore
sector, deep sea sector (container ships, tankers, bulkers) and near
coastal sectors including passenger liners.
iii. Research on implementation of technology onboard ships and the
effect to the fatigue issues.
5
1.5 Problem Identification
In order to ensure that this project can be carried out smoothly and finally
achieves its objectives, certain problems which are part of the project itself would have
to be identified. These are the problems, which require consideration of various
problems solving methodology in order to produce a reliable solution. The major
problems in this project have been identified as follows:
• The suitable approach to process and analyze the data and also the
suitable software to be used later.
• Obtaining the suitable sector to be surveyed for this project.
Consideration should be given to the fact that shipping industry in
Malaysia now is monopolizing by one or two major player. So that,
networking to this company must be initiated from the beginning of
the project to ensure the survey can be carried out.
• Identifying the right time to get the respondents which are very
difficult. It’s because of the unpredictable and tight schedule of the
Malaysian ship.
1.6 Thesis Organization
This report consists of six main chapters where each chapter will focus on the
relevant topics as follows:
1.6.1 Chapter 1
This is an introduction section where the background of the study will be
elaborated briefly. The objectives and the scope of research also will be stated clearly in
this chapter.

6
1.6.2 Chapter 2
For the purpose of understanding and knowing on the topic of the project in
details, this chapter will focus on theoretical and any findings which related to the
research topic. It is called as literature review. Clear information on fatigue such as
definition, concept, effect, sources, measurement and etc can be read in this chapter. For
better understanding, there are also a lot of readings on the maritime sector and brief
information on technologies at sea had been added in this chapter.
1.6.3 Chapter 3
This chapter presents the details of the research methodology where will be
focused on the processes of executing the project or study from drafting the
questionnaires, data collection, result processing and method of analysis. At the end of
this chapter, the analysis of pilot study also will be presented.
1.6.4 Chapter 4
In chapter 4, the final result where the evidence of the sources of fatigue is
shown. The details of analysis of the data and result will be presented in details. All
the figures, tables and chart which represent the analysis of the data will be shown and
the details description of the analysis will be given clearly in this chapter.

7
1.6.5 Chapter 5
Chapter 5 discusses the result which shown in previous chapter in detail. The
discussion to be made based on the result obtained in chapter 4. The arguments and
evidences on the results also will be discussed further in this chapter as well.
1.6.6 Chapter 6
Chapter 6 presents the overall conclusion and some recommendations for future
research. This chapter will formulate the findings and the objectives of the project. At
first, the objectives of the project will be reviewed and conclusions will be made based
on the outcomes of study. To reinforce the outcome of this project, some
recommendations were made at the end of this chapter where the proposed future
studies to be carried out.
1.7 Summary
This chapter actually presents of the need of this study. The objectives and the
scope of the study also clearly stated at the beginning of write up and it gives clearer
direction what sort of expected outcome to be achieved at the end of the project. The
scope of the study is also important as a direction to complete the study. The result must
be relevance and significant to the overall topic and objectives.

8
CHAPTER 2
LITERATURE REVIEW
2.1 Introduction to Fatigue
What is “fatigue”? In order to be scientifically sound, we will use the definition
found in the Department of Transportation’s (DOT) March 1999 policy statement on
fatigue: “a complex state characterized by a lack of alertness and reduced mental and
physical performance, often accompanied by drowsiness.” Fatigue certainly includes
lack of alertness (i.e., sleepiness), but also involves compromised attention to detail and
diminished ability to reason rapidly and clearly in order to respond to changing
circumstances (Boardman, 2007).
The technical use of the term fatigue is imprecise. Indeed, the variety of fatigue
inducing situations, time courses and outcomes suggests that it unlikely that we are
considering a single set of processes leading to a specific underlying state. This makes
integration of the existing literature very difficult. A person may feel fatigued,
performance may deteriorate and the body’s physiological functioning may be affected.

9
These three outcomes, subjective perceptions, performance and physiological
change are usually recognised as the core symptoms of acute fatigue. The condition is
usually recognised by the reporting of fatigue and the objective outcomes then assessed.
Estimates of the prevalence of fatigue will vary depending on which aspect of the
fatigue process one uses as the indicator of fatigue. For example, if one assumes that
doing shift work is a risk factor for fatigue one might simply use the number of workers
doing shift work as an indicator of prevalence.
However, this is based on the assumption that shift work automatically leads to
fatigue which one finds is not always the case. Similarly, fatigue may be measured by
the presence of negative outcomes, but the extent of the problem will often depend on
the indicator chosen. There is no single “right” approach: all aspects of the fatigue
process must be assessed and considered.
`Fatigue' is a generic term used to encompass a range of experiences described
as anything from `sleepy,' `tired,' or `exhausted' to `beat.' There are two major
physiological phenomena that have clearly been demonstrated to create `fatigue:' sleep
loss and circadian rhythm disruption (Transportation Safety Board of Canada, 1997).
There is no universally accepted technical definition for fatigue. However,
common to all the definitions is degradation of human performance (IMO, 2001).
“A reduction in physical and/or mental capability as the result of
physical, mental or emotional exertion which may impair nearly all
physical abilities including: strength; speed; reaction time;
coordination; decision making; or balance” (IMO, 2001).
According to the Patraiko (2006), a simple definition of fatigue could be: long
hours plus stress. If we accept that the seafaring profession has traditionally required
long hours to be worked, the causes of stress in our current environment need to be
examined.

10
Definitions of fatigue usually include the inability or disinclination to continue
an activity, generally because the activity has, in some way, been going on for “too
long”. This may be due to an earlier activity, exhausting resources that normally
recover. One can conceive of different kinds of fatigue, such as local physical fatigue
(e.g. in a skeletal muscle), general physical fatigue, mental fatigue (e.g. following
sustained attention due to a long-lasting high mental workload) or “central nervous”
fatigue (sleepiness). Thus, fatigue is often considered to be a generic term of which
sleepiness is one of the major sub-components. In a driving context, sleepiness and
mental fatigue are the most relevant fatigue components (Lützhöft et al., 2007).
2.2 Concept of Fatigue
Underlying this Project is a conceptualization of fatigue as a process. This
process begins with risk factors for fatigue (i.e. work characteristics and conditions
associated with fatigue), moves on to subjective perceptions of fatigue (i.e. how and
when an individual experiences and reports fatigue), and concludes with the
consequences of fatigue both in the short (symptoms of fatigue such as loss of
concentration; poor performance) and longer term (e.g. ill health). This process
approach has been suggested elsewhere in relation to work characteristics, fatigue and
ill health, and is analogous to the approach to stress widely used in studies of the
general working population. The work described here approached fatigue in this way
(Smith et al., 2006).
Both subjective and objective measures of fatigue were used, and these
measures have been compared. In terms of health, however, only subjective measures
were possible as seafarers identified at their medicals as having a chronic illness or
condition cannot continue to work at sea. The World Health Organization (WHO)
defines health as “a state of complete physical, mental and social well-being and not
merely the absence of disease or infirmity” (WHO). The measures used in this research
11
fit within this definition of health, and in this report the term “health” has been used in
this WHO defined sense. Furthermore, this focus on perceived ill health and well being
is supported by clear findings showing that reduced psychological well being can
increase the risk of some physical illness (Smith et al., 2006).
2.3 Source of Fatigue
Sleep is a vital physiological function. Like food and water, sleep is necessary
for survival. Sleepiness results when sleep loss occurs. Sleepiness is the brain's signal,
analogous to hunger or thirst, that sleep is needed. Sleep loss, as the term implies,
describes the phenomenon of getting less sleep than is needed for maximal waking
performance and alertness. If an individual normally needs 8 hr of sleep to feel
completely alert, and gets only 6 hr of sleep, 2 hr of sleep loss has been incurred. Sleep
loss over successive days accumulates into a sleep debt. If the individual needing 8 hr of
sleep gets only 6 hr a night for 4 nights in a row, an 8-hr sleep debt has been
accumulated (Transportation Safety Board of Canada, 1997).
Circadian rhythms are physiological and behavioral processes (e.g., sleep/wake,
digestion, hormone secretion, and activity) that oscillate on a 24-hour basis. Each
rhythm has a peak and a low point (nadir) during every 24-hr period. Time cues, called
zeitgebers, keep the circadian/body clock "set" to the appropriate time of day. Common
zeitgebers include bright light (e.g., sunlight) and work/rest schedules. If the circadian
clock is moved to a different schedule, for example when crossing time zones or
changing from a day- to a night-shift, the clock requires a certain amount of time to
adjust to the new schedule. This amount of time depends on many variables; for
example, the number of hours the schedule is shifted. During this transition, the
circadian rhythm disruption can produce effects similar to those of sleep loss. When
circadian disruption and sleep loss occur together, they can interact to compound their
adverse effects (Transportation Safety Board of Canada, 1997).

12
Fatigue can be hard to define and measure; it can incorporate many issues such
as work, boredom, circadian rhythms and the quality and quantity of rest. Lack of rest
and fatigue can accumulate; in fact long-term fatigue even within recommended work
hours is becoming more prevalent. Our manpower shortage in some sectors is leading to
longer sea terms due to the inability to find reliefs. Too many mariners, however, a
simple definition of fatigue could be: long hours plus stress. If we accept that the
seafaring profession has traditionally required long hours to be worked, the causes of
stress in our current environment need to be examined (Patraiko, 2006).
Fatigue may be caused or exacerbated by any or all of the following: lack of
sleep, disruptive work/rest cycles, neurological conditions, excess mental or physical
workload, exposure to extreme physical conditions, emotional stress, the use of drugs or
alcohol, illness, and/or monotony (Boardman, 2007). The most common causes of
fatigue known to seafarers are lack of sleep, poor quality of rest, stress and excessive
workload. There are many other contributors as well, and each will vary depending on
the circumstance (i.e. operational, environmental) (IMO, 2001).
The results of the research show that the potential for fatigue at sea is high due
to seafarers' exposure to a large number of recognizable risk factors, both operational
(E.g. port frequency), organisational (e.g. job support), and environmental (e.g. physical
hazards). But, it is the combined effect of these risk factors that is most strongly
associated with fatigue and its both short and long term consequences (fatigue
symptoms, personal risk and reduced health and well-being) (Smith et al., 2006).
There are many ways to categorize the causes of fatigue. To ensure
thoroughness and to provide good coverage of most causes, they have been categorized
into 4 general factors (IMO, 2001):
Crew-specific Factors
Management Factors (ashore and aboard ship)
Ship-specific Factors
Environmental Factors
13
2.3.1 Crew-specific Factors
The crew-specific factors are related to lifestyle behavior, personal habits and
individual attributes. However, fatigue varies from one person to another and its effects
are often dependent on the particular activity being performed (IMO, 2001).
The Crew-specific factors include the following (IMO, 2001):
Sleep and Rest
- Quality, Quantity and Duration of Sleep
• Only sleep can maintain or restore your performance level. When you do
not get enough sleep, fatigue will set in and your alertness will be
impaired (IMO, 2001).
- Sleep Disorders/Disturbances
• Fatigue may be caused by poor quality of sleep. This occurs when you
are unable to sleep without interruptions and/or you are unable to fall
asleep when your body tells you to (IMO, 2001).
• Disturbances while resting such as being woken up unexpectedly, on call
(during port operations), or unpredictable work hours (when arriving in
port) can cause fatigue (IMO, 2001).
- Rest Breaks
• Apart from sleep, rest (taking a break) between work periods can
contribute to restoring your performance levels. Insufficient rest periods
or postponing assigned rest times (to finish the job early) can cause
fatigue (IMO, 2001).
Biological Clock/Circadian Rhythms
Food (timing, frequency, content and quality)

14
• Refined sugars (sweets, doughnuts, chocolates, etc.) can cause your
blood sugar to rise rapidly to a high level. The downside of such short-
term energy is that a rapid drop in blood sugar can follow it. Low blood
sugar levels can cause weakness, instability and difficulty in
concentrating and in the extreme case unconsciousness. Eating large
meals prior to a sleep period may disrupt your sleep (IMO, 2001).
Psychological and Emotional Factors, including stress
- Fear
- Monotony and Boredom
• Boredom can cause fatigue. You may become bored to the point of
fatigue when your work is too easy, repetitive and monotonous and/or
bodily movement is restricted (IMO, 2001).
Health
- Diet
- Illness
• Medical conditions (i.e. heart problems) and illnesses, such as the
common cold, can cause or aggravate fatigue. The effect depends on the
nature of the illness or medical condition, but also the type of work being
carried out. For example, common colds slow response time and affect
hand-eye coordination (IMO, 2001).
Stress
• Stress can be caused by personal problems (family), problems with other
shipmates, long work hours, work in general, etc. A build up of stress
will cause or increase fatigue (IMO, 2001).
- Skill, knowledge and training as it relates to the job
- Personal problems
- Interpersonal relationships

15
Ingested Chemicals
• Alcohol, caffeine, Drugs and some over-the-counter medications disrupt
sleep. Caffeine consumption can also cause other side effects such as
hypertension, headaches, mood swings or anxiety (IMO, 2001).
Age
Shiftwork and Work Schedules
Workload (mental/physical)
• Working consistently “heavy” workloads can cause fatigue. Workload is
considered heavy when one works excessive hours or performs
physically demanding or mentally stressful tasks (IMO, 2001).
Jet Lag
• Jet-lag occurs following long flights through several time zones. It is a
condition that causes fatigue in addition to sleep-deprivation and
irritability. It is easier to adjust to time zones while crossing from east to
west as opposed to west to east. The greatest difficulty in adjustment
results from crossing 12 time zones, the least from crossing one time
zone. Our bodies adjust at the rate of approximately one-hour per day
(IMO, 2001).
• Everybody has peaks and low points during the 24-hour biological body
clock known as the circadian rhythm. There are two periods of low
alertness (low points) in each 24-hour time frame and they commonly
occur between 3-5am and 3-5pm. These lowest alertness periods are
followed by maximum alertness periods (peaks). The body clock is a tiny
cluster of nerve cells in the centre of the brain which relies on sunlight to
keep it synchronised with planetary time. It releases appropriate
hormones at the correct time of the day to keep you ‘alert’ in the daytime
and ‘sleepy’ at night. Body rhythms can become out of kilter because of
16
travel across multiple time zones and shift work schedules. It usually
takes one day for every time zone crossed for the body to adjust to the
new cues. The body is in a state of disrupted rhythm, until it catches up.
Some literature said 8 hours uninterrupted of sleep provides 100%
recovery (Folkard & Barton, 1993) but only seafarers at deck have a high
mean score meanwhile seafarers at bridge and engine room get medium
mean score for 6 hours uninterrupted rest while at sea.
2.3.2 Management Factors (ashore and aboard ship)
The Management Factors relate to how ships are managed and operated. These
factors can potentially cause stress and an increased workload, ultimately resulting in
fatigue. These factors include:
2.3.2.1 Organizational Factors
Staffing policies and Retention
Role of riders and shore personnel
Paperwork requirements
Economics
Schedules-shift, Overtime, Breaks
Company culture and Management style
Rules and Regulations
Resources
Upkeep of vessel
Training and Selection of crew
17
2.3.2.2 Voyage and Scheduling Factors
Frequency of port calls
Time between ports
Routing
Weather and Sea condition on route
Traffic density on route
Nature of duties/workload while in port
Some maritime watch scheduling systems have been found to increase fatigue
and therefore accidents, more than others. A common shift system is the 6 hours on, 6
hours off schedule used on board the ill-fated oil tanker Exxon Valdez that ran aground
in 1989. It has been estimated that during the 24 hours prior to the accident, the
watchkeeper only obtained approximately 5 or 6 hours sleep, taken in two separate
periods: fatigue was therefore suggested to be a contributory factor in the incident
(Collins et al., 2000).
2.3.3 Ship-specific Factors
These factors include ship design features that can affect/cause fatigue. Some
ship design features affect workload (i.e. automation, equipment reliability), some affect
the crew’s ability to sleep, and others affect the level of physical stress on the crew (i.e.
noise, vibration, accommodation spaces, etc.). The following list details ship-specific
factors (IMO, 2001):
Ship design
Level of Automation
Level of Redundancy
Equipment reliability

18
Inspection and Maintenance
Age of vessel
Physical comfort in work spaces
Location of quarters
Ship motion
The ship’s movement affects your ability to maintain physical balance.
Maintaining balance requires extra energy, which can then cause fatigue. A ship’s
pitching and rolling motions mean you might have to use 15-20% extra effort to
maintain your balance. (IMO, 2001)
2.3.4 Environmental Factors
Exposure to excess levels of environmental factors, e.g. temperature, humidity,
excessive noise levels, can cause or affect fatigue. Long-term exposure may even cause
harm to a person’s health. Furthermore, considering that environmental factors may
produce physical discomfort, they can also cause or contribute to the disruption of sleep
(IMO, 2001).
Ship motion is also considered an environmental factor. Motion affects a
person’s ability to maintain physical balance. This is due to the extra energy expended
to maintain balance while moving, especially during harsh sea conditions. There is a
direct relation between a ship’s motion and a person’s ability to work. Excessive ship
movement can also cause nausea and motion sickness (IMO, 2001).
Environmental factors can also be divided into factors external to the ship and
those internal to the ship. Within the ship, the crew is faced with elements such as noise,

19
vibration and temperature (heat, cold, and humidity). External factors include port and
weather condition and vessel traffic (IMO, 2001).
Noise or vibration can affect your ability to sleep/rest, and it can affect your
level of physical stress, thus causing fatigue (IMO, 2001).
There are a number of things that can be done to address these causes. Some
contributors are more manageable than others. Opportunities for implementing
countermeasures vary from one factor to another (noise can be better addressed during
the vessel design stage, breaks can be addressed by the individual crew member,
training and selection of the crew can be addressed during the hiring process, etc.)
(IMO, 2001).
2.4 Effect of Fatigue
When extreme, fatigue can cause uncontrolled and involuntary shutdown of the
brain. That is, regardless of motivation, professionalism, training, or pay, an individual
who is extremely sleepy can lapse into sleep at any time, despite the potential
consequences of inattention. Transportation incidents and accidents involving fatigue
provide dramatic examples of this fact (Transportation Safety Board of Canada, 1997).
Alertness is the optimum state of the brain that enables us to make conscious
decisions. Fatigue has a proven detrimental effect on alertness this can be readily seen
when a person is required to maintain a period of concentrated and sustained attention,
such as looking out for the unexpected (e.g. night watch) (Sandquist et al., 1996).
The negative effects of one night of sleep loss are compounded by subsequent
sleep loss. Sleep loss and the resultant sleepiness can degrade most aspects of human
performance. In the laboratory, it has been demonstrated that losing as little as 2 hr of
20
sleep can negatively affect alertness and performance. Performance effects can include:
degraded judgment, decision-making, and memory; slowed reaction time; lack of
concentration; fixation; and worsened mood. The brain is programmed for two periods
of maximal sleepiness every 24 hr: (about) 3-5 am and 3-5 p.m (Transportation Safety
Board of Canada, 1997).
The research has also shown that the consequences of fatigue are not only felt in
terms of impaired performance and reduced safety but decreased wellbeing and
increased risk of mental health problems, also known to be risk factors for future
chronic disease (Smith et al., 2006).
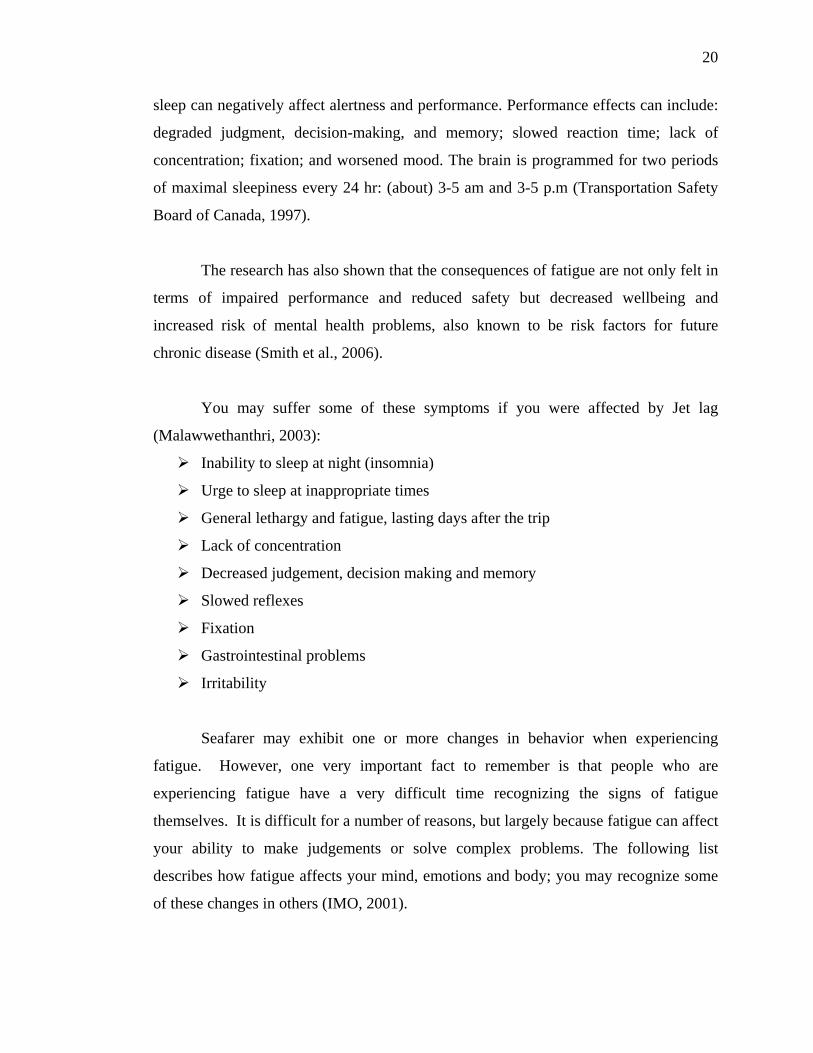
You may suffer some of these symptoms if you were affected by Jet lag
(Malawwethanthri, 2003):
Inability to sleep at night (insomnia)
Urge to sleep at inappropriate times
General lethargy and fatigue, lasting days after the trip
Lack of concentration
Decreased judgement, decision making and memory
Slowed reflexes
Fixation
Gastrointestinal problems
Irritability
Seafarer may exhibit one or more changes in behavior when experiencing
fatigue. However, one very important fact to remember is that people who are
experiencing fatigue have a very difficult time recognizing the signs of fatigue
themselves. It is difficult for a number of reasons, but largely because fatigue can affect
your ability to make judgements or solve complex problems. The following list
describes how fatigue affects your mind, emotions and body; you may recognize some
of these changes in others (IMO, 2001).
21
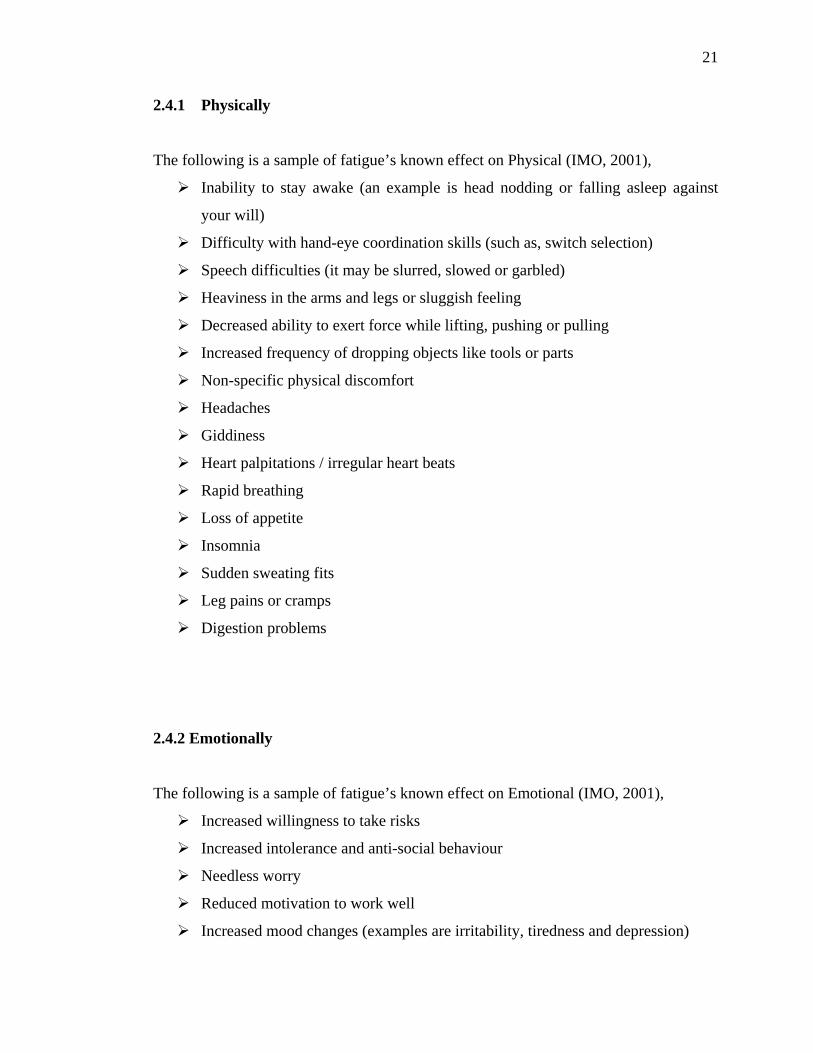
2.4.1 Physically
The following is a sample of fatigue’s known effect on Physical (IMO, 2001),
Inability to stay awake (an example is head nodding or falling asleep against
your will)
Difficulty with hand-eye coordination skills (such as, switch selection)
Speech difficulties (it may be slurred, slowed or garbled)
Heaviness in the arms and legs or sluggish feeling
Decreased ability to exert force while lifting, pushing or pulling
Increased frequency of dropping objects like tools or parts
Non-specific physical discomfort
Headaches
Giddiness
Heart palpitations / irregular heart beats
Rapid breathing
Loss of appetite
Insomnia
Sudden sweating fits
Leg pains or cramps
Digestion problems
2.4.2 Emotionally
The following is a sample of fatigue’s known effect on Emotional (IMO, 2001),
Increased willingness to take risks
Increased intolerance and anti-social behaviour
Needless worry
Reduced motivation to work well
Increased mood changes (examples are irritability, tiredness and depression)
22
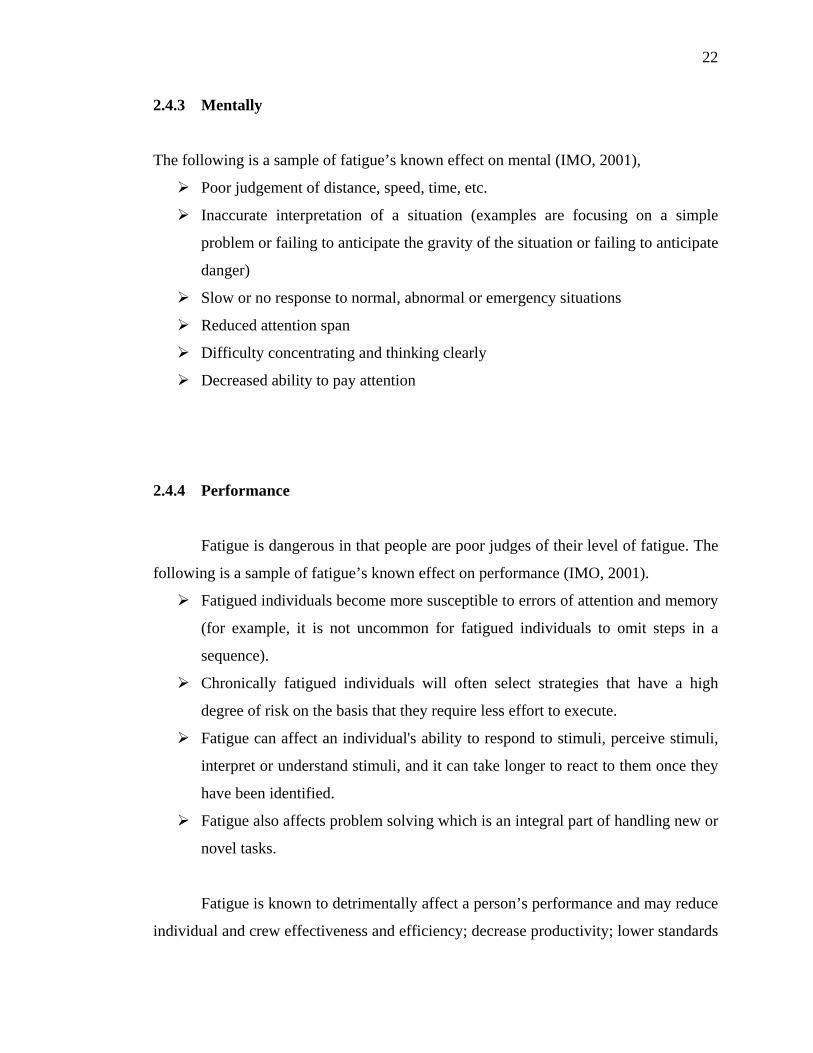
2.4.3 Mentally
The following is a sample of fatigue’s known effect on mental (IMO, 2001),
Poor judgement of distance, speed, time, etc.
Inaccurate interpretation of a situation (examples are focusing on a simple
problem or failing to anticipate the gravity of the situation or failing to anticipate
danger)
Slow or no response to normal, abnormal or emergency situations
Reduced attention span
Difficulty concentrating and thinking clearly
Decreased ability to pay attention
2.4.4 Performance
Fatigue is dangerous in that people are poor judges of their level of fatigue. The
following is a sample of fatigue’s known effect on performance (IMO, 2001).
Fatigued individuals become more susceptible to errors of attention and memory
(for example, it is not uncommon for fatigued individuals to omit steps in a
sequence).
Chronically fatigued individuals will often select strategies that have a high
degree of risk on the basis that they require less effort to execute.
Fatigue can affect an individual's ability to respond to stimuli, perceive stimuli,
interpret or understand stimuli, and it can take longer to react to them once they
have been identified.
Fatigue also affects problem solving which is an integral part of handling new or
novel tasks.
Fatigue is known to detrimentally affect a person’s performance and may reduce
individual and crew effectiveness and efficiency; decrease productivity; lower standards
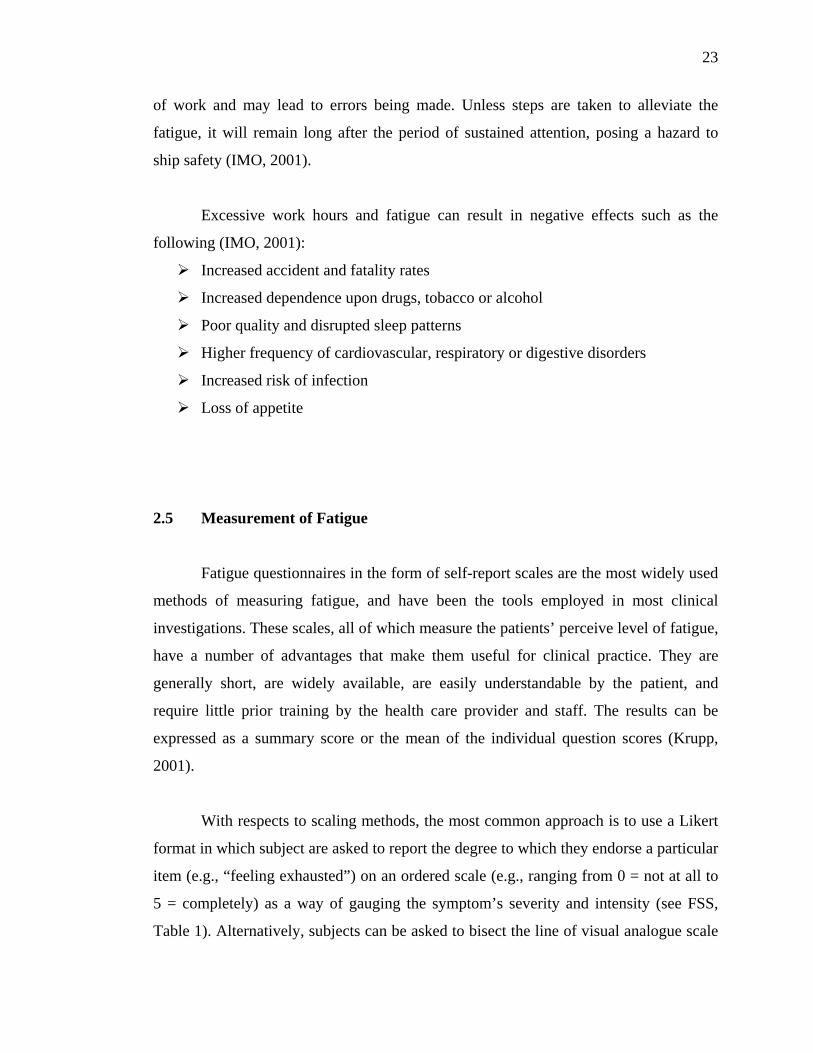
23
of work and may lead to errors being made. Unless steps are taken to alleviate the
fatigue, it will remain long after the period of sustained attention, posing a hazard to
ship safety (IMO, 2001).
Excessive work hours and fatigue can result in negative effects such as the
following (IMO, 2001):
Increased accident and fatality rates
Increased dependence upon drugs, tobacco or alcohol
Poor quality and disrupted sleep patterns
Higher frequency of cardiovascular, respiratory or digestive disorders
Increased risk of infection
Loss of appetite
2.5 Measurement of Fatigue
Fatigue questionnaires in the form of self-report scales are the most widely used
methods of measuring fatigue, and have been the tools employed in most clinical
investigations. These scales, all of which measure the patients’ perceive level of fatigue,
have a number of advantages that make them useful for clinical practice. They are
generally short, are widely available, are easily understandable by the patient, and
require little prior training by the health care provider and staff. The results can be
expressed as a summary score or the mean of the individual question scores (Krupp,
2001).
With respects to scaling methods, the most common approach is to use a Likert
format in which subject are asked to report the degree to which they endorse a particular
item (e.g., “feeling exhausted”) on an ordered scale (e.g., ranging from 0 = not at all to
5 = completely) as a way of gauging the symptom’s severity and intensity (see FSS,
Table 1). Alternatively, subjects can be asked to bisect the line of visual analogue scale

24
(VAS) for the same purpose. The advantages of the Likert scale include its ease of
scoring and better accessibility for respondents (Krupp, 2001).
However, there are few other published results of field studies of maritime
watchkeepers where physiological variables have been measured, except the almost 20-
year old studies performed by Colquhoun and colleagues (Colquhoun et al., 1988).
Methods which have been used earlier used range from questionnaires, sleep
logs and observations to accident analyses. Nonetheless, some issues have not been
resolved – firstly there are indications that data collected through subjective methods
such as questionnaires or interviews are not convincing enough as they may be
perceived as biased or not entirely accurate. Secondly, recommendations for changes
have not been effective. The shipping community may not be fully aware of the risks. In
a closed voting session at a Swedish maritime day 73% of the participants (all maritime
officers) admitted to having fallen asleep one or more times on watch (Lützhöft &
Kiviloog, 2003). This shows that careful study planning with methods that guarantee
confidentiality can gain disturbing, but accurate, results (Lützhöft et al, 2007).
Questions addressing issues which are experienced by most workers involved in
unconventional work hours were based on the ‘Shiftwork Index’ developed by Barton
(1995) and colleagues. Industry specific questions relating to pilotage work were based
on previous studies of Great Barrier Reef pilots (Parker et al.1997) and other seafaring
and marine pilot groups (Berger 1987; Sanquist et al.1996). A draft copy of the
questionnaire was circulated to Pilot Advisory Group members, and then modified on
the basis of their feedback (Parker et al., 1998).
The questionnaire was trialed by administration to two recently retired Great
Barrier Reef pilots. The pilots completed the document and commented on content,
suitability and acceptability. Their comments were incorporated into the questionnaire
before it was distributed to the pilot group (Parker et al., 1998).

25
The final questionnaire totalled 211 items and explored the broad nature of
fatigue in marine pilots. It sought information on (Parker et al., 1998):
demographic characteristics (age, marital status and number of children under
18 years of age)
industry experience and recent work history
sleep patterns at sea, ashore and at home
ratings of health, fitness and chronic fatigue
illnesses, sleep apnea and sea sickness
lifestyle habits (smoking, caffeine and alcohol consumption)
circadian characteristics and morningness / eveningness
feelings while working on the bridge (tension, fatigue, performance levels,
vulnerability to performance decrements, impact of performance decrements)
factors contributing to fatigue
strategies to combat fatigue
pilotage specific experiences
job satisfaction
Dyadic adjustment.
From the study conducted by Anna et al. (1999), the alpha values of her study
are in the range of 0.83 to 0.92. Her study stated that the value seems to be good. Her
study is about the validity of a questionnaire in measuring fatigue among working
people, which is quite similar to this study. In comparison to her study, we can see the
comparison of the value to this study whether it good and reliable. And also the internal
consistency reliability for each item can be accepted or not.
2.6 Maritime Sector in Malaysia
Malaysia’s economic trade is powered by sea borne transportation. For at least the
last 30 years, the Malaysian Government has supported the expansion of national

26
shipping capacity, as evident by the creation and continued encouragement of the
Malaysia International Shipping Corporation Bhd (MISC) since 1968. Although the
Malaysian merchant fleet has grown over the years, much of the demand for shipping
services is still met by foreign shipping lines.
Currently, there are more than 100 foreign and local shipping lines calling at
Malaysian ports to provide a worldwide network of services. Of these, there are 63
foreign shipping lines calling at local ports, which have a link to about 200 ports
worldwide. The Malaysian Ship-owners’ Association (MASA) aims to promote and
protect the interest of Malaysian ship-owners, and to represent members of the
association in dealings with the Government and its agencies on matters of relevant
interest. MASA members account for two-thirds of the country’s merchant fleet
tonnage. Table 2.1 below illustrates the growth of the MASA members’ fleet.
Table 2.1: Growth of MASA Member Fleet
In 2001, the Maritime Institute of Malaysia (MIMA) conducted a study on the
human resource requirements of Malaysian seafarers. The study concluded that
Malaysia relies on the services of foreign seafarers to fulfill approximately 44% of the
manning requirements for Malaysian registered vessels. Some factors that inhibit
growth in the supply of Malaysian seafarers are: a decline in sponsorship for cadets;
limited berths for training; and difficulty in obtaining employment on ships. The
Source: Malaysian Shipowners’ Association (2007)

27
difficulty to secure berths for training poses an obstacle particularly for non-shipowning
sponsors and self-sponsored trainees. Those unable to obtain a berth for training at sea
are unable to continue their certification process.
In 2004, MIMA conducted another study as a follow up to that conducted in
2001. A total of 49 Malaysian shipping companies participated in the survey, which
represents 70% of total GRT recorded in the Malaysian registry. The findings of the
second study largely reconfirmed those of the former, with no trend of improvement or
deterioration of employment for Malaysian seafarers evident. Other issues that have
reportedly caused seafarers to leave their jobs were relatively low wages, a lack of
training, and insufficient shore-leave. Captain Sapuan Sarpan, the President of the
Malaysian Maritime Association has stated that local seafarers are not paid in
accordance with the salary scale and training for seafarers because to do so would be
expensive. Low wage rates do not attract people to pursue a career as a seafarer.
The Malaysian International Shipping Corporation Berhad (MISC) does invest in
the training of seafarers for its vessels, but has difficulty in recruiting capable Malaysian
crews. MISC also grapples with a steady loss of trained personnel to alternative land-
based employment. These factors lead ship-owners to employ certified foreigners to
make up for crew shortages. By doing so, they are able to avoid the cost of training
local seafarers and, at the same time can hire the required manpower at lower costs than
they would incur by hiring Malaysians.
2.7 Technology at Sea and its Relation to Fatigue
How can technology best serve seafarers, to improve safety, quality of life and
operational efficiency on board? IMO's aims are safer shipping and cleaner oceans. It
works toward meeting those aims through agreeing minimum international technical
and operational standards which are implemented by Governments, the shipping

28
industry and seafarers. This research looks at some of the technical and related
operational developments that have been introduced through IMO over the recent past,
particularly with respect to navigation and communications, and seeks to identify the
benefits and disbenefits from the seafarer's perspective.
A survey by Omdal (Omdal, 2003) of 11 Norwegian vessels aimed to identify
factors potentially harmful to health and found that 44% of respondents reported noise
as a problem. Only 8% of crew onboard a noise-reduced vessel reported stress and such
evidence suggests that through technology and improved design some traditional
hardships associated with the maritime life can be overcome.
If developments in navigation and communications technology have affected the
quality of life of the seafarer, what of the increasing integration of computers into
everyday shipboard operations? No office ashore (or children's bedroom!) of today
would be complete without a computer and the same now applies to ships. The days of
the analogue loading and stress calculator to aid the Mate in his task of safely stowing
the cargo have been replaced by computer programs that not only make the calculations,
keep the records and make the stowage plans but also give advice on best practice and
allow many `what if s' to be considered at the touch of a button. The responsibility for
the loading plan may be retained on board (although in the container trades this too is a
shore task) but the responsibility for the mathematics now lies with the programmer and
many seafarers will be grateful for the improvements in operational efficiency and
reduction of worry that brings.
Technological developments significantly aid that aim and operational efficiency
on board and ashore. But we must not allow these developments to by-pass the seafarer
as, if we are to reap the benefits of his knowledge and professionalism, we must also
make sure that technology also enhances the seafarer's quality of life too. (Nautilus,
2008)

29
The development of computer-based training, and the advantages which are surely
to accrue for seafarers through delivery of training to ships via the internet, is likely to
be a fruitful area of development in the future. As with all technologies, there are
advantages and disadvantages to CBT but, with some thoughtful development of this
technology with the seafarer in mind, there are surely some significant benefits to be
had in improving operational efficiency and the quality of life for seafarers on board.
CHAPTER 3
RESEARCH METHODOLOGY
3.1 Introduction
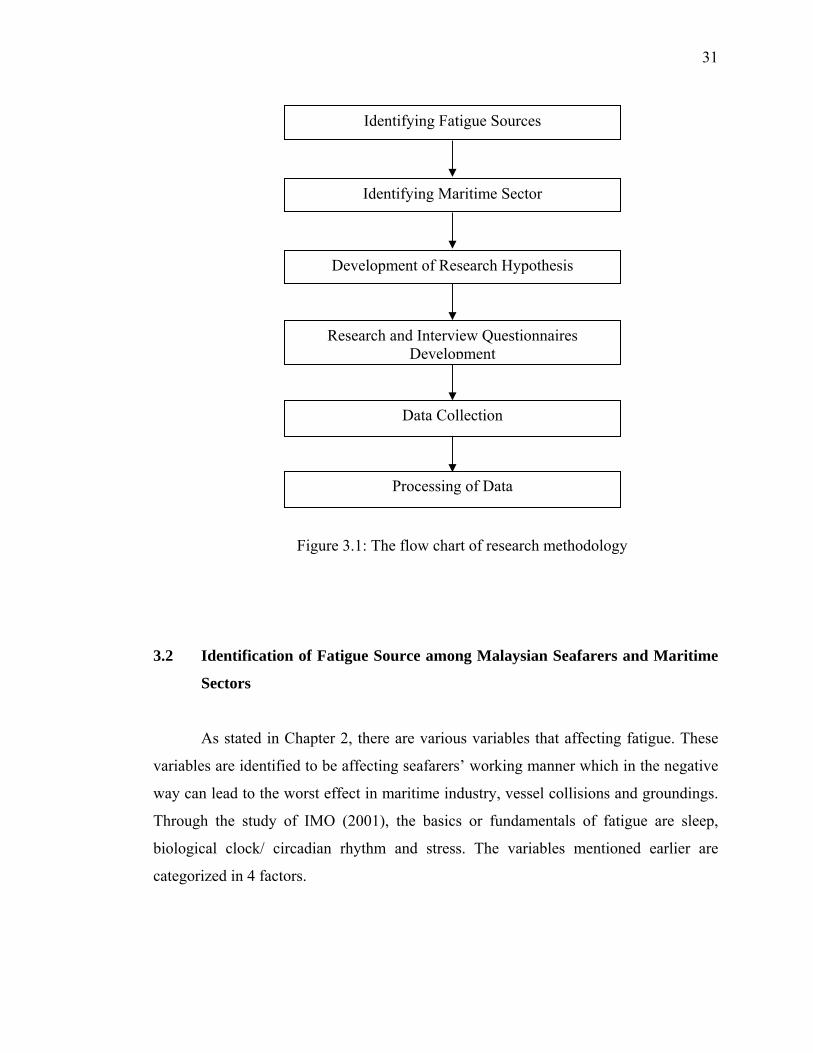
There are six key steps in the methodology used to complete this pilot study.
The steps are explained into Figure 3.1 below:
31
Figure 3.1: The flow chart of research methodology
3.2 Identification of Fatigue Source among Malaysian Seafarers and Maritime
Sectors
As stated in Chapter 2, there are various variables that affecting fatigue. These
variables are identified to be affecting seafarers’ working manner which in the negative
way can lead to the worst effect in maritime industry, vessel collisions and groundings.
Through the study of IMO (2001), the basics or fundamentals of fatigue are sleep,
biological clock/ circadian rhythm and stress. The variables mentioned earlier are
categorized in 4 factors.
Identifying Fatigue Sources
Development of Research Hypothesis
Research and Interview Questionnaires Development
Processing of Data
Identifying Maritime Sector
Data Collection
32
The variables that have been categorized are of general terms and don’t really
represent Malaysian seafarers’ fatigue. Due to the reason, the variables affecting
Malaysian seafarers’ fatigue need to be identified first to further develop this study. In
order to do this, a review of previous literatures has to be made and then the
identification of fatigue variables of Malaysian seafarers can be done.
According to previous research which done by Abdullah (2007), the sources of
fatigue among Malaysian seafarers are:
i. Lack of quantity and quality of sleep with 0.05 level of confident at
Bridge and Engine Room while 0.01 level of confident at Deck
ii. Noise and ship vibration with 0.05 level of confident at Bridge, Engine
Room and Deck
iii. Irregular working hour with 0.05 level of confident at Bridge, Engine
Room and Deck
iv. Boredom with 0.05 level of confident at Bridge only
v. Long working hours and unpredictable task with 0.05 level of confident
at Bridge while 0.01 level of confident at Engine Room
Meanwhile, according to research which had been done by Mohd (2007), fatigue
is different at different time of a working period among different group of seafarers.
Older groups of seafarers are more fatigue than younger group, experienced at different
session in working period where younger groups felt fatigue earlier than older groups,
fatigue level is higher for older groups of seafarers. Engineers are found out to be more
fatigue than deck officers, experienced within the same session in a working period,
fatigue level is higher than deck officers.
These two researches told us about the sources of fatigue among the seafarers
and also the group which felt more fatigue than the other onboard ships. This project
will focus on the fatigue level of the seafarers in various maritime sectors in Malaysia
as per listed below :
33
i) Port/Tug Sector
ii) Short Sea/Near Coastal sector.
iii) Deep sea/Foreign Going sector
3.3 Development of Hypothesis
A hypothesis is an early prediction of the outcome of a study. In this study, it is
recognized that the prediction of Malaysian seafarers’ fatigue level is too wide because
there are no comprehensible study that have been made in the mean on identifying
Malaysian seafarers’ fatigue level. Therefore, the hypothesis is narrowed to a much
better prediction based on the objectives of the study.
There are clearly 3 objectives recognized in Chapter 1. Based on these
objectives, the hypotheses are:-
i. There are various sources of fatigue and different fatigue level
among seafarers in different maritime sectors
ii. The technology used onboard ship can help or overcome the fatigue
issues among the seafarers.
First, the hypothesis is developed according to the objectives of the study.
Variables of fatigue are identified to further develop the questionnaire. It is
understandable that fatigue is different among different seafarers for various type of
maritime sector. These differences depend on various reasons that can affect fatigue to a
person. Through this study, the differences are observed by categorizing seafarers into
different group depending on their age, rank and place of work. There is a need to
compare the fatigue levels among seafarers of different maritime sector in Malaysia.

34
3.4 Research Instrument
With the intention of gaining quantitative information from the respondents, a
set of questionnaire was used as the instrument to collect data (Questionnaires as
attached in Appendix A). The entire questions were uniquely designed to collect
information from the respondent. Some questions were adapted from Fatigue, Health
and Injury among Seafarers in Cardiff University and Great Barrier Reef Pilots
Questionnaire which were globally used to identify sources of fatigue among seafarers
and also from The Technology Perception at Sea Questionnaires which had been
developed by NUMAST 2006. (Questionnaires as attached in Appendix B and C)
3.4.1 Development of Questionnaire
This study investigates seafarers’ perception on the sources of fatigue level in
various maritime sectors. In order to extract information from respondents, the
researcher used a structured questionnaire. Nunan (1992) points out that questionnaire
are one of the good methods in order to obtain information from respondents.
Krupp (2001), in his study declared that questionnaires in the form of self-report
are the most common method that has been used by previous researchers to measure
fatigue. As in this study, questionnaires are going to be used to accomplish the
objectives.
The questionnaire items are based on constructs that have been developed as
follows:-
i. Construct 1 - Personnel Particular & Health (Demography)
ii. Construct 2 – Nature of Work (Work Shift)
iii. Construct 3 – Location of Work
iv. Construct 4 – Effect of Technology

35
The questionnaire consisted of structured questions as well as closed-
ended questions. Wallen and Franken (2000) believe those structured questions
are able to enhance consistency or responses across respondents. It also provides
a set of possible responses to make it easier for respondents (Nunan, 1992) and
the responses can be straightforwardly analyzed (Munn and Drever, 1993).
Likert scale (Table 3.1) below was used to measure the outcome of the results.
Table 3.1: Sample of Likert Scale
Scale Never Seldom Sometimes Often Always
Score 1 2 3 4 5
The homogeneity or internal consistency of this questionnaire is checked
by Cronbach’s Alpha (α) calculation for all items. Using the SPSS, to ensure
reliability of the questions, Cronbach’s Alpha α value must be in range 0.75 to 1
(Chua, 2006). The validity of this questionnaire is tested first by conducting a
mock study to identified questionnaire. If it is valid, the questionnaire is
complete and ready to be distributed to the real respondents and if not, it needs
to be altered and tested again until it is completed.
3.5 Data Collection
The questionnaire developed and distributed to the respondents who is serving at
various type of maritime sectors as follows:
• Port/Tug sector
• Short sea and near coastal sector
• Deep sea sector

36
Respondents are accounted to be just a little portion of the population of Malaysian
seafarers. The identified respondents are differentiated according to their work
category:-
i. Pilots
ii. Officers
iii. Engine Crews
iv. Deck Crews
Each of the categories stated above is given 5 questionnaires to 5 different
persons. After certain of time, the questionnaires are collected back and the data
analysis can be made. In this survey, it is purposely done to the various ranks and
location of workplace and also the nature and shift of work to check the critical area and
nature of shift which contribute more to fatigue problem.
3.6 Data Analysis
As usual, the first raw data are analysed using Statistical Package for Social
Science (SPSS) and MiniTab. This software will automatically calculate the desired
outcome. This software has enhanced the speed of data analysis by cutting the amount
of time required if conventionally doing it by manual calculations. Furthermore, this
will reduce errors in calculations. However, MiniTAB software, which function is
almost the same to SPSS also will be used to cross check the statistical value calculated.
For first time study, the value of Cronbach’s Alpha (α) must be determined to
check the reliability of the data and result. The most common measure for reliability
which is based on a correlation matrix. It is used to assess the internal consistency
reliability of several item or score. The value of α must be ranged at 0.75 to 1.0 (Chua,
2006). Items should be deleting if the value of α below than 0.6. Only one question can

37
be deleted at one time. This procedure is done repeatedly until the desired value is
obtained.
Demographic analysis is done to view the background of the respondents. The
data will be shown in the form of bar chart or pie chart. Background information will be
briefly explained one by one according to their percentage. Association of this
information with the constructs are determined using either Spearman’s Rho (ρ) or
Kendall’s Tau (τ). By Richard (1994), these methods are used to assess how close the
relationship between two variables is to being monotonous. Monotonous is a
relationship of one that is consistently increase or decrease, but not necessarily in a
linear fashion. Either one of this value can be used to represent the association’s
strength. To show persistence of associations, both of this value is calculated in this
chapter. The value of ρ and τ must be significant. Strong associations of variables can
be seen if the value is closer to -1 or +1.
For the next analysis, mean score was determined depending on Likert’s scale.
A set of mean score will be used to identify level of scoring for every primary location
of works for each construct whether it was low, medium or high. Table 3.2 shows the
range of mean score and it level.
Table 3.2 Level of mean score Level Score Mean
Low
Medium
High
1.00 – 2.33
2.34 – 3.66
3.67 – 5.00
Each primary location of work will be compare by mean score whether it was
high, low or medium.
38
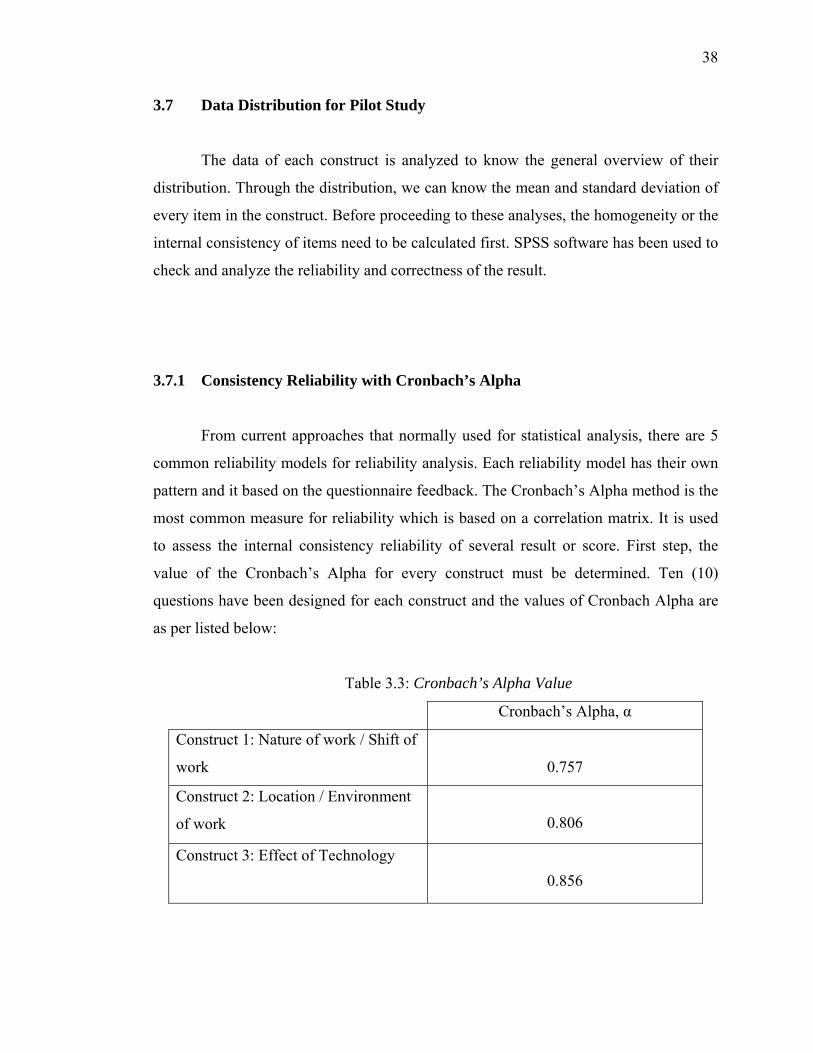
3.7 Data Distribution for Pilot Study
The data of each construct is analyzed to know the general overview of their
distribution. Through the distribution, we can know the mean and standard deviation of
every item in the construct. Before proceeding to these analyses, the homogeneity or the
internal consistency of items need to be calculated first. SPSS software has been used to
check and analyze the reliability and correctness of the result.
3.7.1 Consistency Reliability with Cronbach’s Alpha
From current approaches that normally used for statistical analysis, there are 5
common reliability models for reliability analysis. Each reliability model has their own
pattern and it based on the questionnaire feedback. The Cronbach’s Alpha method is the
most common measure for reliability which is based on a correlation matrix. It is used
to assess the internal consistency reliability of several result or score. First step, the
value of the Cronbach’s Alpha for every construct must be determined. Ten (10)
questions have been designed for each construct and the values of Cronbach Alpha are
as per listed below:
Table 3.3: Cronbach’s Alpha Value
Cronbach’s Alpha, α
Construct 1: Nature of work / Shift of
work
0.757
Construct 2: Location / Environment
of work
0.806
Construct 3: Effect of Technology
0.856

39
Table 3.3 shows the result for Cronbach’s Alpha for all primary location of
works for each construct. Internal consistency reliability for each location and construct
was accepted because Cronbach’s Alpha value ought to be ranged 0.6 to 1 and that
means the items in the questionnaire was reliable because Cronbach’s Alpha value was
at that range for all items. Outcome of the result can be accepted for the study and can
be passing on for the further study or research.

CHAPTER 4
RESULT AND ANALYSIS
4.1 Introduction
A total of 60 candidates have been given the questionnaires. However, only 34
respondents replied. These respondents are Malaysian seafarers who were sailing in
various type of ship in different maritime sector. They were asked to answer all the
questions in the questionnaires provided. The results that have been finalized and
analyzed are briefly explained in this chapter.
This chapter presents the finding based on survey conducted via questionnaires.
It aims to focus on respondents’ feedback about their perception in the sources and level
of fatigue among Malaysians seafarers for 3 different maritime sectors. The results
collected are analyzed and arranged according to the research question.
The data are organized as follow:
i. Demographics of the Malaysian Seafarers
ii. Malaysian seafarers perceptions on the seafarer nature of work are the source of
fatigue
41
iii. Malaysian seafarer’s perceptions on the location of work are the source of
fatigue.
iv. Comparison of level of fatigue for different maritime sector
v. Malaysian seafarers perceptions on the technology installed onboard ship and
it’s effect to the fatigue
The chapter begins by describing the data obtained based on the objective of the
study. Then, a thorough discussion of the finding would be included later in chapter 5.
4.2 Demographics Study
The first section in the questionnaire is the demographic background of the respondents.
Information regarding their background is needed to evaluate the overall percentage of
backgrounds out of 100%.
4.2.1 Demographics Distribution by Seafarer Rank
The Figure 4.1 below is about ranking proportion. 34 numbers of Malaysian
seafarers were playing a part in this survey. More than half of the volunteer was deck
officers and engineers. 23% of them came from the 5th Engineer followed by 18% of
Third Deck Officer and Engineers. There are 2 or 6% of senior officers and engineers
participated for this survey. They are 2 Master and 2 Chief Engineers from various
sectors. 15% or the respondents are now working as a Cadet engineer and Cadet
Officers for foreign going ship. It is believed that most of the respondents are working
onboard ship in various maritime sectors for more than 6 months.

42
RANK
15%
23%
12%18%
20%
6% 6% Cadet
5th
4th
3rd
2nd
Chief
Master
Figure 4.1: Rank Distribution
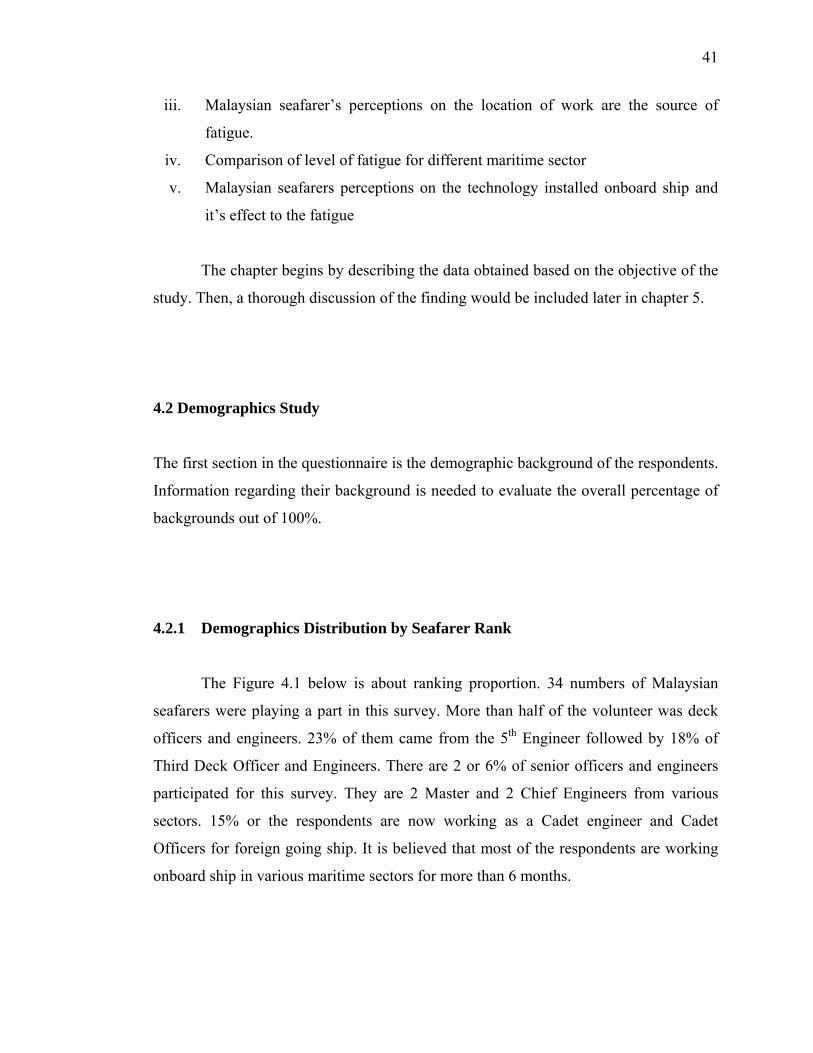
4.2.2 Demographic Distribution According to Maritime Sector
Figure 4.2 shows the proportion of respondents again their maritime sector. For
this study, we focused on 4 different maritime sectors which are Port or Tug operator,
Coastal Container, Foreign Tanker and Foreign LNG ship. 24% of the respondents
were coming from Port and 26% were Coastal Container. If was followed by Foreign
Tanker with 32% and Foreign LNG 18%. All the four (4) maritime sectors were
examined as the major sectors in Malaysia.
43
SECTOR
24%
26%32%
18%Port
Coastal-Container
Foreign-Tanker
Foreign-LNG
Figure 4.2: Distribution by Sector
4.2.3 Demographics Distribution by Location of Work
Figure 4.3 shows proportion of candidate again their location of workplaces.
More than 50 percent of candidate work at Deck and Engine (10 seafarers for each
location) while the remaining candidate work at Bridge (7 persons). Seafarers who work
at Bridge are Deck Officers while who work at engine are Engineering Officers
meanwhile at Deck are mixed from both Officers. All the three location of work were
examined as the major location of work according two major Officers (Deck Officer
and Engineering Officers) was working at that workplace. All of candidates have
shipboard experienced at least than one year. Most of the respondents had first hand
experience in fatigue occurs during onboard.

44
PLACE OF WORK
56%29%
9% 6%
Engine RoomBridgeDeckOther
Figure 4.3: Distribution by Location of Work
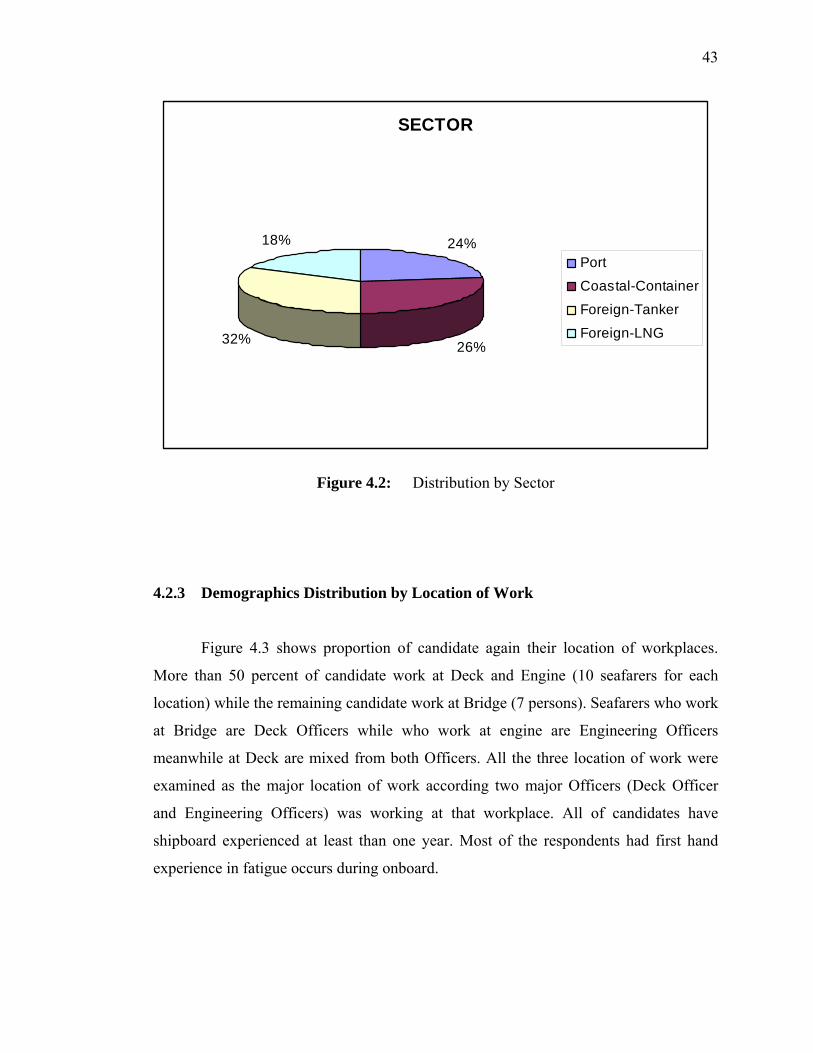
4.2.4 Demographics Distribution by Age
Figure 4.4 shows the distribution of scores across the items comprising the
demographics of the sample. There are 34 respondents from various types of maritime
sector who responded to the questionnaire. It also shows the range of ages of
respondents who answer the questionnaire. 38 percent of seafarers were aged between
18-25 years, approximately 44% were between 26 and 35 years of age and 9% were
between 36 and 45 years of age while the remaining 9% were aged between 46 and 55
years. It is believed that the age of seafarers can be a source of fatigue according it can
affect seafarers emotional, mental and physical.
LOCATION OF WORK
45
AGE
38%
44%
9%9%
18 - 25
26 - 35
36 - 45
46 - 55
Figure 4.4: Distribution by Age
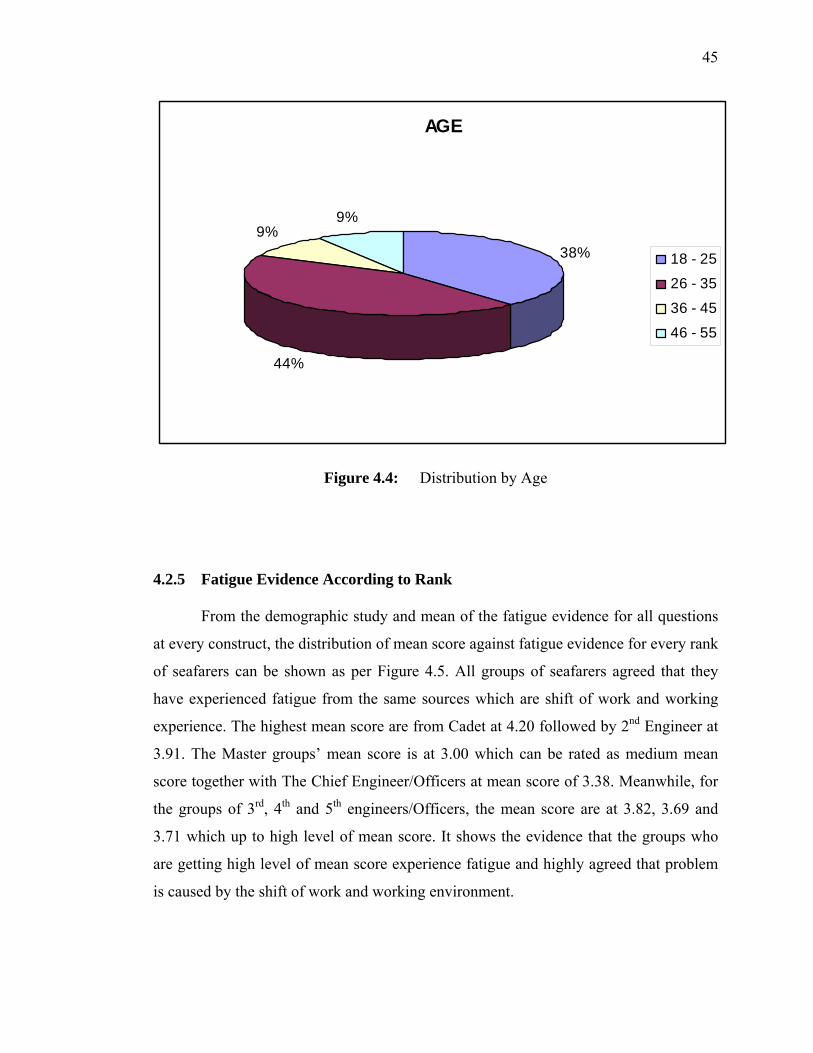
4.2.5 Fatigue Evidence According to Rank
From the demographic study and mean of the fatigue evidence for all questions
at every construct, the distribution of mean score against fatigue evidence for every rank
of seafarers can be shown as per Figure 4.5. All groups of seafarers agreed that they
have experienced fatigue from the same sources which are shift of work and working
experience. The highest mean score are from Cadet at 4.20 followed by 2nd Engineer at
3.91. The Master groups’ mean score is at 3.00 which can be rated as medium mean
score together with The Chief Engineer/Officers at mean score of 3.38. Meanwhile, for
the groups of 3rd, 4th and 5th engineers/Officers, the mean score are at 3.82, 3.69 and
3.71 which up to high level of mean score. It shows the evidence that the groups who
are getting high level of mean score experience fatigue and highly agreed that problem
is caused by the shift of work and working environment.

46
Distribution of Mean of Fatigue Level with Rank
0
0.5
1
1.5
2
2.5
3
3.5
4
4.5
Master ChiefEng/Off
2nd 3rd 4th 5th Cadet
Master
ChiefEng/Off
2nd
3rd
4th
5th
Cadet
Figure 4.5: Distribution of Mean Score for Different Seafarers Rank
4.3 Association of Fatigue with Demographic
The strength association between two categorical variables can be measured
using Kendal’s tau (τ) or Spearman’s rho (ρ). Either one of this value can be used to
represent the association’s strength. A strong value of Kendal’s tau (τ) or Spearman’s
rho (ρ) could be closed to +1.00 while one close to -1.00 would indicate no relationship.
However, only place of work will be analyze because it very common in causing
fatigue.
Distribution of Mean Score by Seafarers Rank
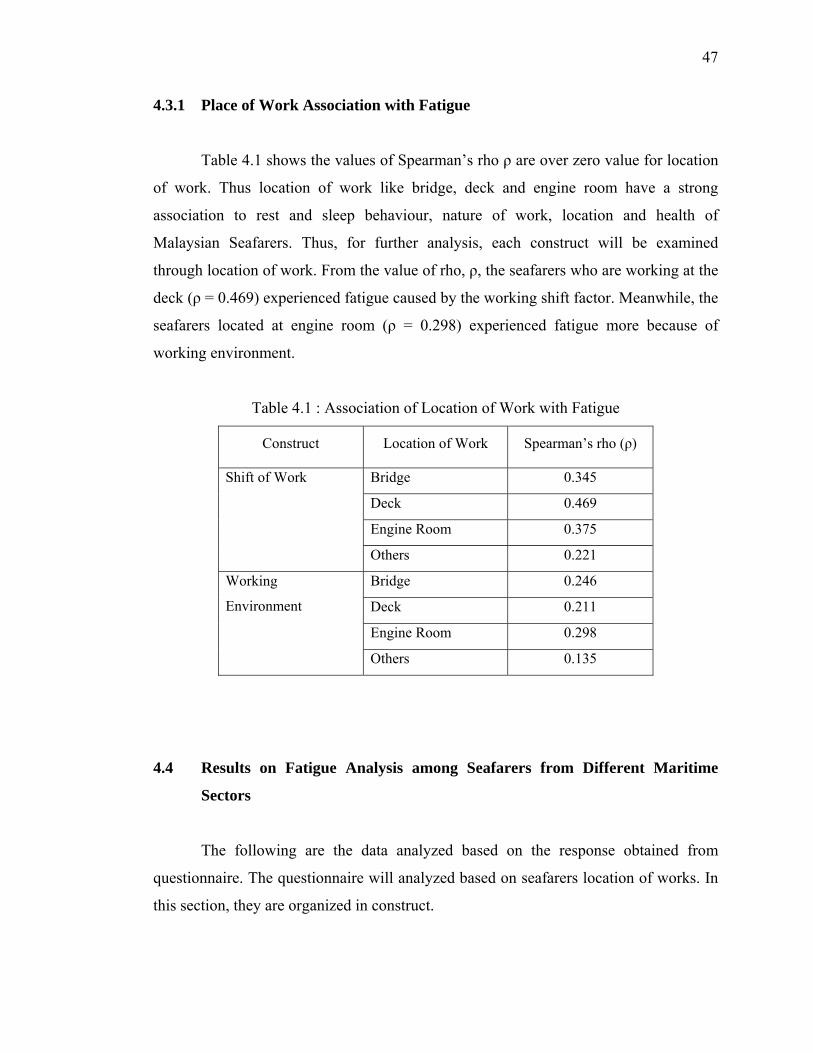
47
4.3.1 Place of Work Association with Fatigue
Table 4.1 shows the values of Spearman’s rho ρ are over zero value for location
of work. Thus location of work like bridge, deck and engine room have a strong
association to rest and sleep behaviour, nature of work, location and health of
Malaysian Seafarers. Thus, for further analysis, each construct will be examined
through location of work. From the value of rho, ρ, the seafarers who are working at the
deck (ρ = 0.469) experienced fatigue caused by the working shift factor. Meanwhile, the
seafarers located at engine room (ρ = 0.298) experienced fatigue more because of
working environment.
Table 4.1 : Association of Location of Work with Fatigue
Construct Location of Work Spearman’s rho (ρ)
Bridge 0.345
Deck 0.469
Engine Room 0.375
Shift of Work
Others 0.221
Bridge 0.246
Deck 0.211
Engine Room 0.298
Working
Environment
Others 0.135
4.4 Results on Fatigue Analysis among Seafarers from Different Maritime
Sectors
The following are the data analyzed based on the response obtained from
questionnaire. The questionnaire will analyzed based on seafarers location of works. In
this section, they are organized in construct.
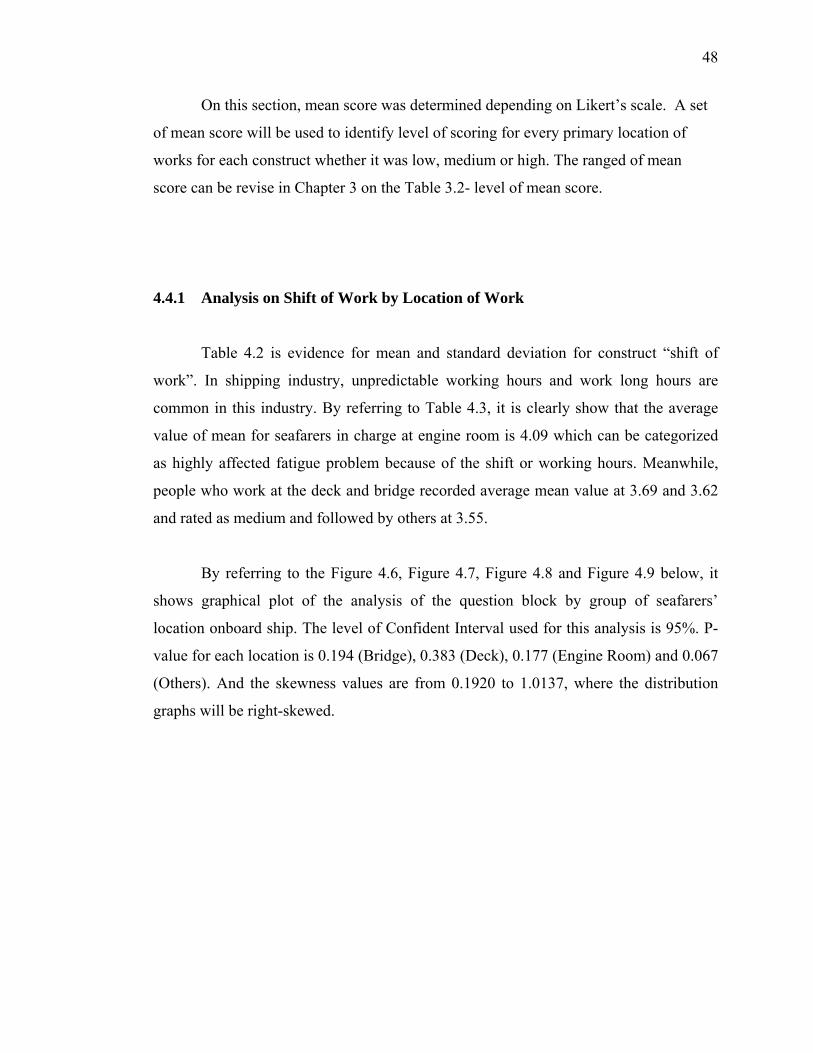
48
On this section, mean score was determined depending on Likert’s scale. A set
of mean score will be used to identify level of scoring for every primary location of
works for each construct whether it was low, medium or high. The ranged of mean
score can be revise in Chapter 3 on the Table 3.2- level of mean score.
4.4.1 Analysis on Shift of Work by Location of Work
Table 4.2 is evidence for mean and standard deviation for construct “shift of
work”. In shipping industry, unpredictable working hours and work long hours are
common in this industry. By referring to Table 4.3, it is clearly show that the average
value of mean for seafarers in charge at engine room is 4.09 which can be categorized
as highly affected fatigue problem because of the shift or working hours. Meanwhile,
people who work at the deck and bridge recorded average mean value at 3.69 and 3.62
and rated as medium and followed by others at 3.55.
By referring to the Figure 4.6, Figure 4.7, Figure 4.8 and Figure 4.9 below, it
shows graphical plot of the analysis of the question block by group of seafarers’
location onboard ship. The level of Confident Interval used for this analysis is 95%. P-
value for each location is 0.194 (Bridge), 0.383 (Deck), 0.177 (Engine Room) and 0.067
(Others). And the skewness values are from 0.1920 to 1.0137, where the distribution
graphs will be right-skewed.

49
Table 4.2: Mean and Standard Deviations for Construct: Shift of Work
Bridge Deck Engine Room Others
Question
Mea
n
Std
Dev
iatio
n
Mea
n
Std
Dev
iatio
n
Mea
n
Std
Dev
iatio
n
Mea
n
Std
Dev
iatio
n
Question 1 3.80 0.79 4.10 0.99 4.05 0.62 4.00 1.41
Question 2 4.00 0.84 3.60 0.84 4.00 0.75 4.50 0.71
Question 3 3.60 0.97 3.40 0.69 3.89 0.66 3.00 0.00
Question 4 3.50 0.67 3.60 1.07 3.95 0.62 3.00 1.41
Question 5 3.40 0.53 3.50 0.96 3.95 0.62 3.50 0.71
Question 6 3.40 0.96 3.80 0.97 4.21 0.71 3.00 1.41
Question 7 3.20 0.53 3.80 0.92 3.95 0.41 3.00 1.41
Question 8 4.00 1.05 3.80 0.84 4.47 0.61 4.00 0.00
Question 9 4.00 0.94 3.60 1.14 4.26 0.65 4.00 0.00
Question 10 3.30 1.15 3.70 1.16 4.17 0.69 3.50 0.71
Average 3.62 0.308 3.69 0.196 4.09 0.18 3.55 0.55
Figure 4.6: Graphical Summary for Bridge

50
Figure 4.7: Graphical Summary for Deck
Figure 4.8: Graphical Summary for Engine Room
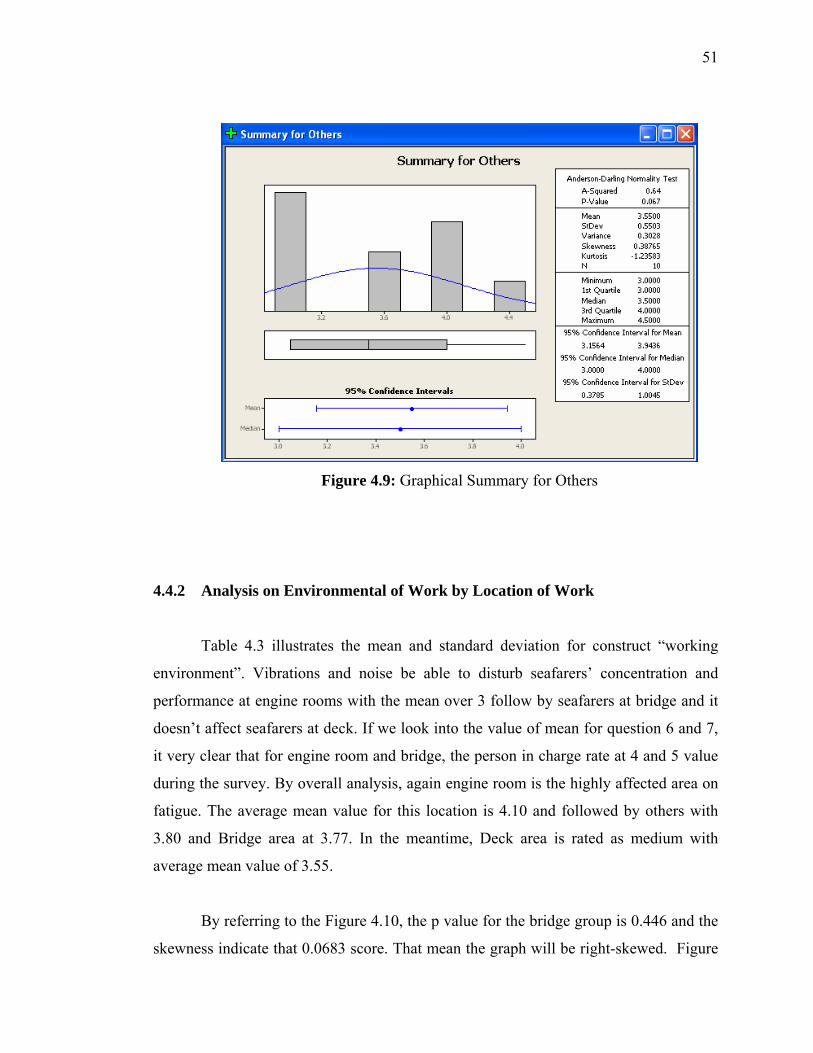
51
Figure 4.9: Graphical Summary for Others
4.4.2 Analysis on Environmental of Work by Location of Work
Table 4.3 illustrates the mean and standard deviation for construct “working
environment”. Vibrations and noise be able to disturb seafarers’ concentration and
performance at engine rooms with the mean over 3 follow by seafarers at bridge and it
doesn’t affect seafarers at deck. If we look into the value of mean for question 6 and 7,
it very clear that for engine room and bridge, the person in charge rate at 4 and 5 value
during the survey. By overall analysis, again engine room is the highly affected area on
fatigue. The average mean value for this location is 4.10 and followed by others with
3.80 and Bridge area at 3.77. In the meantime, Deck area is rated as medium with
average mean value of 3.55.
By referring to the Figure 4.10, the p value for the bridge group is 0.446 and the
skewness indicate that 0.0683 score. That mean the graph will be right-skewed. Figure
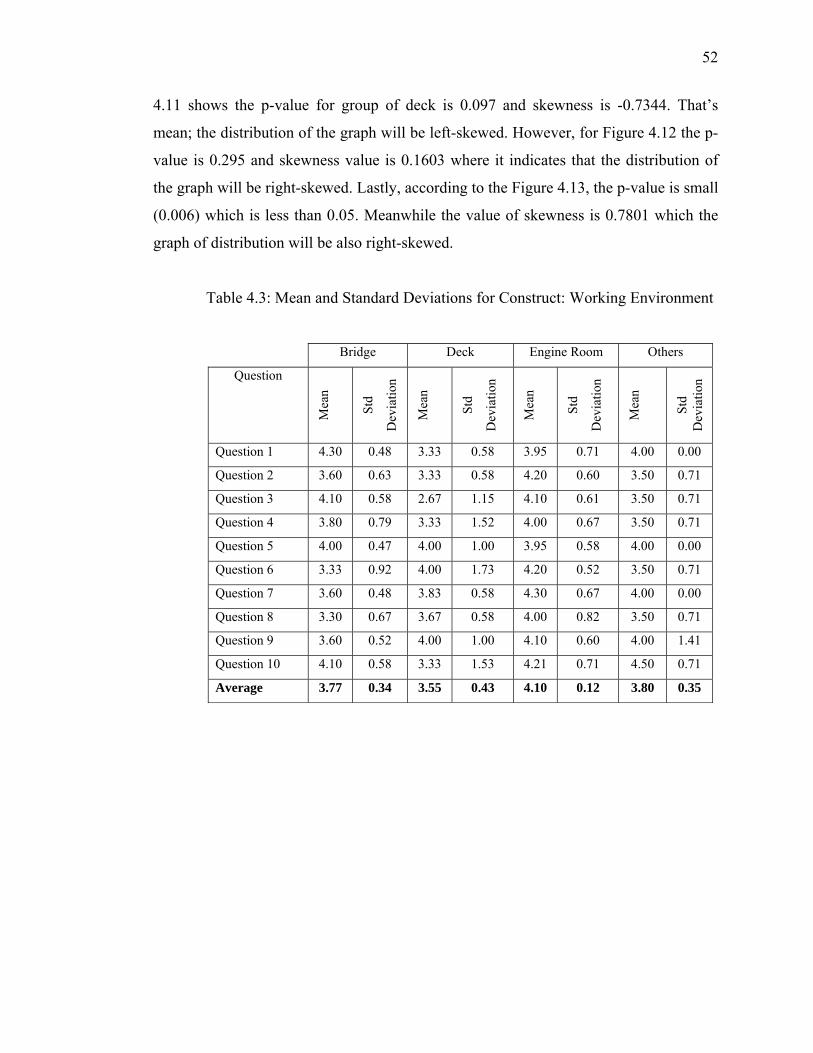
52
4.11 shows the p-value for group of deck is 0.097 and skewness is -0.7344. That’s
mean; the distribution of the graph will be left-skewed. However, for Figure 4.12 the p-
value is 0.295 and skewness value is 0.1603 where it indicates that the distribution of
the graph will be right-skewed. Lastly, according to the Figure 4.13, the p-value is small
(0.006) which is less than 0.05. Meanwhile the value of skewness is 0.7801 which the
graph of distribution will be also right-skewed.
Table 4.3: Mean and Standard Deviations for Construct: Working Environment
Bridge Deck Engine Room Others
Question
Mea
n
Std
Dev
iatio
n
Mea
n
Std
Dev
iatio
n
Mea
n
Std
Dev
iatio
n
Mea
n
Std
Dev
iatio
n
Question 1 4.30 0.48 3.33 0.58 3.95 0.71 4.00 0.00
Question 2 3.60 0.63 3.33 0.58 4.20 0.60 3.50 0.71
Question 3 4.10 0.58 2.67 1.15 4.10 0.61 3.50 0.71
Question 4 3.80 0.79 3.33 1.52 4.00 0.67 3.50 0.71
Question 5 4.00 0.47 4.00 1.00 3.95 0.58 4.00 0.00
Question 6 3.33 0.92 4.00 1.73 4.20 0.52 3.50 0.71
Question 7 3.60 0.48 3.83 0.58 4.30 0.67 4.00 0.00
Question 8 3.30 0.67 3.67 0.58 4.00 0.82 3.50 0.71
Question 9 3.60 0.52 4.00 1.00 4.10 0.60 4.00 1.41
Question 10 4.10 0.58 3.33 1.53 4.21 0.71 4.50 0.71
Average 3.77 0.34 3.55 0.43 4.10 0.12 3.80 0.35
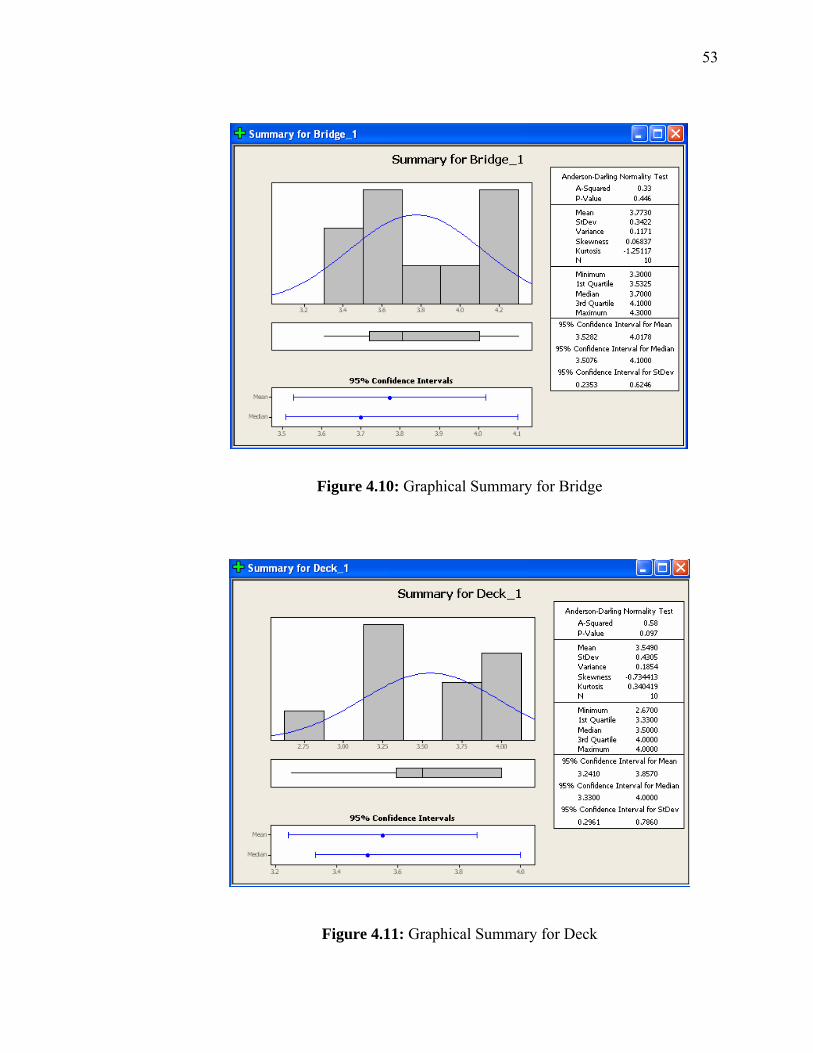
53
Figure 4.10: Graphical Summary for Bridge
Figure 4.11: Graphical Summary for Deck

54
Figure 4.12: Graphical Summary for Engine Room
Figure 4.13: Graphical Summary for Others

55
4.4.3 Analysis on Effect of Technology by Location of Work
Table 4.4 gives you an idea about mean and standard deviation for construct
“effect of technology” onboard ship. Generally, Malaysian seafarers feel more
comfortable to work or deal with technology during their shift. From the mean that we
can see from the table below, most of the respondents rated 4 or 5 to support that
technology is one of the factor to reduce fatigue onboard ship. By referring to the Table
4.5 below, seafarers who work at the engine room and bridge were highly accepted and
realized that technology is part of reason which cause fatigue to them. It clearly shows
that engine room and bridge area recorded the highest score of average mean by 4.13
and 3.90. It is followed by others and deck with 3.75 and 3.43.
Table 4.4: Mean and Standard Deviations for Construct: Effect of Technology
Bridge Deck Engine Room Others
Question
Mea
n
Std
Dev
iatio
n
Mea
n
Std
Dev
iatio
ec
ted
byM
ean
Std
Dev
iatio
n
Mea
n
Std
Dev
iatio
n
Question 1 4.00 0.00 3.67 0.58 4.32 0.48 3.50 0.00
Question 2 4.50 0.71 3.33 1.15 4.05 0.71 4.50 0.71
Question 3 4.00 1.41 3.33 0.58 3.95 0.71 3.00 1.41
Question 4 3.50 0.71 3.33 0.58 4.16 0.69 3.50 0.71
Question 5 3.50 0.71 3.33 0.58 3.84 0.50 3.50 0.71
Question 6 4.00 0.00 3.33 1.15 3.95 0.50 4.00 0.00
Question 7 4.00 1.41 4.00 1.00 4.11 0.46 4.00 1.41
Question 8 3.50 0.71 3.33 0.58 4.42 0.61 3.50 0.71
Question 9 3.50 0.71 3.33 0.58 4.11 0.74 3.50 0.71
Question 10 4.50 0.71 3.33 0.58 4.37 0.76 4.50 0.71
Average 3.90 0.39 3.43 0.23 4.13 0.19 3.75 0.49
By referring to the Figure 4.14, Figure 4.15, Figure 4.16 and Figure 4.17 below,
it shows graphical plot of the analysis of the question block of effect of technology by
group of seafarers’ location onboard ship. P-value for each location is 0.028 (Bridge),

56
0.005 (Deck), 0.635 (Engine Room) and 0.043 (Others). Most of the p-values are less
than 0.05 and only engine room shows it higher than 0.05. And the skewness values are
from 0.203 to 2.260, where the distribution graphs will be right-skewed.
Figure 4.14: Graphical Summary for Bridge
Figure 4.15: Graphical Summary for Deck

57
Figure 4.16: Graphical Summary for Engine Room
Figure 4.17: Graphical Summary for Others

58
4.4.4 Analysis on Shift of Work by Sector
Table 4.5 gives you an idea about mean and standard deviation for construct
“shift of work”. However, this time we look at different types of maritime sectors.
Generally, we know that onboard ship shift of work is most important to seafarers to
follow. At this time we will look in details the real practice from various sectors. And
also, we expect to know the preferred practice from the seafarers itself according to
their nature of works. For Port / Tug operator in Malaysia, seafarers feel that the shift
of work is not one of the important factors which contribute to the fatigue. The average
mean value from this sector is less than 3.52 which consider medium and not so
impressive. But, for the other 3 sectors, Foreign Tanker and Foreign LNG recorded the
average mean value of 4.05 and it is considered highly acceptable that seafarers
consider that shift or nature of work is one of the important factors which contribute to
fatigue. Meanwhile, Coastal sector is also at the high group with 3.80 of average mean
value.
Table 4.5: Mean and Standard Deviations for Construct: Shift of Work
Port Coastal Foreign Tanker Foreign LNG
Question
Mea
n
Std
Dev
iatio
n
Mea
n
Std
Dev
iatio
n
Mea
n
Std
Dev
iatio
n
Mea
n
Std
Dev
iatio
n Question 1 3.25 0.71 3.67 0.71 4.18 0.75 4.00 0.63
Question 2 3.30 0.76 3.55 0.53 4.18 0.87 4.17 0.75
Question 3 3.25 0.71 3.22 0.97 4.09 0.70 4.00 0.00
Question 4 3.50 1.19 3.78 0.83 3.82 0.87 3.67 0.52
Question 5 3.37 0.71 3.67 0.71 3.91 1.04 3.67 0.52
Question 6 3.37 0.74 3.67 1.12 4.27 0.79 4.17 0.75
Question 7 3.62 0.74 3.89 0.33 3.82 0.60 3.67 0.52
Question 8 4.10 0.64 4.11 0.78 4.27 0.90 4.50 0.84
Question 9 4.00 0.93 4.11 0.78 4.18 0.75 4.33 0.52
Question 10 3.50 0.93 4.34 0.88 3.76 0.92 4.33 1.03
Average 3.52 0.30 3.80 0.32 4.05 0.19 4.05 0.30
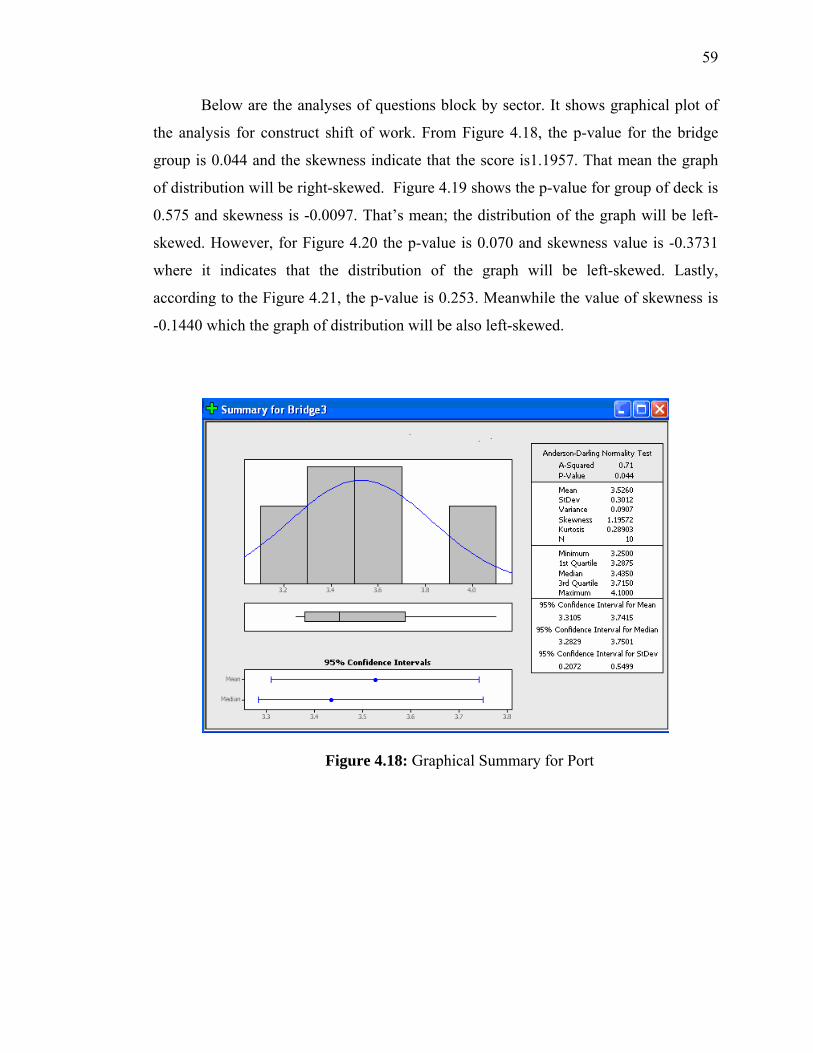
59
Below are the analyses of questions block by sector. It shows graphical plot of
the analysis for construct shift of work. From Figure 4.18, the p-value for the bridge
group is 0.044 and the skewness indicate that the score is1.1957. That mean the graph
of distribution will be right-skewed. Figure 4.19 shows the p-value for group of deck is
0.575 and skewness is -0.0097. That’s mean; the distribution of the graph will be left-
skewed. However, for Figure 4.20 the p-value is 0.070 and skewness value is -0.3731
where it indicates that the distribution of the graph will be left-skewed. Lastly,
according to the Figure 4.21, the p-value is 0.253. Meanwhile the value of skewness is
-0.1440 which the graph of distribution will be also left-skewed.
Figure 4.18: Graphical Summary for Port

60
Figure 4.19: Graphical Summary for Coastal
Figure 4.20: Graphical Summary for Foreign Tanker
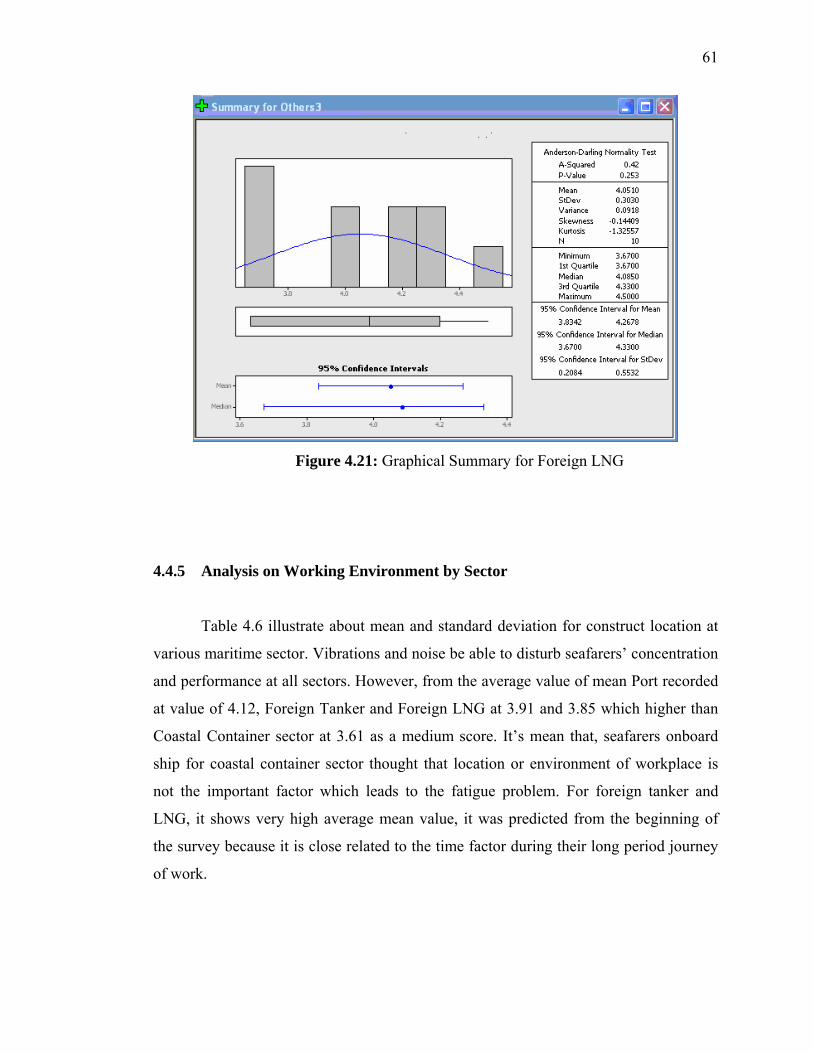
61
Figure 4.21: Graphical Summary for Foreign LNG
4.4.5 Analysis on Working Environment by Sector
Table 4.6 illustrate about mean and standard deviation for construct location at
various maritime sector. Vibrations and noise be able to disturb seafarers’ concentration
and performance at all sectors. However, from the average value of mean Port recorded
at value of 4.12, Foreign Tanker and Foreign LNG at 3.91 and 3.85 which higher than
Coastal Container sector at 3.61 as a medium score. It’s mean that, seafarers onboard
ship for coastal container sector thought that location or environment of workplace is
not the important factor which leads to the fatigue problem. For foreign tanker and
LNG, it shows very high average mean value, it was predicted from the beginning of
the survey because it is close related to the time factor during their long period journey
of work.

62
Table 4.6: Mean and Standard Deviations for Construct: Location/Environment
Port Coastal Foreign Tanker Foreign LNG
Question
Mea
n
Std
Dev
iatio
n
Mea
n
Std
Dev
iatio
n
Mea
n
Std
Dev
iatio
n
Mea
n
Std
Dev
iatio
n
Question 1 4.50 0.53 3.38 0.67 3.91 0.54 4.00 0.63
Question 2 3.87 0.35 3.67 0.87 3.82 0.60 3.67 0.82
Question 3 3.75 0.71 3.44 0.53 3.91 0.54 3.67 0.82
Question 4 4.00 0.76 4.00 0.50 3.73 0.79 3.67 0.82
Question 5 4.12 0.35 3.56 0.53 3.91 0.70 4.00 0.00
Question 6 4.25 0.71 3.38 0.83 4.09 0.54 3.83 0.98
Question 7 4.25 0.46 3.66 0.87 4.18 0.60 3.83 0.41
Question 8 4.12 0.83 4.00 0.87 3.91 0.70 4.00 0.89
Question 9 3.87 0.64 3.67 0.50 3.64 0.67 3.83 0.75
Question 10 4.50 0.53 3.38 0.78 4.09 0.70 4.00 0.63
Average 4.12 0.26 3.61 0.24 3.91 0.17 3.85 0.14
By referring to Figure 4.22, the p-value for the bridge group is 0.608 and the
skewness indicates that the score is 0.2032. That mean the graph of distribution will be
right-skewed. Figure 4.23 shows the p-value for group of deck is 0.093 and skewness is
0.7508. That’s mean; the distribution of the graph will be right-skewed. For Figure 4.24
the p-value is 0.373 and skewness value is -0.0497 where it indicates that the
distribution of the graph will be left-skewed. Lastly, according to the Figure 4.25, the p-
value is 0.026. Meanwhile the value of skewness is -0.1843 which the graph of
distribution will be also left-skewed.

63
Figure 4.22: Graphical Summary for Port
Figure 4.23: Graphical Summary for Coastal

64
Figure 4.24: Graphical Summary for Foreign Tanker
Figure 4.25: Graphical Summary for Foreign LNG

65
4.4.6 Analysis on Effect of Technology by Sector
Table 4.7 gives you an idea about mean and standard deviation for construct
effect of technology. This time we will consider from view of maritime sectors
identified. Generally, Malaysian seafarers from selected sectors as per mention below
(Table 4.7) feel that the technology installed onboard ship is very useful and it can help
them to minimize their fatigue problem. If we can see from the table, we know that all
the sectors contributed very high average value of mean. The average value for Foreign
Tanker is 4.14 followed by Coastal 4.11. Meanwhile, Foreign LNG recorded 3.87 and
Port sector with 3.74 for average mean score. It is clear that all sector agreed that
technology is part of the factors which contribute to fatigue among the seafarer at
various sector.
Table 4.7: Mean and Standard Deviations for Construct: Effect of Technology
Port Coastal Foreign Tanker Foreign LNG
Question
Mea
n
Std
Dev
iatio
n
Mea
n
Std
Dev
iatio
n
Mea
n
Std
Dev
iatio
n
Mea
n
Std
Dev
iatio
n
Question 1 3.87 0.64 4.44 0.53 4.54 0.69 4.00 0.63
Question 2 4.00 0.93 4.11 0.60 3.91 0.70 3.83 0.98
Question 3 3.87 0.83 4.11 0.78 3.73 0.65 3.67 1.03
Question 4 3.63 0.52 4.22 0.67 4.18 0.75 3.67 1.37
Question 5 3.63 0.52 3.78 0.67 3.82 0.87 4.00 0.63
Question 6 3.63 0.52 4.00 0.50 3.73 0.79 3.67 0.82
Question 7 4.00 1.06 4.11 0.33 4.09 0.54 3.67 0.52
Question 8 3.63 0.52 3.89 0.60 4.64 0.50 3.83 1.16
Question 9 3.50 0.93 4.00 1.00 4.18 0.60 4.33 0.82
Question 10 3.62 1.06 4.44 0.72 4.55 0.69 4.00 1.09
Average 3.74 0.18 4.11 0.21 4.14 0.34 3.87 0.22

66
By referring to the Figure 4.26, Figure 4.27, Figure 4.28 and Figure 4.29 below,
it shows graphical plot of the analysis of the question block of effect of technology by
maritime sector. P-value for each location is 0.020 (Port), 0.443 (Coastal-Container),
0.293 (Foreign-Tanker) and 0.066 (Foreign-LNG). Meanwhile, the skewness values are
0.4916 (Port), 0.0457 (Coastal-Container), 0.2853 (Foreign-Tanker) and 1.0221
(Foreign-LNG). As a result, the distribution graph for all sectors will be right-skewed.
Figure 4.26: Graphical Summary for Port

67
Figure 4.27: Graphical Summary for Coastal
Figure 4.28: Graphical Summary for Foreign Tanker
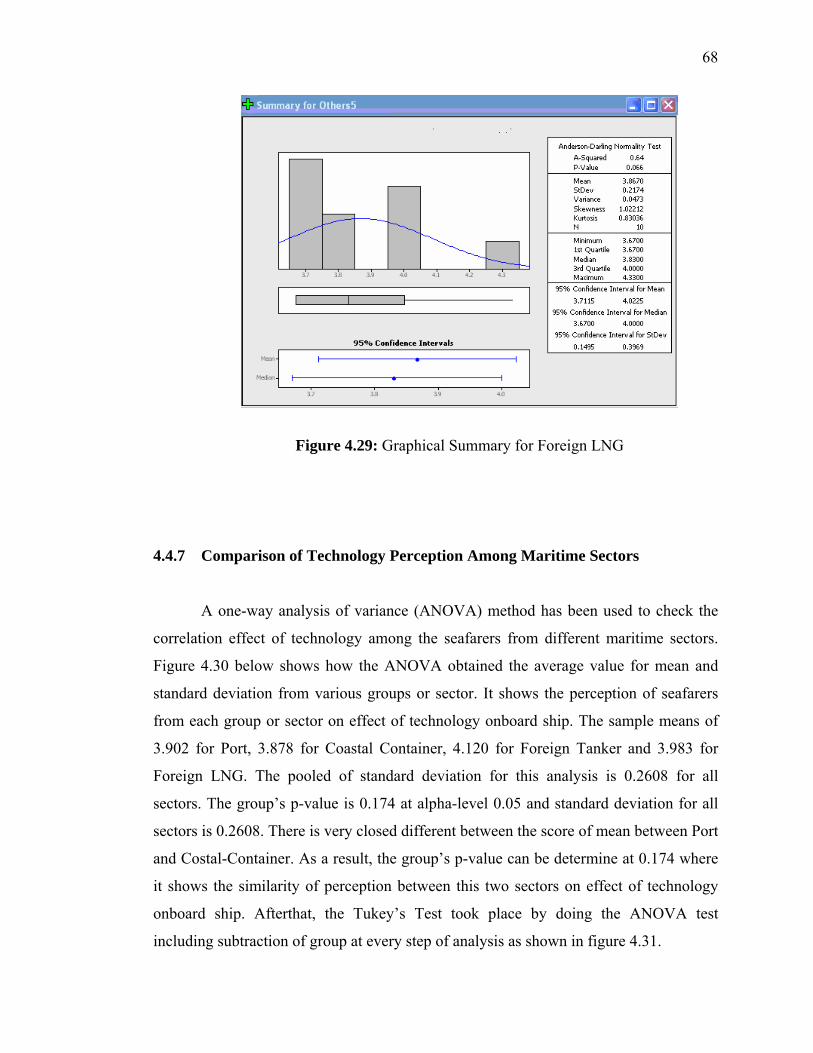
68
Figure 4.29: Graphical Summary for Foreign LNG
4.4.7 Comparison of Technology Perception Among Maritime Sectors
A one-way analysis of variance (ANOVA) method has been used to check the
correlation effect of technology among the seafarers from different maritime sectors.
Figure 4.30 below shows how the ANOVA obtained the average value for mean and
standard deviation from various groups or sector. It shows the perception of seafarers
from each group or sector on effect of technology onboard ship. The sample means of
3.902 for Port, 3.878 for Coastal Container, 4.120 for Foreign Tanker and 3.983 for
Foreign LNG. The pooled of standard deviation for this analysis is 0.2608 for all
sectors. The group’s p-value is 0.174 at alpha-level 0.05 and standard deviation for all
sectors is 0.2608. There is very closed different between the score of mean between Port
and Costal-Container. As a result, the group’s p-value can be determine at 0.174 where
it shows the similarity of perception between this two sectors on effect of technology
onboard ship. Afterthat, the Tukey’s Test took place by doing the ANOVA test
including subtraction of group at every step of analysis as shown in figure 4.31.
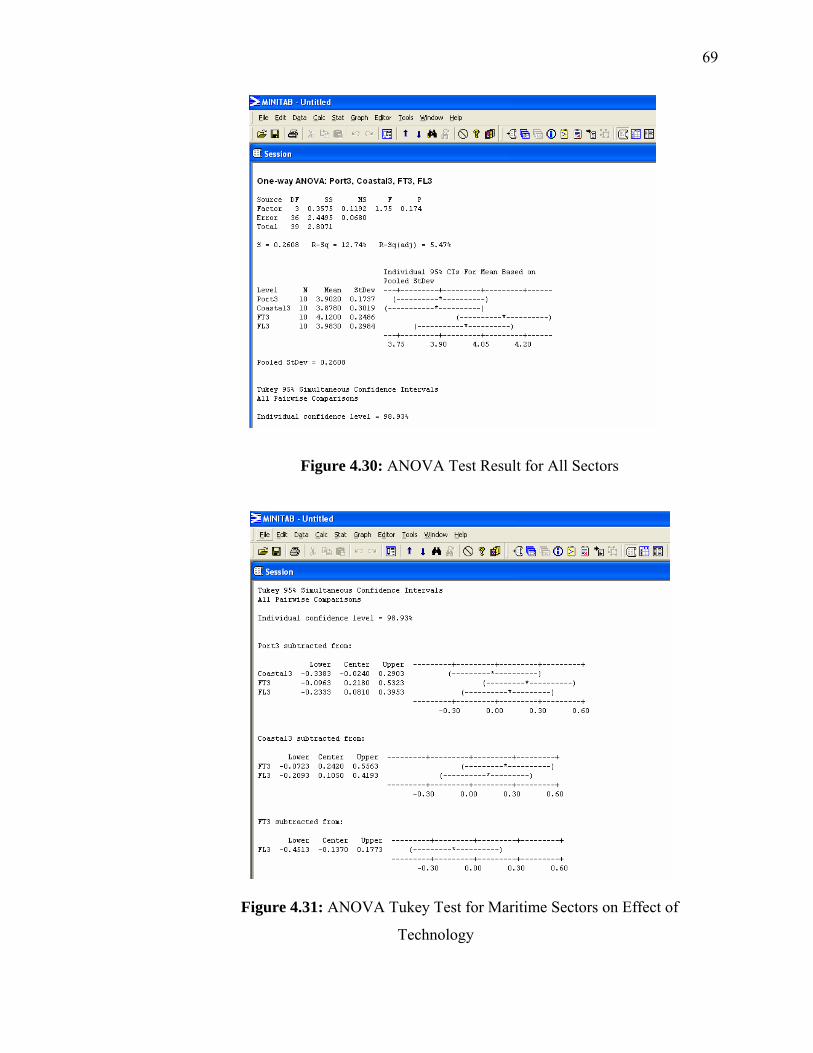
69
Figure 4.30: ANOVA Test Result for All Sectors
Figure 4.31: ANOVA Tukey Test for Maritime Sectors on Effect of
Technology
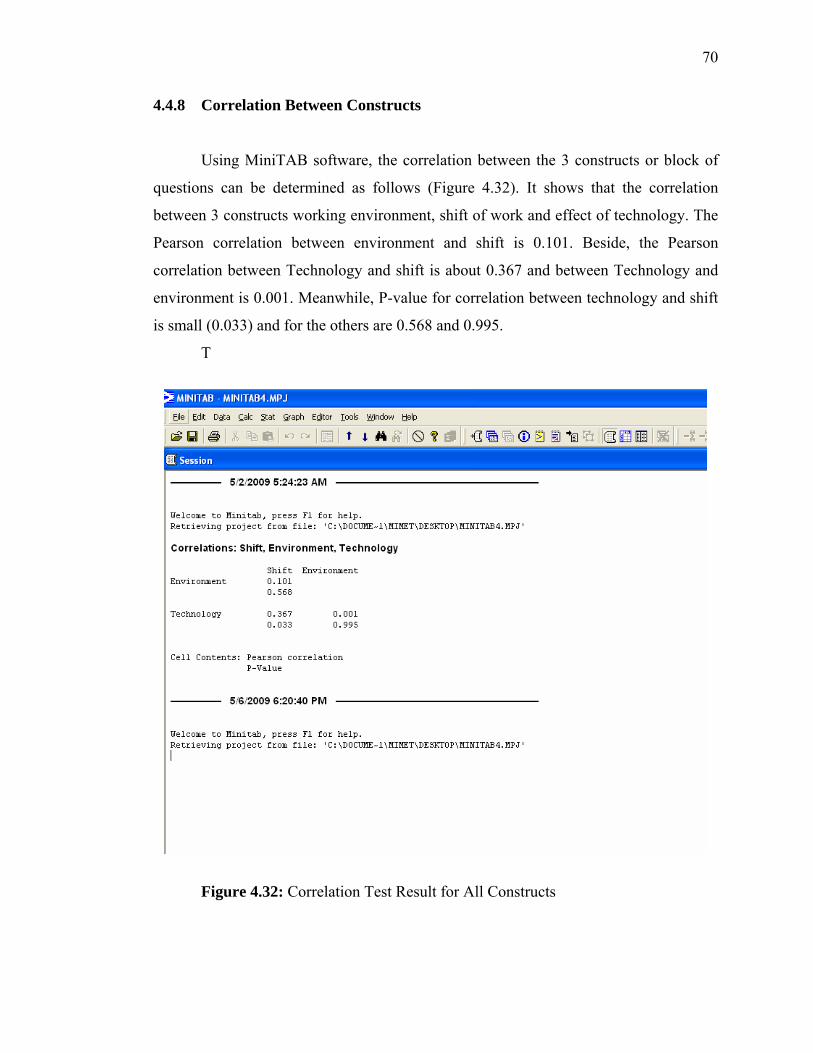
70
4.4.8 Correlation Between Constructs
Using MiniTAB software, the correlation between the 3 constructs or block of
questions can be determined as follows (Figure 4.32). It shows that the correlation
between 3 constructs working environment, shift of work and effect of technology. The
Pearson correlation between environment and shift is 0.101. Beside, the Pearson
correlation between Technology and shift is about 0.367 and between Technology and
environment is 0.001. Meanwhile, P-value for correlation between technology and shift
is small (0.033) and for the others are 0.568 and 0.995.
T
Figure 4.32: Correlation Test Result for All Constructs
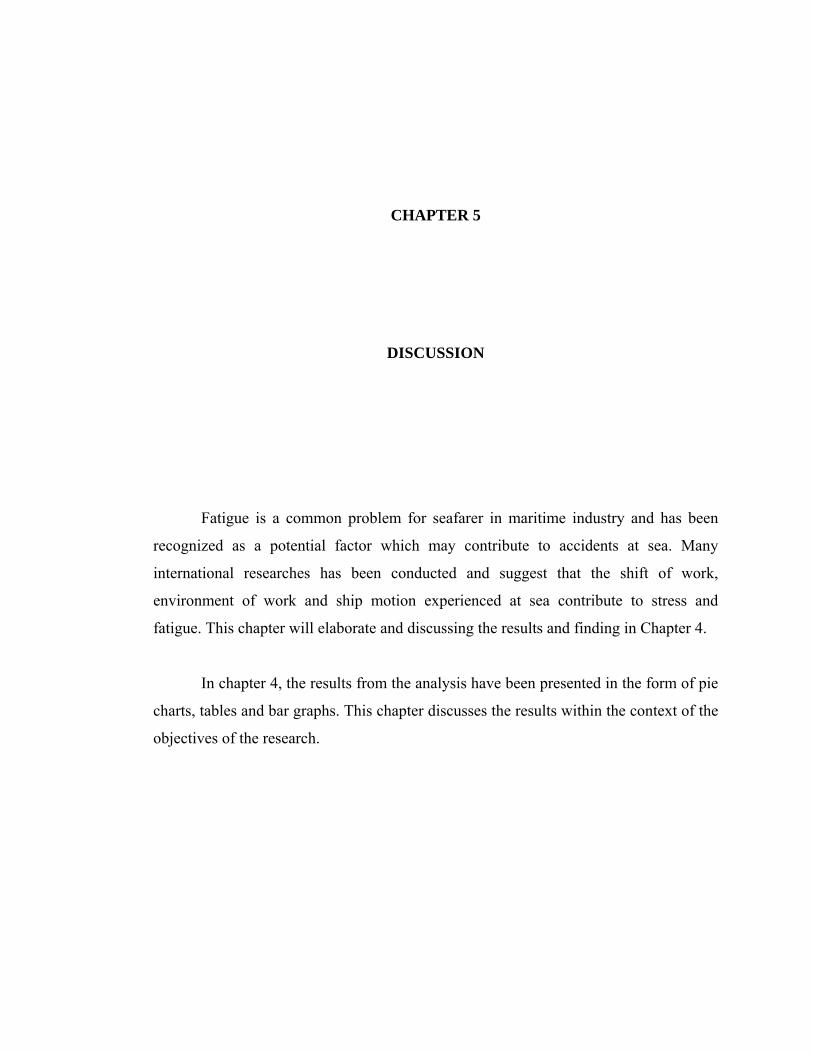
CHAPTER 5
DISCUSSION
Fatigue is a common problem for seafarer in maritime industry and has been
recognized as a potential factor which may contribute to accidents at sea. Many
international researches has been conducted and suggest that the shift of work,
environment of work and ship motion experienced at sea contribute to stress and
fatigue. This chapter will elaborate and discussing the results and finding in Chapter 4.
In chapter 4, the results from the analysis have been presented in the form of pie
charts, tables and bar graphs. This chapter discusses the results within the context of the
objectives of the research.

72
5.1 Validity of Question and Internal Consistency Reliability with Cronbach’s
Alpha
The values of Cronbach’s Alpha,α shown in Table 3.2 (pilot study) for each
construct ranged 0.757 to 0.856, showing the validity of the questions asked in this
survey. From the study conducted by Anna et al. (1999), the alpha values of her study
are in the range of 0.83 to 0.92. Her study is about the validity of a questionnaire in
measuring fatigue among working people, which is quite similar to this study. However,
according to Chua (2005) to ensure reliability of the questions, Cronbach’s Alpha α
value must be in range 0.75 to 1.00. In comparison to be made between the Cronbach’s
Alpha α from this study and Anna’s study and also the SPSS requirement, the alpha
values can be concluded as in the range of a good and reliable. Internal consistency
reliability for each item and construct can be accepted.
5.2 Data Distribution
Data distributions are viewed in terms of means and standard deviations. The
standard deviations of items in each constructs are relatively small showing the
consistency of answers. As shown in Table 4.2 and 4.3 in chapter 4. The value of mean
for each question can be analyzed in details. Most of the question had been rated
between 3 to 5. The average mean value for the construct on shift of work, engine room
recorded the highest mean value of 4.05. This result can be categorized as high mean
score. Meanwhile for the construct on environment of work, engine room still lead the
average mean value of 4.10. This result also can be categorized as high mean score.

73
5.3 Discussion On Place of Work Association with Fatigue
The result and findings for association between location of work with fatigue
can be found in Table 4.1 on page 45. The association between these two dependents
has been shown using SPSS correlation test. The Spearman’s rhos values obtained are
greater than zero. It indicates that the existence of correlations between fatigue do
represented by three constructs to the various place of works.
5.4 Discussion on Fatigue Analysis among Seafarers from Different Maritime
Sectors
This section is divided into 4 sub-groups and each subgroup represents each
sector where the result from seafarers from selected maritime sectors had been
analyzed. The sectors are Port/Tug Operator, Coastal Container, Foreign-Tanker and
Foreign-LNG. The findings in Chapter 4 have been grouped according to construct.
Discussion in this section will be categorized as such. However, in order to confirm that
there are fatigues among the seafarers in different maritime sector, the results are also
analysed by sector we have to look into the detail of the result for each sector. After
that, we will see the finding on the analysis of result on the technology effect to the
fatigue problem.
5.4.1 Evidence of Fatigue of Seafarer
Place of work are very much effecting fatigue in a seafarer. IMO (2001) stated
this as a ship-specific factor which detailed by physical comfort in workspaces, location
of quarters and ship motions apart from other details. IMO (2001) also confirm that

74
working environment is one of the most significant factors of fatigue causation, which
this factor is related with temperature, noise, etc.
From the result (refer to table 4.2 and 4.3) the evidence of fatigue among
seafarers working at different locations. The relatively high average means and small
standard deviations. Correspond to strong evidence of fatigue experienced by seafarers
working in the respective locations.
Generally, seafarers agreed that their work places are contributing to fatigue
occurrence in a working period. Engine room can make the seafarers to feel fatigue
earlier than bridge and deck. Thus proofing the factor of working environment does
affect seafarers’ fatigue. The level of noise, vibrations and exposure to high and low
temperatures felt by seafarers working in the engine room are much higher than the
level felt by those who work on bridge and deck. These factors can increase the level of
stress suffered by engine room workers, reflecting the easiness to feel fatigue.
Furthermore, engine room is rather situated in the lowest part of a ship and can restrict
interpersonal relationship with other crewmembers, reflecting the crew-specific factor
for fatigue as stated by IMO, (2001). Compared to bridge and deck environment, they
are much more comfortable and less exposure to environmental threat that engine room
workers have to cope with.
All groups of seafarers agree that they have experienced fatigue. The highest
means are from higher ranked of work are known to be dealing with less stress but high
job responsibilities, leading to the increase of work load. As for example, higher ranked
deck officers are much more related to the management of ships, including the welfare
of their crew. However, the lower is the person who are doing the work onboard ship.
They are not the management team. This factor, increase the fatigue effect experienced
by the lower rank. Sometime the tight schedules of work for lower rank seafarers make
them feel fatigue due to the shift of work factor.
75
5.4.2 Discussion on Shift of Work by Maritime Sector
Marine nature well known as long of duties period hours plus at irregular hours,
and substantial amount of night work. This in turn may manifest in impaired
performance capabilities and reduce levels of safety. Some literature said 8 hours
uninterrupted of sleep provides 100% recovery.
By referring to the result (Table 4.5), it can be seen that the pattern of the mean
and standard deviation value for different maritime sectors. It shows that all sectors
agree on the issue of fatigue among seafarers. Average mean for Port/Tug is 3.52, mean
for Foreign-Tanker and Foreign-LNG is 4.05 and mean for Coastal-Container is 3.78. A
potential source of stress for seafarers is the irregular timing of their work. Work
undertaken during unconventional hours of day places greater demands on employees
than work performed during normal daytime hours. Mean score value was high for
Malaysian seafarers that working at three main location on ship for unpredictable
working hours and work for long period or unsociable hours.
5.4.3 Discussion on Environment of Work by Maritime Sector
As we know, there was difference level of noise, quality of bed and ship motion
for the locations and environment of work. Normally, bridge seafarers were disturbed
by noise and quality of bed while the others was no disturbances with those two.
Meanwhile, ship motion was disturbed sleep of seafarers at engine and deck while no
sleep disturbance for bridge. Both of these factors have been associated with increasing
levels of discomfort and fatigue as a function of exposure time. Noise and vibration also
contribute to poor sleep and interfere with communication. Additionally, in the long
term there may be detrimental effect on the person’s health. These conditions also
contribute to quantity and quality of sleep that may lead into fatigue to Malaysian
seafarers.

76
In order to determine whether respondents felt that the location and environment
of their workplace will effect their focus while doing their works and increase their
fatigue, an item was included asking Malaysian seafarers to indicate whether they
obtained ‘too little’, ‘enough’ or ‘too much’ break. Ninety percent of respondents
indicated they obtained ‘enough’ break and sleep. From Table 4.6 it is evident that a
significant location effect existed. The mean score for all locations and environment of
work was medium and indicated that seafarers were affected by fatigue because of
environment and location of their workplace during at sea for any selected maritime
sector.
The average mean value for Coastal Container is 3.61 which is lower than the
other three (3) sectors and rated as medium score. It’s mean that, for Coastal-Container
sector, the influence of fatigue to their seafarers is mediumly rated. However, the value
of average mean for Foreign-Tanker and Foreign-LNG is quite high at 3.91 and 3.85.
However the highest average mean value is for Port sector with 4.12. That means, this
sector agrees strongly on the location-related onboard ship. It caused by the location and
environment of work. Respondents were asked to indicate whether or not they
experienced sea sickness, and if so, whether this occurs during the on the pilot launch or
on the ship. As detailed in Table 4.3(Question 4 and 5), all Malaysian seafarers at
bridge (mean = 3.80 & 4.00), deck (mean = 3.33 & 4.00) and engine room (4.00 &
3.95) indicated they experienced sea sickness moderately to the both situation. This
finding is reasonable given the constant pitching and rolling of vessels such as those
used during launch trip.
Overall, Malaysian seafarers was enjoyed doing their job but sometime need to
performing alight exercise and stretching, taking a quick shower and just walk around
the ship to combating fatigue and to stay awake. The normal action taken by Malaysian
seafarers actually considering that they boredom with their workplace and location and
sometimes need to get fresh air because their work is too easy, repetitive and bodily
movement is restricted. Studies have shown that situation of work underload typically
result in reduced levels of awakening and boredom. The high levels of vigilance,
77
watchkeeping, and monitoring required of seafarers requires their constant attention but
these functions may provide minimal task variety. Consequently, additional effort by
the seafarer is required to maintain appropriate level of awakening and fell fresh at all
time.
5.4.4 Discussion on Effect of Technology
In modern era, the usage of technology can be assumed as one of the concrete
solution in order to minimize fatigue in doing our work. It is similar to the ship
operation. From this survey, we are trying to prove that the technology also can be
installed and it can help the seafarers in completing their task. It is also as a tool to
reduce their fatigue while at sea. According to the result obtained various place of work
onboard ship (Table 4.4), it was found that from various locations of work onboard
ship, the seafarers from bridge and engine room highly agree that technology is needed
but it also can cause fatigue to the seafarer. The average mean value for these two
locations is about 3.90 and 4.13 respectively. The deck crew agrees too but the average
mean is only 3.43.
From the result in Table 4.7, it can be said that between the different maritime
sectors, Foreign-Tanker sector agrees that the existence of technology onboard ship will
cause fatigue to their seafarers and it follows by coastal container sector which average
mean score is 4.11. The mean score for Foreign-Tanker sector is 4.14 and it proves that
this kind of respondent who work in this sector knows that technology is one of the
source which cause fatigue to their seafarers. It also supported by the other two sectors,
where the average mean score for Port is 3.74 and Foreign-LNG is 3.87. The average
mean score for these two sectors are highly rated. It proves that the effect of technology
onboard ship will contribute to fatigue problem to the seafarers in various sectors.

78
In considering technological developments it is something that important to the
seafarers and shipping industry, it is the time to see that any possibility to the ship
owner to install high technology machinery and equipment onboard ship. Integrated
systems and increased automation do much to relieve the watchkeeper from the
mechanical tasks of keeping a watch, setting courses, plotting positions and altering
course but they do not relieve him (or her) of his responsibility to act diligently and in a
seamanlike manner. The ship owner have seeks and identify the benefits and disbenefits
of technology onboard ship from the seafarer's perspective.
5.5 Discussion on ANOVA & Correlation Test
5.5.1 ANNOVA Test
In order to perform ANNOVA test, it was decided to run the test for construct of
effect of technology only. It is because to check the correlation between the maritime
sectors. It is to confirm on their perception on effect of technology which first time to
be introduce and take into consideration in fatigue issues among the seafarers. The
hypothesis for the test is that all population means (level means) are the same. From the
Figure 4.30 and Figure 4.31 the ANOVA obtained for the Groups P-value is 0.174
which is higher than alpha-level value (0.05). This mean that one or more means value
are significantly similar from one group to the other. This shows that every group has
the same perception on the issue of fatigue.
The individual statistics of 34 respondents included for each group of sector.
The sample means of 3.9020 for Port, 3.8780 for Coastal, 4.1200 for Foreign Tanker
and 3.9830 for Foreign LNG. The pooled standard deviation is 0.2608 for all sectors.
79
This is the main reason why there is the P-value is 0.174. Therefore, this indicates that
the perception of all sectors to effect of technology is much similar.
5.5.2 Correlation Test
From the result, we also can check on the correlation between constructs or
question blocks. The correlation test is done by using Pearson correlation and the result
generated is Pearson correlation value. If the Pearson value is 0.00, there is no
correlation, there is very weak correlation if the value in the range of 0.01 to 0.30. weak
correlation in between 0.31 to 0.50, moderate correlation in the range of 0.51 to 0.70,
strong correlation if it falls into 0.71 to 0.90. Finally, very strong correlation is
established when the value falls in the range of 0.91 to 1.0 as in Chua (2006).
The first case is the construct “shift of work” and construct “working
environment”, the result shows that there is very weak correlation between these two
constructs (Pearson = 0.101). Weak correlation status appears in the construct “Shift of
work” and construct “technology (Pearson = 0.367). There is almost no correlation
between construct “technology” and construct “working environment” (Pearson =
0.001) where the value of Pearson is nearly to 0.00. The detail result can be referred to
Figure 4.32 in Chapter 4.
CHAPTER 6
CONCLUSION AND RECOMMENDATION
This chapter will summarize the findings of this study and explores
implications that can be drawn from the finding of the study. Recommendations are
given in the hope to assist future researcher to gain more information for the benefit
of Malaysian seafarers and nation shipping industry.
6.1 Overview of the study.
This study was carried out to investigate Malaysians Seafarers perceptions
on the locational source of fatigue, and effect of technology onboard ship for
different maritime sectors. The respondents are from various rank and types of ship.
They came from various ranges of ages, years of experience and different location of
work on ship such as deck, engine room and bridge. They had shipboard
experienced at least one year and experienced fatigue during the voyage. This study
only covers 4 types of maritime sectors Port/Tug operator, Coastal-Container,
Foreign-Tanker and Foreign-LNG.

81
Questionnaires were distributed and analyzed using SPSS and MiniTAB
software. Suggestion and recommendations were included to improve this research
for the sake of Malaysians seafarer.
6.2 Restatement of the objective
This study examines the following objectives:
i. To identify the sources of fatigue among Malaysian seafarers
ii. To confirm the contribution of technology onboard to seafarers
fatigue.
6.3 Review of the finding
Fatigue was synonym with marine industry. Many researches have been done
to identify fatigue among seafarers. Unfortunately, not even a single study has been
done to identify sources of fatigue among Malaysian seafarers and focusing on
different maritime sector. Therefore, this study was conducted to identify the sources
of fatigue among Malaysian seafarers in different maritime sector because the
greater effect of fatigue has been recognized as a potential factor which may
contribute to accident at sea which will be a great loss for shipping company and
even can be fatal to Malaysian seafarers.
The study confirms that Malaysian seafarers also experiencing fatigue while
onboard. Several items were identified as the sources of fatigue among Malaysian
seafarers. From this study, we proved that there is different level of fatigue
experienced by seafarers for various rank onboard ships. From the result, we know
that higher rank officer will experience less fatigue during their duty but it is not for
other rank.
82
The study also confirm, there are two (2) main sources of fatigue among
Malaysian seafarers. The result showed the consistency of respondents saying that
their time and work environment, ship motion and etc are the main factor which
cause fatigue. Then, the construction of questionnaires was based on these criteria.
Finally, the two constructs which had been design from the combination of the said
criteria. There are as follows:
i. Nature or Shift of Work
ii. Location and Environment of Work
The final part of this study is to confirm on the effect of technology onboard
ship to the fatigue problem among seafarers in different sectors. Most of the
respondents agree that technology onboard ship has been used for long time in daily
task. However, there are also high possibilities that technology itself contribute to
the seafarers fatigue problem at sea. According to the finding of this study, we can
conclude that, all the maritime sectors which participate in this survey agreed that
their daily ship operation mostly depend on the technology installed. However, from
the result, it is evident that technology also is part of the source of fatigue to
seafarers in various sectors.
Finally, we are perhaps now starting to think about the capability and
reliability of technology to aid the seafarers and overcome the fatigue at sea and also
think how technology best can serve seafarers, to improve safety, quality of life and
operational efficiency on board ship
6.4 Recommendations and Suggestions
Based on the finding of the study, here are some recommendation and
suggestion in the hope to assist future researcher and for the benefit of all Malaysian
seafarers. Based on the intended setting of the study, it would be fruitful for future
researcher to get the real view of fatigue by increase the number of respondent and
increase the number of sector to be involved. It can be done with collaboration with

83
national companies like MISC, GAGASAN CARRIER, PETRONAS, SHELL and
etc to get onboard to the one of the ship itself. From there, researcher can get a full
view of Malaysian seafarers’ activity while onboard and get the real experience of
fatigue. Other than that, this research also can be carried out by sector itself one by
one and I believe the data will be more accurate.
For the development of questionnaire, researcher needs to consider the types
of ship or background operation (i.e period of journey, propulsion system, port of
operation and etc) because different types of ship have different nature. Researcher
need to see all item while at sea, home and onshore and can make comparison on
item of Malaysian seafarers can be drawn. Researcher also needs to address the
unique combinations of potential stressors, which may interact in various ways to
produce fatigue, poor health and increased accident risk. For future study, other
demographic background can be included to have a wider view of fatigue level
among Malaysian seafarers such as health status and other demographic factors
Future researchers need to look into the possibility to search types of technology
installed onboard and types of ship used. Detail study need to be done on the usage of
technology and how it was implemented and the optimization of the usage to the
assisting the seafarers. And also how effective the technology helps the seafarers and
how it can improve their quality of life.
CHAPTER 7
REFERENCES
Abdullah, M., (2007), A Pilot Study To Identify The Source Of Fatigue Among Malaysia
Seafarer, Fakulti Kejuruteraan Mekanikal, Universiti Teknologi Malaysia,
Malaysia.
Akerstedt, T., (1995), ‘Work hours, Sleepiness and the Underlying Mechanisms’,
Journal of Sleep Research, 4(Suppl. 2): 15-22.
Anna, J., H., M., Bultmann, U.,(1999), Fatigue Among Working People: Validity of A
Questionnaire Measure. Occup Environ Med 2000. 57:353–357 Downloaded
from http://oem.bmj.com/cgi/content/full/57/5/353 on 2nd February 2009.
Barton, J., (1995), ‘Choosing to Work at Night: A Moderating Influence on Individual
Tolerance to Shift Work’, Journal of Applied Psychology, 79(3): 449-454.
85
Boardman H., J., (2007), Issue of fatigue and its relationship to the safety of railroad
operations, Federal Railroad Administration, U.S. Department of
Transportation.
Berger, Y., (1987), Sea Pilots: The Problem of Irregular Hours. Seaways, January,
7 - 10.
Chua, Y.,P., (2006), Asas Statistik Untuk Penyelidikan Buku 2, McGraw-Hill,
Singapore.
Collins, A., Matthews,V., & McNamara, R., (2000), Fatigue, Health & Injury Among
Seafarers & Workers On Offshore Installations: A Review, SIRC/Centre for
Occupational & Health Psychology, Cardiff, University, UK
Colquhoun, W, P, Rutenfranz, J, Goethe, H., Neidhart, B., Condon, R., Plett, R., And
Knauth, P., (1988), Work at Sea: A Study of Sleep and of Circadian Rhythms
in Physiological and Psychological Functions, in Watchkeepers on Merchant
vessel I. Watchkeeping on Board Ships: A Methodological Approach.
International Archives of Occupational and Environmental Health, 60, 321-
329.
Couper, A.,D., (1996), Understanding Some of the More Difficult Research Problems in
Maritime Human Factor Research. Proceedings of a Research Workshop on
Fatigue in the Maritime Industry. Seafarers International Research Centre for
Safety and Occupational Health. University of Wales, Cardiff.
Folkard, S, & Barton, J, (1993), ‘Does the ‘Forbidden Zone’ for Sleep Onset influence
Morning Shift Sleep Duration?’, Ergonomics, 36(1-3): 85-91.
86
Houtman, I., Miedema, M., Jettinghoff, K., Starren, A., Heinrich, J., Gort, J., (2005),
Fatigue In The Shipping Industry, Work and Employment, Hoofddorp, The
Netherlands.
House, J.,D., (1985), Working offshore: The other price of Newfoundland’s oil.
Institute of Social and Economic Research, Memorial University of
Newfoundland.
Hoyos, C.,G., (1995), Occupational safety: Progress in understanding the basic aspects
of safe and unsafe behaviour. Applied Psychology: An International Review,
44(3), 235-250.
IMO, (2001), International Maritime Organization, Guidance on Fatigue Mitigation and
Management, MSC/CIRC. 1014, London: IMO, p.1
IMO, (2002), International Maritime Organization, MSC/Circ.813/MEPC/Circ.330
Krupp, A, L, (2001), Fatigue in Multiple Sclerosis: A Guide to Diagnosis and
Management, Demos Medical Publishing, LLC, Downloaded on 4 August
2007.
Linington, A, (2008), The regulation of seafarers’ working hours. Nautilus Federation
Report. UK
Lützhöft, M., & Kiviloog, L., (2003), Sjöfartsdagen 2003: Kommenterade
voteringsresultat. Ångfartygsbefälhavare-sällskapet i Stockholm (In Swedish).
Available: http://www.ikp.liu.se/usr/marlu/ [2008, Nov].
Main Accident Investigation Branch, (2005), Department of Transport. Safety Digest.
Lessons from Marine Accident Reports 1/2005.

87
Malawwethanthri, K., (2003). Fatigue and Jet Lag In search of Sound Sleep. Seaways.
November.
Malaysian Shipowner Association (MASSA)., Annual Report 2007.
Mohd. Hasrul, H., (2007), A Pilot Study To Identify Fatigue Level Among Malaysian
Seafarers, Fakulti Kejuruteraan Mekanikal, Universiti Teknologi Malaysia,
Malaysia.
Munn, P, and Drever, E, (1993), Using Questionnaires in small-Scale Research. A
Teacher’s Guide, rev.ed. Edinburgh: Scottish Council for Research in
Education
NUMAST, (2006), Fatigue: IMO Must Act, NUMAST Telegraph, March 2006, p.40
NUMAST, (1995), All in Good Time. London, NUMAST, UK
NUMAST, (2001), Seafarers’ Hours: Time to Act. London, NUMAST,UK
NUMAST, (2002), Conditions for change: A NUMAST survey on working conditions in
today’s shipping industry, London: National Union of Marine, Aviation and
Shipping Transport Officers
Nunan, D., (1992), Research Methods in Language Learning, Cambridge: Cambridge
United Press
Omdal, K., A., (2003), A survey of health and work environment onboard Norwegian
ships 7th International Symposium on Maritime Health.
Osman., N., A., (2001), Study on Malaysia’s manpower requirements: The seafarer’s
dimension. Kuala Lumpur: Maritime Institute of Malaysia
88
Osman, N.,A.,(2004), MIMA - HRD for Malaysian Seafarers: Issues and Challenges.
Maritime Institute of Malaysia, Martec, Johor Bahru
Parker, A.,W., Hubinger, L., Green, S., Sargent, L., & Boyd, R., (1997), A Survey of the
Health, Stress and Fatigue of Australian Seafarers, Australian Maritime
Safety Authority, Canberra.
Parker, A.,W., Balanda, K., Briggs, L., And Hubinger, L.,M., (1998), A Survey of the
Work and Sleep Patterns of Great Barrier Reef Pilots. Australian Maritime
Safety Authority (AMSA)
Patraiko, D., (2006), Fatigue onboard Raising awareness: The Nautical Institute
reporting plan, 202 Lambeth Road, London SE1 7LQ, UK.
Razif.,M., (2004), HRD for Malaysian Seafarers: Issues and Challenges. Presented at
Seminar on HRD for Malaysian Seafarers: Issues and Challenges. Kuala
Lumpur: Maritime Institute of Malaysia
Reyner, L., Baulk, S., (1998), Fatigue In Ferry Crews: A Pilot Study, Sleep Research
Group, Loughborough, University, UK.
Sutherland, K.,M., And Flin, R.,H., (1989), Stress at sea: a review of working
conditions in the offshore oil and fishing industries. Work Stress, 3: 269-285
Sanquist, T., F., Raby, M., Maloney A.,L., Carvalhais, T., (1997), Work Hours, Sleep
Patterns and Fatigue Among Merchant Marine Personnel. Journal of Sleep
Research, 6: 245-251
Smith, A., Allen, P., & Wadsworth, E.,(2006), Seafarer Fatigue: The Cardiff Research
Programme Centre for Occupational and Health Psychology, Cardiff
University, 63 Park Place, Cardiff.
89
Transportation Safety Board of Canada, (1997), Fatigue resource Directory : Fatigue in
Transportation -A Guide for Investigating for Fatigue.
Wallen, J., and Franken, S., (2000), Doing Your Research Project: A Guide for First-
time Researchers in Education and Social Science, second edition, Milton
Keynes: Open University Press.
.

SURVEY ON
FATIGUE AMONG
MALAYSIAN
SEAFARER IN
DIFFERENT
MARITIME SECTOR
The questionnaire is voluntary and strictly confidential. We are only interested in groups of workers and therefore no individual will be identified in connection with any of the research findings. Your identity and responses to the questionnaire will be completely protected.

THE BACKGROUND OF RESEARCH This questionnaire marks the independent studies aimed at investigating the source of Malaysian seafarers’ fatigue in different maritime sectors. However, lately there so many technological expansions have been used onboard ship and it helps seafarers to improve their quality of life during at sea. There has been little research into the effects of work and rest schedules of seafarers, although maritime regulators, ship owners and trade unions alike are becoming increasingly aware that working conditions at sea almost certainly generate fatigue in crew members. This has potentially disastrous consequences both for the individual in terms of reduced performance and poor health, and for the environment, if accidents occur as a result of lowered alertness. With the introduction of better working practices you and your groups will benefit the most, as you will feel more willing and able to perform tasks to the best of your ability. By providing strategies to increase the safety and efficiency of marine operations in general, the environment will also be protected from potentially harmful incidents occurring as a result of fatigue.
The Questionnaire
The questionnaire is voluntary and strictly confidential. No individual will be identified in connection with any of the research findings. Your identity is not required in the questionnaire and responses to the questionnaire will be completely protected. Your responses are valuable to provide a safer and more productive work environment for yourself and fellow crewmembers. Your participation is greatly appreciated!
If you have any questions or queries about the study or the questionnaire, please do not hesitate to contact us either by e-mail or on the number/s below.
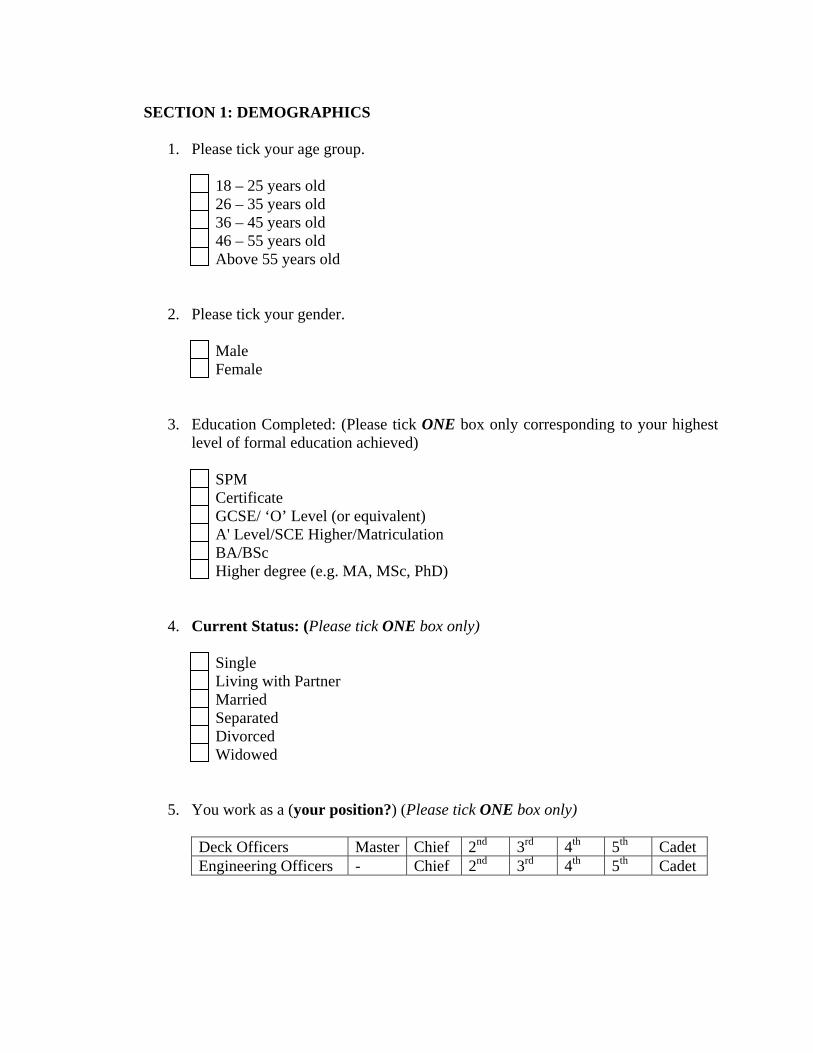
SECTION 1: DEMOGRAPHICS
1. Please tick your age group.
18 – 25 years old 26 – 35 years old 36 – 45 years old 46 – 55 years old Above 55 years old
2. Please tick your gender.
Male Female
3. Education Completed: (Please tick ONE box only corresponding to your highest level of formal education achieved)
SPM Certificate GCSE/ ‘O’ Level (or equivalent) A' Level/SCE Higher/Matriculation BA/BSc Higher degree (e.g. MA, MSc, PhD)
4. Current Status: (Please tick ONE box only) Single Living with Partner Married Separated Divorced Widowed
5. You work as a (your position?) (Please tick ONE box only) Deck Officers Master Chief 2nd 3rd 4th 5th Cadet Engineering Officers - Chief 2nd 3rd 4th 5th Cadet
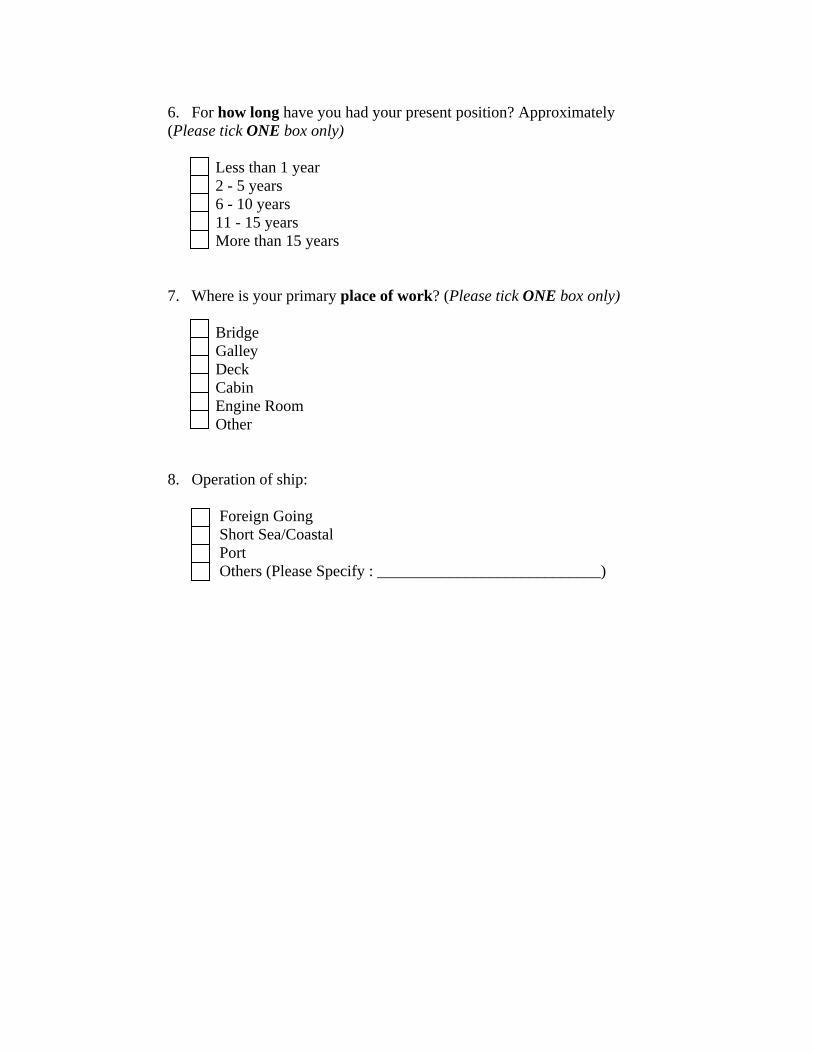
6. For how long have you had your present position? Approximately (Please tick ONE box only)
Less than 1 year 2 - 5 years 6 - 10 years 11 - 15 years More than 15 years
7. Where is your primary place of work? (Please tick ONE box only) Bridge
Galley Deck Cabin Engine Room Other
8. Operation of ship: Foreign Going
Short Sea/Coastal Port Others (Please Specify : ____________________________)

SECTION 2 : SOURCES AND LEVEL OF FATIGUE
PART A : NATURE OF WORK
Please circle one number for each item
Nev
er
Alm
ost
Nev
er
Som
etim
e
Alm
ost
Alw
ays
Alw
ays
1. Do you do shift work? 1 2 3 4 5
2. Do you have unpredictable working hours? 1 2 3 4 5
3. Do you have to work long or unsociable hours? 1 2 3 4 5
4.
Do you ever consider your working hours to present a danger to your personal health and safety?
1 2 3 4 5
5. How do you explain your beliefs that the effects of fatigue increase the longer you are at sea?
1 2 3 4 5
6. Do you feel sleepier (exhausted/tired) at all the time by end of your working shift?
1 2 3 4 5
7. Do you ever consider switching night shift with your teammates?
1 2 3 4 5
8.
Do you ever consider that short shift system is generally a better option to reduce source of fatigue?
1 2 3 4 5
9. Do you experience feelings of nausea brought on by motion effects?
1 2 3 4 5
4 O
n 4
Off
6 O
n 6
Off
8 O
n 8
Off
12 O
n 12
Off
Oth
er
10. What should be the most common shift schedule in a 24-hour period?(Hours)
1 2 3 4 5
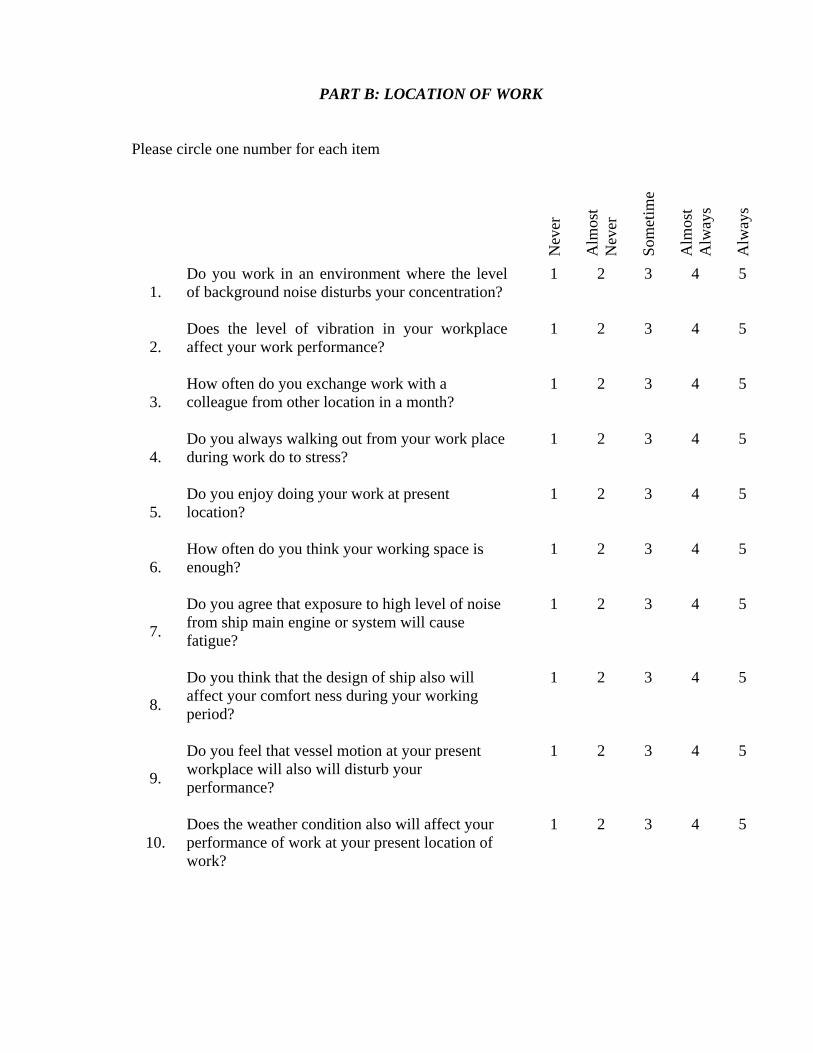
PART B: LOCATION OF WORK
Please circle one number for each item
Nev
er
Alm
ost
Nev
er
Som
etim
e
Alm
ost
Alw
ays
Alw
ays
1. Do you work in an environment where the level of background noise disturbs your concentration?
1 2 3 4 5
2. Does the level of vibration in your workplace affect your work performance?
1 2 3 4 5
3. How often do you exchange work with a colleague from other location in a month?
1 2 3 4 5
4. Do you always walking out from your work place during work do to stress?
1 2 3 4 5
5. Do you enjoy doing your work at present location?
1 2 3 4 5
6. How often do you think your working space is enough?
1 2 3 4 5
7.
Do you agree that exposure to high level of noise from ship main engine or system will cause fatigue?
1 2 3 4 5
8.
Do you think that the design of ship also will affect your comfort ness during your working period?
1 2 3 4 5
9.
Do you feel that vessel motion at your present workplace will also will disturb your performance?
1 2 3 4 5
10. Does the weather condition also will affect your performance of work at your present location of work?
1 2 3 4 5

PART C: TECHNOLOGY ONBOARD SHIP
Please circle one number for each item.
Nev
er
Alm
ost
Nev
er
Som
etim
e
Alm
ost
Alw
ays
Alw
ays
1.
How do you describe the usage of technology? Do you enjoy doing your work with help of technology?
1 2 3 4 5
2. In completing your task, does your job ever require you to get the technology assistance?
1 2 3 4 5
3. How often do you experience feeling tension while using technology?
1 2 3 4 5
4.
When you operate the technology, how often do you feel tired and yawn?
1 2 3 4 5
5.
Have you experience feeling weak and shaky while performing task by using high technology equipment onboard ship?
1 2 3 4 5
6. Do you think that the application of technology will decrease crew alertness?
1 2 3 4 5
7.
Do you ever experience the situation when you are not sure of the action taken while you are operating any hi-tech equipment or system onboard ship?
1 2 3 4 5
8.
Do you think the technology onboard ship will reduce an effect of fatigue during your duty period and improve the seafarer‘s quality of life?
1 2 3 4 5
Not
at a
ll
A li
ttle
Som
etim
e
Usu
ally
Alw
ays
9. Do you think the technology will simplify your job/task?
1 2 3 4 5
10. Do you think technology onboard ship will help the ship safety and operation of overall ship?
1 2 3 4 5
Conditionsfor change
A NUMAST surveyand report on
working conditions intoday’s shipping
industry
‘Life at sea isn’t what it was…’ If members had a poundfor every time they heard that statement, many wouldnow be extremely wealthy.
The shipping industry has changed dramatically in thepast 25 years. It has always been international in its nature, but in recent years globalisation has beenexploited to the full. There has been a marked exodus from traditional maritime nations — often toconvenience registers.
This exodus has been accompanied by the growing use of low cost seafaring labour and a massivereduction in the level of maritime recruitment and training in countries such as the UK. According toa study commissioned by the International Labour Organisation, two-thirds of the world’s merchantfleet is now operated by multinational crews and one ship in every 10 is crewed by more than fivedifferent seafarer nationalities.
At the same time, there have been marked changes in technology at sea, with the introduction ofnew equipment, new technology and new systems such as GMDSS having a profound impact onworking practices and employment.
How have these changes impacted on officers today? NUMAST has conducted a major researchproject to update earlier work carried out over the past decade.
The results — which are based on returns from around 10% of NUMAST’s seagoing membership —must act as a catalyst for change by shipowners, managers, regulators and all those concerned withsetting standards for the industry.
Brian OrrellGeneral secretary
1Social conditions survey
Foreword

2 Social conditions survey
3Social conditions survey
Executive summary
‘Human factor’ issues are increasingly recognised as being of fundamental importance to the safeand efficient operation of ships.
A great deal of work is being undertaken at international level to address long-standing concernsabout the social conditions experienced by seafarers in the world merchant fleet.
However, it is clear that there are still many issues in need of serious attention. A recent survey byLloyd’s Ship Manager, for example, showed that almost 80% of shipowners and managers have problems in attracting ‘quality seafarers’.
Similarly, there is a strong consensus within the industry that shipping needs to do much more toimprove its image to attract intelligent, motivated and committed young people.
This NUMAST report provides a unique insight into the issues that the industry needs to address.Based on detailed survey forms completed by some 10% of the Union’s seagoing membership, itupdates previous research projects undertaken by NUMAST in 1991 and ITF and MORI in 1996.
The report contains the feedback obtained from senior professional staff at the sharp end of operations in today’s shipping industry. It shows their views and perceptions of important elementsof their job, their role and their responsibilities.
Key findings include:
✪ between 60-80% consider that workloads, stress, fatigue,morale and company loyalty have declined over the past decade
✪ almost 50% say job satisfaction has deteriorated over the past 10 years and only 8% say it has improved
✪ fewer than one-third consider they are provided with sufficient opportunity to influence fleet company policy
✪ almost 20% believe that they do not have sufficient seafarers onboard to safely operate their vessel
These are findings of immense importance to a vital international industry and NUMAST concludesits report with a series of recommendations intended to improve the situation.
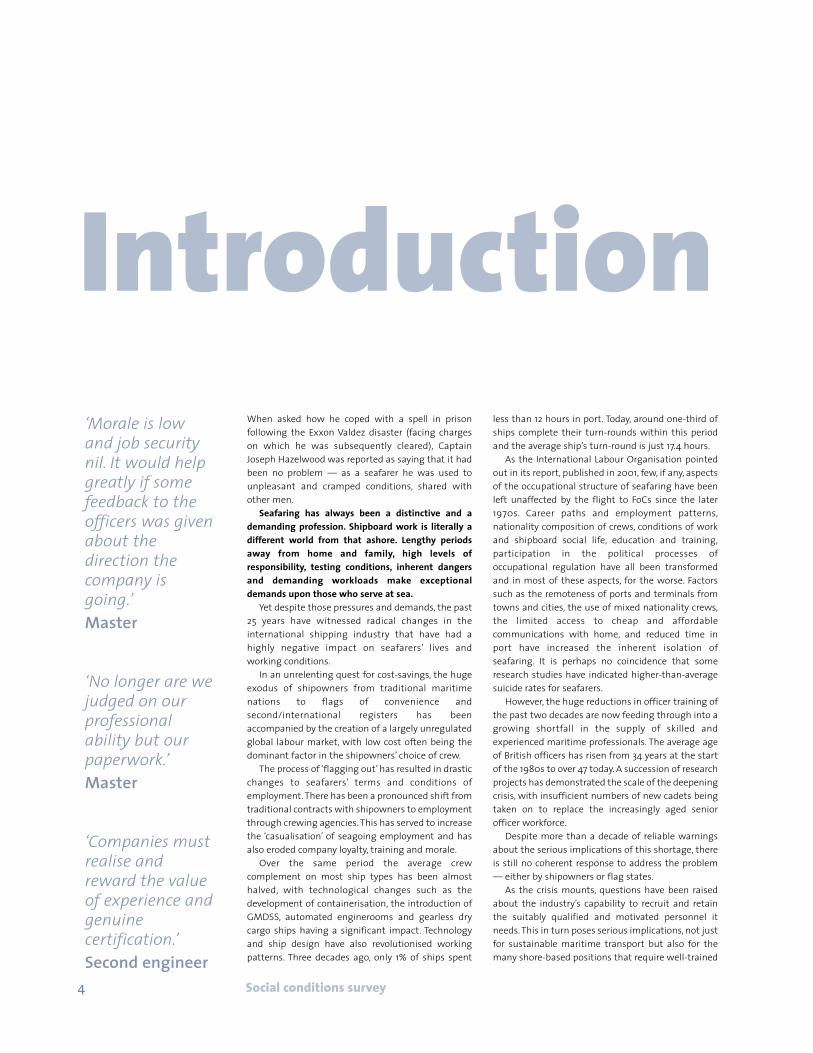
4 Social conditions survey
When asked how he coped with a spell in prisonfollowing the Exxon Valdez disaster (facing chargeson which he was subsequently cleared), CaptainJoseph Hazelwood was reported as saying that it hadbeen no problem — as a seafarer he was used tounpleasant and cramped conditions, shared withother men.
Seafaring has always been a distinctive and ademanding profession. Shipboard work is literally adifferent world from that ashore. Lengthy periodsaway from home and family, high levels ofresponsibility, testing conditions, inherent dangersand demanding workloads make exceptionaldemands upon those who serve at sea.
Yet despite those pressures and demands, the past25 years have witnessed radical changes in theinternational shipping industry that have had ahighly negative impact on seafarers’ lives andworking conditions.
In an unrelenting quest for cost-savings, the hugeexodus of shipowners from traditional maritimenations to flags of convenience andsecond/international registers has beenaccompanied by the creation of a largely unregulatedglobal labour market, with low cost often being thedominant factor in the shipowners’ choice of crew.
The process of ‘flagging out’ has resulted in drasticchanges to seafarers’ terms and conditions ofemployment. There has been a pronounced shift fromtraditional contracts with shipowners to employmentthrough crewing agencies. This has served to increasethe ‘casualisation’ of seagoing employment and hasalso eroded company loyalty, training and morale.
Over the same period the average crewcomplement on most ship types has been almosthalved, with technological changes such as thedevelopment of containerisation, the introduction ofGMDSS, automated enginerooms and gearless drycargo ships having a significant impact. Technologyand ship design have also revolutionised workingpatterns. Three decades ago, only 1% of ships spent
less than 12 hours in port. Today, around one-third ofships complete their turn-rounds within this periodand the average ship’s turn-round is just 17.4 hours.
As the International Labour Organisation pointedout in its report, published in 2001, few, if any, aspectsof the occupational structure of seafaring have beenleft unaffected by the flight to FoCs since the later1970s. Career paths and employment patterns,nationality composition of crews, conditions of workand shipboard social life, education and training,participation in the political processes ofoccupational regulation have all been transformedand in most of these aspects, for the worse. Factorssuch as the remoteness of ports and terminals fromtowns and cities, the use of mixed nationality crews,the limited access to cheap and affordablecommunications with home, and reduced time inport have increased the inherent isolation ofseafaring. It is perhaps no coincidence that someresearch studies have indicated higher-than-averagesuicide rates for seafarers.
However, the huge reductions in officer training ofthe past two decades are now feeding through into agrowing shortfall in the supply of skilled andexperienced maritime professionals. The average ageof British officers has risen from 34 years at the startof the 1980s to over 47 today. A succession of researchprojects has demonstrated the scale of the deepeningcrisis, with insufficient numbers of new cadets beingtaken on to replace the increasingly aged seniorofficer workforce.
Despite more than a decade of reliable warningsabout the serious implications of this shortage, thereis still no coherent response to address the problem— either by shipowners or flag states.
As the crisis mounts, questions have been raisedabout the industry’s capability to recruit and retainthe suitably qualified and motivated personnel itneeds. This in turn poses serious implications, not justfor sustainable maritime transport but also for themany shore-based positions that require well-trained
Introduction‘Morale is lowand job securitynil. It would helpgreatly if somefeedback to theofficers was givenabout thedirection thecompany isgoing.’Master
‘No longer are wejudged on ourprofessionalability but ourpaperwork.’Master
‘Companies mustrealise andreward the valueof experience andgenuinecertification.’Second engineer

and experienced former seafarers.If the industry and flag states are to respond to
this crisis in a meaningful way, they must look beyondthe basic need to provide suitable training facilitiesand cadetships. Seafarers must be recruited properly,well trained throughout their career, given decent payand working conditions and reasonable workinghours, given access to good recreation and welfarefacilities at sea and in port, and provided with a careerpath that encourages them to stay in the industry.
NUMAST believes that shipowners have to start totreat their professional seafarers as the increasinglyscarce resource that they undoubtedly are, and endthe destructive and short-termist policies that havedone so much damage to maritime employmentconditions.
In his 1975 book, The Human Element in Shipping,Professor David Moreby reminded the industry of theimportance of appreciating and understanding theattitudes of seafarers. Pointing out that seafaring isnot just another job but rather a way of life, he argued— over a quarter of a century ago — that: ‘We mayneed to pay some attention to taking positive stepsto upgrading the prestige of seafaring in the countryat large.’
Shipping is one of the world’s most importantindustries. The world merchant fleet transports morethan 90 per cent of global trade and modern societyhas an increasing reliance upon the commodities —particularly hazardous and dangerous cargoes — thatare carried by ships. It is therefore essential thatinternational shipping is crewed by seafarers who arewell-trained, highly skilled, adequately rewarded, andhighly motivated. This research suggests that, inmany key areas, the industry and those who regulateit, are presently failing to pursue policies that fulfilthose goals.
THE FINDINGS
AGE
NUMAST’s survey resultsreflect the increasinglyhigh average age ofofficers from traditionalmaritime nations such asthe UK. Almost three-quarters of those takingpart in the research wereaged over 40 and onlyone-eighth were under 30. This contrasts with theITF/MORI survey, in which 60% of those taking partwere aged 40 or under and 36% were aged between31 and 40. Interestingly, the ITF/MORI study found thatNew Zealand and UK flag vessels had the longestserving crews.
NATIONALITYAgain, the survey results reflect the nature ofNUMAST membership. Just over 94% of those takingpart were British, 2.3% Irish and all but 0.7% of theremainder being from Common-wealth countries.
CERTIFICATESSimilarly, the overwhelming majority of those takingpart (more than 85%) possessed certificates issued inthe UK. A significant number also had certificatesissued by the authorities in Australia, New Zealand,Canada, Ireland, Liberia and Panama.
LENGTH OF SERVICE
Not surprisingly,given the age profileof those surveyed,the results showextensive sea service,More than 86% havebeen a seafarer forover a decade(compared with 51% in the ITF/MORI survey) andfewer than 8% have five years’ or less seagoingexperience.
RANK
In line with the age, experience and certification ofthe survey respondents, a significant proportion werehigh ranking: almost one-third were masters; one-fifth chief engineer officers and 12.5% were chiefofficers/mates. The survey also covered a wide rangeof other ranks and roles, including: superintendents;cadets; marine pilots; communications and radioofficers; electrotechnical officers; systems engineers;dynamic positioning officers; refrigeration andautomation engineers; purser/catering officers;supply and administration officers; medical officers;and ships’ security officers.
5
The findings
‘I would, all thingsconsidered, preferto be working athome. Thecompany I workfor tends to treatseafarers asnumbers ratherthan names.’Third engineer
‘So long as we areglorified clerksworking excessivehours at the beckand call ofaccountants,young people willhave no desire togo to sea unlessthey are so stupidthat they wouldnot be able topass the requiredexams.’Master
‘Standards ofaccommodationin my industryhave declineddramatically.Cabin sharing isbecoming morecommon andsizes of cabins areshrinking. Weseem to havegone back 50years.’Chief engineer
No of years %
< 6 months 1.16–12 months 1.71–5 years 5.05–10 years 5.5> 10 years 86.6
Age %
16–20 1.921–30 10.731–40 14.141–50 37.851–60 32.6> 60 2.9
How old are you?
How long have you been aseafarer/served at sea?
Social conditions survey
Rank Totals
Eng:35.9%
Masters: 32.7%Deck:
24.5%
Other:6.9%
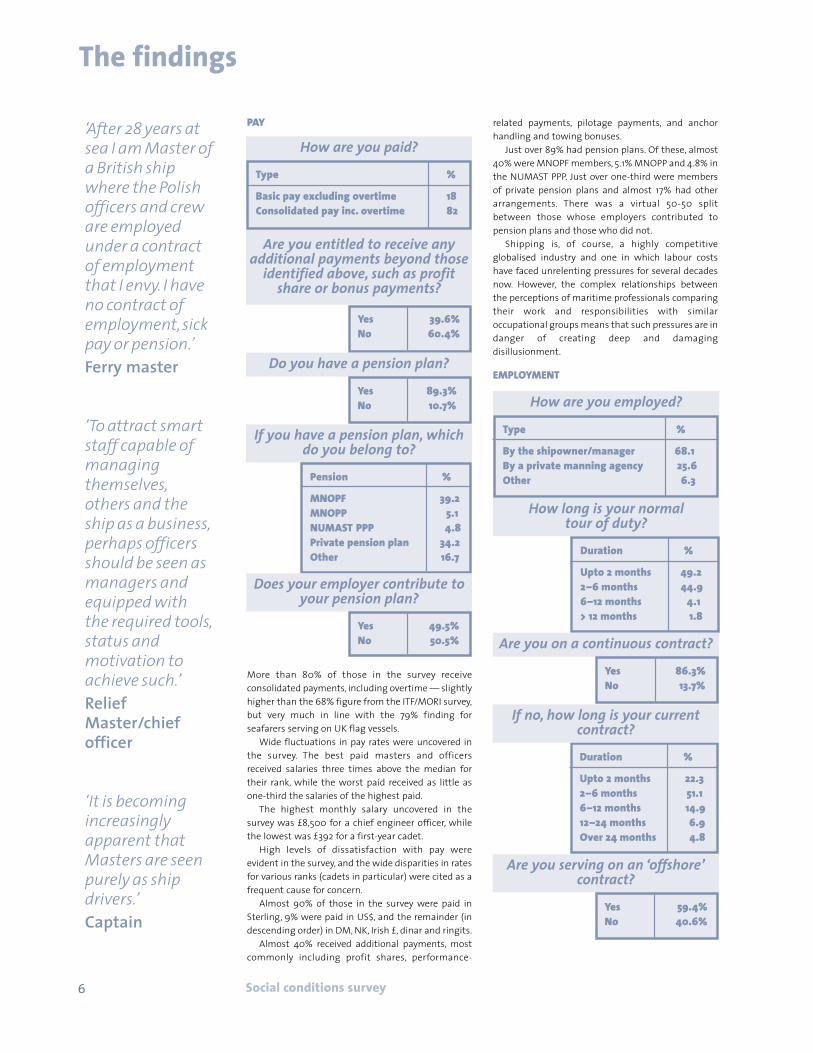
PAY
More than 80% of those in the survey receiveconsolidated payments, including overtime — slightlyhigher than the 68% figure from the ITF/MORI survey,but very much in line with the 79% finding forseafarers serving on UK flag vessels.
Wide fluctuations in pay rates were uncovered inthe survey. The best paid masters and officersreceived salaries three times above the median fortheir rank, while the worst paid received as little asone-third the salaries of the highest paid.
The highest monthly salary uncovered in thesurvey was £8,500 for a chief engineer officer, whilethe lowest was £392 for a first-year cadet.
High levels of dissatisfaction with pay wereevident in the survey, and the wide disparities in ratesfor various ranks (cadets in particular) were cited as afrequent cause for concern.
Almost 90% of those in the survey were paid inSterling, 9% were paid in US$, and the remainder (indescending order) in DM, NK, Irish £, dinar and ringits.
Almost 40% received additional payments, mostcommonly including profit shares, performance-
related payments, pilotage payments, and anchorhandling and towing bonuses.
Just over 89% had pension plans. Of these, almost40% were MNOPF members, 5.1% MNOPP and 4.8% inthe NUMAST PPP. Just over one-third were membersof private pension plans and almost 17% had otherarrangements. There was a virtual 50-50 splitbetween those whose employers contributed topension plans and those who did not.
Shipping is, of course, a highly competitiveglobalised industry and one in which labour costshave faced unrelenting pressures for several decadesnow. However, the complex relationships betweenthe perceptions of maritime professionals comparingtheir work and responsibilities with similaroccupational groups means that such pressures are indanger of creating deep and damagingdisillusionment.
EMPLOYMENT
6
The findings
‘After 28 years atsea I am Master ofa British shipwhere the Polishofficers and creware employedunder a contractof employmentthat I envy. I haveno contract ofemployment,sickpay or pension.’Ferry master
‘To attract smartstaff capable ofmanaging themselves,others and theship as a business,perhaps officersshould be seen asmanagers andequipped withthe required tools,status and motivation toachieve such.’ReliefMaster/chiefofficer
‘It is becomingincreasinglyapparent thatMasters are seenpurely as shipdrivers.’Captain
Yes 39.6%No 60.4%
Are you entitled to receive anyadditional payments beyond those
identified above, such as profitshare or bonus payments?
How are you employed?Type %
By the shipowner/manager 68.1By a private manning agency 25.6Other 6.3
Duration %
Upto 2 months 49.22–6 months 44.96–12 months 4.1> 12 months 1.8
How long is your normal tour of duty?
Do you have a pension plan?Yes 89.3%No 10.7%
If you have a pension plan, whichdo you belong to?
Pension %
MNOPF 39.2MNOPP 5.1NUMAST PPP 4.8Private pension plan 34.2Other 16.7
Does your employer contribute toyour pension plan?
Yes 49.5%No 50.5% Are you on a continuous contract?
Yes 86.3%No 13.7%
Duration %
Upto 2 months 22.32–6 months 51.16–12 months 14.912–24 months 6.9Over 24 months 4.8
Are you serving on an ‘offshore’contract?
Yes 59.4%No 40.6%
If no, how long is your currentcontract?
Social conditions survey
How are you paid?Type %
Basic pay excluding overtime 18Consolidated pay inc. overtime 82
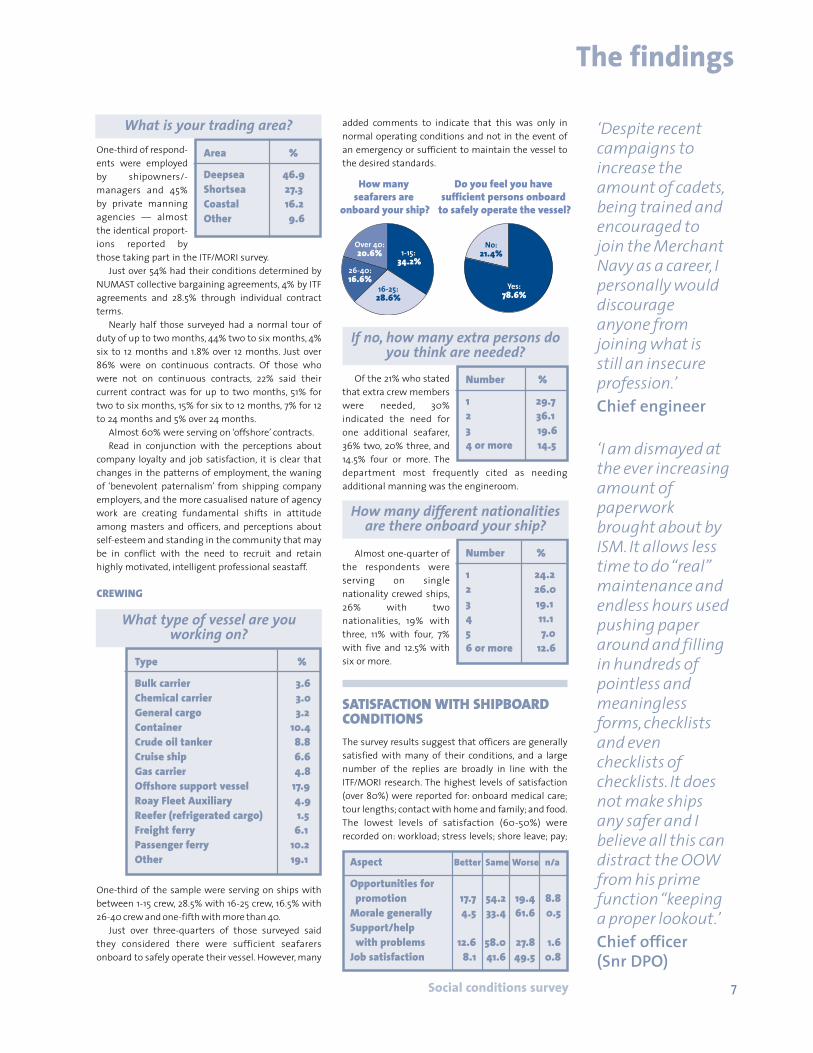
‘Despite recentcampaigns toincrease theamount of cadets,being trained andencouraged tojoin the MerchantNavy as a career, Ipersonally woulddiscourageanyone from joining what isstill an insecureprofession.’Chief engineer
‘I am dismayed atthe ever increasingamount of paperworkbrought about byISM. It allows lesstime to do “real”maintenance andendless hours usedpushing paperaround and fillingin hundreds ofpointless andmeaninglessforms,checklistsand even checklists ofchecklists. It doesnot make shipsany safer and Ibelieve all this candistract the OOWfrom his primefunction “keepinga proper lookout.’Chief officer (Snr DPO)
One-third of respond-ents were employedby shipowners/-managers and 45%by private manningagencies — almostthe identical proport-ions reported bythose taking part in the ITF/MORI survey.
Just over 54% had their conditions determined byNUMAST collective bargaining agreements, 4% by ITFagreements and 28.5% through individual contractterms.
Nearly half those surveyed had a normal tour ofduty of up to two months, 44% two to six months, 4%six to 12 months and 1.8% over 12 months. Just over86% were on continuous contracts. Of those whowere not on continuous contracts, 22% said theircurrent contract was for up to two months, 51% fortwo to six months, 15% for six to 12 months, 7% for 12to 24 months and 5% over 24 months.
Almost 60% were serving on ‘offshore’ contracts.Read in conjunction with the perceptions about
company loyalty and job satisfaction, it is clear thatchanges in the patterns of employment, the waningof ‘benevolent paternalism’ from shipping companyemployers, and the more casualised nature of agencywork are creating fundamental shifts in attitudeamong masters and officers, and perceptions aboutself-esteem and standing in the community that maybe in conflict with the need to recruit and retainhighly motivated, intelligent professional seastaff.
CREWING
One-third of the sample were serving on ships withbetween 1-15 crew, 28.5% with 16-25 crew, 16.5% with26-40 crew and one-fifth with more than 40.
Just over three-quarters of those surveyed saidthey considered there were sufficient seafarersonboard to safely operate their vessel. However, many
added comments to indicate that this was only innormal operating conditions and not in the event ofan emergency or sufficient to maintain the vessel tothe desired standards.
Of the 21% who statedthat extra crew memberswere needed, 30%indicated the need forone additional seafarer,36% two, 20% three, and14.5% four or more. Thedepartment most frequently cited as needingadditional manning was the engineroom.
Almost one-quarter ofthe respondents wereserving on singlenationality crewed ships,26% with twonationalities, 19% withthree, 11% with four, 7%with five and 12.5% withsix or more.
SATISFACTION WITH SHIPBOARDCONDITIONSThe survey results suggest that officers are generallysatisfied with many of their conditions, and a largenumber of the replies are broadly in line with theITF/MORI research. The highest levels of satisfaction(over 80%) were reported for: onboard medical care;tour lengths; contact with home and family; and food.The lowest levels of satisfaction (60-50%) wererecorded on: workload; stress levels; shore leave; pay;
7Social conditions survey
The findings
Area %
Deepsea 46.9Shortsea 27.3Coastal 16.2Other 9.6
What type of vessel are youworking on?
What is your trading area?
Type %
Bulk carrier 3.6Chemical carrier 3.0General cargo 3.2Container 10.4Crude oil tanker 8.8Cruise ship 6.6Gas carrier 4.8Offshore support vessel 17.9Roay Fleet Auxiliary 4.9Reefer (refrigerated cargo) 1.5Freight ferry 6.1Passenger ferry 10.2Other 19.1
1-15: 34.2%
16-25:28.6%
26-40:16.6%
Over 40:20.6%
Yes:78.6%
No:21.4%
How many seafarers are
onboard your ship?
Do you feel you have sufficient persons onboard
to safely operate the vessel?
Number %
1 29.72 36.13 19.64 or more 14.5
If no, how many extra persons doyou think are needed?
Number %
1 24.22 26.03 19.14 11.15 7.06 or more 12.6
How many different nationalitiesare there onboard your ship?
Aspect Better Same Worse n/a
Opportunities for promotion 17.7 54.2 19.4 8.8
Morale generally 4.5 33.4 61.6 0.5Support/help
with problems 12.6 58.0 27.8 1.6Job satisfaction 8.1 41.6 49.5 0.8

and job security. Thetwo fields with amajority expressingdissatisfaction wererecreational facilitiesonboard and morale.
Whilst the surveyresults indicate that,overall, officers aregenerally satisfied withshipboard conditions, many of the accompanyingcomments demonstrate an underlying dissatisfactionwith key aspects of their profession.
The answers to questions about changes over thepast decade also indicate that many officers believethat conditions have declined in this period. Between60-80% considered that workloads, fatigue, stresslevels, working hours, company loyalty and moralehad worsened over the past 10 years or so. A majorityof those expressing views also considered thatmanning levels, shore leave, pay and job satisfactionhad also deteriorated. The only elements which wereperceived to have improved over the past decadewere health and safety and contact with home andfamily.
Once again, many of the results in the NUMASTresearch are in line with those obtained during theITF/MORI study five years previously. Compared withthe NUMAST Conditions for Change report, of adecade ago, the results show a slight reduction in theproportions considering that working hours, fatigueand stress have worsened in the past 10 years. Theproportions reporting an improvement in workinghours have increased from 1% in 1992 to 8% today andmore than 52% now consider health and safety tohave improved in the past decade, compared with32% in the Conditions for Change survey.
However, there has been a marked decline in theproportions noting an improvement in jobsatisfaction and a small reduction in the numbersconsidering that company loyalty has got better.
It is clear from the study and comments made insurvey reports that elements of these trends, as notedearlier, have an adverse impact on the seafarers’perceptions of their roles and responsibilities, and ontheir attitudes towards their profession. Moretransient employment patterns and reducedcompany loyalty often mean a substantial change inthe relationship of masters and officers to theiremployers and to their colleagues, as well as reducedunderstanding of the ships and the trades in whichthey serve.
8 Social conditions survey
Satisfaction
Although the shipis new and safetystandards arefairly high, thecompany treatsseastaff verypoorly. 12% isadded to sat-phonecharges,and creware not allowed touse e-mail.Tanker master
‘Accommodationlevels andcommon roomsvery basic,withshore leave all butimpossible.Thewhole trip is spentonboard,soimprovementwould bewelcome.’Master
‘Shipownersshould providemore onboardleisure activities.For too long it hasbeen thoughtthat a box ofvideos is sufficient. It isn’t!’Master
30 40 50 60 70 80 90
% satisfaction with specific aspects of shipboard life
Working hours
Workload
Stress levels
Manning levels
Time for sleep/rest
Shore leave
Tour lengths
Recreationalfacilities onboard
Travel to/from ship
On board medical care
Contact with home/family
Accommodation
Food
Pay
Job security
Provision of training
Opportunities for promotion
Morale generally
Support/help with problems
67.6%
55.8%
52.8%
68.7%
67.5%
56.1%
81.5%
48.3%
74.1%
82.1%
80.7%
75.2%
80.1%
51.9%
59.1%
64.7%
68.9%
49.3%
61.3%
%
0 20 40 60 80 100
Working hours
Fatigue
Workload
Stress levels
Health & safety
Morale
Company loyalty
Manning levels
Time for sleep/rest
Shore leave
Tour lengths
Recreational facilities onboard
Travel to/from ship
Onboard medical care
Contact withhome/family
Accommodation
Food
Pay
Job security
Provision of traiing
Opportunities for promotion
Morale generally
Support/help with problems
Job satisfaction
How, if at all, have the following aspects of life onboard changed in the last 10 years
Better Same Worse Not applicable
%
Method %
Under NUMAST collective bargaining agreement 54.3Under ITF agreement 4.0Under individual contract terms 28.5None of the above 13.2
How are your conditionsdetermined?
Yes:67.1%
No:32.9%
Do you consider the conditions on your ship reflect your status as
an experienced professional seafarer?
Do yougiven ththe respo

SAFETYSeafaring has always been adangerous occupation, andthe survey results underlinethe scale of shipboardaccidents — even though alarge majority rate theirvessels as safe. One-quarter ofofficers rated the overallsafety condition of their ship asexcellent, almost 55% described itas good, almost 18% average and only 1.1% poor. Thesefigures are markedly higher than those reported bythe participants in the ITF/MORI survey – althoughthat report noted that masters and senior officers aremore likely to give a high safety rating to their shipsthan other ranks.
However, as with the ITF/MORI study, it appearsthat accidents are a frequent occurrence onboard.Accidents involving crew members slipping or fallingdominate, reported by more than 73% of those in thesurvey as having occurred on their ship. Just over 40%reported incidents involving fire, almost 35% accidentsduring loading or unloading in port, almost one-thirdcollapse of equipment or structures, and just under30% rope-related accidents. All these figures aresignificantly higher than the accident rates reportedby those taking part in the ITF/MORI survey.
More than 12% of thosesurveyed said the mostrecent accident onboardtheir ship had taken placewithin the previous monthand more than 40%reported an accident ontheir vessel within theprevious two to six months— slightly higher than the general ITF/MORI rates, butin line with that survey’s findings for UK seafarers (ofwhom 44% reported at least one accident onboardtheir ship in the previous six months). Only 6.3% ofthose in the NUMAST survey said there had been noaccidents onboard their ships in recent years,compared with 22% in the ITF/MORI report.
More than 80% said the accidents had beenproperly recorded in an official book — significantlyhigher than the numbers reported to ITF/MORI, andperhaps indicating that UK seafarers are well-disciplined in reporting accidents and incidents.
The frequency of safety training appears high, withmore than one-third reporting some safety trainingin the past month and 70% having received someform of safety training in the previous year.
In terms of shipboard safety, respondents weremost likely to rate lifeboats as being in poor condition,followed by structure/hull and deck/other surfaces.The highest safety ratings were given to fire-fightingequipment,enginerooms and ladders and railings.
RESPONSIBILITY/RESOURCES
Almost two-thirds of officers said the conditionsonboard their ship reflected their status as a profes-sional seafarer,and around 60% said the were given theresources and the authority to meet the responsibilitiesexpected of them as skilled professionals. These resultsare a marked change from the Conditions for Changequestionnaire carried out a decade earlier, whichshowed figures almost the complete reverse.Could it be
9Social conditions survey
Safety
‘Safetyinspections, safetydrills and safetytraining alwayshave been anintegral part oflife at sea, but asmore and more ofthe officers onany ship are beingdragged underthe flood of ISMpaperwork thenthe time availableto physically lookafter the vesseland itscomplement isbecoming severelylimited and willonly improve ifminimummanningcertificates areamended to takeaccount of thishuge extraworkload… Thesafety has alwaysbeen there. It isthe paperworkwhich could beputting lives atrisk.’Chief engineer
0 20 40 60 80 100
Thinking about safety on board your ship,how would you rate each of the following?
Good Average Poor
Firefighting equipment
Lifeboats
Engine room
Structure/hull
Ladders/railings
Deck/other surfaces
Work supervision
Excellent:25.4%
Good:55.5%
Average:18.0%
Poor: 1.1%
How would you rate theoverall safety of your vessel?
0 20 40 60 80
Fire
Collapse of equipment/structure
Crew member slipping/falling
Rope accident
Incident duringon/off loading in port
Other
Have any of the following accidentsoccurred onboard your ship?
42.4%
32.4%
73.4%
29.3%
34.6%
20.9%
<1 month:12.8%
2–6 months:40.1%
6–12 months:17.5%
1–2 years:10.2%
Over 2 years: 8.2%
No acci- dents: 6.3%
Don'tknow: 4.8%
How long ago did the most recent accident onboard occur?
Yes 87.4%No 4.4%Don’t know 8.2%
Was this accident properly recorded in an official book?
When were you lastgiven safety training?
<1 month:35.7%
2–6 months:22.9%
6–12 months:
11.5%
1–2 years:10.0%
Over 2 years:15.8%
Never:4.4%
When were you last givenany other kind of training?
<1 month:29.4%
2–6 months:23.1%
6–12 months:13.6%
1–2 years:13.2%
Over 2 years:15.8%
Never: 4.4%
Do you consider you are provided with sufficient opportunity to influence
fleet company policy as it affects your employment?
Yes:27.9%
No:72.1%
Do you consider that you should be?
Yes:93.2%
No:6.8%
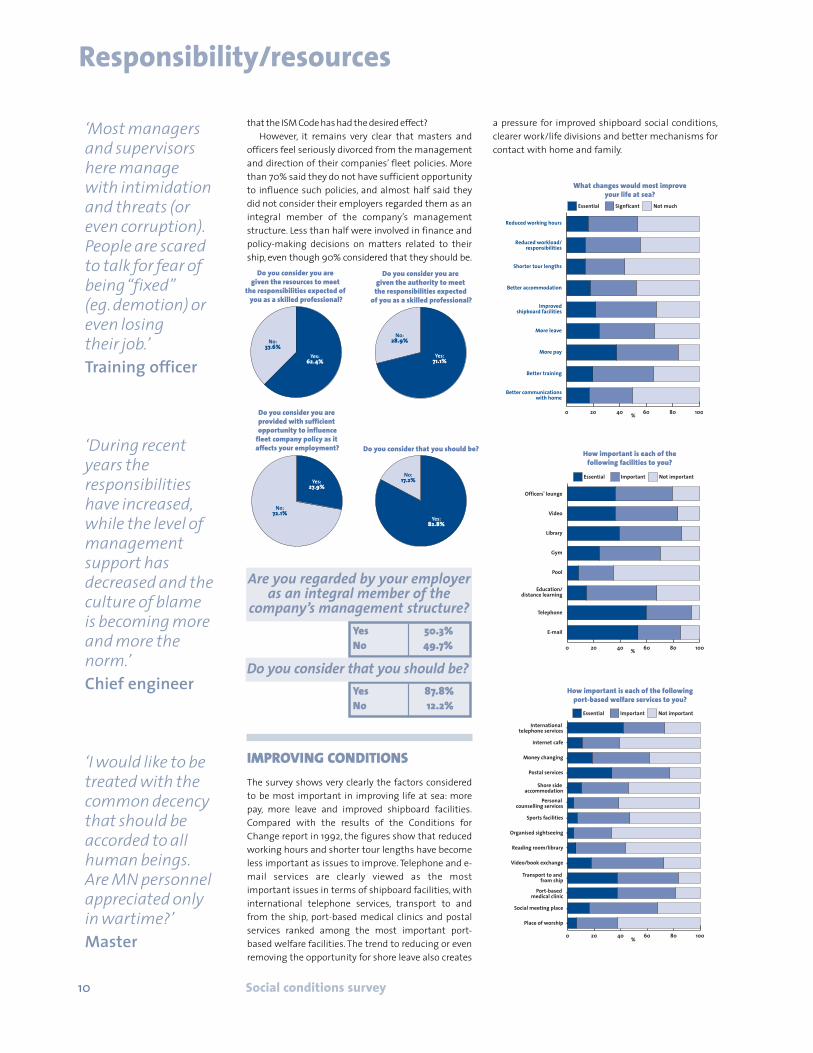
that the ISM Code has had the desired effect?However, it remains very clear that masters and
officers feel seriously divorced from the managementand direction of their companies’ fleet policies. Morethan 70% said they do not have sufficient opportunityto influence such policies, and almost half said theydid not consider their employers regarded them as anintegral member of the company’s managementstructure. Less than half were involved in finance andpolicy-making decisions on matters related to theirship, even though 90% considered that they should be.
IMPROVING CONDITIONSThe survey shows very clearly the factors consideredto be most important in improving life at sea: morepay, more leave and improved shipboard facilities.Compared with the results of the Conditions forChange report in 1992, the figures show that reducedworking hours and shorter tour lengths have becomeless important as issues to improve. Telephone and e-mail services are clearly viewed as the mostimportant issues in terms of shipboard facilities, withinternational telephone services, transport to andfrom the ship, port-based medical clinics and postalservices ranked among the most important port-based welfare facilities. The trend to reducing or evenremoving the opportunity for shore leave also creates
a pressure for improved shipboard social conditions,clearer work/life divisions and better mechanisms forcontact with home and family.
10
Responsibility/resources
‘Most managersand supervisorshere managewith intimidationand threats (oreven corruption).People are scaredto talk for fear ofbeing “fixed”(eg. demotion) oreven losing their job.’Training officer
‘During recentyears the responsibilitieshave increased,while the level ofmanagementsupport hasdecreased and theculture of blameis becoming moreand more thenorm.’Chief engineer
‘I would like to betreated with thecommon decencythat should beaccorded to allhuman beings.Are MN personnelappreciated onlyin wartime?’Master
Do you consider you are given the authority to meet the responsibilities expected
of you as a skilled professional?
Yes:71.1%
No:28.9%
e t
ceit Do you
Do you consider you are given the resources to meet
the responsibilities expected of you as a skilled professional?
Yes:62.4%
No:37.6%
ou are to meet
0 20 40 60 80 100
Reduced working hours
Reduced workload/responsibilities
Shorter tour lengths
Better accommodation
Improvedshipboard facilities
More leave
More pay
Better training
Better communicationswith home
What changes would most improveyour life at sea?
Essential Signficant Not much
%
0 20 40 60 80 100%
International telephone services
Internet cafe
Money changing
Postal services
Shore side accommodation
Personal counselling services
Sports facilities
Organised sightseeing
Reading room/library
Video/book exchange
Transport to and from ship
Port-based medical clinic
Social meeting place
Place of worship
Essential Important Not important
How important is each of the followingport-based welfare services to you?
Are you regarded by your employeras an integral member of the
company’s management structure?Yes 50.3%No 49.7%
Yes 87.8%No 12.2%
Do you consider you are provided with sufficient opportunity to influence
fleet company policy as it affects your employment?
Yes:27.9%
No:72.1%
Do you consider that you should be?
Yes:82.8%
No:17.2%
Social conditions survey
Do you consider that you should be? 0 20 40 60 80 100%
Officers' lounge
Video
Library
Gym
Pool
Education/distance learning
Telephone
Essential Important Not important
How important is each of thefollowing facilities to you?
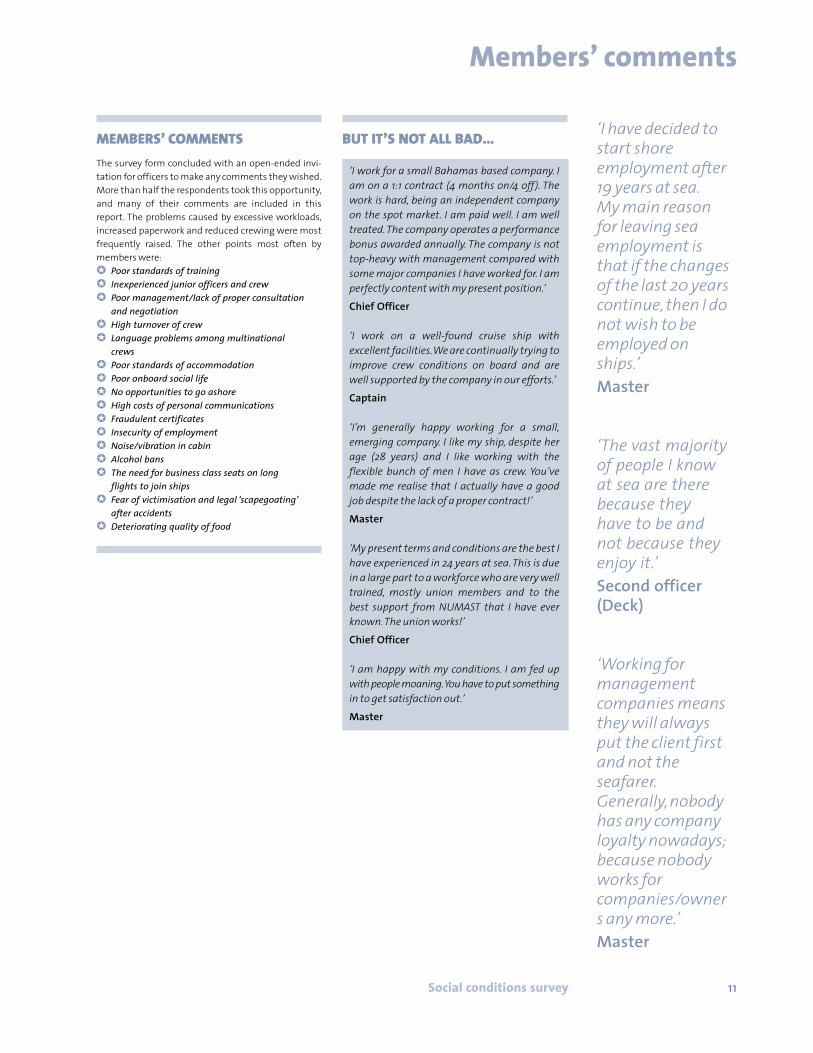
MEMBERS’ COMMENTSThe survey form concluded with an open-ended invi-tation for officers to make any comments they wished.More than half the respondents took this opportunity,and many of their comments are included in thisreport. The problems caused by excessive workloads,increased paperwork and reduced crewing were mostfrequently raised. The other points most often bymembers were:✪ Poor standards of training✪ Inexperienced junior officers and crew✪ Poor management/lack of proper consultation
and negotiation✪ High turnover of crew✪ Language problems among multinational
crews✪ Poor standards of accommodation✪ Poor onboard social life✪ No opportunities to go ashore✪ High costs of personal communications ✪ Fraudulent certificates✪ Insecurity of employment✪ Noise/vibration in cabin✪ Alcohol bans✪ The need for business class seats on long
flights to join ships✪ Fear of victimisation and legal ‘scapegoating’
after accidents✪ Deteriorating quality of food
BUT IT’S NOT ALL BAD…
‘I work for a small Bahamas based company. Iam on a 1:1 contract (4 months on/4 off). Thework is hard, being an independent companyon the spot market. I am paid well. I am welltreated.The company operates a performancebonus awarded annually. The company is nottop-heavy with management compared withsome major companies I have worked for. I amperfectly content with my present position.’
Chief Officer
‘I work on a well-found cruise ship with excellent facilities.We are continually trying toimprove crew conditions on board and arewell supported by the company in our efforts.’
Captain
‘I’m generally happy working for a small,emerging company. I like my ship, despite herage (28 years) and I like working with the flexible bunch of men I have as crew. You’vemade me realise that I actually have a goodjob despite the lack of a proper contract!’
Master
‘My present terms and conditions are the best Ihave experienced in 24 years at sea.This is duein a large part to a workforce who are very welltrained, mostly union members and to thebest support from NUMAST that I have everknown.The union works!’
Chief Officer
‘I am happy with my conditions. I am fed upwith people moaning.You have to put somethingin to get satisfaction out.’
Master
11Social conditions survey
Members’ comments
‘I have decided tostart shoreemployment after19 years at sea.My main reasonfor leaving seaemployment isthat if the changesof the last 20 yearscontinue, then I donot wish to beemployed onships.’Master
‘The vast majorityof people I knowat sea are therebecause theyhave to be andnot because theyenjoy it.’Second officer(Deck)
‘Working formanagementcompanies meansthey will alwaysput the client firstand not theseafarer.Generally,nobodyhas any companyloyalty nowadays;because nobodyworks for companies/owners any more.’Master

CONCLUSIONSNUMAST has welcomed the impetus to addressmaritime safety issues provided in recent years byaccidents such as the Erika. However, we continue tobelieve that such responses – though well motivated –repeatedly fail to tackle the fundamental core issuesthat undermine critical areas of safe operation,concentrating on immediate causes rather thandevoting deeper scrutiny to underlying issues. In fact,the case of the Erika demonstrated once again thatthe response to an accident is so often to detain,charge and incarcerate shipmasters and officers.
Successive studies have emphasised theimportance of the human element in safe shipping.Research has demonstrated that ‘human factors’ arecritical in as much as 90% of accidents at sea, so it iscrucial that we address the issues that underminehuman performance. Last year, IMO secretary-generalWilliam O’Neil spoke of his ‘gnawing concern’ aboutthe reasons why ‘intelligent, well-trained, highly-skilled and experienced seafarers make criticalmistakes despite the advances in technology whichhave been designed to make them more efficient and,by inference, safer in the way they operate.’ Hesuggested that a ‘combination of elements’ could beat the root of such incidents, including fatigue,boredom, health, familiarity, carelessness, familyproblems, pressure to meet schedules and shipboardliving conditions.
At its 20th session in November 1997, the IMOAssembly adopted Resolution A.850(20)on thehuman element vision, principles and goals. Thishighlighted the need for governments to encouragethose responsible for the management and operationof ships to develop, implement and assess safety andpollution prevention management systems. Theresolution acknowledged the need for increasedfocus on human-related activities in the safeoperation of ships, and the need to achieve andmaintain high standards of safety and environmentalprotection for the purpose of significantly reducingmaritime casualties. It pointed out: ‘The humanelement is a complex multi-dimensional issue thataffects maritime safety and marine environmentalprotection. It involves the entire spectrum of human
activities performed by ships’ crews, shore basedmanagement, regulatory bodies, recognisedorganisations, shipyards, legislators, and otherrelevant parties, all of whom need to cooperate toaddress human element issues.’
Despite such high-level initiatives, the shippingindustry and flag states have been slow to respond tothe repeated evidence of seriously adverse effects onthe human element created by destructive crewingpolicies. NUMAST believes that the increasedglobalisation of the shipping industry and the trendto use multinational crews, largely selected on thebasis of low cost, has created huge problems forseafarers — many of whom are effectivelydisenfranchised in terms of the social and welfareprotection that is extended to workers ashore. Even incountries such as the UK, seafarers are routinelyexcluded from domestic legislation coveringemployment, safety and welfare issues, and thisposition has been exacerbated by flagging out tocountries that lack either the political will or theresources to enforce international regulations andcodes.
NUMAST believes this survey has provided furtherevidence of the problems that create extensivedemoralisation and demotivation among seafarers.The findings from this latest survey underline onceagain how, despite this acknowledgement at thehighest level, the importance of the human factorcontinues to be ignored. It demonstrates how those‘at the sharp end’, with high levels of responsibilityand safety-critical duties, feel under-valued, over-worked and demotivated.
At a time when the shipping industry is facingever-increasing demands for safe and efficientoperations, the evidence that those with immediateresponsibility for discharging those duties are sodissatisfied is of immense concern.
Similarly, at a time when the industry is facing agrowing skills crisis, the levels of dissatisfaction withkey elements of work and conditions at sea are also ofconcern. Research conducted by London GuildhallUniversity shows that, on current trends, UK officernumbers will decline by more than 40% over the next
12 Social conditions survey
Conclusions
‘Manning, lack ofsupport fromhead office andincrease inpaperwork mademe leave my lastChief Engineer’sposition. Thestress levels hadbuilt up to suchan extent that Iwas makingmyself ill at thethought ofanother trip.’Second engineer
‘Officers at seawere once importantmembers of society,now weare less than meretechnicians,whilemore cargo iscarried at morerisk to the environment wetry to protect.A once nobleoccupation is nowto be avoided atall costs (look atpay levels andnew recruits).’Third engineerofficer
12 years. Cadet recruitment in the UK, and othertraditional maritime nations such as Greece andNorway, is at barely one-third the level acknowledgedas necessary to meet future needs. Internationally,the research suggests the world will be short of some46,000 officers by the end of this decade — or asmuch as 90,000 if world trade grows faster thanexpected. However, the shipping industryindisputably suffers from a negative public image,and the first-hand perceptions of senior staffreflected in this survey further fuel a poor perceptionof conditions that presents a serious obstacle to therecruitment and retention of properly skilled andqualified staff.
There is an urgent and increasing need forregulatory measures and changes in shippingcompany policies to end the continued downwardspiral in the nature of the seafaring profession. Thedecline of terms and conditions and the casualisationof the working environment have fosteredfundamental problems affecting the recruitment andretention of skilled professional staff, creating aserious long-term problem that exacerbates theinternational industry’s growing labour crisis.
NUMAST also believes that port state controlpolicies need to be developed far more extensively inthe area of ‘human factors’ and the social, workingand living conditions of the crew, including elementssuch as wages, working hours, communications,personal safety and welfare.
More work is also required to ensure that flagstates effectively monitor the operation of ships ontheir registries — including the social and welfareconditions of seafarers. It is clear, as was noted in2002 by the ILO panel of experts consideringmaritime working conditions in 2002, that manyseafarers are now essential ‘migrant’ workers, withlittle or no relationship between the flag of the shipson which they serve and their own nationality. In suchcircumstances, it is essential that ship registries andmaritime administrations have the necessarycommitment and resources to ensure that they cancomply with their responsibilities for theenforcement of international labour standards. In this
context, it is disturbing that even some ‘traditional’maritime nations seem reluctant to embrace the 10principles proposed by the ILO as part of its ongoingwork to achieve the enforcement of ‘decent work’policies.
In its report on seafarers’ working conditionspublished in 2001, the ILO concluded: ‘The industryhas a powerful need for a self-confident, proud andhighly-skilled workforce; however more coherenceand quality in training will not in itself be sufficient.There are also the pressing social and human rightsissues associated with crew composition and size,wage levels, continuity of employment, health andsafety, the quality of shipboard life, and, above all andquite fundamentally, an unfailing recognition of theseafarer’s need for dignity and respect.’
At present, it appears that the industry is unwillingor unable to respond in a sophisticated way to thesometimes conflicting demands and requirementsarising from its ‘human element’. There appears to belittle effort expended to assess and respond to thedrastic changes of the nature of shipping andseafaring employment and to formulate constructivepolicies to address such challenges as the socialimpact of reduced crew levels, less time in port,multinational crew complements and theintroduction of technological aids to ship operationand navigation. There are profound psychological andsocial issues to be considered here, but the shippingindustry’s constant quest for economies seems topreclude a rational approach to these.
NUMAST presents this report to the industry andto those who regulate and control it, in the hope thatit will provide an insight into the ways in which thatdignity and respect is often currently being denied tothose at the sharp end. It is essential, for the future ofsafe and efficient shipping operations, that theseissues are dealt with and that shipmasters andofficers are treated in a way that fosters confidenceand pride, and encourages recruitment, retention andprogression of the skilled and experienced personnelthat the industry so desperately needs.
13Social conditions survey
Conclusions
‘The single, mostimportant factorto improving lifeat sea is toincrease manningin the areaswhere a shortageof personnel hasreduced manningto levels wherewe, who still workat sea, are nolonger able toperform ourduties fully andsafely.’Electrotechnicalofficer
‘Modern management onlygive limited accessto decisionmaking within thecompany.Shipboardmanagement isonly there to takethe blame.Accountants rulethe waves.’Master
‘My workload hasmore thandoubled in the last10 years,with bothcompany andstatutory paperwork beingthe reason.’Chief engineer

RECOMMENDATIONS
✪ shipowners, flag states and others shoulddemonstrate by regulations and policies thatseafarers are considered as valued professionals,afforded suitable employment security andcontinuous training
✪ codes of practice should be developed by theindustry to prevent unfair and damagingcompetition caused by inadequate manninglevels, unfair or substandard employmentpolicies, and the avoidance of training byshipowners/operators
✪ shipping companies should committhemselves to the development of ‘partnershipat work’ agreements and similar concepts forimproved dialogue and consultation with theirmasters and officers
✪ shipmasters and officers need regulatory protection from unnecessary and/or prolongeddetention in wider disputes over liability ordamages
✪ shipmasters and officers must be givengreater protection against victimisation and/orcommercial pressures in the exercise of their professional judgement on safety issues
✪ new regulatory mechanisms are essential toprotect the basic social, welfare andemployment rights of seafarers employed under‘globalised’ conditions
✪ the industry and the authorities mustcompile and disseminate detailed internationalrecords on seafarer health and safety statistics.
✪ flag states must fully investigate allcasualties, incidents and complaints and publishtheir findings as soon as practicable and
accident investigations must make a full andsystematic assessment of the role of the humanelement in accident causation. Action must betaken against flag states that consistently failto investigate, or publish the results ofinvestigations into accidents involving shipsusing their registers
✪ revision of the principles used to assess thesafe manning of ships must be accompanied byconcerted efforts to enforce adequate crewcomplements and to prevent unfair competition through relaxed interpretation of international standards
✪ urgent action is needed to implementproposals to create a ‘safety net’ of insuranceprovision to provide financial security forabandoned seafarers. This should create asystem of financial security, together with aforum such as an international seafarers’ court,to which seafarers can have ready and easyaccess to guarantee payment of wages whichare due and owing and to guarantee thepayment of compensation where seafarers areinjured or killed in work related incidents;
✪ the industry and flag states must developnew mechanisms to promote maritimetraining, to curtail wastage rates and to reversethe growing global shortage of skilled andexperienced seafarers
✪ concentrated programmes of PSC inspections should be undertaken to focus on ‘humanelement issues and onboard social and workingconditions. Port state control procedures shouldbe refined to place greater emphasis upon STCWand ILO Convention requirements
✪ full support should be given to thedevelopment and adoption of the new ILOconsolidated maritime convention, allowing theenforcement and application of minimumsocial standards via port state control.
14 Social conditions survey
Recommendations
‘After more than30 years as a MNofficer I feel that,whilst there havebeenimprovements in safety andother relatedareas, the statusand standing ofthe MerchantNavy officer is atan all-time low.’Electro-technicalofficer
‘Basically feel I amoverworked,underpaid andunder valued bymy employer…The above,pluslack of job security,createshigh stress levels.Technology hasnot reduced workloads, it hasonly provided anexcuse to reducemanning or lesscompetentpersonnel.Thefew professionalsleft carry themain burden tosafely operate theship.’Master
Oceanair House750-760 High RoadLeytonstone London E11 3BB
t 020 8989 6677f 020 8530 [email protected]
Nautilus HouseMariners’ParkWallasey CH45 7PH
t 0151 639 8454f 0151 346 8801
General SecretaryBrian Orrell LLB (HONS)


We are asking people to fill in this questionnaire as part of a large scale study looking at people's experiences of using technology at sea. Your help would be greatly appreciated.
This questionnaire is voluntary and strictly confidential. We are only interested in groups of workers and therefore no individual will be identified in connection with any of the research findings. Your identity and responses to the questionnaire will be completely protected. You do not have to complete any of the questions if you do not want to and can stop at any time. Equally, if you feel you cannot answer a question just leave it blank. Once you move forward a page you will not be able to go back, so please make sure you are comfortable with your answers before moving on. It is not possible to save this questionnaire half way through and therefore please leave at least 15 minutes to complete it.
If you have any questions about the study, please contact Paul Allen E-mail: [email protected]. Tel: +44 (0)29 20876454
Technology is increasing onboard ships. In order to improve safety, reduce costs and maximise efficiency, technology is being brought in to all areas of seafarer life. No one has asked seafarers or people in the industry, however, what they feel about what is happening and how they find working with the technology being introduced. Is technology always a good thing, what do seafarers really value and how should things change? These are the questions we want to ask.
Introduction

General Perceptions of Technology
In this section we will ask you a number of questions relating to technology. Where ship systems used to be monitored directly, seafarers are now often faced with computer screens reporting back from parts of the ship remotely. We are particularly interested in your experience with such Information Communication Technology (ICT) in this questionnaire.
Computer LiteracyFor each of these areas please indicate your level of confidence. 1 = N o t a t a l l c o n f i d e n t, 5 = V e r y c o n f i d e n t
5. To what extent do you generally feel resistant, for whatever reason, to the introduction of new technology onboard ships?
Not at all
A little
Moderately
Quite a lot
A great deal
6. SHIP SECURITY
Not at all
A little
Moderately
Quite a lot
A great deal
1. E-mail 1 2 3 4 5
2. Word Processing (e.g. Microsoft Word)
1 2 3 4 5
3. Spreadsheets (e.g. Microsoft Excel)
1 2 3 4 5
4. Searching the internet (e.g. Microsoft Explorer)
1 2 3 4 5
7. OPERATIONAL EFFICIENCY
Not at all
A little
Moderately
Quite a lot
A great deal
8. SHIP HEALTH AND SAFETY
Not at all
A little
Moderately
Quite a lot
A great deal
In your experience, to what extent do you feel Technology has helped in the following areas:
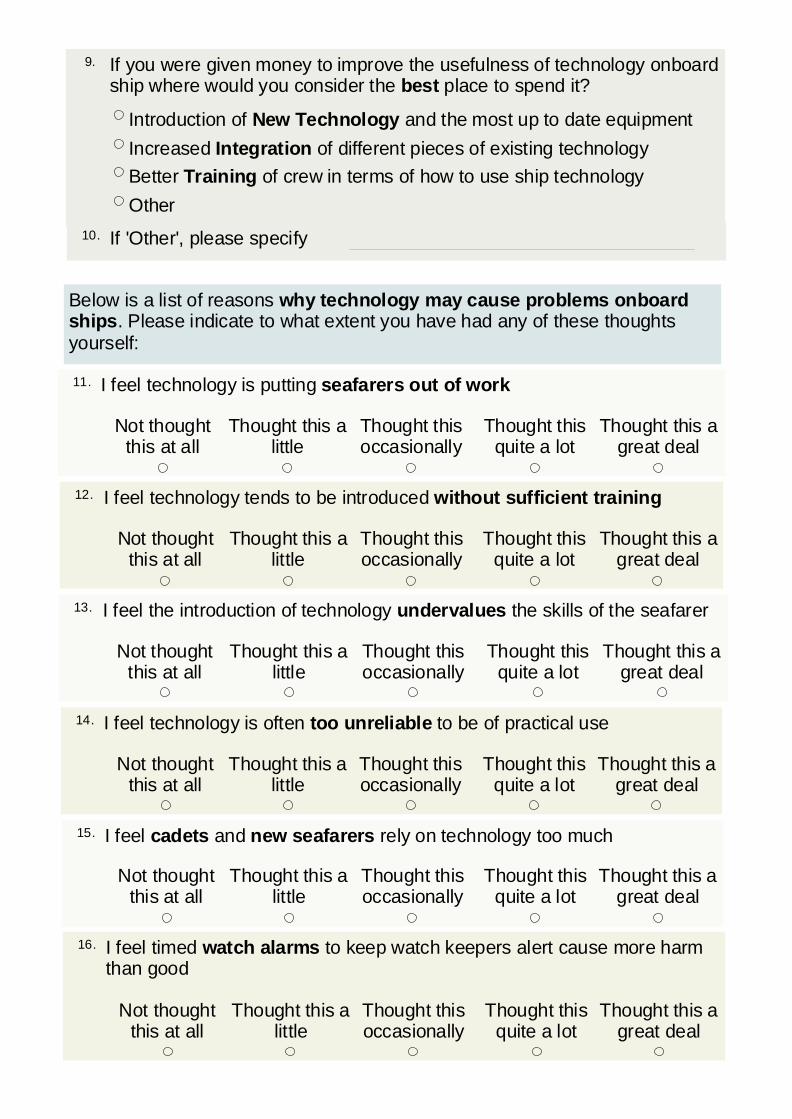
Below is a list of reasons why technology may cause problems onboard ships. Please indicate to what extent you have had any of these thoughts yourself:
11. I feel technology is putting seafarers out of work
Not thought this at all
Thought this a little
Thought this occasionally
Thought this quite a lot
Thought this a great deal
12. I feel technology tends to be introduced without sufficient training
Not thought this at all
Thought this a little
Thought this occasionally
Thought this quite a lot
Thought this a great deal
13. I feel the introduction of technology undervalues the skills of the seafarer
Not thought this at all
Thought this a little
Thought this occasionally
Thought this quite a lot
Thought this a great deal
14. I feel technology is often too unreliable to be of practical use
Not thought this at all
Thought this a little
Thought this occasionally
Thought this quite a lot
Thought this a great deal
15. I feel cadets and new seafarers rely on technology too much
Not thought this at all
Thought this a little
Thought this occasionally
Thought this quite a lot
Thought this a great deal
16. I feel timed watch alarms to keep watch keepers alert cause more harm than good
Not thought this at all
Thought this a little
Thought this occasionally
Thought this quite a lot
Thought this a great deal
9. If you were given money to improve the usefulness of technology onboard ship where would you consider the best place to spend it?
Introduction of New Technology and the most up to date equipment
Increased Integration of different pieces of existing technology
Better Training of crew in terms of how to use ship technology
Other
10. If 'Other', please specify

Your opinion on specific pieces of technology
We want to know your opinions on some specific pieces of Information and Communication Technology (ICT). Please mark your opinions on the pieces of equipment listed below. You may not have necessarily used the equipment, but if you are familiar with what it does then please give us your opinion.
RADAR / ARPA
Machinery Space Monitoring Equipment
17. How familiar are you with this technology?
(a) I frequently use this technology
(b) I occasionally use this technology
(c) I know what this technology is, but have not used it
(d) I know very little/nothing about this technology [Skip to Question 21]
21. How familiar are you with this technology?
(a) I frequently use this technology
(b) I occasionally use this technology
(c) I know what this technology is, but have not used it
(d) I know very little/nothing about this technology [Skip to Question 25]
18. Level of Reliability
1 2 3 4 5
19. How User Friendly?
1 2 3 4 5
20. Standardisation across ships
1 2 3 4 5
Please rate this technology [1= Low/Bad. 5= High/Good]
22. Level of Reliability
1 2 3 4 5
23. How User Friendly?
1 2 3 4 5
24. Standardisation across ships
1 2 3 4 5
Please rate this technology [1= Low/Bad. 5= High/Good]

25. How familiar are you with this technology?
(a) I frequently use this technology
(b) I occasionally use this technology
(c) I know what this technology is, but have not used it
(d) I know very little/nothing about this technology [Skip to Question 29]
29. How familiar are you with this technology?
(a) I frequently use this technology
(b) I occasionally use this technology
(c) I know what this technology is, but have not used it
(d) I know very little/nothing about this technology [Skip to Question 33]
33. How familiar are you with this technology?
(a) I frequently use this technology
(b) I occasionally use this technology
(c) I know what this technology is, but have not used it
(d) I know very little/nothing about this technology [Skip to Question 37]
AIS
ECDIS / Electronic Chart Systems
GPS (Satellite positioning for navigation)
26. Level of Reliability
1 2 3 4 5
27. How User Friendly?
1 2 3 4 5
28. Standardisation across ships
1 2 3 4 5
Please rate this technology [1= Low/Bad. 5= High/Good]
30. Level of Reliability
1 2 3 4 5
31. How User Friendly?
1 2 3 4 5
32. Standardisation across ships
1 2 3 4 5
Please rate this technology [1= Low/Bad. 5= High/Good]
34. Level of Reliability
1 2 3 4 5
35. How User Friendly?
1 2 3 4 5
36. Standardisation across ships
1 2 3 4 5
Please rate this technology [1= Low/Bad. 5= High/Good]
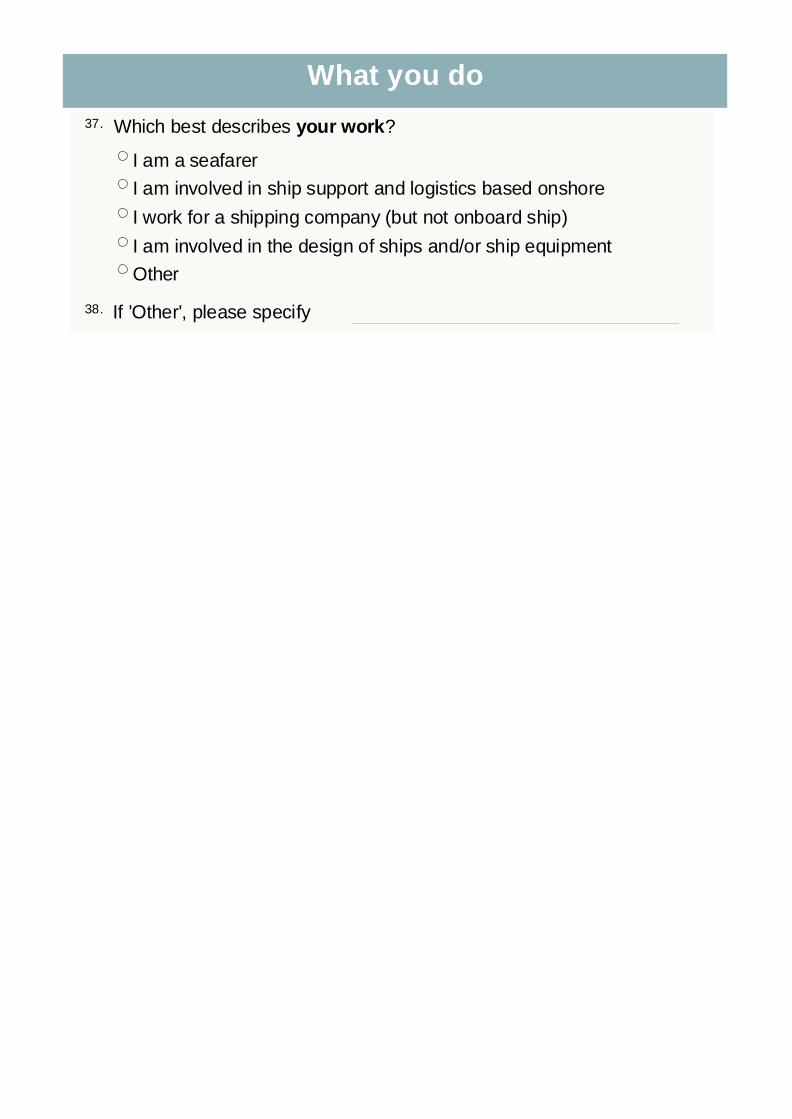
37. Which best describes your work?
I am a seafarer
I am involved in ship support and logistics based onshore
I work for a shipping company (but not onboard ship)
I am involved in the design of ships and/or ship equipment
Other
38. If 'Other', please specify
What you do

You and your Vessel
41. Approximately how many crew are there on your present or most recent ship in total?
43. What is the flag or your current / most recent ship?
44. Please state the a p p r o x i m a t e size of you present or most recent vessel (State whether DWT or GT. Leave blank if size not known)
42. How many bridge watchkeeping officers are there on your present / most recent vessel?
39. Which of the following categories most closely matches the vessel you presently work on?
Passenger Ferry
High-Speed Ferry
Freight Ro-Ro
Products Tanker
Shuttle Tanker
Crude Tanker
Chemical Tanker
Gas Tanker
Car Carrier
Cruise Ship
Bulker
General Cargo
Reefer
Offshore Support
Supply Vessel
Standby Vessel
Dredger
Container Ship
Tug
Pilot Boat
Tanker (Other)
Other
40. If 'Other', please specify
46. Which of the following classifications best describes your present or most recent tour of duty?
Deep Sea
Short Sea and Coastal
Middle Sea (Baltic and Med) / Middle trade
Offshore
Other
47. If 'Other', please specify
45. Please state the a p p r o x i m a t e age of you present or most recent vessel (leave blank if age not known)

48. What is your official job title?
49. Which of the following Ranks best describes your role onboard ship?
Officer
Petty Officer
Rating
Other
50. If 'Other', please specify
51. Which Department would you most closely associate yourself with?
Deck
Engineering
Hotel / Catering
Integrated (Deck & Engineering)
Other
52. If 'Other', please specify

Technology and Your Ship
53. Different vessels have different amounts of technology on them. Thinking about your present / most recent ship, what was your g e n e r a l perception of the level of technology installed?
I would class it as a fairly 'High Tech' ship
I would class it as a fairly Average Technology ship
I would class it as a fairly 'Low Tech' ship
55. Have you ever had any training in terms of handling multiple alarms in the work place?
Yes No
57. On what basis do you feel you are most likely to decide an alarm is important?
Volume
Tone (e.g. siren versus bell)
Pitch (i.e. high versus low)
Other
58. If 'OTHER' please specify
56. Have you ever had any serious incidents as a result of problems with alarm handling?
Yes No
59. Do you have any access to e-mail for personal use onboard ship?
Yes No
61. Do you have any access to the internet for personal use onboard ship?
Yes No
60. How much value do you put on having access to e-mail for personal use onboard ship?
Very low value Low value Average value High value Very high value
54. Is your vessel certified as UMS (Unmanned Machinery Space)?
Yes No Don't know
62. How much value do you put on having access to internet for personal use onboard ship?
Very low value Low value Average value High value Very high value
63. Do you have any comments on the issue of e-mail or internet access for crew? If so, please use the space below to discuss

General Comments
To finish we just need some very basic information about you. This is just to help make our analyses as meaningful as possible...
66. Age
67. SexMale Female
68. Current status Single Living with partner
Married Separated
Widowed Divorced
70. Do you have any children?Yes No
69. What Nationality / citizenship are you?
Please click on 'Submit' below to return your responses to us. Thank You.
We would greatly value any more general comments from you to help guide our research. If you have any comments or thoughts on the issue of technology onboard ship please use the space below to tell us about them
65. General thoughts on ship technology
64. Would you generally like to see more or less technology onboard the ships you work with?
Would like to see more About right Would like to see less