ihra - summary of ihra pedestrian safety wg activities - … · 2001-04-27 · head impact point...
TRANSCRIPT

Y. Mizuno 1
SUMMARY OF IHRA PEDESTRIAN SAFETY WG ACTIVITIES – PROPOSED TEST METHODS TO EVALUATE PEDESTRIAN PROTECTION AFORDED BY PASSENGER CARS Yoshiuki Mizuno Japan Automobile Standards Internationalization Center (JASIC), Japan Hirotoshi Ishikawa Japan Automobile Research Institute (JARI), Japan On behalf of IHRA Pedestrian Safety WG Paper Number 280 ABSTRACT The IHRA Pedestrian Working Group has conducted investigation and analysis on the current status of pedestrian accidents in the IHRA member countries. We collected the accident data that occurred by 1999, then unified the formats of the accident data and established a dataset that makes it possible to make comparison with each other. According to the current status of pedestrian accidents, three parts of the pedestrian’s body have the highest priority for protection, the child and adult heads, and the adult lower leg/knee. As for the motor vehicle, we determined which particular parts of the motor vehicle were involved, which pedestrian body parts they injured and the severity of the injuries, and analyzed the effect of their shapes, corresponding to the items above. It was decided that the test methods should be for motor vehicles for passenger use but not buses and coaches. The shapes of passenger cars were investigated and categorized by three groups, Sedan, SUV (Sport Utility Vehicle) and 1-Box (One Box Vehicle), so that the effects of these vehicle shapes could be studied with computer simulations. The simulations to date have focused on the head impact speed, head impact angle, head effective mass, and the Wrap Around Distance to the head impact point (WAD). We decided to adopt the sub-system methods and to establish specifications for impactors for each sub-system. That is, three subsystem test procedures (adult headform, child headform and legform impact tests) were proposed in high priority identified in the analysis of pedestrian accidents in the IHRA member countries. The pedestrian test procedures proposed and investigated by the experts of IHRA member countries may in the future provide a basis of technical regulations, however, it was recognized that considerable research
and development was required to refine the test procedure. It was deemed necessary to conduct validation study of the test procedures through actual tests using sample vehicles and to explore the car feasibility level prior to the use of the test methods in legislation. INTRODUCTION Back in May 1996, the 15th ESV International Conference was held at Melbourne, Australia. Anteceding this Conference, six items of International Harmonized Research Activities (IHRA) were proposed and endorsed in the ESV Government Focal Point Meeting under the initiative of the U.S. DOT/NHTSA and these items were formally presented to the 15th ESV International Conference. As a result, six projects were launched with an aim to propose harmonized test procedures reflecting the latest traffic accident condition. For each project, a leading country was designated and a working group (WG) was formed by ESV participating countries to achieve assignments within the timeframe of five years. The membership of the IHRA Pedestrian Safety Working Group (IHRA-PS-WG) is comprised of experts selected by the governments of Australia, Europe (EC/EEVC), Japan and the U.S., experts selected by the industrial organization of OICA and the chairperson selected by Japan. The primary tasks assigned to the IHRA-PS-WG were: a) investigating and analyzing the latest pedestrian
accident data in the IHRA member countries, and b) establishing harmonized test procedures that would
reflect such accident condition and would induce vehicle structures to be improved for the reduction of fatalities and alleviation of severe injuries in pedestrian vs. passenger car crashes.

Y. Mizuno 2
These tasks would be carried out with the cooperation of all IHRA member countries. Bio-mechanics in the aspect of pedestrian accident and development of test devices based on such bio-mechanics are still in the process of research. Because a suitable pedestrian dummy was not available at the beginning of this project and it would need enormous time and/or fund for its development, the IHRA-PS-WG had to give up the idea of using a pedestrian dummy after consulting with the IHRA/Bio-WG. Also, pedestrian dummies have disadvantages when used as part of test methods to require protection for all statures of pedestrians. Therefore, the IHRA-PS-WG decided to make use of and further develop the existing “component (sub-systems) method” employed by the ISO (TC22/SC10/WG2) and EEVC/WG17, while being ready to research into areas not covered by these test methods. As one of the two primary tasks assigned to the IHRA- PS-WG was to gather the results of detailed research into the accident condition worldwide. Currently accident data to an agreed format has been collected for Japan, Europe and USA with Australian data to follow. The current dataset has been analyzed to determine the impact areas of vehicles, accident frequency and injured regions of pedestrian vs. passenger car crashes and to decide research priorities from these findings. According to the priorities thus decided, the IHRA-PS-WG embarked on its research activities to develop adult and child head test methods, and adult lower leg/knee test methods. ACCIDENT DATA At the first meeting of the IHRA pedestrian safety-working group, it was agreed that development of harmonized test procedures would be based upon real world crash data. Accident survey databases were sought which contained pertinent pedestrian and vehicle information. Pedestrian information desired included age, stature, gender, injured body region, and injury severity. Vehicle information sought would be vehicle type, make, and year, mass, pedestrian contact location, damage pattern, and impact velocity. Other general accident information such as pedestrian crossing pattern, weather conditions, vehicle and pedestrian trajectories, alcohol use, etc. were also of interest if collected. Bicycle or motor-driven cyclists were not included in
the study. Three databases from Japan, Europe, and the United States were identified which contained much of this information. In Japan, pedestrian accident data collected by JARI between 1987 and 1988 and in-depth case study data of pedestrian accidents conducted by ITARDA between 1994 and 1998 were combined for the development of IHRA global accident dataset. A total of 240 cases were included from the neighboring cities of JARI. In Germany, investigation teams from both the Automotive Industry Research Association and Federal Road Research Institute collected accident information in a jointly conducted project called the German In-Depth Accident Study (GIDAS). A total of 783 cases collected between 1985 and 1998 were included from the cities of Dresden and Hanover, along with their surrounding rural areas. Detailed information from pedestrian accidents was collected in the United States through the Pedestrian Crash Data Study (PCDS)1,2. In this non-stratified study, a total of 521 cases were collected between 1994 and 1999. Cases were collected from six urban sites during weekdays. Data from these three studies were combined into a single database for further analysis to develop a better basis for global pedestrian impact conditions. From each of these studies, seven fields of information were identified which were common to all three studies and were crucial to providing guidance in test procedure development. For each injury, these seven fields of data were collected and input into the unified pedestrian accident database. The seven fields were country, case number, pedestrian age, impact speed, AIS injury level, body region injured, and vehicle source causing the injury. Injury body region and vehicle source were categorized as shown in Table 1. The number of cases and total injuries represented in this combined database are shown in Table 2. Throughout the remainder of this report, this combined accident dataset is denoted as the global accident dataset. It should be noted that pedestrian injuries in developing countries are not represented in this dataset. However, it represents the best comprehensive pedestrian accident database available to guide pedestrian safety test procedure development.
Y. Mizuno 3
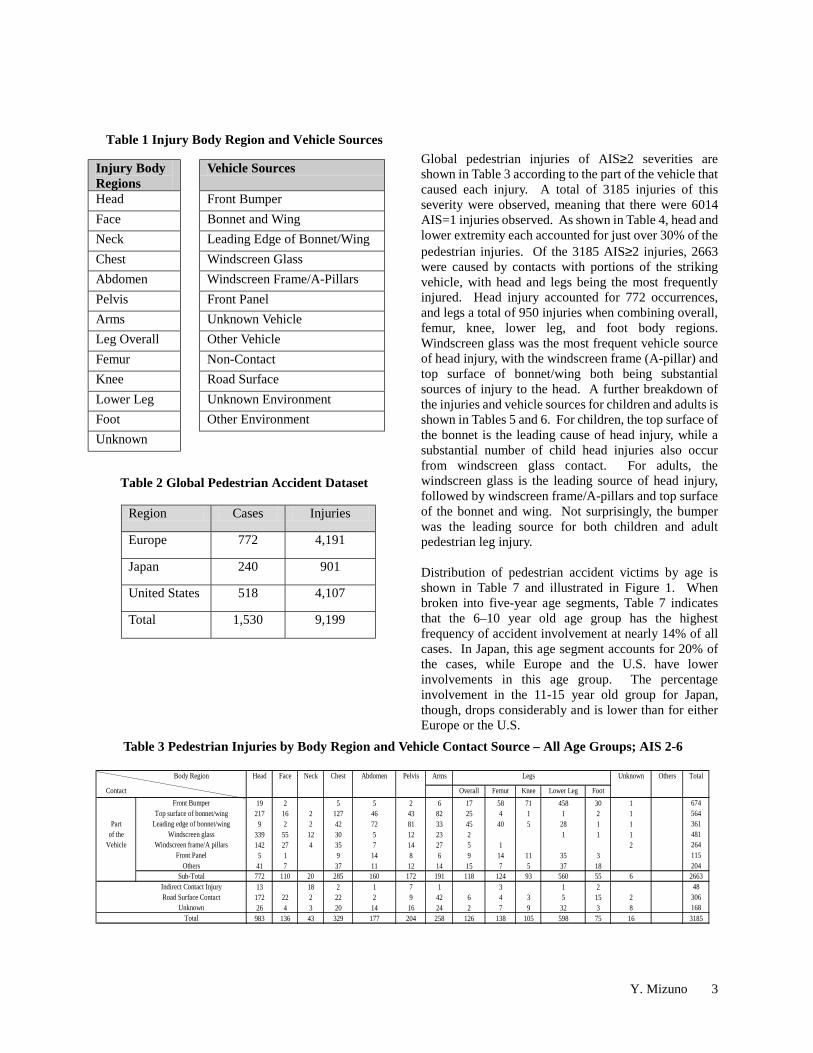
Table 1 Injury Body Region and Vehicle Sources
Table 2 Global Pedestrian Accident Dataset
Global pedestrian injuries of AIS≥2 severities are shown in Table 3 according to the part of the vehicle that caused each injury. A total of 3185 injuries of this severity were observed, meaning that there were 6014 AIS=1 injuries observed. As shown in Table 4, head and lower extremity each accounted for just over 30% of the pedestrian injuries. Of the 3185 AIS≥2 injuries, 2663 were caused by contacts with portions of the striking vehicle, with head and legs being the most frequently injured. Head injury accounted for 772 occurrences, and legs a total of 950 injuries when combining overall, femur, knee, lower leg, and foot body regions. Windscreen glass was the most frequent vehicle source of head injury, with the windscreen frame (A-pillar) and top surface of bonnet/wing both being substantial sources of injury to the head. A further breakdown of the injuries and vehicle sources for children and adults is shown in Tables 5 and 6. For children, the top surface of the bonnet is the leading cause of head injury, while a substantial number of child head injuries also occur from windscreen glass contact. For adults, the windscreen glass is the leading source of head injury, followed by windscreen frame/A-pillars and top surface of the bonnet and wing. Not surprisingly, the bumper was the leading source for both children and adult pedestrian leg injury. Distribution of pedestrian accident victims by age is shown in Table 7 and illustrated in Figure 1. When broken into five-year age segments, Table 7 indicates that the 6–10 year old age group has the highest frequency of accident involvement at nearly 14% of all cases. In Japan, this age segment accounts for 20% of the cases, while Europe and the U.S. have lower involvements in this age group. The percentage involvement in the 11-15 year old group for Japan, though, drops considerably and is lower than for either Europe or the U.S.
Injury Body Regions
Vehicle Sources
Head Front Bumper Face Bonnet and Wing Neck Leading Edge of Bonnet/Wing Chest Windscreen Glass Abdomen Windscreen Frame/A-Pillars Pelvis Front Panel Arms Unknown Vehicle Leg Overall Other Vehicle Femur Non-Contact Knee Road Surface Lower Leg Unknown Environment Foot Other Environment Unknown
Region Cases Injuries
Europe 772 4,191
Japan 240 901
United States 518 4,107
Total 1,530 9,199
Body Region Head Face Neck Chest Abdomen Pelvis Arms Legs Unknown Others Total
Contact Overall Femur Knee Lower Leg FootFront Bumper 19 2 5 5 2 6 17 58 71 458 30 1 674
Top surface of bonnet/wing 217 16 2 127 46 43 82 25 4 1 1 2 1 564Part Leading edge of bonnet/wing 9 2 2 42 72 81 33 45 40 5 28 1 1 361
of the Windscreen glass 339 55 12 30 5 12 23 2 1 1 1 481Vehicle Windscreen frame/A pillars 142 27 4 35 7 14 27 5 1 2 264
Front Panel 5 1 9 14 8 6 9 14 11 35 3 115Others 41 7 37 11 12 14 15 7 5 37 18 204
Sub-Total 772 110 20 285 160 172 191 118 124 93 560 55 6 2663Indirect Contact Injury 13 18 2 1 7 1 3 1 2 48Road Surface Contact 172 22 2 22 2 9 42 6 4 3 5 15 2 306
Unknown 26 4 3 20 14 16 24 2 7 9 32 3 8 168Total 983 136 43 329 177 204 258 126 138 105 598 75 16 3185
Table 3 Pedestrian Injuries by Body Region and Vehicle Contact Source – All Age Groups; AIS 2-6

Y. Mizuno 4
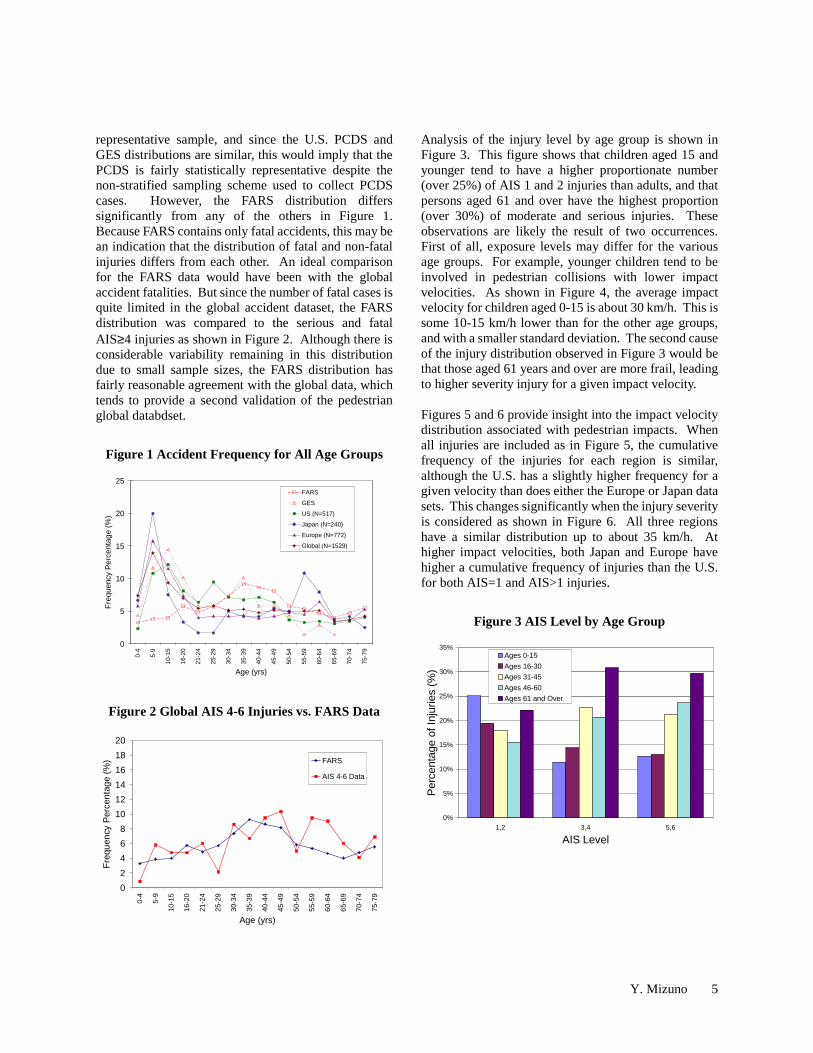
The age distribution data contained in Figure 1 also provides an opportunity to somewhat validate the pedestrian global accident dataset as being representative. In addition to the Europe, Japan, and U.S. datasets, data from the U.S. FARS and GES are also included. FARS is the Fatal Analysis Reporting
System, which contains every fatal traffic accident in the U.S. The GES is the General Estimates System, and is obtained from a nationally representative sampling of police-reported crashes. In general, the age distribution of the GES data is similar to the others in Figure 1. Since the GES is designed to be a statistically
Table 4 Distribution of Pedestrian Injuries (AIS 2-6)
Table 5 Pedestrian Injuries by Body Region and Vehicle Contact Source – Ages < 16; AIS 2-6
(For AIS 2-6)Injury Location US Europe Japan Global
Head 32.7% 29.8% 28.6% 30.9%Face 3.7% 5.3% 2.4% 4.3%Neck 0.0% 1.8% 4.5% 1.4%Chest 9.5% 11.6% 8.5% 10.3%
Abdomen 7.7% 3.8% 4.8% 5.6%Pelvis 5.3% 7.9% 4.5% 6.4%Arms 7.9% 8.1% 9.0% 8.1%
Overall Legs 7.9% 0.7% 2.1% 3.9%Femur 3.2% 4.0% 9.3% 4.3% 30.3%Knee 3.0% 3.4% 4.2% 3.3%
Lower Leg 18.1% 19.8% 17.2% 18.8%Foot 1.1% 3.4% 2.9% 2.4%
Unknown 0.0% 0.5% 2.1% 0.5%Others 0.0% 0.0% 0.0% 0.0%
Body Region Head Face Neck Chest Abdomen Pelvis Arms Legs Unknown Others TotalContact Location
Overall Femur Knee Lower Leg Foot
Front Bumper 3 1 2 3 14 19 5 45 1 1 94Top surface of bonnet/wing 70 5 1 9 4 2 14 1 106
Part Leading edge of bonnet/wing 2 1 1 3 5 4 6 1 11 1 6 1 42of the Windscreen glass 39 2 1 1 1 1 45
Vehicle Windscreen frame/A pillars 5 1 2 8Front Panel 5 1 1 1 5 1 1 15
Others 9 4 2 3 4 13 5 40Sub-Total 133 8 3 20 11 7 29 18 40 7 65 6 3 350
Indirect Contact Injury 1 1 1 1 4Road Surface Contact 45 4 1 1 10 1 62
Unknown 6 1 2 5 3 4 1 22Total 185 12 4 22 14 8 45 18 43 7 69 7 4 438
Body Region Head Face Neck Chest Abdomen Pelvis Arms Legs Unknown Others TotalContact Location
Overall Femur Knee Lower Leg Foot
Front Bumper 16 2 2 3 2 3 5 39 66 413 29 580Top surface of bonnet/wing 147 11 1 118 42 41 68 23 2 1 1 2 1 458
Part Leading edge of bonnet/wing 7 1 1 39 67 77 27 43 29 4 22 1 318of the Windscreen glass 300 53 11 29 5 12 22 2 1 1 436
Vehicle Windscreen frame/A pillars 137 27 4 34 7 14 25 5 1 2 256Front Panel 1 8 14 7 5 9 9 10 34 3 100
Others 32 7 33 11 12 12 12 3 5 24 13 164Sub-Total 639 102 17 263 149 165 162 99 83 86 495 49 3 2312
Indirect Contact Injury 12 17 2 7 3 1 2 44Road Surface Contact 127 18 2 21 2 8 32 6 4 3 5 14 2 244
Unknown 20 4 3 19 12 16 19 2 4 9 28 3 7 146Total 798 124 39 305 163 196 213 107 94 98 529 68 12 2746
Table 7 Pedestrian Accident Age Distribution
Age US Europe Japan Global0-5 4.4% 8.8% 9.2% 7.4%
6-10 10.3% 14.5% 20.0% 13.9%11-15 10.6% 9.8% 5.0% 9.4%16-20 8.1% 7.4% 3.3% 7.0%21-25 8.5% 4.5% 1.7% 5.4%26-30 9.5% 4.7% 1.7% 5.8%31-35 6.4% 4.3% 5.4% 5.2%36-40 6.8% 4.4% 5.0% 5.3%41-45 7.0% 3.6% 3.8% 4.8%46-50 6.0% 4.5% 5.4% 5.2%51-55 3.5% 5.4% 6.7% 5.0%56-60 3.5% 4.5% 10.0% 5.0%61-65 3.5% 5.7% 6.7% 5.1%66-70 3.1% 3.6% 3.8% 3.5%71-75 3.3% 3.9% 4.2% 3.7%76-80 3.9% 5.1% 2.5% 4.3%More 1.7% 5.2% 5.8% 4.1%
Table 6 Pedestrian Injuries by Body Region and Vehicle Contact Source – Ages > 15; AIS 2-6
Y. Mizuno 5
representative sample, and since the U.S. PCDS and GES distributions are similar, this would imply that the PCDS is fairly statistically representative despite the non-stratified sampling scheme used to collect PCDS cases. However, the FARS distribution differs significantly from any of the others in Figure 1. Because FARS contains only fatal accidents, this may be an indication that the distribution of fatal and non-fatal injuries differs from each other. An ideal comparison for the FARS data would have been with the global accident fatalities. But since the number of fatal cases is quite limited in the global accident dataset, the FARS distribution was compared to the serious and fatal AIS≥4 injuries as shown in Figure 2. Although there is considerable variability remaining in this distribution due to small sample sizes, the FARS distribution has fairly reasonable agreement with the global data, which tends to provide a second validation of the pedestrian global databdset.
Figure 1 Accident Frequency for All Age Groups
0
5
10
15
20
25
0-4
5-9
10-1
5
16-2
0
21-2
4
25-2
9
30-3
4
35-3
9
40-4
4
45-4
9
50-5
4
55-5
9
60-6
4
65-6
9
70-7
4
75-7
9
Age (yrs)
Freq
uenc
y Pe
rcen
tage
(%)
FARS
GES
US (N=517)
Japan (N=240)
Europe (N=772)
Global (N=1529)
Figure 2 Global AIS 4-6 Injuries vs. FARS Data
02468
101214161820
0-4
5-9
10-1
5
16-2
0
21-2
4
25-2
9
30-3
4
35-3
9
40-4
4
45-4
9
50-5
4
55-5
9
60-6
4
65-6
9
70-7
4
75-7
9
Age (yrs)
Freq
uenc
y Pe
rcen
tage
(%) FARS
AIS 4-6 Data
Analysis of the injury level by age group is shown in Figure 3. This figure shows that children aged 15 and younger tend to have a higher proportionate number (over 25%) of AIS 1 and 2 injuries than adults, and that persons aged 61 and over have the highest proportion (over 30%) of moderate and serious injuries. These observations are likely the result of two occurrences. First of all, exposure levels may differ for the various age groups. For example, younger children tend to be involved in pedestrian collisions with lower impact velocities. As shown in Figure 4, the average impact velocity for children aged 0-15 is about 30 km/h. This is some 10-15 km/h lower than for the other age groups, and with a smaller standard deviation. The second cause of the injury distribution observed in Figure 3 would be that those aged 61 years and over are more frail, leading to higher severity injury for a given impact velocity. Figures 5 and 6 provide insight into the impact velocity distribution associated with pedestrian impacts. When all injuries are included as in Figure 5, the cumulative frequency of the injuries for each region is similar, although the U.S. has a slightly higher frequency for a given velocity than does either the Europe or Japan data sets. This changes significantly when the injury severity is considered as shown in Figure 6. All three regions have a similar distribution up to about 35 km/h. At higher impact velocities, both Japan and Europe have higher a cumulative frequency of injuries than the U.S. for both AIS=1 and AIS>1 injuries.
Figure 3 AIS Level by Age Group
0%
5%
10%
15%
20%
25%
30%
35%
1,2 3,4 5,6
AIS Level
Perc
enta
ge o
f Inj
urie
s (%
)
Ages 0-15Ages 16-30Ages 31-45Ages 46-60Ages 61 and Over

Y. Mizuno 6
Figure 4 Average Impact Velocity by Different Age Group
0
10
20
30
40
50
60
70
80
90
Age 0-15 Age 16-30 Age 31-45 Age 46-60 Ages > 60Age Group
Ave
rage
Impa
ct V
eloc
ity (k
mph
)
Figure 5 Impact Velocity by Geographic Region
0%
20%
40%
60%
80%
100%
120%
0 20 40 60 80 100 120Impact Velocity (kmph)
Cum
ulat
ive
Freq
uenc
y
US (N=444)
Japan (N=231)
Europe (N=763)
Global (N=1438)
Figure 6 Injury Distribution by Impact Velocity
0
20
40
60
80
100
120
0 20 40 60 80 100 120Impact Velocity (kmph)
Cum
ulat
ive
Freq
uenc
y (%
)
Japan, AIS=1Japan, AIS>1USA, AIS=1USA, AIS>1Europe, AIS=1Europe, AIS>1
The cumulative injury distributions are further broken down by age, body region, and injury severity in Figures 7 – 9. Age classifications are grouped as children (age < 16 years old) and adults (age 16 years and older). All body regions are included for both children and adults in Figure 7, with distributions shown for AIS 2-6 and AIS 3-6 injuries. The injury distribution distinction between children and adults is again evident in this figure. For children, about 50% of the AIS 2-6 injuries occur below about 39 km/h, while for AIS 3-6 injuries the velocity at which 50% of the injuries occur is below 44 km/h. For adults, the corresponding velocities are about 52 and 57 km/h for AIS 2-6 and AIS 3-6 injuries, respectively. Head injury distributions are shown in Figure 8. For both children and adults, the AIS 3-6 and AIS 4-6 cumulative injury distributions are very similar. Fifty percent of child AIS 3-6 head injuries from pedestrian accidents occur below about 45 km/h. The corresponding velocity for adults is about 58 km/h. For AIS 2-6 children and adult head injuries, the impact velocities at which 50% of the injuries occur are decreased by about 5 km/h impact velocity. Injury distributions for children and adult leg injuries are shown in Figure 9. Distributions for AIS 2-6 and AIS 3-6 leg injuries are again similar, with the 50% cumulative AIS 2-6 injuries for children and adults occurring at about a 5 km/h lower impact velocity than for AIS 3-6 injuries. Fifty percent of the AIS 3-6 leg injuries for children occurred below about 40 km/h, while for adults the corresponding impact velocity was nearly 50 km/h.
Figure 7 Impact Velocity by AIS Segments – All Body Regions
0%
20%
40%
60%
80%
100%
120%
5 10 15 20 25 30 35 40 45 50 55 60 65 70 75 80 85 90 95 100
More
Impact Velocity (kmph)
Cum
ulat
ive
Freq
uenc
y
Children AIS 2-6 (n=438)
Adults AIS 2-6 (n=2736)
Children AIS 3-6 (n=200)
Adults AIS 3-6 (n=1505)

Y. Mizuno 7
Figure 8 Impact Velocity by AIS Segments – Head
0%
20%
40%
60%
80%
100%
120%
5 10 15 20 25 30 35 40 45 50 55 60 65 70 75 80 85 90 95 100
More
Impact Velocity (kmph)
Cum
ulat
ive
Freq
uenc
y
Children AIS 2-6 (n=185)Adults AIS 2-6 (n=792)Children AIS 3-6 (n=85)Adults AIS 3-6 (n=533)Children AIS 4-6 (n=47)Adults AIS 4-6 (n=284)
Figure 9 Impact Velocity by AIS Segments – Leg
0%
20%
40%
60%
80%
100%
120%
5 10 15 20 25 30 35 40 45 50 55 60 65 70 75 80 85 90 95 100
More
Impact Velocity (kmph)
Cum
ulat
ive
Freq
uenc
y
Children AIS 2-6 (n=144)
Adults AIS 2-6 (n=892)
Children AIS 3-6 (n=84)
Adults AIS 3-6 (n=524)
In summary, this compilation of pedestrian accident data from Europe, Japan, and the U.S. provides a unique and important dataset. The cumulative injury distribution data will provide a basis for establishing component pedestrian protection test procedures, priorities, and potential benefits assessments. VEHICLE SHAPES & CATEGORIES Front shape of passenger car was investigated and categorized into three groups, Sedan, SUV (Sport Utility Vehicle) and 1-Box (One Box Vehicle), so that the effect of vehicle front shape on the pedestrian impact was studied with computer simulations focusing on the head impact velocity, head impact angle, WAD (Wrap Around Distance) and head effective mass. Figure 10 shows the car front shape corridors for the three groups obtained from current production cars in Japan, U.S. and Europe. Each corridor consists of upper
and lower boundaries of the bonnet and windscreen glass with the front skirt corridors.
Figure 10 Car Fron Shape Corridors
0
1000
2000
3000
0 1000 2000 3000 4000 5000Length (mm)
Hei
ght (
mm
)
Sedan + Light vehicle + Sports type (n=33)
0
1000
2000
3000
0 1000 2000 3000 4000 5000Length (mm)
Hei
ght (
mm
)
SUV (n=16)
0
1000
2000
3000
0 1000 2000 3000 4000 5000Length (mm)
Hei
ght (
mm
)
1Box (n=8)
Figure 11 shows the definitions of the measuring points for the bumper lead (BL), bumper center height (BCH), leading edge height (LEH), bonnet length, bonnet angle, windscreen angle, and the bottom depth and height of the front skirt. These positions and angles for the lower, middle and upper boundaries of the corridors for each group are summarized in Table 8.

Y. Mizuno 8
Figure 11 Definitions of Car Fron Shape
0
1000
2000
0 1000 2000Length (mm)
Hei
ght (
mm
)
LEH
BCH
BCH
LEH
BL
Bon. (length, angle)
Bon. Win. (angle)
Win.
00 1000
( Bottom Depth , Bottom Height)
Table 8 Car Fron Shape Corridors
Sedan + Light vehicle + Sports typeLower Middle Upper
BL (mm) 127 127 127BCH (mm) 435 475.5 516LEH (mm) 565 702 839Bon. length (mm) 1200 917.5 635Bon. angle (deg.) 11 14.5 18Win. angle (deg.) 29 34.5 40Bottom depth (mm) 42 98 154Bottom height (mm) 182 225.5 269
SUVLower Middle Upper
BL (mm) 195 195 195BCH (mm) 544 640 736LEH (mm) 832 1000 1168Bon. length (mm) 1023 933.5 844Bon. angle (deg.) 11 9.75 8.5Win. angle (deg.) 36 39.5 43Bottom depth (mm) 48 123 198Bottom height (mm) 248 348 448
1BoxLower Middle Upper
BL (mm) 188 188 188BCH (mm) 448 576 704LEH (mm) 864 1004 1144Bon. length (mm) 361 259 157Bon. angle (deg.) 40 40 40Win. angle (deg.) 30 38 46Bottom depth (mm) 63 95 127Bottom height (mm) 214 292.5 371
BIOMECHANICS Head Injury Biomechanics For the purposes of the IHRA-PS-WG, emphasis has been placed on pedestrian head injuries resulting from head impact with the vehicle frontal structure, including the windscreen and A-pillars. The Head Injury Criterion (HIC) has been selected as the measure of the risk of brain injury resulting from such an impact. It is recognized that HIC does not allow for the influence of some factors, such as rotational acceleration of the head, but it has been selected here because, at present, it is used almost universally in crash injury research and prevention. The time window for the calculation of HIC has been set at 15 ms, and the value of HIC shall not exceed 1000. Two headforms are proposed for use in subsystem testing, one representing the head of a 50th percentile adult and the other the head of a 6 year old child. The diameter of each headform is 165 mm and the mass is 4.5 kg for the adult headform and 3.5 kg for the child. The headforms are subject to performance, rather than design, criteria (see IHRA documents PS/113 and 118). The head impact test areas on the vehicle for the child and adult headforms correspond to the areas commonly struck by the head of a child and an adult pedestrian, respectively.

Y. Mizuno 9
0
0.5
1
1.5
2
-2 -1.5 -1 -0.5 0 0.5
Horizontal displacement (m)
Vert
ical
dis
plac
em
ent
(m)
Foot
Knee
Pelvis
Head
Car A
Normalized PMHS Corridor: H. 1.67-1.92m (Vel. 25-40km/h)
Simulation: AM 50 (Vel. 40km/h)
Simulation: AM 50 (Vel. 32km/h)
Simulation: AM 50 (Vel. 25km/h)
0
20
40
60
80
0 50 100 150 200 250
Time (ms)
Head
resu
ltan
t ve
locity
(km
/h)
PMHS Corridor: H. 1.67-1.80m
Simulation: AM 50
Car A
0
20
40
60
80
0 50 100 150 200 250
Time (ms)
Head
resu
ltan
t ve
locity
(km
/h)
PMHS Corridor: H. 1.70-1.92mSimulation: AM 50
Car A
0
20
40
60
80
0 50 100 150 200 250
Time (ms)
Head
resu
ltan
t ve
locity
(km
/h)
PMHS Corridor: H. 1.67-1.70mSimulation: AM 50
Car A
LEH: 763mmLEH: 763mmLEH: 763mmLEH: 763mmBL: 145mmBL: 145mmBL: 145mmBL: 145mm
BCH: 383mmBCH: 383mmBCH: 383mmBCH: 383mm
COMPUTER SIMULATIONS Car to Pedestrian Impact Model Figure 12 shows two pedestrian models used for the IHRA computer simulation study. These are JARI pedestrian model used for the JARI study and TNO pedestrian model for the NHTSA study. The validity of these models was evaluated by comparing results from their computer simulations and published PMHS (Post Mortem Human Subject) tests. Figure 13 shows a typical overall pedestrian kinematics from computer simulation and PMHS test at impact speed of 40 km/h. The lateral rotation of the upper body segments and the leg bending motion were well predicted. The trajectories of body segments and the head resultant velocities relative to the car body were also compared at different impact velocities between the model and the PMHS as shown in Figure 14. These comparisons also indicate the good reliability of the computer simulation model.
JARI model TNO model
0ms 20ms 40ms 60ms 80ms 100ms
Figure 13 Validation Result on Overall Pedestrian Kinematics
Figure 14 Validation Results on Pedestrian Trajectory and Head Resultant Velocity
T b
Figure 12 Pedestrian Model

Y. Mizuno 10
Parameter Study In order to understand the influence of vehicle shape on the severity of the pedestrian impact, such as head impact velocity, head impact angle, WAD (Wrap Around Distance) and effective head mass, a parameter study was conducted under the conditions of single pedestrian size (AM50), two pedestrian settings (standing and walking), three impact velocities, braking with 0.5 G, and three vehicle shapes as shown in Table 9 and Figure 15. However, the vehicle stiffness used was different between JARI study and NHTSA study as shown in Figure 16. Definitions of the head impact velocity and the head impact angle are illustrated in Figure 17. According to the IHRA-PS-WG decision, two different WADs (WAD1 and WAD2) were calculated as shown in Figure 18.
Table 9 Input Parameters Pedestrian Size Walking Position Vehicle Stiffness Friction
Impact Speed Braking Vehicle Shape
AM50
JARI Setting NHTSA Setting
Pedestrian-Vehicle: 0.30Pedestrian-Ground: 0.67
30, 40, 50 km/h0.5 G
Upper, Lower, Middle *
Sedan, SUV, 1Box
Figure 15 Pedestrian’s Initial Condition
25deg.
50deg.
5deg.5deg.
g
Standing (JARI used) Walking (NHTSA used)
5.7deg.5.7deg.
4deg.
25deg.
Figure 16 Vehicle Stiffness
0
10
20
30
40
0 0.05 0.1 0.15 0.2
Penetration(m)
Forc
e(k
N)
JARINHTSA
Bumper Stiffness
0
10
20
30
40
0 0.05 0.1 0.15 0.2
Penetration(m)
Forc
e(k
N)
JARINHTSA
Bonnet Stiffness
0
10
20
30
40
0 0.05 0.1 0.15 0.2
Penetration(m)
Forc
e(k
N)
JARINHTSA
Window Stiffness
Figure 17 Definition of Head Impact Velocity and Head Impact Angle
VRX
VRZ
VRRα
=α
+=
RX
RZ
2RZ
2RXRR
VVarctan
VVV
VRX : Relative head velocity against vehicle (X) VRZ : Relative head velocity against vehicle (Z) VRR : Head Impact Speed - Resultant of relative head velocity against vehicle - α : Head Impact Angle - Obtain from VRX and VRZ ratio -

Y. Mizuno 11
Figure 18 Definition of WAD1 and WAD2
WAD 2
WAD 1
Follows Contour
Straight Line Simulation Results Concerning the simulation results, only a few examples are shown in this paper. Figure 19 shows the head impact velocity and the head impact angle obtained from the JARI and NHTSA simulation studies in which head impact velocities are indicated as a velocity ratio against the vehicle impact velocity and both cases of head to bonnet contact and head to windscreen contact are included. The head impact velocity ratio varies significantly, from 0.6 to 1.1, according to the vehicle shape. However, the effects on head impact velocity of the pedestrian’s initial stance and of the shoulder and upper body stiffness used in the model have not yet been explored. Under the same vehicle shape, the head impact velocity ratio also varies due to the small difference of pedestrian’s initial condition (JARI setting or NHTSA setting). Simulations from two different pedestrian models produce similar results for each vehicle front shape except for the head impact angle. The head impact angle differs by up to about 30 degrees between JARI and NHTSA simulations. The main reason for the difference could be due to the difference
of the computer models used by JARI and NHTSA since each computer model uses different pedestrian model with different joint stiffness and different vehicle stiffness. Table 10 shows a summary of the parameter study, however the results of Table 10 are preliminary since the computer simulations were not finalized by February 2001. In Table 10, head impact configurations are categorized into two groups (head to bonnet contact and head to windscreen contact), since there is a big difference between the two groups in terms of head impact condition.
Figure 19 Head Impact Velocity and Angle from Computer Simulations
0
0.2
0.4
0.6
0.8
1
1.2
Sedan-JARI
setting
Sedan-NHTSAsetting
SUV-JARIsetting
SUV-NHTSAsetting
1BOX-JARIsetting
1BOX-NHTSAsetting
Hea
d im
pact
vel
. / v
ehic
le im
pact
vel
.
JARI simulation NHTSA simulation
0102030405060708090
Sedan-JARI
setting
Sedan-NHTSAsetting
SUV-JARIsetting
SUV-NHTSAsetting
1BOX-JARIsetting
1BOX-NHTSAsetting
Hea
d im
pact
ang
le (d
eg.)
JARI simulation NHTSA simulation
- Bonnet Contact -Vehicle Type Head Impact Velocity Head Impact Angle WAD1 WAD2 Effective Head Mass
/ Vehicle Impact Velocity (deg.) /Pedestrian Height /Pedestrian Height /Head MassSedan 0.78 62.3 1.14 1.14 1.01SUV 0.77 83.6 0.98 0.98 0.79
Average 0.78 73.0 1.06 1.06 0.90
- Bonnet Contact - (except for the impacts at the SUV upper boundary)Vehicle Type Head Impact Velocity Head Impact Angle WAD1 WAD2 Effective Head Mass
/ Vehicle Impact Velocity (deg.) /Pedestrian Height /Pedestrian Height /Head MassSedan 0.78 62.3 1.14 1.14 1.01SUV 0.88 88.9 1.01 1.01 0.94
Average 0.83 75.6 1.08 1.08 0.98
- Windscreen Contact -Vehicle Type Head Impact Velocity Head Impact Angle WAD1 WAD2 Effective Head Mass
/ Vehicle Impact Velocity (deg.) /Pedestrian Height /Pedestrian Height /Head MassSedan 1.06 43.4 1.15 1.14 0.86SUV 0.96 71.2 1.11 1.10 0.751-Box 0.72 50.8 0.98 0.97 0.73
Average 0.91 55.1 1.08 1.07 0.78
Table 10 Summary of Parameter Study (preliminary resuls at 30, 40 and 50 km/h)

Y. Mizuno 12
In case of Sedan type vehicle, head impact velocity ratio is 0.78 for the head to bonnet contact and 1.06 for the head to windscreen contact. However, as already noted, the effects on head impact velocity of the pedestrian’s initial stance and of the shoulder and upper body stiffness used in the model have not yet been explored. There is a big difference for the head impact angle between the two groups. The average head impact angle is 73.0 degrees for bonnet contact and 55.1 degrees for windscreen contact. Wrap Around Distance (WAD) is almost comparable to the pedestrian height in cases of SUV for bonnet contact and of 1-Box for windscreen contact. The difference between WAD1 and WAD2 is very small. Effective head mass is almost comparable to the head mass itself for cases of bonnet contact, whereas it is about 80% of the head mass for cases of windscreen contact. In case of head to bonnet impact at SUV upper boundary, head effective mass becomes very small since the head impact against the bonnet tends to become less significant after the shoulder to bonnet impact. EXISTING METHODS AND TOOLS EEVC test methods The European Enhanced Vehicle-safety Committee (the former European Experimental Vehicles Committee) performed several studies and proposed various recommendations on test methods to assess pedestrian protection. In the spring of 1987 one of these proposals was discussed by the EEC ad-hoc working group ‘ERGA Safety’ 3. It was concluded that the basis of the proposal was promising, however, additional research was needed to fill up some gaps. The EEVC was asked to coordinate this research and at the end of 1987 EEVC Working Group 10 ‘Pedestrian Protection’ was set-up. The mandate of this group was to determine test methods and acceptance levels for assessing the protection afforded to pedestrians by the fronts of cars in an accident. The test methods should be based on sub-system tests, essentially to the bumper, bonnet leading edge and bonnet top surface. The test methods should be considered to evaluate the performance of each part of the vehicle structure with respect to both child and adult pedestrians, at car to pedestrian impact speed of 40 km/h. EEVC/WG10 started its activities in January 1988 to develop the required test methods as described by the mandate. These development studies were performed by
a European consortium consisting of BASt, INRETS, LAB/APR, TNO and TRL acting under contract to the European Commission and under the auspices of EEVC. In 1994 EEVC/WG10 was dissolved and its final report was published focusing especially on the changes and improvements with respect to the previous version of the proposed test methods. In 1997 a new EEVC working group - WG 17 Pedestrian Safety – was set up with two main tasks: 1. Review of the EEVC/WG10 test methods and
propose possible adjustments taking into account new and existing data in the field of accident statistics, biomechanics and test results.
2. Prepare the EEVC contribution to the IHRA working group on pedestrian safety.
The EEVC WG17 activities with respect to task 1 were finalized early 1999 and reported to the EC. Improvements were proposed with respect to the test procedure, definitions, tools and requirements. The EEVC/WG 17 methods were used by the European Commission as basis for further discussions on an EC Directive in this field. Figure 20 shows the EEVC pedestrian sub-system tests. The EEVC test methods include in order of priority: 1. Child headform to bonnet top test 2. Adult headform to bonnet top test 3. Legform to bumper test (up to 500 mm bumper
height, above that height optional, alternative upper legform to bumper test)
4. Adult upper legform to bonnet leading edge test The EEVC test methods fully describe the procedures for testing, the tools (including certification) and (proposed) test requirements.
Figure 20 EEVC Pedestrian Sub-system Tests
Headform Impactor
(Adult)
(Child)
Headform Impactor
(Adult)
(Child)Upper legform
ImpactorUpper legform
Impactor
Legform ImpactorLegform Impactor
Y. Mizuno 13
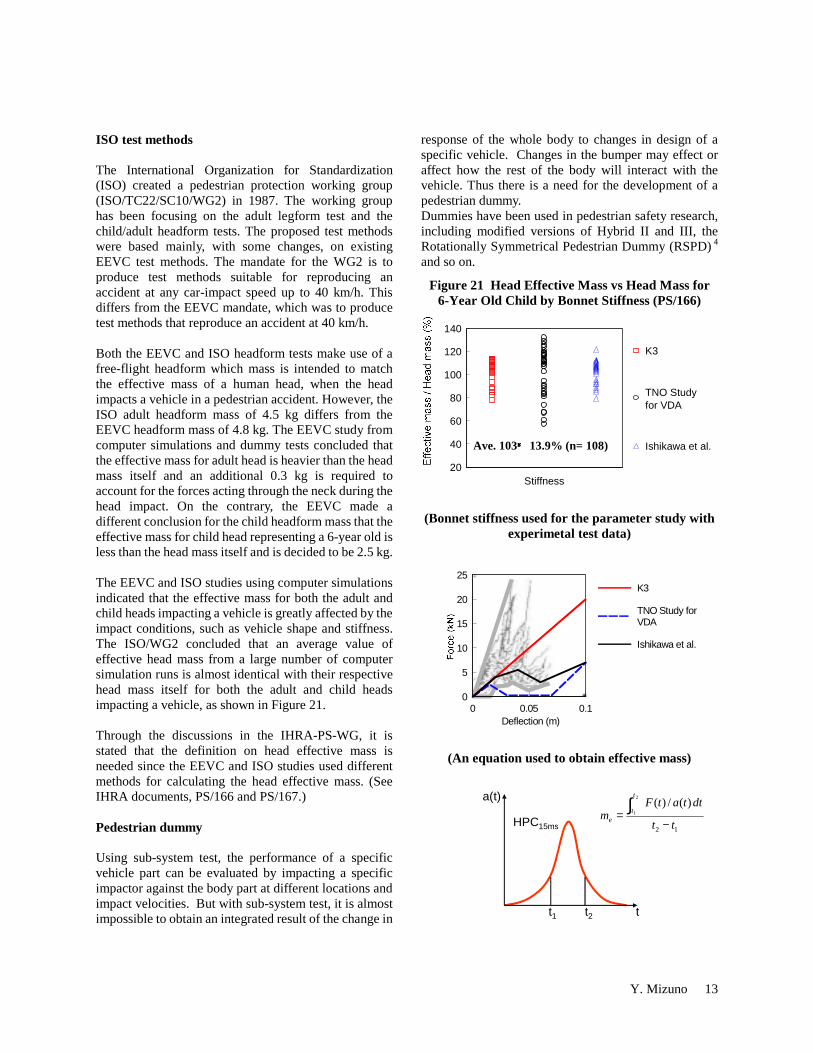
ISO test methods The International Organization for Standardization (ISO) created a pedestrian protection working group (ISO/TC22/SC10/WG2) in 1987. The working group has been focusing on the adult legform test and the child/adult headform tests. The proposed test methods were based mainly, with some changes, on existing EEVC test methods. The mandate for the WG2 is to produce test methods suitable for reproducing an accident at any car-impact speed up to 40 km/h. This differs from the EEVC mandate, which was to produce test methods that reproduce an accident at 40 km/h. Both the EEVC and ISO headform tests make use of a free-flight headform which mass is intended to match the effective mass of a human head, when the head impacts a vehicle in a pedestrian accident. However, the ISO adult headform mass of 4.5 kg differs from the EEVC headform mass of 4.8 kg. The EEVC study from computer simulations and dummy tests concluded that the effective mass for adult head is heavier than the head mass itself and an additional 0.3 kg is required to account for the forces acting through the neck during the head impact. On the contrary, the EEVC made a different conclusion for the child headform mass that the effective mass for child head representing a 6-year old is less than the head mass itself and is decided to be 2.5 kg. The EEVC and ISO studies using computer simulations indicated that the effective mass for both the adult and child heads impacting a vehicle is greatly affected by the impact conditions, such as vehicle shape and stiffness. The ISO/WG2 concluded that an average value of effective head mass from a large number of computer simulation runs is almost identical with their respective head mass itself for both the adult and child heads impacting a vehicle, as shown in Figure 21. Through the discussions in the IHRA-PS-WG, it is stated that the definition on head effective mass is needed since the EEVC and ISO studies used different methods for calculating the head effective mass. (See IHRA documents, PS/166 and PS/167.) Pedestrian dummy Using sub-system test, the performance of a specific vehicle part can be evaluated by impacting a specific impactor against the body part at different locations and impact velocities. But with sub-system test, it is almost impossible to obtain an integrated result of the change in
response of the whole body to changes in design of a specific vehicle. Changes in the bumper may effect or affect how the rest of the body will interact with the vehicle. Thus there is a need for the development of a pedestrian dummy. Dummies have been used in pedestrian safety research, including modified versions of Hybrid II and III, the Rotationally Symmetrical Pedestrian Dummy (RSPD) 4 and so on.
Figure 21 Head Effective Mass vs Head Mass for 6-Year Old Child by Bonnet Stiffness (PS/166)
20
40
60
80
100
120
140
Stiffness
K3
TNO Study for VDA
Ishikawa et al.
(Bonnet stiffness used for the parameter study with experimetal test data)
(An equation used to obtain effective mass)
Ave. 103±±±±13.9% (n= 108)
0
5
10
15
20
25
0 0.05 0.1Deflection (m)
K3
TNO Study for VDA
Ishikawa et al.
12
2
1
)(/)(
tt
dttatFm
t
te −
=∫a(t)
t
HPC15ms
t1 t2
Y. Mizuno 14
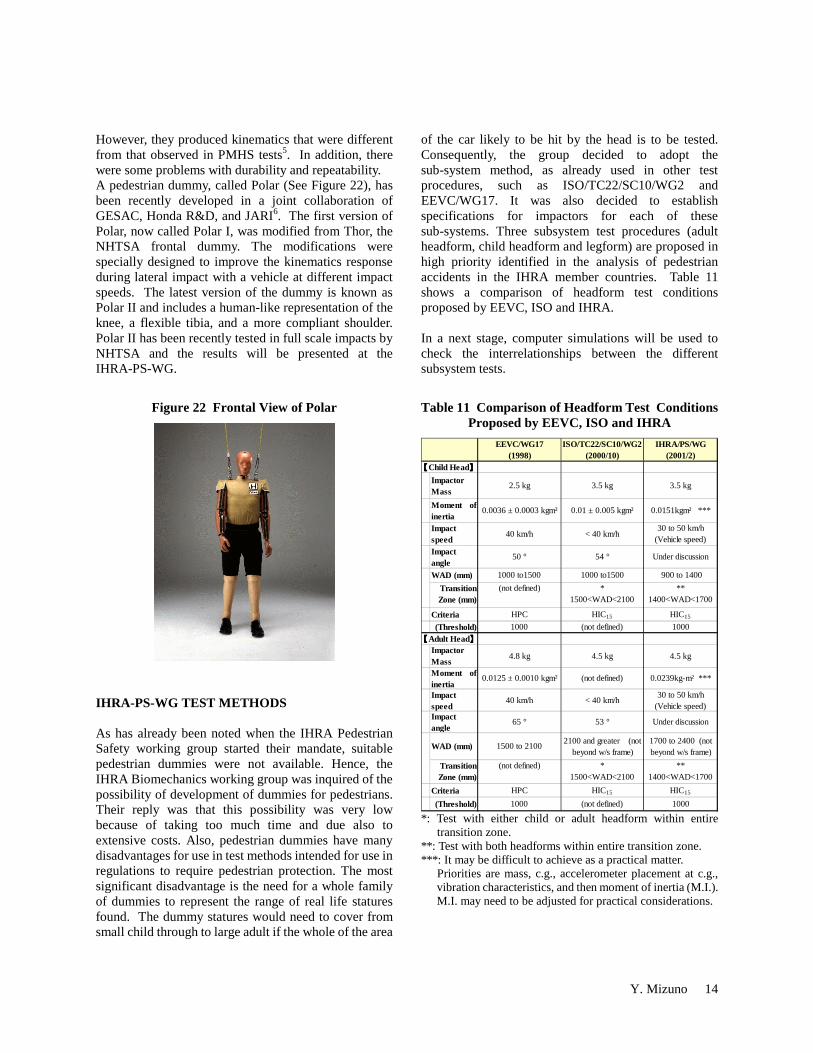
However, they produced kinematics that were different from that observed in PMHS tests5. In addition, there were some problems with durability and repeatability. A pedestrian dummy, called Polar (See Figure 22), has been recently developed in a joint collaboration of GESAC, Honda R&D, and JARI6. The first version of Polar, now called Polar I, was modified from Thor, the NHTSA frontal dummy. The modifications were specially designed to improve the kinematics response during lateral impact with a vehicle at different impact speeds. The latest version of the dummy is known as Polar II and includes a human-like representation of the knee, a flexible tibia, and a more compliant shoulder. Polar II has been recently tested in full scale impacts by NHTSA and the results will be presented at the IHRA-PS-WG.
Figure 22 Frontal View of Polar
IHRA-PS-WG TEST METHODS As has already been noted when the IHRA Pedestrian Safety working group started their mandate, suitable pedestrian dummies were not available. Hence, the IHRA Biomechanics working group was inquired of the possibility of development of dummies for pedestrians. Their reply was that this possibility was very low because of taking too much time and due also to extensive costs. Also, pedestrian dummies have many disadvantages for use in test methods intended for use in regulations to require pedestrian protection. The most significant disadvantage is the need for a whole family of dummies to represent the range of real life statures found. The dummy statures would need to cover from small child through to large adult if the whole of the area
of the car likely to be hit by the head is to be tested. Consequently, the group decided to adopt the sub-system method, as already used in other test procedures, such as ISO/TC22/SC10/WG2 and EEVC/WG17. It was also decided to establish specifications for impactors for each of these sub-systems. Three subsystem test procedures (adult headform, child headform and legform) are proposed in high priority identified in the analysis of pedestrian accidents in the IHRA member countries. Table 11 shows a comparison of headform test conditions proposed by EEVC, ISO and IHRA. In a next stage, computer simulations will be used to check the interrelationships between the different subsystem tests.
Table 11 Comparison of Headform Test Conditions Proposed by EEVC, ISO and IHRA
EEVC/WG17(1998)
ISO/TC22/SC10/WG2(2000/10)
IHRA/PS/WG(2001/2)
ImpactorMass
2.5 kg 3.5 kg 3.5 kg
Moment ofinertia
0.0036 ± 0.0003 kgm² 0.01 ± 0.005 kgm² 0.0151kgm² ***
Impactspeed
40 km/h < 40 km/h30 to 50 km/h
(Vehicle speed)Impactangle
50 ° 54 ° Under discussion
WAD (mm) 1000 to1500 1000 to1500 900 to 1400TransitionZone (mm)
(not defined) *1500<WAD<2100
**1400<WAD<1700
Criteria HPC HIC15 HIC15
(Threshold) 1000 (not defined) 1000
ImpactorMass
4.8 kg 4.5 kg 4.5 kg
Moment ofinertia
0.0125 ± 0.0010 kgm² (not defined) 0.0239kg-m² ***
Impactspeed
40 km/h < 40 km/h 30 to 50 km/h(Vehicle speed)
Impactangle
65 ° 53 ° Under discussion
WAD (mm) 1500 to 2100 2100 and greater (notbeyond w/s frame)
1700 to 2400 (notbeyond w/s frame)
TransitionZone (mm)
(not defined) *1500<WAD<2100
**1400<WAD<1700
Criteria HPC HIC15 HIC15
(Threshold) 1000 (not defined) 1000
【【【【Child Head】】】】
【【【【Adult Head】】】】
*: Test with either child or adult headform within entire
transition zone. **: Test with both headforms within entire transition zone. ***: It may be difficult to achieve as a practical matter.
Priorities are mass, c.g., accelerometer placement at c.g., vibration characteristics, and then moment of inertia (M.I.). M.I. may need to be adjusted for practical considerations.

Y. Mizuno 15
IMPLICATIONS FOR REGULATION Societal Benefits The aim of this section is to estimate the potential benefits in terms of casualty reductions, from vehicles that have been made to meet the pedestrian impact test requirements under development by this Working Group. Measures to protect pedestrians will also be of benefit to other vulnerable road users such as pedal cyclists and motorcyclists. The Working Group is producing test methods and test tools suitable for the whole of the vehicle front likely to strike a pedestrian. Protection is therefore assumed for all impact locations in frontal impacts. As protection requirements for the vehicle and the potential savings of pedestrian injuries are very dependent on the impact velocity selected for the test methods, benefits for three speeds (30, 40 and 50 km/h) have been estimated. These are vehicle equivalent speeds, which will not necessarily be the actual sub-system test speeds. Benefits have been estimated for fatalities and seriously injured casualties. The latter are defined here as casualties of MAIS 2 to 5 who are not fatally injured. The global accident dataset was the primary data source, but as it did not identify fatalities, this information was sought and gratefully received from the organisations that had originally contributed the data. Where necessary, national statistics from Great Britain were also used. The estimates of the proportions saved are derived from a chain of estimates, starting with all the pedestrians fatally or seriously injured. A proportion of these will be injured by vehicles within the scope of the test procedures, mainly by cars. Of these, a proportion will be injured by the impact type that the test procedures are simulating, namely a frontal impact. Of these, a proportion will be injured at a speed at which the test procedures can provide protection. Of these, a proportion of casualties will be injured by the vehicle rather than by the ground. For each speed, two methods were used to calculate the proportions injured at speeds at which the test procedures could provide protection: a) A simplified assumption that those saved above the test speed will match those not saved below, similar to the method of
Lawrence et al 7. b) An assumption that the safety measures will shift the whole injury distribution downward, similar to the method of Davies and Clemo 8. They assumed that a speed of 25 km/h was ‘safe’ with current cars; the same speed is used in this current study. Preventing some injuries to a pedestrian will not necessarily benefit the pedestrian; if they should receive a fatal injury from the ground contact then the result will be the same, however much improved is the vehicle. Fatalities were assumed to be saved if all injuries could be potentially prevented for which the AIS severity was the maximum (MAIS) for that casualty. For seriously injured casualties it was assumed that the serious casualty could be potentially saved if all the AIS 2 to 5 injuries were caused by car contact. However, casualties with both car contact and ground contact injuries in the AIS 2-5 range were counted as being 20 percent ‘saved’, to reflect that there was some benefit in reducing the number of serious injuries. It is assumed in the estimates shown in Table 12 that fatalities saved would still be seriously injured.
Table 12 Potential reductions in pedestrian fatal and serious casualties due to cars passing IHRA test methods, as a percentage of pedestrians injured by all vehicle types
Method Test Speed (km/h)
Fatal (%)
Serious (%)
30 5 17 40 14 27 Safe within
test speed 50 26 33 30 13 7 40 35 19 Speed-shift 50 48 29
Discussion: The estimates by the two methods differ markedly, particularly in their relative benefits for the two severities, demonstrating that estimates of this type are not precise. The ‘safe within the test speed’ method will tend to underestimate the potential for saving lives, as most fatalities occur above the test speed. Conversely, the speed shift method tends to over-estimate the potential for saving lives, as cars are likely to be optimised to just pass at the test speed, with little in-hand to provide protection at higher speeds.

Y. Mizuno 16
OTHER MEASURES It is recognised that improvement of the level of pedestrian protection provided by the design of the front of the car is only one of many ways of reducing pedestrian casualties. Road and traffic engineering measures, such as reducing vehicle travelling speeds by lower speed limits, can also be expected to reduce the frequency of collisions with pedestrians and the severity of those collisions that do occur. ASV (Advanced Safety Vehicle) technologies on active safety, such as pedestrian detection warning system, collision avoidance automatic brake, nighttime pedestrian monitoring system and so on, could prevent the pedestrian accidents or minimize the pedestrian injuries by decreasing the vehicle impact speed. However, even with advances in road and traffic engineering, and other measures, there will still be a need to minimise the severity of injury sustained by a pedestrian struck by a car. RECOMMENDATION Achievements This project has run for four years since July 1997, when the first IHRA-PS-WG was held, until the ESV International Conference in June 2001. Nine experts meetings have been held so far. The know-how of experts has been fully used and research in new areas has been conducted. Over this period, detailed information on pedestrian-involved traffic accidents in member countries was gathered and analyzed, and other relevant information from investigations conducted to date has also been gathered and analyzed. Data for traffic accidents in member countries reveal that although the percentages of pedestrian-involved accidents vary with each country, the percentages are relatively high. Since some member countries intend to introduce technical regulations like those in the EU, the IHRA-PS-WG is conscious of the urgent need to propose appropriate, harmonized test procedures as a potential basis for harmonized regulations. The work that has been done to develop the proposed EU regulation forms a useful basis for the development of
internationally harmonized test procedures. However, pedestrian protection is a comparatively new field and so the available information is not yet completely adequate for the development of comprehensive and validated test procedures. Pedestrian crash test dummies are not generally available at present, although a pedestrian dummy is being developed by the private sector. An inquiry was made to the IHRA/Bio WG, but they replied that dummies cannot be developed yet due to the time and cost required. It is also the opinion of some members of the IHRA-PS-WG that the kinematics of the vehicle/pedestrian collision may prove to be too difficult to reproduce in a valid and repeatable manner with a pedestrian crash test dummy. Accordingly, it was decided to use subsystem test procedures which, at least at this stage, are more practical and repeatable. Interactions between the results of the subsystem tests will be studied using computer simulation of the collision events once a comparison of existing computer simulation programs has been completed. Proposals for head impact subsystem test procedures for adults and children are nearly complete. These are top-priority issues. Proposals for test procedures for the adult leg are also being considered. Other areas of the human body will be researched in the future. Continuation of IHRA/PS Activities The aim of the IHRA-PS-WG is to prepare test procedures for the child and adult head, and the adult leg, for presentation at the ESV Conference in 2003, together with recommendations for research activities that will be needed to develop other test procedures for the further improvement of pedestrian protection. In the field of pedestrian crash injury biomechanics there are still areas which must be investigated and their practical applications explored. The IHRA-PS-WG plans to first clarify the issues, necessities and research responsibilities through detailed investigations. The following issues will be studied.
* Comparative evaluation of the results of, and interactions between, subsystem test procedures and test procedures employing a computer simulation program based on the best such programs currently available.
* Regarding leg impacts on the pedestrian, the IHRA-PS-WG plans to confirm the injury mechanisms and tolerance of the leg to impact.
Y. Mizuno 17
This will be followed by evaluation of available and proposed impactors and development of test procedures based on the results.
* Clarification of the importance of injury mechanisms to areas other than the head or legs; also, R&D on impactors to confirm such injury mechanisms.
This work will be greatly facilitated if member countries are prepared to cooperate and share the cost, conduct further studies, and assist in the development of essential test procedures. REFERENCES 1 Isenberg, R.A., Walz, M., Chidester, C., Kaufman, R.; “Pedestrian Crash Data Study-An Interim Evaluation,” Fifteenth International Technical Conference on the Enhanced Safety of Vehicles, Paper No. 96-S9-O-06, 1996. 2 Isenberg, R.A., Chidester, C., Mavros, S.; “Update on the Pedestrian Crash Data Study,” Sixteenth International Technical Conference on the Enhanced Safety of Vehicles, Paper No. 98-S6-O-05, 1998. 3 Commission of the European Communities; “Frontal Surfaces in the Event of Impact With a Vulnerable Road User,” Ad-hoc Working Group ERGA Safety, document ERGA S/60, Brussels. 4 Kajzer, J., Aldman, B., Mellander, H., Planath, I. and Jonasson K.; “Bumper System Evaluation Using an Experimental Pedestrian Dummy,” 12th International Technical Conference on the Experimental Safety of Vehicles, 1989. 5 Kallieris, D. and Schmidt, G. ; “New Aspect of Pedestrian Protection Loading and Injury Pattern in Simulated Pedestrian Accidents,” 32nd Stapp Car Crash Conference, SAE 881725, 1988. 6 Akiyama, A., et al. ; “Development of a Simulation Model and Pedestrian Dummy,” SAE paper No. 1999-01-0082. 7 Lawrence, G J L, B J Hardy and R W Lowne. ; “Costs and benefits of the EEVC pedestrian impact requirements,” Project Report 19, Crowthorne, UK: TRL Limited, 1993.
8 Davies R G and K C Clemo ; “Study of research into pedestrian protection costs and benefits,” Report No. 97-456502-01 under Contract No. ETD/96/84099 to the Commission of the European Communities. Nuneaton, UK: Motor Industry Research Association, 1997.
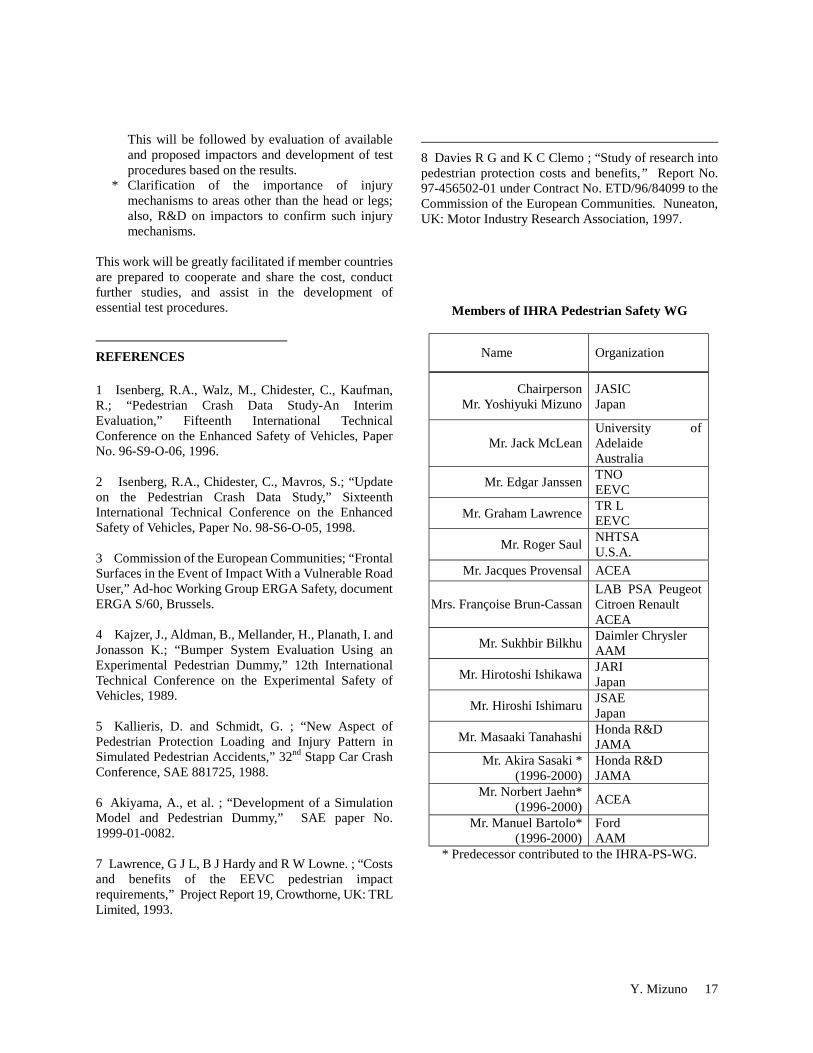
Members of IHRA Pedestrian Safety WG
Name Organization
Chairperson Mr. Yoshiyuki Mizuno
JASIC Japan
Mr. Jack McLean University of Adelaide Australia
Mr. Edgar Janssen TNO EEVC
Mr. Graham Lawrence TR L EEVC
Mr. Roger Saul NHTSA U.S.A.
Mr. Jacques Provensal ACEA
Mrs. Françoise Brun-Cassan LAB PSA Peugeot Citroen Renault ACEA
Mr. Sukhbir Bilkhu Daimler Chrysler AAM
Mr. Hirotoshi Ishikawa JARI Japan
Mr. Hiroshi Ishimaru JSAE Japan
Mr. Masaaki Tanahashi Honda R&D JAMA
Mr. Akira Sasaki * (1996-2000)
Honda R&D JAMA
Mr. Norbert Jaehn* (1996-2000) ACEA
Mr. Manuel Bartolo* (1996-2000)
Ford AAM
* Predecessor contributed to the IHRA-PS-WG.