[ignalycopy - nasa · introduction bolt loads can produce failures by one of three basic failure...
TRANSCRIPT

" /+sn_,4-'T/#--3_Y-_?"7
NASA-TM-86297 19840024366NASA Technical Memorandum 86297
FAILUREANALYSISOFA GRAPHITEIEPOXYLAMINATE_:::v..,..;,.--' "_.-."..'T_T"_I"'._","Ty,_ _-,__.., _-..'.:L ' ". ,/" >;._ .." ,, ,,.:,,_
SUBJECTEDTOBOLTBEARINGLOADS
_-- w,
J,H,CREWS,JR,ANDR,V,.A,NAIK
AUGUST1984
[IgnAlYCOPYS#_P_ 0 1084
.LANGLEYRESEARCHCENTERLIBRARY,NASA
HAMPTON,.VIRGINIA
NationalAeronautics andSpace Administration
Langley Research CenterHampton,Virginia23665
https://ntrs.nasa.gov/search.jsp?R=19840024366 2019-08-01T17:31:11+00:00Z


SELECT _:',i.T r-" I-_ i.A I.I _'_I-- I _/--T _--.p, __ _..4A ¥. ir-_ F.I _'%"_" F.I T p-.-l" • P,I.._. n _ligIEKi"I ..... 11_ :-_Lr'.l L......t;-,"........ ,, ['--]UI ].... _,_,_. ' .....ILJ",iH_'_
r-,'_ _-.i-_1 _,_1 p,r-, H'-I alltj/:_ I._v "_)/.-"/ I
, -.
:_,ht:E t .H I EbUN ,-_,_m,/'_l P'H-"
i ._"gS297- -<'._'_ o _ _ , _..... _, ,,,_.... _, _ U,_,L.,.._ I:'.! !
['ILL;_ I" d } ] ui"e ai-_a] ,'c_ _,. ._., o-r d =._'"._, ,_;j_,,_,, ........... ] _i'[! i _a"t "-' c'i iY" ""-"P "i'"-"_I tO. "L)] t. P)'-" 5P _ |-'iri
] -,"-'dc-.... "-'"- .... .I ,'-"........... D _' ='" ....... "-' ''U ,'I"'"'" H/L.NE[IL_'3,._ ,4 .... i--HH. _" ' .K)!II!|]](-)TI tJ[_ ,
i _ . t . li il_ •I',]OF'TO I i1, Vd, "i
H ._,.:h.,,] 1_, tt.t_KY..... ,'""_t,.,,_+,i Oiid] H_!- Ol IdU t ]C:R_ ,_=.,-,F_-I,.__ Si:'_C_.. ............ r,:it "IL)Ii- L,__.,!q I G_V-.__5_druh ,
I ll.-.ltlll - I._Jl._ i --. I !¥I].L..I . - ...... •,, TI_
l._l""_Ti I_%1'_ • I,-'_'T II.l'_r'i ''_ / iI iI.i#'_'_ i _.al.-_i'-'_l-'-i ''--. • t-,,,%-iir-_r,--t'-',l _ Ail. la-_l _11_ 1 __ •Hp'HI v.-. I :-'t/'"_ i _'_" "-''"
i_All, l,_. , i.-- I I--i'fll--ill l'fV it"IUitt _ _ .I..%..i-1-.-i1-.. t _i",1I KLS:_m r ...... ,"-.............
/i _ A. 1--'1 i.ili: ill
...... t'il =c-_=_m.,-,ty,-',ojC ..................... i -'_'_i-','-_T<_'-' ................ i---._=-ffll_j:'m'_; %-..%.4t.1. i ! _ _i%, .. .d! : t!i--fl I t .." %.! -_'zl'_ -I-_!!! f" ll'-# "%"...........
......................,,_._:. -.,. ,,,._r,',,-;<i".: ,........... F:tY_FIciTIT._, =i--.,<-'-r-,, ]tJ_"e er'.,el:'-"-"i...- l t%,." s• H,+ -r_ _ ,., :,-_ -. =' ."_- " [)_,---Jl'" I ;-_,x,lt ....... pq ],h-' to it,,re ....• _ ¢ .... c , .... . ..... i. __ - • -- -
"_- rr,e,-,_i--,_,<-_ ", ":---i-.-_,-.;'T ,','),'Ti'-ii":=T}<_''_-'<_r t<-,, ,-<>t....-<_.ai ]_,_:.-.c..,__.b:;" .... tb!_'ee' "l!d]'"- - T,_,] l{itll" r,,i0dee;.- - e_f.,-;jc)i5, sbea;"_0Llt, ,_,,=_-'_":u_.>ed___'=_,.....Kd-,vU;_.,'-'i_bmet-eItl,,l I -. - - .......... , .... "-_ , . L!I_ --'I ILIt t:"__i_dc_eafte:.," damage ,-)r-.,set_.-, afte,: ultimate load to e:>(,_-3rfilF-.,e.... [_; ........
• '...... _-:tJlated _01= _achi............. _r,,e, cO eS-S_S t ['_C_* ,_(,,I l_,l..il i !'_. I I. _a _ ........... .I .# ,- -• . . _o..-• _ ...... .a,. • _.l .... -- ill-'" -
test specimen c:c.,.i-,.,f1,_,,,---,-_._,,_:i__--o[',,.... ,_."_--I!O. '_" tiRP-<-J........... ili_ *_h a _ i ]tIP# C_"] t Of] tO• ..L .... : .._ i ..... "
•-.,,,-.-,_,,---"the test ' i"-, Fd _h,_._-. ,V .... t,_lL.! .......... l;i'-Jud _]t_',--,-- jnv,<-:,__n,-_,:. ..... d.-3.-r.,-i_c_.._......... iiiei--e; ...... i,u,t,,v, :<-, ;" .... if:,:t-e _,-:n_{_C:_iqtlv _'<-'".... "-":-""_"-'> " _'...._,.a: ,,_.._:,: tei--.,sJon ........r-,_t_dL_I '._-;b S =,,. _ ..........
.I-_! ,.,I ,_, ,. = .... "_

I

INTRODUCTION
Bolt loads can produce failures by one of three basic failure modes--
tension, shearout, or bearing. However, Joints are usually designed with
little regard for failure modes and typically are optimized for maximum ultl-
mate strength. For current graphite/epoxy composites, this approach usually
leads to joints that fall in the tension mode. Unfortunately, such tension
failures can develop with little advance warning in a rather catastrophic
manner.
The obJectlveof the present study was to analyze and compare laminate
failures for each of the three basic failure modes. Toward this end, tests
were conducted to measure damage onset strength,•ultimate strength, and fail-
ure energy for specimens subjected to bolt-bearlng loads. Specimens were
16-ply quasl-isotropic T300/5208 graphite/epoxy laminates in various con-
figurations that were designed to produce the different failure modes. Radio-
graphs, enhanced with a dye-penetrant, were used to observe the local
damage. A flnlte-element stress analysis was conducted for each specimen
configuration to determine how the configuration influenced the local stresses
near the loaded hole. The computed stresses were also used with laminate
failure criteria to predict failure modes and strengths.
Tests results are presented in terms of strength and failure energy
plotted for the range of specimen configurations. Failure modes and sequences
are identified and discussed, stress results are presented as stress distri-
butions and stress concentration factors. Failure predictions based on the
stresses are discussed and compared with observed test results.

SYMBOLS
C bolt-hole clearance, m
Cb coefficient for bearing damage onset prediction
Ct coefficient for tension damage onset prediction
d hole diameter, m
e specimen edge distance, m
Kbb bearing stress concentration factor
Ktb tension stress concentration factor
P bolt load, N
r,8 polarcoordinates,m, deg
rob characteristicdimensionforbearingfailureprediction,m
rot characteristicdimensionfor tensilefailureprediction,m
Sb nominalbearingstress,MPa
Sbo damage onset strength, MPa
Sbu ultimatestrength,MPa
t laminate thickness, m
w specimen width, m
x,y Cartesiancoordinates,m
6 holeelongation,m
8c bolt-hole contact half-angle, deg
a laminate stress, MPa
acu laminate compressive ultimate strength, MPa
err radial stress component, MPa
.C£u laminate tensile ultimate strength, MPa• b
Ce8 circumferential stress component, MPa
2

TEST PROCEDURES
Test specimen configuration and loading are shown in figure i. All
specimens were made from the same (0/45/90/-45)2s T300/5208 graphite/epoxyp
laminate which had a nominal thickness of 2.24 mm. Bolt holes were ultrasoni-
cally drilled with a diameter of 6.37 mm. The steel bolts had a nominal
diameter of 6.35 mm, but their actual diameter was 6.32 mm. This produced a
hole clearance C of 0.05 mm. The specimen width-to-hole diameter ratio,
w/d, ranged from 2 to 8. The edge distance-to-hole-diameter ratio, e/d,
ranged from 1.5 to 4.0. These specimen configurations were selected to
produce failures by the three basic failure modes shown in figures 2(b), 2(c),
and 2(d). The other failure modes in figure 2 will be discussed laterq
The bolt-loading apparatus is shown in figure 3. A pair of steel clevis
straps loaded the bolt in double shear; a friction grip reacted the load. The
washers (12.7 mm diameter) between the clevis straps and the specimen
(see fig. 3(c)) distributed the clampup torque load over an area around the
bolt hole. All bolts were torqued to 5.65 N.m, a moderate clampup torque for
a 6.35 mm bolt.
Inductive displacement transducers were used to measure bolt-hole elonga-
tion. The apparatus shown in figure 3(d) measured the relative displacement
between the clevis and a small, stiff wire that rested against the edge of the
hole under the bolt. To provide clearance for the wire, the bolt and the
washers were slotted. The measured displacements were attributed entirely to
hole elongation, since the clevis and bolt deflections were Insignlflcan=.
The curve of nominal bearing stress, Sb (Sb = P/td), versus hole
elongation, 6, was recorded throughout each test. The tests were conducted
using hole elongation as the servo control variable. The hole elongation was
increased at a very slow rate (0.002 mm/s) until the ultimate strength was
3

reached. This procedure produced load-displacement records that were very
sensitive to any localized damage near the bolt hole. This procedure also
allowed the specimens to be unloaded after ultimate strength was reached. The
unloading prevented the failure mode information(i.e., local damage) corre-
sponding to ultimate strength from being masked by the gross damage caused by -
complete specimen failure. A typical recording of bearing stress against hole
elongation (Sb versus 6) is shown in figure 4. The nonlinearity near the
origin is due to clampup friction between the washers and the specimen.
Results in reference I with a similar test apparatus showed that the friction
force was only about 50 N for the clampup torque used in the present study.
For higher load levels, the Sb - 8 curves were essentially linear despite
the nonlinear contact that developed between the hole and the clearance-fit
bolt. This contact behavior will_be discussed later in the stress analysis
section.
The damage onset strength, Sbo , was determined using three independent
methods. The start of nonlinearity in the Sb - 6 curve was the first evi-
dence of damage and was used to indicate damage onset, as shown in figure 4.
At slightly higher loads, snapping and popping noises were heard. The first
such audible noise was taken as the second indication of damage onset, and the
corresponding point was marked on each Sb - 8 record. As the loading pro-
gressed, abrupt drops or jumps would occur in the curve, also indicating
sudden damage development. The first such drop was used for the third Sbo
measurement. In some tests, specimens were unloaded immediately after the
first audible noise was detected and then radiographed using an x-ray-opaque
dye penetrant to determine the location, mode, and extent of damage. These
specimens were not tested further. Most specimens were loaded to ultimate
strength before they were unloaded and radiographed.
4

Specimens could not be unloaded precisely after ultimate load (point A)
was reached; testing had to continue slightly beyond this point to be certain
that it was the peak value for that curve. For example, the curve in figure 4
extends beyond point A to point B before unloading to point C. However, the
unloading curve from point A was needed to calculate the failure energy. The
failure energy _as calculated from the area enclosed by the curve 0AD. The
desired unloading curve from point A was approximated, as shown in figure 4,
by shifting the BC curve to get the AD curve.
ANALYTICAL PROCEDURES
Stress Analysis
Laminate stresses near the fastener hole were calculated using the
NASTRAN flnlte-element program with isoparametric elements. The finite-element
model shown in figure 5 corresponds to the largest test specimen
(w/d - 8 with e/d = 4). Other specimen configurations were modeled by
eliminating elements to change the w/d or e/d ratio as required. As a
result, the mesh refinement near the hole was identical for all configura-
tions. The mesh in this area consisted of small triangular elements, each
subtending 0.9375°, as shown in figure 5. The distance to the grip line end
of the model was 6d for all cases. A Young's modulus of 58.89 GPa and a
Possion's ratio of 0.31 were used to represent the quasi-isotropic T300/5208
laminate. These properties were obtained using lamination theory and the
T300/5208 ply properties from reference 2.
As previously mentioned, the case of a laminate with a clearance-fit,
loaded hole is a nonlinear problem. The contact area between the bolt and the
hole increases nonlinearly as a function of the bolt bearing stress, producing
a changing boundary condition at the hole boundary. An analytial approach
similar to that in reference 3 was used here to determine the nonlinear
5

relationshipbetween the bearing stress, Sb, and the contact angle, 8c. The
bolt was assumed to be frictionless,rigid, and fixed and the grip-lineend of
the model was subjectedto a uniform displacement, Us, in the negative
x-directlon. Within a specifiedcontact arc, 8c, the nodes on the hole
boundary were constrainedto lie on a circular are having the bolt radius.
The bearing stress, Orr, at the end of the contact arc (8 = 8c) should be
zero when the proper combinationof 8c and uo is found. The procedure
started by assuming values of 8c and uO and then calculating Orr at
8 = 8c. A second uo value was used with the same 8c value and a second
art was calculatedat 8 = 8c. A linear extrapolation(or interpolation)was
used to find the uo value correspondingto err = O. This uo value along
with the assumed 8c value defineda point on a uo - 8c curve. The
procedurewas repeated to developa uo - 8c curve for each specimen
configuration. A similar procedureled to Sb -8c curves. After these
nonlinear curves were established,the proper 8c and uo values could be
found for any Sb value.
FailurePredictions
Damage initiationwas assumed to be governedby the peak stresses at the
hole boundary. Accordingly,tensiledamage onset was predictedby setting the
peak tensile stress at the hole equal to the ultimate tensile strength,
Otu, for the laminate. Using the tensilestress concentrationfactor, Ktb,
this produced the followingequation:
CtSboKtb = atu (1)
The Ct coefficientwas introducedto account for the local stress gradient
near the hole. Whereas the atu value was obtained from coupons where a
) 6

relatively large volume of material was subjected to a uniform stress, the
material near the hole is subjected to a stress gradient and the peak stress
exists only over a small volume. As a result, the hole boundary strength
exceeds Otu. The coefficient Ct attempts to account for this stress gradi-
ent effect and was computed by solving equation (i) for Ct using test data
involving tensile damage. To predict tensile damage onset, equation (I) was
rewritten using this Ct value.
Sbo- atu/(¢tKtb) (2)
This empirical relationship is similar to that proposed in reference 4 to
predict the ultimate strength of loaded holes.
A similar expression was found for bearing damage onset using the bearing
stress concentration factor. Kbb , and the lamlnate compressive strength,
Ocu"
Sbo = Ocu/(CbKbb) (3)
For a given case, both equations (2) and (3) were used to predict Sbo values
for the two dlfferent damage onset modes. The lower Sbo value was taken as
the damage onset strength prediction and it also indicated the predicted
failure mode.
Although the damage onset was predicted using hole boundary stresses, the
ultimate strength Sbu was predicted using the well known Whitney-Nulsmer
polnt-stress approach (ref. 5). According to this approach, failure is pre-
dicted when the computed laminate stress (or stresses) satisfy a failure
criterion at a characteristic distance from the hole boundary. The maximum
stress failure criterion was used with the polnt-stress approach. For tensile
failures, the characteristic dimension rot was found by fitting the strength
7

prediction procedure to a measured Sbu value corresponding to an observed
tensile failure. This rot value was then used to predict failure for other
cases by using the stress distributions computed for these cases. This pro-
cedure will be discussed further when the predictions are compared with test
results.
RESULTS AND DISCUSSION
Test Results
Test results are presented for ranges of w/d values and then for e/d
values. In each case, the damage onset strengths and failure modes are pre-
sented and discussed. Next, the ultimate strengths and failure modes are
addressed. Finally, the measured failure energies are compared and discussed
for the various failure modes. Throughout this section, data points typically
represent the average of three or more test values.
Width effects. - Damage onset results are presented in figure 6 for
w/d values ranging from 2 to 8 with e/d = 4. Data from the three damage
onset detection techniques (nonlinearity onset, audible noise, and first drop)
are compared in figure 6(a). For w/d = 2 and 3, the damage onset was in the
local tension (LT) mode. ("Local" refers to damage that was confined to the
region under the washer. Damage beyond this region will be referred to as
"remote" damage.) Notice that for the small w/d values, nonlinearity was
not observed. For larger w/d values, nonlinearity developed before audible
noises and two modes of damage were detected, local bearing (LB) and local
tension (LT). This suggests that LB damage caused the nonlinearity and LT
damage caused the audible noise. The subsequent damage that caused the first
drop in the Sb - 6 curve could have been caused by larger scale, abrupt
damage in either the LT or LB modes.

The damage onset locations are shown in figure 6(b). Except for
w/d TM 2, the LT damage occurred in the range of 8 from 71 ° to 74 °. The
LT damage appeared to consist of lamina splitting and was concentrated in a
small region extendlngtransversely from the hole, as shown in figure 2(b).
In contrast, the bearing damage appeared to be mostly delamlnatlon and was
spread over a large arc centered about e TM 0° on the hole boundary. The
curve labeled "c88 peak" will be discussed later.
Ultimate strength results are compared with damage onset results in
figure 7. Except for the w/d = 2 case, which failed abruptly in a net-
section tension (NT) mode, the failure mode data for the ultimate strengths
were found by unloading the specimens after the maximum test load was reached,
as previously explained. Consequently, the failure modes associated with the
post-ultlmate response, culminating in complete specimen failure, may be
different from those indicated in figure 7. Comparison of the failure modes
for damage onset and for ultimate strength indicates failure sequences. For
small w/d values, damage initiated in the LT mode and progressed in the
tensile mode until specimen failure. As previously discussed, for w/d _ 3,
the damage apparently initiated in the LB mode, followed by LT damage
which produced the audible noise. As the load was further increased, the
damage progressed in both modes in a stable manner until the ultimate strength
was reached. For w/d > 5, remote bearing (RB) failure mode was found after
ultimate strength was reached and the specimen was unloaded, see figure 2(b).
It is doubtful that this RB damage developed in a stable manner because it
occurred beyond the clampup washer where the laminate had no lateral
support. It probably developed abruptly at ultimate load. Notice that in
figure 7, the transition from LT to RB failures occurred for 4 _w/d _ 6,
the range commonly used in composite joints. Also for this important w/d

range, notice that damage initiates at stress levels that are as small as 61
percent of the ultimate strength.
Failure energy data are presented in figure 8. As expected, the tension-
dominant failures (small w/d values) dissipated very little energy. Signif-
icantly higher energy levels were measured for the larger w/d cases. Part
of this increase is due to the higher ultimate strengths for large w/d
values. However, a significant part of the increase is believed to be attrib-
utable to the LB failure mode observed for the larger w/d cases. The
lateral support provided by the bolt clampup allowed the local bearing
deformation to progress in a somewhat stable manner. This stable LB damage
progressed until the specimen reached its ultimate strength. Although damage
also grew in the LT mode, this damage did not appear to dissipate much o
energy, as shown by the results for w/d = 3 in figures 7 and 8. If this is
the correct interpretation of the dramatic increase in failure energy shown in
figure 8 for the large w/d cases, it indicates that failure mode can have a
strong influence on the toughness of composite Joints. For some joint
applications, the increase in failure energy for 4 _ w/d < 6 may be more
important than the increase in strength in that w/d range.
Edge distance effects. - Damage onset results for w/d = 8 and a range
of e/d values are presented in figure 9. Damage initiated either in the
LT or LB modes. For the smallest e/d value, when the specimens were
radiographed after an audible noise, only the LT mode was observed. This is
further evidence that the audible noise was caused by LT damage. Notice
that even for the smallest e/d value, the expected shearout mode was not
observed. For large e/d values, nonlinearity developed before the first
audible noise and both LB and LT damage was found when the specimens were
unloaded. Consequently, as with the w/d data, these results suggest that
i0

LB damage caused the nonlinearity onset and that LB damage preceded the
LT damage. Figure 9(b) shows that LT damage developed near 8 = 71° for
the entire range of e/d values. The radiographs showed this damage in
rather narrow radial bands extending from the hole, as shown in figure 2(f).
Figure I0 shows ultimate strength results for the e/d values tested.
For the smallest e/d value, the specimens failed by the sequence of LT
damage followed by remote shearout (RS) to the specimen edge, see
figure 2(f). For the intermediate e/d values, the damage started with local
bearing, followed by local tension, and ended with remote shearout, shown as
LB/LT/RS in figure I0. For the larger e/d values, the failure sequences
culminated in RB failures. Note that the e/d = 4 case in this figure
corresponds to the w/d = 8 case shown previously in figure 7.
The failure energy results in figure Ii show the same trend as discussed
earlier for the w/d cases. Although the radiographs showed that the RS
mode resulted in considerable delaminatlon, this mode apparently dissipated
little energy. The larger failure energy measurements appear to correlate
with the presence of bearing damage.
Local Stress Evaluation
Stresses computed around the hole boundary are plotted in figure 12 for
three different cases. These stresses, the o88 tangential stress and the
arr bearing stress, have been normalized by Sb for comparison. The dashed
curves correspond to the stresses for an infinite laminate with a snug-fittlng
(C = 0) rigid bolt. This case provides good reference stress distributions
because the contact angle does not change with applied bearing stress.
Therefore, the contact angle (8c = 82°) and the stress distributions shown as
dashed curves apply for any level of bearing stress. The peak value of c8_S b
is 0.92, which agrees With the values of 0.91 and 0.92 from references 6
ii

and 7, respectively. This agreement verifies the finlte-element modeling used
in the present study.
The dash-dot curves in figure 12 represent stress distributions for the
largest test specimen (w/d = 8 with e/d = 4) with a snug-fltting (C = 0)
bolt. The contact angle of 85@ is only slightly higher than for the infinite
laminate case but the aee/Sb peak value was 1.14, more than 20 percent
larger than the reference case. This shows that even the largest specimen
used in the present study only roughly approximated the infinite laminate
behavior.
The solid curves in figure 12 show the stress distributions for the
largest test specimen with a 0.05 mm clearance fit. In this case, as
discussed earlier, the contact angle increases with applied bearing stress.
The results shown correspond to Sb = 664 MPa (the measured damage onset
stress for this test configuration); the contact angle was found to be about
70@. The solid curve has a peak c_9/Sb value of 1.27. Comparison with the
dash-dot curve shows that clearance fit increased the _00 peak by more than
i0 percent and shifted its location by 15@. This emphasizes the importance of
modeling the clearance fit in the present stress analyses.
The peak values of aee/Sb and Crr/Sb, expressed as stress concentra-
tion factors Ktb and Kbb , respectively, were calculated for the w/d and
e/d ranges used in the test program. The applied bearing stress levels used
in these calculations correspond to the damage onset strengths presented
earlier in figures 7 and I0. The computed Ktb and Kbb results are plotted
in figure 13. As expected, the small w/d cases had high Ktb values. The
locations of ace peaks on the hole boundary are shown in figure 6(b). These
locations agree well with the observed locations for tensile damage onset as
12

shown in figure 6(b). In contrast to the Ktb results, the Kbb values in
figure 13(a) are virtually unaffected by the w/d ratio.
The Ktb values in figure 13(b) are elevated for smaller e/d ratios.
This trend is probably responsible for the local tension damage previously
observed for the test cases with small e/d values. This will be further
discussed when strength predictions are presented in the next section. The
locations for the ae0 peaks, corresponding to the Ktb results, are shown
in figure 9(b). Again the locations for gee peaks agree very closely with
the measured locations for tension damage onset.
Failure Predictions
The dashed curves in figure 14 are predictions for damage onset, obtained
by using the calculated Ktb and Kbb values in equations (2) and (3). The
laminate strengths used in these predictiuliswere 414 M_= and 455 MPa fo_ L_le
tension and compression, respectively (ref. 2). The value of the Ct coeffl-
clent was determined from equation (I) using the Sbo data for the w/d = 2
case, which involved only tension damage. Tension damage predictions agreed
reasonably well with the test data shown by open symbols. For the bearing
predictions, Cb was found using Sbo data for the w/d = 4 case. For the
small w/d ratios, the tension-damage curve lies below the bearing curve,
indicating tension as the predicted damage onset mode. For w/d values
greater than 4, bearing is the predicted mode. These trends agree with the
observed failure modes discussed earlier.
" The dot-dash curves in figure 14 are predictions for ultimate strength.
The point-stress procedure was used with the _xx stress distributions and
the maximum-stress failure criterion to calculate these curves. The axx
distributions used in this procedure were those calculated along the observed
direction of damage growth. For tension predictions, the growth directions
13

4.
were transverse lines that intersected the hole boundary at the observed
damage onset locations, shown earlier in figure 6(b). The characteristic
dimension rot for tension was found to be 1.54 mm, based on the w/d = 4
data, and that value was used to predict tension failure strengths for thew
other w/d values. The procedure was applied in a similar manner to obtain
the predicted curve for bearing failure strengths. The bearing predictions
were all based on _xx distributions along the x-axls. The characteristic
bearing dimension rob was found to be 2.79 mm based on data from the
w/d = 6 case. Comparison of the two dash-dot curves shows that bearing
damage is predicted for w/d > 6, which agrees with the failure mode data
shown in figure 7. Furthermore, the strength predictions agree reasonably
well with the test results (solid symbols) in figure 14.
Figure 15 shows strength predictions for the e/d values. The damage
onset predictions (dashed curves) were calculated using Ct and Cb values
determlned from the w/d results. For this reason these curves are not as
accurate as for w/d predictions. Nevertheless, these curves predict the
damage onset modes correctly and also predict the proper damage sequence for
the large e/d cases. Because local shearout (see fig. 2(b)) was a viable
failure mode for small e/d values, the shear stresses along the shearout
plane (y = d/2) were determined for applied bear±ng stresses equal to the
measured Sbo values. Even for the rather extreme case of e/d = 1.5, the
maximum shear stress on this planewas slightly below the laminate shear
strength (310 MPa, ref. 2). In contrast, the corresponding Oxx stresses
along the observed damage path (a radial line at e TM 71@) exceeded the
tensile ultimate strength by as much as 70 percent. This explains why the
damage initiated in tension and propagated along the 9 = 71@ radial llne
rather than in the shear mode along the local shearout plane.
14

The predicted curve for remote shearout failures was calculated using
the axx distribution along the e = 71@ direction. As previously dis-
cussed, the failure sequence for the smaller e/d cases started as a tension
failure along the e = 71@ path followed by remote shearout failure along
the y = d plane, see figure 2(f). The predicted dash-dot curve in figure 15
indicates the data trends hut the predicted strengths have errors as large as
20 percent. Comparison of the two predicted dash-dot curves indicates the
proper failure mode trends but not with as much accuracy as shown for the
w/d cases.
The strength prediction procedures were also used with several failure
criteria in addition to the maximum stress criterion. These other criteria
were the Tsai-Hill (ref. 8), Tsai-Wu (ref. 9), Hoffman (ref. I0), Yamada-Sun
(ref. Ii), and the maximum strain criteria. The results based on the maximum
strain criteria were almost as good as those based on maximum stress.
However, none of the other criteria produced satisfactory predictions. Note
that all of these other criteria involve multl-axial stress components. This
suggests that the failures were governed primarily by the maximum stress,
which in all cases was the x-axis stress component.
CONCLUDING REMARKS
Quasi-isotropic graphite/epoxy laminates (T300/5208) were tested under
bolt-bearing loads using a simple fixture with a 6.35 =m steel bolt. Test
specimens had a range of widths and edge distances to produce failures by
several different modes. Radiographs were made after damage onset and after
ultimate load toexamine the failure modes and the failure sequences. The
laminate stresses near the bolt hole were calculated for each test specimen
configuration using a finlte-element procedure. These stresses were then used
in a failure prediction procedure to analyze the test results.
15

Damage onset was found to develop at stress levels that were as low as
62 percent of specimen ultimate strength. This damage developed in either the
bearing mode or the tension mode. Even specimens with small edge distances
developed damage in the tension mode rather than the shearout mode. Except
for specimens with very small widths or edge distances, the first damage
usually developed in the bearing mode and consisted mainly of ply delamlna-
tlon. However, at slightly higher stress levels, tension damage appeared in
the form of ply cracks. The location of tension damage on the hole boundary
correlated very well with the location of the computed maximum tensile
stress. The stress analysis showed that both the location and magnitude of
this maximum stress are strongly influenced by the bolt clearance.
The failure modes associated with ultimate strength were usually differ-
ent from the damage onset mode. Only for the case of tensile failures in
narrow specimens did the damage initiate ana grow to fallure in the same
mode. When wide specimens were tested to ultimate strength, they first devel-
oped damage in the local bearlng mode at the hole boundary, then local tensile
damage (also at the hole boundary), and finally developed remote bearing
immediately beyond the clampup washer. Specimens with moderately small edge
distances also failed in a sequence involving three modes: damage appeared
first in the local bearing mode, then In the local tension mode which lead to
the remote 8hearout mode extending from the edge of the washer.
Failures involving extensive bearing damage were found to dissipate
significantly more energy than tension dominated failures. Because the speci-
men configuration influenced the failure mode it, therefore, also influenced
the failure energy. With increasing w/d values, for example, the transition
from tension failure to bearing failure that occurred in the range of
4 _ w/d < 6 caused a very large increase in failure energy. For some
16

applications, this increase in failure energy for 4 _ w/d < 6 may be more
important than the increase in strength in that range. The failure energy for
bearing-loaded holes is a material property that should be given additional
emphasis in Joint design procedures as well as in material development
activities.
17

REFERENCES
i. Crews, J. H., Jr.: Bolt-Bearlng Fatigue of Graphlte/Epoxy Laminate.Joining of Composite Materials, ASTM STP 7A9, K. T. Kedward, Ed.,American Society for Testing and Materials, 1981, pp. 131-144.
2. DOD/NASA Advanced Composites Design Guide, Vol. IV-A: Materials, FirstEdition, Contract No. F33615-78-C-3203, Air Force Wright AeronauticalLaboratories, July 1983. (Available as NASA CR-173407 and from DTICas AD B080 184L.)
3. Mangalgiri, P. D.; Dattaguru, B.; and Rao, A.K.: Finite Element Analysisof Moving Contact in Mechanically Fastened Joints. Proceedings of theSeventh International Seminar on Computational Aspects of the Flnite-Element Method (CAFEM-7), Chicago, Illinois, Aug. 29-30, 1983,pp. 123-157.
4. Hart-Smith, L. J.: Bolted Joints in Graphite-Epoxy Composites. NASACR-144899, National Aeronautics and Space Administration, Jan. 1977.
5. Whitney, J. M.; and Nuismer, R.J.: Stress Fracture Criterion forLaminated Composites Containing Stress Concentrations. J. CompositeMaterials, Vol. 8, July 1974, pp. 253-265.
6. DeJong, Theo: Stresses Around Pin-Loaded Holes in Elastically Orthotropicor Isotropic Plates. J. Composite Materials, Vol. ii, July 1977,pp. 313-331.
7. Eshwar, V. A.; Dattaguru, B.; and Rao, A.K.: Partial Contact andFriction in Pin Joints. Rep. No. ARDB-STR-5010, Dep. Aeronaut. Eng.,Indian Inst. Sci., Dec. 1977.
8. Tsai, S. W.: Strength Theories of Filamentary Structures, FundamentalAspects of Fiber Reinforced Plastic Composites, R. T. Schwartz and H. S.Schwartz, editors, Wiley Interscience, New York, 1968, pp. 3-11.
9. Tsai, S. W.; and Wu, E.M.: A General Theory of Strength for AnisotropicMaterials. J. Composite Materials, Vol. 5, Jan. 1971, pp. 58-80.
i0. Hoffman, O.: The Brittle Strength of Orthotropic Materials. J. CompositeMaterials, Vol. I, 1967, pp. 200-206.
II. Yamada, S. E.; and Sun, C. T.: Analysis of Laminate Strength and ItsDistribution. J. Composite Materials, Vol. 12, July 1978, pp. 275-284.
18

y
" IGrip w _--xarea
- 1J_ 6d • _-- e --_
(a) SDec!m_ncnnflguratlon and Ioadlng
w/d 2 3 4 6 8 8 8 8 8
e/d 4 4 4 4 4 3 2,5 2 1,5
(b) Test specimenconfigurations
Figure 1, - Test specimenconfigurations and loading,
19
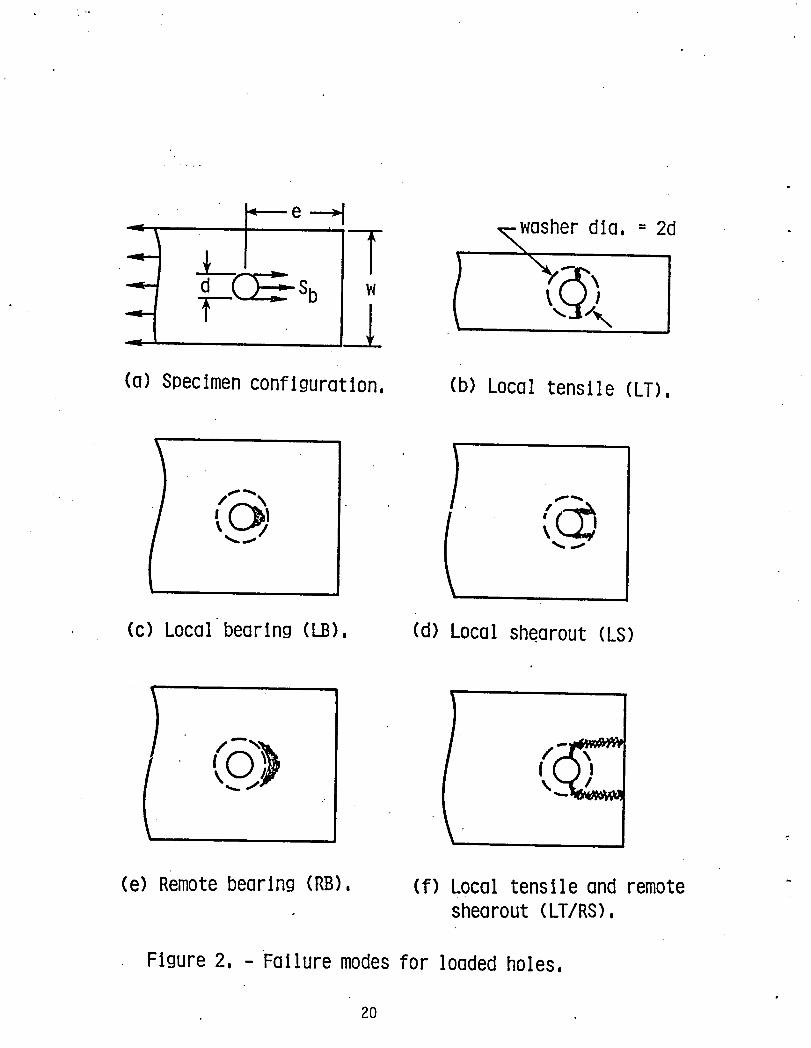
(o) Speclmenconflgurotlon, (b) Local tenslIe (LT),
,, , _i
(c) Local bearlng (_), (d) Local shearout (LS)
ii
_, : ;
(e) Remotebearing (RB), (f) Local tenslle and remote "sheerout (LT/RS),
Figure 2, -Follure modesfor looded holes,
20

Bolt
l -- levis
6d / Slotted /Specimen.
.__ - washerdie, = 12,7mmGrip area
(a) SDoclmenconfiguration, (b) koadlng(front view),
Specimen
Clevis
Displacementtransducer WIre
Slottedbolt
Slottedwasher
(c)Loading (side view), (d) Instrumentation,
•" Figure 3, - Specimenand test apparatus,
21

U1tlmatestrengthj Sbu__ AB
I/
!, /
!/
First drop /
z: Damageonset mAudlble nolse //. Nonllnearlty /
onset //
l Unloadlng/ curve
- /o /
//
//
//
//
//
0 D C Holeelongatlon,_r
Figureq, - Typlcalrecordingof bearingstressagainstholeelongatlon,
22

I_ I _1I- 6d ,,,-_-- e -I
/vvvvvv\ 7< J, / W12
lj
O,9375o
Figure5, - Finiteelementmodel,
23

- Flrst drop "_
600 LT .
/_T _'_' / Nonl!nearity " ,400 / Audible onset
Sb° nolse(MPa) " LT
200 -
0 , ! ! ! I ! I I1 2 3 4 5 6 7 8
w/d
(a) Measureddamageonset strengths,
!9 60- /(deg) Tensiondamage (:teePEAK
30--
0 , ! , ! I ! I I I1 2 3 4 5 6 7 8
w/d
(b) Damagelocation on hole boundary,
Figure 6, - Damageonset results for w/d range, e/d = 4,
24

- 1200- Ultimatestrength
i000 -B LBILTIRB
800
Sb(MPo)
600 LT
_///_ LBILT \ _'.....
400 N_ Damageonset (audible noise)kT
200-eld: 4
I I I I I I !1 2 3 4 " 5 6 7 8
w/d
Figure7, - Damageonsetand ultimatestrengthfora rangeof wldvalues,
25

e/d = L!
_- NT_I LT0 ! I ! ! I1 2 3 4 5 6 7 8
w/d
Figure 8, - Failure energy for range of w/d values,
26

- Firstdrop
600 - [] / LB/LT/m
Audlble NonllnearltySb 400 - LT noise onset(MPa)
200-
0 I ! ! I l I1 2 3 4
eld
(a)Measureddamageonset strengths,
90-
P.v/
60 - /e !
(deg) Tenslon C:reo PEAKdamage30 -
0 I I , I ! Ii 2 3 4
. e/d
(b) Damagelocation on hole boundary.
Flgure 9, - Damageonset results for e/d range, w/d : 8,
27
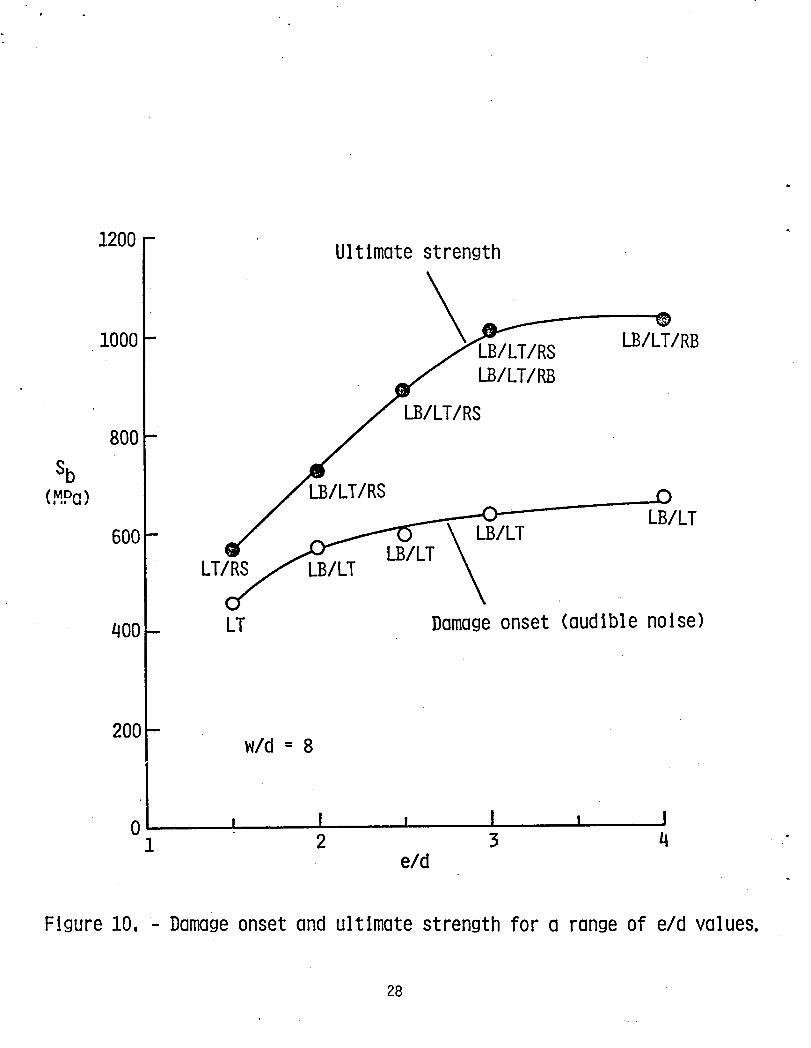
1200- U1tlmotestrength
i000 LB/LT/RB
800-
Sb(_Pa) ;_
600 LT/_ , LB/LT400- LT Damageonset(audiblenoise)
200-w/d - 8
0 l I I I I I.I. 2 3 4
e/d
Figure 10, Damageonset and ultimate strength for a range of e/d values.
28

3-
o u//"_'_/LTIRS, LBILTIRB
_I LBILTI_2O
. ,-._
r--
L.
wld = 8" 1
_ LB/t.T/RS.- LT/RS
0 I I I1 2 3; 4
e/d
Flgure.'L1,-Failure energyfor rangeofeYdwlues,
29

(3-_8B
1,0 Inflnlte laminate, C -0
I I I I I I I0 30 60 90 120 150 180
8, deg
Figure 12, - Stress distributions along hole boundary,
30

i
L-o
)(bearlng (:l-_ri)
2 -t-o
4-_
L.
Kbb(I)
f-o 1--u
e/d - 4L.
(/)
0 I I I I I I I1 2 3 4 5 6 7 8
w/d
(a)Resultsforw/d range,
I..o 2 --
° 1%ee ) ,
r-
_ Kbb (bearing _rr ) "121L.
ur--
o wld - 8(J m
(/)
1..
0 l I l I I I1 2 3 4
e/d
(b)Resultsfore/d range.
Figure13, - Stressconcentrationfactorsfor testspecimens,
31

1200-
Bearlngfallure,rob= 2,79nTn
_'--'--.---.2 _" _ ISbi000 - -_. u
Tenslon.failure, Tension damage
800- rot : 1,54mm onset, Ct = 0,52Sb .
AudlbIe noise(MPa)
600- . ----------"-"....
, • \400- Bearing damage
onset, Cb = 0,66
200 -
p
0 ! I ! I I ! I1 2 3 4 5 6 7 8
w/d
Figure 14, - Strength predictions for w/d range,
32

1200- Beorlngfollure,rob= 2.79n_n
i000 SbuRemotesheoroutfolIure,/._._'-
400 Cb = 0 66Tensiondamageonset,
Ct = 0.52
200-
O I I i I J- 1 2 3
e/d
Figure15,- Strengthpredictionsfor e/d ronge,
33


1. Report No. 2. GovernmentAccessionNo. 3. Recipient's'Catalog No.NASATM-86297
w
4. Title and Subtitle 5. Report DateFailure Analysis of a Graphite/Epoxy Laminate August 1984Subjectedto Bolt BearingLoads 6.PerformingOrganizationC_de
505-33-33-05
7. Author(s) 8. Performing Organization Report No.
J. H. Crews, Jr.
R. V. A. Naik* 1oWorkUnitNo.9.PerformingOrganizationName and Address
NASA LangleyResearchCenterHampton,VA 23665 11. Contractor Grant No.
13. Type of Report and Period Covered
12. SponsoringAgency Name and Address TechnicalMemorandumNationalAeronauticsand Space Administration 14. SponsoringAgency CodeWashington,DC 20546
15. S_pplementaryNotes
*R. V. A. Naik, GraduateStudent,01d DominionUniversity,Norfolk,VA
16. Abstract
Quasi-isotropicgraphite/epoxylaminates(T300/5208)were tested under bolt-bearing loads to Study failuremodes, strengths,and failureenergy. Specimenshad a range of configurationsto producefailuresby the three nominalfailuremodes: tension, shearout,and bearing. Radiographswere made after damage onsetand after ultimate load to examinethe failuremodes. Also, the laminatestressesnear the bolt hole calculatedfor each test specimenconfiguration,and then usedwith a failurecritetonanalyzethe test data.
Failures involvingextensivebearingdamage were found to dissipatesignifi-cantlymore energy than tensiondominatedfailures. The specimenconfigurationinfluencedthe failuremodes and thereforealso influencedthe failureenergy. Inthe width-to-diameterratio range of 4 to 6, which is typicalof structuraljoints,a transitionfrom the tensionmode to the bearingmode was shown to causea large increase in failureenergy.
The failuremodes associatedwith ultimatestrengthwere usuallydifferentfrom those associatedwith the damage onset. Typicaldamage sequencesinvolvedbearingdamage onsetat the hole boundaryfollowedby tension damageprogressingfrom the hole boundary. Ultimatefailuresinvolvedshearout beyondthe clampupwasher for specimenswith small edge distancesand involvedbearingdamage beyondthe washer for largerspecimens. Strengthpredictionsindicatedthat the damagecorrespondingto ultimatestrengthwas governedby the maximumstress near thehole.
17. Key Words (Suggested by Author(s)) 18. Distribution Statement '
laminate,bolt, bearing,graphite/epoxy,
strength,damage,stress analysis, Unclassified- Unlimitedcomposites
SubjectCategory24
19. Security Oauif. (of this report) 20. Security Clauif. (of this _) 21. No. of Pages 22. Dice
Unclassified Unclassified 34 A03
N-305 Forsaleby theNationalTechnicalInformationService.Springfield,Virginia22161

