igc transport project report v6 · list of tables ... annual growth rate of bangladesh’s...
TRANSCRIPT

Working paper
Travel mode choice preferences of urban commuters in Dhaka
A pilot study
Minhaj Mahmud Atonu RabbaniMarch 2012

1
Travel Mode Choice Preferences of Urban Commuters in Dhaka:
A Pilot Study
Minhaj Mahmud1 Atonu Rabbani2
1Research Fellow, Bangladesh Institute of Development Studies (BIDS), Dhaka, Bangladesh 2Assistant Professor, Department of Economics, University of Dhaka, Dhaka, Bangladesh
Submitted to: Bangladesh Country Growth Program
International Growth Centre (IGC)
Date: March 25, 2012

i
Table of Contents
List of Tables ........................................................................................................................ ii
List of Figures ....................................................................................................................... ii
1 Introduction ................................................................................................................. 1
1.1 Current Transport Situation in Dhaka .................................................................. 1
1.2 Prior Work ............................................................................................................. 2
1.3 Research Motivation .............................................................................................. 7
1.4 Organization of the paper ...................................................................................... 8
2 Results from the Baseline Pilot Survey ......................................................................... 8
2.1 Data ........................................................................................................................ 8
2.2 Results .................................................................................................................... 9
3 Choice Experiments Regarding Travel Mode Choice Dhaka ..................................... 15
3.1 General Background and Design Related Issues ................................................... 15
3.2 Choice experiment results .................................................................................... 20
4 1 Policy Implications of our findings................................................................ 23
5 2 Conclusions .................................................................................................... 24
References .......................................................................................................................... 25

ii
List of Tables
Table 1: Socio-economic description of the subjects. ............................................................... 10
Table 2: Respondents’ driving behavior. .................................................................................. 11
Table 3: Mode of travel to work. ............................................................................................. 12
Table 4: Travel information for using Car for commuting to office (N = 833). ...................... 12
Table 5: Importance of different factors for private means of transport. ................................. 13
Table 6: Importance of different factors for public means of transport. .................................. 13
Table 7: Household Expenditure on Private Car. .................................................................... 14
Table 8: Travel mode attributes and their respective levels. ..................................................... 20
Table 9: Discrete Choice Models - ML Estimates ..................................................................... 21
Table 10: Estimated Elasticity and Marginal Effects for Car and Bus Mode. ........................... 22
List of Figures
Figure 1: Respondents’ driving behavior by sex. ...................................................................... 11
Figure 2: Distribution of Total Expenditure. ........................................................................... 14
1
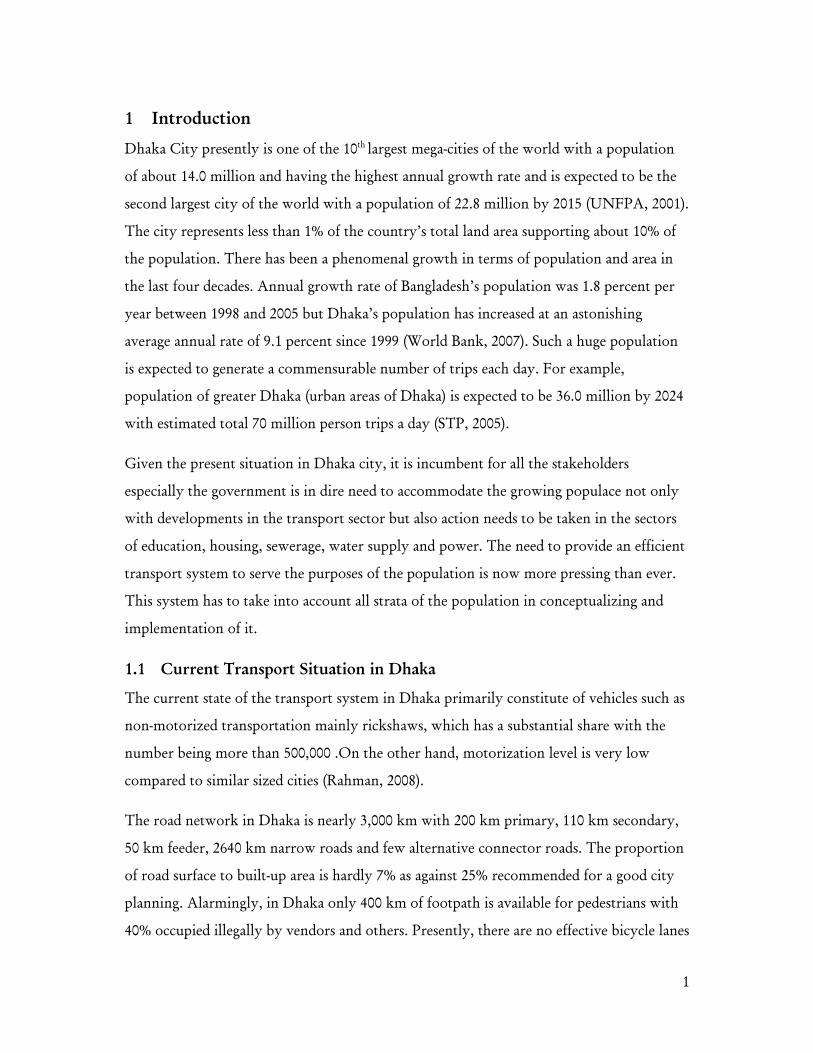
1 Introduction
Dhaka City presently is one of the 10th largest mega-cities of the world with a population
of about 14.0 million and having the highest annual growth rate and is expected to be the
second largest city of the world with a population of 22.8 million by 2015 (UNFPA, 2001).
The city represents less than 1% of the country’s total land area supporting about 10% of
the population. There has been a phenomenal growth in terms of population and area in
the last four decades. Annual growth rate of Bangladesh’s population was 1.8 percent per
year between 1998 and 2005 but Dhaka’s population has increased at an astonishing
average annual rate of 9.1 percent since 1999 (World Bank, 2007). Such a huge population
is expected to generate a commensurable number of trips each day. For example,
population of greater Dhaka (urban areas of Dhaka) is expected to be 36.0 million by 2024
with estimated total 70 million person trips a day (STP, 2005).
Given the present situation in Dhaka city, it is incumbent for all the stakeholders
especially the government is in dire need to accommodate the growing populace not only
with developments in the transport sector but also action needs to be taken in the sectors
of education, housing, sewerage, water supply and power. The need to provide an efficient
transport system to serve the purposes of the population is now more pressing than ever.
This system has to take into account all strata of the population in conceptualizing and
implementation of it.
1.1 Current Transport Situation in Dhaka
The current state of the transport system in Dhaka primarily constitute of vehicles such as
non-motorized transportation mainly rickshaws, which has a substantial share with the
number being more than 500,000 .On the other hand, motorization level is very low
compared to similar sized cities (Rahman, 2008).
The road network in Dhaka is nearly 3,000 km with 200 km primary, 110 km secondary,
50 km feeder, 2640 km narrow roads and few alternative connector roads. The proportion
of road surface to built-up area is hardly 7% as against 25% recommended for a good city
planning. Alarmingly, in Dhaka only 400 km of footpath is available for pedestrians with
40% occupied illegally by vendors and others. Presently, there are no effective bicycle lanes

2
and safe walkways. The 37-km long rail-road does not make a significant contribution to
the city’s transport system due to policy constraints. (Rahman, 2008). Furthermore, the
problem of lack of policies are evident from 100 open markets on the streets and 3,000
shopping malls beside roads without adequate parking provisions. A significant number of
the signals are controlled manually and there are insufficient traffic policemen for
controlling traffic.
The transport environment in Dhaka poses various problems such as mixed-modes
transports using the same road space, traffic congestion, delays, mismanagement, conflict
of jurisdictions, poor coordination among organizations and increasing environmental
problems.
1.2 Prior Work
Ahmed, Ahmed and Hoque (1980) investigated in their study about the failure of the
traffic management and administration of Dhaka city. The authors recommended
modification of traffic management and policies. They found that the existing transport
facilities not adequate to fulfill demand given the mixed mode situation of Dhaka.
Since early 1990s the traffic problems of Dhaka have received their due attention in
different policy papers. In an earlier attempt, Dhaka metropolitan area Integrated Transport
Study (DITS, funded by UNDP) project identified chronic traffic congestion, lack of traffic
management, conflict of jurisdictions and poor coordination among agencies as some of
the major factors needed to be sorted out to address the traffic problems of Dhaka city. It
also identified the inadequacy of the then fleet of 1,400 buses to properly meet the travel
demand of the city. It also recommended calling for the establishment of a more effective
organization structure to coordinate the traffic management and engineering activities of
the various agencies and to provide a more effective means of regulating public transport
services. It called for the encouragement of the formation of a small number of large
operators regarding bus industry rather than continuing with the large number of very
small operators. It also recommended infrastructure improvement and proposed traffic
engineering improvements at intersections with network importance as well at sites
between intersections that caused localized traffic congestion. It was also recommended
3
that a network of routes for non-motorized vehicles be designated by identifying many
such problem areas within Dhaka.
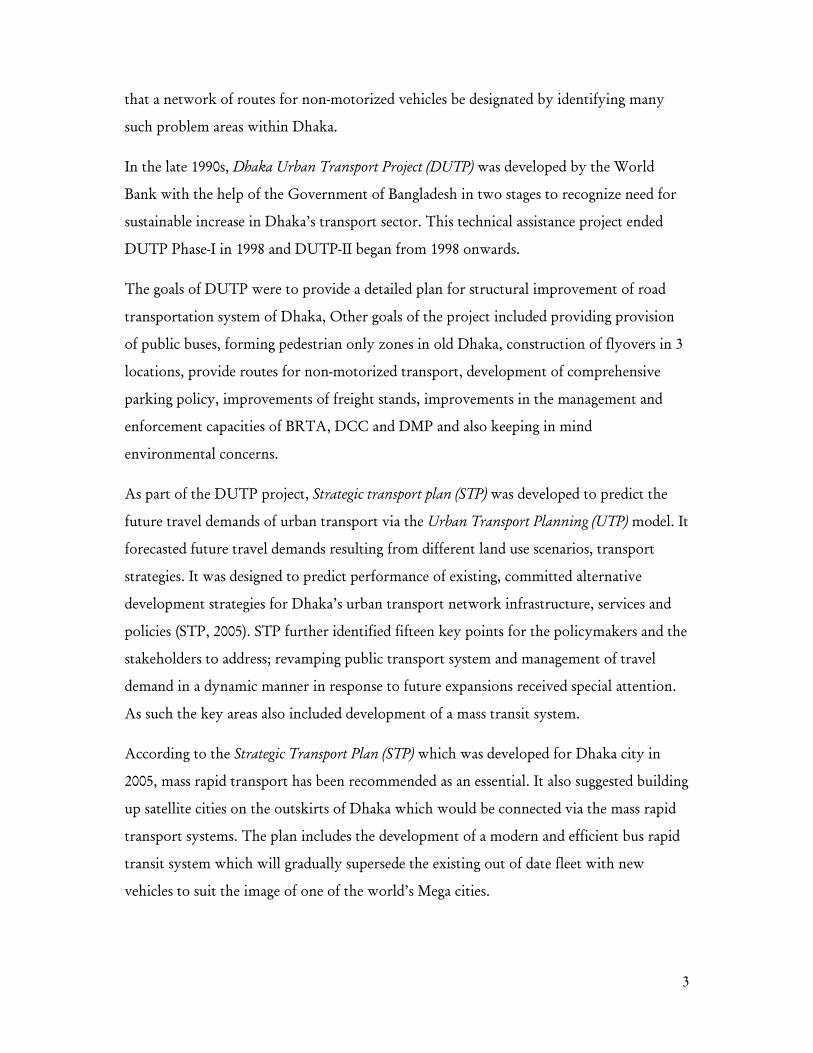
In the late 1990s, Dhaka Urban Transport Project (DUTP) was developed by the World
Bank with the help of the Government of Bangladesh in two stages to recognize need for
sustainable increase in Dhaka’s transport sector. This technical assistance project ended
DUTP Phase-I in 1998 and DUTP-II began from 1998 onwards.
The goals of DUTP were to provide a detailed plan for structural improvement of road
transportation system of Dhaka, Other goals of the project included providing provision
of public buses, forming pedestrian only zones in old Dhaka, construction of flyovers in 3
locations, provide routes for non-motorized transport, development of comprehensive
parking policy, improvements of freight stands, improvements in the management and
enforcement capacities of BRTA, DCC and DMP and also keeping in mind
environmental concerns.
As part of the DUTP project, Strategic transport plan (STP) was developed to predict the
future travel demands of urban transport via the Urban Transport Planning (UTP) model. It
forecasted future travel demands resulting from different land use scenarios, transport
strategies. It was designed to predict performance of existing, committed alternative
development strategies for Dhaka’s urban transport network infrastructure, services and
policies (STP, 2005). STP further identified fifteen key points for the policymakers and the
stakeholders to address; revamping public transport system and management of travel
demand in a dynamic manner in response to future expansions received special attention.
As such the key areas also included development of a mass transit system.
According to the Strategic Transport Plan (STP) which was developed for Dhaka city in
2005, mass rapid transport has been recommended as an essential. It also suggested building
up satellite cities on the outskirts of Dhaka which would be connected via the mass rapid
transport systems. The plan includes the development of a modern and efficient bus rapid
transit system which will gradually supersede the existing out of date fleet with new
vehicles to suit the image of one of the world’s Mega cities.

4
STP assumed that majority of people will continue to choose public transport as their
primary mode of travel. It also recognized the hierarchy of public transport systems in
which each vehicle type would have a definite and specific role to play. There will be high
capacity buses for carrying greater volumes through the main corridors while smaller
mini-buses will serve the more congested areas. Rickshaws and motorized three wheelers
will be given the role as feeder services linking neighborhoods with the main transit lines.
The mass rapid transit system (MRTS) which comprises of Bus Rapid Transport (BRT) was
expected to expand proportionally to the expansion in the anticipated growth in
population.1,2
Hasan (2007) noticed STP (2005) ignored some aspects of the socio-economic
characteristics of the people living in Bangladesh and transport structure (e.g. the wide
usage of non-motorized transport (NMT) and the different categories of people living in
different zones of the city) and are not fully appropriate for study in a developing country
context. He finds that locally developed research-based studies on transport in Dhaka
suffer from lack of data and sophisticated analytical tool which has been solved somewhat
through the Household Interview Survey (HIS) in the STP (2005) and the new more
advanced analytical tools.
Earlier, Ahsan (1990) suggested expansion of existing mass transit system, improvement of
maintenance facilities, stop and terminal layouts, quality of service and developing more
advanced systems like rapid transit systems. Alam and Habib (2003) provided several
remedies to alleviate traffic demand and control air pollution related to traffic. He also
investigated the policy implications from his recommendations. He suggested alternate
transportations to combat traffic congestion and air pollution. Such options include
1 The river transport services will also be integrated with the overall city-wide transport system. This will be achieved by creating closer and properly designed linkages between river transport and land transport. This will be achieved by re-designing the ferry terminals, providing seamless interfaces between river and land-based transport and by linking the fare structures to allow through ticketing of travel. 2 While the importance of private vehicles as feeder was well recognized, there were some suggestions to reduce reliance on such travel modes for environmental reason. E.g. Hasan (2007) recommended, as part of the alternative planning options, eliminating rickshaws, auto-rickshaws in addition to improving the bus transit system and introducing the rail transit system and improvement of road networks. He claimed that reducing rickshaws and auto-rickshaws will cut down on the pollution significantly by asserting that rickshaws will do so in the long run. Removal of rickshaws should be supplemented by increase in bus transit service to keep mobility level at present level and to absorb the passengers who would shift from rickshaws to buses.

5
banning rickshaws, auto-rickshaws from major roads, improving bus service, bottlenecks
and missing links in the road network and introducing rail transit.
The paper found that banning rickshaws and auto-rickshaws from major roads will have
major improvement on the congestion level which will skyrocket by 2020. The study
proposed to increase the number of cars and buses to keep mobility at current levels.
Improving modal share of buses, the study found speed of service to be the most sensitive
issue to relieve traffic congestion and to cut down on air and noise pollution. It was also
advised that speed of service can be increased by reducing waiting times, reducing the
number of operators of bus service in the city through developing co-operatives. The
benefit of rail transit system would be more apparent in the long run through land use
patterns.
Bari and Efroymson (2006) found that projects such as DUTP study seek to improve the
condition for cars while banning FFT simply increase the gaps between rich and poor;
increase imports of fuel, vehicles, and spare parts and thus of foreign debt; and
consequently, only lead to greater traffic congestion and thus fumes, noise, and suffering
for all.
They find that the banning of FFT in the demonstration project not only hampered
mobility of the majority of road users and greatly increased travel costs, but also resulted
in a 32-41% loss of net income for rickshaw and rickshaw van pullers, despite their
working longer hours, as revealed by the HDRC report on the rickshaw ban on Mirpur
Road (HDRC, 2004).
They discuss how it is unfortunate that some people in DUTP tend to blame FFT as the
root cause of transport problems in Dhaka City because in reality it is well known that
transport problems in Dhaka City have been attributed to unplanned urbanization
without any concerted effort to develop a transport system under an integrated supply and
demand management.
The paper also finds that nearly total elimination of Fuel-Free Transport (FFT) combined
with a very high increase in bus service resulted in only a 15% increase in passenger
capacity, whereas a small decrease in cars combined with only a modest increase in bus

6
service resulted in a 27% increase in passenger capacity in a VIP road, which has been
under Fuel-Dependent Transport (FDT)-only operation in the base case, indicating that as
far as road capacity is concerned the problem is cars, not rickshaws.
They posit that rickshaws are not the main source of traffic congestion as is asserted in
DUTP and provide relevant statistics to support their claims. Such statistics include
rickshaws making up 69.8% of vehicle but only utilizing 43.5% of road space to transport
59.4% of passengers (all trips). On the other hand, it was found that cars made up only
6.4% of vehicles, yet occupied as much as 29.9% of the road space in the base case to
transport far fewer passengers (5.5%) than by rickshaw.
Despite being removed from the main roads, their findings indicate that rickshaws are still
the most popular mode of transport, serving 30% of the passengers, whereas cars serve
only 8.5% of all trips (11% of vehicular trips) while requiring the greatest share of road
space (54.2%).
According to the paper, if Dhaka introduces public transit (PT) priority measures, such as
Bus Rapid Transport (BRT), there will be no need to give additional priorities to cars and
motorized para-transits. This is because BRT will be able to cater to the needs of
intermediate and long trips in combination with FFT priority measures, which will
address the needs of the majority of short trips. They cite that the city will experience
“traffic evaporation by making less room for cars and encouraging less space-consuming
transport”. This will cause people to drive less to avoid traffic jams, and are more likely to
walk, cycle, or take a bus. Thus, unnecessary trips would avoid making use of closer
destinations rather than travelling to farther ones. They suggested that a combination of
fuel-free transport and public transit would be far superior to a fuel-dependent transport
and public transit option.
They recommend emulating the transport practices in successful mega cities around the
globe like Singapore, Hong Kong, Tokyo and London where the use of cars has been
effectively restricted by imposing measures, such as imposition of lower speed limits,
reduction of road capacity by assigning more space to pedestrians and bicyclists, and
imposing restrictions on and increasing the price for car parking.

7
Enam & Chowdhury (2011) discussed the challenges faced in developing a paper on mode
choice model due to dearth of data on cost-structure of different modes and level of
service. Their paper develops choice set probabilistically using socio-economic
characteristics, trip destination and trip purposes.
They assert that contrary to common belief, Non-Motorized Transport (NMT) requires
relatively less space than cars and auto-rickshaws. NMT can move within comparatively
small spaces due to their relatively slower speeds, and maintain fairly low headways
(bumper to bumper time separation between two consecutive vehicles) and fit more
vehicles within a given width than larger vehicles such as cars. They conceded that
understand-still congested conditions, the proportional share of space occupied by
rickshaws would increase, but would always be likely to remain less than their legitimate
share of 53.90%. According to the paper, rickshaws are very efficient in terms of road
space allocations, and there is no scientific basis to prove otherwise.
They discussed other concerns such as whether the speed advantage of cars can overcome
their huge disadvantage in terms of space requirements in urban roads where average
operating speeds of cars are not significantly higher than that of rickshaws. They also
posited that the economic costs imposed on non-motorized transport by the presence of
motorized vehicles in the traffic stream or increases in door-to-door journey times due to
any NMT ban should also be included.
For high density mega-city such as Dhaka dependency on private mode is largely
inefficient and results in massive congestion. It is important to understand the different
attributes that are important to these commuters and learn about the possible trade-offs
between different modes. As such it will contribute toward designing a multi-modal
hierarchical transport network for the greater Dhaka region given the growth and
development of the city as a whole.
1.3 Research Motivation
Our study is a pilot which surveyed offices in Dhaka city regarding transport mode
preferences between two broad categories namely private car and public bus modes. We
wish to identify preference for and determinants of travel mode choice among individuals
commuting to work who predominantly use low-occupancy private travel modes (such as

8
private cars). We propose to conduct a mode choice experiment to learn about tradeoffs
people make between different attributes of private and public transportation system. The
specific policy aim is to encourage urban commuters to use public transportation mode by
providing apposite alternative for getting to work.
Our intention is to identify people’s preferences through hypothetical choice experiments
to elicit commuters’ preferences for alternative transportation modes (e.g. private cars
versus public buses). Our choice experiment involves defining attributes and levels of
attributes relating to car or bus depending on how the respondents choose to go to work.
We aim to choose policy relevant attributes so that policy could directly or indirectly
influence behavior.
1.4 Organization of the paper
The rest of the paper is organized as follows. In Section 2, we present results from the
survey carried out on a random sample of officer workers in Dhaka. We describe the data
and summarize the results in this section. In next section (Section 3), we present the results
from a choice experiment survey we administered on a subset of individuals from baseline
survey (which we described in Section 2). In Section 4, we provide some policy
implications from our results while we conclude in Section 5.
2 Results from the Baseline Pilot Survey
2.1 Data
We carried out the survey in two phases. In the first phase, we collected data with a target
of about 1,000 subjects. The main criteria were these subjects were needed to be office
goers with a potential to own or have access to private cars and also with a high likelihood
to taking such vehicle to commute to their work-place. We decided to interview subjects in
office settings which were more accessible to the enumerators. We also selected areas
where there were high concentrations of offices (e.g. Kawranbazar, Motijheel-DIlkhusha,
Banani, Gulasha etc.). We ended up with 1,058 such subjects. In the second phase we
selected a sample of about 300 who uses private cars to commute to office in order to carry
out choice experiments to elicit preference and willingness-to-pay over public mass
transport.
9
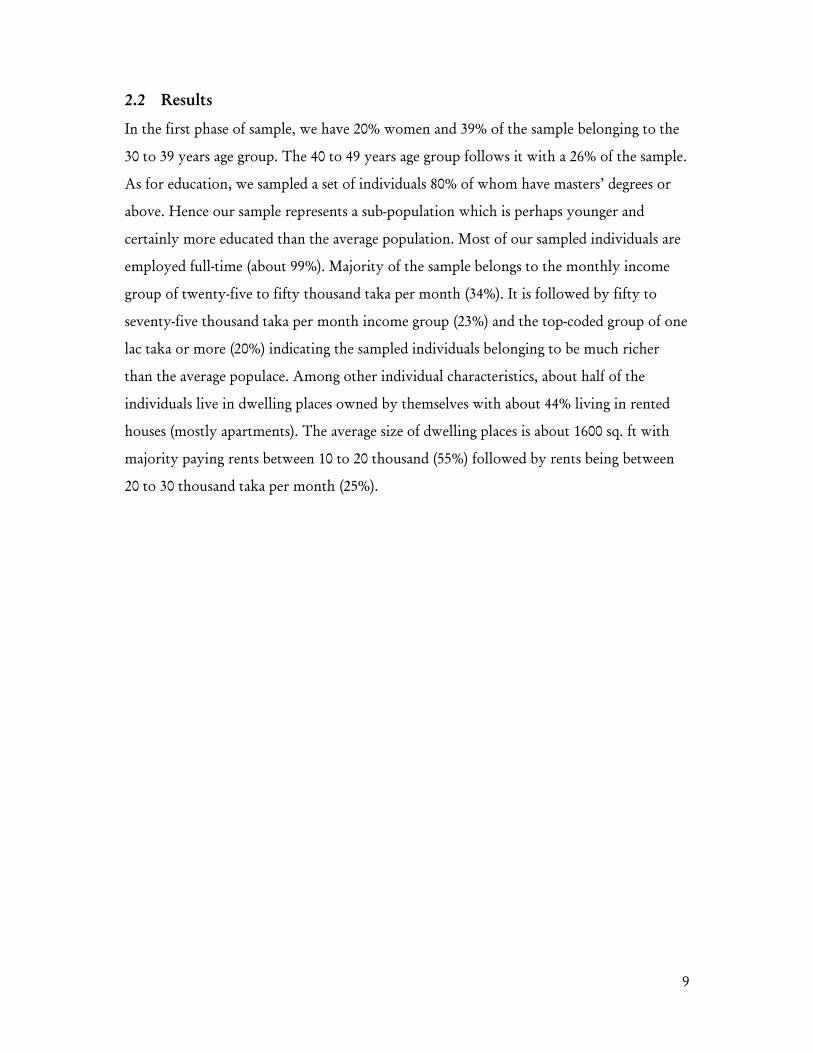
2.2 Results
In the first phase of sample, we have 20% women and 39% of the sample belonging to the
30 to 39 years age group. The 40 to 49 years age group follows it with a 26% of the sample.
As for education, we sampled a set of individuals 80% of whom have masters’ degrees or
above. Hence our sample represents a sub-population which is perhaps younger and
certainly more educated than the average population. Most of our sampled individuals are
employed full-time (about 99%). Majority of the sample belongs to the monthly income
group of twenty-five to fifty thousand taka per month (34%). It is followed by fifty to
seventy-five thousand taka per month income group (23%) and the top-coded group of one
lac taka or more (20%) indicating the sampled individuals belonging to be much richer
than the average populace. Among other individual characteristics, about half of the
individuals live in dwelling places owned by themselves with about 44% living in rented
houses (mostly apartments). The average size of dwelling places is about 1600 sq. ft with
majority paying rents between 10 to 20 thousand (55%) followed by rents being between
20 to 30 thousand taka per month (25%).

10
Table 1: Socio-economic description of the subjects. % %
Sex Total Work Experience (Number of Years)
% Female 20.0 0-10 38.3 10-20 32.9
Age Group 20-30 20.3 20-29 14.8 30+ 8.5 30-39 39.0 40-49 26.0 Household Size 50-59 16.9 1 44.3 60 plus 3.4 2 40.4
3 10.8 Highest Level of Education 4+ 4.5
Higher Secondary 0.9 Bachelors 19.0 Area of house/apartment (sq. ft.) 1601.7 Masters 67.0
Above Masters 13.1 Ownership Status of the Dwelling Place
Owned 51.8 Employment Status Govt. quarter 3.0
Full-time 98.7 Office Quarter 0.6 Part-time 1.3 Rented 43.6
Other 1.1 Income Group (Taka per month)
less than 25,000 9.7 Monthly Rent (in Taka if Rented) 25,000 to 50,000 34.4 less than 10,000 10.7 50,000 to 75,000 23.4 10,000 to 20,000 54.5 75,000 to 100,000 12.1 20,000 to 30,000 24.5 100,000 and above 20.4 30,000 to 40,000 7.9
40,000 to 50,000 1.1 50,000 and above 1.3
N = 1,058. Source: Authors’ Calculations from Survey Data.
In Table 2, we look at driving behavior of the respondents. About 51% of the respondents reported
knowing how to drive. Of which only 9% of the respondents was female. However, of
respondents who knew how to drive most of them were only occasional driver (58%). Less than
one-third of those individuals (about 29%) drove regularly. If we look at purpose of driving then
people who knew how to drive, drove mostly for recreational activities (60%). However, 48% of
these respondents drove for commuting to work (more than one response was permitted).
Shopping came next with about 34% of the respondents driving for this purpose.

11
Table 2: Respondents’ driving behavior.
N = 1,058
Can the respondent drive?
Yes 50.6% Of which
Female 9.3% How often?
Regularly 29.0% Sometimes 58.3% Never 12.5%
Purpose of driving
Commuting to work 48.3% Commuting to School 18.2% Recreation 60.0% Shopping 33.5% Other 7.2%
Source: Authors’ Calculations from Survey Data.
We have also looked at driving behavior by sex of the respondents. For all purpose women are less
likely to drive however, the difference in driving behavior is specially pronounced for commuting
to work. Women are much less likely drive for driving to office and also for driving to take
children to school (or any other educational institutes). For all other cases, both sexes exhibit
similar driving patterns.
Figure 1: Respondents’ driving behavior by sex.
Source: Authors’ Calculations from Survey Data.
‐10%
0%
10%
20%
30%
40%
50%
60%
70%
Male Female Male Female Male Female Male Female Male Female
Cummuting to work
Commuting to School
Recreation Shopping Other
12
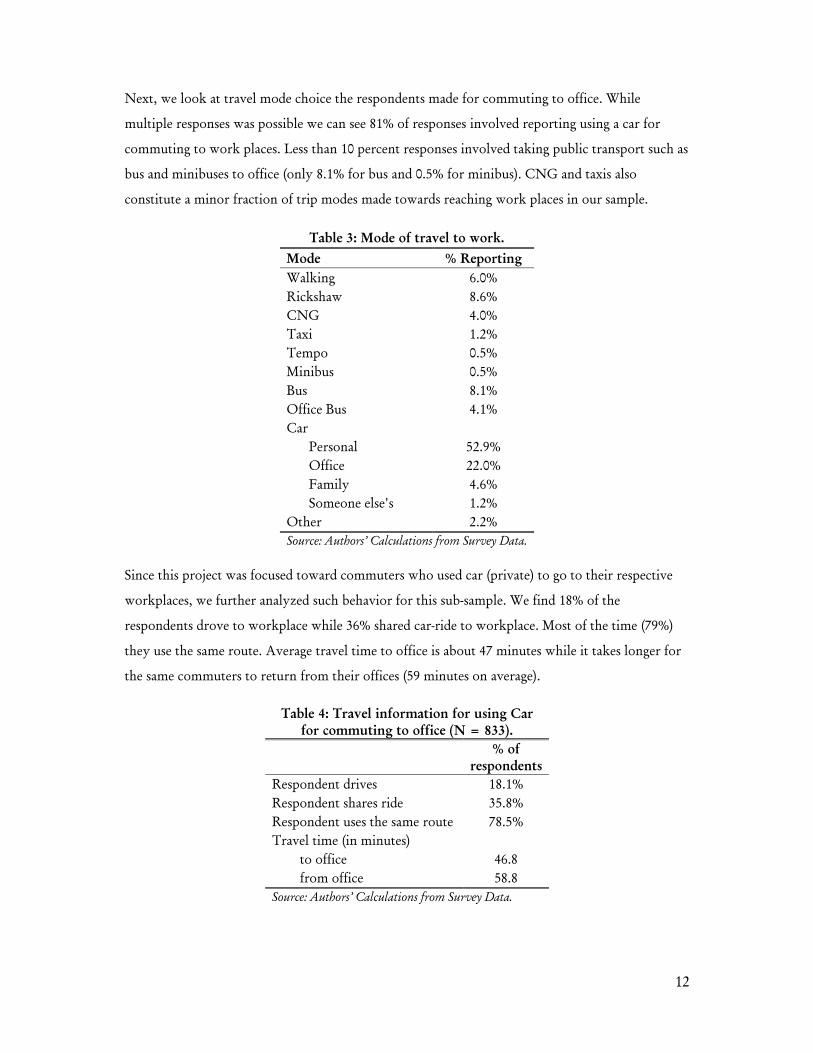
Next, we look at travel mode choice the respondents made for commuting to office. While
multiple responses was possible we can see 81% of responses involved reporting using a car for
commuting to work places. Less than 10 percent responses involved taking public transport such as
bus and minibuses to office (only 8.1% for bus and 0.5% for minibus). CNG and taxis also
constitute a minor fraction of trip modes made towards reaching work places in our sample.
Table 3: Mode of travel to work. Mode % Reporting Walking 6.0% Rickshaw 8.6% CNG 4.0% Taxi 1.2% Tempo 0.5% Minibus 0.5% Bus 8.1% Office Bus 4.1% Car
Personal 52.9% Office 22.0% Family 4.6% Someone else's 1.2%
Other 2.2% Source: Authors’ Calculations from Survey Data.
Since this project was focused toward commuters who used car (private) to go to their respective
workplaces, we further analyzed such behavior for this sub-sample. We find 18% of the
respondents drove to workplace while 36% shared car-ride to workplace. Most of the time (79%)
they use the same route. Average travel time to office is about 47 minutes while it takes longer for
the same commuters to return from their offices (59 minutes on average).
Table 4: Travel information for using Car for commuting to office (N = 833).
% of respondents
Respondent drives 18.1% Respondent shares ride 35.8% Respondent uses the same route 78.5% Travel time (in minutes)
to office 46.8 from office 58.8
Source: Authors’ Calculations from Survey Data.

13
Next, we elicited factors that the respondent reported as important factor for choosing private and
public means of transport for office trip. For the private means of transport travel cost per trip
topped the list followed by maintenance cost. So varying these factors would lead a commuter to
choose private means of transport one way or other. Environmental concerns come next.
Moreover, comfort of travel and parking facilities are also found to be important factors for
choosing private means of transport.
Table 5: Importance of different factors for private means of transport.
Table 6: Importance of different factors for public means of transport.
Travel cost (per trip) 2.15 Fare per trip 2.74 Maintenance cost 1.94 Distance to bus stop 2.11 Environmental concerns 1.69 Comfort 1.65 Comfort 1.53 Waiting facilities 1.61 Parking facilities 1.46 Environmental concerns 1.61 Travel time (commuting time) 1.36 Waiting time 1.46 Safety issues 1.30 Frequency of departure 1.46
Security issues 1.28 Travel time (commuting time) 1.25
Waiting facilities (if you use someone else's car) 0.60 Security issues 1.21 Waiting time (if you use someone else's car) 0.57 Safety issues 1.20
Other 0.03 Punctuality of arrivals/departures 1.15 Other 0.02
Source: Authors’ Calculations from Survey Data.
As for public means of transport, fare per trip and distance to the bus stop were reported to be
important factors for choosing (or not choosing) public means of transport. Comfort and waiting
facilities are next two factors which the respondents mentioned as factors which are important for
choosing public means of transport. Interestingly, travel time comes 6th most important factor for
private means of transport and 8th for public means. Since better transport facilities will affect both
private and public means (say, through better road management) travel time itself does not pose
any trade-offs for a particular mean of transport.
Since costs were reported to be important factors for choosing we looked at monthly expenditure
on private means of transport per vehicle for a household (see Table 7). There were 907 incidences
with few households having multiple private vehicles. The average expenditure is about 18.6
thousand taka per month. The cost for employing a driver is about 9.1 thousand taka per month
(an average over 683 observations). There are some incidences of renting a separate garage (241)
with an average cost of 1.9 thousand taka per month. The fuel cost for liquid petroleum (patrol or

octane) w
thousand
We furthe
cost is the
constitute
maintenan
One shou
amortizat
was reported t
taka per mon
ItemTot
DGFFRO
Notitem
er looked at t
e largest share
ed second lar
nce claimed 1
uld note that
tion and paym
Source: Auth
F
to be about 4
nth.
Table 7: Hm tal Driver SalaryGarage rent Fuel (Liquid) Fuel (CNG) Repair Other te: Mean and S
m. Source: Auth
the distributi
e of total exp
gest expendit
13% of total e
this underest
ments on loan
Figure 2
ors’ Calculati
Fuel (CNG)27%
O
.7 thousand t
Household ExN
907 y 683
241 698
636 633 50
SD are calculahors’ Calculatio
ion of these c
penditure whi
ture share wit
expenditure w
timates the ac
ns as well as p
2: Distributio
ions from Sur
Fu
Repair13%
Other1%
taka per mon
xpenditure oMean18,69,11,84,67,23,43,1
ated for numbeons from Survey
costs by differ
ich is about 4
th about 37%
with a minor
ctual cost of o
premium on
on of Total E
rvey Data.
uel (Liquid)19%
nth and for C
on Private Cn 637.56 27.94 54.36
683.08 246.59 457.46 36.00
er of reports foy Data.
rent items as
46% of total c
% of the total
r share going
owning a car
insurance.
Expenditure
Driver Salary37%
G
CNG it is abo
Car. SD 9,780.44 2,054.78 1,354.03 4,903.74 3,937.84 2,808.13 2,974.78
or each
reported abo
costs. Salary f
expenditure.
towards gara
owing to ign
e.
Garage rent3%
1
out 7.3
ove. Total fue
for drivers
. Repair and
age rentals.
noring
14
el

15
3 Choice Experiments Regarding Travel Mode Choice Dhaka
3.1 General Background and Design Related Issues
In this section, we attempt to identify people’s preferences through hypothetical choice
experiments. The basic idea is to create a hypothetical situation to elicit commuters’
preferences for alternative transportation modes (e.g. private cars versus public buses). In a
choice experiment, respondents make repeated choices between different alternative goods
or projects that are described by their attributes (see Louviere et al., 2000). By giving a
respondent the opportunity to answer several choice sets, we would obtain huge amount
of information for each respondent. Thus, we will be able to estimate the marginal impact
of different attributes on their choice of travel modes.
We can specify the indirect utility function representing individual preference for an
alternative (i) mode of transport as follows:
…
Whereas is the parameter associated with attribute and alternative i and is the
alternative i specific constant, parameter not associated with any of the observed and
measured attribute, which represents on average the role of all the unobserved sources of
utility.
According to the random utility approach (McFadden, 1974), the utility is not directly
observable and hence consists of both an observable and unobservable or stochastic
components. By introducing a random error term εi to reflect random components we can
re-write the utility function as Ui=Vi+εi.
The probability that an individual choosing alternative i is equal to the probability that the
utility of the chosen alternative is greater or equal to the utility associated with an
alternative j not chosen after evaluating available alternatives in a particular choice of j=1,
…., i, ….J alternatives. This can be expressed as
, 1,2, … , ,
We can re-write the above equation to clearly specify the random utility maximization as
follows:

16
, 1,2, … , ,
This says that probability of an individual choosing alternative i is equal to the probability
that the difference in the unobserved sources of utility of alterative j compared to
alternative i is less than or equal to the difference in the observed sources of utility
associated with alternative i compared to alternative j after evaluating available alternative
in a particular choice of j=1, …., i, ….J alternatives.
The workhorse choice model of discrete choice analysis is the conditional logit choice or
multinomial logit model (Louviere et al, 2000). The basic form (below) states that the
probability of an individual choosing an alternative( say i) among J alternatives is equal to
the ratio of the exponential of the observed utility index for alternative i to the sum of the
exponentials of observed utility indices for J alternatives including the i-th alternative
Probexp
∑ exp
Observed preferences heterogeneity in the choice models can be captured through
introducing socioeconomic characteristics of individual in eth systematic component of
the utility function. It may be noted that The vector of coefficients associated with k
attributes can be assumed to vary across individuals but are constant across choice
situations for each individual reflecting an underlying assumption of stable preference for
an individual (Train, 1998). However, to capture unobserved preference heterogeneity we
need to assume that parameters associated with attributes are random and follows specific
distribution random (random parameter model). The assumption regarding the
distribution of random parameters is important.3
We aim to understand which characteristics are more relevant to achieving a switch from
private mode to public mode thus focus on the relative importance of attributes. Our
sampling strategy is purposive, given the focus of our study: the sample consists of
individual living and working within the metropolitan area of the city. This allows us to
ensure that the respondents could actually make choice between private and public
transportation at least in the short run.4 This strategy however excludes people who
3 See Bhat (2000) for detail on treatment of heterogeneity using random parameter model. 4 We take similar approach as Alpizer and Carlsson(2001).
17
cannot potentially afford to own a private transportation for individual or family
purposes. We argue that by increasing the cost of using a private vehicle as well as by
increasing the attractiveness of public mode of transport might also have longer term
impact with regards to car ownership hence congestion as well as environment. Given that
we wanted to focus on individuals who commute to work by private mode of
transportation or individuals having work and having access to private vehicle, we have
chosen the offices of the following location.
In view of this sampling strategy, the baseline survey, our goal was to gather information
on the ones who have access to private modes of transport (either own, share/car-pooling,
rent, office transport) for commuting to work in Dhaka. In addition, the baseline
questionnaire enabled us to learn about office commuters who use other modes of
transport as well. Along with trip details and costs, the design of the survey instrument
further facilitated us to identify existing and potential car users. We surveyed 1058
personnel at various offices in Dhaka; particularly those who are employed in executive
level positions or higher. The type of private and government offices that we covered can
be broadly categorized into: banks, insurance, real estate, NGOs, research institutes, IT,
Telecoms, Newspapers, Media (Television and Radio), Pharmaceuticals, and Universities.
The samples were drawn using the cluster randomization approach; targeting the major
commercial areas of the city, namely Motijheel, Dilkusha, Paltan, Kakrail, Shantinagar,
Kawran Bazaar, Kazi Nazrul Islam Avenue, Panthopath, Dhanmondi, Mohakhali,
Gulshan, Banani, Uttara, Agargaon, and Dhaka University Campus. These areas are
situated at varied distances from the city center, and each area feature dissimilar types of
industries. Our trained enumerators approached individuals having access to private
vehicles or use private vehicles to fill out our baseline questionnaire and took their consent
about participating in a mode choice experiment few weeks later.5
Based on the baseline sample, we targeted the respondents who own car(s). This subset
included office commuters who use diverse modes of transportation, including those who
live in close proximity to their workplaces. In terms of location, the same baseline survey
areas (except Agargaon) were visited. We targeted 488 car owners from our baseline
5 Please see Section 2 of this report for the summary of statistics.

18
survey. The criteria for selecting these respondents were that they own cars, provided us
with their business cards and agreed to follow up in the choice experiments survey. At the
end of the choice experiments, we followed up with 315 respondents. The remaining
respondents could not be reached as most of them have been transferred to other locations,
changed jobs, and were away in meetings, etc.
The mode choice survey consists of questions on present work trips, fuel use, distance
from home to work place and travel time etc. Then the respondents were introduced to
the hypothetical mode choice experiment with two alternative mode of transport for using
to commute to work. The alternatives were described in terms of several attributes and the
respondents were asked to choose one of these two alternatives. Given that work trips
both ways contribute heavily to city’s congestion problem during peak hours, we restrict
purpose of trip in the choice experiment to work trips only. This also restricts individuals
to adjust respective schedules when facing the hypothetical choice situation and ensure that
the mode choice decision is not a function of chosen departure time and or congestion
levels.
Before the actual experiment was conducted the enumerators carefully explained each of
the attributes in the choice experiment. They also read to the respondents a summary of
the attributes. The last part of the survey includes follow up questions about
understanding of the choice experiment, opinion on relevant issues and socioeconomic
characteristics including income.
Prior study focusing on mode choice in Dhaka city concludes the difficulty of modeling
mode choices mainly because of various multiple mode used by city dwellers. However we
choose to restrict to two alternatives private vehicle (car) and public bus by including
policy relevant attributes to look at most important determinants and relative importance
of attributes with the policy aim of reducing congestion by inducing people to switch from
private mode to public mode of transport. The choice of attributes were based on our
baseline responses (discussed in Section 3 of this report), whereby individuals rank a list of
attributes (obtained from previous studies as well as expert discussions).
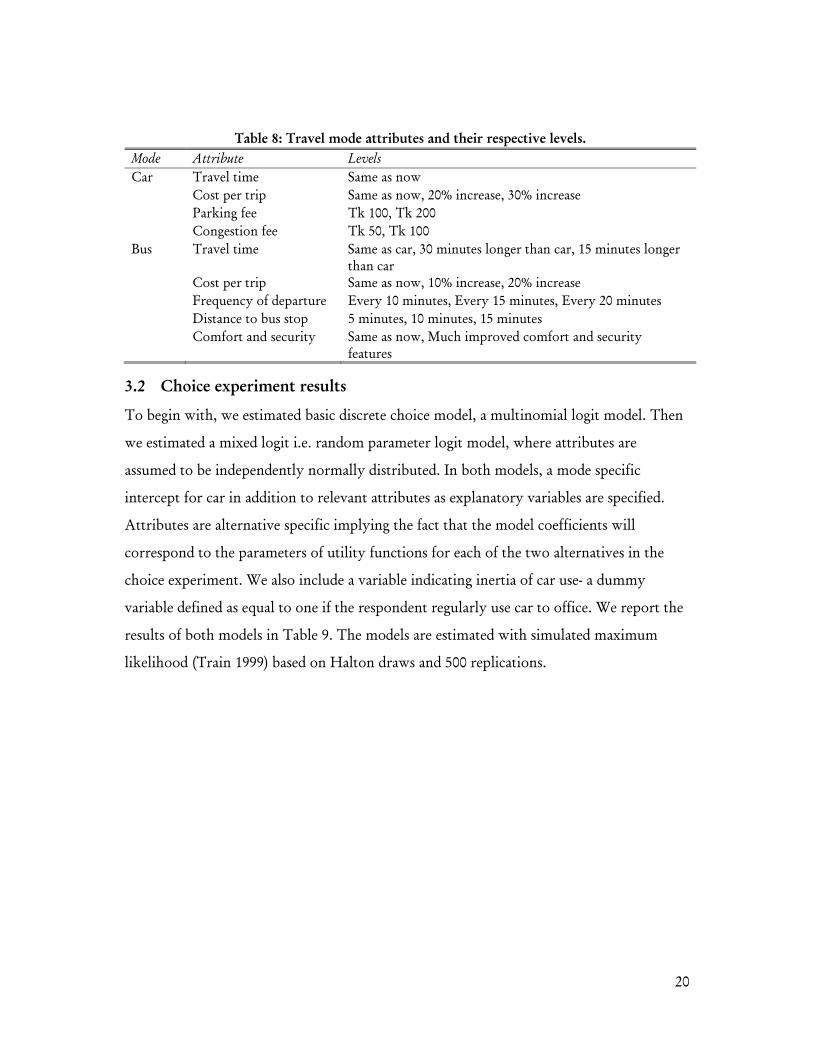
The selected attributes and their levels are presented in the following Table 8. The travel
time and cost per trip for car and bus are customized at current level. Before the choice
19
experiment, we asked individuals about the distance to work, type of fuel used in the car
for car users and travel time etc. Enumerators were given conversion formula to calculate
and present the relevant numbers while interviewing the respondents. Each respondent’s
travel time was determined by averaging the time taken to go to office and the time taken
to return home from office. Values of the three different levels in the choice experiments
were thus found using the averaged time. Travel cost per trip for both car and bus was
calculated using the distance between each respondent’s office and residence (as stated by
them). Travel cost per trip for bus, or bus fare, was found by multiplying distance with
Tk. 1.55 per kilometer. This particular fare rate has been set by the Bangladesh Road
Transport Corporation (BRTC) for non-air-conditioned buses in Dhaka city. For car,
travel cost per trip was calculated by multiplying distance with fuel price per kilometer.
On average, Compressed Natural Gas (CNG) costs about Tk. 7 per kilometer and
octane/petrol costs about Tk. 15 per kilometer. The survey respondents mentioned the
fuels that they use for their cars and based on that information, trip cost was computed. In
cases where multiple fuels are used, we considered the highest price, i.e. the price of
octane/petrol. The quality improvement in terms of comfort and security was
hypothetical but carefully explained.
The experimental design involves creating the choice sets in an efficient way by combining
attributes level into alternatives in the choice sets. The choice sets were created by only
considering the main effects using linear D Optimal design in Choice Metrics. The attributes
were combined to create 24 choice sets in 3 blocks and 8 choice situations. The choice sets
were randomly assigned to respondents to rule out the possibility of any ordering effects
on choices and thus each respondent answered eight choice situations whereby each time
they chose one of the two alternative modes they would use while commuting to office.6
Table 8 provides the description of attributes and levels used in the choice experiment.
6 We also asked debriefing questions to identify protests responses.
20
Table 8: Travel mode attributes and their respective levels. Mode Attribute Levels Car Travel time Same as now Cost per trip Same as now, 20% increase, 30% increase Parking fee Tk 100, Tk 200 Congestion fee Tk 50, Tk 100 Bus Travel time Same as car, 30 minutes longer than car, 15 minutes longer
than car Cost per trip Same as now, 10% increase, 20% increase Frequency of departure Every 10 minutes, Every 15 minutes, Every 20 minutes Distance to bus stop 5 minutes, 10 minutes, 15 minutes Comfort and security Same as now, Much improved comfort and security
features
3.2 Choice experiment results
To begin with, we estimated basic discrete choice model, a multinomial logit model. Then
we estimated a mixed logit i.e. random parameter logit model, where attributes are
assumed to be independently normally distributed. In both models, a mode specific
intercept for car in addition to relevant attributes as explanatory variables are specified.
Attributes are alternative specific implying the fact that the model coefficients will
correspond to the parameters of utility functions for each of the two alternatives in the
choice experiment. We also include a variable indicating inertia of car use- a dummy
variable defined as equal to one if the respondent regularly use car to office. We report the
results of both models in Table 9. The models are estimated with simulated maximum
likelihood (Train 1999) based on Halton draws and 500 replications.

21
Table 9: Discrete Choice Models - ML Estimates MNL RPL Coefficient
(Standard Error) Coefficient
(Standard Error) Coefficient Standard Deviation
Car Intercept -1.278*** (0.238)
-1.655 (0.382)
Car- Travel time -0.024*** (0.003)
0.029*** (0.006)
0.011 (0.007)
Car- Cost per trip -0.001 (0.001)
-0.001 (0.001)
0.00001 (0.001)
Car- Parking fee (Dummy variable)
0.076 (0.085)
0.11 (0.11)
0.024 (0.814)
Car- Congestion fee (Dummy variable)
0.118 (0.084)
0.172 (0.112)
0.0042 (0.666)
Bus- Travel time -0.029*** (0.003)
-0.035*** (0.006)
0.002 (0.023)
Bus- Cost per trip 0.023*** (0.009)
0.032** (0.013)
0.003 (0.0160)
Bus- Frequency of departure -0.022** (0.011)
-0.026** (0.013)
0.001 (0.104)
Bus- Distance to bus stop -0.055*** 0.011
-0.069*** (0.016)
0.021 (0.11)
Bus- Comfort and security 1.0303*** (0.087)
1.263*** (0.221)
2.11** (1.01)
Regular car user(Inertia) 0.692*** (0.109)
0.856*** (0.382)
Log-likelihood -1592.45 -1590 No. of observations 2520 2520 Pseudo R square 0.09 0.082
As the model coefficients corresponds to the parameters of utility functions for both the
car and bus alternatives a negative parameter, for example, for a specific alternative
indicates that an increase in that item will reduce the utility in choosing that alternative.
Although MNL model performs slightly better in terms of pseudo R square, using a
likelihood ratio test we can reject the restriction imposed by the MNL model( chi square
statistic 310 and p value <0.001). The models provide similar coefficient estimates in terms
of statistical significance. The standard deviation estimates of parameter distributions in
the RPL model does not appear to be significant (collapsed to mean) indicating no
preference heterogeneity (at least that we could observe given the distribution parameters
were derived) expect for the case of bus comfort attribute.

22
As observed for the bus mode all the attributes are significant determinates of mode
choice. We observe larger coefficients for the bus comfort attribute; this attribute have
much higher mean effect on the utility derived from a bus trip compared to other bus
attributes (e.g. level of service in term of frequency of departure). The travel time, distance
to bus stop, frequency of service as well is significant determinants of bus mode choice.
The cost attribute for the bus mode however, shows unexpected sign. This might result
from the fact that levels provided for bus cost per trip was too low for respondents to
make tradeoff or that respondents were focusing on other bus attributes specially bus
comfort when choosing bus alternative.
For the car mode, however travel time appears to be significant determinants of mode
choice. It s surprising that parking fee as well as congestion charge (dummy variables equal
to one for higher fee in both cases) are not significant. It may be noted here that parking is
generally free in the city whereby drivers are responsible for watching the car all the time.
The strong effect of inertia for car users as observed by the significance and sign of the
variables explains a lot here.
Table 10: Estimated Elasticity and Marginal Effects for Car and Bus Mode. Average Elasticities Average Marginal Effects
Direct (Car) Cross (Bus) Direct (Car) Cross (Bus)
Travel Time (Car) -0.610 (-0.57)
0.657 (0.61)
-0.541 (-30.35)
0.545 (29.10)
Cost per Trip (Car) -0.042 (-0.47)
0.046 (0.05)
-0.025 (-2.308)
0.025 (2.558)
Parking Cost (Car) 0.016 (0.020)
-0.018 (-0.022)
1.674 (1.08)
-1.687 (-1.01)
Congestion fee (Car)
0.026 (0.031)
-0.028 (-0.033)
2.60 (1.639)
-2.62 (-1.546)
Cross (Car) Direct (Bus) Cross (Car) Direct (Bus)
Travel Time (Bus) 0.904 (0.868)
-0.974 (0.933)
0.638 (46.04)
-0.643 (-43.78)
Cost per trip (Bus) -0.118 (-0.125)
0.128 (0.134)
-0.526 (-6.166)
0.53 (6.770)
Bus- Frequency of departure
0.146 (0.137)
-0.157 (-0.147)
0.502 (7.282)
-0.506 (-6.879)
Distance to Bus stop 0.236 (0.235)
-0.254 (-0.253)
1.219 (12.67)
-1.228 (-11.68)
Comfort for Bus -0.221 (-0.119)
0.238 (0.182)
-22.66 (-7.38)
22.8 (10.257)
Note: Figures in the parentheses are estimates from RPL model.

23
In Table 10, we report the responsiveness of mode choice to changes in the given attributes
in the context of choice experiment. In particular we provide estimates of elasticity and
marginal effects for different attributes obtained from both the MNL and the RPL model.
The elasticities are the percentage change in choice probability for a percentage change in
the corresponding attributes and the marginal effects are the marginal change in the choice
probability for a marginal change in the corresponding attributes. For dummy variables
however these estimates are rather approximations. The aggregate elasticities are computed
in NLOGIT as probability (of choice) weighted average of the individual elasticities and
marginal effects are also weighted by the choice probabilities (see Bhat, 1998). The higher
elasticities and marginal effects are reported for travel time in case of both travel modes in
the choice experiment. However, the magnitudes of elasticity and marginal effects are
rather small consistent , which is also consistent with earlier studiesas marginal effects and
elasticity may suffer from inertia with regards to car use as well limited adjustment
possibilities in the experiment (Alpizer and Carlsson, 2001; Bhat 2000; Swait and Eskeland,
1995). For illustration, we conducted simulation in NLOGIT to see how changes in some
of the attributes changes market share for a particular mode. A ten minute reduction in
travel time by bus produces estimated market share for bus mode increase by more than 5
percent. This increase in market share for car mode is less than 5 percent resulting from a
ten minutes reduction in travel time by bus. This later result is indicative of higher value
of time for bus (disutility of time spent by bus likely to be higher) compared to car
suggesting that reduction in travel time due to reduced congestion can have substantial
benefits for population. A doubling of full cost for the car alternative will produce an
estimated market share for the car down by 2% only where as a two fold increase in the
bus service quality (e.g. comfort and security) produces an estimated market share for bus
mode increased by 11 percent.
4 Policy Implications of our findings
The analysis shown above has some obvious policy implications/conclusions. The highly
significant inertia variable indicates survey respondents’ strong inertia in travel behaviour.
This is not unexpected as the car mode has many advantages, for example if we look at
24
flexibility of timing, route as well as comfort and safety. Although our sample is not
random per se one may still argue that breaking this behavioural pattern would not be very
easy unless coordinated effort on the part of policy makers to make bus as an attractive
alternative to the travelers. As the elacity estimates indicate focusing on bus fare reduction
may not be a good option but policies pertaining to increasing quality service both in
terms of frequency and adequate comfort and security can have much better impact. The
low direct elasticity for bus fare is indicative of the feasibility of relatively more expensive
but faster and better quality bus targeting middle class or relative lower income sample in
our study. In the short and medium term measures such as exclusive bus lane with faster
and accurate connections and providing priority traffic for buses during peak hours could
make substantial impact in terms of reducing congestion. At the same time introduction of
high congestion fee for car users during peak hours could do further trick. Given that
elasticity of car use with respect to parking and congestion fee is low, policies increasing
parking cost may not be as effective as one might argue. However, we do not want to
make any strong conclusion based on our result.
5 Conclusions
Generally results indicate that mode substitution is sensitive to characteristics and
performance of each mode. Travel time for both car and bus and comfort and security for
bus appears most important determinants of mode choice. Travel time for car as well as
bus cost per trip has higher elasticity and marginal effect. Our study reveals the most
important features for a successful public transportation system that can attract people
away from private mode at least for the purpose of commuting to work reducing
congestion and saving travel time – increased productivity. Benefit from reducing
congestion is expected to be high which has obvious implication for productivity and
growth. Given any uncertainty pertaining to sampling, one obvious conclusion is that
program aiming at reducing congestion during peak time should focus on substantial
increase in the cost of private transport and provision of faster and reliable and
comfortable public transport.
Our limitation of analysis is that it is partial in nature as the elasticity of transport demand
may not be representative of the Metropolitan Dhaka as we intended to be. It is however

25
expected that individuals would attempt to adjust higher costs per trip by reducing number
of trips beginning with the less important to them; for example non work trips. Future
research should conduct comprehensive mode choice experiment by modeling all relevant
modes an individual would have access to.
References
Ahmed, S.M. and Hoque, M.M. (1988). "Transportation and Traffic in Dhaka- Review of the Past,
Present and Outlook for the Future." Proceedings, Seminar on Dhaka 2000 Ad,IEB.
Ahsan, H.M. (1990). “A Study of Mass Transit in Metropolitan Dhaka”, M.Sc. Thesis, Department
of Civil Engineering, BUET, Dhaka.
Alam, Md. Jobair Bin Alam & K. M. Nurul Habib (2003), “Effects of alternative transportation
options on congestion and air pollution in Dhaka city”, Journal of Civil Engineering, Vol CE 31,
No.2, The Institution of Engineers, Bangladesh.
Alpizer, F and Carlsson, F. (2001), Policy Implications and Analysis of the Determinants
of Travel Mode Choice: An Application of Choice Experiments to Metropolitan Costa
Rica, Working Papers in Economics, No. 56. University of Gothenburg.
Bari, M & Efroyam, D (2006), Dhaka urban transport project’s after project report: a critical
review, Roads for People, WBB Trust.
Bhat, C. (1988), “Accommodating Variations in Responsiveness to Level-of-Service Measures in
Travel Mode Choice Modeling”, Transport Research A. 32: 495-507.
Bhat, C. (2000), “Incorporating Observed and Unobserved Heterogeneity in Urban Work Travel
Mode Choice Modelling:, Transportation Science 34: 228-238.
DITS, 1993, “Greater Dhaka Metropolitan Area Integrated Transport Study”, Prepared by PPK
Consultants Declan International and Development Design Consultant (DDC), Dhaka.
DUTP (Dhaka Urban Transport Project), Phase II (1998), Draft Final Report, Prepared by PPK,
Mot MacDonald and Development Design Consultant (DDC), Dhaka.
Enam, A., 2010, Developing a Comprehensive Mode Choice Model to Capture the Preferences for Mass
Rapid Transit in Dhaka, M.Sc. Thesis, Department of Civil Engineering, Bangladesh University of
Engineering & Technology, Dhaka.
26
Enam, A. and Choudhury, C, 2011, Methodological Issues in Developing Mode Choice Models for
Dhaka City, Bangladesh, Transportation Research Board Annual Meeting, Washington D.C., The
USA.
Gallaghar, R. (1992), “Rickshaws of Bangladesh”, University Press Limited, ISBN 9840511823.
Habib, K. M. N. (2002), “Evaluation of Planning Options to Alleviate Traffic Congestion and
Resulting Air Pollution in Dhaka City”, M.Sc. Thesis, Departmet of Civil Engineering, BUET,
Dhaka.
Hasan, S., 2007, Development of a Travel Demand Model for Dhaka City, M.Sc. Thesis, Department
of Civil Engineering, Bangladesh University of Engineering & Technology, Dhaka.
Rahman, Saidur, 2008, Future Mass Rapid Transit in Dhaka City: Options, Issues and
Realities,Jahangirnagar Planning Review, Vol. 6, pp. 69-81.
Jaigirdar, M. A. (1998), “Environmental Impacts of Improved Bus Service of Dhaka City”, M.Sc.
Thesis, Department of Civil Engineering, BUET, Dhaka.
Louviere, J.L., D.A. Hensher and J.D. Swait (2000), “Stated Choice Methods: Analysis and
Application”, Cambridge University Press.
McFadden , D. (1974), “Conditional Logit Analysis of Qualitative Choice Behavior” in P.
Zarambka (ed.), Frontiers in Econometrics, New York: Academy Press.
Revelt, D. and K. Train (1998), “Mixed Logit with Repeated Choices: Households’ Choices of
Appliance Efficiency Level”, Review of Economics and Statistics 80: 647-657.
STP, 2005, “Strategic Transport Plan for Dhaka”, Prepared by Louis Berger Group and Bangladesh
Consultant Ltd.
Swait, J. and G. Eskeland (1995), “Travel Mode Substitution in Sao Paulo: Estimates and
Implications for Pollution Control”, Policy Research Working Paper 1437, The World Bank.
Train, K. (1998), “Recreation Demand Models with Taste Differences over People”, Land
Economics 74: 230-239.
Train, K. (1999), “Halton Sequences for Mixed Logit”, Working Paper Department of Economics,
University of California, Berkeley.

CONFIDENTIAL
Area code Enumerator code SL
Baseline Survey Questionnaire
It will take only about 15 minutes of your time. All information will be kept confidential.
1.1 Name1.2 Gender 1) Male 2) Female1.3 Age group 1) 20-29 2) 30-39 3) 40-49 4) 50-59
5) 60 or older1.4 Education level (highest) 1) Higher secondary 2) Bachelors 4) Masters
4) Above Masters1.5 Can you drive? 1) Yes 2) No1.6 If YES -- How often do you drive? 1) Regularly 2) Sometimes 3) Never1.7 1) Commuting to work 2) Going to school
3) Recreation 4) Shopping5) Other, specify:
2. Information on how you commute to work2.1 Where is your residence located?2.2 1) Walk 2) Rickshaw 3) CNG
4) Taxi 5) Tempo 6) Mini-bus7) Bus 8) Office car 9) Office bus10) Someone else's car 11) Personal car12) Family car 13) Motorcycle14) Other, specify:
If 2.2 = 3 to 102.3 How far do you travel to avail that transport? km
2.4 How do you go there? 1) Walk 2) Rickshaw 3) Other:2.5 How long does it take to go there? minutes
If 2.2 = 102.6 Whose car do you use? 1) Friend's 2) Relative's 3) Colleague's 4) Other:
If 2.2 = 11, 122.7 Do you drive the car? 1) Yes 2) No2.8 Does anyone else travel with you? 1) Yes 2) No
2.9 Time taken to commute to work: minutes
2.10 Time taken to return home from work: minutes
2.11 Do you use the same route every day? 1) Yes 2) No2.12 Tk.Your average monthly transport expenses
(for commuting to work):
The research is supported by the International Growth Center (IGC) at London School of Economics (LSE) and the University of Oxford .
Which mode of transport do you usually take to commute to work?
This survey is part of a research on the transport situation in Dhaka. We intend to gather knowledge about people’s preferences for different modes of transport.
For what purposes do you drive? (Multiple options applicable)
Page 1/4

CONFIDENTIAL
3. Attributes of private and public transport modes3.1
Travel cost (per trip) 1 2 3 4
Maintenance cost 1 2 3 4
Safety issues 1 2 3 4
Security issues 1 2 3 4
Comfort 1 2 3 4
Travel time (commuting time) 1 2 3 4
Waiting facilities (if you use someone else's car) 1 2 3 4
Waiting time (if you use someone else's car) 1 2 3 4
Parking facilities 1 2 3 4
Environmental concerns 1 2 3 4
Other, specify: 1 2 3 4
3.2
Fare per trip 1 2 3 4
Frequency of departure 1 2 3 4
Safety issues 1 2 3 4
Security issues 1 2 3 4
Comfort 1 2 3 4
Travel time (commuting time) 1 2 3 4
Waiting facilities 1 2 3 4
Waiting time 1 2 3 4
Distance to bus stop 1 2 3 4
Punctuality of arrivals/departures 1 2 3 4
Environmental concerns 1 2 3 4
Other, specify: 1 2 3 4
4. Respondent's General Information
About your profession:4.1 Current occupation
4.2 Designation4.3 Employment status 1) Full-time 2) Part-time4.4 Your monthly income range 1) Less than 25,000 2) 25,000 to 50,000
3) 50,000 to 75,000 4) 75,000 to 100,0005) 100,000 and above
4.5 Past occupation
4.6 Duration of employment in current job years
4.7 Total work experience (since first job) years
5
5
5
5
Extremely important
Least important or
Not
How important are each of the following factors if you choose to use private transport (car) for commuting to work?
How important are each of the following factors if you choose to use public transport (bus, metro rail, etc) for commuting to work?
Rank according to their importance to you:
Rank according to their importance to you:
5
important
5
5
5
5
5
5
5
5
5
5
5
Extremely important
Least important or
Notimportant
5
5
5
5
5
5
5
Page 2/4

CONFIDENTIAL
About your household (HH):4.8 Household size
4.9 No. of adults
4.10 No. of students
4.11 No. of income-earners in your household
About your residence4.12 Area of your house / flat (in square feet) square feet
4.13 Ownership of your house / flat 1) Owned 2) Govt. quarter 3) Office quarter4) Rented 5) Other, specify:
4.14 If rented, Monthly house rent: 1) Less than 10,000 2) 10,000 to 20,0003) 20,000 to 30,000 4) 30,000 to 40,0005) 40,000 to 50,000 6) 50,000 and above
4.15 Does your household have cars? 1) Yes 2) No
5. If your household HAS cars5.1 How long have you been using cars? years
5.2 How many drivers does your HH employ?5.3 1) Commuting to work 2) Going to school
3) Recreation 4) Shopping5) Other, specify:
5.4 1) Car
5.5 2) Microbus
5.6 3) Jeep
5.7 4) Motorcycle
5.8 5) CNG
5.9 6) Other, specify:
Information on the two most used cars in your household:
5.10 Type of car5.11 Model year5.12 1)Brand new 2)Reconditioned 1)Brand new 2)Reconditioned
3) Used 3) Used4) Other, specify: 4) Other, specify:
5.13 How long have you been using the car? years years
5.14 1) Driver's salary Tk. Tk.
5.15 2) Garage rent Tk. Tk.
5.16 3) Fuel (octane/petrol) Tk. Tk.
5.17 4) Fuel (CNG) Tk. Tk.
5.18 5) Repair costs Tk. Tk.
5.19 6) Other, specify: Tk. Tk.
For what purposes do you use cars? (Multiple options applicable)
How many?
Monthly expenses on your car(s)
Please list the vehicles that your houshold has
Car # 1 Car # 21)Car 2)Microbus 3) Jeep 1)Car 2)Microbus 3) Jeep
In what condition did you buy the car?
Page 3/4

CONFIDENTIAL
6. If your household DOES NOT have cars6.1 1) None 2) Office car / bus
3) Colleague's car 4) Relative's car5) Friend's car 6) Other, specify:
Do you plan to buy vehicle in the next 1 year? 1) Yes 2) No6.3 What will you buy? 1) Car 2) Microbus
3) Jeep 4) Motorcycle5) CNG 6) Other, specify:
6.4 In what condition? 1) Brand new 2) Reconditioned3) Used 4) Other, specify:
6.5 Your budget? 1) Less than 10 lacs 2) 10 to 20 lacs3) 20 to 30 lacs 4) 30 lacs and above
6.6 1) Commuting to work 2) Going to school3) Recreation 4) Shopping5) Other, specify:
7.1 How would you like to participate in our upcoming survey? (Multiple options applicable)Over phone Your telephone / mobile number(s):
Online Your email address:In person Place: 1) Office
2) At home -- Home address:
3) Elsewhere -- Address:
Day(s) of the week: 1) Saturday 2) Sunday 3) Monday 4) Tuesday5) Wednesday6) Thursday 7) Friday
Your convenient time:
Enumerator's Section: Office Address:
8.1 Team no. 8.5 Organization
8.2 Date (dd/mm/yyyy) 8.6 Type of Org.
8.3 Time (hh:mm) 8.7 Address
8.4 Comments: Write overleaf (in detail)
Data Entry Operator's Section: 8.8 Area
9.1 Entered by: 8.9 GPO Box No.
9.2 Date (dd/mm/yyyy)
Thank you for your time and cooperation!
Do you have access to cars? (Multiple options applicable)
For what purposes will you use the vehicle? (Multiple options applicable)
We will conduct another survey from 21st January 2012 to 10th February 2012 to learn more about the factors that influence people’s choice of public and private modes of transport. You are invited to participate.
If you are willing to provide feedback, we can ensure your participation at your convenient place and time.
If YES --
Page 4/4

1 / 20
CONFIDENTIAL
Choosing between public and private modes of transport
TO: Name: Designation: Organization:
Area:
0.1) Survey Q ID: 0.2) Baseline Q ID: 0.3) Area: 0.4) Q Set: A
Set A
2 / 20
CONFIDENTIAL
Dear Sir/Madam, Thank you for participating in our baseline survey conducted in January 2012. With this follow up survey, we intend to know about the transport mode pref-erences of car users/owners commuting to work in Dhaka. Your participation in this final round of transport survey automatically enables you to take part in a lottery to win attractive prizes as follows:
1st prize: 16 GB pen drive (1 item) 2nd prize: 8 GB pen drive (1 item) 3rd prize: 4 GB pen drive (1 item) 4th prize: Attractive coffee mugs (4 items)
It will take only about 15 minutes of your time, and all information will be kept confidential. For your information, this survey is part of a research on the transport situa-tion in Dhaka. The study is supported by the International Growth Center (IGC) at London School of Economics (LSE) and the University of Oxford. Thank you for your time and valuable feedback! Best regards, Transport Preference Research Team

3 / 20
CONFIDENTIAL
Background: Dhaka is one of the 10th largest mega-cities of the world. Although less than 1% of Bangladesh’s total land area, the city supports about 10% of the coun-try’s population. Under such circumstances, the current state of the transport system in Dhaka is widely talked about. With a road network that is less than sufficient, people suffer from huge amount of traffic jams and congestion throughout the entire city on a daily basis. Consequently, the government and researchers and have been propos-ing the construction of a rapid transit system which comprise of buses and metro rails. In the existing situation, bus-based rapid transit system can offer fast and cost-effective travel. General Questions: A.1) How long does it normally take to commute to your office (in minutes)? A.2) How long does it actually take to commute to your office (in minutes)? A.3) How long does it normally take to return home from work (in minutes)? A.4) How long does it actually take to return home from work (in minutes)? A.5) Where is your residence located? A.6) Estimated distance between your residence and office (in km): For your information, your estimated BUS FARE = DISTANCE x Tk. 1.55 This will help you to answer the choice questions later.

4 / 20
CONFIDENTIAL
A.7) Which types of fuel do you use for your car? (Circle all that apply) 1. CNG 2. Petrol 3. Octane 4. Other [Please specify: …………………………………………………………….…....] A.8) How often do you use a car to commute to work? (Circle one) 1. Regularly 2. Sometimes A.9) In addition to a car, do you use any other mode of transport to commute to work? (Circle one) 1. Yes 2. No A.10) If yes, which mode of transport do you use most along with your car? (Circle one) 1. Walk 2. Rickshaw 3. CNG 4. Taxi 5. Tempo 6. Mini-bus 7. Bus 8. Office car 9. Office bus 10. Someone else's car [Please specify whose car: …………………………..] 11. Motorcycle 12. Other [Please specify: ………………………………...……………………………..] FOR ENUMERATORS: A.11) BUS—Cost per trip (fare): Tk. A.12) Car—Cost per trip : Tk.

5 / 20
CONFIDENTIAL
In the questions that follow: You will be presented with hypothetical situations where you will be asked to choose between car and bus to commute to work. When choosing between car and bus, a number of attributes/factors are in-volved. Basically, you will be presented with two alternatives with varied lev-els of improvements or deterioration of those particular factors. For example, some bus option will involve improved bus service at lower cost, improved comfort and safety features. Similarly, other car options will feature reduced travel time, increased parking fee, congestion fee. Therefore, you will be asked to consider both the alternatives and their re-spective factors, and then choose your preferred option. —- Now suppose there are two different transport options: 1. Private car 2. Bus (mass transit) Each differ with respect to individual characteristics. The characteristics of bus:
Travel time Bus fare per trip Frequency of departure Distance to bus stop — Time taken to reach the nearest bust stop from your home. Comfort and security
The characteristics of private car:
Travel time Travel cost per trip Parking fee per day Congestion fee — The daily amount of road toll to be paid for using car during peak hours (a proposed measure to reduce traffic congestions).
6 / 20
CONFIDENTIAL
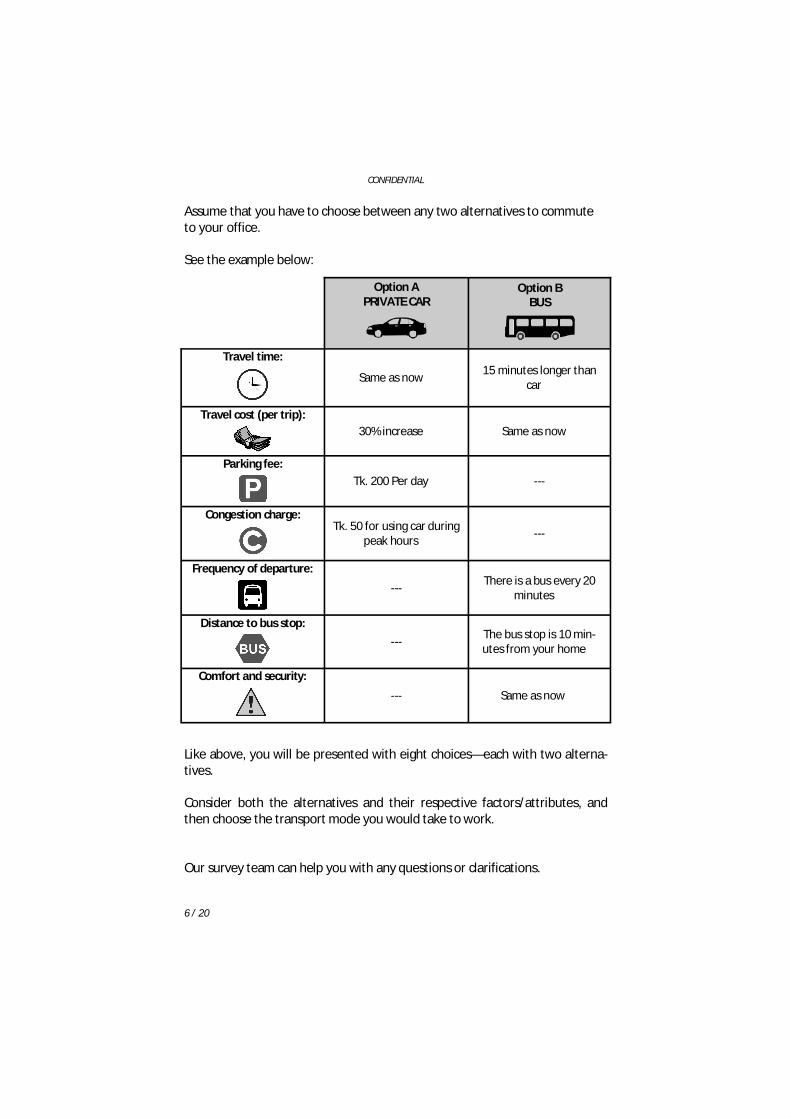
Assume that you have to choose between any two alternatives to commute to your office. See the example below:
Option A PRIVATE CAR
Option B BUS
Travel time:
Same as now 15 minutes longer than car
Travel cost (per trip):
30% increase Same as now
Parking fee:
Tk. 200 Per day ---
Congestion charge:
Tk. 50 for using car during peak hours ---
Frequency of departure:
--- There is a bus every 20 minutes
Distance to bus stop:
--- The bus stop is 10 min-utes from your home
Comfort and security:
--- Same as now
Like above, you will be presented with eight choices—each with two alterna-tives. Consider both the alternatives and their respective factors/attributes, and then choose the transport mode you would take to work. Our survey team can help you with any questions or clarifications.

7 / 20
CONFIDENTIAL
CHOICE 1
Considering the two alternatives above, which mode of transport would you use for commuting to work? (Circle one) 1. Car 2. Bus
Option A PRIVATE CAR
Option B BUS
Travel time:
Same as now 30 minutes longer than car
Travel cost (per trip):
30% increase Same as now
Parking fee:
Tk. 100 per day ---
Congestion charge:
Tk. 50 for using car during peak hours ---
Frequency of departure:
--- There is a bus every 10 minutes
Distance to bus stop:
--- The bus stop is 10 min-utes from your home
Comfort and security:
--- Same as now

8 / 20
CONFIDENTIAL
CHOICE 2
Considering the two alternatives above, which mode of transport would you use for commuting to work? (Circle one) 1. Car 2. Bus
Option A PRIVATE CAR
Option B BUS
Travel time:
Same as now 30 minutes longer than car
Travel cost (per trip):
Same as now 20% increase
Parking fee:
Tk. 100 per day ---
Congestion charge:
Tk. 50 for using car during peak hours ---
Frequency of departure:
--- There is a bus every 10 minutes
Distance to bus stop:
--- The bus stop is 5 minutes from your home
Comfort and security:
--- Much improved comfort and security features
9 / 20
CONFIDENTIAL
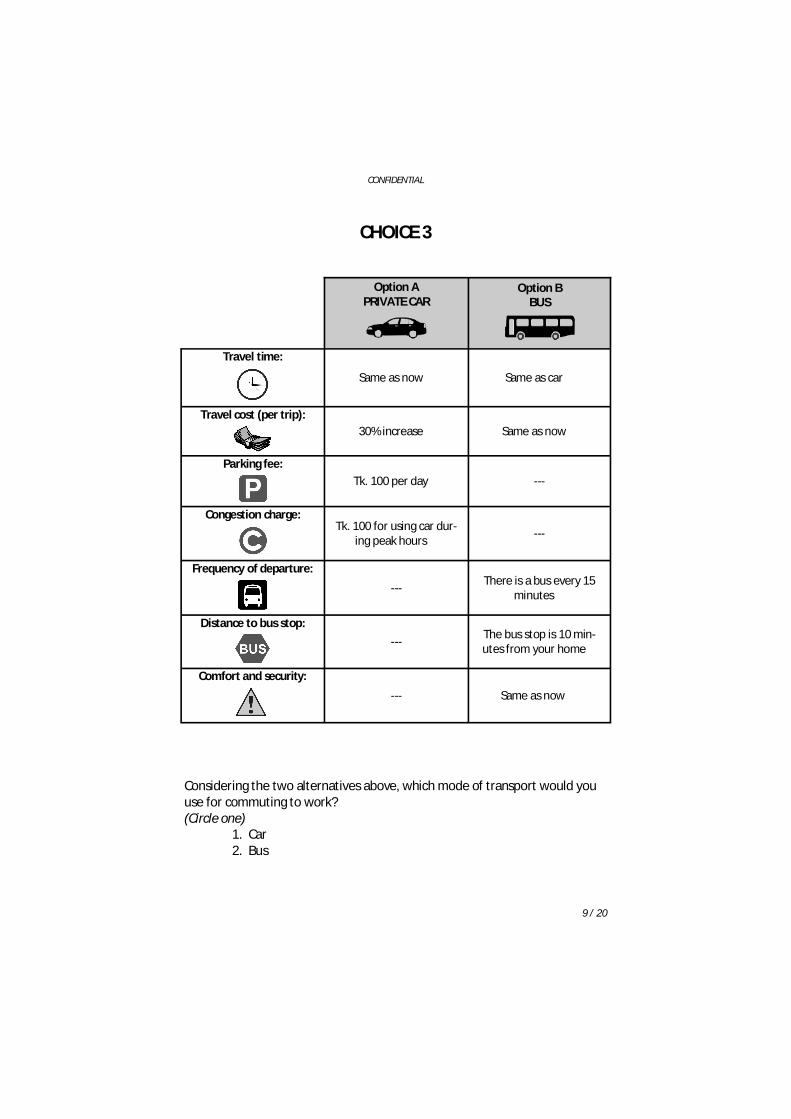
CHOICE 3
Considering the two alternatives above, which mode of transport would you use for commuting to work? (Circle one) 1. Car 2. Bus
Option A PRIVATE CAR
Option B BUS
Travel time:
Same as now Same as car
Travel cost (per trip):
30% increase Same as now
Parking fee:
Tk. 100 per day ---
Congestion charge:
Tk. 100 for using car dur-ing peak hours ---
Frequency of departure:
--- There is a bus every 15 minutes
Distance to bus stop:
--- The bus stop is 10 min-utes from your home
Comfort and security:
--- Same as now

10 / 20
CONFIDENTIAL
CHOICE 4
Considering the two alternatives above, which mode of transport would you use for commuting to work? (Circle one) 1. Car 2. Bus
Option A PRIVATE CAR
Option B BUS
Travel time:
Same as now Same as car
Travel cost (per trip):
Same as now 20% increase
Parking fee:
Tk. 200 Per day ---
Congestion charge:
Tk. 50 for using car during peak hours ---
Frequency of departure:
--- There is a bus every 10 minutes
Distance to bus stop:
--- The bus stop is 5 minutes from your home
Comfort and security:
--- Much improved comfort and security features

11 / 20
CONFIDENTIAL
CHOICE 5
Considering the two alternatives above, which mode of transport would you use for commuting to work? (Circle one) 1. Car 2. Bus
Option A PRIVATE CAR
Option B BUS
Travel time:
Same as now 15 minutes longer than car
Travel cost (per trip):
20% increase 10% increase
Parking fee:
Tk. 200 Per day ---
Congestion charge:
Tk. 50 for using car during peak hours ---
Frequency of departure:
--- There is a bus every 20 minutes
Distance to bus stop:
--- The bus stop is 5 minutes from your home
Comfort and security:
--- Same as now
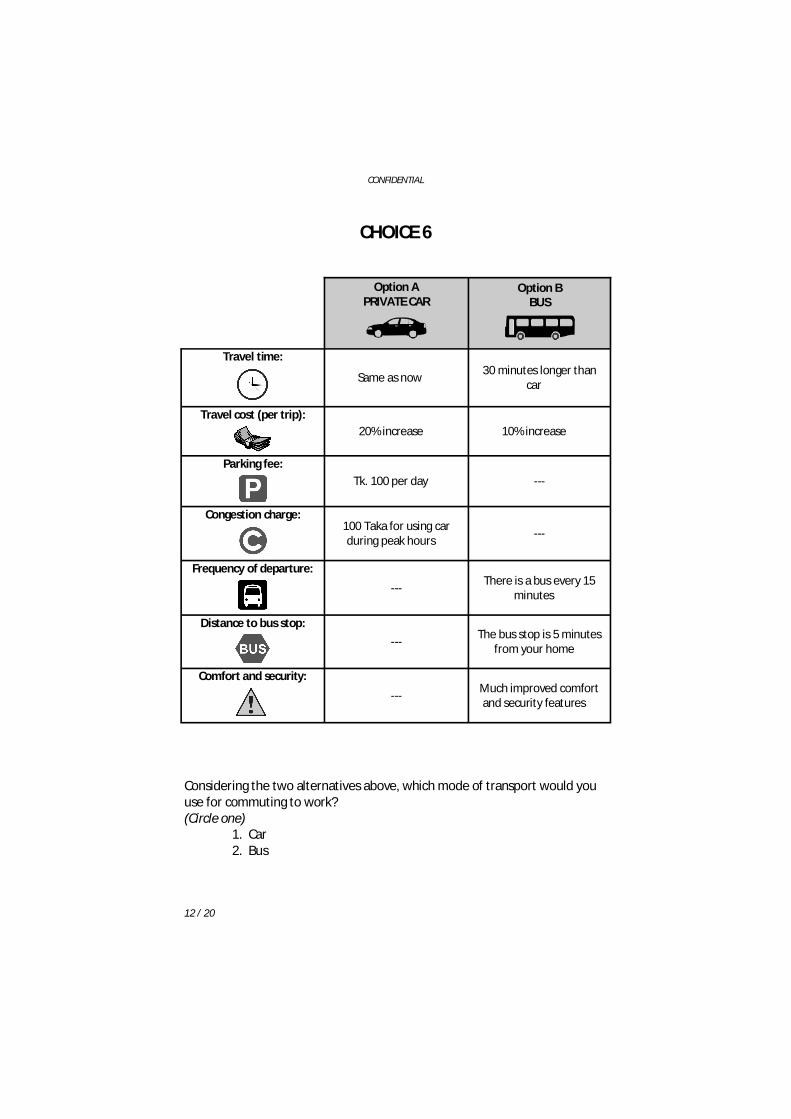
12 / 20
CONFIDENTIAL
CHOICE 6
Considering the two alternatives above, which mode of transport would you use for commuting to work? (Circle one) 1. Car 2. Bus
Option A PRIVATE CAR
Option B BUS
Travel time:
Same as now 30 minutes longer than car
Travel cost (per trip):
20% increase 10% increase
Parking fee:
Tk. 100 per day ---
Congestion charge:
100 Taka for using car during peak hours ---
Frequency of departure:
--- There is a bus every 15 minutes
Distance to bus stop:
--- The bus stop is 5 minutes from your home
Comfort and security:
--- Much improved comfort and security features

13 / 20
CONFIDENTIAL
CHOICE 7
Considering the two alternatives above, which mode of transport would you use for commuting to work? (Circle one) 1. Car 2. Bus
Option A PRIVATE CAR
Option B BUS
Travel time:
Same as now 15 minutes longer than car
Travel cost (per trip):
20% increase 10% increase
Parking fee:
Tk. 100 per day ---
Congestion charge:
100 Taka for using car during peak hours ---
Frequency of departure:
--- There is a bus every 20 minutes
Distance to bus stop:
--- The bus stop is 10 min-utes from your home
Comfort and security:
--- Much improved comfort and security features
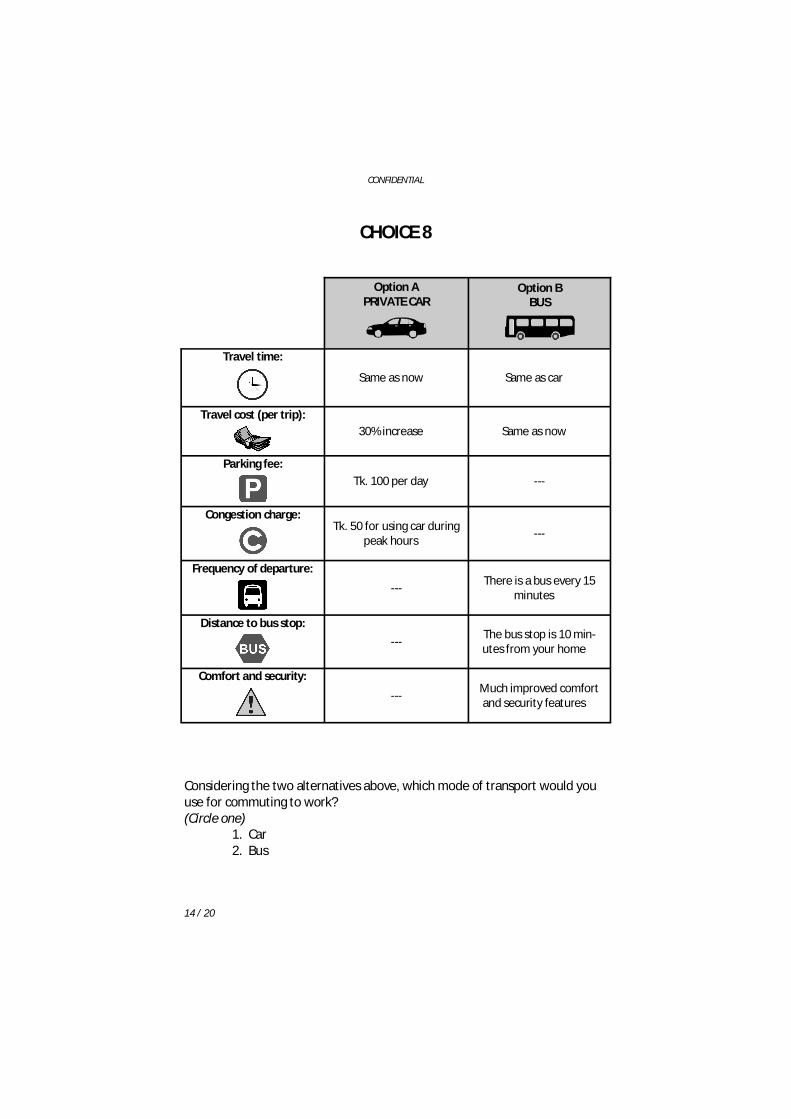
14 / 20
CONFIDENTIAL
CHOICE 8
Considering the two alternatives above, which mode of transport would you use for commuting to work? (Circle one) 1. Car 2. Bus
Option A PRIVATE CAR
Option B BUS
Travel time:
Same as now Same as car
Travel cost (per trip):
30% increase Same as now
Parking fee:
Tk. 100 per day ---
Congestion charge:
Tk. 50 for using car during peak hours ---
Frequency of departure:
--- There is a bus every 15 minutes
Distance to bus stop:
--- The bus stop is 10 min-utes from your home
Comfort and security:
--- Much improved comfort and security features

15 / 20
CONFIDENTIAL
C. Concluding questions: C.1) How difficult was it for you to understand the alternatives from the choices (choices 1 to 8)? (Circle one) 1. Easy 2. Moderately difficult 3. Very difficult to understand Regarding the choices you have just made, C.2) Which attribute is did you consider the most? (Circle one in each column) a) CAR b) BUS
1. Travel time 1. Travel time
2. Travel cost per trip 2. Bus fare per trip
3. Operating cost 3. Frequency of departure
4. Parking fee per day 4. Distance to bus stop
5. Congestion fee 5. Comfort and security
C.3) Which attribute did you consider the least? (Circle one in each column)
a) CAR b) BUS
1. Travel time 1. Travel time
2. Travel cost per trip 2. Bus fare per trip
3. Operating cost 3. Frequency of departure
4. Parking fee per day 4. Distance to bus stop
5. Congestion fee 5. Comfort and security

16 / 20
CONFIDENTIAL
C.4) Please indicate the extent to which you agree or disagree with each of the following statements: (Tick which applies for each statement)
1. Strongly
agree
2. Agree
3. Neither agree or disagree
4. Disagree
5. Strongly disagree
a) I would prefer money to be spent on other things than im-proving public transport
[ ] [ ] [ ] [ ] [ ]
b) I have no interest on im-proved transport in Dhaka
[ ] [ ] [ ] [ ] [ ]
C.5) Which category below best describes your own personal monthly in-come? (Circle one) 1. Less than 25,000 2. 25,000 to 50,000 3. 50,000 to 75,000 4. 75,000 to 100,000 5. 100,000 and above C.6) Lastly, what is your opinion of this survey? (Circle all that apply) 1. Interesting 2. Too long 3. Unrealistic 4. Informative 5. Difficult to understand 6. Other [Please specify: …………………………………………………………………..]

17 / 20
CONFIDENTIAL
Thank you for your time!
Please return your completed questionnaire to our survey team for your chance to win attractive prizes.

18 / 20
CONFIDENTIAL
BLANK

19 / 20
CONFIDENTIAL
BLANK

20 / 20
CONFIDENTIAL
ENUMERATOR’S SECTION: D.1) Team No.: D.2) Enumerator No.: D.3) Date (dd/mm/yyyy): D.4) Time (hh:mm): Please write down the answer code for choices 1 to 8. (Car = 1, Bus = 2)
DATA ENTRY OPERATOR’S SECTION: D.5) Entered by: D.6) Date (dd/mm/yyyy):
Question No. CHOICE Answer Code
B.1 Choice 1
B.2 Choice 2
B.3 Choice 3
B.4 Choice 4
B.5 Choice 5
B.6 Choice 6
B.7 Choice 7
B.8 Choice 8
Designed by soapbox.
The International Growth Centre (IGC) aims to promote sustainable growth in developing countries by providing demand-led policy advice based on frontier research.
Find out more about our work on our website www.theigc.org
For media or communications enquiries, please contact [email protected]
Subscribe to our newsletter and topic updates www.theigc.org/newsletter
Follow us on Twitter @the_igc
Contact us International Growth Centre, London School of Economic and Political Science, Houghton Street, London WC2A 2AE