ifrs 4 phase ii: illustrative example of life contract...
TRANSCRIPT

IFRS 4 Phase II: illustrative example of life contract without participation features
June 2015

On 25 June 2013, the International Accounting Standard Board (the IASB or the Board) published a revised exposure draft on the accounting for insurance contracts (2013ED). The Board offered a 120-day comment period, asking for industry feedback on the following targeted areas
1. Adjusting the contractual service margin
2. Measurement and presentation exception for certain types of contracts with participation features
3. Presentation of revenues and claims in the statement of comprehensive income
4. Presentation of interest expenses in profit or loss, and recognizing the effects of changes in discount rates in other comprehensive income (OCI)
5. Approach to transition
After receiving the feedback, the Board discussed the comment letters in January 2014 and has been re-deliberating several key issues since March 2014. At the end of 2014, the Board completed most of its discussions on the model for insurance contracts without participation features. Several educational sessions were held to discuss the adaptions of the general proposals in the 2013ED for contracts with participation features, but no decisions have yet been made. The Board is continuing the discussion in 2015, and expects to issue the final standard in 2016.
These developments suggest that the IASB is close to concluding the long and thorough process to compile its proposal for the accounting for insurance contracts, and it is time of insurance companies to start evaluating the financial and operational impacts of the new standards on their businesses. We have seen companies begin to investigate the impact of non-participating contracts on their businesses.
In order to put this standard into practice, we provide an example here to illustrate the following aspects, based on a cohort of business for a non-participating product priced with a high interest rate:
1. Initial measurement
2. Transition
3. Profit signature
4. Presentation of statement of comprehensive income
Please note, the example provided is for illustration purposes only. Certain working assumptions are therefore simplified. Tentative decisions made by the Board up to the end of March 2015 are considered in the analysis.
The journeyso far ...
Product features and policy information
The product we illustrate is a non-participating whole life protection-type contract, with a premium-paying period of 12 years. The sum assured increases for the first 12 years, and then remains level afterwards. It provides death and total permanent disability benefits and pays a guaranteed cash value upon surrender. This product was assumed to be launched in the late 1990s. The pricing interest rate was 8%. We focus on the 1998 cohort for the purpose of this illustration.
Building block approach
Best estimate liability (BEL) is defined as the present value of cash outflows minus the present value of cash inflows, taking into account all related expected future cash flows. In this illustrative example, all cash flows are discounted at the government bond yield extrapolated from the last liquid data point (10-year) to an ultimate forward rate of 4.2%. The liquidity premium is set to zero for simplicity. At initial measurement, where the 10-year government bond yield is higher than the ultimate forward rate, the yield level is assumed to remain flat beyond the last liquid data point.
The risk adjustment (RA) is calculated using the cost-of-capital approach. The projected risk capital is determined with a 99.5% confidence level and a capital charge of 6%. The life underwriting risk parameters of the Solvency II standard-formula approach are adopted in this illustration.
The contractual service margin (CSM) is amortized over the remaining coverage period taking into account the expected number of policies in-force. The remaining coverage period reflects the remaining expected life of the policyholders in the cohort. This is in line with the tentative decision made by the Board in May 2014.
t=0
RAT
BELT
RA0
BEL0
CSM0Unlocking of CSM at t=T
t=Tbest estimate non-economic assumption and locked-in discount rate
BEL’T
Impact of discount rate change OCI
t=Tbest estimate non-economic assumption and current discount rate
Release in CSM from t=0 to t=T
CSMT
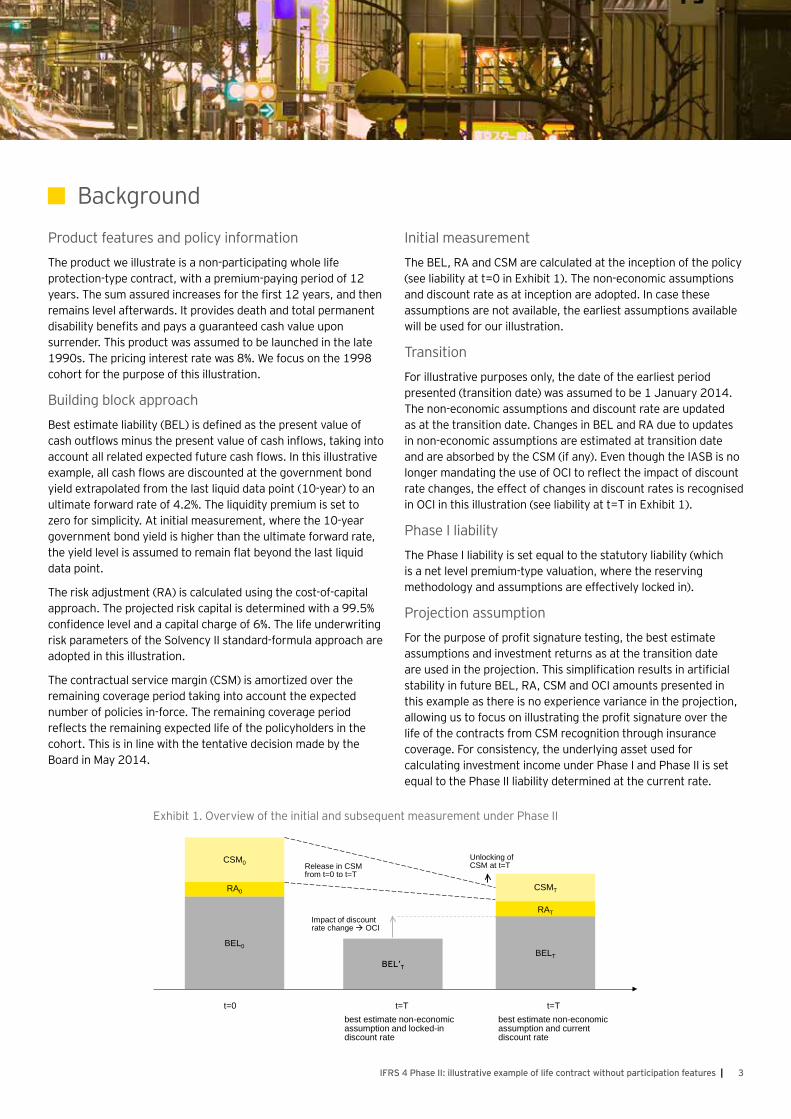
Exhibit 1. Overview of the initial and subsequent measurement under Phase II
BackgroundInitial measurement
The BEL, RA and CSM are calculated at the inception of the policy (see liability at t=0 in Exhibit 1). The non-economic assumptions and discount rate as at inception are adopted. In case these assumptions are not available, the earliest assumptions available will be used for our illustration.
Transition
For illustrative purposes only, the date of the earliest period presented (transition date) was assumed to be 1 January 2014. The non-economic assumptions and discount rate are updated as at the transition date. Changes in BEL and RA due to updates in non-economic assumptions are estimated at transition date and are absorbed by the CSM (if any). Even though the IASB is no longer mandating the use of OCI to reflect the impact of discount rate changes, the effect of changes in discount rates is recognised in OCI in this illustration (see liability at t=T in Exhibit 1).
Phase I liability
The Phase I liability is set equal to the statutory liability (which is a net level premium-type valuation, where the reserving methodology and assumptions are effectively locked in).
Projection assumption
For the purpose of profit signature testing, the best estimate assumptions and investment returns as at the transition date are used in the projection. This simplification results in artificial stability in future BEL, RA, CSM and OCI amounts presented in this example as there is no experience variance in the projection, allowing us to focus on illustrating the profit signature over the life of the contracts from CSM recognition through insurance coverage. For consistency, the underlying asset used for calculating investment income under Phase I and Phase II is set equal to the Phase II liability determined at the current rate.
3IFRS 4 Phase II: illustrative example of life contract without participation features |
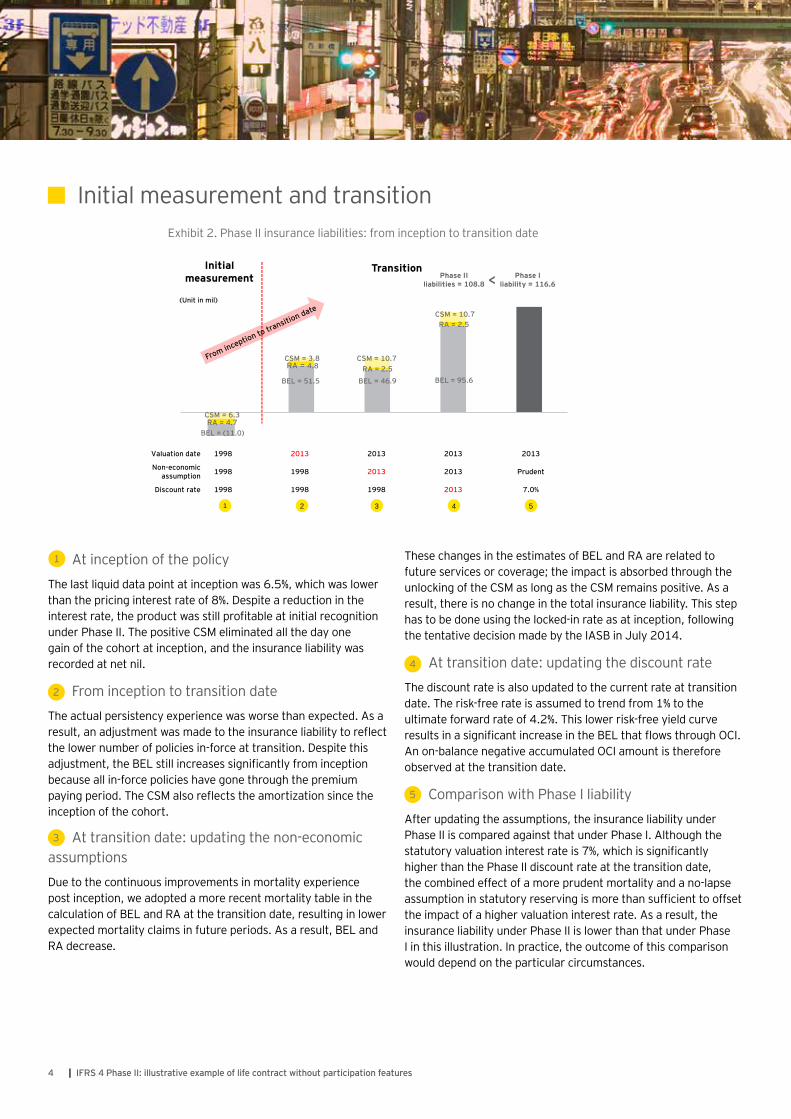
Exhibit 2. Phase II insurance liabilities: from inception to transition date
Initial measurement and transition
At inception of the policy
The last liquid data point at inception was 6.5%, which was lower than the pricing interest rate of 8%. Despite a reduction in the interest rate, the product was still profitable at initial recognition under Phase II. The positive CSM eliminated all the day one gain of the cohort at inception, and the insurance liability was recorded at net nil.
From inception to transition date
The actual persistency experience was worse than expected. As a result, an adjustment was made to the insurance liability to reflect the lower number of policies in-force at transition. Despite this adjustment, the BEL still increases significantly from inception because all in-force policies have gone through the premium paying period. The CSM also reflects the amortization since the inception of the cohort.
At transition date: updating the non-economic assumptions
Due to the continuous improvements in mortality experience post inception, we adopted a more recent mortality table in the calculation of BEL and RA at the transition date, resulting in lower expected mortality claims in future periods. As a result, BEL and RA decrease.
1
2
3
4
5
These changes in the estimates of BEL and RA are related to future services or coverage; the impact is absorbed through the unlocking of the CSM as long as the CSM remains positive. As a result, there is no change in the total insurance liability. This step has to be done using the locked-in rate as at inception, following the tentative decision made by the IASB in July 2014.
At transition date: updating the discount rate
The discount rate is also updated to the current rate at transition date. The risk-free rate is assumed to trend from 1% to the ultimate forward rate of 4.2%. This lower risk-free yield curve results in a significant increase in the BEL that flows through OCI. An on-balance negative accumulated OCI amount is therefore observed at the transition date.
Comparison with Phase I liability
After updating the assumptions, the insurance liability under Phase II is compared against that under Phase I. Although the statutory valuation interest rate is 7%, which is significantly higher than the Phase II discount rate at the transition date, the combined effect of a more prudent mortality and a no-lapse assumption in statutory reserving is more than sufficient to offset the impact of a higher valuation interest rate. As a result, the insurance liability under Phase II is lower than that under Phase I in this illustration. In practice, the outcome of this comparison would depend on the particular circumstances.
Page 1
Valuation date 1998 2013 2013 2013 2013
Non-economic assumption 1998 1998 2013 2013 Prudent
Discount rate 1998 1998 1998 2013 7.0%
BEL = (11.0)
BEL = 51.5 BEL = 46.9 BEL = 95.6
CSM = 6.3
CSM = 3.8 RA = 2.5
RA = 2.5
Initial measurement
Transition Phase I
liability = 116.6
RA = 4.7
RA = 4.8 CSM = 10.7
CSM = 10.7
(Unit in mil)
Phase II liabilities = 108.8 <
1 2 3 4 5
4 | IFRS 4 Phase II: illustrative example of life contract without participation features

Profit signatureExhibit 3. Profit signature: Phase I vs. Phase II
In Exhibit 3, the profit recognition is accelerated under Phase II because the CSM is released over the remaining coverage period, taking into account the expected number of policies in-force, which essentially recognizes profit in earlier years. On the contrary, the prudence embedded in the statutory liability is only released in the later part of the policy due to the absence of lapse assumptions in statutory reserving and the fact that the majority of the expected mortality claims happen near the end of the policy term. This is also in line with the observation that for this product, the insurance liability under Phase II is consistently lower than that under Phase I throughout the projection (see Exhibit 4).
Looking at the composition of the total comprehensive income under Phase II in Exhibit 3, the majority of profit or loss is sourced from underwriting result. Negative investment earnings are observed due to the negative interest spread on this product (locked-in rate vs recent investment return assumption). The negative accumulated OCI balance due to Phase II liability unwinds through OCI over time to zero upon the maturity of the cohort (see Exhibit 5).
Key observations
0.0
20.0
40.0
60.0
80.0
100.0
120.0
140.0
2013 2023 2033 2043 2053Calendar year
Insurance liabilities
Contractual Service MarginRisk AdjustmentPV Fulfillment CFsStatutory Reserve
(Unit in mil)
IFRS 4 Phase I liabilityBELRACSM
-55.0
-45.0
-35.0
-25.0
-15.0
-5.0
5.0
1988 1998 2008 2018 2028 2038 2048
Calendar year
Accumulated OCI balanceTransition date
(Unit in mil)
Exhibit 4. Insurance liabilities: Phase I vs. Phase II
Exhibit 5. Accumulated OCI balance due to Phase II liability
-0.5
0.0
0.5
1.0
1.5
2.0
2.5
3.0
3.5
4.0
2014 2024 2034 2044 2054
Calendar year
Total comprehensive income
IFRS 4 Phase II other comprehensive incomeIFRS 4 Phase II investment resultIFRS 4 Phase II operating resultIFRS 4 Phase II total comprehensive incomeIFRS 4 Phase II profit & lossIFRS 4 Phase I profit & loss
(Unit in mil)
IFRS 4 Phase II underwriting result
5IFRS 4 Phase II: illustrative example of life contract without participation features |
Presentation of the statement of comprehensive income
Definition of insurance contract revenue
The IASB tentatively confirmed the use of insurance contract revenue and prohibited the presentation of premium information in the statement of comprehensive income during the April 2014 meeting.
Insurance contract revenue is defined as the sum of release in CSM, release of RA relating to past coverage, expected claims and expenses, and the part of the premium allocated to the recovery of directly attributable acquisition costs. As required by the new standard, non-distinct investment components are excluded from the definition of insurance contract revenue and claims & expenses incurred.
Please note, an investment component is the amount that an insurer needs to repay to the policyholder even if the insured event does not occur.
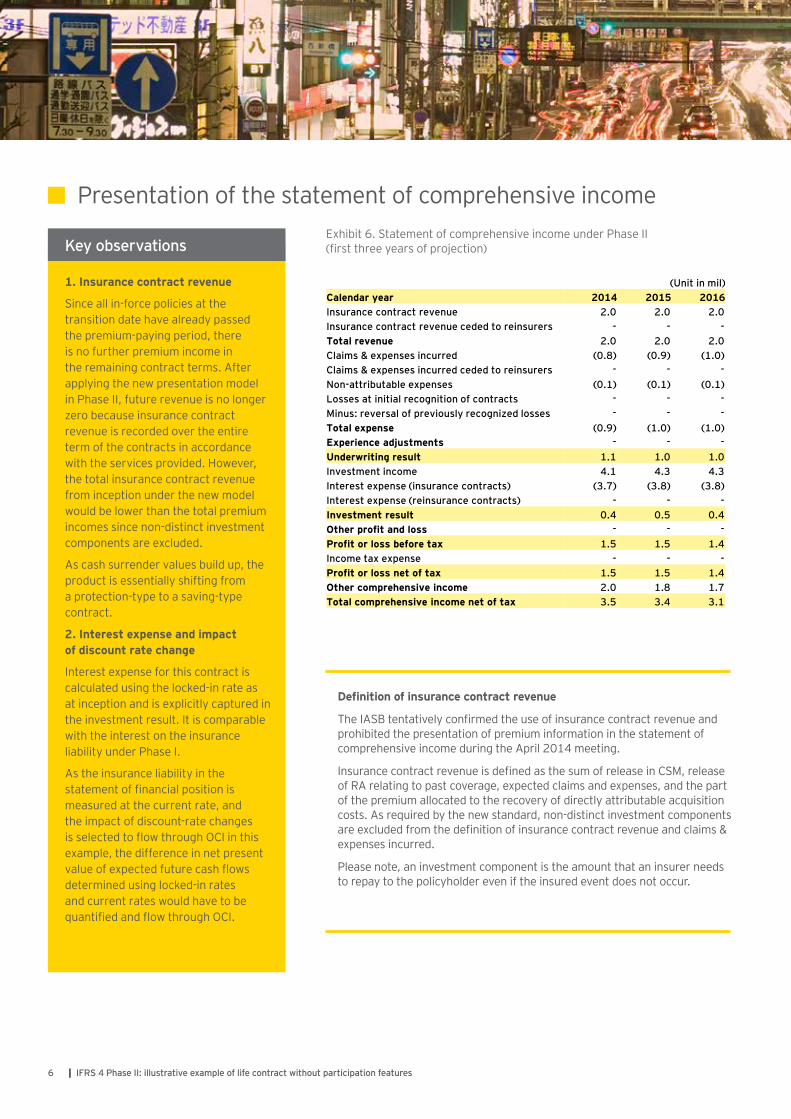
Exhibit 6. Statement of comprehensive income under Phase II (first three years of projection)
1. Insurance contract revenue
Since all in-force policies at the transition date have already passed the premium-paying period, there is no further premium income in the remaining contract terms. After applying the new presentation model in Phase II, future revenue is no longer zero because insurance contract revenue is recorded over the entire term of the contracts in accordance with the services provided. However, the total insurance contract revenue from inception under the new model would be lower than the total premium incomes since non-distinct investment components are excluded.
As cash surrender values build up, the product is essentially shifting from a protection-type to a saving-type contract.
2. Interest expense and impact of discount rate change
Interest expense for this contract is calculated using the locked-in rate as at inception and is explicitly captured in the investment result. It is comparable with the interest on the insurance liability under Phase I.
As the insurance liability in the statement of financial position is measured at the current rate, and the impact of discount-rate changes is selected to flow through OCI in this example, the difference in net present value of expected future cash flows determined using locked-in rates and current rates would have to be quantified and flow through OCI.
Key observations
(Unit in mil)Calendar year 2014 2015 2016Insurance contract revenue 2.0 2.0 2.0 Insurance contract revenue ceded to reinsurers - - -Total revenue 2.0 2.0 2.0 Claims & expenses incurred (0.8) (0.9) (1.0) Claims & expenses incurred ceded to reinsurers - - -Non-attributable expenses (0.1) (0.1) (0.1) Losses at initial recognition of contracts - - -Minus: reversal of previously recognized losses - - -Total expense (0.9) (1.0) (1.0) Experience adjustments - - -Underwriting result 1.1 1.0 1.0 Investment income 4.1 4.3 4.3 Interest expense (insurance contracts) (3.7) (3.8) (3.8) Interest expense (reinsurance contracts) - - -Investment result 0.4 0.5 0.4 Other profit and loss - - -Profit or loss before tax 1.5 1.5 1.4 Income tax expense - - -Profit or loss net of tax 1.5 1.5 1.4Other comprehensive income 2.0 1.8 1.7 Total comprehensive income net of tax 3.5 3.4 3.1
6 | IFRS 4 Phase II: illustrative example of life contract without participation features
Time for financial impact assessment
This illustrative example only highlights some of the potential impacts of Phase II to the balance sheet and income statement. Given the variations in the current Phase I practices in the industry and business portfolio, the financial impact of Phase II adoption is expected to differ significantly across the market and would depend on the particular circumstances of each insurer. Insurance companies need to start to evaluate the financial and operational impacts of Phase II adoption now. An impact assessment
1. Even though the product was priced in a high interest rate environment (therefore assuming a higher investment yield than is currently achieved), a positive CSM was obtained at inception because the interest rate used to discount the liability at the inception of the cohort was comparable to the pricing interest rate used. The interest rate used to discount the liability at transition was significantly lower, however the impact of this was reflected in a negative OCI balance rather than through a reduction to the CSM.
2. If the impact of the discount rate change is selected to flow through OCI, an on-balance negative accumulated OCI amount at transition date would be observed (assuming total OCI on the insurance liability exceeds total OCI on the assets) due to the significant fall in interest rates since inception.
3. The insurance liability under Phase II is lower than that under Phase I in this example, due to the prudent statutory valuation assumptions. This implies that, in addition to the comparison of discount rates, the reserving methodology and non-economic assumptions also affect the relative size of the insurance liability under Phase I and Phase II.
4. The recognition of profit is accelerated because the CSM is released over the remaining coverage period taking into account the expected number of policies in force. This essentially brings more profits earlier to reflect the coverage pattern for the cohort. This is in contrast to the traditional statutory valuation where the prudence is normally released near the end of the contract term.
5. The majority of the income statement is sourced from underwriting results. Negative investment results are observed due to the lower expected investment return compared with the locked-in rate.
6. The total volume of revenue recognized from the inception of the cohort is reduced when compared with current measurement due to the disaggregation of non-distinct investment components.
Key takeaways
should be performed to get an early view of the transition impact of Phase II as well as the profit signature on major product lines. This will allow insurers to explore the optionality allowed for under Phase II (for instance, use of OCI to absorb the effect of discount-rate change) and also to ensure adequate preparation time to meet the IASB’s requirements.
Companies should take this opportunity to identify ways to optimize future Phase II implementation, such as the possible overlaps with Solvency II / economic capital, as well as embedded value reporting. This would help minimize
operational complexity and avoid the need to take different approaches to financial reporting and allow for optimal reporting efficiencies by following the same approach.
Financial impact analysis also provides valuable insights into the major operational challenges, for instance, the availability of data and model capability, and the system / tool for calculating CSM and so forth. This allows companies to calculate timely estimates of the implementation costs and efforts required to effectively implement the Phase II requirements.
7IFRS 4 Phase II: illustrative example of life contract without participation features |

As the market leader in financial reporting and transformation, we have advised life insurers across Asia-Pacific on Phase II- related work. This includes conducting impact assessments, educational sessions and workshops, gap analysis and implementation planning. All such projects allow our clients to better understand the upcoming Phase II standard and its financial and operational implications for their business.
We have strong connections with our global IFRS contacts who work closely with the IASB. This enables us to bring the latest developments on Phase II standards and relevant industry insights from around the globe to our clients.
If you would like to know more about the implications of Phase II for your business and how we can help you to prepare for Phase II implementation, please contact us.
Global
Kevin Griffith+44 20 7951 [email protected]
Jasper Kolsters+31 88 40 [email protected]
Europe, Middle East, India and Africa
Hans van der Veen +31 88 40 70800 [email protected]
Pierre Planchon+33 1 46 93 62 54 [email protected]
Nick Walker+44 20 7951 0335 [email protected]
Stefan Schmid+41 58 286 3416 [email protected]
Brian Edey+41 58 286 4224 [email protected]
Martin Gehringer+49 6196 996 12427 [email protected]
Ralf Widmann +49 7119 881 15142 [email protected]
Matteo Brusatori+39 02722 12348 [email protected]
Cornea De Villiers+27 21 443 0364 [email protected]
Americas
Dana D’Amelio +1 212 773 [email protected]
John Santosuosso+1 617 585 1867 [email protected]
Doru Pantea+1 416 943 3997 [email protected]
Eduardo Wellichen+55 11 2573 3293 [email protected]
Mario Bittar +54 11 4510 2377 [email protected]
Asia Pacific
Mike Wong +852 2849 9186 [email protected]
Patrick Menard+65 6309 [email protected]
Tze Ping Chng +852 2849 9200 [email protected]
Kieren Cummings +61 2 9248 4215 [email protected]
Jeff Malatskey +852 2849 [email protected]
Peter Telders +852 9666 2014 [email protected]
Japan
Norio Hashiba+81 33 503 [email protected]
For more information, please contact:
About us
EY | Assurance | Tax | Transactions | AdvisoryAbout EY
EY is a global leader in assurance, tax, transaction and advisory services. The insights and quality services we deliver help build trust and confidence in the capital markets and in economies the world over. We develop outstanding leaders who team to deliver on our promises to all of our stakeholders. In so doing, we play a critical role in building a better working world for our people, for our clients and for our communities.
EY refers to the global organization, and may refer to one or more, of the member firms of Ernst & Young Global Limited, each of which is a separate legal entity. Ernst & Young Global Limited, a UK company limited by guarantee, does not provide services to clients. For more information about our organization, please visit ey.com.
© 2015 EYGM Limited. All Rights Reserved.
EYG no. EG0257 1504-1447408
ED None
This material has been prepared for general informational purposes only and is not intended to be relied upon as accounting, tax, or other professional advice. Please refer to your advisors for specific advice.
ey.com