ifo institute for economic research ict, skills and german industry productivity – the...
TRANSCRIPT

Ifo Institute for Economic Research
ICT, SKILLS AND GERMAN INDUSTRY PRODUCTIVITY– The Interdependency of High-Skilled Labor and ICT Investments
Thomas Strobel
The 2008 World Congress on National Accounts and Economic Performance Measures for Nations, Washington D.C., 05-15-2008
Ifo Institute for Economic Research
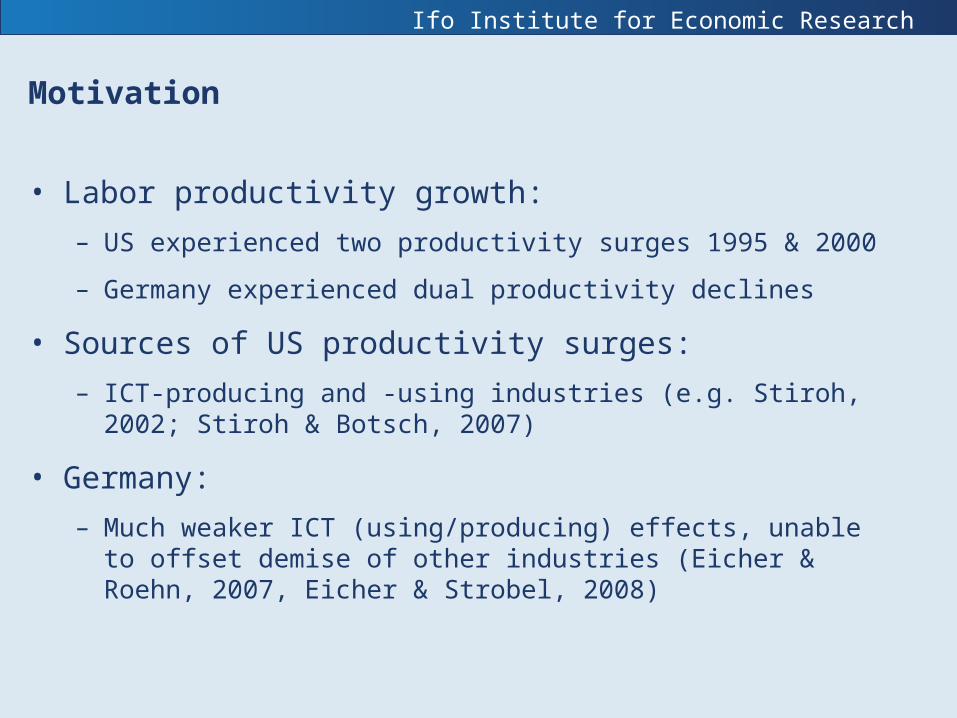
Motivation
• Labor productivity growth:
– US experienced two productivity surges 1995 & 2000
– Germany experienced dual productivity declines
• Sources of US productivity surges:
– ICT-producing and -using industries (e.g. Stiroh, 2002; Stiroh & Botsch, 2007)
• Germany:
– Much weaker ICT (using/producing) effects, unable to offset demise of other industries (Eicher & Roehn, 2007, Eicher & Strobel, 2008)
Ifo Institute for Economic Research
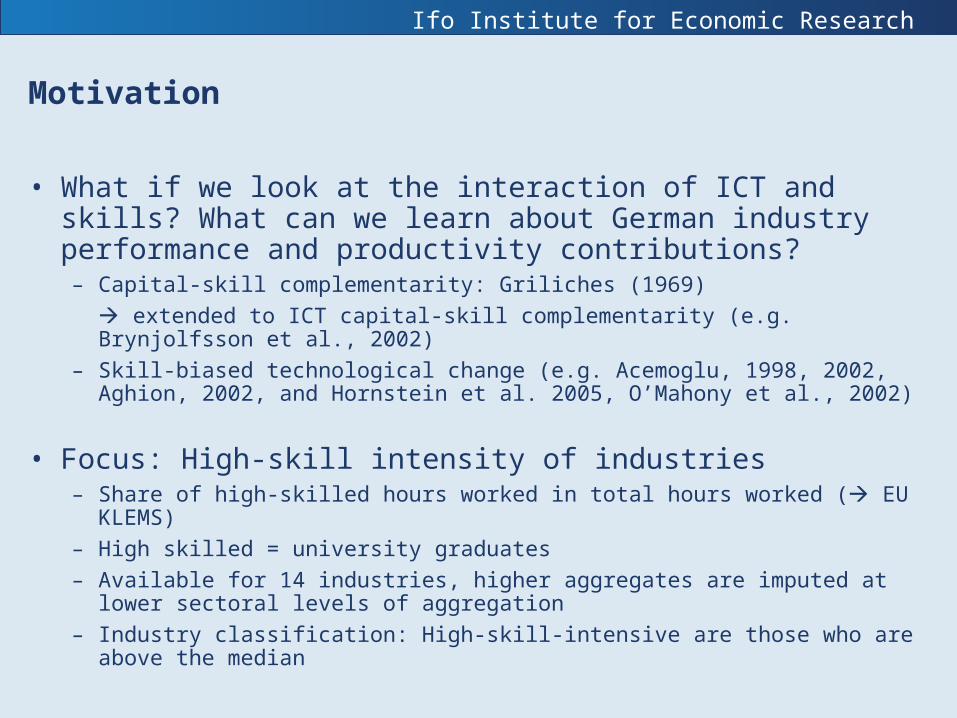
Motivation
• What if we look at the interaction of ICT and skills? What can we learn about German industry performance and productivity contributions? – Capital-skill complementarity: Griliches (1969)
extended to ICT capital-skill complementarity (e.g. Brynjolfsson et al., 2002)
– Skill-biased technological change (e.g. Acemoglu, 1998, 2002, Aghion, 2002, and Hornstein et al. 2005, O’Mahony et al., 2002)
• Focus: High-skill intensity of industries– Share of high-skilled hours worked in total hours worked ( EU KLEMS)
– High skilled = university graduates
– Available for 14 industries, higher aggregates are imputed at lower sectoral levels of aggregation
– Industry classification: High-skill-intensive are those who are above the median
Ifo Institute for Economic Research
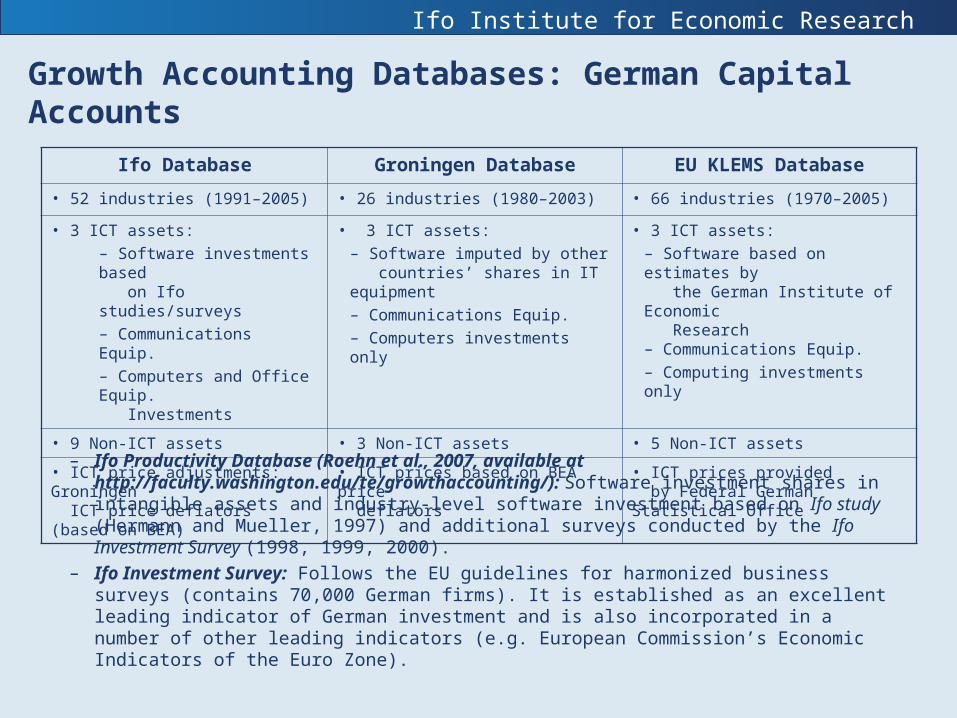
Growth Accounting Databases: German Capital Accounts
Ifo Database Groningen Database EU KLEMS Database
• 52 industries (1991–2005) • 26 industries (1980–2003) • 66 industries (1970–2005)
• 3 ICT assets:– Software investments based on Ifo studies/surveys – Communications Equip.– Computers and Office Equip.
Investments
• 3 ICT assets:– Software imputed by other countries’ shares in IT equipment– Communications Equip. – Computers investments only
• 3 ICT assets:– Software based on estimates by the German Institute of Economic Research– Communications Equip. – Computing investments only
• 9 Non-ICT assets • 3 Non-ICT assets • 5 Non-ICT assets
• ICT price adjustments: Groningen ICT price deflators (based on BEA)
• ICT prices based on BEA price deflators
• ICT prices provided by Federal German Statistical Office
– Ifo Productivity Database (Roehn et al., 2007, available at http://faculty.washington.edu/te/growthaccounting/): Software investment shares in intangible assets and industry-level software investment based on Ifo study (Hermann and Mueller, 1997) and additional surveys conducted by the Ifo Investment Survey (1998, 1999, 2000).
– Ifo Investment Survey: Follows the EU guidelines for harmonized business surveys (contains 70,000 German firms). It is established as an excellent leading indicator of German investment and is also incorporated in a number of other leading indicators (e.g. European Commission’s Economic Indicators of the Euro Zone).
Ifo Institute for Economic Research
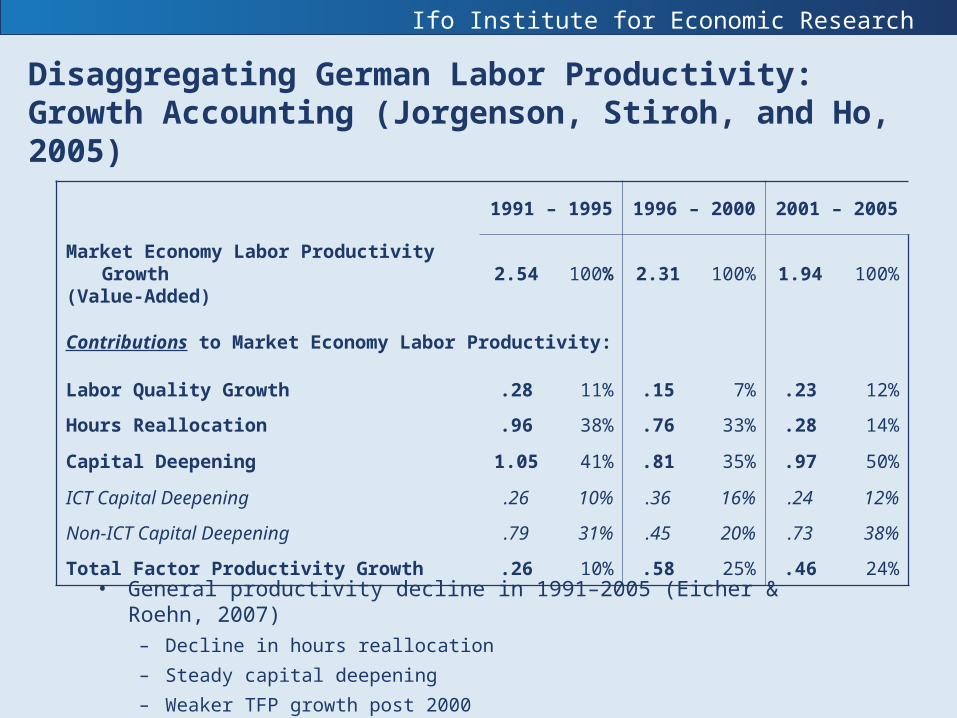
• General productivity decline in 1991–2005 (Eicher & Roehn, 2007)– Decline in hours reallocation
– Steady capital deepening
– Weaker TFP growth post 2000
1991 – 1995 1996 – 2000 2001 – 2005
Market Economy Labor Productivity Growth(Value-Added)
2.54 100% 2.31 100% 1.94 100%
Contributions to Market Economy Labor Productivity:
Labor Quality Growth .28 11% .15 7% .23 12%
Hours Reallocation .96 38% .76 33% .28 14%
Capital Deepening 1.05 41% .81 35% .97 50%
ICT Capital Deepening .26 10% .36 16% .24 12%
Non-ICT Capital Deepening .79 31% .45 20% .73 38%
Total Factor Productivity Growth .26 10% .58 25% .46 24%
Disaggregating German Labor Productivity: Growth Accounting (Jorgenson, Stiroh, and Ho, 2005)
Ifo Institute for Economic Research
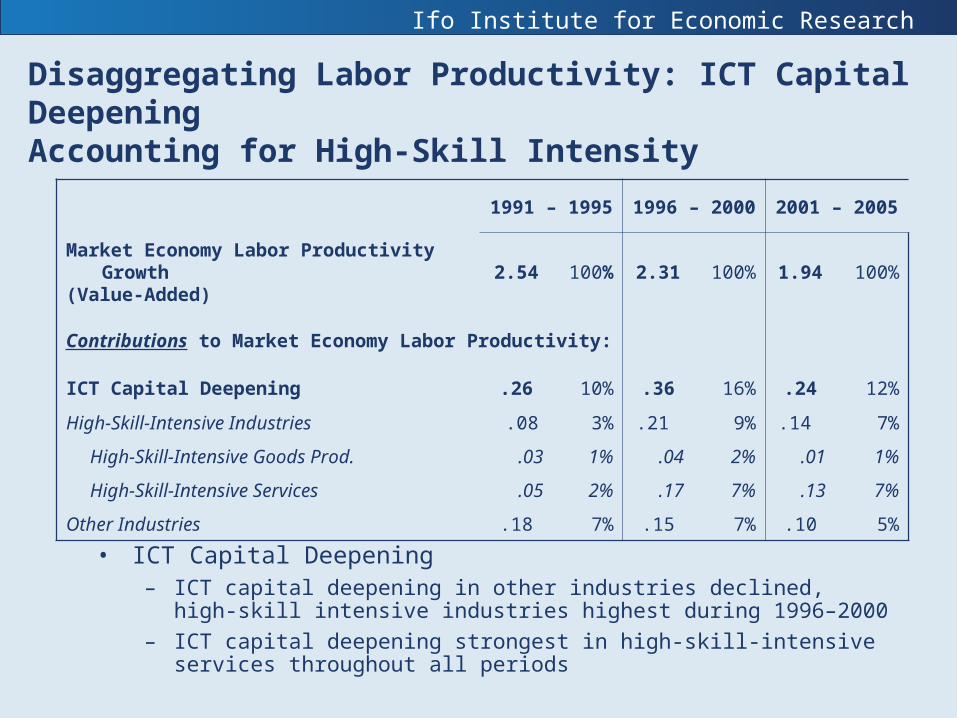
Disaggregating Labor Productivity: ICT Capital DeepeningAccounting for High-Skill Intensity
1991 – 1995 1996 – 2000 2001 – 2005
Market Economy Labor Productivity Growth(Value-Added)
2.54 100% 2.31 100% 1.94 100%
Contributions to Market Economy Labor Productivity:
ICT Capital Deepening .26 10% .36 16% .24 12%
High-Skill-Intensive Industries .08 3% .21 9% .14 7%
High-Skill-Intensive Goods Prod. .03 1% .04 2% .01 1%
High-Skill-Intensive Services .05 2% .17 7% .13 7%
Other Industries .18 7% .15 7% .10 5%
• ICT Capital Deepening– ICT capital deepening in other industries declined, high-skill intensive
industries highest during 1996–2000
– ICT capital deepening strongest in high-skill-intensive services throughout all periods
Ifo Institute for Economic Research
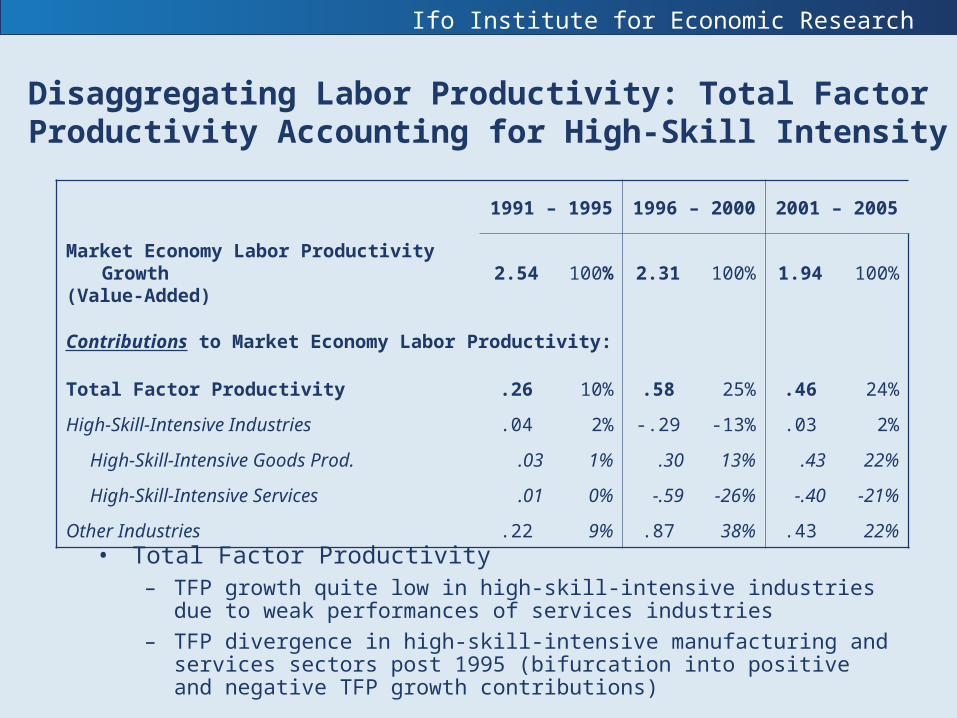
Disaggregating Labor Productivity: Total Factor Productivity Accounting for High-Skill Intensity
1991 – 1995 1996 – 2000 2001 – 2005
Market Economy Labor Productivity Growth(Value-Added)
2.54 100% 2.31 100% 1.94 100%
Contributions to Market Economy Labor Productivity:
Total Factor Productivity .26 10% .58 25% .46 24%
High-Skill-Intensive Industries .04 2% -.29 -13% .03 2%
High-Skill-Intensive Goods Prod. .03 1% .30 13% .43 22%
High-Skill-Intensive Services .01 0% -.59 -26% -.40 -21%
Other Industries .22 9% .87 38% .43 22%
• Total Factor Productivity– TFP growth quite low in high-skill-intensive industries due to weak
performances of services industries
– TFP divergence in high-skill-intensive manufacturing and services sectors post 1995 (bifurcation into positive and negative TFP growth contributions)
Ifo Institute for Economic Research
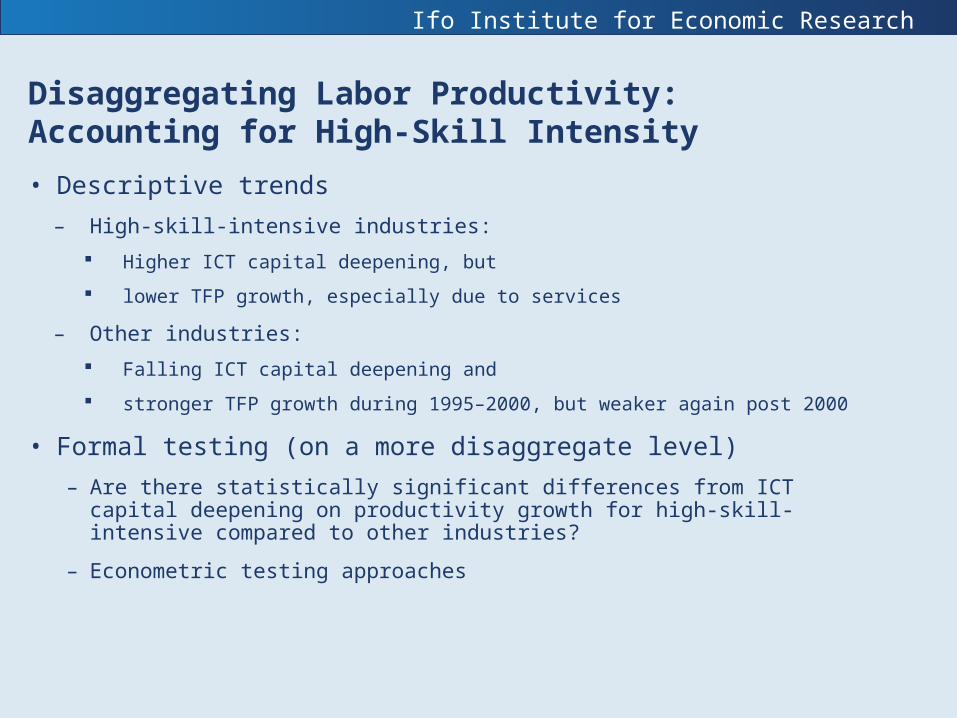
Disaggregating Labor Productivity:Accounting for High-Skill Intensity
• Descriptive trends
– High-skill-intensive industries:
Higher ICT capital deepening, but
lower TFP growth, especially due to services
– Other industries:
Falling ICT capital deepening and
stronger TFP growth during 1995–2000, but weaker again post 2000
• Formal testing (on a more disaggregate level)
– Are there statistically significant differences from ICT capital deepening on productivity growth for high-skill-intensive compared to other industries?
– Econometric testing approaches
Ifo Institute for Economic Research
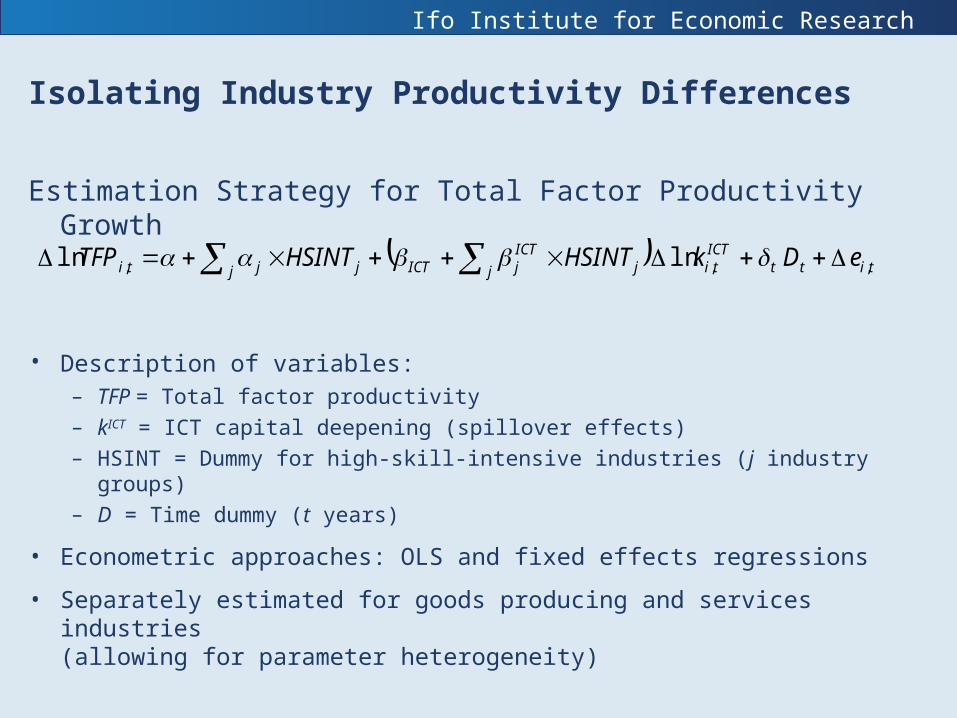
Isolating Industry Productivity Differences
Estimation Strategy for Total Factor Productivity Growth
• Description of variables: – TFP = Total factor productivity– kICT = ICT capital deepening (spillover effects)
– HSINT = Dummy for high-skill-intensive industries (j industry groups)– D = Time dummy (t years)
• Econometric approaches: OLS and fixed effects regressions
• Separately estimated for goods producing and services industries (allowing for parameter heterogeneity)
tittICTtij j
ICTjICTj jjti eDkHSINTHSINTTFP ,,, lnln
Ifo Institute for Economic Research
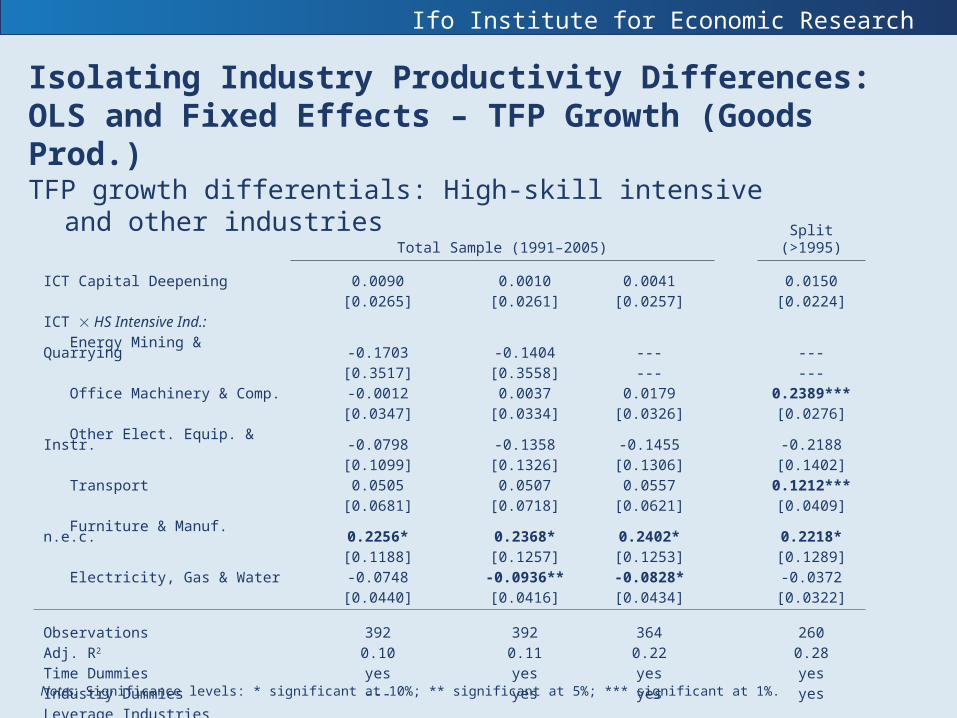
Isolating Industry Productivity Differences:OLS and Fixed Effects – TFP Growth (Goods Prod.)
TFP growth differentials: High-skill intensive and other industriesTotal Sample (1991–2005) Split (>1995)
ICT Capital Deepening 0.0090 0.0010 0.0041 0.0150
[0.0265] [0.0261] [0.0257] [0.0224]
ICT HS Intensive Ind.:
Energy Mining & Quarrying -0.1703 -0.1404 --- ---
[0.3517] [0.3558] --- ---
Office Machinery & Comp. -0.0012 0.0037 0.0179 0.2389***
[0.0347] [0.0334] [0.0326] [0.0276]
Other Elect. Equip. & Instr. -0.0798 -0.1358 -0.1455 -0.2188
[0.1099] [0.1326] [0.1306] [0.1402]
Transport 0.0505 0.0507 0.0557 0.1212***
[0.0681] [0.0718] [0.0621] [0.0409]
Furniture & Manuf. n.e.c. 0.2256* 0.2368* 0.2402* 0.2218*
[0.1188] [0.1257] [0.1253] [0.1289]
Electricity, Gas & Water -0.0748 -0.0936** -0.0828* -0.0372
[0.0440] [0.0416] [0.0434] [0.0322]
Observations 392 392 364 260
Adj. R2 0.10 0.11 0.22 0.28
Time Dummies yes yes yes yes
Industry Dummies --- yes yes yes
Leverage Industries excluded --- --- yes yes
Notes: Significance levels: * significant at 10%; ** significant at 5%; *** significant at 1%.
Ifo Institute for Economic Research
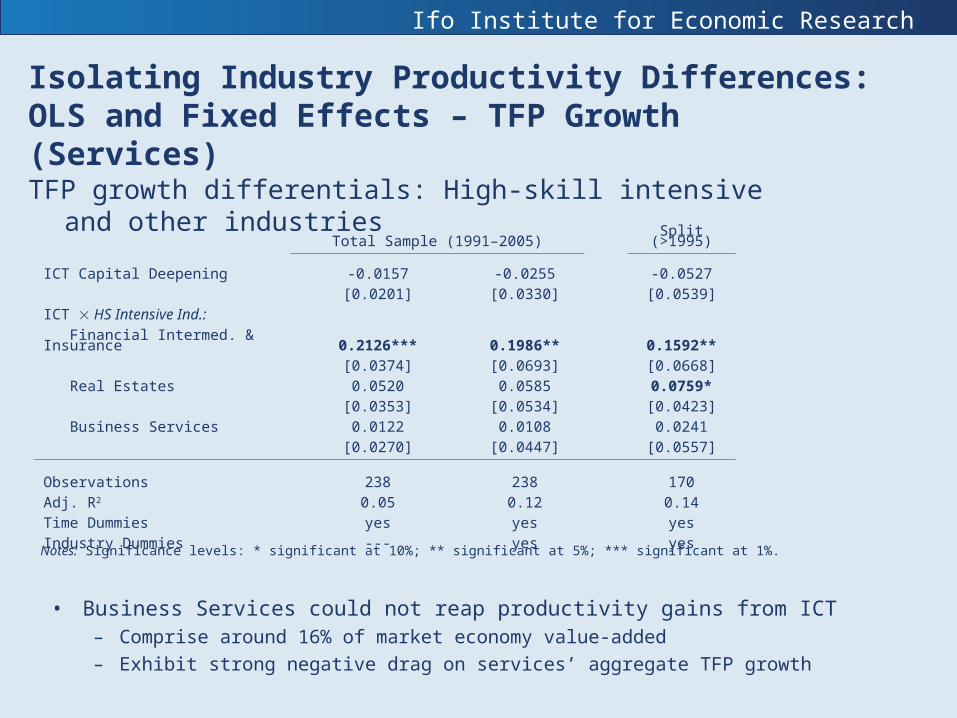
Isolating Industry Productivity Differences:OLS and Fixed Effects – TFP Growth (Services)
TFP growth differentials: High-skill intensive and other industriesTotal Sample (1991–2005) Split (>1995)
ICT Capital Deepening -0.0157 -0.0255 -0.0527
[0.0201] [0.0330] [0.0539]
ICT HS Intensive Ind.:
Financial Intermed. & Insurance 0.2126*** 0.1986** 0.1592**
[0.0374] [0.0693] [0.0668]
Real Estates 0.0520 0.0585 0.0759*
[0.0353] [0.0534] [0.0423]
Business Services 0.0122 0.0108 0.0241
[0.0270] [0.0447] [0.0557]
Observations 238 238 170
Adj. R2 0.05 0.12 0.14
Time Dummies yes yes yes
Industry Dummies --- yes yes
Notes: Significance levels: * significant at 10%; ** significant at 5%; *** significant at 1%.
• Business Services could not reap productivity gains from ICT – Comprise around 16% of market economy value-added
– Exhibit strong negative drag on services’ aggregate TFP growth
Ifo Institute for Economic Research
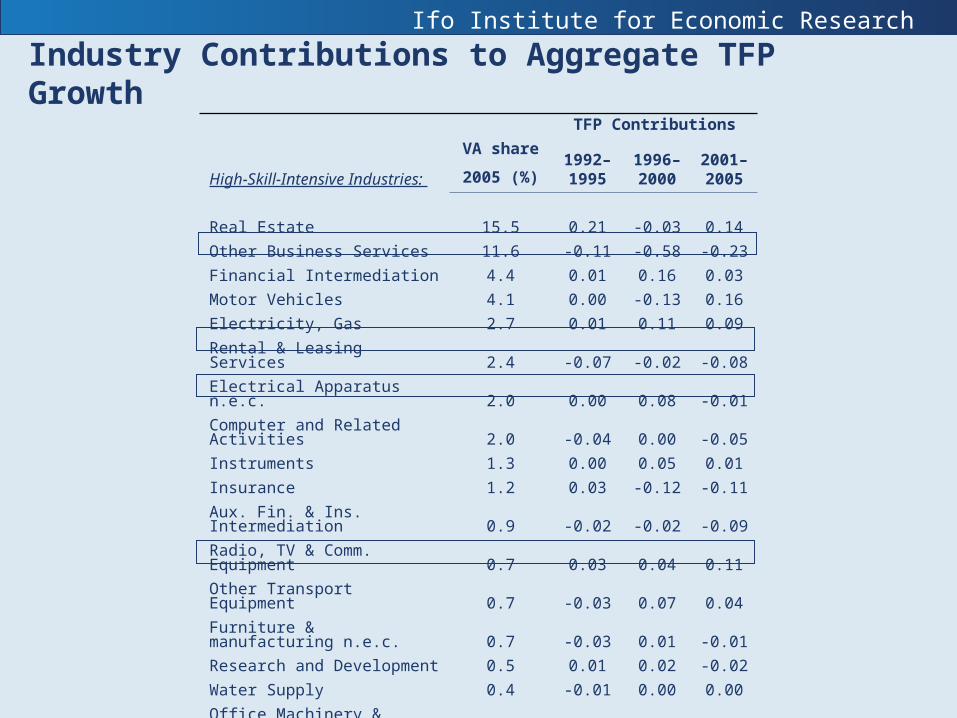
Industry Contributions to Aggregate TFP Growth
High-Skill-Intensive Industries:
VA share
2005 (%)
TFP Contributions
1992–1995
1996–2000
2001–2005
Real Estate 15.5 0.21 -0.03 0.14
Other Business Services 11.6 -0.11 -0.58 -0.23
Financial Intermediation 4.4 0.01 0.16 0.03
Motor Vehicles 4.1 0.00 -0.13 0.16
Electricity, Gas 2.7 0.01 0.11 0.09
Rental & Leasing Services 2.4 -0.07 -0.02 -0.08
Electrical Apparatus n.e.c. 2.0 0.00 0.08 -0.01
Computer and Related Activities 2.0 -0.04 0.00 -0.05
Instruments 1.3 0.00 0.05 0.01
Insurance 1.2 0.03 -0.12 -0.11
Aux. Fin. & Ins. Intermediation 0.9 -0.02 -0.02 -0.09
Radio, TV & Comm. Equipment 0.7 0.03 0.04 0.11
Other Transport Equipment 0.7 -0.03 0.07 0.04
Furniture & manufacturing n.e.c. 0.7 -0.03 0.01 -0.01
Research and Development 0.5 0.01 0.02 -0.02
Water Supply 0.4 -0.01 0.00 0.00
Office Machinery & Computers 0.2 0.03 0.11 0.06
Mining & Quarrying, ex. Energy 0.1 0.01 0.00 -0.01
Energy Mining & Quarrying 0.1 0.03 -0.03 -0.02
Recycling 0.1 0.00 0.00 -0.01

Ifo Institute for Economic Research
Conclusion
• There is an ICT-skill complementarity for German industries
– High-skill-intensive industries have higher ICT capital deepening, especially in the services sectors
– ICT capital deepening in other (non-high-skill-intensive) industries is steadily declining
• ICT and skills enhanced industries’ productivity performance
– There are productivity increasing effects from ICT capital deepening in high-skill-intensive goods producing and services industries, especially post 1995 (cp. TFP growth regressions)
– Negative total factor productivity growth in high-skill-intensive services (cp. growth accounting exercises) is due to weak performance of Business Services
– Potential explanations
• Measurement of services output
• Regulations might hinder ICT diffusion (Nicoletti et al., 2006)
• Share of high-skilled workers too low (e.g. brain drain)

Ifo Institute for Economic Research
Thank You for Your Attention!

Ifo Institute for Economic Research
Back Up
Ifo Institute for Economic Research
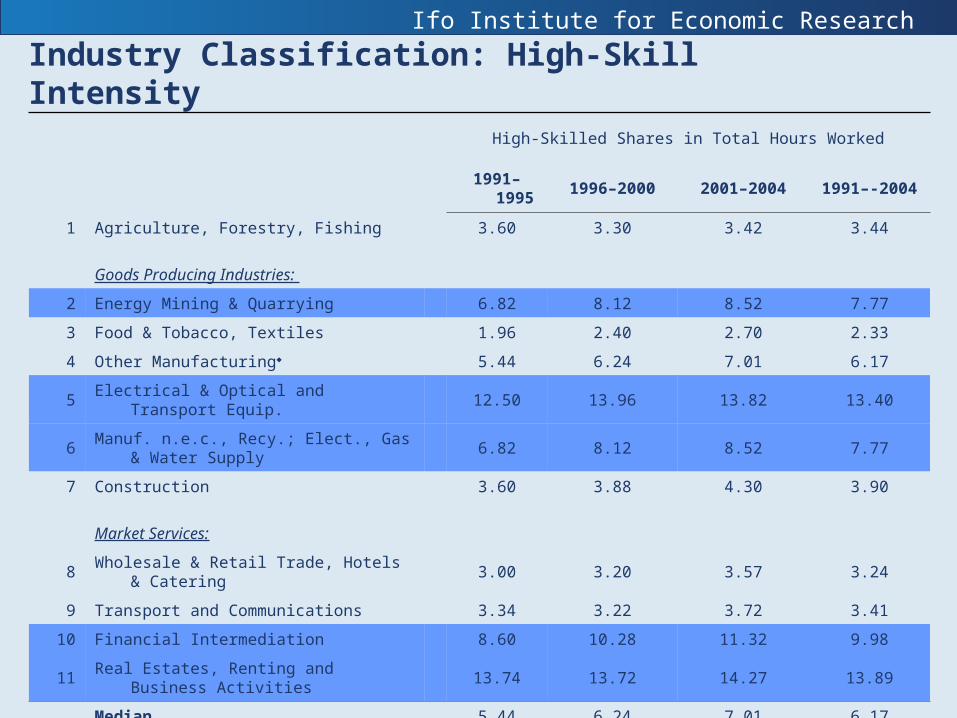
Industry Classification: High-Skill Intensity
High-Skilled Shares in Total Hours Worked
1991–1995 1996–2000 2001–2004 1991–-2004
1 Agriculture, Forestry, Fishing 3.60 3.30 3.42 3.44
Goods Producing Industries:
2 Energy Mining & Quarrying 6.82 8.12 8.52 7.77
3 Food & Tobacco, Textiles 1.96 2.40 2.70 2.33
4 Other Manufacturing♦ 5.44 6.24 7.01 6.17
5 Electrical & Optical and Transport Equip. 12.50 13.96 13.82 13.40
6 Manuf. n.e.c., Recy.; Elect., Gas & Water Supply 6.82 8.12 8.52 7.77
7 Construction 3.60 3.88 4.30 3.90
Market Services:
8 Wholesale & Retail Trade, Hotels & Catering 3.00 3.20 3.57 3.24
9 Transport and Communications 3.34 3.22 3.72 3.41
10 Financial Intermediation 8.60 10.28 11.32 9.98
11 Real Estates, Renting and Business Activities 13.74 13.72 14.27 13.89
Median 5.44 6.24 7.01 6.17
Mean 6.31 6.95 7.38 6.84
Ifo Institute for Economic Research
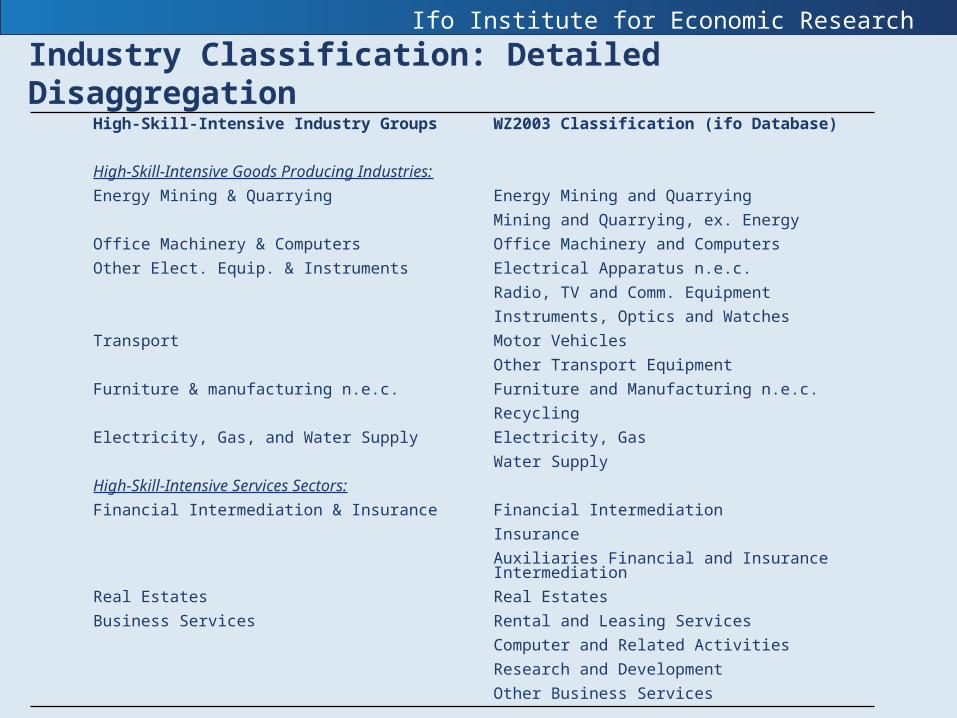
Industry Classification: Detailed Disaggregation High-Skill-Intensive Industry Groups WZ2003 Classification (ifo Database)
High-Skill-Intensive Goods Producing Industries:
Energy Mining & Quarrying Energy Mining and Quarrying
Mining and Quarrying, ex. Energy
Office Machinery & Computers Office Machinery and Computers
Other Elect. Equip. & Instruments Electrical Apparatus n.e.c.
Radio, TV and Comm. Equipment
Instruments, Optics and Watches
Transport Motor Vehicles
Other Transport Equipment
Furniture & manufacturing n.e.c. Furniture and Manufacturing n.e.c.
Recycling
Electricity, Gas, and Water Supply Electricity, Gas
Water Supply
High-Skill-Intensive Services Sectors:
Financial Intermediation & Insurance Financial Intermediation
Insurance
Auxiliaries Financial and Insurance Intermediation
Real Estates Real Estates
Business Services Rental and Leasing Services
Computer and Related Activities
Research and Development
Other Business Services
Ifo Institute for Economic Research
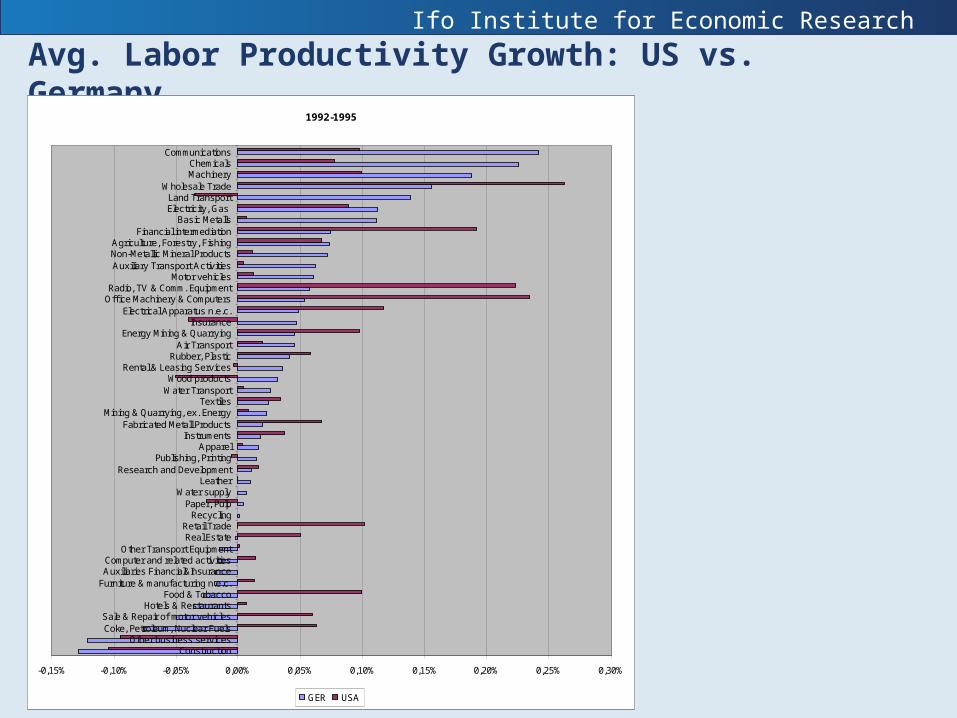
Avg. Labor Productivity Growth: US vs. Germany 1992-1995
-0,15% -0,10% -0,05% 0,00% 0,05% 0,10% 0,15% 0,20% 0,25% 0,30%
ConstructionOther business services
Coke, Petroleum, Nuclear FuelsSale & Repair of motor vehicles
Hotels & RestaurantsFood & Tobacco
Furniture & manufacturing n.e.c.Auxiliaries Financial&InsuranceComputer and related activities
Other Transport EquipmentReal EstateRetail Trade
RecyclingPaper, Pulp
Water supplyLeather
Research and DevelopmentPublishing, Printing
ApparelInstruments
Fabricated Metall ProductsMining & Quarrying, ex. Energy
TextilesWater TransportWood products
Rental & Leasing ServicesRubber, Plastic
Air TransportEnergy Mining & Quarrying
InsuranceElectrical Apparatus n.e.c.
Office Machinery & ComputersRadio, TV & Comm. Equipment
Motor vehiclesAuxiliary Transport ActivitiesNon-Metallic Mineral ProductsAgriculture, Forestry, Fishing
Financial intermediationBasic Metalls
Electricity, Gas Land Transport
Wholesale TradeMachineryChemicals
Communications
GER USA
Ifo Institute for Economic Research
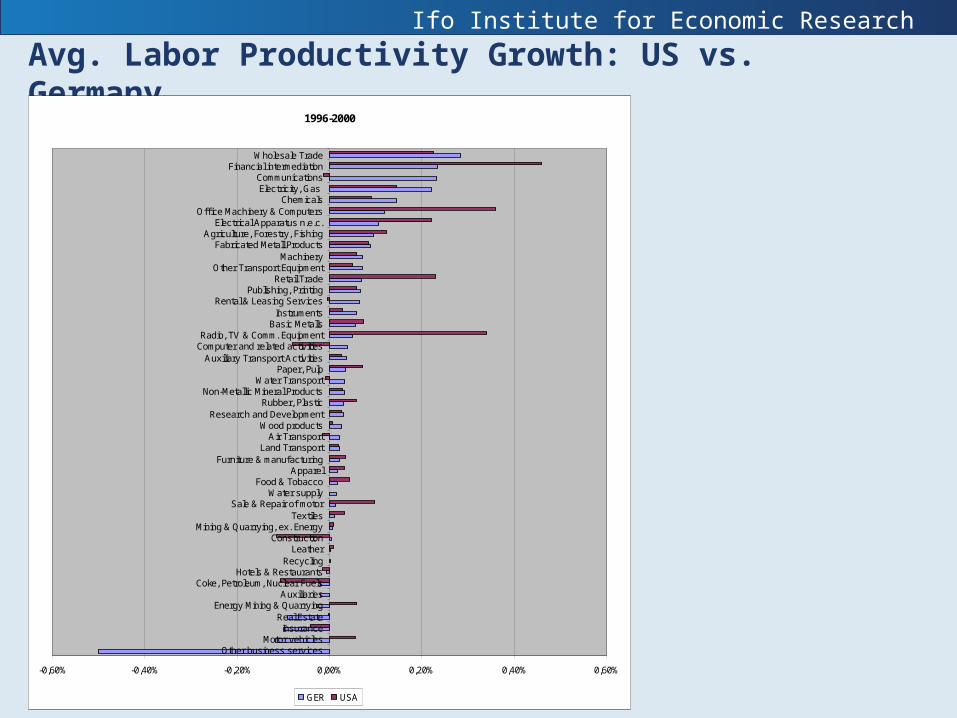
Avg. Labor Productivity Growth: US vs. Germany 1996-2000
-0,60% -0,40% -0,20% 0,00% 0,20% 0,40% 0,60%
Other business servicesMotor vehicles
InsuranceReal Estate
Energy Mining & QuarryingAuxiliaries
Coke, Petroleum, Nuclear FuelsHotels & Restaurants
RecyclingLeather
ConstructionMining & Quarrying, ex. Energy
TextilesSale & Repair of motor
Water supplyFood & Tobacco
ApparelFurniture & manufacturing
Land TransportAir Transport
Wood productsResearch and Development
Rubber, PlasticNon-Metallic Mineral Products
Water TransportPaper, Pulp
Auxiliary Transport ActivitiesComputer and related activitiesRadio, TV & Comm. Equipment
Basic MetallsInstruments
Rental & Leasing ServicesPublishing, Printing
Retail TradeOther Transport Equipment
MachineryFabricated Metall Products
Agriculture, Forestry, FishingElectrical Apparatus n.e.c.
Office Machinery & ComputersChemicals
Electricity, Gas Communications
Financial intermediationWholesale Trade
GER USA
Ifo Institute for Economic Research
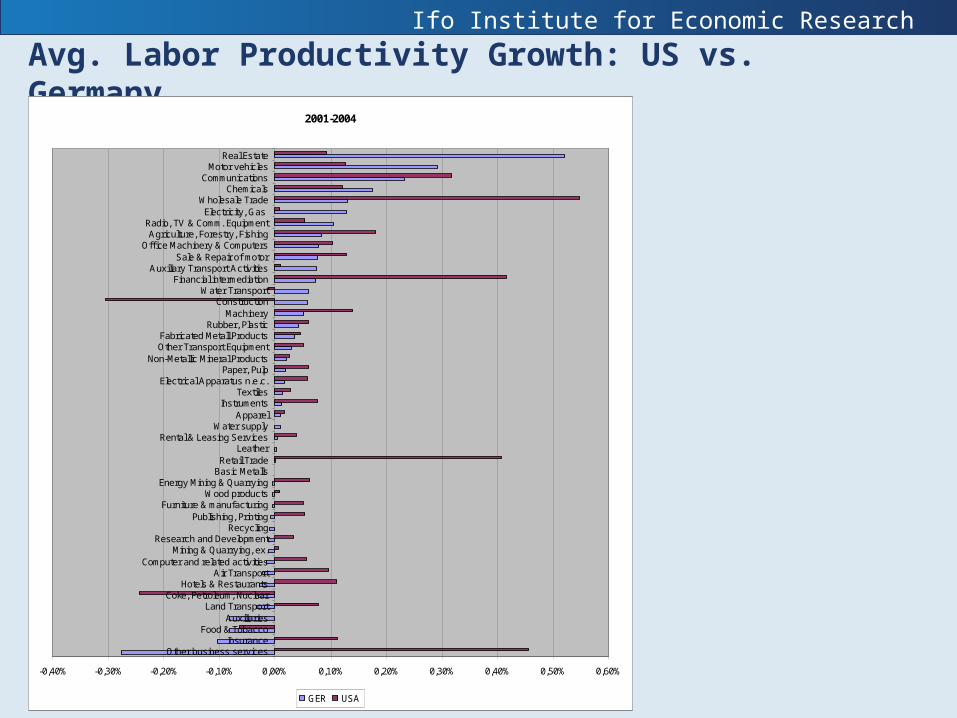
Avg. Labor Productivity Growth: US vs. Germany 2001-2004
-0,40% -0,30% -0,20% -0,10% 0,00% 0,10% 0,20% 0,30% 0,40% 0,50% 0,60%
Other business servicesInsurance
Food & TobaccoAuxiliaries
Land TransportCoke, Petroleum, Nuclear
Hotels & RestaurantsAir Transport
Computer and related activitiesMining & Quarrying, ex.
Research and DevelopmentRecycling
Publishing, PrintingFurniture & manufacturing
Wood productsEnergy Mining & Quarrying
Basic MetallsRetail Trade
LeatherRental & Leasing Services
Water supplyApparel
InstrumentsTextiles
Electrical Apparatus n.e.c.Paper, Pulp
Non-Metallic Mineral ProductsOther Transport EquipmentFabricated Metall Products
Rubber, PlasticMachinery
ConstructionWater Transport
Financial intermediationAuxiliary Transport Activities
Sale & Repair of motorOffice Machinery & Computers
Agriculture, Forestry, FishingRadio, TV & Comm. Equipment
Electricity, Gas Wholesale Trade
ChemicalsCommunications
Motor vehiclesReal Estate
GER USA