ieeiieeeeeii postgrrduate school monterey … · 12 fivure 6. a detailed m odel of the sampling...
TRANSCRIPT

-A195 S"6 SCATTERIN IMPULSE RESPONSE SYNTHESIS USING RANOM 1/2 '
NOISE ILLUMINATION: INITIAL CONCEPT EVALUATION(U) NAVALPOSTGRRDUATE SCHOOL MONTEREY CA D I LEE MAR 88
UNCLASSIFIED F/G 17/9 UIEEIIEEEEEIIEEllElllllEllEEEEEEEEEHEHDWEEEEEEIEEEEEEEEIEEEEEIIIIEEEEEEEAEEEEEEEEEEIEEIIEEEEEEEEEE

* I--4
-- W w w w w w

NAVAL POSTGRADUATE SCHOOLio Monterey, CaliforniaIn'
a
ftA D. EYFIELECTE
S JUL 14 1988
THESIS 'H
SCATTERING IMPULSE RESPONSESYNTHESIS USING
RANDOM NOISE ILLUMINATION:INITIAL CONCEPT EVALUATION
by
Dong Ii Lee
March 1988
Thesis Advisor: Michael A. Morgan
Approved for public release; distribution is unlimited
<, .j ,-- ...

Unclassified
seturity classirication of this race k ' 56MEORT DOCLM ENTAviro.N PAGE
I a Rzport Security ciassincation Unclassified lb Resuictive Mtarkings
.Sceuray Ctlassn'cation -Wh~lor4%Y 3 Distribution Availability )f Rt'nort0 Ds~i~atonDow :a1i~ Sl~oleApproved for public release: dit-ribution is unl-imiited.
4 Performing~ Org-anization Report Nutnber(s) 5 Monitoring Organiziin Rerort Number(s)6a Name of Performing Organization 6b Office Symbol 7a ,Name of Monitoring OrganizationNaval Post,-zraduate School ilf appilcabte) 62 Naval Postgraduate School"ic Address f.:'rv. st~ate. and ZIP coudi) 7b Address (:e.state, and ZIP code)Nlontzvev. CA )3043-5Of() Monterev. CA 93941-5000t
'.\rd Funuin- Siroiiorlll z 8b LnszatIn01..) Prucurem'ent Instrunicitt ICeiILl('catior, Niambtr
A.cssf ii~v il. a ,nd zIP ,.vael JI0 Source of Func_-to N unnlrs ~\ ~~ktr-~.o
I....:.a ~Wn .0 :: ca' SCATTERING IMIPULSE RESPONSE SYNTHIESIS USING R2ANDQ )IM NCUSE IL-~IUINlA"VIN: 7NV1 LAL CONCEPT EV.ALUATION
.':P-rsnnal Authoris) Don-- 11 LeeIt 1 I ,(Rerr'r( I! b Timet Coviered 1.1 Liate of R.2norL iyeazr. o~.s~.dat) 15 P Z COL:aIt
I I.~. March l91 l'*r Cm, :p -c ntistci r tlo-_e cf t uhridJ o ;ktlV-
* '*''-' t01., 1 (ifr:nn D.4 lX:w;C or th.. U .S. ( Irverr~unent.
:. ~~~Scatterine: Ranidom noi~ ~eiet icrmeei Radar.
' 71lt i,:Wue n rvere i ptcc~ar and Idengjf 'y block runi'.r)* ~ ll~i~thtes., sivestigatws the synihosis of smnooth.i imnpulse responses using samnplcd data of the input and output of randomnoise driven electromagnetic systems. Speciai interactive software was developed 1*0r N?S's tiffi domaini C!CLzrtozlnitrC4catterine laborator.y. The system performs . ignai acqui .ition. sy .nthesizes timne and frequency domnaini scattemnng reponsesusi broad band random noise and provides results as easily evaluated graphic displays. Attempted validations Lit the S';sti.-n*jare miade by comparing synthesizcd impulso respot ses for mi'crowave filers and transient scatterers to nitexiate expncrinier'iud1and compuitational data. . /S -
\1i":hael A. Nfor.tna (40 )66-2\7V7DD 111 fO0R0I I473. .&MAR 83 Ai'It '2du-rn nnI: e used uniil *2ha.estod ouritN classtifioil lof 1i nl::e
o \v It ntlir e!dit lll are b.oe

Approved for public release; distribution is unlimited.
Scattering Impulse ResponseSynthesis Using
Random Noise Illumination:Initial Concept Evaluation
by
Dong II LeeMajor, Korean Army
B.S., Korean Military Academy, 1977
Submitted in partial fulfillment of the
requirements for the degree of
MASTER OF SCIENCE IN ELECTRICAL ENGINEERING
from the
NAVAL POSTGRADUATE SCHOOLMarch 1988
Author:._ _ _ __ _ _ _ _
Dong 11 Lee
Approved by: /__ _ _,_ _ _ _ __ _ _ _
Michael A. Moran, Thesis Advisor
11 .10- - iGlen A. Myers, Seecond Reader*
John P. Powers, Chairman,Department of Electrical Engineering Science
Gordon E. Schacher,Dean of Science and Engineering

ABSTRACT
This thesis investigates the synthesis of smoothed impulse responses using sampled
data of the input and output of random noise driven electromagnetic systems. Special
interactive software wvas developed for NPS's time domain electromagnetic scattering
laboratory. The system performs signal acquisition, synthesizes time and Frequency do-
miain scattering responses using broad band randomn noise and provides results as ea'sily
evaluated -,rapliic displays. Attemipted validations of thie systenh are ma~de by compating)
synthesized impulse responses flor midcrowave ilters and transient scattercrs to alternate
experimental and computational data.
Accesson Fo
NTIS GRA&I* DTTC TAB
Unauounced 5l
-6 Dl ~tribution/ -
* IAv~1iability Codesiii K Av ail and/or-
Ma Special
0I

TABLE OF CONTENTS
I. INTRODUCTION ............................................. 1A. OVERVIEW.............................................. IB. NOISE SOURCE IM*fPULSE RESPONSE MEASUREMENT CONCEPT . 2
C. OVERVIEWV OF THESIS.....................................5
11. TEORY OF NOIS.ESOLRtCE IMP1ULSIE RLS1IONSE MIE--ASURL.NIEN F .7
A. THEORY OF ANALOG SIGNAL CROSSCORRELAUION............ 7
B. CROSSCORRELATFION. MEASURI:MIENTI........................ S
1. Mlethod 1.:Simiultaneous Uuai Channel Mteasuremcrntwith Saumpliing
Rate Greater than Nyquist Frequenicy................................ 82. Method 2.: Simultaneous Dual Charncl N haSUrenient with A rI'itra r'
*Sampling Rate. (Less thtan Nyquist Frequency)..........................9
M. Method 3.Pre- subtracted Single Cha nnel M easurcment with A I-it .rarv
Sampling Rate. (Less thian Nyquist Frequency) ......................... I1)C. PROP'ERTIES OF THlE ESTIMATED CROSSCORRELATION........ 14D. SYSTE.M I DENTIFICATION USING ESI IMATrED CROSSCORRE-
LATION FNCTON........................................17
HL1 BASIC EXPERIMENTAL CONFIGURATION.....................22A. DESCRIPTION OF DPO AND ITSNIODIFICATION .............. 22
B. NOISE SOURCE GENERA-TOR HIARDWARE AND ITS DEVELOP-MIENT....................................................260
C. SUMMAv~tRY OF TI'IE ROBILEMS AND SOLUION0Sl FOR TH-E
*CRtOSSCORRELATION. M EASUREM'vENT. ........................ 34
IV. CALIBRATION AND VALID)ATION %-IEASI:RIEMN1 N. ............. 36A. INITIAL TESr OF SIMULTANEOt:S CHANNEL SAMPLING........313B. C ROSSCOR RELATION OF THE I1IPO SYSTIEM*l...................3)6C. DI3CONVOLUTION VALIDATION TEST........................39
1. Test with Noise Source....................................3)
2. Test with Modified Pulse Source.............................40
iv
0Z

V. ELECTROMAGNETIC SCATTERING MEASUREMENT..............53
A. DESCRIPTION OF THE SCATTE RING RANGE.................. 53
B. DERIVATION OF NOISE SOURCE IMPULSE SCATTERRING RE-SPONSE MEASUREMENT FORMULA............................54
C. ELECTROM*VAGNETIC SCATTERING CROSSCORRE LATION M EAS-UREMENT ................................................. 60
VI. CONCLUSIONS............................................ 65FA. SUMEMARY............................................. 65
11. FUTURE CONSIDERATIONS................................606
APPENDIX COMPllUT-ER PROGRAM-'v LISTrINGS......................67
LIST OF REFERENCES ......................................... 1of9
*INITIAL D)ISTRIBUTION LIST....................................III

LIST OF FIGURES
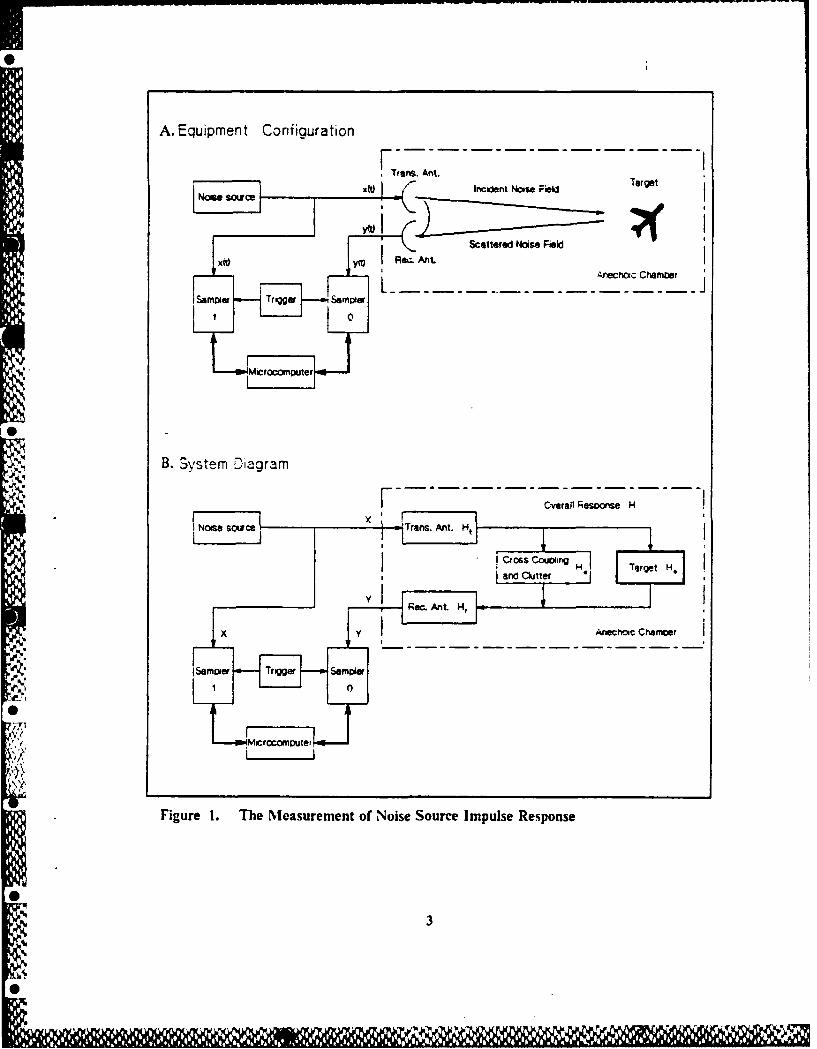
Figure 1. The Measurement of Noise Source Impulse Response ....... 3Figure 2. The Procedure of Noise Source Impulse Response Scattering 'Veasure-I
ment .................................................. 4
Figure 3. Crosscorrelation Measurement System Model....................8Figure 4. Comparison of The Three Estimation Techniques flor The Crosscorre-
laton................................................11
Figure 5. Simultaneous Channel Sampling Test b'y Subtraction............... 12Fivure 6. A Detailed M odel of The Sampling Systemn of the D l1O............. 13
Fieure 7. A Detailed System Model to be Measured......................18IFieure S. The Sampling Scheme of the Tectronix 7854 DPO.................rietiie 9. A Pulse Signal and Its Convolved Output by a Linecar System........ 24
Ficure 10(. Modifie! TeAtronix 7854 1)PO...............................-2
-iure 11. Potentiometer R eadiiiw Table . . . . . . . . . . . . . . .
Figure 12. Tile Reading Error Due to the Line-width of Ramp Signal...........2')
Ficure 13. The Efl'ect of the Dilffrence of Sampling Interval..................))Fitzure 14. Noise Generator ......................................... 1Figure 15. Frequency Response of an Amiplifier of the 'Noise Generator.........3
Figure 16. A Recorded Noise Signal....................................3Figure 17. The Amount of the Measured Error Noise ...................... 35
Figure 18. Simultaneous Channel Sampling Characteristics by Subtraction....... 37Fi'2ure 19. Jitter Noise of the Noise and the Ramp Signal by Sub~traction........ 38Figulre 20. DPO Systemn Crosscorrelation Measurement Setup................ 41
Figure 21. DPO System Crosscorrelation 17unctionl........................4
Figure 22. DPO System Crosscorrelation 17unction and Power Spectral l)CensiEV . . 437i gure 23. Frequency Response of the Avamuek Ainplifier ................... 44
ricure 241. Noise Deconvolution Validation Systemn Setupl.......... 45~
Ficure 25i. The System Crosscorrclation, Crosscorrelation M.\ethod.............,)
oFiizure 26. Thie Crosscorrelation of'Avantek Amnplifier. Crosscorr-clation Methiod 4 .-
i tr,. 27. Thie Syvtei Rkespontse of' .vartck Amtplifier, ( rosscorrelation Methiod 4',fFi~nure 2S. The Mo 1dilied PulSe Input Signal. Tlime Domtain Method............4Figure 29. TUhe Output Signal of the Avantek Amiplifier. 'Time Domain Method .. 54)
Vi
duIA U14.IArl

Figure 30. The System Response of Avantek Amplifier, Time Domiain Method . .. 51Figure 31. The Comparison of the Two Methods..........................52Figzure 32. A System Diagram of the Scattering Range......................5Figure 3 3. Pathi Diffierences for Target and Calibration Spheres............... 58Figure 34. Examples of the Delayed Signal Due to Different Paths............. 59Figure 35. Time Origin Alignement Test of the 8 Inch Sphere ................ 63Figzure 36. The Fluctuation of the Estimated Crosscorrelation Due to the Error
Noise................................................ 64
vii

I. INTRODUCTION
A. OVERVIEW
The objective of this research is to demonstrate the viability of performing high-
resolution impulse response scattering measurements using a broad-band noise source.
Tile development of laboratory facilities for high-resolution impulse response scattering
icasurements has generally proceeded using two major techniques. The first of these
employs a stepped-frequency coherent oscillator and a vector (magnitude and phase)
receiver. Impulse response target characteristics are obtained via inverse Fourier trans-
formation of the frequency domain data. The second method obtains impulse response
measurements directly in the time-domain by use of a repetitive fast-pulse target illumi-
nation with a sampling-scope acting as the receiver. The time-domain approach for
scattering measurements offers a viable alternative to the more prevalent continuous
wave approach. Transient scattering measurements provide wavclbrrns that can be more
directly interpreted as to cause and effect and allow exact range-gating of target re-
sponses for elimination of unwanted clutter [Ref. 1. 21.
The development of digital sampling oscilloscopes and broad band noise generators
made possible a third method lbr high-resolution impulse response scattering measure-
merits. This technique is based on the estimation of the crosscorrelation function be-
tween input and output using a broad-band noise source as the transmitter. This
methodology has been employed in measuring the mechanical impulse response of large
structures, such as bridges and buildings [Ref. 31.
The practical advantages of this third technique are two-fold. The first is the wide
bandwidth and high power available from noise sources which are available at much
lower cost than comparable stepped-frequency sources. A conclusive demonstration of
the viability of noise source impulse response measurements may lead to Further refine-
nicuts and ultimately to cotmnercial marketing of this technology. The second advan-
taue is related to the use of noise-source illunlination for tactical and strategic radar
applications. An obvious benefit would be the masking ol the radar interrogation signal:
this would appear at the target as either jamnming or interference. Conlision would re-
suit as to proper countermeasures to be employed by the target. Furthermore. since this
imethod uses random noise, which is orthogonal to other signals and other noise
(producing zero crosscorrelation with these), a high SNR requirement could be achieved.
01 111 1
This thesis is a continuation in a series of efforts in transient elect romagnetic scat-tering that began in 1979 at the 'Naval Postgraduate School (NPS). The developmentof digital sampling techniques allowed the development of transient scattering ranges inthe late 1960's [Ref. 41. A transient scattering range having sufficient bandwidth andsi2nal to noise ratio (SNR) to support radar target identification was initially con-structed at NPS in 1980 using a ground plane configuration [Ref. 5,61. A very wideband(short pulse) free-field scattering range was then constructed in 1983 for implementationof target identification based upon natural resonances. as introduced by Mittra and VinBlari'curn1 [R3ef. 71. Thiis fr-ee field transient range was validated by \iJariate ui. zindMceDaniel [Ref. 8.01.
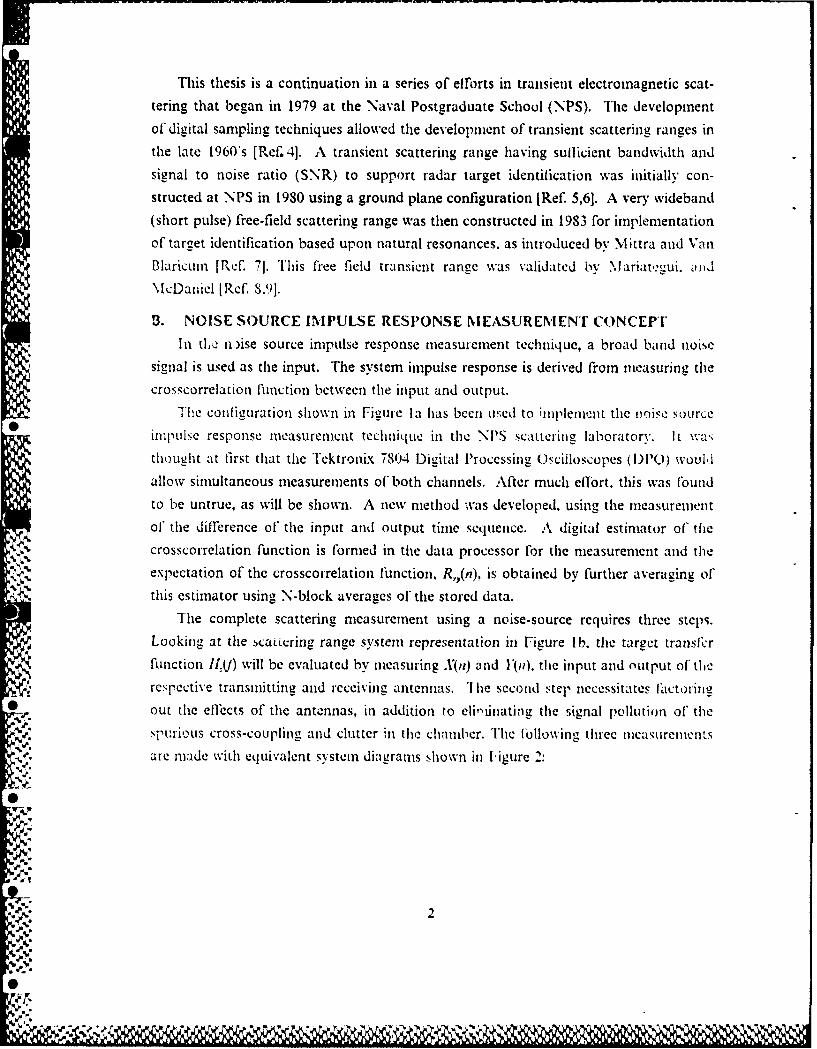
3. NOISE SOURCE IMPULSE RESPONSE MIEASUREM'ENT CONCEPT'In tLc ii;)ise source impulse response mneasuremnent technique, a broad balld noise
* signal is used as the input. The system impulse response is derived from measuring thecrosscorrelation function bctween the inpu)Lt and output.
The corifizuration shown in Ficuie l a has been uIe to rnplern111211 thle VOiSe source
0impulse response measurement technliqueI in the NVS scattering laboratory. It Latliou~±ht at first that the Tektronix 780i4 Dicital Processingn Oscilloscopes (1I00) wouilIallow simultaneous measurements of both channels. After much effort. this was foundto be untrue, as will be shown. A new miethod~ wa developed. using the measurenmentof' the difference of the input and Output time sequence. A digital estimator of' tilecrosscoirelation function is formed in tile data processor for the mecasurenment and tileexpectation of the crosscorrelation function. R,(n), is obtained by Further averaging of'this estimator using N-block averagzes of thle stored data.
'Ilie complete scattering measurement using a noise-source requires three step~s.Looking at tie scaiiering range systemn represenitation in Figuire lb, the target translicrfunction I[,(/) will be evaluated by measuring X(n) and V~i). the input and outrut of' tilerespective transuitn and receiving antens T[le second step necessitates fitrns
out tile efficas of the antcnnas, in addition to ehItnting, the signal 110lluti60n o1' thle
spu1triou)Ls cross-coulplingo and clutter ;In the chiamber. The following three nicasurenentsate miade With eqiValent system diagrams shown in 1-iizure 2:
A. Equipment Configuration
NoseS snt. cide rn Noise Field Target
Xto R&. Ant caterd Noise Field
AnecftocChamber
B. -System Diagram
k~~ Tas Ant.i TrHetSml
Crs ouln
Figurer Tger Smero os oreIpleRsos
3

0 Step 1. :BrickgrOund measurement (no target)
Trans. Ant. NcRc.At
Hi(f) = Ht(f) Hc(f) Hr(f)
* Step 2. :Calibration target (sphere) measurement
HOCaib Target
X2 E - CHR YV2
H2(f) = Hi(f) +Ht(f) Hp(f) Hr(f)U Step 3. Test target measure ment
Target
H CH
.0 H3(f) =Hi(f) + FH(f) Hs(f) Hr(f)U Step 4. Subtraction of the background effect
H4(f) = H2(f) - Hidt)H5(f) = H3(f) - Hi(f)
* Step 5. :Extraction of the target response (Deconvolution)
H4(f) -Ht(f) H5 (f Hr(f') Pf
For optimal compensation, use Rlad's methodH5(f) -H5(f) H4(f)H4(F) I 1H4(f) 12 + 0: H42(f))/N
Therefore.
H.(f) =Hs(f) H4(f)1H4(f)1 2 + (Z H42(f)),'N Hc
Hpc(f) computed frequence response of thecalibration target. (sphere)
Figure 2. The Procedure of Noise Source Impulse Response Scattering Measure-ment
4
Ma

1. No target present. measure /,(t)
2. Calibration target (sphiere) present, measure lt,(t)
3. Test target present. measure Qt3()
Then, h,(i) will be subtracted from h2(t) and hA:t) to eliminate the clutter effect.
h4(:) = /z2(t) - hi(t) (I
hi--r) = Iz](i) - h1~t) .)
Finally, thle desired impulse response is extracted from him() and 14(1) using an optimaldeconVOILutionl technique knowvn as Riad's method I Ref. Ju1 which will be described indetail in the following chapter.
An important difliculty encountered in this thesis research was that no samiplingdevice with a igh enough rate for the source signatl. h aving a banidwidth of ,ipproxi-
* mnately 13 01 iz. is availablc thus Ihr. Consequently, thle esinliaion of the crosscorre-Lition function could not be computed using a pair of propeily samled -sets of the tillh:function of each input and output signal. Tlwo alternate methods wcrc developed which.for thle case of ergodic random noise, perits arbitrarily slow sampling to be used. Thesetwo Nvquist independenit techniqjues will be described in Chapter 11.
C. OVERVIEW OF THESISThe objectives of this thesis were to:
1. Develop a working software program which will acquire transicnt response datafrom the target and compute the estimation of the crosscorrelation function fol-lowed by a computation of' thle system impulse response using a deconvolutiontechnique.
2. Demionstrate impulse scattering response measurements using a broad band ran-dom noise source, and verify the performance in conip~arision with anothier tech-nique: timei-domnain measurement using~ modified step function input.
Chapter 11 will expand the theory of noise source impulse response measurement.Tihis will examine the basic theory of analogt crosscom relation techniques [Ior acquiringsystem impulse responses and consider an appropriate der'iVation for thle discrete version
0 of' the technique for the sampled signal. In addition, it will quantifyr tile estimation oftile crosscorrelation ('unction.
Chapter I II describes the experimental system in detail. 1 his Will include thle dec-scription of the original Digital Processing Oscilloscope (DPO) and miodifications that
0S
were made. A description of the noise source hardware and its modified hardware will
also be given in this chapter. In addition, the problems encountered in this research will
be discussed and some guidelines for the laboratory work will be summarized.
Chapter IV contains the calibration and validation measurements lbr simulated
targets. This will include the initial quality tests of simultaneous channel sampling, noise
source, and crosscorrelation function that were made by sampled data using the noise
source. The derivation of the crosscorrclation of the measurement itself
(autocorrelation} and frequency response will be considercd using IFT techniques. The
initial test involvie,1 a mirowave baudpass amnplilier using a noise source and a step
generator with ampiifier will also be discussed.
Chapter V will describe the electromagnetic scattering measurement. *rlhe exper-
inental setup. scattering range and chara.cteristics of the antena used will be explained.
Finally, the impulse response measurement of a metal sphere target will be attempted
using the noise source. The resultant failure of this measurevient will he considered.
Chapter VI provides some conclusions about thi% experimental appi yt,. involvitng
*'eke \our . inpulse tcsponse measurecnts. Additiotl;dly. reCo1unez.driots :,, madCre,.rding improvements in the current systein and possibilities fur l'urther ,csCarl.
-4 ,
4.
N

1I. THEORY OF NOISE SOURCE IMPULSE RESPONSE
MEASUREMENT
A. THEORY OF ANALOG SIGNAL CROSSCORRELATIONLooking at the system diagram in Figure lb, the responses of transmitter antenna
h,(t) and receiver antenna hz,(t) are cascaded with the parallel responses of the target h,(t)
and the clutter h,(t). fbrming an overall response, hki),
1zt) = h1(t) * I tzM) + 0z(') 1 ,)
The total measurement systcm can be represented as a simple linear system whose re-
sponse, 1'(t), due to an input, X(t), is given by the convolution
)'( ) * (t)
* -~~ J h(e7).(t - o) do 22
It can be shown that the crosscorrelation of the input and output of a linear systemestimates the system impulse response when the input has a bandwidth that is large
compared to the bandwidth of the system. This results firom superposition as applied
to stochastic expectation,
Rxy(t) = E [X(r) Y(r + i)]
= E [h(t) * X(r)X(r + t)1
= h(t) * E[X(r)X(r + t)1
Rxyi ) = h(i) * R,(t) (2.3)
0 For ergodic processes, the mean values and moments can be determined by time aver-ages as well as by ensemble averages.
, Rx.(t) =< X(r) 1'(r + t)>
X•r )'.-r + ]d
Replacing the output signal Y(t) by the convolution defined in Equation (2.2) results in
70

~(t) Linear system Sample Coreatr
Figure 3. Crosscorrelation Measurement System Model
* 00fX(r fo h(a)X1(r + i - a) dcci?
=, JI(a)J-. V(T).V(T +( (- a)) tftda (2.5)
f- fh()Rx(i - ) dca
h=t * xt
This leads to an important property of the Fourier transform relation. which is
S, Hl x (2.6)
known as the crosscorrelation theorem (IRef. I I.
B. CROSSCQRRELATION MEASUREMENT1. Method 1. : Simultaneous Dual Channel Measurement vith Sampling Rate
Greater than Nyquist Frequency.Three methods of performing the measurement could be used to estimate the
* crosscorrelation of the linear system. One possible, probably the most general. way isto directly sample the input and output sequence simnultaneously and store the data inthe computer memory. This involves a delay of the input sequence, and a computation
of the average of the product of the two sequence vectors.

K-I-n
Rx(n K k A k+nk-n?
K-I-n
R~()=- X(k) Y(k + n) (2.7)k=n
This scheme is illustated iii Figure 4 and compared to other meth~ods. Two conditions
must be satisfied to use this method,
1. Sampling miust bie donie With a samiplig rate greater than the NyquIList fre~pierw.
2. Sampling of two channels must be done simultaneously.
2.Method 2. :Simultaneous Dual Channel Measurement wiith Arbitrary Samplingf
Rate. (Less thani Nyquist Frequency)Method I could not be used because the required bandwidth of the 13PO
sampler is inIsuHficit. An al1ternative method requires manually shfigte iput or* outputI signal. being increnented by the sampling Interval. Saviples Of tlIe i11p11t ;ovA
ow 1Put signal are taken with a suitable sampling rate, since each sampled timle sCLequeceis treated as the sample set of the ensemble space rathecr than a timec sequenice.
K-1
KYV 7~ V,k I1;+n7 .kk=O
K-I
R.y(n) 1 (kL) Y(kL + ni)(28k=O
where,
Tit = - -, Tma> x (2." )
1 ~ ~ I lete, T denotes the time period of' delay and 7' i te sa pig p iol UinZ ti
technique, the estimation of'the crosscorrclation of' the delayed time point can he comi-
puted by each neasuz enent of' input and output signal wiih ant appropriate aniulit of'delav. This nicthod is illustratcd in [ilzure 4. 1 hie remaining condition which iust besatisfied for the crosscorrelation measurement is simultaneous sampling.
9

For the case of random noise, it looks like the direct measurement method underthe high rate sampling environment. The second method was initially chosen for thisresearch.
3. Mlethod 3. :Pre-siibtracted Single Channel Measurement wvith ArbitrarySampling Rate. (Less than Nyquist Frequency)
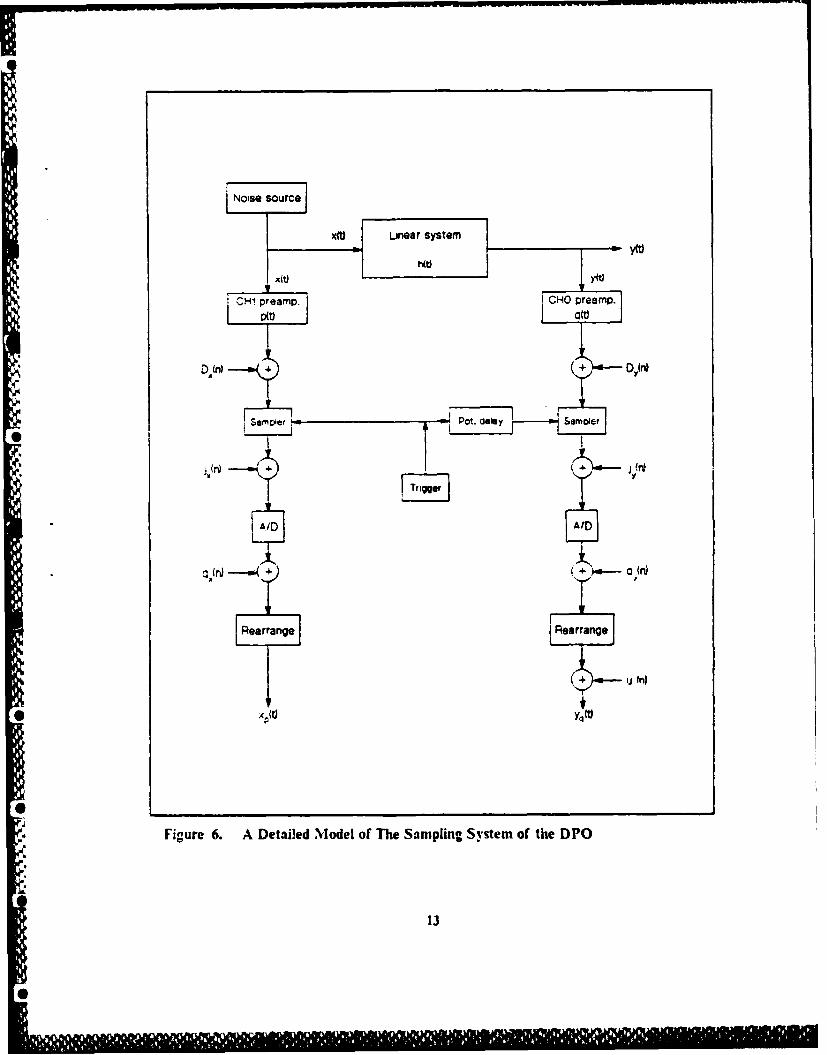
During the laboratory work, it was shown that an unknown critical noise isadded to the left sampling channel of the DPO which makes the second method imnpos-sible to use. This may be caused by mnispositioning of the actual data in the buffer. 'I hitsphenomena and the equivalent model are illustrated in FiLILI'2; 5 anUd 6. Anl uiienlaml
miethod whi-Ji avoids this problem is to subtract Y froin X using the built InI Add1 111n.1"Invert" functions in the DPO. T'his results in only one sequence of 're-subtracted dataand is followed by computing the estimation of'the ineart-qu:.re value of' this data se-
quence.Ret'errin2 to Fig2ure 6. assume that the imipuilse responses of' the samnpler Owni-
nels of the DPO are unit impulse responses,. I'lhe efkcit of the sampler respon~s" of the*DPO will. be dliscvssed inI thc later r-zctiori of this Chapter.)
pW0= q(t) = (t) (2.11)
Then the measured sequences .17(n) and Vj~n) can be denoted as
.Xp(n) =X(n) + D,(n) 4- X,(n) (2. 1 I)
Yq(fl) aY(n) + D,(n) + NA,(n) (2. 1 b)
wvhere,
*D.,(n) DC bias due to die DPO vertical adjustment.
.VX(,) other noise. (thermnal noise, jitter. quatiiation noise etc.)
with similar representationis f'r1)(n) and Njn usig the V-chiannel.
01

A. Method 1Nsampies
x i i I1 IIIIIIII i HK-I -K
!-rfn
CDeay Sarnolin- Deriod
Dual channel measurement with sampling rate greater than Nyquist freauency.
B. Method 2
N samples K-1A
Y I R"Y.(n)= K YX(kL) Y(kL + n)
x TL
Deiay Sampling period
Duai channel measurement withI sampling rate less than riyquist frequency.
C. Method 3N samples A
_________________ Rr(n) 3 [2Z(oo~) IZ(n)1I'
I IZ(n) a': 1 (kL) - Y(kL +n)
HTDelay Samping period
Single channel measurement with sampling rate less than Nyquist freauency.
Figure 4. Comparison of The Three Estimation Techniques for The Crosscorre-lation

A. Subtracted by computer B. Subtracted by DPO
(after sampled) (before sampled)
SCALE: 0.1 VOLT SCALE: 8.1 'JOLTflEk. : 0.06795"1093'15 MEA14 : 8.03802"3829125VAR : 0.009617420?4o06 UAR : 7.42e9219E-4
Figure 5. Simultaneous Channel Sampling Test by Subtraction
12
CH-I preamp. CHO Preamp.
Saw~~Wer Pot. Coey Smo
A/D
Rearrange i Rearrange
Figure 6. A Detailed Mlodel of The Sampling System of the DPO
13

Let a subtracted sequence be denoted as
Z(n) = X,(kL) - Y'q(kL + n) 2.13)
where "n" is due to the time-shift. Then the mean-square of Z(n) is described as
[ Z(nj [ X,kL) - Y4(kL + n) 12
- 1{ '(kL)+ L,(kL) + n.dL) } - t }(A L - u) + DiL + n) 4-t ,AL - a,
= DC term - 2R1,1)
- j Z(0)2 - 2R/..(n)
where we have assumCd stationarity of the random process in X and Y 'Ihcre!lbre. !ieSdCired estination of' the crosscoirelation Rinc.tion is
R =,(n) ± I [ Z(o) 1: - 1 Z(, 1 (2.
Ilhe results of the trial measurements reveal that this estimate has a better and morc
consistent value than the result firom method 2. This measurement technique has been
used for this research.
C. PROPERTIES OF THE ESTIMATED CROSSCORRELATION
Since the crosscorrelation function has an important role in the analysis of line;ir
systems with random inputs. an important piractical problem is that of dctet minitn3 the
quality ul" the estimation of the function lbr experime'tally observed random plocsscs.
In order to evaluate the quali.y of this estimate it is necessary to determfine the mean
aWkl ;he variance of R,+,t ). sitice the estimated crosscorrelation is a raiidomii varia lle
vih 9 cprecis, value depends upon the particular sample function being used and the
* rri.ular set of samples taken. The mean value for Equation (2.S) and (2.14) c,'m be
,:,.;rputed as fRllows:
14
6

K-1
E [R.,j(n)j E[ -i-Y (kL) Y(kL + n)IK=
k-I
E [ P'k)YkL +it)jk-0
K KRW(
Tr,11-. the exrccted valtue of the estimate is the true value oftlie crosscorrelation function
anld is an unbiased estimate of the crosscorrelation function. The variance is denoted
as
~ ;fR i) E R,=, ni {~ ) R, (it ,2
E~ R~u~ -2E R.,(!i) 1?,(n) I E t- {RXY(/t)
K -d I
K-I Kr-1
V~tr[Ry K2 I ~E (jL) Y(jL +n)}XkL ~ tKj='0 k=-O 2l)
* Sizicej and k are diffierent samples in (lie ensemble spalcc. it is icasonable to assume iIhat
dhey are statistically independent random variables when j -* k. I lence. Equation (2. 16('
becomecs
EII VX~jL)Y(jI, + ni) I Y (kL) 1kL + it) } EjXIK)AL+ it) }2=k
R*xA .V

E 1( X(JL)1'(L + n)) 1(k L) Y(kL + n) ) I= ELX(kL) YIL + n)] p2 k2
where A is thle crosscorrelation of 'P and P~ while B3 is thle square of the crosscorrelation
for X' and 1. Using this result, the variance leads to
i 11i R,(.11) K, =- I + ( K K) BP-?
_.1 -B
K
h"r~R(11) C2 = - ) (2.17)
where ~)is the true variance of the product of the randomn variables X, mid Y-..
An intresting phenomena takes place when tdie time goees to liniiy. IL Ii Ca'e.
Xi Anj and Y(ti) are zero mecan random variables, then
Therefore,
T2P
This means that the variance of the mecasured crorscorrelation approaches ai COW;U1tdf
vaUle as thle time separatjoni uocs to inifinity. TlierefIore, the resultant estimated cross-
correlation could be thought of as
kR1,1n) = R,1? ) .(1) 2. 19)
v.hlere. 0)(m Is the estimation error wvith unlit varI-ince. I lowevcr. this OF:-, cat N- ieduced by iticrc.xsizu thle number of' samprle poits, since the varianice is iorrmi. *cd by
tis number.
16
0

D. SYSTEMI IDENTIFICATION USING ESTIMVATED CROSSCORIRELATIONFUN CTI ON.
To measure thle input and output noise, somec kind of measuring device must heused. Thercfore it would be reasonable to think that tie measured sequence results fiorn
a convolution of the sequence to be measured and thle systemn response of the nleasuig* device. This is illustrated in Figure 7. Therefore, the measured crosscorrelation function
is R ,(t) rather than R,(1).
R,. (: J p( i)Yq( + z) (Ir(2')
where.
.1"t) J (a)X~r - a o(.
1,14(7 L (AL) I (T - P') dg
= q~r) (2.127)
Substituting Equations (2.21) and (22)into Equation (2.20) yields
R (11) E 00 i'(07)X(r - 0) do fl:- q(mjv(r +t - m) dpdr
.1? Jr(o) f~~~ r - ey)y( r +I - p) dr q(p) dpa
11a-x f2'ji'b jxP(t + '7 - Ui) + "/) dz q1 p) dJuda
Rl,,,'t + (7 - u')q(;') dpdoy (2.2,1
* Sffl.e the iner inteeral of the riclht expression in Lquatiun (2.21) is ilhe consolution 1be-
tween R,,(pu) and q(IA), the equation can also be denoted as follows.
0
17
'OKI I

Noise source
I Linear systeMh(O)
H. samc)i er7otf!)
.18

R~yq1 =J (,T) J~ t + a - Ai)R.,(u) e4pda
- J p(a)q((t - p) + a) dia R.,-(t) dg (2.24)
= Rpq(t - 1A)Ry~(p) dip
Therefore, the resultant measurcd crosscorrelation is
=R~r,,) R,(i) * h/iz) 12.2 5)
h(t)(I
%%here R, (t) is refierred to as the system crosscorrclation in this thesis and has the sanhe
role as the autocorrelation in Equation (2.3).
Since thle Iineasuremlent of' thle sysicni crosscoi relation is pterformcd -xsidiour die rxr-
-et it should be an even function if thle responses oi' the two sainpling systems of' theDPO are exactly the same. [In fact, tile responses of the two channels do not have exactlythe same characteristics so the test result of the measured system crosscorrelation halsan almost even shape, as expected. 1This wvill be described in chapter 4.
The Fourier transform- of Equation (2.25) results in
S, Wcf = Spqv 0y/= SPqtf) S.l) IN() (226)
= Sxf,() 11(1
which satisfies the crosscorrelation theorem.*To get the inipulse response, R,,,iI() must be deconvolved by R,,,,(A) -1 herefote at
least two measuremcnts must be perl'ormcid for doing time deconVolutionl:
*RIfl () =Rpq,(n) R,(n) (2.2-)
The power spectrums of Equations (21.27,28) are
19
Sisn

Sx ,q(k) = Spq(k) S(k) (2.29)
A A A
=.,;,k) = Spqt(k) S.,(k) HI(,) (2.30)
Then, the frequency response of the system is extracted by dividing Equation (2.30) by
Equation (2.29).
-- q ls, ,(k)
S 7(k) Sdk) 11(k)
Spq(k) S.jk)
However. this firequency divisiou must he compensated since th e estimatecd cro;s-
correlation function is corrupted by noise, as described in Equation (2.19). so thar. 0,c
power spectral density is biased by the noise power. 'Ihe technique used here for nois
compensation is known as Riad's Method. The "optimal estimator" prescribed by Riad's
Method [Ref 101 is
A
A S(k) S',(k) (2.32)
Is.,,(k)I + I FWX
where IV, represents the average spectral power density of the system crosscorrelation
function:
Ti . / - , '(k) (2.33)k=)
The parameter A is denoted as the smoothing parameter and establishes the lower limit
of the denominator, hence reducinmg the noise eli~ct on the computed target response
when the input signal spectrum is small. The impulse response is derived by perlornming
an inverse Fourier transform on the target frequency response
2
020

h(n) = F_ f 11(k)) (2.34)
Another important point to keep in mind is that we use an FFT algorithni whichhas quite dilfferent properties From the continuous Fourier transform Ordinarily. whcnthe FF1' is used to estimate the frequency response, windowing is perflormed to smooththe result. However, applying a window interferes with the circular convolution prop-erty. Therefore, in this research, we will not apply windowing before perforn-hig theFFT algorithm. Instead of win'JowiL,. tile crosscorrelation function R 1 ()will be "zero
padded- to avoid the wrap-around problem which conies from tile Circular con1VOIlioproperty.
21
Ft A PU S'%' .wm mmk

111. BASIC EXPERIMENTAL CONFIGURATION
A. DESCRIPTION OF DPO AND ITS MODIFICATIONTo meet the goals of this thesis work, an ultra wide band noise source and a dual
channel sampling device with high sampling rate and precise synchronization must beused. A dual channel synchronous sampling Digital Processing Oscilloscope (DPO) anda broadband noise signal generator were used for this purpose.
The DPO is not an ideal samplingi device since it does not sample at a rate exce--ilh,:the Nyquist firequency. Even though the sampling rate of'the DPO is measured in MI liz.it can display a periodic repetitive signal having up to 12 G1Tz in bandwidth w rear-ranging the actual low rate sampled data using a display buffer. t lence the signal dis-
played on the oscilloscope looks like it has been sampled at over the Nyquist rate. Thesampling technique of the Tektronix DPO saimpler S-6 is illustrated in Figuie S. 1 lteTektronix S-52 pulse generator produces a last repetitive pul,,e tain. A time limitedoutput of a lumped network can be displayed at an apparent sampling rate execeding tie
Nyquist rate by using the S-52 to drive the network. This is shown in Figure 9.
However, this property could not be extended to a non-repetitive signal since thetechnique does not reconstruct the original shape of the actual sequence by rearranginethe sampled data after it is taken by the sampling head. Consequently. we could notutilize the virtual characteristics of repetitive sampling of the DPO lbr this research. Thebroad band noise generator has about 13 (3Iz bandwidth which is far beyond the singleshot sampling rate of the DPO.
Using the measurement method 2. as described in Section 11.11. one of the signals tobe measured is manually shifted through the required sampling interval. The measure-ment process treats the data as samples of an cnsenible space rather than a time se-quence since our intention is to compute the value of the crosscorrelation of the shilltedtime diffcrence. Under this condition. th-rc is no restriction of the sampling rate and theDM(O can be used. There is. )owever, tile need of an additional variable lelav fbt ti-n
ilon one channel to make the required time shift. Ibis flinction is carried tut usim: the"Delay" knob on the chantcl 0 sampler.
22
0r

I----
I ~
:1
I I
*
j ~
I Iii.3d IIU- F,
-----I- I
__________________________ It
* I* I4
S
0
Figure 8. The Sampling Scheme of the Tectronix 7854 DPO
0
23
0
a a * -. t *

A. A portion of a rectaingular pulse produced by the S-52 pulse generator
14LMOER-OF SAMPLE POINT :256
UPA)EF'RMSAP : 2456 PTS.RtS : 39.859 PS.WN : 9999.104 PS .MOiX : 0.169 VITMH : -1.8E-3 LiLT 1256DYR : 8.17 LiLTMiS: -0.003 ULTAVC : 190 TIMES
B. N-1odified pulse filtered by the DNI R005 bandpass amplifier
NMtBER OF SAMPLE POINT :256
AUIEF 8P"SMP : 256 PTS.PES : 39.059 PS.WINH : 9999.104 PS.M fAX : 0.98i YuT
t'Th : 1. 244 Vi.TS. IAS: -0.32 7-" LT -AUG : 100 TiMES
Figure 9. A Pulse Signal and Its Con'olved Output by a Linear System
24

This delay knob has a 10 nanosecond delay range which is enough for ineasuring thle
crosscorrelation function for the small targets that are used. Assuming that thle band-
width of the sampled signal is less than 12 Gllz. the required sampling interval is
T,=_L= 40) psec (..
where, according to the sampling theorem,
f,=28-25 Gllz 02
To obtain this type of resolution oin the delaty, a 14) turn potentiometer was used instead
of the built-in one turn potentioineter onl tile 1.) nanosecond delay knL'h1.. This
potentioimetcr hias a 11%be thousand division scale onl its face kvithiin the ful~l raiwe of its
delay. This modification is illustrated in Figure 10.
During~ the laboratory measurements. it was fountd that the actual ie deliv 1wast
0 not exacilV. hillea rlv prop~ottional tothe delay reo-Jing. Aptnllitr. ,u l al
was then used to miark thle value of' the readinL: corre'pondizig to each tinio J'2!ay. A
sainple lpoteritiomneter reading table is shmown inl [ieure 11. Although the actual kcluy is
dcpendent upon thle potentiometer reading table used with each measurement, a reading
dilrerence of about 3.0 represents approximately a 40 picosecond delay.
To create a potentionmeter reading table, anl additional measurement using thle pulse
source was performed prior to the noise-source measurement. Atf-ter creating several such
tables, it was revealed that the potentiometer reading has about ± 3 picosecoild reading
error due to misreading and the line-width of the displayed pulse when it is performeon 20 picosecond per division time scalc. This is illustrated in Figure 12. One factor
which increases this line-width is the jitter noise. This reading error increases as tile timne
scale increases and makes the potentiometer reading table next to useless. Thrlmlc. it
linear increment of the potentiometer by 1.5 is 1 ISUallt acceptable if'1th1 totdl timeI Wini-
dow to be measured is over 2W0 picoseconds. Ini suich a case the measurtement a.n be
pcerlbrued usinga a 20) picosecond per division tliue scale.
Another problem encountered during~ the lab~oratory work is a scaline d11'l-rCnce of
the s;ampling interval of the two channels as well as thle drift of the samlpling frlme. A
coniparision of (X - ))on the 21, psec. div. and 14) msec..div. is shown In I-Igule L,.
Looking at [igure 1-1. we see that thle upper part has nokse with a consftant cn~elore
while the other demonstrates a noise with a consistently growing envelope. Theriefore.
25
MA0nb

it would be reasonable to think that tile source of the noise Hi) the upper figure comesfiom the jitter noise of the two channels due to the random sampling time error whilethe other includes the jitter noise and a scaling difference of the sampling interval. One
possible source of the :caling problem nfight be come friom machine accuracy. So, if thetwo signals are aligned at one position using the potentioineter delay knob, so that thesubtracted signal at the point shows a minimum envelope, then the error caused by dif.ferent sampling rates grows with increasing the time diflfrences from the aligned point,producing larger error in the envelope. Therefore. it would he better to sample the dataon a 20 picosecond per diviion nominal Value Ito nfininuze problems introdued by thedifference of sampling rates.
During the laboratory work it was found that the images of a pulse signal as dis-
played on each of the two channels was gradually drilling from let to right with difleriuv.velocity. This drift problem might come from the thermal inconsistency of the DPOsiuce it can be reduced by warming up 1or about one hour. However. the elfect still rc-mains. This problem requires completion of the experiment il as short a time as p, i-ble.
B. NOISE SOURCE GENERATOR IIARDWARE AND 11S DEVELOI'MEN"A model DMR-01)5 broadband noise generator was used for this research. This
noise source includes a noise generator and two cascaded broadband amplifiers, each ofwhich has about 20 dB gain with a 13 GI lz bandwidth. The system output is approxi-nmately 40) inV in rms value and the voltage histogram resembles a Gaussian distlib-ution. The block diagram, the firequency characteristic, and a sample recorded outputof the noise source are illustrated in Figures 14. 15, and 16.
In the laboratory it was round that a frequent change of the physical environmentmay lead to electrical inconsistency iesulting in output fluctuations. A little alftcr be-ginning this research, one of the two amplifiers used itn the noise source fluted and it wassent to the manuflicturer to fix the malfunction. After the amplifier was returned to
0 NPS. an aluminum support was attached to the noise source to avoid further rroblcm.The sUpport also acts as a heat sink. Thereafter. a consistent noise output has Kcn
produced.
5. 26
0
-4, #. ~'

I
w
0V
S
6I'
1%
4
I'
6
Figure 10. Modified Tektronix 7S54 DPO
627
I'
q
I,
a'
6
- V

POTEN'TIOMETER READINJG TABLE
Test I.D. DateN u m b e r o f m e a s . F i len u m b e rNumber of samples File number
Neas Seq Delay I Pot. Remark Mas Seq Delay PNo. No. (psec) Reading No. No. (psec) R
1 33
2 34
3 354 36
5 376 38
'I---!------------- ----------- --------- --------- ---- ---- ------ --- t39
II.3 40
9 41-91 I • 411I 42
1I 431.2-1 44
--- -- -- --- -- -- -- --- ---45- ------ -14 .. 46 I--- -- -- -- ---- -- -- -- -
116 48
A, 4 4918f 5019 5120 52
254
Figure 11. Potentiometer Reading Table
28*•.

lMBER OF SAPLE POINT : 1624
UM)EFOR"9"P : 1924 PTS.RES : 9.195 PS. M psec.,Idiv.HIN : 199.68 PS.
- Ni- : 8.971 ULT - _W_. .IIH : -8665 ULT 1924DV? : 0.136 4LT9IAS: -9.893 iLTPAIG. : 10 TI"ES
~Sline-width a 4 psec.
, Figure 12. The Reading Error Due to the Line-width of Ramp Signal
29

A.(0 1dslydo te2 sc/i.%no
A. (X - 1') di.splayed on the 20 psec..idiv. window
*Figure 13. The Effect of the Difference of Sampling Interval
03

1%31
....0... ... MO

IC
/ -I " - - -I I
Ii N. " IC
4.1)-\ 1I -__ II
00
4. Figure 15. Frequency Response of an Amplifier of the Noise Generator
2"32
10U
-I*'9
rf L
NCIn

NUNSER OF SAMPLE POINT :4896
WAMPORM54Z PTS.:r PSEC.
SP-CTRUN
E2se GHZ
4~9 PTS.
SCALE: 0.2 VOLTMEAN : 0.0890599765625ViAR : 0.8122109742944
* DYtI.R: 0.64844
Figure 16. A Recorded Noise Signal
33

C. SUMMARY OF THlE PROBLEMS AM) SOLUTIONS FOR THECROSSCORRELATION MEFASUREMIENT
The problems for thle crosscorrelation measurement and thc solutions described soCar are summarized as follows.
1. To produe a noise Source with consistent characteristics, an alumninumi heat Sinksupport was attached to the noise source.
2. A sampling rate lower than the NYquist frequency and milispositioning of' the nioieadded to tile channel 0 (output measurement channel) forced use of the measure-ment method 3.
3. -The scaling, ditference oftlhc samipling period nf thei two c:tnite11ls leads; toip ithe data cm the 201 picosecond per diiSioll tille SCale to inimliize tlie Clet.
4I. The drift of sampling frame requires at warm up period of at least one hour to teachthcrmal steady statc and then to perform tile measuremlent as last as p ossihlc.
5. To perf'orm the fastest measurement, a 1.5 reading ditkrcc of the Potentiometeris linearly increased regardless Of potenltiomelter reading table since the experimenctreveals that a 1. 5 reading difference of thle poteLjoliicter makes a 2( ic ondt:iav with all'ordable error which can be coinpronilsed wXith iaChilie pi CCI*';10UII:11),vhuaal readin2 error.
0~o n..ISO. it is re11co1iiuneiidcd to peillorni the~ experlicna a', qui'.kl :.s pos.4ile tor2 aethe Jata rraiisl'tr Ltle. ,vich is plroportionzd "o [lie mbe-1"r ol, the san~'(It eabout 8.5 seconid 6or transt'erriii- a set of' 1024 samples ef data.)
17ollowingl theCse guidelines, about hialf an hour of mecasu-remnrt timne is needed For 641Point by 2 sets of' 10.1-1 samples tvith an additional one hiour for warnling iip the syste-iiwhich will be the best condition for the crosseorrelation measurement under the curret
laboratory environment. I lowever, the drift problem still remains since at least one-hialf'
hiour is needed to perfocrm thle experiment.
Finally, detailed tests revealed that the systern crosseot relation at the peak point hastiiC valuie of* about twenty timecs tile peak-to-peak value of the error noise. 'I his is 0lri~-
trated in Fimcure 17. Therefore, if the value of the original crosscon elation dropl- downisitmiicaitvthen the error noise will dlominate the imeasured si-nal and wvill Make tl~k:
crosscorrelaition method impossible to use.
0
34
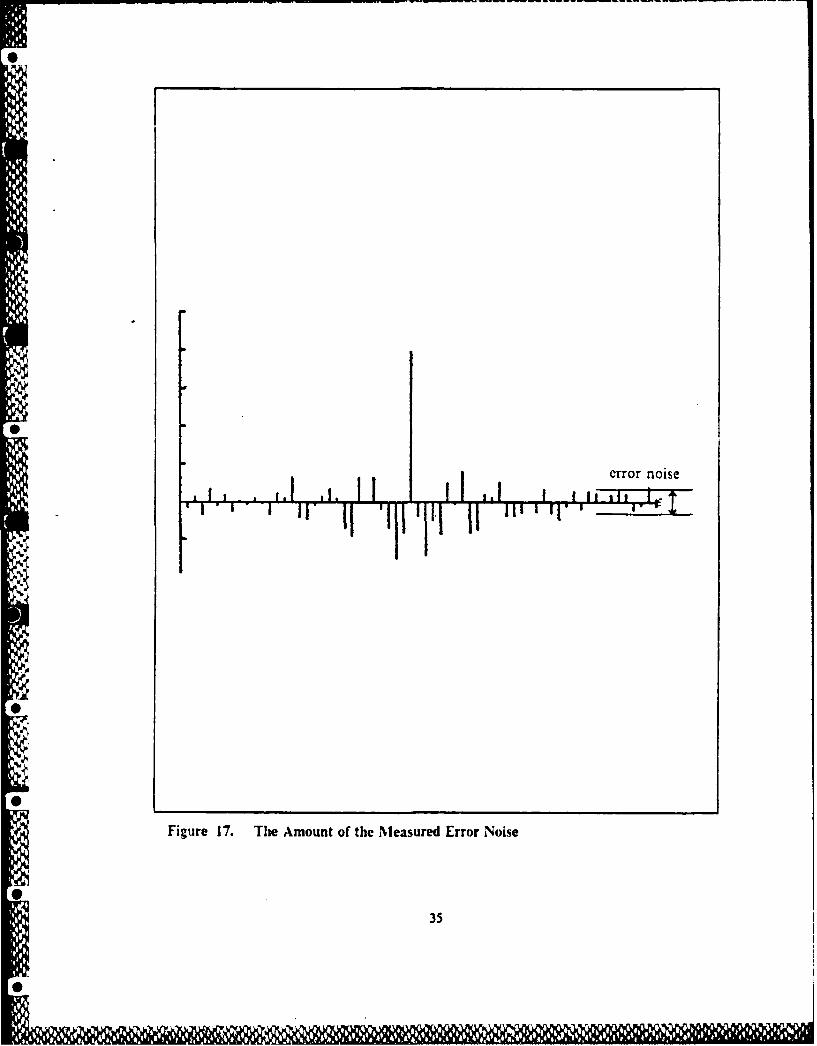
111111 1*' ~error noise
Figure 17. The Amount of the Measured Error Noise
35

IV. CALIBRATION AND VALIDATION NIEASURENIENT
A. INITIAL TEST OF SIMULTANEOUS CHANNEL SAMPLING
1 he most important and critical role of the DPO in this research is in simultaneouslysampling a pair of time functions which are probed at the input and the output port of
a linear system. A useful validation test for the simultaneous sampling characteiistic is
to subtract the signal from one chanIel (X: ilput seqIence in this thesIN) Isrom the oth,r
nticl (Y' output scquence). This will be di~pla'*d on the DI'O screen 1% u sng t!;e
built in "Add" and "Invcs" functions of the DPO. Using the manual delay knob. the
imniue of the subtracted signal can be nuninfized using the simultaneous sampling posi-
* tiut .. Thle potent it. er reading at this point (it must be the n = 0 point of the s11 .teiu
crosscorrelation, R,(n)) has a value of about 200 indicating that the sampling channelo Output channCl has a time delay of about 2.7 nanoseconds less than that of the
ch renal 1. This is illustrated in [lire IS with a coxnparivon with the original input 'c.
Looking at the Figure IS. the left part shows a nose M1th a cmtisistett cnvclO'tpe eI"
small variance. 1 lie source of the noire on the left Iiguie comes from the jittet noi,;e ofthe two channels produced by randorm sampling tim errors. Assunling that the envicl-
ope of the jitter noise is proportional to the time derivative of the source signal itself, thenoise source signal must have more variance of its jitter noise vis-a-vis the rawiip sou'cosi-nal. This results since the time derivative of the ranip signal produced by IPO is
much smaller than that of the noise source indicating that the noise signal is more vul-nerable to the jitter noise than the ramp signal. l-his property is verified in Figure 19.
13. CROSSCORRELATION OF TIHE DPO SYSTEM..\s described in Section ll.D. the crosscorrelation between input and output is -ot-
* volved by the crossconelation between the impulse response of the two sampling heads.
I he discrete version of eq.(2.25) is
.,,,I) = itq ) R :..J )
0w = ~,,I RXA') R," h(n)
-'. ."~
0
36

A. Channel I - Channel 0 B. Channel I
SCALE: 0.1 VOLT SCALE: @',&,VOLTMEAN : 0.8389273929125 MEAN : 06. GUM7%ft8
*VAR : 7.428921318E-4 VAR B.-,1O6?9S5135EM
Figure I&. Simultaneous Channel Sampling Characteristics by Subtraction
37

A. Jitter noise of the noise signal
B. Jitter noise of the pulse signal
] Figure 19. Jitter Noise of the Noise and the Ramp Signal by Subtraction
i3s

where.
kXR ,(n) am Rpqfl) *R1(j) (4.2)
I lere R,')is the estlination of the systemn crosscorrelation and is cornvolved with the
crosscorrelation of the sampling head and the autocorrelation of source noise itself. To
approximately measure the system crosscorrelation. we simply feed the same input signal
to cachi sampling head, as illustrated in rigure 2).
In the ideal case, each sampler system imipulse response. in anid Oifl. miu.-t have the
sanie shape, and at best the unit impulse response. Although these two iniptlse re-
sponses are not exactly identical. they will in reality be very closec to each other. Coive.
quently. the shape of the system crosscorrelaiiori R. (it is close to. but not exactly. iti
even function, while the autocorrelatiomi of the source noise R,(n) must be even.
The initial measurements were perf'ormed usirig a 2.5 picosecond ganipling I-eti'dA to
* ~ ~ ~ ~ iet a more detailed timec shape uh' the system crosscorrclatiozt. Subsequent c'rmuet
wcte performed using a 11) picosecond sampijling~ iteval to sce the cmiiie %hape of' ri
svs tcni crusscorrelatiomi. Frigure 211 anti .2 show the tc,.t results. As expected, the shiapf!
of the crosscorrelation is almost even, which means the two sampling channels ha--c
smnuflar characteristics.
C. DECONVOLuT~ION VALIDATION TEST1. Test ivitm Noise Source
An Avantek miodel SA83-2954 solid-state microwave amplifier was used during
this validation test. This amplifier has an average gain of 42.5 dB over the b~and fromn 2
to 6 (AHz and provides a 3 dB bandwidth or about S Gllz. The spectral characteristic
of the Avantek amplifier is shown in Figure 23. '1 his amplificr is liiikcd to two 'NI dB
attenuators, since it produces moderate power. to prevent anv. possible dainae to time
sampling heads whichi have an operating range of 5 voils peak. Figure 24 illustrates tice
basic settup fbr this test.
Tro extract the linpulsc response of the Avantek amplifier (2-port ). the Collowinmg
* three steps were followed:
I. Test without the 2-port, measure the systenm cros-,correlatioli.
2. Tes t with the 2-port. measure the crosscorreclation of the 2-port.
3. Perform deconvolution computation.
39

The system crosscorrelation measurement was ierlornied using 64 timce points
having a 40) picosecond increment. This gives about a 2.5 nanosecond window. Muhch is
almost three times longer than the effective period of the s' stem crosscorrelatioln. Theam1lount of tile delay timie interval (.40 picoseconds) IS SWuLh~ently sniull III (his case '.tuce
this gives a Ny-quist f'requency exceeding thle banidrass ii'equcncies of thle Avanitek ami-
plifier. A plot of the measured system crosscorrelation is shown in Figure 25.The bandpass amplifier crosscorrelation measurement was performed using thle
samec tutne points and delay interval. Further. anl Initial delay was given to the chaninel1) In the amiount of-440) picoseconds to compensate for the cllective delay through the
Avantek amiplifier. Tlhe resultant nieasurcd i.ros-scorrelation Is ,iLewt, In rigure zo.
I.inally. thle computation of' deconvolution was performed using Rlad's optimal
comprensaticti technique. A,~ desctribed III Section 11.1). thIis decoMnvo.luion mid od
serves to limit the lower bound of thle denominator and thus reduces the noise effect.
Several Lomiputations were perf'ormed with difiirent mixoothinc fitcturs and finally the
c:I'e Off)'. I w~as selected f1or tile he,;t solution. Aldter the comnputation t(l decon., Qluti 1.
t..enI it2 imp~ulse res;ponse was riovcd 12 1'cinl% to the r-igt to ,ho'v the .r
Zr.pimic iripretatiton. I e0111t i% ililtrated i I-!ieui e 21.
2.Test th Modified Pulse Source*'lie same three measurement steps were performed using the timle domlainl
mnethod described by McDaniel IRef' Q1, The output ramip signal fromt the S-52 pialke
generator was flthered by one of the amliliers used with the noise generator to pt odticca roLugly simlilar power spectral density at the input. Trhis source signal has enIough~
innate zero padding to eliminate the wrap-around problem. Thec test was fi~irly straightforward and the results are shown In Figures 28. 29. and 30.
The comparison of the two methods is s'ivcn in F-igure 31. These two results
Mhave almost the same shape. as is expected. asi de from the tin-c scaling difrerci~e. 'I liecrosscorrelation miethod uses about a 41) picosecond tlime Interval whilc thle time domainl
* me-thod samnples with a period of' 39 picosecond. MhIich Is fixed by thle D)lO spiaces.
Aniother I'at ic that tile result fromi the crosscotuclation mecthod lias imore error noi'-C
power than that cf the pulse miethod. Therefore. the p'erlor11ManLe of the crosscoi rclAio0,
method using the current IJPO appears to produce lower k~tualivy results than that of the
r!ilse methiod.
0
04

Noie enerator
Potentio-meter delay T DPO
3 'cel A w in)
x~~kT [ijer WRU
ComputerI
IR ( n)
Figure 20. DPO System Crosscorrelation Measurement Setup
41
Lol10

Points 128 points
kesolution 2.5 picosecond
WindowY 320 picosecond
* Figure 2 1. DPO System Crosscoffelation Function
42

NABOR OF SAMPLE POINTS :1024 TIMES I
AXIS3 : 129 PTS.RE.S : to PS.W41K I Zee8 PS.K*tX 0 .01g8491K H, -0.005519
DES Q. Q.21 5471 Z
TPER TPU :9MHNI I 41 T OS.ll _ _ __ _ _ _ __ _ _ _ _
PV0.3 H
Figure 22. DPO System Crossicorrelation Function and Pow~er Spectral Density
43

0
0X
+L
t 1.
Li C.
rimure 23. Frequency Response of the Avanick Amplifier
44

Noegenerator
X(t) yt
* Potentiometer defay* 1CM samD!er ____________ aIK)3mple
Trigger (kL)
~~kU (kL4-n)
fl(kLU-y, (KL-n)
Computer
I'~~ ~ (n)
0Figure 24. Noise Deconvolution Validation System Setup
45

S1
HU"BER OF SAMPLE POINTS : 1924 TIMES I
Qi;kEFORMMES : 64 PTS.PES : 40 PS.w iN 25-)o PS.MAX : 8.916874I n- -0.005146rYN" 0.02292 1 1 it fill. 82
SPECTRU 11nES : 33 PTS..PES : 0.39 GHZWIN : 12.48 GHZ
f-APEP FCT. : 0HANNING WIND)p
* Figure 25. The System Crosscorrelation, Crosscorrelation Method
46

N~UMBER OF SAMPLE POINTS : 1924 TIMES 1
WAVE.CORMKES : 64 PTS.RE-S : 40 PS.141N : 2560 Ps.M.~ A 0.015661 1-oloKIN -0.0130131LW-N : 9. 028674
SFECTRPNM ES : 32 PT:3.RES : 0.3q CH7
MAX: 0.11?TAPER FCT. : e
Figure 26. The Crosscorrelation or Avantek Amplifier, Crosscorrelation Niethod
47

NUMIBER OF SAMPLE POINT : 64
WAV.EFORMI SPECTRUM
ITT WITHTARG~ET
TAESO
SIP 64P- lP 3PS
t'YN. : 16RTT PTS " . : 32
0~ ~~~~~RS Fiur 47. TheC SRste Repos of3 Avne Amlfe.Crsc.eto it
WI.:26 SC I.:1.1 H7
48

NUMIBER OF SAMPLE POINT :256
IQAaEFeOflSlIP : 256 PTS.RES : 7q. 059 PS.WIN : 9999.104 PS.MAX : i-986 ULTMINI : -9.252 VLT 1 5tDYN : 1.244 VLT
* 1IAS: -0.32" VLTAUSG :100 TIMES
SPEC TR UMFSHIP : 125 PTS.RES : 0.1 GHZWIN : 12.9 GHZM AX : 9. 'B6 4 VJL T
Figure 28. The Modifled Pulse Input Signal, Time Domain Method
49
11011

MUNBER OF SAMPLE POINT :256
WAVEFORMSliP : 256 PTS.RES : 39.059 PS.WN : 9999.104 PS.A A-PrAX : 0.643 LiLT11 wHuN4 : -0.775 LILT 1 ;2-56DYN : 1. 417 kJLTBIAS: 0.068 LijLTAUZ : 100 TIMES
SPE~CTRPUM'SMP :12 9 PTS.
MA~X :6.08?( VLT
* Figure 29. The Output Signal of the Avantek Amplifier. Time Domain Nietihod
so
i01111R1

RUMBER OF SAMIPLE POINT : 256WAUEFORM SPECTRUM
TEST WITHTA~RGET
* TSST WITHOUTTi4ET
T AP G.E T* RESPONSE
SOMP. :256 PTS. SHP. : 129 PTS.PES. 39-.e59 PSEC. RES. : e.1 GHZ.WIN. :9999.104 PSEC. WIN. : 12.9 GHZ,YAX. 0 .318 tLT. MAX.. : 2.8188 O'LT.r-1I N. :-8. 387 tiLT.r)','. :. 9.74 liLT. SMIOOTH FCT. : 0.1
0 Figure 30. The System Response of Avantek Amplifier. Time Domain NMethod
1 4 1

IMPULSE RESPONSE
* : NOISEo PULSE
V
+ t +
to ,0
SAMPLES : 64 POINT.RESOLUTION : 40 PSEC.WINDOW : 2560 PSEC.
Figure 3 1. The Comparison of the Tuo Methods
0

V. ELECTROMAGNETIC SCATTERING MEASUREMENT
* A. DESCRIPTION OF TIE SCATTERING RANGE
To derive the characteristics of the noise source impulse scattering response meas.
urement, a physical environment and equivalent model for the scattering range should
be developed. Since the scattering range was already described in detail by Mariatequi[Ref. 8 1, and McDaniel [Ref. 91, only a brief description will be gien in this section.
The general physical environment of the scattering range is illustrated in Figure Ia.
As shown in the illustration, the system can be divided into 5 parts.
1. Anechoic chamber
2. rransmittin, and recei ing antennas
3. Br',adband analog noise generator
4. Dual channel sampling dc ice (DPO)05. Signal processor and controller (TFektronLx 4052A desktop computer)
* ,,. The purpose of the anechoic chamber is to shield the incident and scattered
waveforms from external noise and interference effects as well as multipath contain.
ination. The physical dimensions of the chamber are
I. Longitudinal length : 20 ft.
2. Lateral width : 10 ft.
3. Height : 10 ft.
To provide shielding from atmospheric and man-made noise, the chamber is
internally covered with aluminum panels which are earth grounded. A special absorbermaterial manufactured by Rantec, a division of Emerson Electric, is attached to thealuminum shield to absorb the clectromagnetic radiation. This absorber is ridged along
the length of the chamber to guide the incident wave to the back wall where the most
of* the incident and guided electromagnetic wave is absorbed by IS inch pyramidal cones.
Eight-inch pyramidal cones are attached to the front wall, where the antennas arcmounted. Tihese absorb back-scattered radiation and prevent reradiation of' the
electromagnetic wave. This material is designed to provide back-scattering attcnuation
of a 5) MIlz signal by about 34) dB below that of a flat metal plane. Reflection coclfi-cents are increased to about -12 dB at I GlIz for near grazing incidence on the side-
walls, floor and ceiling. This leads to a realistic low frequency lriutation of about I Gluz
due to the resultant multi-path interference.
A stvrofoam column is used as the support for the various targets in the chamber.
This material has a relative permittivity of about 1.1 at 3 GIiz so that it gives negligible
effect (reflection, refraction) to the transnitted wave but provides a stable support 1br
the targets.
Two double-ridged horn type antennas are used for the transmitting and receiving
antennas. They have a usable bandwidth of I to 12.4 Glit and have a relatively flat gain
over the band.
The broadband analog noise generator, DPO, and the Tektronix 4052.\ desk top
computer were already described in Chapter Ill.
B. DERIVATION OF NOISE SOURCE IMPULSE SCA'ITERRINC R;..SPONSE
MEASUREMENT FORMULA
Since the goal of' this iecarcl is to validate the crocscprtclation nea:urcrcn,1 bcontparing the inr,lulse scattering response result with that from the time domain mea -
ur,:merit. a simple sphere was choen for the target.
An equivalent system diagrain for the scattering range is shown in Figure 32. 1 icre.
the impulse responses are
1. h(t) Target
2. h(t) Clutter and antenna cross-coupling
3. h.(,) Transmit antenna
4. hij) Receiving antenna
and the signals are
1. x t) Transmitted (source) signal produced by DPO
)2. Y Received (back scattered) signal
K...(kL) Sampled transmitted sequence
* 4. ,',(kL + n): Sampled received sequence
5. :01) Stored sequence X - Y)
6. R.,4(n) Crosscorrelation output
* Compared with the discussion in Section IV.C. the system impulse response in the
anechoic chamber is more complicated than a simple 2-port network response. The
4 impulse response of the anechoic chamber is
5s4

0
Clutter and coupling hW
Noise gen~erator x(t)
Comigger kL
-OQ'a+
L4. - - - - - - - - -07
rigure 32. A System Diagram of the Scattering Range
5
h(i) - hAt) * (hAt) + hAir)) * h,(t)
= (h t(i) * ht)) (,/(t) + h:15
M 11,i * (h,(t) + hjt1))
This equation suggests the need of at least three sets of measurements flor extracting the
target response hA:). Using our method, the three crosscorrelations that must be meas-
ured are
Rxl in 1 R,qw) * Ry(t)
I I Rrq(t) * Rj(t) * hA) * hAt) ] * (t) (0.2)
( ,ht)I * h,-t)
R,., () * [ hpl() + h) J (5.3)
,(W a Arq(t) * R(t) * ht(t) * h(t) (5.5)
I lowever. experiments revealed the need of one more background measurement for bet-
ter subtraction of the background noise. This is because of the use of a relatively shor t
time window compared with the dderence of the propagation delays of different targets.
(the calibration target, and real target). Therefore, instead of Equation (5.2) to (5.4),
we use Equation (5.6) to (5.9).
=R I (n) h(tt)2 (5.6)
R. (n)13 = ,k(n) *
R ,n) 2 - [ n) + h(n)2 J (5.)
Vr R- .(11)3 ,( h) ( " )- /.(,) 3 1.
where
MOM

4() Rpq(f) *RA,(n) *h~n) * h7(n) (5.10)
hj n)3 :- 11,(" - 111) 2 (.1
Here, mn is the time delay due to the different measurement time origin caused by thephysical shape of each target. So, the best delay could be determined by the difrereticeof the transit time of the leading edge of the scattered electromagnetic wave for eachtarget.
in nteger {-
In this equation. D denotes the radial diffierence of the two spheres and c teprescnt- thefree space velocity of an electromagnetic wave. *[his is illustrated in Figure 33 and an
example of' this cfTcct is shown in Figure 34 using an I sqI. ft. co1per shect targct forbetter rellection.
Th~e next thiiiiz to do after the ftiir measurements of the crOSSCOIzrClatiOnlI Ois e X-traction of the target response h,(n). This Is peribinied in two steps.
I. Clutter subtraction.
2.Crosscorrclation deconvolution using Riad's method.
At first. subtraction of the clutter effiect was performzed. Let the subti acted result bedcnotcd as
A A A
R21(n) m ,,() - Rr,y.(n)12
= (n) * /z,(n)
The followingl is the deconvolution for extracting the response of the targzet. Thekey point of' the deconvolution is the usc of the calibration target whichi ha&s a known
__ coniputcd transfer ftznction. The Mfie-series program preparcd by rofessor Morg~an
computes the transfer function of the sphere I Ref' 91.
57
0f N WM~i'ti

T r n . n .4 s n r
TRan. Ant.
2D)
Figure 33. Path Differences for Target and Calibration Spheres
59
0O O"

AUMBER OF SAMPLE POINT :1824
MiA4EFGRMSIP :1024 PTS.kES : 19.529 Ps.WN.: 19997.696 PS.-Vw-MAX :8.955 ULT vvVM1I 4 -0.073 V.LT 112DYN, : .1-08 ULTBIAS: 0 ULTAUQG : 100 TIMES
NUMBER OF SAMPLE POINT :1024
W.)EFORMSMP :.1024 PTS.RES :19.529 PS.W-1 N 19997.696 PS. V yMihX : .054 UJLTHM: -e.074 LILT 112V(H 0.12" LILT8A AS: 0 kiTP)G : 180 TIMES
Fig ure 34. Examnples of the Delayed Signal Due to Different Paths
59

Let lI,,() represent the computed transtir function of the 8 inch sphere. For an ideal
, case, the transfer function of the target could be computed as
f1,V) = S" V) (p 5.14
where S3,(j) and S21(/) are the Fourier transforms of the crosscorrelations R31([) and
R21(t). Since we are dealing with the estimated crosscorrelations, Riad's method, as de-
scribed in Section IL.D, is applied.
14k S3 I(k) S, I(k<) 1p((.51S $ 1 (2) + j"
where,
*2= - St,5. (k
k=o
Finally. the smoothed estimation of the impulse response will be obtained from the in-
verse Fourier transform of Equation (5.15).
C. ELECTRONIAGNE'IrC SCATERING CROSSCORRELATFION
MEASUREM ENT
First, a 12 inch calibration target measurement of R,,,,(n, was performed. To esti-mate a suitable time window, a pulse signal was first used as the excitation in theanechoic chamber. The measured backscattered signal contains several constitucnts: di-
rect antenna coupling; chamber clutter and target scattering which is modilied by the
antenna responses and multipath. The target pedestal is located approximately 8 fct
0from the horn antennas.
An additional 7 feet of cable delay line was linked between the transmitter power
splitter and the channel 4) sampler to show the two signals in the same time window. At
first, a directional coupler was selected instead of the power splitter since the directional
coupler tranismits most of the input signal. I lowever, it was found that the directioinl
CoL picr provided a sitilficant attenuation in its high lrequency band. The result of the
alignnent test is illustrated in Figure 35. The leading edges of the two signals arc aligned
06- 60

when the potentiometer reading indicates 195. The time width of the sphere response
was about 2 nanoseconds.
Next, the noise source was applied to measure the electromagnatic scattering cross-correlation measurement. Since the pulse response is limited to about 7 Gllz [Fig. 13.],a set of 64 samples with a sampling interval of 40 picoseconds was chosen to cover a 2nanosecond time interval. This produces a Nyquist frequency of 12.7 GI-iz.
Unfortunately, the measured value of tile crosscorrelation was significantly cor-rupted by the noise and system errors so that it was impossible to use. Since then. the
effort was focused on finding the source of tile errors and on the ways to avoid it.
I lowever, the answer is that, at this time, we could not reduce the error suflicientlv to
makes the estimation useful. In fact, the ight against the error noise for the signal noise
source spans the whole history of this research. The situation in the scattering icas-
urement offers signifcantly less output signal strength than was observed in the initial
tests using lumped filters. This degradation of signal appears to have exceeded the limits
of fldclity needed to demonstrate any viability of the measurement. In short, the results
atppeared as "garbage" that could not be reproduced on any two mcsure tents. Thesignial was essentially buried in the noise.
In addition to tile description about the noise in Chapter I1, the sampled sequence
of the two channels are modeled as
X,(n) = X(n) * p(n) +jx(n) + Q(n) + dx(n) + A,("n) + D (n) (5.17)
Y(n) = Y(n) * q(n) +jy(n) + Q(n) + d(n) + sy(n) + uy(n) + I.(n) + DY(n) (5.18)
where,
1. X(n): Input signal
2. p(n): Impulse response of tile input channel sampler
3. j,(n): Jitter noise of the input channel
4. Q,(10: Quantization noise of the input channel
5. d,(n): Drift (nonstationary) noise of the input channel
6. N(n.): Other noise (Thermal noise etc.)
7. l,(n): DC bias due to the DPO vertical alignment
8. Y(n): Output signal
9. q(t): Impulse response of the output channcl satmpler
10.j,(n): Jitter noise of the output channel
61
0o

SV
11. Q,(n): Quantization noise of the output channel
12. d.(n): Drift (nontationary) noise of the output channel
13. s,(n): Sampling interval scaling noise of the output channel
14. u,(n): Mispositioning noise
15. ,%,(n): Other noise (Thermal noise etc.)
16. D,(n): DC bias due to the DPO vertical alignment
It may be surmised that the poor performance is probably caused from the nonstation-
ary characteristics of the DPO, as summarized in Section III.C. This includes the jitter
noise and quantization noise. The estimation error for a stationary process should be
reduced by increasing the number of sample points. As shown in Figure 36, the error
noise is not linearly reduced by increasing the number of tile samples. This reveals tile
existence of other sources of the error such as nonstationar" noise (caused by the drift
problem) which may give a sudden level of noise that can not be reduced by the opera-
tor.
Figure 36 rcveals that the electromagnetic scattering crosscorrelation mieasurement
for the 12 inch sphere is significantly corrupted by the error noise although the result
came firom the computation of 8192 samples. Therefore, it might be almost impossible
to perform deconvolution under such a low SNR environment unless other ways can be
found to increase the SNR of the estimated value. One such way, which may solve this
problem, is the use of a new generation of sampling devices, such as the Hewlett Packerd
Model 54120 digitizing oscilloscope. This DPO has a sampling rate up to 20 GlIz and
olfers computer controlled time-offsets of its 4 channels. A follow-on investigation will
consider the application of the IIP-DPO to this research.
62
Ml 0' "

Transmitted signal
Backscattered signal
Figure 35. Time Origin Alignement Test of the 8 Inch Sphere
63
0I

NUIIBER OF SAMPLE POINTS : 1824 TIMES 2
WAUIF OR NIIES :8 PTS.IFES :20 PS.WN: 168 PS.M~X :0.09921956089591KIM 0 .036178806942116YN 906393175381r'
-NUMBER OF SAMPLE POINTS :1924 TIMES 4
UAMJEFORMMES : 8 PTS.RES : 29 PS.141 f+ :169 PS.
* TMAX :0.0718456311913PH~0.83929341281
6 H .84155221838t3
NUMBER OF SAMPLE POINTS :1824 TIMES 8
WA&JEFORMtK9S 8 PTS.RES :28 PS.1 H 1690 PS.MkX :0.0603420941451N- 6 .03392;21498138.MRN 0 .020-4199443313.
0Figure 36. The Fluctuation of the Estimated Crosscorrelation Due to the ErrorNoise
064
0

V'I. CONCLUSIONS
A. SUMMARYThe main effort described in this thesis is to demonstrate the viability of impulse
response measurements using a broadband random noise source. An application of thissystem is radar target detection and tracking. where it would offer the following potential
advanta aes:
1. Low cost noise sources arc available.
2. Deception iii radar applications, (jammer or natural noise appearance).
The first step of tile research was to develop the theory of noise source imp~ulse re-
sponse measurements. An analog version of the crosscorrelation was derived followed
,% kdevelopment of the three crosscorrclation nheasuremnent miethods. 'I he thiird Incas-
urceent method (pie-subtracted single chiatnnl ineasuremient withi arbirai11% y IaM~Iiiig
rate) was selected ufter muL1h elffrt in tryinig to us~c miethod 2. The bias aiid varinuco te~t
of the estimiated crosscorrelation l'ollowcd. It was shown that tile estimation Is imbiosed.
ULnd consistent. Finally, the effect of the sampler on the signal as well as thle application
of an optimal deconvolution technique were considered.
The next step w~as devoted to the experimental configuration. Thec chiaractcr-istics
of the Tektronix DPO and noise gcnerator werc investigated. It seems that tile
Tektronix DPO is not the ideal device for this research since it exhibits mny problemsfor thecse measurements. Some of these are the drift problem, the relatively large amount
of jitter noise (about 1,.5 of the signal strength), a sampling interval scaling problem. etc.
An ellfort to minimize this error noise was attempted. Detailed tests were perlbornid. and
it was revealed that the system crosscorrelation included errors in its p-eak-to-pecak value
* of about 1 20 of its mnaximumn signal powcr.
The calibration and validation test were then performed. An Avantek solid-statemlicrowave amplifier was sclectcd as the test itemn. The crosscoirelation nicasiremnents
of thle sampling system and thle Avantek ainplilicr were pemforinied. A smouothied lie-
*quency response or the Avantek amiplifier was compluted using the Riid's miethod.
Then, the impulse response of the Avantck amplier was obtained using toe inmver~se
I ourier tratisobri. I is was compared to results obtained via a dirct pulsC xc.Citation01
measurement.
65
KI
Finally, an electromagnetic scattering measurement was attemped after considering
the requisite mathematical foundation. Four measurements were needed in practice al-
though the theory requires three measurements. The scattering measurement provided
insufficient fidelitv due to hardware linitations of' the Tektronix DPO. Major sources
of error in the current system include nonstationary drift, jitter~and mispositioning.
B. FUTURE CONSIDERATIONSThe main difficulties encountered in this research resulted from the use of a less than
ideal sampling device that could not sanpc sulliciently flast to satisfy the N yquist crite-
rnon. [7urther. it has been reveiled tho~t this samipling device has watiy problemns as de-scribed in the previous section.
The significant payoff of this research mandates that it be continued with vigorousattempts .o _1leviate the hardware deficiencies encountered in this initial ell'ort. T[he use
of a new generation digital processing oscilloscope by Hiewlett Packard is a step in the
righlt direction since this device allows computer control of the temiporal ollset of each
chiannecl with an accurate resolution of' I0) picoseconds. The essentially drift-l'i-e petr-lborniatce. coupled with automated tinic-ofi'sets in the crosscorrelation data acqUliiton.will allow largze ensemiblc averages to be employed with mnuch shorter mneasurement tilics
than have been the case here.
66

APPENDIX COMPUTER PROGRAM LISTINGS
*CA
*WoWft I ac£
*Wow w w-*wCf. 9Q=1 1- .0
*Bw =Cm U00= 01 4zO04 0
I. '2 Ii0 . - I-
*-=J = a = v =w.-ez I. = u a =t
'ww 0- a a Ca~l%0- (% '%Z OS4) .1
0 0 AA 0 M0 a W
0.JA 0 lu f-O 0= -A )waz410 1. 4w, a= > =
.96~~ ".404- ~ ~ = = 3 Ia03 - 9 j=== == - 1 ix ==== I .
ago '5-91 01 9-0' al 99. SEIa9
67 ~ ( (' .

0L
UU
mu %CL a
M Coil
LLD 6-
LU ac J in0-t
*C CLA v-
C9 a.. (D.i ow
Q. La -= Coz .0w I--a~
9. X. s . ^ L
2Z 02= 2 &-x L
I. z^f w'" *ro 3^ L%., M M %e M) 4- <: W
2 db.o 2 . '-
LPZ I-- .- =w us o- b==QZ aL 4WU
i= men" ' a. ~ 0.3M~ Cd 0 W f "toL mww Q0.0tz x& 0 0 atX 2Q&'A ~ Ow 12 IL"& .'amaaz2== Cd&A " I C.9-. 9.2
69.

WI0
acJ W 0LI
'/) Ia Ol o , L
4M W -= a .~
VISI
CP CD, im -
OW~ wW rtN-NtN o OMM
696
a ,Iowan

0w
C-)
99x
I- IL)
477 x
=7 .5 W
*U aaZ2- 0
LA 30atC 6
(4 E at I- C4.uWIIA C = ~t
z- LLax 9"9-- 2
= LL = = us0. Il 0 . f
S -L" L"S;*JI CD IrA a. - u
z~ = =, =AQ cow EM 0- t-.
60 w IMD -,A t*ftis- CD!* so-6vI40I D Dt p Wlb f f aIWE l 6wZ m .~~~~~f Wig9 ~. l
Ii. E - ~ 9 Q70
il EM EM

00
4* so
40,.
4z - j
4z w-j = . 0
* . -0 a W. *. -*~ *j CLa~ 3
46 0 I - CJ. = C
40 1- w i = ~ -jcc Ca
4* 0: u- C. = s
=. -. U6 = EM. 00e - ADUt4* Q. LU ac-. (D*0 1.- w w~ 0U WOO
4. ~ ~ a =Z~M .. J L
Q -L £h. as Mae
*~ Im 0-s W U IJ Z
doo aambs ma wwtaf mamodw 00o mes- LNfl'm 0
4. so wAwv04kf00f-q4 " -" p .
* ~ ~VI&.~ (flj~ .) 71

0. * U6
a2 (Drq aD I.==o .4Z D M wo2% C ll0 - 3lk - - MO34 %
40 4b l2'2op * -
ON ̂ els- 1% .0. t.j9a-O
lil 0 ". 200G .
0- It ~ N'" *u N*u 40 0) 9-'. (2 w's-0
-I= =A =Mammadc
r. Ga- lill- ala. WIN &I% x on..
9-3 ~ZN ALa~~W~i.Z0WW W Li..~72

%
4406
SO -
%. S.
= P = =
*- 42 - 11 4. Z
00 Xw% " A
L1 -0 1 Z W 62 0.
W 0 =:C x .-:411 *- .
40 97 - 9- 22 =.Qc *W
40 u -. ===2 0= I=<:9440 - 9 0 x L NO . 1-0-1-a
= A MA .. --
We 44 t. Id02Mo ) to rr w vww
'0098 afti) Wm
w n .r 073

WI
'-44
In.
0.d r r* 0 CAC
-LU m
40 4*I-.IA.
741

00
4* (
** (
- C
LA 2 Ia" 0 N* w D CDC'W. =. zo 4=V -- 0 CD C
cx o0 ' 0 = .. '-. IM04Z X XZ .0 qr I- r =% !\qr ovo
-. 1 0 --
4Z' of w~ 0 If =-IX X= '7'b-M . - It 4* a*
4Z. LA Z-ZCaM X L r L *-'W - -X.JW 4* '- 1.'..'.
4* (Q. N0 03 O .m &4000 4*
75

0qx
S.A
a .
CD 0 r~j -J 11 -.w 07U(A LAf==- . LC LL
12 IL CLw
CD 0 Lo, 2X92 %
No L. o. sel ow 60'F~ *M0 - mSel.w 0nW Co IM7,0 13 A 0.4
W 0 0 OX 000 LE Sell0,o 0 0 'Z si o.o. in.w w
wo W4* See CI-
40 LA. A 4
0. 0-4 o z 4 Ir00.4 006 e - "0- e e e s
af Cb*A& ve. Odo wowoof.-gN'. 10 £53 335 v nr6S35ULwe$3 "
(D'0 do0 j ;m 0 t
I 1..M~n It 3l I I !111i
~ o.~,,,

IN0u
-.. Q*11
W La*
Q a-~.
4* 4zI
4* I xu. = P
=*- c -::z
LL. w1 Ck
X* e- 0"
LL. IL tlz C d4*LU lz 4z cLU# M - - A9
2- a i*C#j - dmAIT.<C =2x4o - t- - * 4
x .. 4* 9- = == =I.- L CD = 44 4%J *X= z a .4C
W Af-t' o 0 0
4* =. 606- I-o
IW* 1.- 0.- 1-- 01 1
A c 0.. 04 .M -isJ CDOm4w m- c% - rVIlb , 0 I-V' 10to
%IJI me of-'C 0I C% As (IQ" M0M r r4mnmm
0 I- Cd77

16-
6"
I-o -
CD C
j (a - -C4z I- caaI-a A=.
P. c em4aW4z &ZaW 6.
-1 4*I .W.0- Q 40 '" i-
n WF L-= LAC . 0 __
= &Z 4* i z -ixCa.. -'.-. = a . C fd C4'W (A a. 1- 0)l sou ujQ I FC
W a =- C a MaZ0ri= -L6.
Na so. COa a 0 4I-- 4 ? - 1-- 0-1 -%-0 M WI-1- *1-W -L j
C. 0 a = "' .- U N? -J --
4? 0-. Ca CaO 0(0W rm , III w '041 voatl' tow 0- PU- P51K:,NNWI M
79~
00
CL -L2 %. w)z C
4z w 0
w II
I- aM
LLa ItX.
ow L 2 0 .1 w ^ *(A +. m A- - 611 m
CL CD, to. N~ *1 0. ,0"I
CD =L*~~~o -J = = Nc ="41.zI ~- aac m~0 C ~ 4 4FI-Iw $71 n.. 0 a-WLh 00
24-0)so ID CD4. J ~ UM* M'J "M.m MZN M-*~jm- mgmMm mrim*3 ,.:
~ -''... ~ a 79
LUIr.j
LLU
LUI
a))
vi)i
LUi
= = ZN
a.6 w. v."~qCL ~ - 1- X4"w .
IA C__6_b12 6
Wam N a- z wu-to X= .. 1.J a~ .a
N i M= AA .a- =#Iw %. 6---
+ * LV a a OU -
0.. - 1. to- 0 ~ I mc Z Ia0 Q
OZI NO -Z .4 -- a ~ o. -Lal
00SiQIw 012 N "(Z I~ A t' I %A' MIM
.~.s S 3.~.S U. 90 ~ I~ ~'C

CD ac_j _j
ft W*7c;; jM 0
I-== 0670)b *== -Vc3X) C- U IJA9LZJ x r
I.- %, W -.
40 a. (A Xo t- Ii oz Z040 Im CDj C.X (D)-..Jr) a J
Z4?- 11 a NX N a= -== -LA
iMJM e.dO00 a 0 (OJ Mf*bOf MW&Msj'i. V ('I.- Q;; 8f IN- is aX e
*~~Z W a\ 004 '0 \~ Fr.4

LC
on,~ so ow
00
00 as so& 0s
1o6 a a 4 a
CA. I-- -As l -
Z - ,J.J -1 --(j, .....
am~~~ 0 0 A-
1 6~~~~aU CD=t U M49aV
R 0=
= 0 4L W Lii
w,, coo -- Lo. we s.Q
leT U) L x I= " ILI af
Vcs $ "aG IL 1 a =2 2 a
Now" goo" "=
xcw w A.* a 3 u L I
Q M M - f- I- = Z Q~ W. W 6..L& 1 L1-C - LI LI -a -U .C
uzc, PiTNN~~N.3~~ KNN M o tV S0(-
S.92. '

LL*.
0 -X
2 LL~. IL
ac ~ - I'12=0 -.
II. 1.-
*<0 m0.
Q.- L.-9
I- =0. P
OCA
===. I-. 040"
1- IL W
4z = lza 'J ('m8 SLfl I.- A
= 40 'at - IAS i) 'a s0 Z a,
n-unt Z 0 - (JO- Za. 01 =-S a~ a Nm t0
lC"& CL tOW c~ 0 40 C
eU NM Zoo~~
83

IILa s
4. 4
2. w to .- 49
us.U*1 0
4c "I I -L4 1 4* M M
4* -W vM£M ~ .
4* to 2 nato -N0
4'4

U
IL-
LUJCx a-
23i
LU = I-
IL) -A 4In LL LU
(A . .6 uj90 4Z
.-C F- 0) p- L.2 Q IC
#I-E~ = = ac M.- z C I= (0) =- 146
t- t- 0 10 @.0-I CDCA L. U~l. 9= LUI LuWOA AX a w 01 W 0 0 L" a- 1n CsI-
4MI q4IL40% Q.4*0= aC*o web :oas -41g-- rimNOa a j. 40 t0~ La 8.4-'Q M SJ.7^d Ia #-Ml
0L U4 V) CLa~'a sAI( - 6 IZa

KIZ
Ow LA
4 L6
wOL-9 C o
4z M ON qr C WW
= -
= LU - 0.G sgaoasw .LAa s- o
go$W2a 0 0om
oom Com voev1 0000^vCmOM- 6.w 1..!3 h'" b.". i.. -44 -lmrv ;M
6- LU s. 0. 6

LU
U.- 0
Q.. C-. Us-
LAS LUJ'w
O (% XMc 01.4b (b NJU. 13.L2
+' 0.. =ZL CDOf0 - :
?- = = c a - f w'l @""2
M ll- O. QW Q C MA;MS , L
OD ON CD Q =D Qm-m -m mm mrm em oc; 9?1"
0.. 0. l87

Up.
CL
04
1--4
4* 0 co0 4* co
z x . a,
. ZnD - X I.- $A OZ0 oW U Q. 0~ coo.4 . 0
N a .44. =2 v4-... I nM -42 40""
+! 4* Ia I~ z - in- O=ea .* 4- t- f--02Lii 40 *.% It: : LL 0- 0
=% wq 42 J- It ==o£ dz Q) .0. 01 Wa .. W"* 4P0 itO 2kUj ~ -- XC It 7(f (fZ .t N4~ If f I(l "C a jz mIt X.I AW ad CZ Wi a-,. W-\ U2--. L-b IL. 3
S ~ ~ ~ ~ ~ mmr amp- coca ~a N~*ZW4 %a r. mi OZ -?1 026- Na 14 4"1q! 0 M - Vo. OsQ&. (1; Vfl~~56-~~J' r* 4 ".0 .

-A195 N6 SCATTERIN IMPULSE RESPONSE SYNTHESIS USING RMON 212NOISE ILLUMINATION- INITIAL CONCEPT EVRLUATION(U) NAVALPOSTGRADUATE SCHOOL MONTEREV CA D I LEE MARR 88
UNCLASSIFIED F/G 17/9 ML
solllllolllolllmllI
EEEEEEEEEE -E

-
0 w w w u ww w w ww -

U.
LL.
ep.
x 2 r W
W 1-. 0 j _ W .-= IL CIJI - .a6 Q
D m*aa S a a = S
d- ~ a£ a a a W
CD- -- ILL.s LLa.
11-0 9L W 1CCL -IL (A =
awc "A W.=- Cfz a w-a
uZ0 %e U.Z a us vPO 0- 4* a
INtW*-49 6- 1-0 . . -1-0 -. 1-1.t=1-0
I~"$Ow "L 0 b" CL~- M W L.bs. I--
89
I0I,,iiii jlij 1 IjII1[ ll

4*
* ~W*. C-* OEM
x .A-=* (U* * LLUop
*U W.L
0~~~ 1 JJ s.=
U.J wN w 46*U 9L 0: -1
I. - = zLIl= LZ A. 0.L
I.- C Q94* U~. U = -
CD a I.. la. us* CA. 0 4z= = P
qw us CA. 4% 0,.mo . I-Ica -w oft , (% I.j
* Ima. LU D 4 4* NU 0I. W" -ObW a ==
* 0c 8- 04*= I.- =at
w~ Mi .... o~ r** a a. a-0 fu mg Cb 1 f E
Z ~ ~ ~ ~ . = -=...4
WWW a- ==c== b-o o -w w - .LU.w a-o w w
LU mm 0vOI %pina 0D 0c4 ov (%j, om e4~~ z,% cA- oi (% m r)mmmi nAm A-
Ii.4*~0 ... ~e w(Juu.N '5~O.I~90(
*' .* SillM~ Cal OM z :4)L0W

aa
LaL
Ixx
02 CL
0 C -O
I- 4-. c
#z I"-=
*w LLW= WCL IL -
=~~ ~ ~ t * == M OLlz l- 0W lt z $-q0 W - 4
CD Us 0 L*- sL IL* Of NNco w* a L tl- = = e
co~~~~~. = 4.. I #a" W
"aga a - o"4z= m Los a ~ 4=W e-4- to 0 + -=
4-.~~Q lUC7Zrrq~wll %sate V%% W iLC'
~z U 9- 91

LLI-
IX W
9L CL LU wC0
'CCU.
=0 CA ..M~9 z I" (.19 LAS q
3 4Ill I t - Z
5=~% 11d' C~ -0 =
cZ ZZ ( Wc- zl LU 0.. ~ % 'Al Rhg-w W.I- I It of .1 1.. 0 -C
0 4 * (fCm4 P"% 4-*Ji - N I 4n CA 46UaL U)M * 6040 fm A\a2 *Uif'- -) = 4# 4*a U2
I If W #0 A151114 40 g(% .. 10- 1.-446
cacZ.IA C1 PAI51 AifWLWLUO W*144ww0Zwc Uwwwwwmi.
Aprp*l ~wlvnNRUI %0140 tog %D.4DQi Wb'll SO S0
92

ILl
LU,
I..
ILl
ww
4.
0.I-.F I-C
oz =w. . P"
C 0 07 \= M1-
=U 4Z ! =J4% d, I# . ]. ft1 'alZ Z 10 x.U w. 4
ID ~ ~ 0 1- - oo C I r V("ZO.M -N= <Cw. I.-t w \ 0-qw2at a (92' 1A == #A
40 LU U) I $-% a0 CZLL
*0 . -.- 0so .0 I = CA. x C~O7
W0 U =a CUI- AL. MQ COMMI
W 'M0 00 000 .4C * D M IMC MS (Aq U) XO - CD OI 9W-~~M" .Juu---j~o- * OZ N 0.0m0
~u-Z -Zz .- Z W W.....JZ I ZO(93

u ILJ
(I, w
420 x i4Da rM% W
S. 6 0, aJ IN 011I C4 x.I in m'J v.J( ..O ..IXm CD C.a WE -, D MCC C ',=M
ZEE42 -11 Ca 0.~ ObI 120 JaI-At- = tW_J& Ob*16 19 d a -. Nu
'242 '. 07. X.-eQ('=E % q a0
o j a 0 1- Q j.. U ZUs iA I 0 - a5 C
* i GK. 0 0.0 m 1* IL3 0.0
42422Z 3;.4--.~4uwW42.4f.'44zwwwWIztC 20-i-3:'mwwwZ-.-
Z~U~2~)(JE U0.svaXLm
94

la-g
SW .W a 2
U)~ .0...
0---, = C
ass o* .0 as
-J -- - -1) "A . -
9* -111 B A
0 1 1. -
--0 SW. "A. 5050 a
-. 14 50. SW 50_W SW LSW.- -1-1- :
IA4a '" 'e i -e%0X.L1 2a - 58W 23 a 2 s a j
If 0 If If of 0 11
NKN ~ ~ L 2.l -I 0 O C I NNW
* ..J Z1 -~1(fl~~a95
111111111111111 ill 1 lilU "I'll,, 1111111

.-
s~LL
ILJ
0 u
U)
oto
cz CIDc=w c
-- C Z 01J
&mc=Cw ffw*9"alC~i = 0%QI-. = 0
WI.-9-
I-II = = = j 11lI'i111
IM M BAN

*bLL
*(fl Q.La
* C
0- NL .
IxI
*0 L
U). 0 t l) W7-=" =X IXIC ..O' I-
*41 Iw .. = O' i =. -.1
*.Q =1 C- Q - 0. W . 0C
ex: C (j -C C.
w =e 1. 00 w WwO(JO.'C Ix rw) w* 'L* w-
m: aA I l wt . -j 0U W Ill (A' = U) m .
G:0=C CJ: us wJ 'I w .
(A = I.- a: 0.. MWW(I~~~~~P aO-4 2~ U ~ " 4 Z .
4- 4* 4146E -~40.40O acs CC aI =a -
4I~ -U I- - CLL 1. 136' -L .4 .
A..i0) Am 'm 8-O % P 0 9 0 - 03 CI4*~o 0.. AZ- ia: 64 b a:jN
0'J~I0 £ J 4 ~97L

CL
W LU
c0: I- 4Qz =
1- W LUr
LUIL &L z ='
L- 4z OS -a-ULU) :- = ..
42 so .o- 0: 3c, = -.I- a. C..1W(Z 4 L2w~ W. C~ LM.
0 -- go -r. us .. ".k
Q . . -j ObVL . CUS..U
w Lu * LL. -jW L
-I.- OM = MN3 qr al. L'' LInAi 1.'M -P 4 '%.C' W-4
fl CZf . - - . $. ~0 .
*~J a* IN 00-40-0C0- 0-0L.
00 w.owu = LU -0w WWW ovLuc.Z'N 8.
1 A. Ca ICY ~Ol~ . .0.... TV S .5
LUZZW WI'~*~3 ~ a..."*8.
* Z. - ) 0.-e- *..Z ~0 . M 0..JO 98

w LU
IU -C A-
= 6.- -UV- TwJ
Lu - I--I ~~-- 0: 0
cc v4z w 'I quto~ 00 Lai. ='-
W= c J m= w. wIl-~f ./).1
WL =- L
LLI- I- a$
W0-0 == a- w-I- Lu -w - - ID. C
WWWM=W= W WM=L9r. dc Ix de CL C= 0. CL
IM T10 2 O 0-.- . I Ue r%~ IN IM v £tDti m IMD a -V

wwIx 4z
Q7L
-j L'
CL
- X 0-U U Cl L-1
w -. I a 3
L.I . I- Ix
I--. C1-
*~~L Ix co'j Q. .
Ix We-W 0UNI-= co 0.2L
Cj La L I-U-a- 0 =120 w b" - -
LU LU ta.. L20.U 1-
LUI.- L2~I Lu W- aL2 -U0 C DD IM( -
z- inw00w"7 020 * IQ "% Z. - 5#-=Z 4A Q U = a .2= N U 14 - 1- -
- ON-w = i a'2 aI a QU
M.0 L I LU WiLOU & a. ft. 6 !-D . s ib6f
C 0 I-too
winU U
CAJ
Ow 4&0 -!-W--g i 0s
L1 S = Ili40) ra =
I---
- 4* *A b. 4* w = C
l- *L* = a* 4* Ow 060 AL S
.wL 40Iwo I- I- CJ
I- Cy . Wz = =0 .w-Q wo 4* w c) UW..J L
cv.- O(0&8- I.- a- ta.Z coW x 0*C) WZ 0"u
4* = - W " wO
.- M (~Iaw 4* mo- ftw 0= qz M* CD, *=Z -1 40 LLLt- IL 4* -1 !A -2W
0 -~cA 40 40 *balO
4pdb~~~4 Uwlomd moaf of abm DWftmo'
"A-.4 ~
*u8-33 4 4* u~sm101u

I.-
*. =
= 0 = =.
co 4w c
OWA
LU I- 3
ata
4 e. a% ^ LU
LU 00 OM.A &Z N 3
= ulWo - co ac$A0 = .90 Cm N CIO 0
u.- -N cc - a3 = a
W2. to z 5 3 **sow- . *a0 VON M*z 0se0 9-*0) .I24* -. NoA OZ a 0l WC 0-cs 0
* .a a a W C* dip 0 4b3=0 =
ww~wrnz0w Mw.3
102

00 -
Zr %0 Z=9
=-m -a =t "=P 3 '^.
=4 Goo* 4,44 + +S L D
NGc W- 4"0"Nv 0 If- fCD Z_0 :6p ft~jtf-eN 4 4. L .%M
9*s + 40 +. Q="WA--%mI z= = LU z. = 0-_ D-z-= = = ^.. m If IfD
&'L 9 s" C . 11 of go oil -4In ow"
103
w in.
**x
=In .e.4Z 14 %eto 0 "llIL
o 4, M40 -1 I*f
U. I n -R OC
00 0 =33 2=M*"u
.0 a.. .' = = = w = a-U 4z3Q1 * ===
_j 0 -N V -- IfW - OK -- a .
0)C C Ilv49ol )1 rb,ai 09 .O0% en A D D D w
.A im 1"AU %.*. 6o vA 4 3NN#-I(I i.l(Mk4jjkJ(j#% 11
- 1%.X we',104

LU-0
tooww U7 4
*L 4* itC - .WIIw k*-
= O)A fl4. -1mw. X m 40 0= -w -
3c = 9 .m -q -T"oZ = = -A a .: i . -
I- ~ ~ ~ ~ ~ ~ ~ ~ ~ J ok4 n= - oxInw)e oe, L -0 0S w - ' ,f L- = D ~ . -I.- ~ ~ ~ ~ ~ ~ ~ ~ m X= 62 na" fc 41 6A Il. www -
C-f- OM cl-M - o- v" -A- = ewi L= C * z =I Is. om I =
(A a .P Z N zCO-4 QZ ~ O==MC U) O L0IL . . .
W.-m = w ZZI, J= oj4*a -w = =w=='?.- 11 W $= mWWWWCC K-LO-
u ~~Cfltl$2 .. -
W )'~'Zw K o4
LU
oj m
04
C.0
=LU .. :e c
a* ==D= -
OA -NAw -94 ZL. C- g. a M%, s 4 L Of..a $-L ." =C V
=06W4Z PitZ Its-8a( 0
oz G'Z + II- 0 2 c WLicH 0
=WJQ I ,U. ZQ-,,, zf"Z CIA.0~ -
vo " LUmW ~ % ~ 1'I .... 0 M M Mw. M "m"m"rw r4 0+g r
0 '~' *'~ w~~4. 2210=

9-
* 2 *
0 woo a a _Jln a coo W ~ U.~ L. Xis -10 %. N *%U =- so s. .
=In 4*a a aUm a 2 a~aob (D 0 CD ~ u.
Mw-a om -0 occom 0 fCL eftomosoosX
= ~ ~ i U o-q 000-0 CD ZO~5I-,4' (Y w o wo wo e GasOI= =
-~~ ~~ r- 3= i0G.tz F-J UR 9- ==Q"-.*W== NZ'9 . .I 40 **%04 =* --f'4.-
uoI-oa "Z~u
vft aftW 016 0' m *4M v0a- 4 ea a a 1 b C4 areIw,6 - N4,0 o O" 40 9a1 goon 9U1. olz- 144 ZIP .v9 -111 Ma 10 .3 1O
~.0 '~~ 4* z~~C07

UI- em£ =
MIg. 2 .ZX= &A LA = 9
MAZU WL ^w-L
aI 2 a a 0 a
I--* acs===IJ
a. L3
isn m~
Io

LIST OF REFERENCES
1. MI.A. Morgan, Time-Domain Scattering Measurements, IEEE Antennas and Prop-
agation Newsletter, Aug. 1984.
2. M.A. Morgan and B.W. M1cDaniel, Transient Electromagnetic Scattering: Data Ac-
quisition and .Signal Processing, IEEE Transactions Cfl Instrunientation and M.Ieas-
uremient.'To be Published (Junil. 1988).
3. G. R. Cooper and C.D. Mc(;illeii, I'rolhibiliStic Mekthods of* Signal and 4ystem
A4nalysis, H-olt, Rinehart and Winston, p. 300, 1971.
4. J.D. Lorenzo. .-I Raige 6)r Yehasuring the Impulse Res;'onse )y*Scww.;m, obio'Cs,
5. 1967 NEREMI (North Last EIlectrnics Research and Engineeri ting ccagw Vol. 9, pp. S0-81, Nov. 1967.
5. C .%. I lariliond, The Development ef'a Ilistatiic Electromagnetic Scattering Laborcl-
tory. Masters Thiesis, Naval Postgraduate School, Monterey, California. Dec. 1980.
6. L.A. Sorrentino, Time Domain Radar Laboratory Operating System Development and
Transient E.11 A4nalysis, Masters Trhesis, Naval Postgraduate School. Monterey,
California, Sep. 1981.
7. M. L. Van Blaricuni and R. NI ittra, A Techniquef ]b -Ixtiaciing the Poles card Resi-
dites of a Stystem ljirecu/vJ'rom fits Transient Response, IE Transactions on An-
tennias and Propagation-23. pp. 777-781, Nov. 1976.
* 8. M.A. 'Mariatcgi, Devclopmnent. Calib~ratlion and Evaluation qf a Free-Field Scatciping
Ranp.;e Masters Thesis. Naval P'ostgraduate School. Monitercy. Califloiniia. Dec.
1983.
109

9. B.W. McDaniel, Calibration and Evaluation of a Free-field Scattering Range Using
IWideband Pulse Amplification, Masters Thesis, Naval Postgraduate School,
Monterey, California, Dec. 1983.
10. S. M. Riad, Impulse Response Evaluation Using Frequecncy Domain Optimial Coln:-
pensahion Deconvolution, 23rd Midwest Symposium on Circuits and Systems, Uni-
versity of Toledo, pp. 521-5, Aug. 1980.
I1. Sinion I laykin, Commnunication S'ystems, 2nd Edition, Ne\'w York: Wiley. p. 59. 1
11

INITIAL DISTRIBUTION LIST
No. Copies
1. Defense Technical Information Center 2Cameron StationAlexandria, VA 22304-6145
2. Library, Code 0142 2Naval Postgraduate SchoolMonterey, CA 93943-50)2
3. Department Chairman. Code 62Dept. of Electrical and Computer EnginceringNaval Postgraduate SchoolMonterey, CA 93943-5000
4. Prof. M.A.Morgan. Code 62MW 10Dept. of Electrical and Computer EngineeringNaval Postgraduate School*lonterev. CA 939-43-5000
5. Prol" G.A.Mvcrs. Code 62MvlDept. of Electrical and Computer EngineeringNaval Postgraduate SchoolMonterey, CA 93943-5000
6. Dr. David Lewis 2DARPA-A S' Office1400 Wilson BlvdArlington, VA 22209
7. Dr. Allen R. AtkinsMcDonnell Douglas Research LabsP.O. Box 516St. Louis, MO 63166
8. Dr. Bruce Z. llollinann. Code F12Naval Surlace Warlhre Centerl)ahligren, VA 22448
9. Dr. Rahiner Madan, Code I 14SEIO)lice of Naval Research8J4 N. Quincy Strecet
-Arlington, VA 22217
9. Lce. Dong Ii 7135-1 Daei Done. l)ong (Gul)ae Jcon Si. Choong Nam 300Republic of Korea

0
0
I
(NI*
I