ieee transactions on microwave theory … ieee...hiroshi idei, takashi shimozuma, ... an lo pumped...
TRANSCRIPT

IEEE TRANSACTIONS ON MICROWAVE THEORY AND TECHNIQUES, VOL. 54, NO. 11, NOVEMBER 2006 3899
Experimental Verification of Phase Retrieval ofQuasi-Optical Millimeter-Wave Beams
Hiroshi Idei, Takashi Shimozuma, Michael A. Shapiro, Member, IEEE, Takashi Notake, Shin Kubo, andRichard J. Temkin, Fellow, IEEE
Abstract—The accuracy of a phase-retrieval procedure formicrowave beams was analyzed and verified using an 84-GHzquasi-optical beam transmitted by a corrugated waveguide. Theoutput intensity and phase profiles of the beam were directlymeasured with a microwave receiver. The beam intensity wasalso measured at several planes and the data were used with aphase-retrieval algorithm to yield an independent estimate ofthe phase. Moment and matching coefficient methods were usedto analyze the retrieved profiles. In the higher order momentanalysis, the intensity profiles, which were calculated from theretrieved phase profiles, coincided well with the measured profilesin terms of the beam size, asymmetric property (skewness), andflatness/peakedness (kurtosis) over the entire profile. Analysisindicated that the mode content of the beam obtained by phaseretrieval matched that of the direct measurement with a matchingcoefficient of 0.97 using both the intensity and phase profiles.
Index Terms—Electron cyclotron heating (ECH), Gaussianbeam, gyrotron, phase measurement, phase retrieval, quasi-optical mirror.
I. INTRODUCTION
ELECTRON cyclotron heating (ECH) using high-powermillimeter waves is an attractive method for plasma pro-
duction, auxiliary heating, and current drive in a nuclear fusionresearch. In planned fusion experiments at the InternationalThermonuclear Experimental Reactor, Cadarache, France, theinjected ECH will have a total power of 20 MW. To couple intooversized circular corrugated waveguides in the ECH system,an output beam from a high-power gyrotron oscillator leadsto a matching-optics unit (MOU), which is transmitted to thelauncher by the waveguide transmission line in the modeof the waveguide. The output beam from the gyrotron is thenconverted into a pure Gaussian beam to attain a high couplingefficiency between the MOU and waveguide. The phase-cor-recting mirror array at the MOU for the large helical device(LHD) project at the National Institute for Fusion Science,
Manuscript received April 17, 2006; revised July 6, 2006. This work wassupported in part by the Japan–U.S. Collaboration in Nuclear Fusion Researchunder the Personal Exchange Program. The work of M. A. Shapiro and R. J.Temkin was supported by the U.S. Department of Energy, Office of Fusion En-ergy Sciences, Washington, DC.
H. Idei is with the Advanced Fusion Research Center, Research Institutefor Applied Mechanics, Kyushu University, Kasuga 816-8580, Japan (e-mail:[email protected]).
T. Shimozuma, T. Notake, and S. Kubo are with the Radio Frequency PlasmaHeating Research Division, National Institute for Fusion Science, Toki 509-5292, Japan.
M. A. Shapiro and R. J. Temkin are with the Plasma Science and FusionCenter, Massachusetts Institute of Technology, Cambridge, MA 02139 USA.
Digital Object Identifier 10.1109/TMTT.2006.884632
Toki, Japan, was designed at the Massachusetts Institute ofTechnology (MIT), Cambridge [1]. The phase profiles wereretrieved from the intensity profiles using the iteration methodsexplained in [2]–[4] because precise phase measurements areunavailable in high-power applications. The retrieval processis necessary to design phase-correcting mirrors. The mirrorarray designed for the LHD project has been evaluated at thelow-power test facilities [5].
To obtain a high transmission efficiency in the corrugatedwaveguide line, the beam center position and tilt must be alignedwithin tolerable limits to provide coupling into the mode[6]. Precise quantifications of the beam center and tilt angle arerequired to investigate their effects on the transmission/couplingefficiency. In this coupling study, a Gaussian-like beam wascoupled into a corrugated waveguide at the tilted injection inthe - and -directions, which were perpendicular to the propa-gating -axis [7]. The tilted injection excites the unwanted cou-pling modes, which causes high transmission losses and arcingevents in the high-power transmission. The intensity profiles ofthe output beam from the waveguide after coupling were offsetfrom the waveguide axis and sidelobes appeared in the - and
-directions due to the tilted injection. The beam center and tiltwere analyzed from the first moments of the moment theoryof a quasi-optical beam [8]. The desired Gaussian content inthe output beam was analyzed using the matching-coefficientmethod.
The output beam profile after coupling in the tilted injection isused to compare the retrieved profiles to the measured profiles.The distorted intensity profiles are measured along the propa-gation. The phase profiles are retrieved from the measured in-tensity profiles by the iteration method [9]. In this paper, theintensity profiles, which are calculated with the retrieved phaseprofiles, are compared to the measured profiles. The intensityprofiles are analyzed by the moment theory (using higher ordermoments). Recently, a new approach using the higher order mo-ments to retrieve the phase has been proposed and developed[10], [11]. This paper also evaluates the matching coefficientsfrom both of the intensity and phase profiles measured and cal-culated in the phase retrieval. Finally, the phase-retrieval processis experimentally tested with the direct intensity and phase mea-surements at a low power level.
This paper is organized as follows. Section II describes theexperimental setup and results at the low-power level. Theintensity and phase profiles calculated in the phase retrievalare shown in Section III. Section IV discusses the intensityand phase profiles based on the moment theory and matching-coefficient method, while Section V presents a conclusion.
0018-9480/$20.00 © 2006 IEEE
3900 IEEE TRANSACTIONS ON MICROWAVE THEORY AND TECHNIQUES, VOL. 54, NO. 11, NOVEMBER 2006
Fig. 1. Experimental setup for the low-power test measurements.
II. EXPERIMENTS
A. Low-Power Test Facilities
The low-power test facilities were used to directly measurethe phase profiles of the propagating waves, as well as the inten-sity profiles with a high resolution and stability of the measuringfrequency. The operating frequency was 84 GHz. One synthe-sizer, which was a microwave ( 20 GHz) source for the mul-tiplier, generated a millimeter wave, while the other was a localoscillator (LO) for the harmonic mixers on both the launcherand receiver sides. Since the conversion losses at the harmonicmixers were not low (typically 35 dB), additional IF amplifierswere prepared. The frequency of the IF signal was 20 MHz.The intensity ratio and phase difference between the IF sig-nals on the two sides were detected at a vector network ana-lyzer. To operate the harmonic mixers, an LO pumped ampli-fier was also prepared. In this system, the dynamic range wasmore than 90 dB for the intensity measurement. The error in thephase measurement was approximately 5 at a power levelof 80 dBm [12]. The power level at the launcher was morethan 0 dBm, and this study used the precise phase measurement.A three-dimensional stage system controlled the detector-stageposition. The setting resolution at the – -plane perpendicularto the propagating -axis was 0.010 mm, while the resolutionfor the -axis was 0.025 mm. The setting resolutions of the de-tector-stage position were on the order of 1/100 for the wave-length at the frequency. The test components were set up by theposition control of the three-dimensional stage. A helium–neonlaser was used to align the components.
B. Experimental Setup
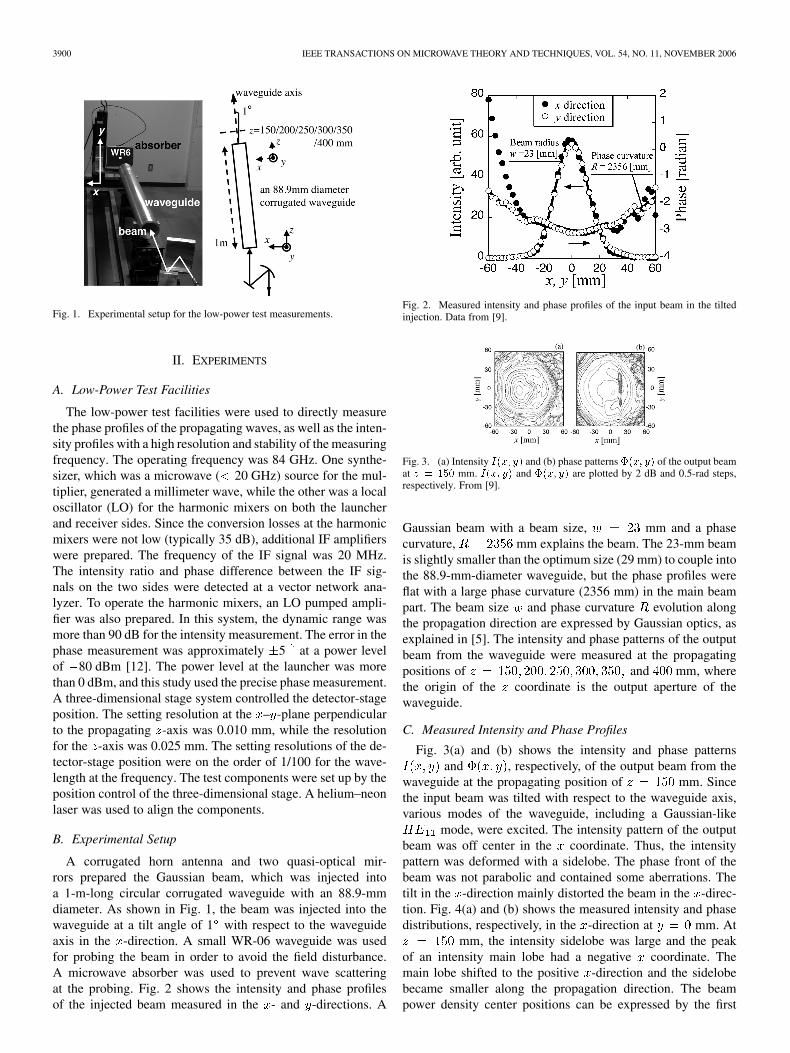
A corrugated horn antenna and two quasi-optical mir-rors prepared the Gaussian beam, which was injected intoa 1-m-long circular corrugated waveguide with an 88.9-mmdiameter. As shown in Fig. 1, the beam was injected into thewaveguide at a tilt angle of 1 with respect to the waveguideaxis in the -direction. A small WR-06 waveguide was usedfor probing the beam in order to avoid the field disturbance.A microwave absorber was used to prevent wave scatteringat the probing. Fig. 2 shows the intensity and phase profilesof the injected beam measured in the - and -directions. A
Fig. 2. Measured intensity and phase profiles of the input beam in the tiltedinjection. Data from [9].
Fig. 3. (a) Intensity I(x; y) and (b) phase patterns �(x; y) of the output beamat z = 150 mm. I(x; y) and �(x; y) are plotted by 2 dB and 0.5-rad steps,respectively. From [9].
Gaussian beam with a beam size, mm and a phasecurvature, mm explains the beam. The 23-mm beamis slightly smaller than the optimum size (29 mm) to couple intothe 88.9-mm-diameter waveguide, but the phase profiles wereflat with a large phase curvature (2356 mm) in the main beampart. The beam size and phase curvature evolution alongthe propagation direction are expressed by Gaussian optics, asexplained in [5]. The intensity and phase patterns of the outputbeam from the waveguide were measured at the propagatingpositions of and mm, wherethe origin of the coordinate is the output aperture of thewaveguide.
C. Measured Intensity and Phase Profiles
Fig. 3(a) and (b) shows the intensity and phase patternsand , respectively, of the output beam from the
waveguide at the propagating position of mm. Sincethe input beam was tilted with respect to the waveguide axis,various modes of the waveguide, including a Gaussian-like
mode, were excited. The intensity pattern of the outputbeam was off center in the coordinate. Thus, the intensitypattern was deformed with a sidelobe. The phase front of thebeam was not parabolic and contained some aberrations. Thetilt in the -direction mainly distorted the beam in the -direc-tion. Fig. 4(a) and (b) shows the measured intensity and phasedistributions, respectively, in the -direction at mm. At
mm, the intensity sidelobe was large and the peakof an intensity main lobe had a negative coordinate. Themain lobe shifted to the positive -direction and the sidelobebecame smaller along the propagation direction. The beampower density center positions can be expressed by the first

IDEI et al.: EXPERIMENTAL VERIFICATION OF PHASE RETRIEVAL OF QUASI-OPTICAL MILLIMETER-WAVE BEAMS 3901
Fig. 4. (a) Measured intensity and (b) phase distributions in the x-direction aty = 0 mm. From [9].
moments. Here, the th moments, and are definedwith the intensity distribution as
(1)
(2)
The first moment evolutions along the propagation directionand are written in terms of the quasi-optical mo-
ment theory as follows [8]:
(3)
(4)
The gradients of the phase in the - and -directionsdetermine local values of the wavenumber.
The integrals of the gradients in the – -plane with an in-tensity weight, which were normalized by the total intensityand wavenumber of the beam, expressed the propagatingdirections of the beam. In the phase distribution shown inFig. 4(b), the local minimum near the main lobe peak is locatedat a more negative coordinate than that of the main lobe peak.Thus, there was a phase gradient at the main lobe peak. Thephase rapidly changes near the sidelobe. These results wereconsistent with the intensity profiles along the propagationdirection, indicating that the main part of the beam was tiltedand the sidelobe part might be expanding. Fig. 5 shows the firstmoment evolution along the propagation directions and
. The first moment is defined as the center of the intensity
Fig. 5. First moment evolution along the propagation directions hxi(z) andhyi(z) of the output beam from the waveguide. Dashed lines show the tiltedpropagation axes, which are defined by the normalized integrals at z = 150mm.Data from [9].
distribution. The moment at mm was at approxi-mately mm, but the peak of the intensity distribution wasat approximately 19 mm. The sidelobe affected the beamcenter or the moment . Along the propagation direction,the center of the beam moved toward the positive -directionand the sidelobe was expanded. The dashed lines show thetilted propagation axes defined by the normalized integrals at
mm. The first moment evolutions were explained wellby the tilted propagation axes. The first moments at various
positions were in the slope of the tilted propagation axes,indicating that the – -plane in the experimental setup waswell aligned with the propagating -axis.
III. PHASE RETRIEVAL
The phase profiles were retrieved from three intensityprofiles along the propagation direction. Two data sets at
mm and at mm wereused for the phase retrieval. Interpolating converted the mea-sured 49 49 array intensity data into a 128 128 array. In thephase-retrieval process, the calculated intensity profiles werecompared to the measured intensity profiles at the referenceplane. Thus, the intensity profiles were calculated with theretrieved phase profiles along the propagation direction. Figs. 6and 7 show the intensity distributions measured and calculatedin the retrievals with the data sets in the - and -directions,respectively, at mm and mm. The distributionswere at the beam center lines, which wereand The intensity distributions in the retrievalsagreed well with the measured distributions down to a level of
15 20 dB below the central peak.Figs. 8 and 9 show the retrieved and measured phase distri-
butions at mm and mm in the - and -directions,respectively. The profiles were also at the beam center lines,which were and The retrieved andmeasured phase data were interpolated in the intensity dynamicrange of 30 dB. The phase profiles were normalized at the beamcenters. The figures also show the measured intensity distribu-tions. Fig. 8 shows an excellent agreement between the retrievedand measured phase profiles in the intensity dynamic range of15 dB, even near the sidelobe. In Fig. 6, the intensity distribu-tions in the retrieval also coincide with the measured distribu-tion in the dynamic range. The profiles away from the sidelobe,

3902 IEEE TRANSACTIONS ON MICROWAVE THEORY AND TECHNIQUES, VOL. 54, NO. 11, NOVEMBER 2006
Fig. 6. Intensity distributions in the x-direction measured and calculated inthe retrieval at: (a) z = 150 mm and (b) 350 mm. Distributions in the re-trieval are obtained from two data sets of the measured intensity profiles atz = 150=250=350mm and at z = 200=300=400 mm.
Fig. 7. Intensity distributions in the y-direction measured and calculated inthe retrieval at: (a) z = 150 mm and (b) 350 mm. Distributions in the re-trieval are obtained from two data sets of the measured intensity profiles atz = 150=250=350mm and at z = 200=300=400mm.
shown in Figs. 8 and 9, agree well in the dynamic range of 22 dB.The phase profiles retrieved from the two intensity data sets areconsistent. It is noteworthy that a quasi-optical mirror designed
Fig. 8. Retrieved and measured phase distributions in the x-direction at:(a) z = 150 mm and (b) 350 mm. Retrieved phases are obtained from twodata sets of the measured intensity profiles at z = 150=250=350mm and atz = 200=300=400mm. Measured intensity distributions are also shown.
with a basis of the phase retrieval may collect a sidelobe in thedynamic range when the intensity profiles, which are calculatedin the retrievals, reproduce the measured profiles.
IV. DISCUSSION
The intensity and phase profiles in the retrievals werecompared to the measured profiles at the beam center lines
in Figs. 6–9. To discuss the validity ofthe phase retrieval, the similarities of the intensity and phaseprofiles measured and calculated in the retrieval should bequantified throughout the beam. First, the intensity profilescalculated in the retrievals are discussed with the measuredintensity profiles using higher order moments. In [10] and [11],the th moments of were used in the analysis. How-ever, the intensity profiles in this study are mainly deformedin the -direction due to the tilted injection in the – -planeas shown in Fig. 3. The th moments, which are uncoupled inthe - and -directions, and , are used to compare thecalculated and measured intensity profiles. Higher order thmoments around the beam centers are defined as follows:
(5)
(6)

IDEI et al.: EXPERIMENTAL VERIFICATION OF PHASE RETRIEVAL OF QUASI-OPTICAL MILLIMETER-WAVE BEAMS 3903
Fig. 9. Retrieved and measured phase distributions in the y-direction at:(a) z = 150 mm and (b) 350 mm. Retrieved phases are obtained from twodata sets of the measured intensity profiles at z = 150=250=350 mm and atz = 200=300=400 mm. Measured intensity distributions are also shown.
Fig. 10. Evolution of the effective beam radii along the propagation directiona (z) of the intensity profiles measured and calculated in the phase retrievals.
The effective beam radii in the - and -directions are,respectively, expressed with the second moment as
(7)
(8)
The effective beam radii are defined for the intensity distribu-tion. Twice the effective radius corresponds to the beam size
Fig. 11. Evolution of the skewness along the propagation direction S (z) ofthe intensity profiles measured and calculated in the phase retrievals.
Fig. 12. Evolution of the kurtosis along the propagation direction K (z) ofthe intensity profiles measured and calculated in the phase retrievals.
in Gaussian optics. Fig. 10 shows the evolution of the effectivebeam radii along the propagation direction . The evolu-tion of the effective radii in the measured intensity profiles arewell explained by those in the calculated profiles. The third mo-ments are used to discuss the asymmetric properties ofthe intensity distributions. The skewness , which is a mea-sure of the degree of the asymmetry, is defined from the thirdmoment as . A positive or negative skew-ness expresses the shape of the distribution when the tail ex-pands in the positive or negative direction, respectively. Fig. 11shows the evolution of the skewness along the propagation di-rection . The skewness in the -direction is positivelylarger than that in the -direction due to the sidelobe in the pos-itive -direction. The sidelobe expands along the propagationdirection, but a tail with a relative intensity level of more than
20 dB is perpetuated, as shown in Fig. 6(b). The skewnessdue to the sidelobe roughly maintains a constant value alongthe propagation in the -direction. The fourth momentsgive the flatness/peakedness of the distribution. The kurtosis
to express the flatness of the distribution are defined fromthe fourth moments as . The kurtosis ofa Gaussian distribution is 3. A distribution that has a kurtosisgreater than 3 is termed leptokuritic, while a value smaller than3 is termed platykuritic. Fig. 12 shows the evolution of the kur-tosis along the propagation direction . The kurtosis in

3904 IEEE TRANSACTIONS ON MICROWAVE THEORY AND TECHNIQUES, VOL. 54, NO. 11, NOVEMBER 2006
Fig. 13. Matching coefficient between complex amplitudes measured and cal-culated in the retrievals along the propagation direction C (z).
the retrieval was evaluated at the output aperture of the wave-guide. The kurtosis in the -direction, i.e., , at the aperture issmaller than a Gaussian kurtosis of 3. Thus, the intensity distri-bution in the -direction is flatter than a Gaussian beam and is
mode-like at the waveguide aperture. The intensity dis-tributions calculated in the retrievals agree with the measureddistributions in the higher order moments.
To discuss both the retrieved phase distribution and inten-sity distribution, the matching coefficients were evaluated. Thematching coefficient compares two complex amplitudes
and , and is written as
(9)
where the complex amplitude is defined from the intensity andphase profiles as . Fig. 13 shows thematching coefficient between the complex amplitudes, whichwere measured and calculated in the retrievals along the propa-gation direction . The matching coefficients are approxi-mately 0.97 along the propagation direction. The high matchingcoefficient indicates that both the intensity and phase profilescalculated in the phase retrievals closely resemble the measuredprofiles. Precise measurements at the low-power level experi-mentally verified the intensity and phase profiles calculated inthe retrieval.
V. CONCLUSION
The intensity and phase profiles were precisely measuredto compare to the profiles calculated in the phase retrievals atthe low power level. The retrieved phase profiles agreed wellwith the measured phase profiles in the intensity dynamic rangeof 15 dB as the intensity profiles calculated in the retrievalreproduced the measured profiles. From higher order momentanalysis, the intensity profiles calculated in the retrieval coin-cided well with the measured intensity profiles in terms of thebeam size, asymmetric property, and flatness/peakedness overthe entire distribution. The mode content of the beam in the re-trieval to that in the measurement, which was expressed by thematching coefficient, was 0.97. This high matching coefficientindicated that both the intensity and phase profiles calculated inthe phase retrievals agreed very well with the measured profiles.
The phase-retrieval process was experimentally confirmed tobe a robust solution for designing phase-correcting mirrors.
ACKNOWLEDGMENT
Author H. Idei would like to thank the staff of the TRIAM Ex-perimental Group, Kyushu University, Kasuga, Japan, for theircontinuous support. The authors express their gratitude to Prof.O. Motojima and Prof. N. Noda, both with the National Institutefor Fusion Science, Toki, Japan, for promoting the Japan–U.S.Collaboration in Nuclear Fusion Research.
REFERENCES
[1] M. A. Shapiro, T. S. Chu, D. R. Denison, M. Sato, T. Shimozuma, andR. J. Temkin, “Design of correcting mirrors for a gyrotron used at largehelical device,” Fusion Eng. Des., vol. 53, pp. 537–544, 2001.
[2] A. P. Anderson and S. Sali, “New possibilities for phaseless microwavediagnostics. Part I: Error reduction techniques,” Proc. Inst. Elect. Eng.,vol. 132, pp. 291–298, Aug. 1985.
[3] A. V. Chirkov, G. G. Denisov, and N. L. Aleksandrov, “3D wavebeamfield reconstruction from intensity measurements in a few cross sec-tions,” Opt. Commun., vol. 115, pp. 449–452, 1995.
[4] D. R. Denison, T. S. Chu, M. A. Shapiro, and R. J. Temkin, “Gyrotroninternal mode converter reflector shaping from measured field inten-sity,” IEEE Trans. Plasma Sci., vol. 27, no. 2, pp. 512–519, Feb. 1999.
[5] T. Notake, H. Idei, T. Shimozuma, M. Sato, S. Kubo, S. Ito, Y. Takita,K. Ohkubo, Y. Yoshimura, S. Kobayashi, Y. Mizuno, T. Watari, R.Kumazawa, M. A. Shapiro, and R. J. Temkin, “Evaluation of phasecorrecting mirrors for an 84 GHz gyrotron based on direct phase mea-surements at low-power level,” Fusion Eng. Des., vol. 73, pp. 9–18,2005.
[6] K. Ohkubo, S. Kubo, H. Idei, M. Sato, T. Shimozuma, and Y. Takita,“Coupling of tilting Gaussian beam with hybrid mode in the corrugatedwaveguide,” Int. J. Infrared Millim. Waves, vol. 18, pp. 23–41, 1997.
[7] H. Idei, T. Shimozuma, T. Notake, S. Ito, S. Kubo, M. A. Shapiro, J.P. Anderson, R. J. Temkin, and K. Ohkubo, “Beam alignment of ECHtransmission line using moment method,” in Proc. 27th Int. InfraredMillim. Waves Conf., 2002, pp. 151–152.
[8] S. N. Vlasov, V. A. Petrishchev, and V. I. Talanov, “Averaged descrip-tion of wave beams in linear and nonlinear media (method of mo-ments),” Izv. Vyssh. Uchebn. Zaved. Radiofiz., vol. 14, pp. 1353–1363,1971.
[9] H. Idei, T. Shimozuma, M. A. Shapiro, T. Notake, S. Kubo, R. J.Temkin, and K. Ohkubo, “Comparison between retrieved and mea-sured phase profiles of quasi-optical beams,” in Proc. 28th Int. InfraredMillim. Waves Conf., 2003, pp. 351–352.
[10] J. P. Anderson, M. A. Shapiro, R. J. Temkin, and D. R. Denison, “Phaseretrieval of gyrotron beams based on irradiance moments,” IEEE Trans.Microw. Theory Tech., vol. 50, no. 6, pp. 1526–1535, Jun. 2002.
[11] M. A. Shapiro, J. P. Anderson, and R. J. Temkin, “Synthesis of gyrotronphase-correcting mirrors using irradiance moments,” IEEE Trans. Mi-crow. Theory Tech., vol. 53, no. 8, pp. 2610–2615, Aug. 2005.
[12] T. Notake, H. Idei, S. Kubo, T. Shimozuma, Y. Yoshimura, S.Kobayashi, Y. Mizuno, S. Ito, Y. Takita, K. Ohkubo, W. Kasparek, T.Watari, and R. Kumazawa, “Real time polarization monitor developedfor high power electron cyclotron resonance heating and current driveexperiments in large helical device,” Rev. Sci. Instrum., vol. 76, 2005,023504.
Hiroshi Idei received the B.S. degree in physicsfrom Shizuoka University, Shizuoka, Japan, in 1988,and the M.S. and Ph.D. degrees in physics fromthe Nagoya University, Nagoya, Japan, in 1990 and1995, respectively.
From 1993 to 2003, he was a Research Associatewith the Plasma Heating Division, National Institutefor Fusion Science. Since 2003, he has been an Asso-ciate Professor with the Advanced Fusion ResearchCenter, Research Institute for Applied Mechanics,Kyushu University, Kasuga, Japan. His research
interests include plasma confinement research, plasma heating/current driveusing microwaves and millimeter waves, plasma diagnostics using microwavesand millimeter waves, and microwave and millimeter-wave components.

IDEI et al.: EXPERIMENTAL VERIFICATION OF PHASE RETRIEVAL OF QUASI-OPTICAL MILLIMETER-WAVE BEAMS 3905
Takashi Shimozuma was born in Sanjo, Japan, in1956. He received the B.Sc. (with honors) and Ph.D.degrees in physics from Kyoto University, Kyoto,Japan, in 1979 and 1985, respectively.
From 1984 to 1993, he was with the CentralResearch Laboratory, Mitsubishi Electric Corpora-tion, Amagasaki, Japan, as a Gyrotron and PlasmaResearcher. Since January 1994, he has been withthe National Institute for Fusion Science, Toki,Japan. His research interests are the research anddevelopment of gyrotrons, ECH systems, and ECH
experiments.
Michael A. Shapiro (M’01) received the Ph.D. de-gree in radio physics from the University of Gorky,Gorky, Russia, in 1990.
In 1995, he joined the Plasma Science and FusionCenter, Massachusetts Institute of Technology(MIT), Cambridge, where he is currently Head ofthe Gyrotron Research Group. His research inter-ests include vacuum microwave electron devices,high-power gyrotrons, dynamic nuclear polarizationspectroscopy, high gradient linear accelerator struc-tures, quasi-optical millimeter-wave components,
and photonic-bandgap structures.
Takashi Notake received the B.S. degree fromRitsumeikan University, Kyoto, Japan, in 1999, andthe M.S. and Ph.D. degrees from Nagoya University,Nagoya, Japan, in 2001 and 2005, respectively.
He is currently a Post-Doctoral Fellow withthe Radio Frequency Plasma Heating ResearchDivision, National Institute for Fusion Science. Hiscurrent interests are pressure and current profilescontrol of magnetically confined plasmas by use ofelectron cyclotron resonance heating and currentdrive (ECRH/ECCD).
Shin Kubo was born in Matsuyama, Japan, in 1956.He received the B.Sc. and Ph.D. degrees in physicsfrom Kyoto University, Kyoto, Japan, in 1978 and1984, respectively.
Since 1984, he has been a Member of the ScientificStaff with the Institute of Plasma Physics, NagoyaUniversity, Nagoya, Japan, which, in 1990, was reor-ganized as the National Institute for Fusion Science,Toki, Japan, where he is currently an Associate Pro-fessor with the Radio Frequency Plasma Heating Di-vision. His research interests are wave processes in
plasma, particularly in the microwave region, including microwave-heating sys-tems.
Richard J. Temkin (F’94) received the B.A. degreein physics from Harvard University, Cambridge, MA,in 1966, and the Ph.D. degree in physics from theMassachusetts Institute of Technology (MIT), Cam-bridge, in 1971.
From 1971 to 1974, he was a Research Fellowwith the Division of Engineering and AppliedPhysics, Harvard University. From 1974 to 1979,he was a Staff Member and an Assistant GroupLeader with the National Magnet Laboratory, MIT.In 1980, he became Group Leader of the Gyrotron
and Advanced Millimeter Sources Group, Plasma Fusion Center, MIT. Since1985, he has been a Senior Research Scientist with the Physics Department,MIT. Since 1986, he has been Head of the Waves and Beams Division, PlasmaScience and Fusion Center, MIT, where he currently serves as the AssociateDirector.