ieee transactions on computers, vol. 61, no. 11, …
TRANSCRIPT
IEEE TRANSACTIONS ON COMPUTERS, VOL. 61, NO. 11, NOVEMBER 2012 1
NOCS Special Section:PDG GEN: A Methodology for Fast and
Accurate Simulation of On-chip NetworksKevin Macdonald, Christopher Nitta, Matthew Farrens, and Venkatesh Akella
Abstract—With the advent of large scale chip multiprocessors, there is growing interest in the design and analysis of on-chip networks.Full-system simulation is the most accurate way to perform such an analysis, but unfortunately it is very slow and thus limits designspace exploration. To overcome this problem researchers frequently use trace-based simulation to study different network topologiesand properties, which can be done much faster. Unfortunately, unless the traces that are used include information about dependenciesbetween packets, trace-based simulations can lead one to draw incorrect conclusions about network performance metrics such asaverage packet latency and overall execution time.The primary contributions of this work are to demonstrate the importance of including dependency information in traces, and to presentPDG GEN, an inference-based technique for identifying and including dependencies in traces. This technique uses traces obtainedfrom multiple full-system simulations of an application of interest to infer dependency information between packets and augment traceswith this information. On the SPLASH-2 benchmark suite, PDG GEN is 2.3 times more accurate at predicting overall execution timeand almost 4000 times more accurate at predicting average packet latency than traditional trace-based methods.
Index Terms—Modeling methodologies, Simulation.
F
1 INTRODUCTION
F ROM servers to mobile phones [1], future chips willcontain dozens, if not hundreds or even thousands,
of processors, memories, and/or hardware acceleratorsconnected by on-chip networks. The on-chip networkis a critical component of the chip, as it constitutes asignificant fraction of the area and power consumed.As a result, a “one-size-fits-all” approach to designingone is inadequate, and a thorough exploration of thedesign space is required. For example, the buffer sizes,number of virtual channels, topology of the network,arbitration and flow control schemes, and amount ofheterogeniety can all be optimized for a given appli-cation or market segment. The most accurate way toevaluate potential on-chip network designs is throughthe use of full system simulation, using a real operat-ing system running real applications. To compare twodifferent network designs, for example, a set of fullsystem simulations should be run for each configuration.Doing so will give the best measure of how the designscompare. Unfortunately, full system simulation is veryslow. The execution time can grow quadratically withincreased node counts, preventing designers from doingfull system simulations with a large number of nodes.
• K. Macdonald, C. Nitta and M. Farrens are with the Department ofComputer Science, University of California at Davis, One Shields Avenue,Davis, CA 95616
• V. Akella is with the Department of Electrical & Computer Engineering,University of California at Davis, One Shields Avenue, Davis, CA 95616Email: [email protected], [email protected],[email protected], [email protected]
For example, FFT benchmark from SPLASH-2 on 64cores takes months to complete!
One commonly used method for circumventing thisproblem is to use a full system simulator to extract arecord of network activity (a trace) and feed it into a tracebased network simulator to evaluate various networkconfigurations. Trace based simulations run much fasterthan full system simulations, and are widely used [2],[3], [4], [5], [6], [7], [8], [9], [10], [11]. Unfortunately, thesetraces only include information about the order of andtime between packet transmissions. In real systems thereare dependencies between packets as well - some out-going packets cannot be generated until incoming datahas been received, for example. These dependencies areanalogous to data dependencies in pipelined processors,and will be referred to as reception dependencies.
While a trace from a given full system simulationwill implicitly include the reception dependencies forthat particular network configuration, the whole purposeof network simulation is to be able to vary networkparameters and evaluate the results. The absence ofexplicit information about reception dependencies meansthat packets are often injected into the network by thesimulator at a higher rate than would occur in a realsystem, because the simulator does not know it needsto wait for certain events to occur. The ramificationof this unrealistically high packet injection rate is thatmeasured latencies can climb dramatically for the net-work being analyzed, since many messages are spendingan artificially large amount of time sitting in networkbuffers. Simulating a trace taken from a slower networkon a higher performing network is also a problem,

IEEE TRANSACTIONS ON COMPUTERS, VOL. 61, NO. 11, NOVEMBER 2012 2
TABLE 1Example Trace
Packet # Time Sent Source Destination1 20 A C2 22 B C3 24 C D4 26 D A
because it may not show the simulated network’s truepotential since packets are injected at a lower rate thanthey would be in a real system. Thus, drawing anymeaningful conclusion about system parameters such asoverall speedup or ideal buffer size based on trace sim-ulation results is exceedingly difficult, if not impossible.Unfortunately, many studies that use dependency-freetraces do include results relating to network speedup [3],[4], [6], normalized execution time [2], [5], or networklatency [2], [7], [8], [9], [10].
The rest of this paper is organized as follows: Section 2provides a motivating example that shows why includ-ing dependency information in traces is so important,and Section 3 introduces our proposed solution. We dis-cuss related works from the literature in Section 4. Sec-tion 5 provides a detailed description of our PDG GENalgorithm, and the accuracy of PDG GEN, as well asthe feasibility of using it in conjunction with commonsimulation tools, is evaluated in Section 6.
2 MOTIVATION
2.1 Simple ExampleTo better understand the potential pitfalls of simulat-
ing networks using traces that do not include depen-dencies, consider the example trace shown in Table 1,obtained from a full system simulation which used anetwork with a single cycle latency. Executing this traceon a network simulator which also has a latency ofone cycle (see Space-Time Diagram in Figure1(a)) willindicate that the program completes at time 27 (one cycleafter packet 4 is sent). If the simulated network has a fourcycle latency, then the program will complete at time 30(four cycles after packet 4 is sent). As expected, there isa difference in completion time, and there will also be achange in average latency. This is shown graphically inFigure1(b).
But what if node C was actually gathering informationfrom nodes A and B, calculating a sum, and then sendingthe result off to node D? And what if the sum generatedby D was then sent back to node A? In this case therewould be dependencies within the trace – packet 3 can-not be sent until both packets 1 and 2 arrive, for example,and packet 4 cannot be sent until it receives packet 3.There will also be some amount of “computation” time(in this case, to perform the addition) that must elapsebetween the reception of the last dependent packet andthe transmission of the next one. Thus, in this example,if the computation time is 1 cycle then packet 3 can besent 1 cycle after both packet 1 and 2 have been received,and packet 4 can be sent 1 cycle after receiving packet
3.A full system trace generated using a single cycle
latency network will contain none of this information. Inthis trace packet 1 will arrive at node C at time 21, packet2 at time 23, a single cycle will be spent performing theaddition, at time 24 node C will transmit its value, andat time 27 the simulation will complete (see Figure1(c)).However, if the latency used by the full system simulatoris changed to four, packet 3 will not be sent until time27 (since packet 2 is received at time 26), which delaysthe reception of packet 3 until time 31. This in turndelays the transmission of packet 4 until time 32, andthe completion time climbs to 36 (see Figure1(d)). Thefact that there are dependencies in the trace that are notexplicitly identified means the trace based simulationwill report a completion time that is artificially low,because it is injecting packets into the network at toohigh of a rate. This simple example highlights the im-portance of including reception dependencies in tracedbased network simulation.
2.2 Real World ExampleThe results of the intuitive example from the previous
subsection can be corroborated by comparing full systemsimulation results (which is the true indicator of per-formance) with the output of a trace based simulation,where the trace is generated on one network topology,and then used in a network simulation of a differenttopology. The full system simulator Simics 3.0 [12] andthe memory and on-chip network timing model GEMS2.1.1 [13] were used to perform this experiment.
We configured Simics to model a 16 core processorusing a fully connected single cycle network, and rana 1 million complex data point FFT benchmark fromthe SPLASH-2 parallel benchmark suite [14] and createda trace of network activity. This trace was used byGarnet [15] (the network simulator inside GEMS) innetwork-only standalone mode connected single cyclelatency network. In this simulation each packet wasinjected into the network at the timestamp specified inthe trace, and as expected the results of this simulationmatched the results obtained from Simics. The sametrace was then used to re-run the network-only sim-ulation on three different topologies: a torus, a mesh,and a fattree. Additionally, the actual FFT full systemsimulation was re-run on a torus, mesh, and fattree. Acomparison of the trace results and full system simula-tion results are presented in 2.
As Figure 2(a) shows, the total execution time reportedby the trace based simulations change very little for dif-ferent topologies because each packet is always injectedinto the network at a fixed time. Figure 2(b) shows thataverage network latency was not severely affected untilthe trace was run on a network with a low enoughbandwidth that congestion began to occur. These resultsindicate that a trace by itself represents the packet injec-tion distribution for the specific network configurationon which the trace was collected - however, when it is

IEEE TRANSACTIONS ON COMPUTERS, VOL. 61, NO. 11, NOVEMBER 2012 3
(a) Base Example, Latency=1 (b) Extended Latency Example, Latency=4
(c) Base Example including Dependencies (d) Extended Latency Example including Dependen-cies
Fig. 1. Example space-time diagram (without dependencies (a), (b), and with dependencies (c) and (d))
(a) Execution Time (b) Average Network Latency
Fig. 2. 1M point FFT execution time (a) and average network latency (b) for Simics full system simulation and tracebased network simulation
used on a different network configuration, it no longerrepresents the actual packet injection distribution for theapplication and hence can yield erroneous results.
3 PROPOSED SOLUTION
Augmenting a trace with information about the packetdependencies inherent in the application would makethe packet injection times closer to what would actuallyhappen if the application was re-run on each new net-work configuration, and would lead to simulation resultsthat are more meaningful and reliable. An obvious ap-proach is to modify the existing simulator to explicitlyextract the dependencies when generating the trace;unfortunately, this approach is unrealistic because de-pendency tracking in a shared memory system requiresmaintining dependency lists for each memory location.Furthermore, the dependency list for an operation resultis the union of the operands’ dependency lists. While itis clear that explicit dependency information cannot beextracted, it can be inferred from a series of full systemsimulations of an application of interest, and then addingthis information to the trace. Using a different networkconfiguration for each full system run exposes informa-tion about the dependency relationships between dif-ferent packets, which can be extracted by comparingthe different traces. Using this approach we are able tocreate a Packet Dependency Graph (PDG), which is essen-
tially a trace augmented with dependency information.This PDG can be used by a traditional cycle-accuratenetwork simulator with only minor code changes, andallows researchers to utilize fast, reconfigurable networksimulators in their research while retaining much of thefidelity of full system simulators.
The algorithm that produces a PDG from a set ofinput traces will be referred to as the PDG GEN algo-rithm, and it has been validated against the SPLASH-2 parallel benchmark suite running on the Simics fullsystem simulator using the GEMS memory and on-chipnetwork timing model. PDG GEN achieves an averageerror rate of 19.9% in end-to-end execution time and anaverage error rate of 1.91% in average packet latency,compared to full system simulations. This is a substantialimprovement over traditional timestamp traces, whichhave average error rates of 45.4% and 7550% in executiontime and average packet latency, respectively.
4 RELATED WORK
The relevant related work can be classified into threebroad categories - software based functional/timing sim-ulation, FPGA based emulation of either the functionalor the timing model (or both), and high-level workloadmodeling using statistical techniques. BookSim 2.0 [16]is one of the first and most basic network-on-chip sim-ulators. It does not use traces from real applications,
IEEE TRANSACTIONS ON COMPUTERS, VOL. 61, NO. 11, NOVEMBER 2012 4
but instead uses synthetic traffic to predict the averagelatency of a network. Garnet [15] is the successor toBookSim, and it incorporates detailed timing and powermodels. In its stand-alone configuration it also uses traceswithout any dependency information, so it suffers fromthe pitfalls described previously.
Simics [12] is a commercial tool that allows full-systemfunctional simulation. However, as the benchmarkingdata in [17] shows, it is very slow and does not scalebeyond approximately 16 cores due to prohibitivelylong simulation times. Furthermore, it does not haveany support for modeling on-chip networks and lacksa timing model for the underlying architecture of thenetwork. GEMS [13] provides a timing model and net-work model on top of Simics, making it one of the mostwidely used simulators in the architecture communitytoday. However, since it runs on top of Simics, it is(obviously) even slower and less scalable, and unsuitablefor fast design space exploration. Graphite [18] is arecent effort from MIT to take advantage of multiplemachines to accelerate functional simulation of as manyas 1024 cores. However, Graphite does not maintainstrict ordering of events in the system, and as a resultit is unsuitable for evaluating on-chip networks (a pointthe authors themselves mention in their paper). Hest-ness et. al [19] recognize the necessity for dependencyinformation within traces, and propose a technique thatuses a trace of memory references from a single fullsystem simulation to generate a trace of cache coherencytraffic which includes the direct dependencies betweencoherence messages. While their technique shares manysimilarities with the contributions of this work, it is morelimited in scope than the proposed PDG GEN algorithmbecause it does not have the ability to infer complexdependencies between memory references, which neces-sitates multiple full system runs.
In parallel with these developments, in the designautomation community (where fast design space ex-ploration and application-specific customization of net-works is important) researchers are exploring the possi-bilities of high-level network traffic models [20]. Mar-culescu [21] was the first to propose a mathematicalcharacterization of node to node traffic for the MPEG-2application. Soteriou et. al [22] generalized this to a com-prehensive network traffic model based on hop-count,burstiness and packet injection distributions. Kim et.al [23] take a somewhat different approach by proposinga closed-loop network simulation using synthetic trafficpatterns representing a certain pre-determined amountof work. Wei et. al [24] propose dynamically mappingrealistic multi-threaded applications to a cycle-accurateNOC simulator in order to gather detailed informationabout network performance.
Gratz and Keckler [25] provide a detailed analysis ofwhy existing approaches to simulation are not appropri-ate, and make a case for realistic workload characteriza-tion that includes the temporal and spatial imbalancesin network traffic distribution. Their work supports the
central argument in this paper, which is that failing toproperly model packet injection rate leads to substan-tial inaccuracies. The solution advocated by Gratz andKeckler is to provide synthetic traffic models enhancedby the network traffic characteristics, while we proposethe creation of traces from full-system simulation thatare augmented with a model for packet injection that isapplication specific.
5 PDG GEN IMPLEMENTATIONThe PDG GEN algorithm uses a two-step approach,
which consists of a sampling step followed by the useof an inference heuristic to infer the PDG from the sam-ples generated in the first step. Before describing thesesteps, we present the formal model of the computingenvironment assumed by PDG GEN. Pseudocode forthe algorithms described in this section can be foundin [26].5.1 Formal Model5.1.1 Traces
A trace is defined as a time-ordered list of events. Anevent Ei is a 4-tuple < Ti, Li, Ri, Pi >, where i is theentry number in the list, Ti is the time stamp of the globalclock, Li is the local node, Ri is the remote node, andPi is the unique packet ID. If Li is the sender of thepacket and Ri is the receiver of the packet, then Ei is atransmit event. Each transmit event results in one or morereceive events. For example, the transmit event, Ei =<Ti, Li, Ri, Pi > results in a receive event at node Ej =<Tj , Ri, Li, Pi >, where Tj is the clock cycle at which thepacket is received by node Ri. Note that Tj − Ti is thenetwork latency for the packet Pi.
It is assumed that if an application is run with networkconfiguration A, and then with network configuration B,the two resulting traces will have the same set of packetsbeing sent and recieved, albeit at different times.1. Moreformally, for each event Ea =< Ta, La, Ra, Pa > intrace A, there will be a corresponding event Eb =<Tb, Lb, Rb, Pb > in trace B in which La = Lb, Ra = Rb,and Pa = Pb, but Ta may be different than Tb. Thisassumption also implies that the mapping of the appli-cation to network nodes is fixed, and that in both runA and run B each node was performing the same set oftasks.5.1.2 Computation Model
Each node n in the on-chip network is modeled asa single computational element, which generates packettransmit events and consumes packet receive events. Anode transmits the same packets in the same order eachtime an application is run. Each time a node transmits apacket, it is modeled as the result of some computationthat has a set of input values. Inputs could be valuespreviously calculated at the node, or be values receivedfrom other nodes. Each transmit event is therefore mod-eled as having a computation time and a set of 0 or more
1. In practice this assumption does not hold and is addressed inSection 5.4.2

IEEE TRANSACTIONS ON COMPUTERS, VOL. 61, NO. 11, NOVEMBER 2012 5
receive dependencies, which are receive events that mustoccur at a node before the computation for the transmitcan begin.
Node n will transmit packet p once the following3 requirements have been satisfied: 1) n has alreadytransmitted the packet that it is supposed to transmitbefore p, 2) each packet in p’s set of receive dependencieshas been received by n, and 3) p’s computation time haselapsed since both 1) and 2) have been satisfied.5.2 Sample Trace Generation
The PDG GEN algorithm takes as input a set of tracesof the form described in Section 5.1.1. The traces aregenerated by running an application of interest multipletimes, each time using a different network configura-tion. Each trace will therefore capture the behavior ofthe same application under a different set of networkconditions.
The first trace (referred to as the base trace is generatedby running the application of interest on a Fully Con-nected Network (FCN) with single cycle link latencies.This configuration was chosen because it represents an“ideal” network and will expose computational delaysand hence the real dependencies that may otherwisebe hidden due to queuing, routing and other non-deterministic mechanisms. Using information from thebase trace, the nodes are partitioned into m sets withpairs of nodes that are communicating the most placedin different sets.
An additional m traces are then generated by run-ning the application of interest on FCNs in which theoutgoing links of the nodes in one of the m partitionshave a large latency, p, while the remaining links havesingle cycle latency. If there are n nodes, then eachpartition will contain n
m nodes. The lopsided latencies inthe partitioned network configurations serve to exposeinformation about dependencies between packets - somepackets will be delayed while waiting for dependenciesfrom slow nodes, while others with no dependencies onpackets from slow nodes will not be delayed.5.3 PDG GEN Algorithm
The PDG GEN algorithm has two tasks: to infer adependency set and to calculate a computation time foreach packet. In general, for a given transmit event Ei,any event at that node that has occurred before Ei couldbe in its dependency set. This is a problem, since thereare usually millions of packets in a trace. To deal withthis, two simplifying assumptions are made. The firstis that transmit events at a given node are ordered (asdescribed in Section 5.1.2). This allows each transmitevent Ei at a node to always be dependent on exactlyone previous transmit event at that node, namely theimmediately preceding one. While this assumption maynot accurately model all real situations, it is importantbecause it simplifies the PDG GEN algorithm and alsoallows for simple and efficient implementation of thecode necessary to support PDGs in a network simula-tor. It should also be noted that traditional trace-based
simulations also make this assumption.The second simplification is to only consider a win-
dow of previous receive events, instead of the entirehistory. We evaluated two windowing techniques - onethat uses a fixed window size w in which only the wreceive events immediately preceding a transmit eventare considered for its dependency set, and another thatuses a dynamic window in which a transmit event onlyconsiders packets received during the window of timesince the k previous transmits at that node (for example,if k=1, a transmit can only depend on packets that havearrived since the previous transmit event at the samenode, if k=2 a transmit can only depend on packets thathave arrived since the second most recent transmit event,etc.).
The PDG GEN algorithm uses the base trace and madditional sample traces (as described in Section 5.2) togenerate a receive dependency set (Si) and a compu-tation time (Di) for each packet. PDG GEN follows 3steps:STEP 1: For each transmit event Ei in each of the traces,add all the receive events within the window (k or w) toEi’s set of potential receive dependencies, Si.STEP 2: Remove all receive events from Si that violatecausality, i.e. arrive after the transmit event Ei, in any ofthe m traces.STEP 3: Find the computation time (Di) associated withthe transmit event Ei.
The initial computation delay for each event is com-puted using the base trace. Let Ei =< Ti, Li, Ri, Pi > bea transmit event at node Li. Recall that this event willoccur at cycle Ti, after all the packets in its receptiondependency set have arrived. Let Tj be the clock cycleat which the last member of the reception dependencyset arrives. The initial computation delay Dj is thencalculated as Ti − Tj . The following two properties arethen used:
Property 1: If node N transmits a packet Pi at time Ti
and if the initial computation delay as computed aboveis Di, then any packet received by node N at time Tj >Ti −Di cannot be a reception dependency for Pi.
Property 2: If node N transmits packet Pi at timeTi, and Pi’s computation time is Di, then any packetreceived by n at time Tj < Ti − Di cannot be Pi’s lastreception dependency.
These properties are used to prune the set of possibledependencies. The last reception dependency for eachpacket is found in each of the m traces, and if it violatesProperty 1 in any trace, it is removed from the set Si.If any of the elements in Si violate Property 2, it meansthat the estimated computation time Di was too small,so the corresponding reception dependency is removedfrom Si. This process continues until no pruning occursfor an entire iteration of all the traces.5.3.1 PDG GEN Example
Table 2 shows transmission times (P13) and receptiontimes (P6, P7, P8, P9) for a node in three different traces.STEP 1 of the algorithm will result in adding packets P6,
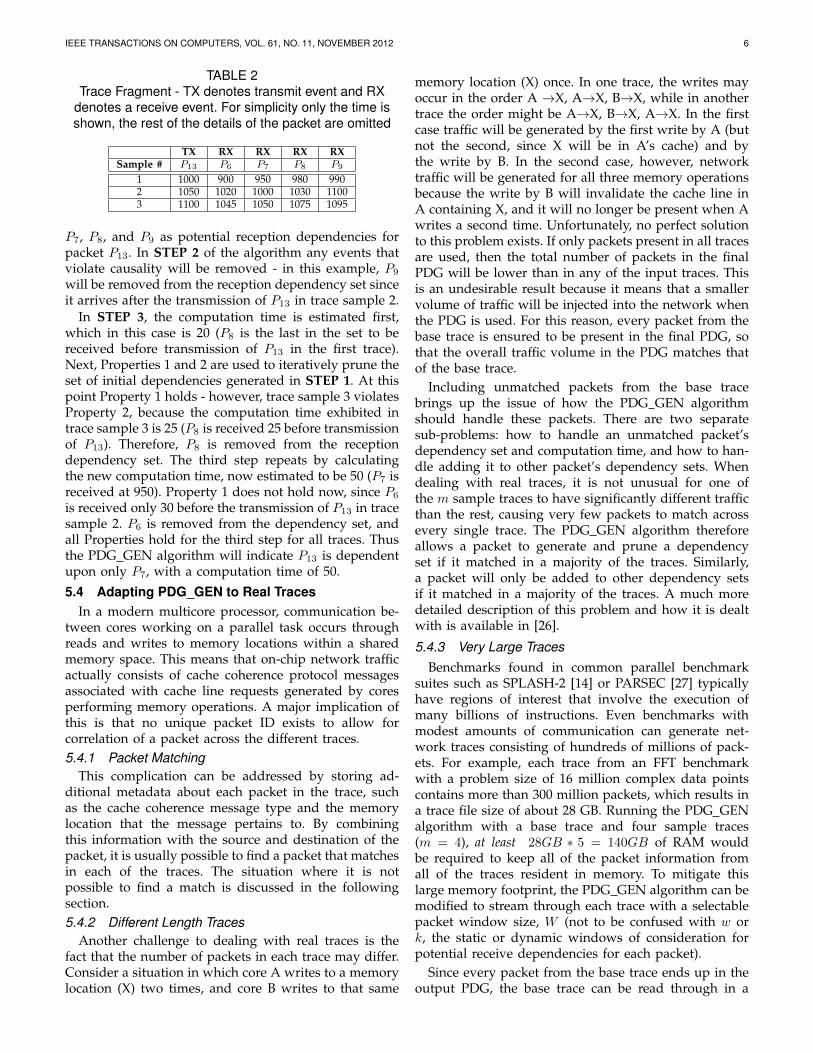
IEEE TRANSACTIONS ON COMPUTERS, VOL. 61, NO. 11, NOVEMBER 2012 6
TABLE 2Trace Fragment - TX denotes transmit event and RX
denotes a receive event. For simplicity only the time isshown, the rest of the details of the packet are omitted
TX RX RX RX RXSample # P13 P6 P7 P8 P9
1 1000 900 950 980 9902 1050 1020 1000 1030 11003 1100 1045 1050 1075 1095
P7, P8, and P9 as potential reception dependencies forpacket P13. In STEP 2 of the algorithm any events thatviolate causality will be removed - in this example, P9
will be removed from the reception dependency set sinceit arrives after the transmission of P13 in trace sample 2.
In STEP 3, the computation time is estimated first,which in this case is 20 (P8 is the last in the set to bereceived before transmission of P13 in the first trace).Next, Properties 1 and 2 are used to iteratively prune theset of initial dependencies generated in STEP 1. At thispoint Property 1 holds - however, trace sample 3 violatesProperty 2, because the computation time exhibited intrace sample 3 is 25 (P8 is received 25 before transmissionof P13). Therefore, P8 is removed from the receptiondependency set. The third step repeats by calculatingthe new computation time, now estimated to be 50 (P7 isreceived at 950). Property 1 does not hold now, since P6
is received only 30 before the transmission of P13 in tracesample 2. P6 is removed from the dependency set, andall Properties hold for the third step for all traces. Thusthe PDG GEN algorithm will indicate P13 is dependentupon only P7, with a computation time of 50.
5.4 Adapting PDG GEN to Real TracesIn a modern multicore processor, communication be-
tween cores working on a parallel task occurs throughreads and writes to memory locations within a sharedmemory space. This means that on-chip network trafficactually consists of cache coherence protocol messagesassociated with cache line requests generated by coresperforming memory operations. A major implication ofthis is that no unique packet ID exists to allow forcorrelation of a packet across the different traces.5.4.1 Packet Matching
This complication can be addressed by storing ad-ditional metadata about each packet in the trace, suchas the cache coherence message type and the memorylocation that the message pertains to. By combiningthis information with the source and destination of thepacket, it is usually possible to find a packet that matchesin each of the traces. The situation where it is notpossible to find a match is discussed in the followingsection.5.4.2 Different Length Traces
Another challenge to dealing with real traces is thefact that the number of packets in each trace may differ.Consider a situation in which core A writes to a memorylocation (X) two times, and core B writes to that same
memory location (X) once. In one trace, the writes mayoccur in the order A →X, A→X, B→X, while in anothertrace the order might be A→X, B→X, A→X. In the firstcase traffic will be generated by the first write by A (butnot the second, since X will be in A’s cache) and bythe write by B. In the second case, however, networktraffic will be generated for all three memory operationsbecause the write by B will invalidate the cache line inA containing X, and it will no longer be present when Awrites a second time. Unfortunately, no perfect solutionto this problem exists. If only packets present in all tracesare used, then the total number of packets in the finalPDG will be lower than in any of the input traces. Thisis an undesirable result because it means that a smallervolume of traffic will be injected into the network whenthe PDG is used. For this reason, every packet from thebase trace is ensured to be present in the final PDG, sothat the overall traffic volume in the PDG matches thatof the base trace.
Including unmatched packets from the base tracebrings up the issue of how the PDG GEN algorithmshould handle these packets. There are two separatesub-problems: how to handle an unmatched packet’sdependency set and computation time, and how to han-dle adding it to other packet’s dependency sets. Whendealing with real traces, it is not unusual for one ofthe m sample traces to have significantly different trafficthan the rest, causing very few packets to match acrossevery single trace. The PDG GEN algorithm thereforeallows a packet to generate and prune a dependencyset if it matched in a majority of the traces. Similarly,a packet will only be added to other dependency setsif it matched in a majority of the traces. A much moredetailed description of this problem and how it is dealtwith is available in [26].
5.4.3 Very Large TracesBenchmarks found in common parallel benchmark
suites such as SPLASH-2 [14] or PARSEC [27] typicallyhave regions of interest that involve the execution ofmany billions of instructions. Even benchmarks withmodest amounts of communication can generate net-work traces consisting of hundreds of millions of pack-ets. For example, each trace from an FFT benchmarkwith a problem size of 16 million complex data pointscontains more than 300 million packets, which results ina trace file size of about 28 GB. Running the PDG GENalgorithm with a base trace and four sample traces(m = 4), at least 28GB ∗ 5 = 140GB of RAM wouldbe required to keep all of the packet information fromall of the traces resident in memory. To mitigate thislarge memory footprint, the PDG GEN algorithm can bemodified to stream through each trace with a selectablepacket window size, W (not to be confused with w ork, the static or dynamic windows of consideration forpotential receive dependencies for each packet).
Since every packet from the base trace ends up in theoutput PDG, the base trace can be read through in a

IEEE TRANSACTIONS ON COMPUTERS, VOL. 61, NO. 11, NOVEMBER 2012 7
linear fashion, and the only packets that must be retainedin memory are those that are still within the window ofconsideration for upcoming transmits from each node.The PDG algorithm can be modified to run one packetat a time, because all the necessary information will comefrom packets that have been encountered and matchedearlier in the base trace.2
This assumption allows the introduction of a packetwindow W , which is the maximum number of packets“ahead of” and “behind” the current position in thebase trace that must be kept track of for each of theother traces. Each time a new packet is encountered inthe base trace 3 actions occur: 1) if W packets from thebase trace are already being stored, the oldest one oneis discarded, 2) if 2W packets from each the other tracesare already being stored, discard each oldest one, and 3)read forward in each of the other traces to find a newpacket.
This allows an upper bound of 2W ∗m+W packets thatmust be stored at any time while running the PDG GENalgorithm. Using a window size of W does introducea trade-off between memory footprint and matchingaccuracy, because if W is too small, packets from the basetrace may not find their match in some of the sampletraces simply because they are outside the window ofconsideration. Similarly, if the base trace is shorter thanany of the sample traces and if W is small enough,some packets at the end of those traces will never beconsidered because the packet window never reachesthem.5.5 Traffic Specific Modifications
While the PDG GEN algorithm as described thusfar only uses timing information in its analysis, it ispossible to include other traffic-specific information intothe process. For example, in the case of our Simics +GEMS simulation setup described earlier in Section 2.2,the traffic is made up of coherence messages for aMOESI directory based cache coherence protocol. Muchof the traffic consists of request and response mes-sages sent between cache controllers and directories thathave straigtforward dependency relationships, which areeasily discernable by using information about the themessage’s source, destination, coherence message type,and cache line in question. This knowledge enabled usto create a modified version of PDG GEN specific tothe MOESI directory coherence protocol. It uses coher-ence message types and memory locations to infer allprotocol-specific dependencies, and only performs thePDG GEN algorithm on initial requests. These modifici-ations were straightforward to implement, and it wouldbe possible to create a modified version of PDG GENfor any other type of traffic.
2. Each packet that is encountered in the base trace could theoreti-cally match to a packet that is transmitted at any time in each of theother traces - realistically, however, the ordering of packet transmitsin each trace should be fairly similar, meaning that a matching packetshould usually be located at roughly the same fraction of the waythrough each trace.
6 EVALUATIONTwo separate testing environments were employed to
evaluate the PDG GEN algorithm. The first approachwas to generate a reference PDG and compare it toa PDG inferred by the PDG GEN algorithm, which isdescribed in Section 6.1. The second approach was areal-world validation, in which traces captured frombenchmarks running in a full system simulator wereused by PDG GEN to create a PDG for the benchmark.This approach is described in Section 6.2 To see a moredetailed evalution, refer to [26].6.1 Reference PDG Evaluation
In order to evaluate the PDG GEN algorithm’s perfor-mance in terms of metrics like the number of dependen-cies found or missed, there must be some known refer-ence PDG to compare to the inferred PDG created by thealgorithm. This cannot be done using real applications,because no reference PDG exists for these applications.Not only that, a PDG reflects a simplified computationalmodel of what is actually happening as a parallelizedapplication is running, so it is unclear what a correctreference PDG for an application would even be.
Our solution was to generate reference PDGs usingsynthetic traffic patterns, and run the reference PDGson a network simulator to create traces that can beused as inputs to PDG GEN. The resulting inferred PDGwas then compared to the original reference PDG todetermine how closely it matches.6.1.1 Simulation Environment
There are two major components to the simulationenvironment: a traffic generation tool that creates ref-erence PDGs from synthetic traffic patterns, and a cycle-accurate on-chip network simulator that reads a PDGand injects packets into the network based upon itsreception dependencies and computation times.
The traffic generator can create any of the followingwell known traffic patterns: uniform random (rand),nearest neighbor (nn), tornado (tor), transpose (trans),bit inverse (inv), hotspot (hot), and negative exponentialdistribution (NED) [28]. It also supports three additionaltraffic patterns - Ball, Central and Tree for further stresstesting. The Ball pattern simulates a selectable numberof tokens that are randomly sent to the next node basedon NED, modeling passing a beach ball in a crowd.The Central pattern simulates a central or hotspot nodethat receives requests and responds to the source node,designed to model a central memory controller or amaster node. The Tree pattern models a barrier synchro-nization, whose performance is critical in many parallelapplications.
There are also two other traffic generator parametersof note. One is the average packet injection rate, where arate of 0.1 indicates each node transmits a packet on av-erage once every 10 cycles. The other is the dependencyrate, which is the probability that a packet transmittedby node n is dependent on each previously generatedpacket received by n. This probability compounds as

IEEE TRANSACTIONS ON COMPUTERS, VOL. 61, NO. 11, NOVEMBER 2012 8
Fig. 3. Space-Time Diagram to Illustrate Quasi-dependencies
each previously generated packet is considered - a de-pendency rate of 0.5 means that a packet has a 50%chance of being dependent on the most recent receive,and a 25% chance of being dependent on the secondmost recent, etc.
The output of the traffic generator is a known PDG–alist of packets which each have a source, a destination,a unique Packet ID, a computation time and a list ofreception dependencies. We modified the traffic injectioncode for the popular cycle-accurate network simulatorBookSim 2.0 [16] so that it could inject the packets in thePDG at the appropriate time based upon when depen-dencies are met and when computation times finish foreach packet (see [26] for details). However, any networksimulator can be similarly modified with relatively smalleffort.
6.1.2 Sensitivity Analysis
In each of the following sections, the inferred PDGis compared to the reference PDG to determine howmany dependencies were found, as well as the numberof additional quasi-dependencies that were added. Quasi-dependencies are defined as packets that are classified asdependencies in the inferred PDG, but are not explicitlystated as dependencies in the reference PDG. Figure 3illustrates the two types of quasi-dependencies. In thisfigure packet 7 is actually dependent only on packet 6,but the PDG GEN algorithm will also identify packets2 and 5 as dependencies as well since the partitioningis unlikely to be able to make either packet violatecausality. For example, a trace generated with Node Ausing slow outbound links will also slow delivery ofpacket 4 and hence delay packet 6, and slowing Node Bin a partitioning will further exacerbate the problem. For-tunately, regardless of topology, quasi-dependent packet2 is highly unlikely to ever be the last dependencymet since it is transmitted before packet 4, which thetrue dependency (packet 6) is itself dependent upon.However, quasi-dependencies of the form of packet 5are of greater concern, since it is possible that for sometopology packet 5 will be received after packet 6 (thetrue dependency). Fortunately, Property 1 and Property2 (Section 5.3) used in the PDG GEN algorithm aremore likely to prune packet 5 from the set of receptiondependencies than packet 2, thus reducing the potential
impact on predicted execution time.6.1.3 Number of Partitions, m
As described in Section 5.2, m is the number of parti-tions into which the nodes should be placed, as well asthe number of additional simulations to run and acquiretraces from. Figure 4(a) shows the number of true andquasi-dependencies (normalized to the reference PDG)found for values of m varying from 0 (only base FCNtrace) to 64 (base FCN trace plus 64 sample traces eachwith a slow node). Figure 4(b) shows the average percenterror in packet computation time for varying values ofm. The reference PDG that was used consisted of 64node NED traffic with a dependency rate of 0.5 and aninjection rate of 0.01. PDG GEN was run with a windowsize of k=1, which was able to identify most of thedependencies in the base trace (m=0). Figure 4(b) doesshow that when m = 0 the computation time error isfairly high, but increasing m beyond 2 yields almost nogain in either dependency identification or computationtime accuracy.
These results indicate that the main reason to use alarger value of m is to reduce the number of quasi-dependencies in the inferred PDG. As later analysis inSection 6.1.6 shows, even with a large number of quasi-dependencies present, the inferred PDG and referencePDG still tend to perform similarly during actual net-work simulations. Furthermore, when full system simu-lations are being used to generate traces, increasing mmeans increasing the number of computationally expen-sive full system simulations that are required to generatethe PDG. Therefore, m should be picked according to thedetails of the situation at hand - how long the initialfull system simulations take (and how many can beperformed in parallel), how sensitive the network sim-ulator’s performance is to tracking extra dependencies,and how many times the PDG will be re-used.6.1.4 Partitioned Link Latency, p
Section 5.2 also describes p, which is the latency ofall the outgoing links from the nodes in one “slow”partition. Each sample simulation has a different par-tition selected as the slow partition. Figures 5 and 6show the accuracy of PDG GEN for varying values of p.Figures 5(a) and 5(b) show the number of dependenciesfound for NED and Tree traffic patterns, respectively,while Figures 6(a) and 6(b) show the average percenterror in the computation time that PDG GEN calculatedfor each packet. PDG GEN was run with m=4 and k=1,and both NED and Tree consist of 64 node traffic withan injection rate of 0.01 and a dependency rate of 0.5.
For NED, the initial increase of p from 1 to 2 yieldslarge improvements, because when p = 1 the sampletraces are identical to the base trace. Increasing p beyond2 yields small improvements in the number of true de-pendencies found initially, at the cost of small increasesin the number of quasi-dependencies found. However,further increases in p slowly but steadily increases thenumber of quasi-dependencies found. This is because

IEEE TRANSACTIONS ON COMPUTERS, VOL. 61, NO. 11, NOVEMBER 2012 9
(a) Dependencies Found (b) Computation Time Error
Fig. 4. Normalized number of dependencies found (a) and average percent error in computation time (b) for NEDtraffic pattern for varying values of m.
(a) Dependencies Found for NED (b) Dependencies Found for Tree
Fig. 5. Normalized number of dependencies found for NED (a) and Tree (b) traffic patterns for varying values of p.
(a) Computation Time Error for NED (b) Computation Time Error for Tree
Fig. 6. Average percent error in computation time for NED (a) and Tree (b) traffic patterns for varying values of p.
some packets will start out with a larger set of initialreceive dependencies when p increases, and any of thesepackets that cannot be pruned will increase the numberof quasi-dependencies found. Note that as the numberof quasi-dependencies become very large, the error incomputation time begins to grow significantly as well.
The other traffic patterns studied exhibit behavior sim-ilar to NED as p is increased, with one notable exception.For Tree, increasing p steadily increases the number oftrue dependencies found, while simultaneously decreas-ing both quasi-dependencies and computation time er-rors. This result highlights one of the challenges faced byPDG GEN; different traffic patterns may require differ-ent parameters, but it is not clear how to determine thecorrect values for these parameters without a referencePDG to compare against.
6.1.5 Window Sizes, w and k
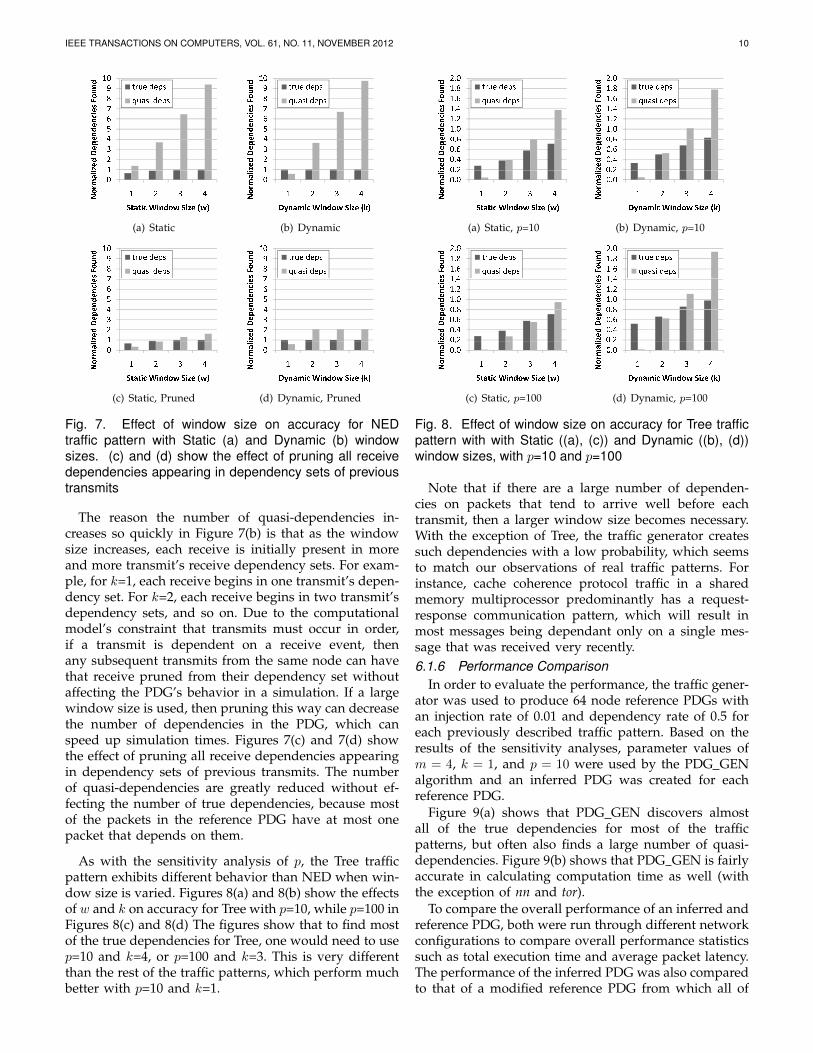
As Section 5.3 describes, w is a static window size con-taining the number of receive events at a node precedinga transmit event that will be considered as possibledependencies for the transmit, while k is a dynamicwindow size containing the number of previous transmitevents to go back when considering potential receivedependencies for a transmit. PDG GEN can use either astatic or dynamic window (w or k).
Figure 7(a) shows the performance of PDG GEN on64 node NED traffic for varying values of w. The resultsdemonstrate that as the window size grows the numberof true dependencies detected increases, but the numberof quasi-dependencies climbs even faster. In Figure 7(b),varying values of k are used, and the results show thatusing a dynamic window of k=1 tends to perform welldue to its adaptive nature.
IEEE TRANSACTIONS ON COMPUTERS, VOL. 61, NO. 11, NOVEMBER 2012 10
(a) Static (b) Dynamic
(c) Static, Pruned (d) Dynamic, Pruned
Fig. 7. Effect of window size on accuracy for NEDtraffic pattern with Static (a) and Dynamic (b) windowsizes. (c) and (d) show the effect of pruning all receivedependencies appearing in dependency sets of previoustransmits
The reason the number of quasi-dependencies in-creases so quickly in Figure 7(b) is that as the windowsize increases, each receive is initially present in moreand more transmit’s receive dependency sets. For exam-ple, for k=1, each receive begins in one transmit’s depen-dency set. For k=2, each receive begins in two transmit’sdependency sets, and so on. Due to the computationalmodel’s constraint that transmits must occur in order,if a transmit is dependent on a receive event, thenany subsequent transmits from the same node can havethat receive pruned from their dependency set withoutaffecting the PDG’s behavior in a simulation. If a largewindow size is used, then pruning this way can decreasethe number of dependencies in the PDG, which canspeed up simulation times. Figures 7(c) and 7(d) showthe effect of pruning all receive dependencies appearingin dependency sets of previous transmits. The numberof quasi-dependencies are greatly reduced without ef-fecting the number of true dependencies, because mostof the packets in the reference PDG have at most onepacket that depends on them.
As with the sensitivity analysis of p, the Tree trafficpattern exhibits different behavior than NED when win-dow size is varied. Figures 8(a) and 8(b) show the effectsof w and k on accuracy for Tree with p=10, while p=100 inFigures 8(c) and 8(d) The figures show that to find mostof the true dependencies for Tree, one would need to usep=10 and k=4, or p=100 and k=3. This is very differentthan the rest of the traffic patterns, which perform muchbetter with p=10 and k=1.
(a) Static, p=10 (b) Dynamic, p=10
(c) Static, p=100 (d) Dynamic, p=100
Fig. 8. Effect of window size on accuracy for Tree trafficpattern with with Static ((a), (c)) and Dynamic ((b), (d))window sizes, with p=10 and p=100
Note that if there are a large number of dependen-cies on packets that tend to arrive well before eachtransmit, then a larger window size becomes necessary.With the exception of Tree, the traffic generator createssuch dependencies with a low probability, which seemsto match our observations of real traffic patterns. Forinstance, cache coherence protocol traffic in a sharedmemory multiprocessor predominantly has a request-response communication pattern, which will result inmost messages being dependant only on a single mes-sage that was received very recently.6.1.6 Performance Comparison
In order to evaluate the performance, the traffic gener-ator was used to produce 64 node reference PDGs withan injection rate of 0.01 and dependency rate of 0.5 foreach previously described traffic pattern. Based on theresults of the sensitivity analyses, parameter values ofm = 4, k = 1, and p = 10 were used by the PDG GENalgorithm and an inferred PDG was created for eachreference PDG.
Figure 9(a) shows that PDG GEN discovers almostall of the true dependencies for most of the trafficpatterns, but often also finds a large number of quasi-dependencies. Figure 9(b) shows that PDG GEN is fairlyaccurate in calculating computation time as well (withthe exception of nn and tor).
To compare the overall performance of an inferred andreference PDG, both were run through different networkconfigurations to compare overall performance statisticssuch as total execution time and average packet latency.The performance of the inferred PDG was also comparedto that of a modified reference PDG from which all of

IEEE TRANSACTIONS ON COMPUTERS, VOL. 61, NO. 11, NOVEMBER 2012 11
(a) Dependencies Found (b) Computation Time Error
Fig. 9. Normalized number of dependencies found (a) and average percent error in computation time (b) for eachtraffic pattern
the reception dependencies have been removed (referredto as a stripped PDG).
BookSim was used to run a simulation of an 8x8mesh with two virtual channels, for each reference andinferred PDG. The total execution time and averagepacket latency of the inferred and stripped PDGs werethen normalized to the reference PDG, and the resultsare shown in Figure 10(a) and Figure 11(a). These figuresshow that on average the execution times of the inferredPDGs were within 0.55% of the reference PDGs, andaverage packet latencies were within 0.27%. In contrast,the stripped PDG varied widely from the reference PDG,with average errors of 89.18% in execution time and27464% in latency. The stripped PDG results show onceagain that failing to accurately model packet injectionrates can lead to incredibly inaccurate conclusions abouthow a traffic pattern will perform on a network.
The largest discrepancies for the inferred PDG were a2.25% error in execution time and 1.59% error in latency,both seen in the Tree traffic pattern. This is to be ex-pected, as the previous sections have shown that the Treetraffic pattern performs best with different PDG GENsettings than the others. Figures 10(b) and 11(b) showthe same PDGs running on a 3 level FatTree network,and the inferred PDG performed very similarly to themesh case, with an average execution time error of 0.32%and average latency error of 0.30%. These results indicatethat an inferred PDG can match a reference PDG veryclosely in overall network behavior, despite the presenceof quasi-dependencies and computation time error.
6.2 Simics EvaluationAfter performing direct quantitative comparisons be-
tween reference and inferred PDGs, the next step wasto use the PDG GEN algorithm on traces from full sys-tem simulations of real applications. As with the initialmotivating experiment in Section 2.2, Simics 3.0 [12] andGEMS 2.1.1 [13] were used as the full system simulationframework, and Garnet (the network simulator withinGEMS) was modified to record a trace of each packettransmit and receive event that occurs during a fullsystem simulation.
With this modification, multiple Simics simulations ofan application of interest can be run to acquire the nec-
essary input traces for use by the PDG GEN algorithm.However, the traces acquired in this manner are not
directly usable by PDG GEN. As described earlier, thereare no explicit packet IDs to identify packets acrossthe traces, and the traces are of different lengths. Toaccommodate this, the matching algorithm describedin Section 5.4.1 was used to generate usable traces.The PDG GEN algorithm was also modified to use thewindowing scheme described in Section 5.4.3 in order toaccommodate the very large traces that are generated byrunning real applications.
The PDGs obtained from the setup described abovecan be used by any network simulator that has beenmodified to support the injection of a PDG file intothe network. We modified Garnet to support PDGs, inorder to allow a direct comparison between full-systemSimics simulations (which use the Garnet simulator) andnetwork-only Garnet simulations using PDGs.
6.2.1 Simics Comparison ResultsIn this section overall performance results are pre-
sented for the PDG GEN algorithm and each benchmarkfrom the SPLASH-2 parallel benchmark suite. To gener-ate the results Simics and GEMS were configured with16 directories using the MOESI SMP directory cachecoherency protocol, and 16 1 CPI in-order processorseach with 16KB L1 instruction and data caches andprivate 4MB L2 caches (for a total of 32 distinct nodes inthe on-chip network). Pipelined out of order processorswere not modeled because we are only looking at themessages out the back side of the memory heirarchy, andany out of order behavior should be absorbed by the var-ious levels of the cache. PDGs were generated for eachbenchmark using m = 4 and p = 50, and then simulatedon Garnet running in standalone network mode usingtwo new network topologies–a mesh and a fattree, withthe network clock speed cut in half and a link pipelinedepth of 10 cycles (to simulate a resource-constrainednetwork). The networks had 4 virtual channels and 16byte flits. These results were then compared to Simicssimulations of the same benchmarks on the same twonetwork configurations.
Figure 12(a) shows the execution times and Fig-ure 12(b) shows the average packet latencies for Simics,

IEEE TRANSACTIONS ON COMPUTERS, VOL. 61, NO. 11, NOVEMBER 2012 12
(a) 8x8 Mesh (b) 3 Level FatTree
Fig. 10. Normalized execution time for different traffic patterns for Stripped PDG, Reference PDG and Inferred PDGon 8x8 mesh (a) and 3 level FatTree (b) networks
(a) 8x8 Mesh (b) 3 Level FatTree
Fig. 11. Normalized latency for different traffic patterns for Stripped PDG, Reference PDG and Inferred PDG on 8x8mesh (a) and 3 level FatTree (b) networks
(a) 8x4 Mesh (b) 3 Level FatTree
Fig. 12. Normalized execution time for different SPLASH-2 benchmarks for traditional trace, Simics simulation, andPDG on 8x4 mesh (a) and 3 level FatTree (b) networks
PDG, and traditional trace simulations for each bench-mark (normalized to the execution time of the Simicssimulations) running on an 8x4 mesh network. The basetrace was used for the traditional trace simulations.These results show that while the PDGs are not perfectat predicting execution time, they are far superior tothe traditional method of using a timestamp-based trace.Notice also that even when the PDGs significantly miss-predict execution time, they still result in very accu-rate packet latency estimates. Both the FFT and FMMbenchmarks on fattree show situations where using atraditional trace leads to highly inaccurate packet latencyestimates.
Another interesting thing to note is that sometimesthe PDG will underestimate execution time due to a
significant increase in the number of packets generatedby a benchmark on one of the new networks comparedto the base trace. For example, the Cholesky benchmarkgenerated 33% more packets when run on the meshnetwork than when run on the base FCN network. Itis quite possible that this difference in trace size is thetrue reason for the PDG underestimating execution time(Figure 12(a)), and not that it failed to infer enoughdependencies or accurately calculate computation times.And even in these cases the PDG still did a good job ofpredicting average packet latency (Figure 13(a)).
However, some PDGs did misspredict execution timedue to inaccuracies in the PDG GEN algorithm. Forexample, PDG significantly underestimated LU’s execu-tion time on fattree, despite only a 15.1% trace size dif-

IEEE TRANSACTIONS ON COMPUTERS, VOL. 61, NO. 11, NOVEMBER 2012 13
(a) 8x4 Mesh (b) 3 Level FatTree
Fig. 13. Normalized latency for different SPLASH-2 benchmarks for traditional trace, Simics simulation, and PDG on8x4 mesh (a) and 3 level FatTree (b) networks
ference. PDG also significantly overestimated Volrend’sexecution time on fattree even though there was only a4.7% trace size difference. This highlights an issue firstuncovered by the NED and Tree synthetic traffic patternsin Section 6.1.4: different traffic patterns may requiredifferent PDG GEN settings.
Overall, the PDGs had an average error of 20.8% inexecution time on the mesh network, and an averageerror of 18.9% in execution time on the fattree network.In contrast, the traditional traces had an average errorof 43.4% and 47.3% in execution time on the mesh andfattree networks, respectively. This means that on aver-age, the PDGs were 2.3 times more accurate at predictingexecution time. The PDGs were even better at predictingaverage packet latency, with average errors of 1.66% and2.16% on the mesh and fattree networks, respectively.The traditional traces had an average error of 3.81% inpacket latency on the mesh network, and 15100% onthe fattree network (due to the catastrophically largeover-estimates for FFT and FMM; see Figure 13(b)). Thismeans that the PDGs were 2.3 times better at predictingaverage packet latency on the mesh network, and 6990times better at predicting average packet latency on thefattree network. This shows that as a network becomesmore resource constrained, the PDGs become increas-ingly better than traditional traces at predicting packetlatency because they throttle injection rates appropriatelyand never flood the network with packets the waytraditional traces do.
6.2.2 Traffic Specific PDGsIn Section 5.5 we discussed the possibility of mod-
ifying the PDG GEN algorithm to take advantage oftraffic-specific behavior. To demonstrate the viability ofthis approach, we developed a version of the PDG GENalgorithm that works specifically with the MOESI direc-tory cache coherence traffic used in these Simics sim-ulations. We used the modified PDG GEN algorithm togenerate modified PDGs for each SPLASH 2 benchmark,and ran them on the same mesh and fattree networks.Averaged across all of the benchmarks on both of thesenetworks, the modified PDGs were 22% more accurateat predicting execution time and 2% more accurate atprediciting packet latency than the original PDGs. While
these gains are modest, the required effort to modifythe algorithm was equally modest. Overall, these resultsshow that the PDG GEN algorithm can be applied toreal-world benchmarks that are commonly employed byresearchers today, and afford significant accuracy gainsover traditional trace based simulation methods.
7 CONCLUSIONThe goal of this work was to improve the accu-
racy of trace based cycle-accurate network simulation,a commonly used on-chip network evaluation method.A full system simulation environment (Simics+GEMS)was used to demonstrate that simply recording a net-work trace from an application fails to incorporate keyinformation about packet injection rates, and can leadto inaccurate results. The PDG GEN algorithm was pre-sented, which infers dependency information betweenpackets based upon a set of traces gathered from multi-ple full system simulations of an application. Evaluationsusing both synthetic and real traffic patterns show thatPDG GEN can increase the accuracy of network simu-lations significantly compared to the standard techniqueof simple trace based simulation.
While the results presented here are encouraging,there are several avenues of future work. Differentclasses of traffic patterns (for example, Tree vs. NED)may call for different settings of the PDG GEN algo-rithm’s parameters, or even modifications to the com-munication model, such as removing total ordering oftransmits. Additionally, Kamil et. al [29] have shown thatparallel scientific applications often go through programphases in which traffic patterns and volumes changedrastically. An initial high-level traffic analysis phasecould be added to PDG GEN, which identifies trafficcharacteristics and program phases to determine optimalsettings. Work can also be done to apply PDG GEN tonew communication paradigms, such as on-chip mes-sage passing traffic and traffic for emerging architecturessuch as such as System-on-Chip (SoC) or General Pur-pose Graphics Processing Units (GPGPU).
ACKNOWLEDGMENTSThis research is partially supported by NSF Award #
CCF–1116897.
IEEE TRANSACTIONS ON COMPUTERS, VOL. 61, NO. 11, NOVEMBER 2012 14
REFERENCES
[1] C. H. van Berkel, “Multi-core for mobile phones,” in DATE, 2009,pp. 1260–1265.
[2] D. Zhao et al., “Design of multi-channel wireless noc to improveon-chip communication capacity,” in Networks-on-Chip (NOCS),2011 Fifth ACM/IEEE International Symposium on, May 2011, pp.177–184.
[3] D. Vantrease et al., “Corona: System implications of emergingnanophotonic technology,” in ISCA ’08: Proceedings of the 35thInternational Symposium on Computer Architecture. Washington,DC, USA: IEEE Computer Society, 2008, pp. 153–164.
[4] G. Hendry et al., “Analysis of photonic networks for a chipmultiprocessor using scientific applications,” Networks-on-Chip,International Symposium on, vol. 0, pp. 104–113, 2009.
[5] Y. Pan et al., “Firefly: illuminating future network-on-chip withnanophotonics,” SIGARCH Comput. Archit. News, vol. 37, no. 3,pp. 429–440, 2009.
[6] M. J. Cianchetti et al., “Phastlane: a rapid transit optical routingnetwork,” SIGARCH Comput. Archit. News, vol. 37, no. 3, pp. 441–450, 2009.
[7] N. Eisley et al., “In-network cache coherence,” in MICRO 39:Proceedings of the 39th Annual IEEE/ACM International Symposiumon Microarchitecture. Washington, DC, USA: IEEE ComputerSociety, 2006, pp. 321–332.
[8] J. Kim et al., “A novel dimensionally-decomposed router foron-chip communication in 3d architectures,” SIGARCH Comput.Archit. News, vol. 35, no. 2, pp. 138–149, 2007.
[9] D. Park et al., “Design of a dynamic priority-based fast patharchitecture for on-chip interconnects,” in HOTI ’07: Proceedings ofthe 15th Annual IEEE Symposium on High-Performance Interconnects.Washington, DC, USA: IEEE Computer Society, 2007, pp. 15–20.
[10] N. E. Jerger et al., “Virtual circuit tree multicasting: A case foron-chip hardware multicast support,” SIGARCH Comput. Archit.News, vol. 36, no. 3, pp. 229–240, 2008.
[11] J. Kim et al., “Flattened butterfly topology for on-chip networks,”Microarchitecture, IEEE/ACM International Symposium on, vol. 0, pp.172–182, 2007.
[12] P. Magnusson et al., “Simics: A full system simulation platform,”Computer, vol. 35, no. 2, pp. 50–58, Feb 2002.
[13] M. M. K. Martin et al., “Multifacet’s general execution-driven mul-tiprocessor simulator (gems) toolset,” SIGARCH Comput. Archit.News, vol. 33, no. 4, pp. 92–99, 2005.
[14] S. C. Woo et al., “The splash-2 programs: characterization andmethodological considerations,” in ISCA ’95: Proceedings of the22nd annual international symposium on Computer architecture. NewYork, NY, USA: ACM, 1995, pp. 24–36.
[15] L.-S. Peh et al., “Garnet: A detailed on-chip network model insidea full-system simulator,” International Symposium on PerformanceAnalysis of Systems and Software (ISPASS), vol. 0, April 2009.
[16] W. Dally and B. Towles, Principles and Practices of InterconnectionNetworks. San Francisco: Morgan Kaufmann, 2004.
[17] Z. Tan et al., “A case for fame: Fpga architecture model execu-tion,” in Proceedings of the 37th annual international symposium onComputer architecture, ser. ISCA ’10. New York, NY, USA: ACM,2010, pp. 290–301.
[18] J. Miller et al., “Graphite: A distributed parallel simulator formulticores,” in High Performance Computer Architecture (HPCA),2010 IEEE 16th International Symposium on, 9-14 2010, pp. 1 –12.
[19] J. Hestness et al., “Netrace: dependency-driven trace-basednetwork-on-chip simulation,” in Proceedings of the Third Interna-tional Workshop on Network on Chip Architectures, ser. NoCArc ’10.New York, NY, USA: ACM, 2010, pp. 31–36.
[20] R. Marculescu et al., “Outstanding research problems in nocdesign: system, microarchitecture, and circuit perspectives,” IEEETransactions on Computer Aided Design of Integrated Ciruits andSystems, vol. 28, no. 1, pp. 3–21, 2009.
[21] G. Varatkar and R. Marculescu, “On-chip traffic modeling andsynthesis for mpeg-2 video applications,” Very Large Scale Integra-tion (VLSI) Systems, IEEE Transactions on, vol. 12, no. 1, pp. 108–119, jan. 2004.
[22] V. Soteriou et al., “A statistical traffic model for on-chip inter-connection networks,” in Modeling, Analysis, and Simulation ofComputer and Telecommunication Systems, 2006. MASCOTS 2006.14th IEEE International Symposium on, sept. 2006, pp. 104 – 116.
[23] H. Kim, et al., “On-chip network evaluation framework,” inProceedings of the 2010 ACM/IEEE International Conference for HighPerformance Computing, Networking, Storage and Analysis, ser. SC’10. Washington, DC, USA: IEEE Computer Society, 2010.
[24] G. Wei, et al., “A software framework for trace analysis targetingmulticore platforms design,” in Networks on Chip (NoCS), 2011Fifth IEEE/ACM International Symposium on, may 2011, pp. 259 –260.
[25] P. V. Gratz and S. W. Keckler, “Realistic workload characterizationand analysis for networks-on-chip design,” CMP-MSI, 2010.
[26] K. Macdonald, “Inferring packet dependencies to improve trace-based simulation of on-chip networks,” Master’s thesis, Univer-sity of California, Davis, 2011.
[27] C. Bienia et al., “The parsec benchmark suite: characterization andarchitectural implications,” in Proceedings of the 17th internationalconference on Parallel architectures and compilation techniques, ser.PACT ’08. New York, NY, USA: ACM, 2008, pp. 72–81.
[28] A.-M. Rahmani et al., “Negative exponential distribution trafficpattern for power/performance analysis of network on chips,”in VLSID ’09: Proceedings of the 2009 22nd International Conferenceon VLSI Design. Washington, DC, USA: IEEE Computer Society,2009, pp. 157–162.
[29] S. Kamil et al., “Reconfigurable hybrid interconnection for staticand dynamic scientific applications,” in Proceedings of the 4thinternational conference on Computing frontiers, ser. CF ’07. NewYork, NY, USA: ACM, 2007, pp. 183–194.
Kevin Macdonald received his Master’s Degreein Computer Science from University of Califor-nia, Davis. His research interests include com-puter architecture and on-chip networks.
Christopher Nitta is a postdoctoral researcherand lecturer at University of California, Davis.His research interests include network-on-chiptechnologies, embedded system and RTOS de-sign, and hybrid electric vehicle control. He hasa PhD in Computer Science from University ofCalifornia, Davis.
Matthew Farrens received his PhD in ElectricalEngineering from the University of Wisconsinand is a professor of Computer Science at theUniversity of California, Davis. His research in-terests center on computer architecture, withspecial emphasis on the memory hierarchy. Heis a member of ACM and IEEE and a recipient ofthe NSF PYI award.
Venkatesh Akella received his PhD in Com-puter Science from University of Utah and is aprofessor of Electrical & Computer Engineeringat University of California, Davis. His currentresearch encompasses various aspects of em-bedded systems and computer architecture withspecial emphasis on embedded software, hard-ware/software codesign and low power systemdesign. He is member of ACM and received theNSF CAREER award.