ieee transactions on antennas and ...saraband/ksieee/foliage.pdfieee transactions on antennas and...
TRANSCRIPT

IEEE TRANSACTIONS ON ANTENNAS AND PROPAGATION, VOL. 52, NO. 5, MAY 2004 1211
Millimeter-Wave Measurements of FoliageAttenuation and Ground Reflectivity of
Tree Stands at Nadir IncidenceAdib Y. Nashashibi, Senior Member, IEEE, Kama Sarabandi, Fellow, IEEE, Shadi Oveisgharan,M. Craig Dobson, Senior Member, IEEE, Wayne S. Walker, and E. Burke, Senior Member, IEEE
Abstract—In this paper, the phenomenology of wave propaga-tion through foliage and forest ground reflectivity is investigatedfor assessing the feasibility of foliage-covered target detection atmillimeter-wave frequencies. An experimental procedure for si-multaneous measurements of foliage attenuation and ground re-flectivity is outlined. This measurement procedure is implementedfor two different tree stands, one mostly coniferous and the otherdeciduous, using a nadir-looking, high-resolution, 35-GHz radarpositioned above the tree canopy. Statistics of the two-way attenua-tion and ground reflectivity for these two well-characterized standsare derived. Strong spatial and angular fluctuations in the two-wayfoliage attenuation coefficient are observed. The mean, standarddeviation, and median of the measured two-way attenuation factorat Stand 1 (mostly coniferous trees with 0.140 trees/m2 stockingdensity and 45.45 Kg/m2 green biomass) are 25 4, 18 3, and48 2 dB, respectively, while the mean, standard deviation, and
median of the measured two-way attenuation factor at Stand 2(deciduous trees with 0.1055 trees/m2 stocking density and 30.90Kg/m2 green biomass) are 15 4, 12 7, and 33 6 dB, respec-tively. The mean attenuation rates of Stand 1 and Stand 2, de-rived from the measured two-way attenuation factor, are 0.40 and0.24 Np/m, respectively. Only a small percentage of the data hadtwo-way foliage attenuation values exceeding 70 dB. The mean,standard deviation, and median of the power reflectivity of theforest floor at Stand 1 are 14 2, 11 0, and 21 1 dB, respec-tively, while for Stand 2, the same statistical measures are 16 0,14 3, and 22 2 dB, respectively. The results demonstrate the
potential for using MMW nadir-looking radars for the detection oftargets underneath foliage-cover.
Index Terms—Attentuation measurement, millimeter wavepropagation, millimeter wave radar, radar detection.
I. INTRODUCTION
DETECTION and identification of targets in a strong clutterbackground, such as a target over a rough terrain, or
embedded in a random medium, such as a target camouflagedunder a forest canopy, have long been a subject of intensiveinvestigation. Whereas significant progress have been made
Manuscript received May 16, 2002; revised June 30, 2003. This work wassupported by the Defense Advanced Research Projects Agency (DARPA)through the Army Research Office under Contracts DAAD 19-00-1-0115 andDAAD 19-02-10262.
A. Y. Nashashibi, K. Sarabandi, S. Oveisgharan, M. C. Dobson, and W. S.Walker are with the Department of Electrical Engineering and Computer Sci-ence, The University of Michigan, Ann Arbor, MI 48109-2122 USA ([email protected]).
E. Burke is with the The Army Research Laboratory, Adelphi, Maryland20783 USA.
Digital Object Identifier 10.1109/TAP.2004.827250
toward the development of detection and identification al-gorithms of targets over a clutter background, through theapplication of multisensor systems such as optical, thermal,lidar, and radar systems, the detection of foliage-covered tar-gets with the required probability of detection and false alarmrate remains at large an unsolved problem. The main goalof foliage-concealed target detection is to develop means toelectromagnetically interrogate a composite scene of targetplus vegetation in such a manner as to either: 1) penetratethe canopy without corrupting the phase and amplitude of thereturn from the target of interest, or 2) use the return from thecanopy itself to establish the distortion matrix for the effects ofthe clutter and subsequently account for these effects in orderto electromagnetically “defoliate” the scene. Due to exorbitantattenuation of electromagnetic waves at optical and infraredfrequencies, the application of conventional optical and IRsensors for detecting a target hidden under foliage has beenproven to be unsatisfactory. However, due to the ability of elec-tromagnetic waves to penetrate through foliage, particularlyat low microwave frequencies, the application of ultra-wide-band imaging radars for detection and identification of targetspositioned under foliage have been investigated [1]–[5] pri-marily in a side-looking configuration. So far, the thrust ofinvestigation on foliage penetrating radars has been focusedon the frequency range covering HF through UHF band. Bothboom-based [2], [5] ultra-wideband SAR radars (spanning thefrequency range between 50 and 1200 MHz) and airborne[3], [4] multifrequency (VHF, UHF, L, and C-bands) SARradars were used to examine the attenuation and backscatterstatistics of forested areas and in hard target detection studies.The rationale behind this choice of frequency range is anintuitive one, basically, the lower is the radar frequency, thelower is the attenuation and scattering from branches and treetrunks. However, there are two drawbacks in this approach thathave somewhat limited the success of low-frequency foliagepenetrating radars: The first is the relatively low resolution ofthese systems due to the limited available bandwidth and thesecond is the low radar cross section of some targets of interestat these frequencies which are comparable to the scatteringfrom tree trunk and ground interaction or large branches.
Having recognized the aforementioned challenges anddifficulties associated with the existing foliage penetratingside-looking radars, we have reexamined the problem andconsidered millimeter-wave (MMW) nadir-looking radars forthis application. The premise for this research stems from thefact that electromagnetic signals at millimeter-wave (MMW)
0018-926X/04$20.00 © 2004 IEEE

1212 IEEE TRANSACTIONS ON ANTENNAS AND PROPAGATION, VOL. 52, NO. 5, MAY 2004
frequencies can penetrate through few layers of foliage withsome finite attenuation and the fact that there is a considerablenumber of openings through most foliage covers. Furthermore,very high resolution and far more compact radar systems canbe designed at millimeter-wave frequencies, hence, they canbe operated successfully in a nadir-looking configuration. Thenadir-looking configuration has two main advantages over theside-looking configuration: The first is that the total two-wayfoliage attenuation is expected to be minimal for a nadir-lookingradar since the ray path length is minimal at normal incidenceand the second is the dependence of the attenuation rate on theincidence angle. A tree trunk is the largest scatterer in a treestructure that can produce significant shadowing, especially,for observation points in its near-field region [6]. However, atnear normal incidence, vertical tree trunks do not contributesignificantly to either attenuation or scattering. It sould bepointed out that nadir-looking MMW radars are not expectedto replace side-looking low-frequency radars. The side-lookinglow-frequency radar has the primary benefit of being a standoffsystem, enabling wide-area coverage, while the nadir-lookingMMW radar can be used for relatively narrow-area coverageand to confirm the presence of targets in areas initially flaggedby the low-frequency radar.
To evaluate the performance of the nadir-looking MMWradar system, phenomenology issues pertaining to electro-magnetic wave interaction with foliage at MMW frequenciesmust be studied. Of particular interest are the attenuation andphase defect of a wave propagating through, and to a lesserextent scattering from vegetation. Attenuation is important forpath-loss calculations which is in turn needed for estimating therequired transmitter power and for signal-to-noise calculations.Phase defect refers to the fluctuation of radar backscatter froma point target on the forest floor as a function of the aspectangle. This phase fluctuation is directly related to the angulardecorrelation function of the backscattered return from theforest media. A synthetic aperture radar (SAR) forms a radarimage with high resolution in azimuth by observing a scattererover a relatively narrow range of aspect angles. Basically bycorrecting the two-way phase history of the backscatter signal(assuming free-space propagation) from a stationary target,the radar beam can be focused on the target. Any deviation inthe signal phase from that of the free-space propagation willdegrade the azimuthal resolution of the radar. Direct scatteringfrom foliage is also important as the target backscatter has tocompete with that of the foliage which fall within the samerange-bin. Hence, the phenomenology study of wave propa-gation in foliage at MMW frequencies becomes an essentialstep toward the development of an optimal target detectionalgorithm. Such a study involves the characterization of signalattenuation and phase defect as a function of both electrical andphysical parameters of foliage constituents, such as relativepermittivity, density, size, and orientation distributions ofleaves, branches, and needles. In addition to foliage attenuationand phase defect, the reflectivity of the forest ground at nadirincidence will have a significant impact on both the systemdesign and on the detection algorithm and needs to be examinedas well. A number of research efforts aimed at characterizingexperimentally the propagation and bistatic scattering of MMWsignals in tree canopies have been reported previously [7]–[14].
However, the experimental results reported in the literature areacquired entirely at near-grazing incidence. In addition, bothmeasurements and semi-empirical models of the MMW radarbackscattered return from bare soil surfaces have been reportedat both low and high incidence angles [15], [16], none howeverof actual forest grounds at nadir incidence.
In this paper, outdoor experimental procedures as wellas two-way foliage attenuation and ground reflectivity dataacquired using a nadir-looking radar operating at 35-GHz arepresented. Phase defect is not considered in this investigationand will be the subject of a separate paper. The outdoormeasurements were conducted in the State of Maryland, ontwo distinct well-characterized tree stands one being mostlyconiferous (henceforth referred to as Stand 1) and the otherdeciduous (henceforth referred to as Stand 2). The foliageparameters of these stands, including tree density, height,trunk diameter, location, foliage coverage, etc., were alsocharacterized accurately and summarized in this paper.
II. OUTDOOR MEASUREMENT TECHNIQUE
Traditionally, attenuation measurements are conducted usingtwo disjoint antennas, one operating as a transmitter and theother operating as a receiver. The system is setup such that thetwo antennas are operated in a line-of-sight measurement modewith the random medium (in this case the foliage) positioned be-tween the two antennas. There are three main difficulties associ-ated with this technique: 1) a complicated experimental setup isrequired, in which both the transmitting and receiving antennasneed to maintain their relative positions and orientations as theyscan the canopy; 2) amplitude and phase fluctuations betweenthe transmitter and the receiver must be minimized at all timeswhile long microwave cables carrying the reference signal movewith the antennas inside the canopy; and 3) a complicated cali-bration procedure is needed to keep track of the orientations ofthe antennas with respect to the surface.
Due to the inherent difficulties in the line-of-sight measure-ment technique, we have deployed a monostatic radar above thetree canopy and positioned a calibration target with known radarcross section (such as a corner reflector) underneath the canopyalong the radar antenna boresight. Statistics of field attenuationwere obtained by moving both the radar and the target to dif-ferent spots. The purpose of the point target is to reflect theradar signal that has penetrated the foliage layer back toward theradar. On the down-side, the two-way attenuation measurementsrequire a far more sensitive receiver. However, this configura-tion overcomes the difficulties associated with the two-antennatechnique while imitating what a radar signal endures during thetarget detection measurements.
The experimental setup used in performing the outdoor at-tenuation measurements is depicted in Fig. 1. In this setup, atrihedral is used as the reference target under the tree canopy.The trihedral is positioned atop a Styrofoam pedestal above theground. The height above the ground for the corner reflector isselected such that the return from the trihedral could be isolatedfrom that of the ground surface in time domain. The radar usedin this experiment operates in a frequency chirped-pulse modewith a bandwidth of 500-MHz capable of producing a 30-cmrange resolution.

NASHASHIBI et al.: MILLIMETER-WAVE MEASUREMENTS OF FOLIAGE ATTENUATION AND GROUND REFLECTIVITY 1213
Fig. 1. Outdoor experimental setup used during the attenuation measurements.
According to the radar equation, the return power from a tri-hedral with radar cross-section (RCS) , in free-space, can becomputed from
(1)
where
(2)
and are the received and transmitted powers, respec-tively, is the radar wavelength, and are the transmit andreceive antenna gains, respectively, and is the range to the tri-hedral. This equation can easily be modified to account for theeffect of foliage assuming that the incident phase-front illumi-nating the trihedral is uniform. This condition is satisfied, if thetrihedral is relatively far from the nearby scatterers. In the pres-ence of foliage, the received power is a random variable whosestatistics are influenced by the physical parameters of the fo-liage cover. The average received power can be related to anaverage two-way foliage attenuation factor . Using (1), the av-erage received power from a trihedral measured in backscatterunder a statistically uniform canopy can be obtained from
(3)
Maintaining the radar configuration (range, transmitterpower, etc.) the same, can simply be obtained from
(4)
where is measured by placing a trihedral outside the teststand (in the absence of any foliage cover). Fluctuations in theradar receiver gain and transmitter power over the duration ofthe experiment was monitored by observing a leakage betweenthe transmitter and receiver. The effect of system fluctuationswas removed from the measured data used in the computationof .
A. Ground Reflectivity Measurements
Also of great importance is the forest floor reflectivity mea-surements. Due to radar size, far-field criterion, and mobilitylimitations, the radar system usually cannot be deployed underthe canopy crown for ground reflectivity measurements. How-ever, the data collected from the trihedrals can be used to esti-mate the average ground reflectivity from the backscatter mea-surements. To demonstrate the procedure let us consider a radarsystem above a ground plane in a nadir-looking configuration.If the ground-air interface is smooth and the radar is far from theinterface, image theory can be invoked and the received powercan be calculated from Friis transmission formula. Representingthe distance between the radar and ground by , the receivedpower can be computed by
(5)
where is the power reflectivity at normal incidence. For asmooth dielectric interface , where is the Fresnelreflection coefficient.
The forest floor is usually rough and covered with vegeta-tion litter which scatter the incident energy in directions otherthan backscatter. Therefore, the forest ground reflectivity maybe significantly smaller than the Fresnel power reflectivity. Thestatistics of the measured backscatter power from the ground isinfluenced by the canopy and surface roughness as well as thedensity and distribution of vegetation litter on the ground. How-ever these two processes are mutually independent and one caneasily show that
(6)
where is the average ground reflectivity of the forest floor.Taking the ratio of (3) and (6), can be eliminated and canbe obtained from
(7)
Expression (7) can be used directly if the experiment is con-ducted with and without the trihedrals assuming that the radarremains calibrated throughout both experiments. However, ifthe shadowing effect of the trihedral can be accounted for, oneexperiment would be sufficient to measure both the two-wayattenuation and ground reflectivity. Beside circumventingan additional set of measurements, the single-measurementapproach does not require system calibration. In this approachthe time-domain responses are examined individually fromwhich , and the corresponding ranges to the radar areextracted as shown in Fig. 2.
To account for the shadowing effect of the trihedral on themeasured ground reflectivity, the following observations are inorder. The physical dimensions of the calibration trihedral aremuch larger than a wavelength and therefore physical opticsapproximation can be used to evaluate its bistatic scatteringcross section. Physical optics approximation provides veryaccurate results along directions which correspond to a sta-tionary-phase point of the radiation integral and the forward

1214 IEEE TRANSACTIONS ON ANTENNAS AND PROPAGATION, VOL. 52, NO. 5, MAY 2004
Fig. 2. Geometry of a trihedral positioned along the boresight between atransmitter and a receiver. E is the direct field from the transmitter in theabsence of the trihedral. E is the scattered field from the trihedral (and itsimage) at the receiver.
scattering direction [18]. According to physical optics approxi-mation the amplitude of the forward scattered field is directlyproportional to the area intercepted by the incident wave (thearea of the object’s shadow on a plane perpendicular tothe direction of incident wave) and is given by [19]
(8)
Fig. 2 shows the geometry of the forward scattering problemwhich is obtained by applying the image theory. Since the heightof the trihedral above the ground is relatively small (comparedto the radar range to the trihedral) the forward scattering of thetrihedral and its image is the same as that of the trihedral alone.Basically the shadow area of the composite target is approx-imately the same as that of the trihedral alone. Noting that thepath lengths for the direct wave to the receiver and the scat-tered wave from the trihedral to the receiver are the same,after some simple algebraic manipulations, the Friis transmis-sion formula can be modified as follows:
(9)
Equation (9) reduces to the Friis transmission formula when. It should also be noted that the phase of is near
180 which results in a reduction in . Basically. It is also obvious that as the range to the
target/ground is increased, the effect of point target shadowingdiminishes. In view of (9), (7) can be modified and the groundreflectivity in the presence of a trihedral can be obtained from
(10)
where and can be directly obtained from the time-do-main radar backscatter measurements.
III. EXPERIMENTAL SETUP AND MEASUREMENT PROCEDURE
A heavy-duty, self-propelled crane, owned and operated byArmy Research Laboratory (ARL) personnel, was used to liftthe radar system and position it above the tree canopy (about24–26 m above ground). The crane was driven on a paved road atthe edge of the tree stands. As depicted in Fig. 1, the crane con-sisted of a four-wheeled main chassis and a two-section boom.The lower section was fully extended to ensure a minimum radarheight of about 24 m while the upper section was tilted such
that it was parallel to the ground surface. With the nadir-lookingradar system suspended at the tip of the upper section, it waspossible to position the radar above any preselected spot on theground by moving the crane on the road and by extending orretracting the upper section of the boom. A fully polarimetricKa-Band radar operating at a center frequency of 35-GHz andeffective beamwidth of 2 was deployed. The radar employs afast frequency chirp modulation of 500 MHz bandwidth [17](30-cm range resolution).
As mentioned before, characterization of the averagetwo-way foliage attenuation cannot be accomplished withjust a single measurement of a trihedral under the canopy.To capture the variability of foliage cover within a given treestand, multiple measurements are required at many locations.To perform these measurements accurately, the trihedral hadto be moved manually from one spot to the next according toa well-characterized grid on the ground. The grid consistedof 30 to 32 rows (depending on the tree stand) with 10 spotsin each row. The spots were about 1 meter apart and the rowswere perpendicular to the road where the crane was parked. Asubset of these rows were selected for the foliage attenuationmeasurements to ensure that foliage cover be present over theentire row. We also excluded spots that were too close to treetrunks. A 12-inch trihedral having an RCS of dBsmwas mounted atop a Styrofoam pedestal 90 cm above theground. As expected, a difference of 6 ns was observed be-tween the times of arrival of the radar returns from the trihedraland ground beneath it.
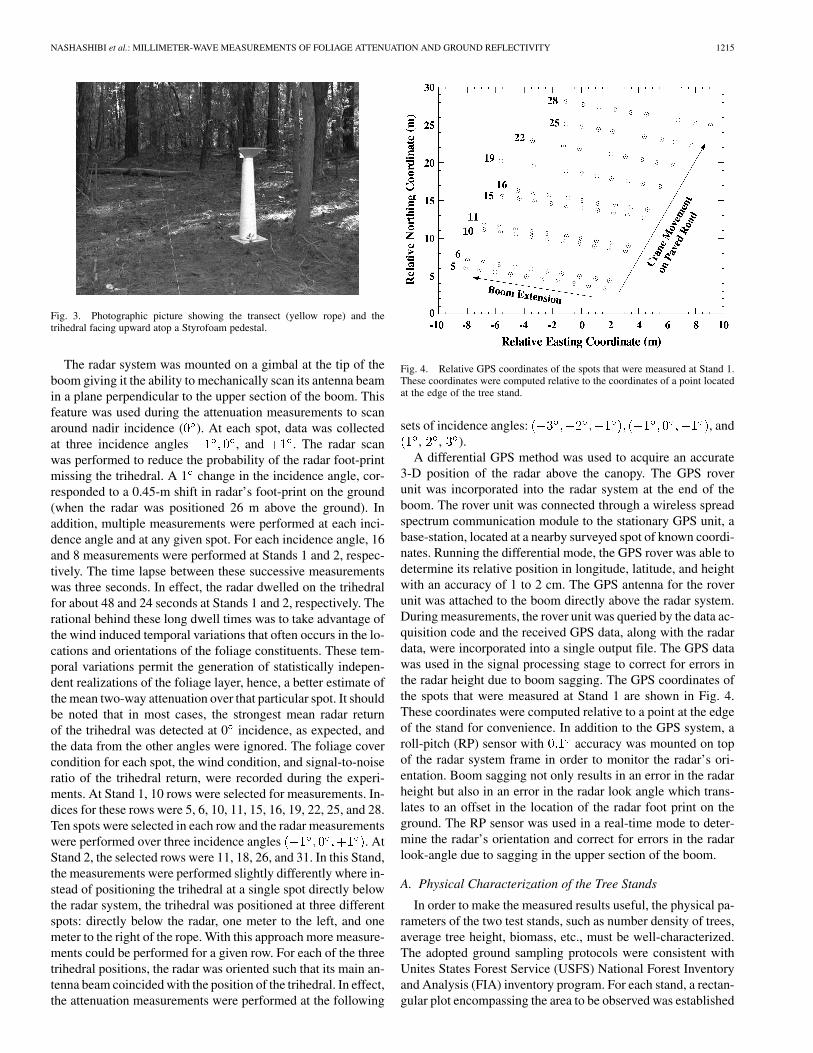
To determine the exact location on the ground where the tri-hedral is to be positioned within a given row, a 10-m-long ropewas stretched near the ground directly below and parallel to theboom. The photograph in Fig. 3 shows the rope deployed atStand 1 (mostly coniferous) along with the trihedral facing up-ward atop the Styrofoam pedestal. The rope was marked at in-crements of 1 meter. To ensure that the rope was directly belowthe upper section of the boom and parallel to it, an alignmenttechnique was used. Once the radar system was ready for mea-surements, the boom was first raised to the proper height abovethe road where the crane was located. With the upper section ofthe boom fully retracted, the trihedral was positioned under theradar system (on the Styrofoam pedestal) and moved in azimuthuntil a maximum radar return from the trihedral was observed.Then, the distance from the trihedral to the boom truck framewas measured. This distance is the same offset distance neededbetween the frame and the first point in the transect (i.e., thefirst marking on the rope). The position of the trihedral was con-firmed using a low-power laser that was attached to the 35-GHzradar and aligned parallel to the radar beam. During the attenu-ation measurements, the laser spot was observed on the groundnear the trihedral in areas with low foliage cover. These observa-tions confirmed that both the incremental extension of the uppersection of the boom and positioning of the trihedral at a givenspot were performed correctly. It should also be noted that the2 beamwidth of the 35-GHz radar resulted in an effective foot-print of about one meter in diameter (at a range of 26 m). Hence,small errors ( cm) in positioning the trihedral were toler-ated since they would not affect the attenuation measurementssignificantly.
NASHASHIBI et al.: MILLIMETER-WAVE MEASUREMENTS OF FOLIAGE ATTENUATION AND GROUND REFLECTIVITY 1215
Fig. 3. Photographic picture showing the transect (yellow rope) and thetrihedral facing upward atop a Styrofoam pedestal.
The radar system was mounted on a gimbal at the tip of theboom giving it the ability to mechanically scan its antenna beamin a plane perpendicular to the upper section of the boom. Thisfeature was used during the attenuation measurements to scanaround nadir incidence ( ). At each spot, data was collectedat three incidence angles , and . The radar scanwas performed to reduce the probability of the radar foot-printmissing the trihedral. A 1 change in the incidence angle, cor-responded to a 0.45-m shift in radar’s foot-print on the ground(when the radar was positioned 26 m above the ground). Inaddition, multiple measurements were performed at each inci-dence angle and at any given spot. For each incidence angle, 16and 8 measurements were performed at Stands 1 and 2, respec-tively. The time lapse between these successive measurementswas three seconds. In effect, the radar dwelled on the trihedralfor about 48 and 24 seconds at Stands 1 and 2, respectively. Therational behind these long dwell times was to take advantage ofthe wind induced temporal variations that often occurs in the lo-cations and orientations of the foliage constituents. These tem-poral variations permit the generation of statistically indepen-dent realizations of the foliage layer, hence, a better estimate ofthe mean two-way attenuation over that particular spot. It shouldbe noted that in most cases, the strongest mean radar returnof the trihedral was detected at 0 incidence, as expected, andthe data from the other angles were ignored. The foliage covercondition for each spot, the wind condition, and signal-to-noiseratio of the trihedral return, were recorded during the experi-ments. At Stand 1, 10 rows were selected for measurements. In-dices for these rows were 5, 6, 10, 11, 15, 16, 19, 22, 25, and 28.Ten spots were selected in each row and the radar measurementswere performed over three incidence angles . AtStand 2, the selected rows were 11, 18, 26, and 31. In this Stand,the measurements were performed slightly differently where in-stead of positioning the trihedral at a single spot directly belowthe radar system, the trihedral was positioned at three differentspots: directly below the radar, one meter to the left, and onemeter to the right of the rope. With this approach more measure-ments could be performed for a given row. For each of the threetrihedral positions, the radar was oriented such that its main an-tenna beam coincided with the position of the trihedral. In effect,the attenuation measurements were performed at the following
Fig. 4. Relative GPS coordinates of the spots that were measured at Stand 1.These coordinates were computed relative to the coordinates of a point locatedat the edge of the tree stand.
sets of incidence angles: , and, , ).
A differential GPS method was used to acquire an accurate3-D position of the radar above the canopy. The GPS roverunit was incorporated into the radar system at the end of theboom. The rover unit was connected through a wireless spreadspectrum communication module to the stationary GPS unit, abase-station, located at a nearby surveyed spot of known coordi-nates. Running the differential mode, the GPS rover was able todetermine its relative position in longitude, latitude, and heightwith an accuracy of 1 to 2 cm. The GPS antenna for the roverunit was attached to the boom directly above the radar system.During measurements, the rover unit was queried by the data ac-quisition code and the received GPS data, along with the radardata, were incorporated into a single output file. The GPS datawas used in the signal processing stage to correct for errors inthe radar height due to boom sagging. The GPS coordinates ofthe spots that were measured at Stand 1 are shown in Fig. 4.These coordinates were computed relative to a point at the edgeof the stand for convenience. In addition to the GPS system, aroll-pitch (RP) sensor with accuracy was mounted on topof the radar system frame in order to monitor the radar’s ori-entation. Boom sagging not only results in an error in the radarheight but also in an error in the radar look angle which trans-lates to an offset in the location of the radar foot print on theground. The RP sensor was used in a real-time mode to deter-mine the radar’s orientation and correct for errors in the radarlook-angle due to sagging in the upper section of the boom.
A. Physical Characterization of the Tree Stands
In order to make the measured results useful, the physical pa-rameters of the two test stands, such as number density of trees,average tree height, biomass, etc., must be well-characterized.The adopted ground sampling protocols were consistent withUnites States Forest Service (USFS) National Forest Inventoryand Analysis (FIA) inventory program. For each stand, a rectan-gular plot encompassing the area to be observed was established

1216 IEEE TRANSACTIONS ON ANTENNAS AND PROPAGATION, VOL. 52, NO. 5, MAY 2004
Fig. 5. An example of (a) an original digital photograph taken at Stand 2 from ground level of the canopy and (b) the image after classification.
using a compass, laser finder, and fiberglass tapes. For all woodystems cm in diameter at breast height (DBH), the species,stem number, and diameter were recorded. The 3-D structurefor each stem was then characterized by measuring the total treeheight, the height of the live crown, and the crown diameter. Inaddition, the x-y location to the nearest meter was measured foreach stem. Each stem was assigned a crown shape class, clas-sified as being either live or dead, and classified as having ei-ther a dominant/codominant or nondominant canopy positions.Leaf-area-index (leaf area/ground surface area m /m ) for eachstand was determined from measurements using an LI-COR2000 Plant canopy Analyzer at both ground level and aboveground-cover.
For tree Stand 1 (mostly coniferous), the site is dominated bya plantation of mature Loblolly pine (Pinus tiada) over toppinga significant understory/small overstory hardwood component.The pine stand appears to have been thinned in the recent past al-lowing for the proliferation of hardwoods including Sweetgum(Liquidambar styraciflua), Yellow poplar (Liriodendron tulip-ifera), and Black cherry (Prunus serotina). Trees ( cm DBH)measured within the test area averaged 17.8 cm in diameter(standard deviation (std) of 11.8 cm) and 13.1 m in height (std of6.6 m). Height to live crown (i.e., live canopy) averaged 5.8 m(std of 4.6 m) whereas total crown thickness averaged 7.3 m(std of 4.0 m). Stocking density and basal area values wererelatively high, averaging 0.140 trees/m and 0.00444 m /m ,respectively. Understory shrubs were uncommon and groundcover was largely absent due to the presence of a thick pine litterlayer. The average leaf area index and ground cover thickness atStand 1 were 4.23 m /m (std of 0.56 m /m ) and 73.4 cm (stdof 59.1 cm), respectively.
For tree Stand 2 (deciduous), the site is characterized by aneven-aged stand of Sweetgum with a highly disturbed under-story/ground-cover layer of vines (poison ivy), briars (rose andraspberry), and invasive shrubs (autumn olive). Trees ( cmDBH) measured within the experimental area averaged 18.0 cmin diameter (std of 9 cm) and 11.5 m in height (std of 5.4 m).Height to live crown (i.e., live canopy) averaged just 4.1 m (stdof 2.2 m) whereas total crown thickness averaged 7.4 m (stdof 4.5 m). Stocking density and basal area exhibited moderateto high values, averaging 0.1055 trees/m and 0.00324 m /m ,
respectively. The stand is relatively open and the tree canopiesare relatively thin, i.e., considerable light penetration occurs.Shrub cover in the understory/ground-cover layer is dense tothe point that traversing the area is difficult. The leaf area indexand ground cover thickness at Stand 2 were 4.33 m /m (std of0.76 m /m ) and 43.4 cm (std of 17.9 cm), respectively. The LAIat this stand is unexpectedly high, indicating a possible error inLI-COR measurements.
Percentage open sky (seen upward from the forest floor) wasalso determined at both stands. The percentage open sky for acanopy is defined as the fraction of open sky to the total ob-served area in a prescribed solid angle for a given direction. Itwas determined as follows: High resolution digital photographs(1.23 million pixels in each photograph) were taken straight upat various places within the test site. An unsupervised per-pixelimage classification procedure was then used to assign eachcolor into a class. These classes were then manually interpretedand reduced to two classes only: sky, not-sky. A photographof the foliage-cover taken from a point on the ground at Stand2 showing sky openings is shown in Fig. 5(a) as an example.Fig. 5(b) shows the same picture where the sky openings andfoliage are classified into two groups. At the end of classifica-tion process, the number of sky pixels were calculated as wellas the fraction of total pixels. The average percentage open skyat Stand 1 and Stand 2 were 9.54% and 24.23%, respectively.
Comparisons between the stocking density, basal area,volume, and green biomass of Stand 1 (mostly coniferous) andthat of 1) Loblolly-pine-dominated stands, and 2) conifer-dom-inated stands in the State of Maryland were performed.Stand 1 exhibits a stocking density (0.140 trees/m ) that isslightly below average for both Loblolly pine-dominated andconifer-dominated stands in Maryland. Conversely, values ofbasal area (0.00444 m /m ), volume (0.036 m /m ), and greenbiomass (45.447 kg/m ) for this stand appear significantlyhigher than average. For example, the basal area of Stand 1 ishigher than 99.0% of all Loblolly pine-dominated plots (100plots) and higher than 98.6% (142 plots) of all conifer-dom-inated plots in the Maryland FIA network. Similarly, greenbiomass is higher than 99.0% of all Loblolly pine-dominatedplots (100 plots) and higher than 99.3% (143 plots) of allconifer-dominated plots. Higher than expected values of basal

NASHASHIBI et al.: MILLIMETER-WAVE MEASUREMENTS OF FOLIAGE ATTENUATION AND GROUND REFLECTIVITY 1217
area, volume, and biomass might be due to the mature, unman-aged nature of the Loblolly pine/hardwood trees at Stand 1.
Comparisons between the stocking density, basal area,volume, and green biomass of Stand 2 (deciduous) and that of1) Sweetgum-dominated stands, and 2) nonconifer-dominated(deciduous) stands in the State of Maryland were performedtoo. Stand 2 exhibits a stocking density (0.1055 trees/m ) thatis slightly below average and basal area (0.00324 m /m ),volume (0.02317 m /m ), and green biomass (30.9 kg/m )values that are slightly above average for Sweetgum-dominatedstands in Maryland. A similar trend is observed when thebroader comparison is made between Stand 2 and all deciduousstands in Maryland. For example, the basal area of Stand 2(0.00324 m /m ) is higher than that of 77.0% (57 plots) ofall Sweetgum-dominated plots and 88.2% (418 plots) of alldeciduous plots in the Maryland FIA network. Similarly, thegreen biomass (30.9 kg/m ) is higher than 77.0% (57 plots)of all Sweetgum-dominated plots and higher than 75.9% (360plots) of all deciduous plots.
IV. DATA ANALYSIS
For any given spot and incidence angle, the measured data,in general, consisted of multiple returns from various scatterers(foliage, trihedral, ground, etc.). Because of the spatial distri-bution of scatterers, these returns occurred with different timedelays that were directly proportional to their distances from theradar. An example of the measured radar return that includes theresponses of the canopy, the trihedral, and the ground is shownin Fig. 6. The first step in processing this data was to apply athreshold where only returns with signal-to-noise ratios equal orexceeding 10 dB were retained. Then, heights above ground foreach of these returns were determined using the GPS data for theradar system, the time of arrival of that return, and the incidenceangle. Once the heights were determined, it was straight forwardto isolate the trihedral and ground returns from other nearby re-turns. An additional constraint was imposed to ensure that thereturn was indeed from the trihedral. The constraint is that theheight of the trihedral return should be about 0.9 m above theground surface. Once the two returns of interest were identified,(1) through (10) were used to compute the two-way attenuationby the foliage and the reflectivity of the ground surface.
A. Two-Way Foliage Attenuation Data
The sample values for the two-way foliage attenuation factormeasured at specific spots (averaged over time) within treeStand 1 are plotted in Fig. 7(a) for rows 5 and 6. The figureclearly demonstrates the strong spatial variations in foliageattenuation within the tree stand. This in turn is consistent withwhat was observed physically at the test site. A photograph ofthe foliage-cover, taken from a point on the ground at Stand 1showing sky openings, is shown in Fig. 8. It demonstrates thestrong spatial variations in foliage density, both vertically andhorizontally. Similar to Stand 1, the time-averaged values forthe two-way foliage attenuation factor, measured at specificspots within tree Stand 2, were generated and are plotted inFig. 7(b) for row 31. As discussed before, the measurements in
Fig. 6. Example of the measured radar return at 35-GHz at normal incidencethat includes the backscatter responses of the canopy, the trihedral, and theground.
this stand were performed at three different incidence angles.The two-way attenuation for the three sets of incidence angleshas been identified in Fig. 7(b) by , and . It shouldbe noted that a slight change in the incidence angle on the orderof 2 degrees results in substantial fluctuations in the two-wayattenuation factor as clearly demonstrated in Fig. 7(b). Hence,for a SAR to successfully image a camouflaged target, itssynthetic aperture must subtend an angle much smaller thanwhich is usually the case for the required resolution. However,this angular decorrelation value must be determined. Thedata collected here indicates that angular change generatescompletely independent measurements since the radar signalis expected to propagate through different sets of branchesand leaves. Hence, the data measured at different incidenceangles can be assumed independent and used in generating ahistogram of the two-way foliage attenuation factor at Stand 2.
A histogram and the corresponding cumulative distributionfunction (cdf) of the two-way attenuation data collected at Stand1 are shown in Fig. 9(a) and (b), respectively. About 26.7%of the data points had attenuation values exceeding 70 dB (theradar backscatter return from the trihedral at 26.7% of the spotsfell below the threshold level of the radar and could not be de-tected) and were not included in the histogram at this stage.However, they were accounted for in the cdf. Similarly, the his-togram and cdf of the two-way attenuation collected at Stand 2are shown in Fig. 10(a) and (b), respectively. In this figure, about8.64% of the data points had attenuation values exceeding 70 dBand were not included in the histogram. However, they were ac-counted for in the cdf. It should be noted that the logarithm of thetwo-way attenuation factor data (i.e., ) was used ingenerating the histograms and cdfs of Figs. 9 and 10. To com-pute the mean, standard deviation, and median of the two-wayattenuation factor, the absolute value of was used. For Stand1 (mostly coniferous), the mean, standard deviation, and me-dian of the measured two-way attenuation factor, expressed in

1218 IEEE TRANSACTIONS ON ANTENNAS AND PROPAGATION, VOL. 52, NO. 5, MAY 2004
Fig. 7. The mean two-way attenuation factor measured along specific spots in: (a) rows 5 and 6 of Stand 1 (mostly coniferous) and (b) row 31 of Stand 2(deciduous).
Fig. 8. Photograph of the foliage cover at Stand 1 taken straight up from chestlevel. The photograph demonstrates the density and strong spatial variations infoliage cover.
decibels, were , , and dB, respectively. Sim-ilarly for Stand 2 (deciduous), the mean, standard deviation, andmedian of the measured two-way attenuation factor, expressedin decibels, were , , and dB, respectively.These results indicate that more attenuation is experienced bythe signal at Stand 1 when compared to Stand 2. This result isconsistent with the ground truth data observations, where thehigher stocking density, basal area, and green biomass weremeasured for Stand 1 when compared to Stand 2. Consideringthe mean crown thickness, , for Stands 1 and 2 are 7.3 and7.4 m, respectively, then the approximate one-way attenuationrates, (with ), measured for Stands 1 and 2 are
and Np/m, respectively.
B. Ground Reflectivity Data
Next we present the reflectivity of forest floor extracted fromthe backscatter measurements of elevated trihedrals embeddedin the test sites. An upper bound for the ground reflectivitycan be achieved assuming the forest floor is a flat dielectric
half-space. A four-component mixing formula can be used forestimating the effective permittivity of a soil medium composedfor clay, silt, and water [20]. The effective soil permittivity at35-GHz of dry and wet (20% volumetric moisture content), re-spectively, are calculated to be and . Thecorresponding reflection coefficients for these surfaces at nadirincidence are 0.43 and 0.78 which corresponds to the surface re-flectivity of and dB, respectively. Unfortunately, soilsamples were not collected from the two sites during the atten-uation measurements to determine the moisture content of thesoils. Nevertheless, it is expected that between 10% and 20%soil moisture were present in the soil during the measurements.Hence, the value of dB can be used as an upper limit forthe measured ground reflectivity.
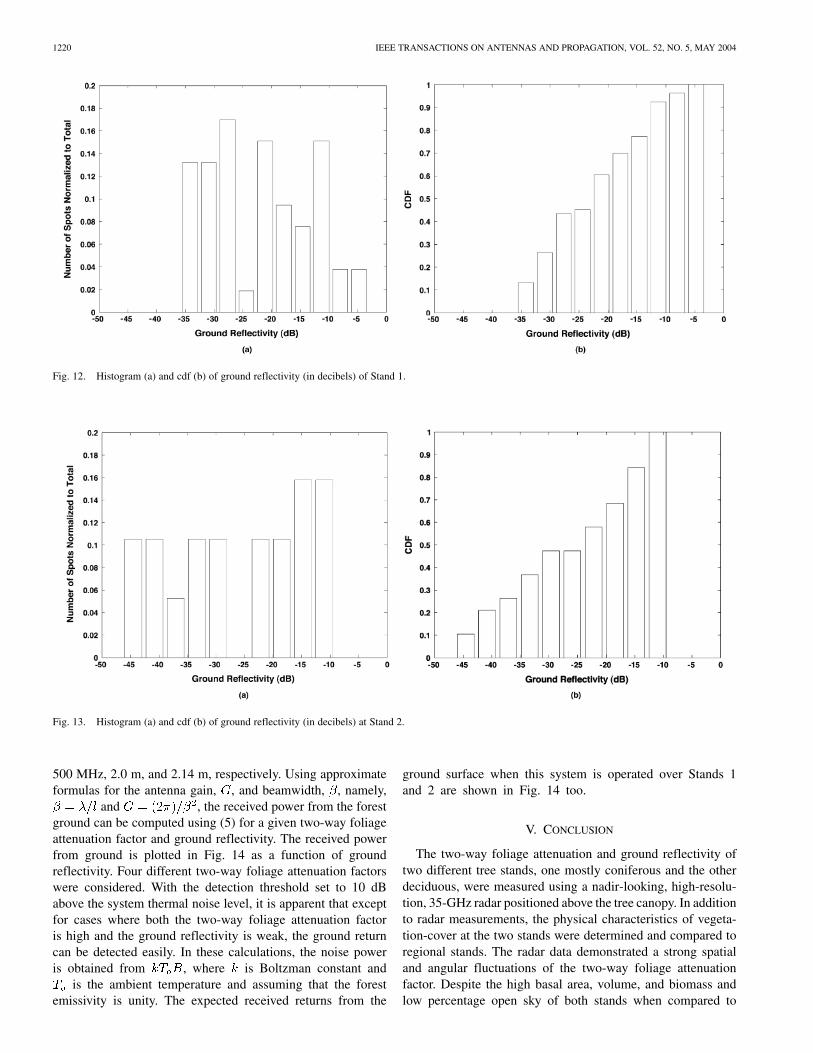
Fig. 11 shows the values of the power (ground) reflectivityderived for various spots in rows 5 and 6 of Stand 1. A strongfluctuation in the power reflectivity is observed from one spot tothe next (1 meter apart). In addition, a significant portion of thespots had power reflectivities that were smaller than dB.At many spots within the two stands, no returns were observedfrom the ground (not shown in Fig. 11). The lack of radar re-turn can be attributed to either strong foliage attenuation or sig-nificant ground clutter that destroyed the coherent return fromthe surface. A close look at the photograph in Fig. 3 revealsthe various types of ground litter present in Stand 1 (pine nee-dles, broken branches, fallen tree trunks, etc.). Similar resultsfor the power reflectivity at Stand 2 were observed. In this casethough, fewer cases were recorded of power reflectivity. Thiscan be attributed to the fact that in Stand 2, a significant under-story foliage structure existed near the ground surface. The re-sult is a more diffuse medium near the surface, hence, a set ofweak effective reflection coefficients. Histograms and cdfs ofthe power reflectivities of the two stands are shown in Figs. 12and 13. These histograms and cdfs were generated using the log-arithm of the power reflectivity data. To compute the mean, stan-dard deviation and median of the power reflectivity, the absolutevalues were used. For Stand 1, the mean, standard deviation,

NASHASHIBI et al.: MILLIMETER-WAVE MEASUREMENTS OF FOLIAGE ATTENUATION AND GROUND REFLECTIVITY 1219
Fig. 9. Histogram (a) and cdf (b) depicting the distribution of the two-way foliage attenuation (in dB) at Stand 1.
Fig. 10. Histogram (a) and cdf (b) depicting the distribution of the two-way foliage attenuation (in dB) at Stand 2.
and median of the power reflectivity, expressed in decibels, were, , and , respectively. Similarly for Stand
2, the mean, standard deviation, and median of the power reflec-tivity, expressed in decibels, were , , and ,respectively.
The weak power reflectivities reported in Figs. 11–13 mightbe somewhat misleading in a sense that one could conclude thatdetection of the return from ground in the presence of foliagecover requires significant transmitter power. However, it shouldnoted that the radar return from the ground surface at nadirincidence is governed primarily by (5) derived from the Friisformula as opposed to the radar equation. That is, the rangedependence of the received power is proportional to asopposed to which is considered in the calculation of thesignal to noise ratio for a radar system. For example, considera real aperture, nadir-looking 35 GHz ( mm) radaroperating at an altitude of 500 m (1667 ft) above ground andtransmitting 1 watt in total power. In addition, let the radar’sbandwidth, , aperture size, , and foot-print on ground be
Fig. 11. Measured power reflectivity at specific spots in rows 5 and 6 at Stand1 (mostly coniferous foliage).
1220 IEEE TRANSACTIONS ON ANTENNAS AND PROPAGATION, VOL. 52, NO. 5, MAY 2004
Fig. 12. Histogram (a) and cdf (b) of ground reflectivity (in decibels) of Stand 1.
Fig. 13. Histogram (a) and cdf (b) of ground reflectivity (in decibels) at Stand 2.
500 MHz, 2.0 m, and 2.14 m, respectively. Using approximateformulas for the antenna gain, , and beamwidth, , namely,
and , the received power from the forestground can be computed using (5) for a given two-way foliageattenuation factor and ground reflectivity. The received powerfrom ground is plotted in Fig. 14 as a function of groundreflectivity. Four different two-way foliage attenuation factorswere considered. With the detection threshold set to 10 dBabove the system thermal noise level, it is apparent that exceptfor cases where both the two-way foliage attenuation factoris high and the ground reflectivity is weak, the ground returncan be detected easily. In these calculations, the noise poweris obtained from , where is Boltzman constant and
is the ambient temperature and assuming that the forestemissivity is unity. The expected received returns from the
ground surface when this system is operated over Stands 1and 2 are shown in Fig. 14 too.
V. CONCLUSION
The two-way foliage attenuation and ground reflectivity oftwo different tree stands, one mostly coniferous and the otherdeciduous, were measured using a nadir-looking, high-resolu-tion, 35-GHz radar positioned above the tree canopy. In additionto radar measurements, the physical characteristics of vegeta-tion-cover at the two stands were determined and compared toregional stands. The radar data demonstrated a strong spatialand angular fluctuations of the two-way foliage attenuationfactor. Despite the high basal area, volume, and biomass andlow percentage open sky of both stands when compared to

NASHASHIBI et al.: MILLIMETER-WAVE MEASUREMENTS OF FOLIAGE ATTENUATION AND GROUND REFLECTIVITY 1221
Fig. 14. Received power of a 2.0-m, real aperture, nadir-looking radaroperating at 35 GHz computed as a function of the ground reflectivity. Fourdifferent two-way foliage attenuation factors were considered. The radar is atan altitude of 500 m and its foot print on the ground is 2 m in diameter. Theexpected received returns from the ground surface when this system is operatedover Stands 1 and 2 were demonstrated too.
similar regional stands, the mean (median) two-way foliageattenuation in Stand 1 and Stand 2 were ( ) and
( ), respectively. Only 26.7% and 8.64%of the measured spots under the canopy in stands 1 and 2, re-spectively, had two-way foliage attenuations exceeding 70 dB.It was also observed that the ground reflectivity is temperedsignificantly by the amount and character of the ground litter.The presence of a dense understory/ground-cover is expectedto reduce the ground reflectivity significantly. The mean (me-dian) power reflectivity of the forest floors at Stands 1 and 2are ( ) and ( ), respec-tively. These results demonstrate the potential for using MMWnadir-looking radars for the detection of targets underneathfoliage.
ACKNOWLEDGMENT
The authors would like to thank Dr. L. Pierce for his role inclassifying photos of the tree stands, and Dr. R. D. De Roo andP. Tchou of The University of Michigan, and D. Robertson, C.Deluca, S. Tenney, D. Testerman, and R. Tan of ARL for theirassistance during the measurements.
REFERENCES
[1] B. Ferrell, “Ultrawideband foliage penetration measurements,” in Proc.IEEE Nation Radar Conf., Mar. 29–31, 1994, pp. 80–84.
[2] L. Happ, K. A. Kappra, M. A. Ressler, J. P. Sichina, K. Sturgess, andF. Le, “Low-frequency ultra-wideband synthetic aperture radar 1995BoomSAR tests,” in Proc. IEEE National Radar Conf., Ann Arbor, MI,May 13–16, 1996, pp. 54–59.
[3] B. T. Binder, M. F. Toups, S. Ayasli, and E. M. Adams, “SAR foliagepenetration phenomenology of tropical rain forest and northern U.S.forest,” in Proc. IEEE International Radar Conf., May 8–11, 1995, pp.158–163.
[4] S. Ayasli and L. Bessette, “UHF & VHF SAR phenomenology,” pre-sented at the Proc. PIERS, Workshop on Advances in Radar Methods,Baveno, Italy, July 20–22, 1998.
[5] L. Carin, N. Geng, M. McClure, J. Sichina, and L. Nguyen, “Ultra-wide-band synthetic-aperture radar for mine-field detection,” IEEE An-tennas Propagat. Mag., vol. 41, pp. 18–33, Feb. 1999.
[6] I. S. Koh and K. Sarabandi, “Polarimetric channel characterization offoliage for performance assessment of receivers under tree canopies,”IEEE Trans. Antennas Propagat., vol. 50, no. 5, pp. 713–726, May2002.
[7] C. C. Borel and R. E. McIntosh, “Millimeter wave backscatter fromdeciduous trees,” IEEE Trans. Antennas Propagat., vol. 38, pp.1391–1398, Sept. 1990.
[8] R. M. Narayanan, C. C. Borel, and R. E. McIntosh, “Radar backscattercharacteristics of trees at 215 GHz,” IEEE Trans. Geosci. RemoteSensing, vol. 26, pp. 217–228, May 1988.
[9] J. B. Mead, P. M. Langlois, P. S. Chang, and R. E. McIntosh, “Polari-metric scattering from natural surfaces at 225 GHz,” IEEE Trans. An-tennas Propagat., vol. 39, pp. 1401–1411, Sept. 1991.
[10] N. C. Currie, F. B. Dyer, and E. E. Martin, “Millimeter foliage pene-tration measurements,” presented at the Proc. Int. IEEE Antennas andPropagat. Soc. Symp. Digest, Amherst, MA, 1976.
[11] E. J. Violette, R. H. Espeland, and F. Schwering, “Vegetation lossmeasurements at 9.6, 28.8, and 57.6 GHz through a pecan orchard,” inCECOM-83-2. Fort Monmouth, NJ, Mar. 1983.
[12] F. K. Schwering, E. J. Violette, and R. H. Espeland, “Millimeter-wavepropagation in vegetation: Experiments and theory,” IEEE Trans.Geosci. Remote Sensing, vol. 26, pp. 355–367, May 1988.
[13] F. T. Ulaby, T. E. Van Deventer, J. R. East, T. F. Haddock, and M. E.Coluzzi, “Millimeter-wave bistatic scattering from ground and vegeta-tion targets,” IEEE Trans. Geosci. Remote Sensing, vol. 26, pp. 229–243,May 1988.
[14] A. Nashashibi, F. T. Ulaby, P. Frantzis, and R. D. De Roo, “Measure-ments of the propagation parameters of tree canopies at MMW frequen-cies,” IEEE Trans. Geosci. Remote Sensing, vol. 40, pp. 298–304, Feb.2002.
[15] A. Nashashibi, F. T. Ulaby, and K. Sarabandi, “Measurement and mod-eling the millimeter-wave backscatter response of soil surfaces,” IEEETrans. Geosci. Remote Sensing, vol. 34, pp. 561–572, Mar. 1996.
[16] F. T. Ulaby, A. Nashashibi, A. El-Rouby, E. Li, R. DeRoo, K. Sara-bandi, R. Wellman, and B. Wallace, “95-GHz scattering by terrain atnear grazing incidence,” IEEE Trans. Antennas Propagat., vol. 46, pp.3–13, Jan. 1998.
[17] A. Nashashibi, K. Sarabandi, P. Frantzis, R. D. De Roo, and F. T.Ulaby, “An ultra-fast wideband MMW polarimetric radar for remotesensing applications,” IEEE Trans. Geosci. Remote Sensing, vol. 40,pp. 1777–1786, Aug. 2002, submitted for publication.
[18] T. C. Chiu and K. Sarabandi, “Electromagnetic scattering interactionbetween a dielectric cylinder and a slightly rough surface,” IEEE Trans.Antennas Propagat., vol. 47, May 1999.
[19] F. T. Ulaby and C. Elachi, Radar Polarimetry for Geoscience Applica-tions. Norwood, MA: Artech House, 1990, p. 62.
[20] F. T. Ulaby, R. K. Moore, and A. K. Fung, Microwave RemoteSensing. Norwood, MA: Artech House, 1986, vol. III.
Adib Y. Nashashibi (S’82–M’95–SM’01) receivedthe B.Sc. and M.Sc. degrees in electrical engineeringfrom Kuwait University, Kuwait, in 1985 and 1988,respectively, and the Ph.D. degree in electricalengineering from The University of Michigan, AnnArbor, in 1995.
He is presently an Associate Research Scientistat the Radiation Laboratory at The University ofMichigan. His research interests include microwaveand millimeter-wave remote sensing, polarimetricradar calibration and measurement techniques,
bistatic radar phenomenology, electromagnetic wave propagation, and scat-tering in random media.

1222 IEEE TRANSACTIONS ON ANTENNAS AND PROPAGATION, VOL. 52, NO. 5, MAY 2004
Kamal Sarabandi (S’87–M’90–SM’92–F’00) re-ceived the B.S. degree in electrical engineering fromSharif University of Technology, Tehran, Iran, in1980, and the M.S. degree in electrical engineeringand mathematics and the Ph.D. degree in electricalengineering from The University of Michigan, AnnArbor, in 1986 and 1989, respectively.
He is Director of the Radiation Laboratory anda Professor in the Department of Electrical Engi-neering and Computer Science, The University ofMichigan. He has 20 years of experience with wave
propagation in random media, communication channel modeling, microwavesensors, and radar systems and is leading a large research group. He has servedas the Principal Investigator on many projects sponsored by NASA, JPL, ARO,ONR, ARL, NSF, DARPA, and numerous industries. He has published manybook chapters and more than 105 papers in refereed journals on electromagneticscattering, random media modeling, wave propagation, antennas, microwavemeasurement techniques, radar calibration, inverse scattering problems, andmicrowave sensors. He has had more than 220 papers and invited presentationsin national and international conferences and symposia on similar subjects.Over the past ten years he has graduated 20 Ph.D. students. His researchinterests include microwave and millimeter-wave radar remote sensing,electromagnetic wave propagation, and antenna miniaturization.
Dr. Sarabandi is a Member of URSI Commission F and of The Electromag-netic Academy. He received the Henry Russel Award from the Regent of TheUniversity of Michigan (the highest honor The University of Michigan bestowson a faculty member at the assistant or associate level). In 1999, he received aGAAC Distinguished Lecturer Award from the German Federal Ministry for Ed-ucation, Science, and Technology. He also received a 1996 Teaching ExcellenceAward from the Department of Electrical Engineering and Computer Science,and the 2003 to 2004 College of Engineering Research Excellence Award, TheUniversity of Michigan. He is a Vice President of the IEEE Geoscience and Re-mote Sensing Society (GRSS), a past Chairman of the Awards Committee ofthe IEEE GRSS from 1998 to 2002, and a Member of the IEEE Technical Ac-tivities Board Awards Committee from 2000 to 2002. He is Associate Editor ofthe IEEE TRANSACTIONS ON ANTENNAS AND PROPAGATION (AP) and the IEEESENSORS JOURNAL. He is listed in American Men & Women of Science, Who’sWho in America, and Who’s Who in Electromagnetics.
Shadi Oveisgharan was born in Isfahan, Iran, in1977. She received the B.Sc. from Sharif Universityof Technology, Tehran, in 1999 and the M.S. degreefrom The University of Michigan, Ann Arbor, in2002, both in electrical engineering. She is currentlyworking toward the Ph.D. degree in the STAR LABat Stanford University, Stanford, CT.
From 2000 to 2002, she worked as a GraduateResearch Assistant with the Radiation Laboratory,University of Michigan. Her current researchinterests include electromagnetic scattering theory
and radar remote sensing.
M. Craig Dobson (SM’91) received the B.A. degreein Geology and Anthropology from the University ofPennsylvania, Philadelphia, in 1973 and the M.S. de-gree in Geography from the University of Kansas,Lawrence, in 1981.
He was previously with the Center for Research,University of Kansas. He is on leave from his po-sition as Research Scientist with The University ofMichigan, Ann Arbor, where he has been a memberof the Research Faculty at the Radiation Lab since1984. He is currently a Program Scientist with the Of-
fice of Earth Science at National Aeronautics and Space Administration (NASA)Headquarters, Washington, DC.
His interests include basic and applied research in the field of microwaveremote sensing. His prior work includes measurement and modeling ofthe fundamental microwave dielectric properties of natural terrestrial media(soil, vegetation, and snow) and understanding the microwave emissionand radar backscattering from terrain. Basic research is conducted in thelaboratory and field experiments using truck-mounted, airborne, and orbitalinstrumentation have lead to applied research in the areas of remote sensingof near-surface soil moisture, land-cover classification, and the retrieval ofbiophysical estimates of vegetation attributes such as height, basal area,above-ground biomass, timber volume, and carbon storage. This work hasbeen extended to simulation of the expected performance of the nextgeneration of orbital SAR systems now being designed and constructed byJapan, Canada, Europe, and the United States. He is currently engaged inlarge-scale assessment of tropical forests using archival SAR data and jointprojects with the U.S. Forest Service and timber companies to evaluatethe use of SAR for forest assessment and management. Much of thisresearch has been done in close collaboration with ecologists, soil scientists,foresters, and hydrologists in an interdisciplinary setting.
Wayne S. Walker received the B.S. degree inresource ecology and management and the M.S.degree in forest/terrestrial ecology from TheUniversity of Michigan, Ann Arbor, in 1994 and1999, respectively, where he is currently workingtoward the Ph.D. degree in remote sensing from theSchool of Natural Resources and Environment, TheUniversity of Michigan.
He is currently a Graduate Student Research As-sistant in the Radiation Laboratory, Electrical Engi-neering and Computer Science Department, The Uni-
versity of Michigan. His current research interests include the quantification anddescription of forest ecosystem structure, specifically evaluating the potential ofmultisensor fusion techniques for use in estimating structural and biomass char-acteristics of forests.
E. Burke (M’92–SM’00) was born in 1951. He re-ceived the B.E. degree from Stevens Institute of Tech-nology, Hoboken, NJ, in 1973 and the M.S.E.E. de-gree from the University of Maryland, College Park,in 1976.
He joined the U.S. Army Harry Diamond Labo-ratories in 1972 and worked on radar fuzing until theformation of the Army Research Labs in 1992. Sincethen, he has been the Chief of the RF and ElectonicsDivision and is currently Chief of the MillimeterWave Branch in the Sensors and Electron Devices
Directorate of the Army Research Lab. His research interests include MMWphenomenology and architectures for military systems.