ieee transactions on antennas and propagation…fsoptics/articles/evaluation_of... · ieee...
TRANSCRIPT

IEEE TRANSACTIONS ON ANTENNAS AND PROPAGATION, VOL. 60, NO. 10, OCTOBER 2012 4855
Evaluation of Time Domain PropagationMeasurements of UWB Systems UsingSpread Spectrum Channel SoundingAmir Dezfooliyan, Student Member, IEEE, and Andrew M. Weiner, Fellow, IEEE
Abstract—Spread spectrum sounding experiments for indoorwireless channel over a frequency band spanning 2–12 GHz, whichexceeds the full FCC UWB band, are reported. Experiments werecarried out for directional spiral antennas in line-of-sight (LOS)and omnidirectional biconical antennas in nonline-of-sight (NLOS)environments, in the latter case with up to 15 m antenna separa-tion. For biconical antennas, channel multipath dispersion is themain reason for the delay spreads, while for spirals, frequency-de-pendent delays of the antennas modify signals upon radiation andreception. A special emphasis of this work is to assess the accuracyof the measured impulse responses extracted from the receivedwaveforms by deconvolution in a typical indoor environment. Inone scheme to assess accuracy, impulse responses obtained usingdifferent spread spectrum waveforms are compared; independentmeasurements show excellent agreement, with correlation coeffi-cients about 0.99. In a second assessment approach, accuracy istested by performing time reversal experiments based on the mea-sured channel impulse response. Correlation coefficients betweenexperimental and theoretical time-reversal traces are on the orderof 0.98, which further confirms highly accurate measurements.
Index Terms—Directional antenna, channel propagation mea-surement, omnidirectional antenna, spread spectrum, time-do-main techniques, time reversal, ultrawidebandwidth (UWB).
I. INTRODUCTION
U LTRAWIDEBAND (UWB) communication [1]–[3] hasbeen studied extensively in recent years due to its potential
capabilities in short range, high speed wireless applications suchas covert communications, highmultiple access capabilities, andwirelessUSB.Characterizing thewidebandpropagation channelis important for radio system design and performance analysisin general, and characterization of ultrawideband channels inparticular, is a topic of current interest [1]. UWB comes withseveral unique advantages (i.e., multipath fading robustness[4], and ultrahigh range resolution for radar applications [5]),and understanding the propagation channel is prerequisite toevaluating anyUWB system. Channel impacts onmultiantennassystem, body area networks, and ranging are discussed in [6].
Manuscript received February 02, 2012; revised April 18, 2012; acceptedMay 01, 2012. Date of publication July 10, 2012; date of current version Oc-tober 02, 2012. This work was supported by the Naval Postgraduate Schoolunder Grant N00244-09-1-0068, and under the National Security Science andEngineering Faculty Fellowship Program.The authors are with the School of Electrical and Computer Engineering,
Purdue University, West Lafayette, IN 47907 USA (e-mail: [email protected];[email protected]).Color versions of one or more of the figures in this paper are available online
at http://ieeexplore.ieee.org.Digital Object Identifier 10.1109/TAP.2012.2207358
In general, there are two possible methods for widebandchannel sounding and propagation measurements: frequencydomain and time domain. Frequency domainmeasurements relyon the utilization of a vector network analyzer (VNA) whichcontrols a synthesized frequency sweeper. The sweeper excitesthe channel by sinusoidal waveforms at different frequenciesand records the frequency dependent S-parameter , whichprovides an estimate of the channel transfer function .The impulse response can be calculated by taking InverseFourier Transform of . While the frequency domain ap-proach can be used to characterize channel responses over alarge bandwidth, the sweep time of the VNA ranges typicallyfrom several seconds to several minutes, depending on manyfactors like measurement bandwidth, speed of the synthesizer,and bandwidth of the IF filter [7], [8]. Although this suffices fortime invariant channels in which the transmitter and the receiverare static, the sweep time of aVNA is too slow to handle fast timevariant channels [1]. Another drawback is that complete channelcharacterization requiresmeasurements of phase aswell asmag-nitude,which in turn necessitates simultaneous connection of theVNA to both the transmitter (Tx) and the receiver (Rx). Usuallythis requires a high-quality doubly shielded RF cable which is amajor limitation for long distance measurements. In one recentexample, Pagani and Pajusco [9] used a VNA to cover the full3.1–10.6 GHz UWB band in LOS as well as NLOS environ-ments up to 20 m of Tx-Rx separation. Most other examplesreport measurements at less than 10 m of antenna separation orcover less than the full FCC UWB band [10]–[12].Time domain measurements provide a more direct character-
ization approach. In the simplest case, channels are excited bya short pulse and impulse responses are sampled at the receiverend by an oscilloscope. The chief limitation of this techniqueis that generating ultrashort, low ringing pulses with sufficientpower to measure high attenuation channels is difficult. Re-ceived responses in this method are the convolution of a channelresponse and a probing pulse. Deconvolution can be appliedto generalize the result; however, care is required to avoid nu-merical instabilities [13], [14]. UWB channel measurements byusing short pulses have been presented in [15]–[17]. In [16],wireless personal area network (WPAN) was studied over thefrequency band of 3.1–10.6 GHz by probing the channel withnarrow pulses ps in duration. Measurements were con-ducted at short distances only up to 135 cm for both LOS andNLOS scenarios. In [17], indoor UWB channels were charac-terized for both LOS and NLOS cases by using a Gaussian-likewaveform with approximately seven volt amplitude peak. Al-
0018-926X/$31.00 © 2012 IEEE

4856 IEEE TRANSACTIONS ON ANTENNAS AND PROPAGATION, VOL. 60, NO. 10, OCTOBER 2012
though the pulse width is reported as less than 100 ps, no infor-mation is provided about the achieved measurement bandwidthas affected by increasing Tx-Rx propagation distances. In gen-eral, path loss is expected to be frequency dependent; and mea-surement of the channel response at high frequencies degradesas the distance between antennas increases.Another time domain approach for measuring the impulse
response of the propagation channel exploits spread spectrumsounders. This method has its roots in chirped radar technology,in which spread spectrum transmit signals, coupled with pulsecompression at the receiver, circumvent the tradeoff betweentransmit energy and range [18], [19]. In this method, channelsare probed by a wideband signal such as PN or multicarrierspread spectrum waveforms [20]–[22]. These signals have lowpeak-to-average ratio, and higher levels of total transmittedpower compared to ultrashort pulses, which results in higherdynamic range. The autocorrelation of these wideband signalscan ideally approach a Dirac Delta function with very lowsidelobes [23]–[25]. In a number of papers in the UWB litera-ture, the channel response has been obtained by calculating thecross-correlation of the waveform measured at the receiver withthe transmitted waveform. For example, Durantini et al. [26],[27] used a carrier at 4.78 GHz modulated by a PN-sequenceto perform channel measurements over a 3.6–6 GHz frequencyband for distances ranging between 4–7.5 m for NLOS chan-nels and 1–11 m for LOS channels. In [28], [29], a transceiversetup based on SiGe-circuits is reported to generate periodicm-sequence waveforms covering a baseband frequency rangeof approximately 0–5 GHz, which can be up converted tocover either the UWB band or for coverage in the 60 GHzband. Receiver consists of a down-convertor, a track-and-holdcircuit, and an analog to digital convertor (ADC) which usesperiodic subsampling at a rate below Nyquist. To achieveaccurate subsampling and also up/down-conversion, carefulsynchronization is required. This transceiver is commerciallyavailable as a robust box in [30].In this paper, we perform spread spectrum channel sounding
using signals from an arbitrary waveform generator (AWG).The AWG not only provides sufficient bandwidth for channelcharacterization over a frequency band spanning 2–12 GHz,which exceeds the full FCC UWB band, but also provides theflexibility to choose different spread spectrum waveforms forsounding. This allows us to assess the accuracy of our channelmeasurements to an extent which, to the best of our knowledge,has not previously been reported in the UWB literature.Experiments were carried out indoors, both for directional
antennas in line-of-sight (LOS) environments and omnidirec-tional antennas in nonline-of-sight (NLOS) environments, in thelatter case with up to 15 m antenna separation. Because of thepractical difficulty of producing sounding signals with an idealdelta function autocorrelation, equivalent to a white power spec-trum, it is important to account for the source spectrum in ex-tracting the system impulse response. Because our experimentsachieve good SNR over the full measurement band, we are ableto employ a simple deconvolution procedure to accurately ex-tract the impulse response. A special emphasis of our work is toassess the accuracy of our time domain measurements in typ-ical indoor environments. Both spiral and biconical antennas
(arranged in either copolarized or cross-polarized orientation)are considered. In one scheme to assess the accuracy of our mea-surements, we compare channel responses obtained using twodifferent common spread spectrum waveforms, PN sequencesand chirp signals. We show despite their well known differentcharacteristics [31], under our channel environments, indepen-dent measurements show excellent agreement, with correlationcoefficients about 0.99. In a second assessment approach, ac-curacy is tested by performing time reversal (TR) [32]–[35]experiments based on the measured channel impulse response.Here the time reversal experimental results are compared withthe simulation trace that shows what should ideally be mea-sured at the receiver in the time reversal experiment if thereis no noise and if our impulse response measurements are per-fectly accurate. Here the correlation coefficients between exper-imental and theoretical time-reversal traces are on the order of0.98, which further confirms measurement accuracy. To the bestof our knowledge, this is the first experimental report of TR overthe whole UWB FCC mask. Other experimental TR literatureseither cover a small portion of the UWB [35], or are completelyout of the main UWB band (3.1–10.6 GHz) [34].We note that in general, path loss is frequency dependent
and high frequencies experience more attenuation than low fre-quencies, especially in NLOS environments [36]. Therefore, ex-citing the channel by a waveform covering a specified frequencyband does not guarantee signal-to-noise sufficient to measurethe channel response over the entire band. In this paper, wemakea point to report power spectra not only of transmitted channelsounding signals, but also of the resulting signals measured atthe receiver. In contrast to many time domain channel responsemeasurements reported in the literature, this practice helps tomore fully specify the band over which impulse responses arecharacterized.In many of our experiments, we introduce a simple optical
fiber link to achieve synchronization between transmitter and re-ceiver. This facilitates achieving high quality synchronization,even in NLOS cases with transmitter and receiver placed in dif-ferent rooms with up to 15 meters of separation.The remainder of this paper is organized as follows: Section II
provides details of the physical measurement setup. Section IIIdescribes our measurement methodology, including the charac-teristics of the transmitted sounding signals and the processingalgorithm employed to extract the impulse responses. Exam-ples of measurement results are reported in Section IV, both forspiral and omnidirectional antennas. Finally, in Section V weconclude.
II. EXPERIMENTAL SETUP
Fig. 1 shows a block diagram of the measurement system.The main components of the transmitter block are an AWG,ultrabroadband amplifier, and the transmitting antenna. Weused our Tektronix AWG 7122B in interleaving, zeroing-onmode, which provides the maximum available bandwidth. Ininterleaving mode, signals from two 12 GS/s D/A channelsare offset in time by half of the sampling period and passivelycombined to reach a maximum sampling rate of 24 GS/s.Interleaving also permits two modes of operation, zeroing onand zeroing off, which determine how individual samples are

DEZFOOLIYAN AND WEINER: EVALUATION OF TIME DOMAIN PROPAGATION MEASUREMENTS OF UWB SYSTEMS 4857
Fig. 1. Block diagram of the measurement system.
handled. In zeroing-off mode, the two D/A channels providenonreturn-to-zero waveforms which are summed together.With zeroing on, each waveform is brought to zero before thenext sample, and the output signal is the summation of the twowaveforms with zero gaps between samples. Zeroing on hashigher frequency response in comparison with zeroing off, butthe maximum output amplitude is reduced from 1 to0.5 . The AWG in interleaving, zeroing-on mode has aneffective RF bandwidth ( dB) of 9.6 GHz, with a rise andfall time (20% to 80%) of 35 ps. The output of the AWG isamplified by an ultrabroadband amplifier (Picosecond PulseLabs 5828A) with 10 dB gain, 6 dB noise figure, 12 dBmmaximum output power and 14 GHz bandwidth. We haveused two different antennas in our experiments: DirectionalArchimedean spiral antennas (NURAD 9C41600, 2–18 GHz),which are strongly dispersive and have circular polarization,and wideband omni-directional antennas (ELECTRO-MET-RICS EM-6865, 2–18 GHz) which have vertical polarizationand uniform radiation pattern in the azimuth plane. TheEM-6865 is composed of two brass biconical elements whichare connected point-to-point and make up an antenna elementshaped like a vertical infinity symbol.The received response of the Rx antenna is passed
through a Low Noise Amplifier (LNA) (B&Z Technologies,BZP120UD1). The selected LNA has a flat frequency responseover 0.1–20 GHz, a 2.2 dB noise figure and a minimum 31 dBgain. Depending on the Tx-Rx distance, antenna type (direc-tional or omni-directional) and environment (LOS/NLOS),channel loss varies significantly, and for some experiments wechoose to add up to two more amplifiers on the receiver side.These amplifiers are identical to the ultrabroadband amplifierused on the transmitter side. Such additional amplificationis particularly important for receiving high RF frequencieswhich experience more attenuation. In cascading amplifiers, itis important to avoid amplifier saturation, which in our exper-iments arises due to interference from Wi-Fi wireless signalswith frequency of 2.44 GHz. Hence, when extra amplifiersare used at the Rx, a high pass filter is used after the LNA.This filter (Mini-Circuits, VHF-3100 ) has approximatelyconstant transmission over the 3–11.5 GHz band and roughly43 dB insertion loss at 2.44 GHz, which is sufficient to avoidsaturation due to Wi-Fi signals.The received signal after amplification is directly connected
to the real-time oscilloscope (Digital Serial Analyzer, Tektronix
DSA 72004B) with 20 GHz analog bandwidth and maximumreal-time sampling rate of 50 GS/s. The “average” data acquisi-tion mode, in which we average over 256 measurements, is usedto reduce additive noise. The data acquisition time is approxi-mately 400 ms, dominated by oscilloscope dead-time betweensuccessive measurements in averaging mode. The oscilloscopeis triggered by one of the AWG’s digital “marker” outputs whichis synchronized with the transmittedwaveformwith timing jitterbelow 30 ps and a rise/fall time (20% to 80%) specified to be45 ps. For short Tx-Rx distances ( m), the trigger signal issent to the oscilloscope by a coaxial cable. As the distance be-tween antennas increases, particularly for NLOS environmentwhere we have to pass the cable through the doors, the loss anddispersion in the cable results in higher jitter [17]. To solve thisproblem, we use a single-mode optical fiber link (0.2 dB/km op-tical loss [37]) to transfer the trigger signal. A continuous-wave(CW) optical signal at 1.55 m wavelength from a tunable laser(Agilent 81689A) is directed into a commercial lithium nio-bate intensity modulator (IM) with DC electrical bias adjustedfor roughly 50% transmission and with an amplified version ofthe AWG marker signal connected to the RF input of the IM.This creates an optical intensity modulation that mirrors theelectrical marker signal [37]. The modulated optical signal isconnected through fiber to a high speed photodetector (THOR-LABS DET01CFC, 2 GHz RF bandwidth) which provides thehigh speed electrical signal for triggering the oscilloscope.Signals recorded by the oscilloscope are stored on a personal
computer using a GPIB interface. For NLOS experiments theoperator is typically positioned in the same room as the Rx. TheAWG is controlled remotely over a wireless local area network.Measurements have been carried out in the subbasement of
the MSEE building at Purdue University. Channel propaga-tion is studied in different locations for omni-directional andspiral antennas to prove the accuracy of our measurements inseveral independent experiments. For omnidirectional case, wemeasured LOS and NLOS scenarios. LOS experiments wereconducted in a large laboratory (15 m 10 m) which containsmetallic desks, cabinets, computers and scattering objects ofdifferent sizes. For NLOS measurements, we placed the trans-mitter in the laboratory and the receiver in an office across fromthe laboratory, and there are two cement walls and a hallway inthe direct path of the Rx-Tx antennas. As we mentioned, theomnidirectional antenna has vertical polarization and uniformradiation in the azimuth plane. We conducted our measure-ments in two different copolar and cross-polar topologies foromnidirectional antennas. In copolar experiments, both the Txand Rx have the same vertical polarization, while in cross-polarmeasurements, the Tx and Rx have different polarization direc-tions (we rotated the Rx antenna 90 degrees to have horizontalpolarization). For spiral antennas, different situations werestudied, including LOS, NLOS in the same room by pointingantennas to different directions, and NLOS by placing antennasin different rooms. In this paper, we present our channel mea-surement method in detail for the LOS spiral and NLOS copolaromni-directional cases. We have chosen these two examplesbecause different physical interactions are mainly involved inthese two experiments. In the NLOS omnidirectional case, thetransmitted signals from the Tx can be propagated in all direc-

4858 IEEE TRANSACTIONS ON ANTENNAS AND PROPAGATION, VOL. 60, NO. 10, OCTOBER 2012
TABLE ICORRELATION COEFFICIENTS FOR IMPULSE RESPONSES MEASURED BY PN AND CHIRP EXCITATIONS, AND ALSO FOR SIMULATION AND EXPERIMENTAL TR FROMCHIRP EXPERIMENTS. : FOR OMNIDIRECTIONAL ANTENNAS, WE USE “LOS” TO MEAN THAT ANTENNAS ARE IN THE SAME ROOM, WITH NO OBSTRUCTION
BETWEEN THEM. HOWEVER, NOTE THAT CROSS-POLAR RESPONSE ARISES FROM SCATTERING
Fig. 2. (a), (b) Generated PN and chirp signals in time domain, respectively. Both the PN and chirp waveforms have a nominal duration of 85.3 ns. (c), (d) RFpower spectra of the generated PN and chirp signals, respectively. Resolution bandwidth of spectrum analyzer is 100 KHz. Both signals are defined over thefrequency range of 0–12 GHz. Indicated parts by ellipsoids show extra features produced by AWG due to RF reflections in interleaving zeroing mode. The RFspectra also exhibit a spur at 12 GHz, equal to the individual channel sample rate of the AWG. These spurs are shown by arrows.
tions and reach the Rx via different paths and interactions (e.g.,reflection, diffraction or scattering). The received response inthis experiment mainly consists of different components whichhave certain delays and attenuations due to the paths they tookin their propagations from the Tx to the Rx. In the LOS spiralexperiment, antenna distortions, especially dispersion, affectthe received response, and the measured impulse responseis mainly antennas’ dispersion. In addition to the results ofthese two specific scenarios which are presented in detail, theaccuracy of measurement performed in several other scenariosis tabulated in Table I, which is discussed later.
III. MEASUREMENT METHOD
A. Probe Signals
Weused PN sequences and chirp signals for channel soundingand studying accuracy of our measurements. PN sequence canbe easily generated by a switching circuit (e.g., SiGe circuits[29]) and is the most common waveform used in spread spec-trum channel sounding. In the experiments here, we used theAWG to generate a maximal length PN sequence with 2047chips and a 24 GHz chip rate, corresponding to a waveform du-ration of ns. The chirp signal used in our experiments isa linear swept-frequency sinusoid whose frequency increases intime (up-chirp) from 0 to 12 GHz over the same 85.3 ns timeaperture used for the PN-sequence. In both cases the AWG isprogrammed to generate the selected waveforms periodically at
2.4 MHz repetition rate to support averaging. Received wave-forms are recorded with 20 ps sampling resolution over a suffi-ciently long time window (400 ns) to include all multipath com-ponents. This corresponds to 20 000 data points per waveform,which can be easily stored in our real-time oscilloscope withmemory length of 250 Megasamples.Fig. 2(a) and (b) show generated PN and chirp waveforms
after amplification by the Tx (“ultrabroadband”) amplifier anddirect connection to the oscilloscope through a DC-18 GHztriple shielded coaxial cable. Fig. 2(b) shows the chirp wave-form rolls off in time and its amplitude decreases. This can beexplained by considering time-frequency characteristics of ourchirp signals, for which the frequency increases linearly withtime. Due to the frequency response of the AWG, the later, highfrequency components of the signal are generated with loweramplitude than the earlier, low frequency components. Hence,the roll-off in time simply reflects the frequency response ofthe AWG generating the chirped signal. In contrast, for the PNsignal high and low frequencies are present concurrently, andsuch gradual roll-off in time is not observed. Fig. 2(c) and (d)display the RF spectra of the amplified transmit waveforms,measured by an RF spectrum analyzer set for 100 KHz reso-lution bandwidth. Here the high frequency rolloff of the AWGis apparent for both waveforms. The RF spectra also exhibit aspur at 12 GHz, equal to the individual channel sample rate ofthe AWG. These spurs may arise to differences in the ampli-tudes of the individual AWG channels or due to inaccuracy in

DEZFOOLIYAN AND WEINER: EVALUATION OF TIME DOMAIN PROPAGATION MEASUREMENTS OF UWB SYSTEMS 4859
Fig. 3. Impulse signal generated by AWGwith the minimum possible rise time(FWHM is ps). The indicated part by the arrow shows the extra featureproduced by AWG due to RF reflections in interleaving zeroing mode.
the time offset of the interleaved channels. Finally, the sectionsof the waveforms indicated by ellipses in Fig. 2(a) and (b) high-light an additional nonideal feature present in the AWG output,namely an echo with approximately 4 ns delay that arises in in-terleaving mode due to an RF reflection. This replica is moreobvious when the AWG is set to generate an impulse of min-imum ( ps) duration (see Fig. 3).
B. Data Processing and Analysis
Fig. 4 shows a block diagram of the experimental setup usedfor extracting the impulse response of the system from the re-ceived waveform. Fig. 4(a) portrays a calibration measurementin which the sounding waveform is recorded without wirelesstransmission, and Fig. 4(b) portrays the measurement in whichantennas, corresponding amplifiers, and the channel itself are allnow included. Equations (1)–(2) below provide a frequency do-main description of the calibration and channel measurementsportrayed by Figs. 4(a) and (b), respectively
(1)
(2)
Where and are, respectively, the frequencyresponse of AWG and oscilloscope, and is the frequencyresponse of the antennas, amplifiers, channel and the high-passfilter (if used in our system). denotes the idealspread spectrum (PN or chirp) signal generated by MATLABin frequency domain, is the output of AWG connectedby a short RF cable to the oscilloscope, and includeschannel, antennas, amplifiers and the high-pass filter (if used inour system) in addition to .To extract from , different approaches can be
employed [21], [22]. Here we compare two simple approaches,one of which takes into account the full spectral characteristicsof the sounding waveform and one of which does not. Althoughboth of the methods we consider are well known [22], [38], wediscussour implementation indetail so that interested readers canreplicate our measurements if desired. Our specific formalismrelies on deterministic Fourier transformable transmitted signalsand we assume synchronization is maintained throughout themeasurement for a periodic transmission and reception.
Fig. 4. Block diagram of the experimental setups. (a) AWG is programmed bythe wideband signal and its output is connected to the real time oscilloscope
. (b) Channels are excited by the AWG output. Impulse responses ofthe antennas, amplifiers and channel are included in addition to part (a) .
For ideal spread spectrum signals with a pulse-like autocor-relation, the unbiased impulse response estimation can be de-rived from the cross-correlation of the received response withthe transmitted signal. This approach, which has been used in anumber of spread spectrum channel sounding papers [25]–[28],[30], is expressed mathematically, in time and frequency do-mains respectively, as
(3)
(4)
where denotes the convolution operation; and andare the impulse responses related to and
by Inverse Fourier Transform (IFT). In our notation,and , respectively, refer to estimates of the frequencyresponse and impulse response of the channel, antennas andamplifiers obtained via cross-correlation processing. In (3), al-though and are real since we are considering themto be baseband signals, we retain the complex conjugate so that(3) is also applicable to the case where and are con-sidered as envelope functions with an assumed carrier.In this approach only the spectral phase of the sounding signal
is compensated; its frequency dependent magnitudestill contributes to the final estimation of the system transferfunction (e.g., neither the high-frequency roll-off of theAWG re-sponse, nor other irregularities in the power spectrum due to theecho in the AWG response, are compensated). As a result, whenthe transmitted spread spectrum signal is not white (autocorre-lation is not a delta function) [20], [23], an unbiased estimationcannot be achieved using just (3) and (4). These power spectrumimperfections can easily occur in practical measurement systeminvolving ultrawide bandwidths [26]–[29]. To illustrate, exam-ples of our experimental autocorrelations are shown in Fig. 5for PN and chirp transmit signals . For example, due toRF reflections internal to the AWG, the autocorrelations of bothtransmitted signals have unwanted peaks at approximately nsof the main peak. Also, although the autocorrelations of ideal,periodically repeated PN-sequences (known as periodic autocor-relation) are known to have an ideal pulse like property [23], theautocorrelation of the single period of a PN-sequence which is

4860 IEEE TRANSACTIONS ON ANTENNAS AND PROPAGATION, VOL. 60, NO. 10, OCTOBER 2012
Fig. 5. Autocorrelation of (a) PN (b) chirp. Extra replicas at ns of the mainpeak are due to AWG RF reflections.
used in our experiments, exhibits significant low level structureoutside of the main peak [27]. On the other hand, the sidelobesof the autocorrelation of single frame chirp signals behave like aSinc function [24] and have comparable quality to the sidelobesof periodic autocorrelation. As a result, the autocorrelationscomputed from our experimentally measured transmit signalsare significantly cleaner for the chirp waveform than for the PNwaveform, though neither is ideal. Because of such practicalissues, the quality of impulse responses computed via (3) and(4) will be compromised, since the nonideal autocorrelation andpower spectrum of the sounding waveform are not taken intoaccount.A simple approach that does take into account the full source
characteristics is deconvolution [21], [22]. The deconvolutionoperation can be performed either in the time [13], [14] or fre-quency domain; here we operate in the frequency domain by theapplication of the fast Fourier transform. Symbolically, we canwrite
(5)
can be computed from by inverse transform
(6)
We use the notation and , without super-script, to refer to estimates of the frequency response andimpulse response, respectively, obtained via the deconvolu-tion method, which we use throughout the rest of this paperunless otherwise noted. Although (5) and (6) are simple, theyare computationally unstable around the zeros of andmathematically classified as an ill-posed problem. In general,these equations are extremely sensitive to the presence of noise,and the transmitted signals, , should maintain a goodSNR over the desired spectral range. In our experiments, asthe transmitted signals cover frequency range up to 12 GHz,we resample the recorded data at 24 GHz, and apply (5) tothe resampled data. Because the transmitted signals have good
frequency content up to 12 GHz (see Fig. 2(c) and (d)), we didnot face instability problems in our computations. By imple-menting deconvolution in (5), modulations of the transmittedpower spectrum due to system imperfections are taken outwhich ideally results in an unbiased estimation of the systemimpulse response.For each antenna placement, we have also implemented the
time reversal technique [32]–[35]. Our experimental procedureconsists of resampling the obtained channel impulse responseat 24 GHz, inverting the result in time, and programming thisdirectly onto the AWG. This signal is then transmitted, and thenew waveform measured at the receiver is recorded using theoscilloscope. We compare this result with the simulated signalwhich is the autocorrelation of the measured channel impulseresponse convolved with the impulse response of AWG andoscilloscope
(7)
For these simulations we measured the impulse responseof AWG and oscilloscope by dividing the spectral ampli-tude of the chirp signal recorded at the output of the AWG,
, by the spectral amplitude of the ideal chirp wave-form, . This yields a better signal-to-noise ratioin comparison with the direct impulse response measurementshowed in Fig. 3. This simulation approach shows what shouldideally be measured at the receiver in time reversal experi-ments if there is no noise and if our channel measurements areperfectly accurate. Comparing this form of simulation with thetime reversal experiment provides an additional check on theaccuracy of the estimated channel impulse responses.Results for two different antenna types and propagation sce-
narios are discussed in Section IV.
IV. IMPULSE RESPONSE MEASUREMENTS
A. Directional Spiral Antenna
We first measure impulse response for two spiral antennas inLOS situation which mainly includes antennas’ dispersion ef-fects. The dispersive pulse response of these spiral antennas waspreviously studied in [39], [40], where pulses of variable band-width and center frequency obtained from a photonic waveformgenerator were used for antenna excitation. In the experimentshere, the height of the antennas is 1.8 m and their distance is 3m to satisfy far-field conditions. Because path loss is small inthis measurement, we placed just one LNA in the receiver side,in addition to the ultra-broad band AMP which we have used onthe Tx side in all our experiments.Fig. 6(a) and (b) are the received responses from PN and chirp
excitations in time domain. As we mentioned, nominal dura-tion of the probing PN and Chirp signals are 85.3 ns. Fig. 6(b)shows the received response of chirp excitation is shorter thanthe PN response and the transmitted signal length. This againcan be explained by considering time-frequency characteris-tics of chirp signals. When this signal is transmitted throughthe antenna (which has frequency response from 2–18 GHz),the beginnings of the pulse (up to 2 GHz) are filtered out, andtherefore the exciting signal becomes shorter than 85.3 ns. On
DEZFOOLIYAN AND WEINER: EVALUATION OF TIME DOMAIN PROPAGATION MEASUREMENTS OF UWB SYSTEMS 4861
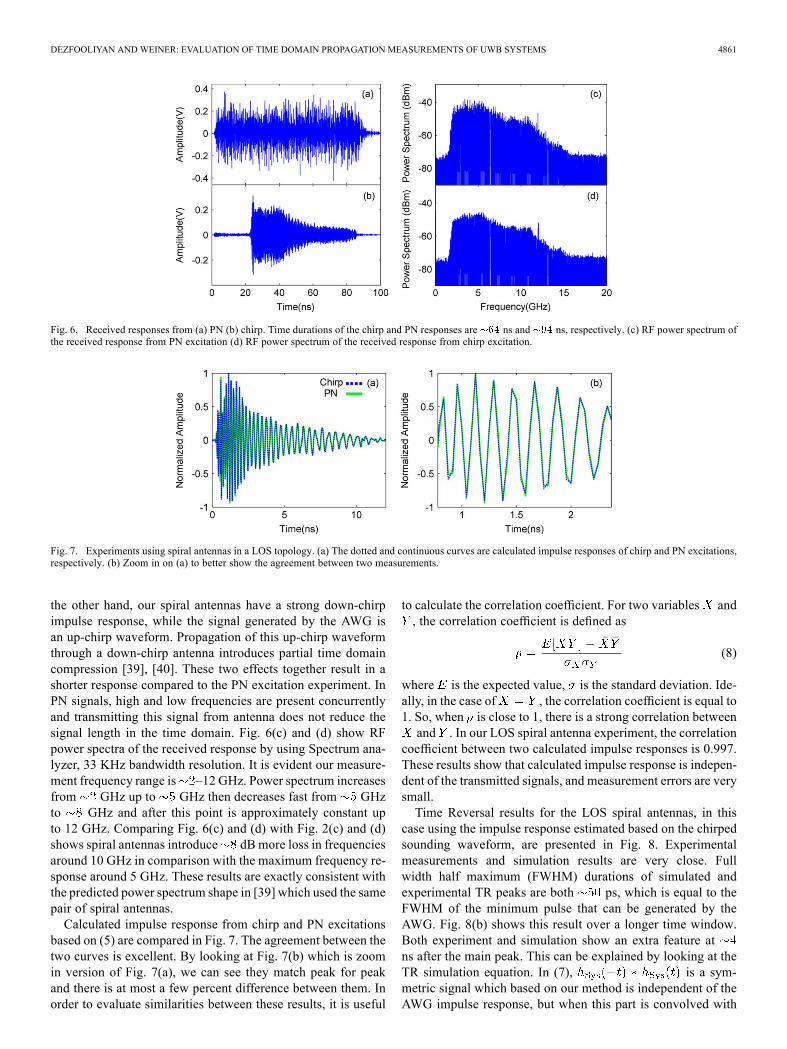
Fig. 6. Received responses from (a) PN (b) chirp. Time durations of the chirp and PN responses are ns and ns, respectively. (c) RF power spectrum ofthe received response from PN excitation (d) RF power spectrum of the received response from chirp excitation.
Fig. 7. Experiments using spiral antennas in a LOS topology. (a) The dotted and continuous curves are calculated impulse responses of chirp and PN excitations,respectively. (b) Zoom in on (a) to better show the agreement between two measurements.
the other hand, our spiral antennas have a strong down-chirpimpulse response, while the signal generated by the AWG isan up-chirp waveform. Propagation of this up-chirp waveformthrough a down-chirp antenna introduces partial time domaincompression [39], [40]. These two effects together result in ashorter response compared to the PN excitation experiment. InPN signals, high and low frequencies are present concurrentlyand transmitting this signal from antenna does not reduce thesignal length in the time domain. Fig. 6(c) and (d) show RFpower spectra of the received response by using Spectrum ana-lyzer, 33 KHz bandwidth resolution. It is evident our measure-ment frequency range is –12 GHz. Power spectrum increasesfrom GHz up to GHz then decreases fast from GHzto GHz and after this point is approximately constant upto 12 GHz. Comparing Fig. 6(c) and (d) with Fig. 2(c) and (d)shows spiral antennas introduce dBmore loss in frequenciesaround 10 GHz in comparison with the maximum frequency re-sponse around 5 GHz. These results are exactly consistent withthe predicted power spectrum shape in [39] which used the samepair of spiral antennas.Calculated impulse response from chirp and PN excitations
based on (5) are compared in Fig. 7. The agreement between thetwo curves is excellent. By looking at Fig. 7(b) which is zoomin version of Fig. 7(a), we can see they match peak for peakand there is at most a few percent difference between them. Inorder to evaluate similarities between these results, it is useful
to calculate the correlation coefficient. For two variables and, the correlation coefficient is defined as
(8)
where is the expected value, is the standard deviation. Ide-ally, in the case of , the correlation coefficient is equal to1. So, when is close to 1, there is a strong correlation betweenand . In our LOS spiral antenna experiment, the correlation
coefficient between two calculated impulse responses is 0.997.These results show that calculated impulse response is indepen-dent of the transmitted signals, and measurement errors are verysmall.Time Reversal results for the LOS spiral antennas, in this
case using the impulse response estimated based on the chirpedsounding waveform, are presented in Fig. 8. Experimentalmeasurements and simulation results are very close. Fullwidth half maximum (FWHM) durations of simulated andexperimental TR peaks are both ps, which is equal to theFWHM of the minimum pulse that can be generated by theAWG. Fig. 8(b) shows this result over a longer time window.Both experiment and simulation show an extra feature atns after the main peak. This can be explained by looking at theTR simulation equation. In (7), is a sym-metric signal which based on our method is independent of theAWG impulse response, but when this part is convolved with

4862 IEEE TRANSACTIONS ON ANTENNAS AND PROPAGATION, VOL. 60, NO. 10, OCTOBER 2012
Fig. 8. Comparison between Time Reversal experiment and simulation forLOS spiral antennas over two time windows. The part indicated by the arrowcorresponds to the echo in the AWG response.
Fig. 9. Comparison between impulse responses calculated via (3) and via (5)for spiral antennas in a LOS topology. (a) PN excitation. (b) Chirp excitation.
, the extra replica appears after the mainpeak due to the RF reflection in the AWG. As we discussed in(7), the agreement between the simulation and experimental TRresults shows our accuracy in measuring the impulse responseof the channel, antenna and AWG. The correlation coefficientbetween simulated and experimental TR traces is 0.974, whichshows remarkable similarity between the two data sets. Wealso performed TR using the impulse response measured byPN excitation, and the result is essentially indistinguishablefrom the TR experiment using the channel response measuredby chirped excitation.To show the importance of accounting for the actual source
power spectrum in computing the actual system impulse re-sponse, Fig. 9 compares results computed on the basis of (3)–(4)
Fig. 10. Experiment using omnidirectional antennas in a NLOS environment.RF power spectrum at the receiver, after high pass filter and cascaded amplifiers.The continuous plot shows spectrum for PN excitation, and the dotted one is thenoise power when the transmitter is turned off.
Fig. 11. Experiments using omnidirectional antennas in a NLOS environment.(a) The dotted and continuous curves are calculated impulse responses usingchirp and PN excitations, respectively. (b) Zoom in on (a) to better show theagreement between two measurements.
with those computed on the basis of (5). The results are clearlydifferent. Furthermore, the calculated responses via (3) evi-dently depend on the excitation signal. The impulse responseusing the PNwaveform and (3) is noisier than that using chirpedexcitation. As mentioned earlier, the autocorrelation of ourexperimental PN sequence has noise-like sidelobes; while theautocorrelation of our chirp signals behaves like a Sinc function.Because (3) does not fully account for imperfections of practicalultrawideband sounding waveforms, estimation of impulseresponses is degraded. Conversely, because (5) does accountfor such imperfections, extraction of the impulse response ismore robust against waveform variations, provided thatmaintain sufficient SNR over the measurement bandwidth.We repeated the same procedure in different locations and
environments with spiral antennas to study the accuracy ofour measurements in several independent experiments. Forexample, in a NLOS scenario, we placed the antennas in dif-ferent rooms and aligned them for the maximum reception. The

DEZFOOLIYAN AND WEINER: EVALUATION OF TIME DOMAIN PROPAGATION MEASUREMENTS OF UWB SYSTEMS 4863
Fig. 12. Comparison between simulation and experimental time reversal technique for omnidirectional copolar NLOS environment. (a) main peak of the TRresponse. (b) ns region of the TR signal following the main peak. Some parts of the peak signal can be seen on the left side of this figure.
correlation coefficient between the measured impulse responsesof PN and chirp excitations in this case is 0.9953. This valuefor the simulation and experimental TR is 0.9766 which provesremarkable measurement accuracy even in NLOS scenarios.
B. Omni-Directional Antenna
Omni-directional antennas are the most common and ap-propriate antennas for wireless communication applications.NLOS channel responses for omni-directional antennas havebeen studied by using frequency domain channel sounding indifferent literatures [7], [9], [11]. Studying channel characteri-zations by employing pulse excitation is extremely difficult dueto high channel attenuations in these scenarios. In this section,we explain NLOS copolar channel measurement over the entireUWB frequency range for omni-directional antennas by usingour spread spectrum sounding technique. Antennas are located
m far apart, with two cement walls in their direct path,which result in high losses especially for high frequencies. Toreceive high frequency components and cover the full UWBfrequency range, we used 51 dB gain amplification on thereceiver’s side. The main limitation of cascading amplifiers isthe saturation effect in the final stages. Wi-Fi wireless signal isthe major interference in most residential environments, witha frequency around 2.44 GHz. As explained earlier, instead ofturning off the Wi-Fi transmitters, we used a high pass filter( GHz) which suppresses Wi-Fi signals by 43 dB.Fig. 10 shows the power spectrum of the channel excitationby the PN signal, and also the noise level when the transmitteris turned off. In these measurements, the spectrum resolutionbandwidth is set to 33 KHz. It can be seen with this resolutionbandwidth, the noise level is about dBm which is equiv-alent to the noise power spectral density of dBm/Hz.High UWB frequency components experience dB moreloss than low frequency components around 3.1 GHz. In con-trast, this frequency dependence in LOS measurements ( mpropagation distance) with the same omni-directional antennasis about 7 dB. The extra loss for high frequency components inthe NLOS case is the result of passing signals through walls. In[36], experimental results show there is dB loss differencebetween 3 GHz and 10 GHz when signals propagate through asingle indoor cement wall.Fig. 11 shows calculated impulse response for PN and chirp
excitations using (5). Again, we can see the agreement betweenthe results is remarkable and by eye is almost perfect. Again this
confirms that our channel measurement is independent of theexciting signal. The correlation coefficient between these tworesponses is 0.991 which shows strong correlation between thetwo data sets.The simulation and experiment of Time Reversal Technique,
using the impulse response estimated using chirped waveformexcitation, are compared in Fig. 12. Fig. 12(a) shows the mainpeak of the TR over a ns time window. The correlation co-efficient between these two data sets over 50 ns time range,which covers the main sidelobes of the TR response, is 0.978. InFig. 12(b), we zoom in on the sidelobes of the TR response closeto the main peak. Some parts of the main peak can be seen on theleft side of this figure, to show the agreement between simula-tion and experimental results on this part of the TR. Again sim-ulated and experimental traces curves agree quite well, whichagain proves that we have a very small error in estimating thephysical response of our system, even in NLOS environments.We also investigated impulse responsemeasurements in other
scenarios to study the repeatability and accuracy of the decon-volution method. Table I shows correlation coefficients for im-pulse responses measured by PN and chirp excitations, and alsofor simulation and experimental TRs based on chirp experi-ments. LOS and NLOS experiments were conducted in the en-vironments described in Section II. The presented values areexamples of several measurements we conducted in differentlocations. This technique shows comparable performance forcopolar and cross-polar measurements, but, in general, LOS ex-periments for omni-directional antennas have higher correlationcoefficient values in comparison with the NLOSmeasurements.This can be explained by considering the overall amplifier gainvalue on the Rx side in these two scenarios. In NLOS experi-ments, we amplified the received response by the overall 51 dBgain, however, we have lower path loss in LOS experiments andthe overall receiver gain is 20 dB. Higher gain values on theNLOS receiver side results in more noise amplifications, and,therefore, the correlation coefficient between data sets is lower.Based on our measurements, impulse response of the chan-
nels can be changed dramatically from one location to another,but, all the measured responses show comparable accuracy tothe examples presented in this paper. This remarkable precisionmakes spread spectrum sounding highly appropriate for charac-terizing ultrawideband radio channels in a variety of situations,as well as for control of channel compensation schemes such astime reversal.

4864 IEEE TRANSACTIONS ON ANTENNAS AND PROPAGATION, VOL. 60, NO. 10, OCTOBER 2012
V. CONCLUSION
In this paper, we investigated accuracy of spread spectrumchannel sounding based on deconvolution in typical LOSand NLOS indoor environments, in the later case up to 15 mpropagation distance. An optical fiber link is used to facili-tate synchronization of Tx-Rx in NLOS scenarios. Widebandprobing waveforms provide higher levels of total transmittedpower compared to ultrashort pulses, which results in a higherdynamic range. The AWG not only provides sufficient band-width for channel characterization over a frequency bandspanning 2–12 GHz, but also provides the flexibility to choosedifferent spread spectrum waveforms for sounding. We studiedthe accuracy of calculated impulse responses by comparingchannel measurements obtained for PN sequence and chirpwaveform excitation. Different experiments including LOSspiral and NLOS omni-directional antennas show more than99 percent agreement between the chirp and PN excitationresults. In another route to test the accuracy, time reversalhas been carried out experimentally. Correlation coefficientsbetween experimental and theoretical time reversal tracesare on the order of 0.98. Our experiments clearly show thatspread spectrum channel sounding can provide high accuracymeasurements of the channel impulse response over the fullUWB band. Furthermore, by exploiting the high quality im-pulse response data obtained, we are able to demonstrate timereversal experiments over a bandwidth, which to the best of ourknowledge, has not previously been reported.
ACKNOWLEDGMENT
The authors would like to thank Prof. A. F. Molisch for his in-sightful comments, and our lab manager Dr. D. E. Leaird for hishelpful technical assistance on this work. Any opinion, findings,and conclusions or recommendations expressed in this publica-tion are those of the authors and do not necessarily reflect theviews of the sponsors.
REFERENCES[1] A. F. Molisch, “Ultrawideband propagation channel,” in Proc. IEEE,
Feb. 2009, vol. 97, no. 2, pp. 353–371 .[2] L. Yang and G. B. Giannakis, “Ultra-wideband communications—An
idea whose time has come,” IEEE Signal Process. Mag., vol. 21, pp.26–54, Nov. 2004.
[3] R. C. Qiu, H. Liu, and X. Shen, “Ultra-wideband for multiple accesscommunications,” IEEECommun.Mag., vol. 43, pp. 80–87, Feb. 2005.
[4] J. Romme and B. Kull, “On the relation between bandwidth and robust-ness of indoor UWB communication,” presented at the UWBST’03Conf., Nov. 2003.
[5] I. I. Immoreev and D. V. Fedotov, “Ultra wideband radar systems:Advantages and disadvantages,” in Proc. IEEE Ultra Wideband Syst.Technol. Conf., Baltimore, MD, May 2002, pp. 201–205.
[6] A. F. Molisch, “Ultrawideband propagation channels and their impacton system design,” presented at the IEEE Conf. Meas., Antennas,Channels, EMC (MAPE), 2007.
[7] J. Karedal, S. Wyne, P. Almers, F. Tufvesson, and A. F. Molisch,“A measurement-based statistical model for industrial ultra-wide-band channels,” IEEE Trans. Wireless Commun., vol. 6, no. 8, pp.3028–3037, Aug. 2007.
[8] D. Cassioli, A. Durantini, and W. Ciccognani, “The role of path losson the selection of the operating bands of UWB systems,” in Proc.IEEE Int. Symp. Personal, Indoor Mobile Radio Commun., 2004, pp.2787–2791.
[9] P. Pagani and P. Pajusco, “Experimental analysis of the ultra widebandpropagation channel over the 3.1 GHz–10.6 GHz frequency band,” pre-sented at the PIMRC, Helsinki, 2006.
[10] J. Keignart and N. Daniele, “Subnanosecond UWB channel soundingin frequency and temporal domain,” in Proc. IEEE Conf. Ultra Wide-band Syst. Technol., 2002, pp. 25–30.
[11] W. Q. Malik, “Spatial correlation in ultrawideband channels,” IEEETrans. Wireless Commun., vol. 7, pp. 604–610, Jul. 2008.
[12] S. S. Ghassenizadeh et al., “A statistical path loss model for in-homeUWB channels,” in Proc. UWBST, 2002, pp. 59–64.
[13] R. J. M. Cramer, R. A. Scholtz, and M. Z. Win, “Evaluation of an ultra-wide-band propagation channel,” IEEE Trans. Antennas Propag., vol.50, no. 5, pp. 561–70, May 2002.
[14] T. C.-K. Liu, D. I. Kim, and R. G. Vaughan, “A high-resolution, multi-template deconvolution algorithm for time-domain UWBchannel char-acterization,”Can. J. Electr. Comput. Eng., vol. 32, no. 4, pp. 207–213,2007.
[15] N. Alsindi, D. Birru, and D. Wang, “Ultra-wideband channel measure-ment characterization for wireless magnetic resonance imaging appli-cations,” presented at the 41th Conf. Inform. Sci. Syst. (CISS’07), Bal-timore, MD, Mar. 14–16, 2007, Johns Hopkins University.
[16] Z. Irahhauten1, J. Dacuna1, G. J. M. Janssen, and H. Nikookar, “UWBchannel measurements and results for wireless personal area networksapplications,” in Proc. Eur. Conf. Wireless Tech., Paris, France, Oct.3–4, 2005.
[17] A. Muqaibel, A. Safaai-Jazi, A. Attiya, B. Woerner, and S. Riad,“Pathloss and time dispersion parameters for indoor UWB propaga-tion,” IEEE Trans. Wireless Commun., vol. 5, no. 3, pp. 550–559, Mar.2006.
[18] J. R. Klauder, A. C. Price, S. Darlington, and W. J. Albersheim, “Thetheory and design of chirp radars,” Bell Sys. Tech. J., vol. 39, no. 4, pp.745–820, Jul. 1960.
[19] R. Zetik, J. Sachs, and R. S. Thomä, “UWB short-range radar sensing,”IEEE Instrum. Meas. Mag., vol. 10, no. 2, Apr. 2007.
[20] S. Zhou, G. B. Giannakis, and A. Swami, “Digital multi-carrier spreadspectrum versus direct sequence spread spectrum for resistance tojamming and multipath,” IEEE Trans. Commun., vol. 50, no. 4, pp.643–655, Apr. 2002.
[21] J. Schoukens and R. Pintelon, Identification of Linear Systems—APractical Guideline to Accurate Modeling. Oxford, U.K.: PergamonPress, 1991.
[22] A. Richter, “Estimation of Radio Channel Parameters: Models andAlgorithms,” Ph.D. dissertation, Technische Universitat Ilmenau, Il-menau, Germany, 2005.
[23] D. V. Sarwate and M. B. Pursley, “Crosscorrelation properties ofpseudorandom and related sequences,” Proc. IEEE, vol. 68, no. 5, pp.593–619, May 1980.
[24] A. Hein, Processing of SAR Data: Fundamentals, Signal Processing,Interferometry. Berlin, Germany: Springer-Verlag, 2004.
[25] G. Janssen and J. Vriens, “High resolution coherent radio channelmeasurements using direct sequence spread spectrum modulation,” inProc. 6th Mediterranean IEEE Electro Techn. Conf., 1991, vol. 1, pp.720–727.
[26] A. Durantini,W. Ciccognani, andD. Cassioli, “UWBpropagationmea-surements by PN—Sequence channel sounding,” in Proc. IEEE Int.Conf. Commun., Paris, France, 2004, pp. 3414–3418.
[27] A. Durantini and D. Cassioli, “Measurements, modeling and simu-lations of the UWB propagation channel based on direct-sequencechannel sounding,” Wireless Comm. Mob. Comp. J., no. 5, pp.513–523, 2005.
[28] R. Zetik, R. Thoma, and J. Sachs, “Ultra-wideband real-time channelsounder design and application,” presented at the COST273 TD(03)201, Prague, Czech Republic, 2003.
[29] J. Sachs, M. Kmec, R. Herrmann, P. Peyerl, and P. Rauschenbach, “Anultra-wideband pseudo-noise radar family integrated in SiGe:C,” pre-sented at the Int. Radar Symp. IRS 2006, Krakow, Poland, May 24–26,2006.
[30] [Online]. Available: http://www.channelsounder.de/[31] M. Kowatsch and J. T. Lafferl, “A spread-spectrum concept combining
chirp modulation and pseudonoise coding,” IEEE Trans. Commun.,vol. COM-31, no. 10, pp. 1133–1142, Oct. 1983.
[32] M. Fink, “Time reversal of ultrasonic fields—I: Basic principles,” IEEETrans. Ultrason., Ferroelect., Freq. Contr., vol. 39, no. 5, pp. 555–566,Sep. 1992.
[33] D. Abbasi-Moghadam and V. T. Vakili, “Characterization of indoortime reversal UWB communication systems: Spatial, temporal and fre-quency properties,” Int. J. Commun. Syst., vol. 24, no. 3, pp. 277–294,Mar. 2011.
[34] I. H. Naqvi et al., “Experimental validation of time reversal ultrawide-band communication system for high data rates,” IEEE Trans. An-tennas Propag., vol. 4, no. 5, pp. 643–650, May 2010.

DEZFOOLIYAN AND WEINER: EVALUATION OF TIME DOMAIN PROPAGATION MEASUREMENTS OF UWB SYSTEMS 4865
[35] N. Guo, J. Q. Zhang, P. Zhang, Z. Hu, Y. Song, and R. C. Qiu, “UWBreal-time testbed with waveform-based precoding,” presented at theIEEE MILCOM’08, 2008.
[36] G. Tesserault, N. Malhouroux, and P. Pajusco, “Determination of ma-terial characteristics for optimizing WLAN radio,” in Proc. IEEE Eur.Conf. Wireless Technol., 2007, pp. 225–228.
[37] G. L. Li and P. K. L. Yu, “Optical intensity modulators for digital andanalog applications,” J. Lightw. Technol., vol. 21, no. 9, pp. 2010–2030,Sep. 2003.
[38] M. K. Tsatsanis and G. B. Giannakis, “Blind estimation of directsequence spread spectrum signals in multipath,” IEEE Trans. SignalProcess., vol. 45, no. 5, pp. 1241–1252, May 1997.
[39] J. D. McKinney, D. Peroulis, and A. M. Weiner, “Time-domain mea-surement of the frequency-dependent delay of broadband antennas,”IEEE Trans. Antennas Propag., vol. 56, no. 1, pp. 39–47, Jan. 2008.
[40] J. D.McKinney, D. Peroulis, andA.M.Weiner, “Dispersion limitationsof ultra-wideband wireless links and their compensation via photoni-cally-enabled arbitrary waveform generation,” IEEE Trans. Microw.Theory Techn., vol. 56, no. 3, pp. 710–718, Mar. 2008.
Amir Dezfooliyan received the B.Sc. degree inelectrical engineering from Sharif University ofTechnology, Tehran, Iran, in 2009. He is currentlyworking toward the Ph.D. degree in electrical engi-neering at Purdue University, West Lafayette, IN.Since 2009, he has been a Graduate Research
Assistant with the Ultrafast Optics and Optical FiberCommunications Laboratory at Purdue University.His current research interests are wireless propaga-tion, UWB communications, ultrafast optics, andoptical pulse shaping.
AndrewM.Weiner (F’95) received the D.Sc. degreein electrical engineering from the Massachusetts In-stitute of Technology, Cambridge, in 1984.Upon graduation, he joined Bellcore, first as a
Member of Technical Staff and later as Managerof Ultrafast Optics and Optical Signal ProcessingResearch. He moved to Purdue University, WestLafayette, IN, in 1992, and is currently the ScifresFamily Distinguished Professor of Electrical andComputer Engineering. His research interestsinclude ultrafast optics signal processing, and appli-
cations to high-speed optical communications and ultrawideband wireless. Heis author of a textbook entitled Ultrafast Optics (Wiley, 2009), has publishedsix book chapters and more than 250 journal articles, and is holder of over 10U.S. patents.Dr. Weiner is a Fellow of the Optical Society of America and is a Member
of the U.S. National Academy of Engineering. He has won numerous awardsfor his research, including the Hertz Foundation Doctoral Thesis Prize (1984),the Adolph Lomb Medal of the Optical Society of America (1990), the CurtisMcGraw Research Award of the American Society of Engineering Education(1997), the International Commission on Optics Prize (1997), the Alexandervon Humboldt Foundation Research Award for Senior U.S. Scientists (2000),and the IEEE Photonics Society Quantum Electronics Award (2011). He is jointrecipient, with J. P. Heritage, of the IEEE LEOS William Streifer ScientificAchievement Award (1999) and the OSAR.W.Wood Prize (2008), and has beenrecognized by Purdue University with the inaugural Research Excellence Awardfrom the Schools of Engineering (2003) and with the Provost’s OutstandingGraduate Student Mentor Award (2008). In 2009, he was named a U.S. Depart-ment of Defense National Security Science and Engineering Faculty Fellow. Hehas served as Cochair of the Conference on Lasers and Electro-optics and theInternational Conference on Ultrafast Phenomena, as Secretary/Treasurer of theIEEE Lasers and Electro-optics Society (LEOS), as a Vice-President of the In-ternational Commission on Optics (ICO), and as Chair of the National Academyof Engineering U.S. Frontiers of Engineering Meeting.