ieee international conference on data mining workshops 2009 hai jin and diansheng guo department of...
TRANSCRIPT

Understanding Climate Change Patterns with Multivariate Geovisualization
IEEE International Conference on Data Mining Workshops 2009
Hai Jin and Diansheng GuoDepartment of Geography
University of South CarolinaColumbia

Introduction Self-Organizing Map U-Matrix Parallel Coordinate Plot Example Conclusion
Outline

Climate change has been a challenging and urgent research problem for many related research fields.◦ most existing visualization and mapping
approaches for climate data analysis are limited to one variable or one perspective at a time
This paper introduces the application of a multivariate geovisualization approach◦ to explore and understand complex climate
change patterns across multiple perspectives including the geographic space, time, and multiple
variables.
Introduction

SOMs were developed by Kohonen in the early 1980's
SOM的基本原理源於大腦結構的特性,因為大腦具有相同功能的腦細胞會聚集在一起的特性,例如:大腦中有專司味覺、視覺等的區塊。◦ input data ∈ℛn
◦ weight: Wi(t) (reference vector) ∈ℛn
◦ physical space: neurons (low-dimension)
Self-Organizing Map (SOM)

SOM Algorithm

SOM - Initialization

Neighborhood functions
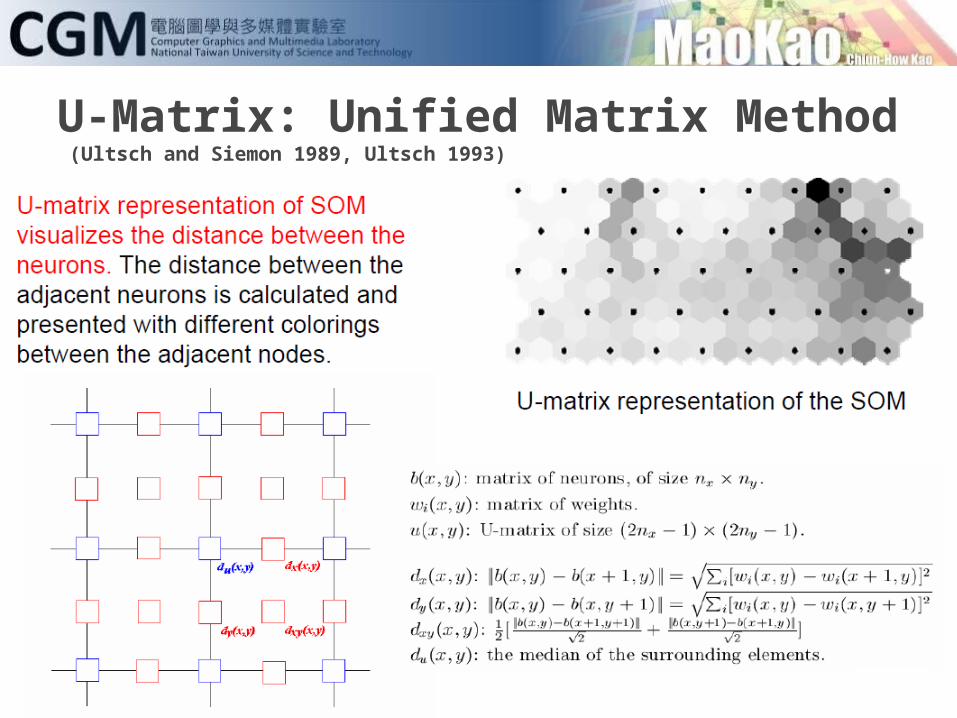
U-Matrix: Unified Matrix Method (Ultsch and Siemon 1989, Ultsch 1993)

Encoding Patterns with ColorsMultivariate Analysis and Geovisualization with an Integrated Geographic Knowledge Discovery Approach

A 3D structure of a diverging–diverging color scheme from an ellipsoid model.
A 3D structure of a diverging–diverging scheme from a bell-shaped model.

Parallel Coordinate Plot (PCP)

The PCP visualizes the SOM result

The climate data used in this research is a spatiotemporal data set of monthly mean surface air temperature for 60 years (Jan. 1948—Dec. 2007).◦ the 10-year average temperature for each 10-
year period (1948-1957, 1958-1967, 1968-1977, 1978-1987, 1988-1997, 1998-2007)
◦ 2664 spatial objects (grid cells) ◦ 12 variables(monthly anomaly) for 6 decades.
Example


Conclusion This paper presents a preliminary application of
an integrated approach to multivariate clustering and geovisualization to explore climate change patterns.
The analysis and visualization of climate change patterns presented in the paper focus on fixed spatial (grid cells) and temporal resolutions (monthly and decadal aggregations).
The software for the presented approach is available at http://www.SpatialDataMining.org.