iea civic education study technical report
TRANSCRIPT

The International Association for theEvaluation of Educational Achievement
Edited by Wolfram Schulz andHeiko Sibberns
IEA Civic Education StudyTechnical Report

1
IEA Civic Education StudyTechnical Report

2 IEA CIVIC EDUCATION STUDY TECHNICAL REPORT

3
IEA Civic Education StudyTechnical Report
The International Association for the
Evaluation of Educational Achievement
Edited by
Wolfram Schulz
and
Heiko Sibberns
with contributorsPierre Foy
Vera Husfeldt
Rainer Lehmann
Roumiana Nikolova
Judith Torney-Purta

4 IEA CIVIC EDUCATION STUDY TECHNICAL REPORT
Copyright © 2004 IEA
All rights reserved. No part of this publication may be reproduced, stored in a retrievalsystem or transmitted in any form or by any means, electronic, electrostatic, magnetic tape,mechanical, photocopying, recording or otherwise without permission in writing from thecopyright holder.
ISBN 90-806643-4-0
Copies of the IEA Civic Education Study Technical Report can be obtained from:IEA SecretariatHerengracht 4871017 BT Amsterdam, The NetherlandsTelephone + 31 20 625 3625Fax + 31 20 420 7136Email: [email protected]
Website: www.iea.nl. Funding for the international coordination of the IEA Civic Education
Study was provided by IEA, the participating countries, the German Science Association(DFG) through a grant to the Humboldt University of Berlin, the University of Maryland,and private foundations from both Europe and the United States.
Printed by Multicopy, Amsterdam, The NetherlandsEdited by Paula Wagemaker Editorial Services, Christchurch, New ZealandDesigned by Becky Bliss Design and Production, Wellington, New Zealand

5
TABLE OF CONTENTS
Chapter 1: Overview of the IEA Civic Education Study 7
Rainer Lehmann
Chapter 2: Development of the CivEd Instruments 17
Vera Husfeldt and Judith Torney-Purta
Chapter 3: Translation Procedures, Field Operations, and Quality 27Assurance
Wolfram Schulz and Roumiana Nikolova
Chapter 4: The CivEd Sampling Design 41
Heiko Sibberns and Pierre Foy
Chapter 5: Data Management and Construction of the 55CivEd Database
Heiko Sibberns
Chapter 6: Weighting Procedures 61
Heiko Sibberns and Pierre Foy
Chapter 7: Scaling Procedures for Cognitive Items 69
Wolfram Schulz and Heiko Sibberns
Chapter 8: Scaling Procedures for Likert-type Items on Students’ 93Concepts, Attitudes, and Actions
Wolfram Schulz
Chapter 9: Mapping Student Scores to Item Responses 127
Wolfram Schulz
Chapter 10: Reporting Student and Teacher Data 133
Wolfram Schulz and Rainer Lehmann
Appendices
Appendix A: Acknowledgments 155
Appendix B: Test and Questionnaire Design 163
Appendix C: Test and Operation Forms 177
Appendix D: Sample Characteristics 187
Appendix E: Design Effects and Effective Sample Size Tables 234
Appendix F: The CivEd Instruments 236

6 IEA CIVIC EDUCATION STUDY TECHNICAL REPORT

7
Chapter 1:
OVERVIEW OF THE IEA CIVICEDUCATION STUDYRainer Lehmann
Twice in its long history of investigating the productivity of educationalsystems, IEA (the International Association for the Evaluation of EducationalAchievement) has authorized surveys of student achievement and attitudes inthe domain of civic education. The first such study (Torney, Oppenheim, &Farnen, 1975) was conducted as part of the so-called Six Subject Study, withdata collected in 1971 (for a summary, see Walker, 1976). The second, forwhich a technical description is given in the present volume, was approved bythe 35th IEA General Assembly in 1994 in Yokyakarta, Indonesia. The maindata collection for this second study took place in 1999, and initial resultswere published in two volumes (Amadeo, Torney-Purta, Lehmann, Husfeldt, &Nikolova, 2002; Torney-Purta, Lehmann, Oswald, & Schulz, 2001).
Unlike domains of learning and teaching such as mother tongue, mathematics,and science (and in many countries also foreign languages), civic educationdoes not hold a well-defined place in an international core curriculum. Evenwithin a country, it can be taught as a specific school subject (often under avariety of titles), be relegated to the status of a secondary or implicit area in anexisting subject (typically history), or be declared a cross-curricular principlethat is to govern all school-based activities. In accordance with this situation,the straightforward aim of the study could not be to measure the “achievedcurriculum”. Rather, the extremely broad definitions of what civic educationcould or should be in and across the countries under investigation had to bebuilt into the general design of the study.
GENERAL DESIGNThe IEA Civic Education Study was conceived as a two-phased study, with thetwo phases referring to:
a) a series of national case studies, designed to investigate, for eachparticipating country, the key issues in the discourse related to the role ofcivic education in the respective context (Phase 1); and
b) a comparative empirical study, consisting of a test of civic knowledge and asurvey of civic-related concepts and attitudes as well as reports on current orexpected civic activities (Phase 2).
Even before the case studies were published (Torney-Purta, Schwille, &Amadeo, 1999), information generated in Phase 1 had been used in aconsensus process conducted by the International Steering Committee (ICC)with the national research coordinators (NRCs) to sharpen the focus of theempirical study of Phase 2. Three main topic areas were identified as being of

8 IEA CIVIC EDUCATION STUDY TECHNICAL REPORT
1 Throughout most of this report, these populations are referred to as 14-year-old students and upper secondary studentsrespectively.
CHARACTERISTICS OF THE IEA CIVIC EDUCATION STUDY
Who Was Assessed?• Standard population: Students in the grade in which most 14-year-olds were found at the time
of testing.• Older population: Upper secondary students in the grade where most students of the nationally
defined age group (16, 17, or 18) were found at the time of testing.1
How Many Were Assessed?• Standard population: Approximately 90,000 14-year-old students from 28 countries were
assessed in 1999. In addition, questionnaire data were collected from approximately 9,000teachers and 4,000 school principals.
• Older population: More than 50,000 16- to 18-year-old students at the upper secondaryschool level from 16 countries were assessed. In addition, questionnaire data were collectedfrom more than 2,000 school principals.
What Was Assessed?• Civic knowledge, including two sub-domains (civic content knowledge and skills in
interpreting political communication), was assessed for both populations; economic literacywas assessed for the upper secondary students only.
• Information was obtained on the home background of the tested students.• Students’ concepts of democracy and citizenship, students’ attitudes regarding institutions,
minorities, and national identity, and students’ civic-related actions were ascertained, as wereaspects of civic-related teaching and learning as perceived by students, teachers, and schoolprincipals.
• Characteristics of sampled schools and teachers of civic-related subjects were documented.
How Were the Data Collected?• The main assessment, of two hours, included a cognitive test, background questions, and
Likert-type items.• Students were assessed with tests consisting of 38 multiple-choice items for the 14-year-old
students and 43 multiple-choice items for the upper secondary students.• Students answered a short background questionnaire and a range of Likert-type items
covering students’ civic-related concepts, attitudes, and actions.• School principals answered a questionnaire about their school and the teaching of civic
education.• Teachers answered a questionnaire about their professional background and the teaching of
civic education.
What Were the Outcomes?• Cross-country comparisons of 14-year-olds’ and upper secondary students’ civic knowledge,
concepts of democracy and citizenship, and civic-related attitudes and actions.• Cross-country comparisons regarding the teaching and learning of civic education.• Analyses of potential predictors of civic knowledge and civic engagement.• A rich database for secondary analysis of political socialization and civic education with data
from 29 countries.• Comparative civic-related data for students from different grades and age groups in 15
countries.

9
fundamental concern in all countries participating in Phase 1:
1. Democracy and Citizenship
2. National Identity and International Relations
3. Social Cohesion and Diversity.
Although these three areas represented the state of affairs in the participatingcountries in 1997/1998, the general design of the present IEA CivicEducation Study has preserved some continuity with respect to the study of1971. First, the set of criterion variables is not restricted to achievement testresults, but also comprises conceptual, attitudinal, and motivational variables.Second, the aspects of civic education under investigation, though not identicalbetween the two studies, are sufficiently similar to allow for occasionalcomparison at the item level. However, statistical and technical advances in thealmost three decades between the two studies (as well as advances in researchin the social sciences and education) are clearly reflected in the present study’sdesign, analysis of data, and presentation of results.
Originally, it was envisaged that no country could participate in Phase 2 of thestudy unless it had provided a national case study chapter by the publicationdeadline for the Phase 1 volume (Torney-Purta et al., 1999). A few countriesreceived final permissions and/or funding for participation after the Phase 1book was completed, but were accepted for participation in Phase 2,particularly since some of them were likely to provide data-facilitatingcontinuity between the 1971 and 1999 studies.
Continuity between the two studies was also a motive in defining the primarytarget population as the grade in which most 14-year-olds were enrolled. The1971 study, as well as research in this area from Germany and Switzerland(Fend, 1991), had demonstrated the existence and interpretability of civic-related variation between students of that age. However, the evaluators of theproposal for the current study presented to the German Research Association(Deutsche Forschungsgemeinschaft: DFG) as the principal funder insisted that atleast one older student population should also be tested and surveyed because,in their opinion, relevant aspects in the emergence of civic-relatedcharacteristics could better be studied at a late point in the development ofadolescents.
The assessment of a population older than 14, upon which the funding of theinternational coordination of the study was made dependent, created a situationthat entailed substantial problems for the data analysis. The countries had basedtheir decision to participate on the original proposal, which required nationalsupport for a study of 14-year-olds. The national research centers had to beurged to seek such support also for a target population from the uppersecondary school, preferably with a modal age of 17. With a great deal ofgoodwill and at considerable expense, 16 countries identified a national targetpopulation. Unfortunately, Germany was not one of them. As a consequence ofthe attempts to save funding for the study as a whole occasioned by theaddition of this group, there is no internationally standardized definition oftarget populations at the upper secondary level, but rather considerablevariation between the national samples of different countries, both in terms of
CHAPTER 1 OVERVIEW OF THE IEA CIVIC EDUCATION STUDY

10 IEA CIVIC EDUCATION STUDY TECHNICAL REPORT
Country National Case Study 14-year-olds Upper Secondary Students
Australia • •Belgium (French) • •Bulgaria • •Canada •Chile • •Colombia • • •Cyprus • • •Czech Republic • • •Denmark • •England • •Estonia • •Finland • •Germany • •Greece • •Hong Kong (SAR) • • •Hungary • •Israel • •Italy • •Latvia • •Lithuania • •Netherlands •Norway • •Poland • • •Portugal • • •Romania • •Russian Federation • • •Slovak Republic •Slovenia • • •Sweden • •Switzerland • • •United States • •Number of countries 24 28 16
mean age (between 16.6 and 19.4) and coverage of the age cohort. The 14-year-old samples all have mean ages between 14.1 and 15.3 and high coverage(especially as this age bracket is just before the age when students begin leavingschool in large numbers in the participating countries).
Table 1.1 lists the countries that contributed national case studies to Phase 1 ofthe study as well as the countries participating in the comparisons of 14-year-olds and upper secondary students. For more detail as to the development ofthe general design into a fully orchestrated study, see Chapter 2 of this report.
Table 1.1 Countries participating in the IEA Civic Education Study

11CHAPTER 1 OVERVIEW OF THE IEA CIVIC EDUCATION STUDY
PU
BLI
CD
IS
COURSE ABOUT GOALS ANDVA
LUE
S
CARRIERS OF GOALS INTO ACTION
Fam
ily:
Pare
nts;
Sibl
ings
Peer Group:
In and out of
Class Discourse
Informal C
ommunity:
Youth Organiza
tions;
Work places
Formal Community:
Political Leaders;
Climate of Optimism
School: Teachers; IntendedCurriculum; Participation
Opportunities
Allies and Enemies –
Country’s International Positio
nValues related to
Social Participation
Individualism – Collectivism
Power Distance or Hierarchy
Her
oes,
Sym
bols
,
and
Nar
rati
ves
in N
atio
nal
or L
ocal
Com
mun
itie
s
Educational and
Comm
unication Media
Processes, Institutions
and Values
Economic
Processes, Institutions
and Values
Political/Legal
Processes, Institu
tions
and Values
Soci
o-Ec
onom
ic S
trat
ific
atio
n an
d
Opp
ortu
nity
Str
uctu
re
By G
ende
r, Et
hnic
or
Lang
uage
Gro
up
Imm
igra
nt S
tatu
s
Religious Values
and Institutions
INDIVIDUALSTUDENT
THEORETICAL FRAMEWORKWe have already mentioned that civic education is much less rigidly anchoredin existing curricula than core school subjects such as mathematics or mother-tongue instruction. We should add that schools have much less of a monopolyto convey principles and specifics of civic education than to provide content inother subjects such as mathematics. This consideration implied the choice of atheoretical framework that recognizes the multiple influences to which childrenand adolescents are subject. The theory of ecological development(Bronfenbrenner, 1988) and, to some degree, the theory of situated cognition(Lave & Wenger, 1991; Wenger, 1998) appeared to provide the respectivereference systems that could be translated into a model governing the study(see Figure 1.1).
Figure 1.1 Model for the IEA Civic Education Study
Whereas the perimeter of this model, including the reflection of publicdiscourse about goals and values, was very much covered by the national casestudies of Phase 1 of the study, an attempt was made in Phase 2 to mirror theinfluences of those who carry the goals into action. For this purpose, morespecific theoretical contributions of sociology and political science could bedrawn upon (e.g., Almond & Verba, 1965; Barnes et al., 1979; Inglehart,1997; Kaase & Newton, 1995; Niemi & Junn, 1998). This body of literatureprovides much evidence (on both adolescent and adult members of the civiccommunities) to which the data produced by the present study can be related.
The national case studies of Phase 1 were instrumental not only inconceptualizing the study, but also in serving as backgrounds against which tointerpret the findings from Phase 2, particularly in those cases where the latter

12 IEA CIVIC EDUCATION STUDY TECHNICAL REPORT
turned out to be unexpected. Theoretical references, such as the ones listedabove, may serve to provide explanatory links between the case studies andspecific findings from the survey, although much of this work still needs to bedone.
DIMENSIONS OF STUDENT ASSESSMENTAs was stated above, care was taken not to limit the study to aspects of civicknowledge keyable as “right” or “wrong” but to give ample space to theinvestigation of the conceptual, attitudinal, and motivational characteristics ofstudents. Although the details of measuring the respective constructs and ofascertaining their interrelationships are discussed in more detail in separatechapters of this report, some of the key issues encountered need to bementioned in this present overview.
With respect to the test of civic knowledge, it was deemed important to tap boththe students’ factual or content knowledge and their ability to interpret civic-related information (for technical details, see Chapters 2 and 7 below).However, for a long time during the process of test construction, it was farfrom clear whether these two test components would be best understood underthe assumption of a single dimension or under a two-dimensional modelreflecting the course of item development and selection. Initial analyses suggestthat both assumptions are defensible on the basis of existing evidence, but it isequally clear that a great deal of further research is needed before separatehierarchies of competency levels can be defined for civic content knowledgeand interpretative skills respectively.
While this problem applies to both the 14-year-olds and the upper secondarystudents, the situation is even more complex with respect to the latter. In thiscase, items intended to measure economic literacy (cf., Walsted & Soper, 1989)were included, and again it was not clear from the beginning whether thesewould turn out to constitute a separate dimension of the test. It seemedpreferable to assume that this would, indeed, be the case, but it was also clearthat much additional research would be required before specific competencylevels could be defined. Moreover, decisions on the dimensional structure of atest can rarely be reduced to the status of a clear-cut psychometric problemwith a single—and simple—solution. Opting for a more complex structuretherefore appears justifiable, if there is at least some evidence supporting it, andif the differential information thus obtained helps to solve theoretical and/orpractical problems.
This ambivalence of psychometric results with respect to the definition oftheoretically meaningful constructs is particularly obvious with students’concepts of democracy, citizenship, and the scope of government. Tounderstand the tacit assumptions or beliefs underlying the students’ responsesto other parts of the survey, the students were asked to give their opinions onstates or events “good for democracy”, the importance of certain actions forbeing a good citizen, and the responsibilities governments should have. Theitems were derived from various concepts of democracy, citizenship, andgovernment as distinguished by political scientists. Such adult differentiationsfound little substance in the younger students’ reactions: 14-year-old students

13
tend to have rather vague notions of democracy, centered around such conceptsas equality and liberty, with little concern for modes of participation or thescope of formal as opposed to substantive equality. It is only at a later stage thatthe respective distinctions appear to become important. Thus, decisions as towhich scales should be defined and reported are not merely related topsychometric issues.
Many of the attitudinal items used in the study were similar to those used inearlier studies, or had even been used before. It is, however, a rather innovativefeature of the present study that all of these data were scaled according tomethods developed within the framework of Item Response Theory (IRT),more specifically according to partial-credit test models. We believe that thisparticular approach renders considerable additional insights over and abovewhat conventional test analyses can do, let alone reports on single items. Giventhat many researchers in the field are relatively unfamiliar with this method, areasonably extensive treatment of the respective analyses is in order (seeChapters 8 and 9 below).
The following scales were found to meet both the technical and the substantivecriteria of being considered worth reporting in the volumes of basic analysis(Amadeo et al., 2002; Torney-Purta et al., 2001):
• Importance of Conventional Citizenship
• Importance of Social-movement-related Citizenship
• Concept of Economy-related Government Responsibilities
• Concept of Society-related Government Responsibilities
• Trust in Government-related Institutions
• Positive Attitudes toward One’s Nation
• Attitudes toward Women’s Political and Economic Rights
• Positive Attitudes toward Immigrants
• Confidence in School Participation
• (Expected) Conventional Political Activities
• Open Climate for Classroom Discussion.
A number of other groups of items were included in the survey but were notreported in the original reports because of limitations of time and resources.
Since the initial reporting of results, considerable additional effort has beenspent on refining the scales. Chapter 8 provides the information required toevaluate the findings presented in the international descriptive reports as wellas information on desirable refinements in future research, including secondaryanalyses of the data. See also www.wam.umd.edu/~iea, where the full surveyinstrument is available and where secondary analysis conducted by the IEAteam is referenced on an ongoing basis.
CHAPTER 1 OVERVIEW OF THE IEA CIVIC EDUCATION STUDY

14 IEA CIVIC EDUCATION STUDY TECHNICAL REPORT
THE CONTEXT QUESTIONNAIRESFrom the very beginning of international comparisons of student achievementand related characteristics, it has been customary to collect information onstudents’ home backgrounds as well as school principal and teacher data onschool characteristics and the teaching process.
The collection of student background data is imperative if issues of the equalityor inequality of educational opportunities are to be addressed, this being acriterion of international comparisons in its own right. Many of the variablesused in the respective sections of the student questionnaire have been usedsuccessfully before, for example the number of books in the home as a proxyfor home literacy resources. Similarly, attempts to measure the “implementedcurriculum” through teacher questionnaires have been considered important formost studies in this area, even though the explanatory power of suchinformation has often been incomplete.
Some efforts have been made to assess the explanatory relevance of theinformation thus collected. There have been constraints of time and staff bothat the ICC for the study, located at Humboldt University, Berlin, Germany, andat the University of Maryland, College Park, United States (where an IEA-related team has been established by the Chair of the International SteeringCommittee). However, some in-depth analyses have been conducted (see, forexample, Torney-Purta, 2002; Torney-Purta & Amadeo, 2003; Torney-Purta &Richardson, 2002). The release of the international data sets pertaining to theIEA Civic Education Study, buttressed by the present technical report, is meantto encourage the research community to undertake further analysis of the data.
SUMMARY OF THE REPORTThe present technical report for the IEA Civic Education Study, for which themain data were collected in 1999 and 2000, is meant to enable fellowresearchers in the field to evaluate published reports, monographs, and articlesbased upon these data and to conduct their own analyses of the internationaldata sets made available along with this report. To achieve this aim, the keyelements in the conduct of this study are described with the necessary technicaldetail.
The present overview is followed by information on the development of theinstruments for the study (Chapter 2), and then descriptions of the translationprocedures (based upon English-language master versions of all instruments),the field operations, and the quality assurance procedures required by IEA(Chapter 3). An equally rigorous requirement for any study conducted underthe auspices of IEA is given by the standards for probability sampling, detailsof which are presented in Chapter 4. For data management and theconstruction of databases, IEA studies can rely on the high quality of routinesdeveloped within the IEA Data Processing Center (DPC) in Hamburg,Germany, an institution that provided the services for the present study (seeChapter 5), including the verification of sampling routines and thecorresponding weighting (Chapter 6). Responsibilities for the scaling ofcognitive items—the civic knowledge test—was shared between the IEA DPC
15
in Hamburg and the ICC in Berlin; the respective technical information ispresented in Chapter 7. The scaling of Likert-type items representing thestudents’ concepts, attitudes, and (expected) actions was conducted at the ICC;the technical detail is given in Chapters 8 and 9. Chapter 10 concludes thereport with information on the handling and reporting of information from thestudent and teacher questionnaires.
We hope that this information will not only enable, in a technical sense, theresearch community to conduct secondary analyses, but will also contribute,albeit indirectly, to improvements in the domain of civic education in manycountries around the world.
REFERENCESAlmond, G. A., & Verba, S. (1965). The civic culture: Political attitudes and democracy in five nations.Boston, MA: Little, Brown and Company.
Amadeo, J., Torney-Purta, J., Lehmann, R., Husfeldt, V., & Nikolova, R. (2002). Civic knowledgeand engagement: An IEA study of upper secondary students in sixteen countries. Amsterdam:International Association for the Evaluation of Educational Achievement (IEA).
Barnes, S. H., Kaase, M., Allerbeck, K. R., Farah, B. G., Heunks, F., Inglehart, R., Jennings,M. K., Klingemann, H. D., Marsh, A., & Rosenmayr, L. (1979). Political action: Mass participationin five Western democracies. Beverly Hills, CA: Sage Publications.
Bronfenbrenner, U. (1988). Interacting systems in human development. In N. Bolger, C. Caspi,G. Downey, & M. Moorehouse (Eds.), Persons in context: Developmental processes (pp. 25–49).Cambridge, England: Cambridge University Press.
Fend, H. (1991). Entwicklungspsychologie der Adoleszenz in der Moderne. Band 2: Identitätsentwicklungin der Adoleszenz-Lebensentwürfe, Selbstfindung und Weltaneignung in beruflichen, familiären undpolitisch-weltanschaulichen Bereichen (Developmental psychology of adolescents in modern times. Vol 2:Development of identity in the adolescent: Plans for life, self-cognition and world appropriation inprofessional, familiar and political-ideological domains). Bern/Stuttgart/Toronto: Verlag HansHuber.
Inglehart, R. (1997). Modernization and postmodernization: Cultural, economic and political change in43 societies. Princeton, NJ: Princeton University Press.
Kaase, M., & Newton, K. (1995). Beliefs in government (Vol. 5). Oxford: Oxford University Press.
Lave, J., & Wenger, E. (1991). Situated learning: Legitimate peripheral participation. Cambridge:Cambridge University Press.
Niemi, R., & Junn, J. (1998). Civic education: What makes students learn? New Haven, CT: Yale
University Press.
Torney, J. V., Oppenheim, A. N., & Farnen, R. F. (1975). Civic education in ten countries: Anempirical study. Stockholm/New York: Almqvist & Wiksell International/John Wiley and Sons.
Torney-Purta, J. (2002). Patterns in the civic knowledge, engagement, and attitudes ofEuropean adolescents: The IEA Civic Education Study. European Journal of Education, 37(2),129–141.
Torney-Purta, J., & Amadeo, J. (2003). A cross-national analysis of political and civicinvolvement among adolescents. Political Science and Politics, 36, 269–274.
Torney-Purta, J., Lehmann, R., Oswald, H., & Schulz, W. (2001). Citizenship and education intwenty-eight countries: Civic knowledge and engagement at age fourteen. Amsterdam: InternationalAssociation for the Evaluation of Educational Achievement (IEA).
CHAPTER 1 OVERVIEW OF THE IEA CIVIC EDUCATION STUDY

16 IEA CIVIC EDUCATION STUDY TECHNICAL REPORT
Torney-Purta, J., & Richardson, W. (2002). An assessment of what fourteen-year-olds knowand believe about democracy in twenty-eight countries. In W. Parker (Ed.), Education fordemocracy: Contexts, curricula, assessments (pp. 185–209). Greenwich, CT: Information AgePublishing.
Torney-Purta, J., Schwille, J., & Amadeo, J. (1999). Civic education across countries: Twenty-fournational case studies from the IEA Civic Education Project. Amsterdam and Washington, D.C.: IEAand National Council for Social Studies.
Walker, D. A. (1976). The IEA Six Subject Survey: An empirical study of education in twenty-onecountries. Stockholm/New York: Almqvist & Wiksell International/John Wiley and Sons.
Walsted, W. B., & Soper, J. C. (1989). What is high school economics? Factors contributing tostudent achievements and attitudes. Journal of Economic Education, 20(Winter), 23–38.
Wenger, E. (1998). Communities of practice: Learning, meaning and identity. Cambridge: CambridgeUniversity Press.

17
Chapter 2:
DEVELOPMENT OF THE CIVEDINSTRUMENTSVera Husfeldt and Judith Torney-Purta
In the first section of this chapter we review the two-year process ofidentifying a common core of topics to form a content framework relating tocitizenship and democracy valid across the 28 countries that participated in theIEA Civic Education Study (CivEd) of 14-year-old students. It will also detailthe three-year process of developing a fair and valid test (items designed withkeys for correct answers) and a survey (items assessing attitudes or beliefs forwhich there are no correct answers) that met IEA standards. In the secondsection we describe the development of the test and survey of the uppersecondary students.
FRAMEWORK DEVELOPMENTThe Phase 1 national case studies were the basis for Phase 2 of the study, andtheir results provided the material from which the testing framework wasdeveloped. This framework is similar to the intended curriculum on which testsin other IEA studies have been based.
The data collected during Phase 1 included summaries of what panels ofexperts in participating countries believed 14-year-old students should knowabout 18 topics relating to democratic institutions. These topics includedelections, individual rights, national identity, political participation, the role ofthe police and the military, organizations that characterize civil society, relationof economics to politics, and respect for ethnic and political diversity (Torney-Purta, Schwille, & Amadeo, 1999). The majority of countries submitted thefollowing (amounting to more than 100 pages for several countries):
1. A proposal for Phase 1.
2. A review of existing research literature.
3. A set of summaries responding to 18 case-study framing questions detailingtheir importance and basic information about civic education in the country.
4. A set of summaries relating to the three core international domains and onerelating to the three optional domains (see detail below). This materialincluded more detailed information about textbooks, curriculum objectives,teaching, and the role of community and out-of-school groups.
5. A chapter-length case study summarizing the material and dealing with anissue of particular importance to civic education in the country.
6. A methodology questionnaire detailing the methods used and listingmembers of the National Expert Panel.

18 IEA CIVIC EDUCATION STUDY TECHNICAL REPORT
Following the analysis of available Phase 1 material from more than 20countries and voting by the National Project Representatives on the mostimportant of the 18 original topics, we chose, in 1995, three domains forextensive study as “core international domains”. Early in the study it was clearthat there was a common core of topics and concepts that experts in thesecountries believed 14-year-old students should understand. These internationalcore domains were:
Domain I: Democracy
What does democracy mean and what are its associated institutions andpractices?
The three sub-domains were:
A.Democracy and its defining characteristics
B. Institutions and practices in democracy
C.Citizenship—rights and duties.
Domain II: National Identity, Regional and International Relationships
How can the sense of national identity or national loyalty among young peoplebe described and how does it relate to their orientation to other countries andto regional and international organizations?
The two sub-domains were:
A. National identity
B. International/regional relations.
Domain III: Social Cohesion and Diversity
What do issues of social cohesion and diversity mean to young people andhow do they view discrimination?
We also identified three other issues as important: the media, economics, andlocal problems (including the environment). These topics were also identified asimportant for Phase 2 but were explored less systematically during this stage.
As a next step in developing a content framework, personnel at the Phase 1Coordinating Center read the case study documents. They developed generalstatements about what young people might be expected to know and believeabout the three domains, and they elaborated on and illustrated these withquotations from the national case studies. This material formed the ContentGuidelines for the International Test and Survey, which served as a concise statementof content elements in the three domains that were important across countries(see Appendix B). These guidelines provided a focus for those writing the testitems. It was clear from the case study material that the greatest emphasis in thetest should be on Domain I: Democracy, Democratic Institutions, andCitizenship.

19
In addition to giving input on the content domains to be covered, the nationalresearch coordinators (NRCs) helped define, in 1996, the types of items toinclude in the instrument. These were:
• items assessing knowledge of content; and
• items assessing skills in interpretation of material with civic or political content(including short text passages and cartoons).
These items formed the test and had keyed correct answers.
Because civic education is an area where students’ content knowledge and skillsare important but not the sole focus, the NRCs suggested three other itemtypes:
• items assessing students’ understanding of concepts such as democracy andcitizenship;
• items assessing students’ attitudes (e.g., feelings of trust in the government);and
• items assessing students’ current and expected participatory actions relating topolitics.
These items formed the survey and did not have correct answers.
Intersecting these five item types with the three study domains produced thematrix in Table 2.1, which served as the basis for the test and survey design.
Table 2.1 Matrix of item types and study domains
Item Type Knowledge of Skills in Concepts Attitudes ActionsContent Interpretation
Domain IDemocracy/Citizenship
Domain IINational Identity/InternationalRelations
Domain IIISocial Cohesionand Diversity
A little less than half of the testing time was devoted to a test that includedcognitive items that could be “keyed” with correct and incorrect answers.Slightly less than half of the remaining testing time was devoted to a surveythat included non-keyed items that assessed concepts, attitudes, and actions.The rest of the instrument asked about students’ perceptions of classroomclimate and their confidence in participation at school, and obtainedbackground information (including home literacy resources and theassociations or organizations to which students belonged). A short period atthe end of the second testing session was reserved for countries to administernationally developed items.
CHAPTER 2 DEVELOPMENT OF THE CIVED INSTRUMENTS

20 IEA CIVIC EDUCATION STUDY TECHNICAL REPORT
THE PROCESS OF TEST AND SURVEY DEVELOPMENT FOR14-YEAR-OLD STUDENTSBecause there were no large existing sets of items likely to yield the number ofitems needed to fill in the matrix, extensive item writing was required. Webegan by reviewing materials in the content guidelines, other summaries ofPhase 1 documents, and messages exchanged during an online conference oncivic issues conducted with secondary school students in seven countries. Wenext invited all NRCs to submit items. Our third task was to review the 1971CivEd instrument, released items from the United States and Canadianassessments, and the published research literature. Members of the InternationalSteering Committee (ICC) then wrote items, which were subsequently enteredinto an item database keyed to the content guidelines. Our fifth step involvedasking groups of test specialists and content experts to review items in thedatabase and their relation to the content framework. All NRCs whosecountries were officially participating by September 1997 reviewed itemsbefore the pre-pilot testing; all NRCs whose countries were officiallyparticipating by November 1998 reviewed items before their inclusion in thefinal version of the test.
The result of this activity was the development of 140 knowledge and skillsitems (content knowledge and skills in interpretation), each with one correct answerand four distracters, and each of which was entered into the database for the14-year-old population. All the items were judged suitable for administration inthe participating countries.
The items focused on principles, pivotal ideas, and general examples, and noton the details of the political arrangements in any one country. For example,Content Knowledge/Domain I items covered the principles of democracy andits associated institutions across the countries participating in the study. Thetest did not include items about specific mechanisms of the electoral process orgovernment structure in any particular country. The Content Knowledge/Domains II and III items likewise dealt with internationally relevant orgeneralized matters shared across countries. This emphasis differs from that inmany national tests where items about each country’s political structurepredominate. The CivEd Phase 2 items are based on information gatheredduring Phase 1 about what students are expected to know and on expertstatements such as that issued under the auspices of the Council of Europeabout the role of history knowledge in civic education (Slater, 1995, pp. 146–148).
Some of the skills in interpretation items asked students to distinguish betweenstatements of fact and opinion. Others were based on a leaflet of the typeissued during an election campaign, on the interpretation of a short article froma mock newspaper, or on a political cartoon. The general ideas for cartoonscame from those published in newspapers. They were redrawn to communicatea single message that 14-year-olds across countries could be expected tounderstand.

21
Pre-Piloting of Items of Content Knowledge and Skills inInterpretation
In September 1997, 80 items assessing content knowledge and skills ininterpretation (multiple-choice items with correct answers) were sent to theNRCs for a pre-pilot. The expert panels reviewed items and the nationalcenters then obtained convenience samples of 14-year-old students for twohours of testing. The sample sizes for the 20 participating countries rangedfrom 185 in Cyprus to 626 in Belgium (French).
A week-long meeting of NRCs was held in March 1998. Here, the pre-pilotitem statistics from 20 countries were made available (Belgium (French),Bulgaria, Colombia, Cyprus, Czech Republic, Estonia, Finland, Germany,Greece, Hong Kong Special Administrative Region (SAR), Hungary, Italy,Lithuania, Norway, Poland, Portugal, Russia, Slovenia, Chinese Taipei, and theUSA). NRCs from all these nations were in attendance, as were coordinatorsfrom countries planning to participate in Phase 2 who had not been able topre-pilot (Australia, Chile, Romania, Slovak Republic, Switzerland). (In somecases these countries had been able to obtain an expert review of the items.)
A questionnaire about the 80 items was circulated to the meeting participantson the first day of the meeting to ascertain which items were likely to beproblematic. The 80 items were listed, and each NRC was asked to indicate(according to his or her pre-pilot experience and the National Expert Panelreview) how much discussion the item required. There were 11 items for whichmore than five of the 18 responding countries answered that the item required“extensive discussion”. These items turned out to be the same items that hadattracted, during the pre-pilot process, complaints about unsuitability for thenational context or difficulties of translation. They were very briefly raised inthe meeting and were then deleted from further consideration.
Many of the remaining 69 items had at least one distracter that was performingpoorly in many countries, and so it was decided to change all items from fivechoices to four. Thus, as the remaining items were discussed, one distracter foreach was cut (in accordance with the recommendation of the NRCs). Each ofthe 69 items was also discussed (with the text of the item shown on atransparency), and suggestions made for revision. Consensus was achieved onretaining 62 of these items as revised (and cutting seven). During thesubsequent session, about a dozen “new” items were proposed (prepared bygroups of NRCs, who felt there were gaps in the instrument’s coverage). Six ofthese “new” items were further revised in a plenary session and accepted.
The surviving 68 items were sorted into two forms, A and B, in an attempt toavoid duplication, to balance item difficulties, and to include approximatelyequal numbers of content knowledge and skills in interpretation items in each form.Of the 62 items that had been piloted, two were so extensively revised as to beessentially new items. Thus, the pre-pilot data on 60 of the items included informs A and B were analyzed to check the reliabilities of 30 of the items fromeach form. These were acceptable (in the low .80s for the large majority ofcountries).
CHAPTER 2 DEVELOPMENT OF THE CIVED INSTRUMENTS

22 IEA CIVIC EDUCATION STUDY TECHNICAL REPORT
Piloting of Items Assessing Content Knowledge and Skills inInterpretation and the Resulting Final Test
Between April and October 1998, 25 countries conducted pilot studies on thetwo forms of the test (items assessing content knowledge and skills in interpretation,described above) and the survey (items assessing concepts, attitudes and actions,described below). In each country, judgment samples of about 200 studentswere tested (two class periods per student). The pilot countries includedAustralia, Belgium (French), Bulgaria, Chile, Chinese Taipei, Colombia, Cyprus,Czech Republic, Estonia, Finland, Germany, Greece, Hong Kong (SAR),Hungary, Italy, Latvia, Lithuania, Norway, Poland, Portugal, Romania, theRussian Federation, Slovenia, Switzerland, and the United States. In addition tothese countries, Denmark, England, the Slovak Republic, and Swedenparticipated in the final testing of 14-year-old students. (Chinese Taipei wasunable to obtain funding to continue its participation after the pilot testing.)
The NRCs were provided with item statistics for their countries (difficulty,discrimination, and differential item functioning). They discussed each itemwithin its content category at a November 1998 meeting. The small number ofitems that was viewed as unacceptable by more than one-fifth of the NRCs wasdropped in accordance with the rule used by IEA to promote test fairnessacross countries. Through a process of negotiation, the research coordinatorschose, by consensus, 38 items assessing content knowledge and skills ininterpretation from the 68 that had been piloted. The discrimination indiceswere greater than .30 for most of these items. In addition to psychometricproperties, coverage of the content framework and the research coordinators’preferences were decisive factors in the process of item selection (see AppendixB for a listing of items by content category).
The ratios of number of “items written” to “number piloted” to “numberaccepted” were similar to IEA tests in other subject areas. Confirmatory factoranalysis and IRT modeling indicated a high-quality test across countries. Thesemodern scaling methods (Frederikson, Mislevy, & Bejar, 1993) were ourprimary guide as we developed the test. Classical scaling methods alsoindicated a test of high quality. The alpha reliabilities for the final 38-item civiceducation test exceeded .85 in each of the countries.
Piloting of Items Assessing Concepts, Attitudes, and Actions andthe Resulting Final Survey
At the March 1998 meeting, the NRCs reviewed lists of suggested topics foritems assessing concepts, attitudes and actions and some prototype items. Mostitem sets for piloting were suggested by the research literature. Some revisionswere necessary to adapt items originally designed for administration to adultsin an interview, and a “don’t know” option was added to each of these items.
In mid-1998, the research coordinators piloted the survey items along withtwo forms of the knowledge and skills test. Items for the survey were chosenthrough a process of negotiation similar to that described in the previoussection. The final survey included 52 items assessing concepts (concepts ofdemocracy, citizenship, and government), 62 items assessing attitudes (social and
23
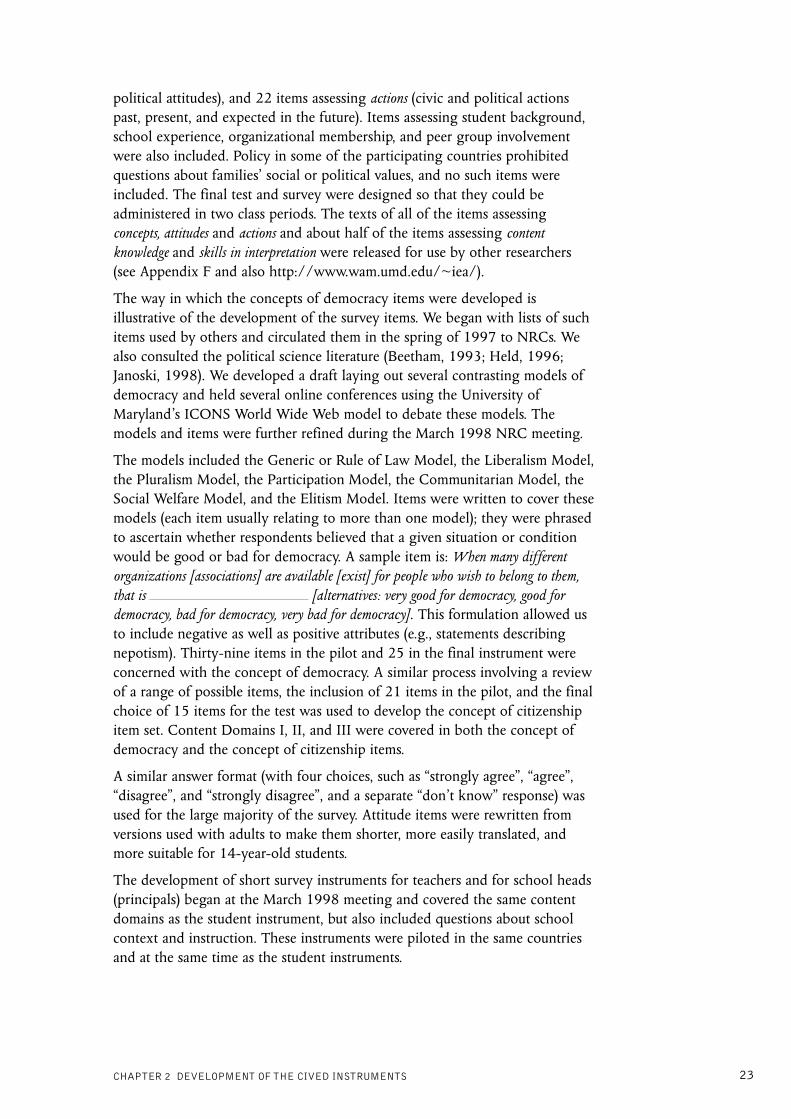
political attitudes), and 22 items assessing actions (civic and political actionspast, present, and expected in the future). Items assessing student background,school experience, organizational membership, and peer group involvementwere also included. Policy in some of the participating countries prohibitedquestions about families’ social or political values, and no such items wereincluded. The final test and survey were designed so that they could beadministered in two class periods. The texts of all of the items assessingconcepts, attitudes and actions and about half of the items assessing contentknowledge and skills in interpretation were released for use by other researchers(see Appendix F and also http://www.wam.umd.edu/~iea/).
The way in which the concepts of democracy items were developed isillustrative of the development of the survey items. We began with lists of suchitems used by others and circulated them in the spring of 1997 to NRCs. Wealso consulted the political science literature (Beetham, 1993; Held, 1996;Janoski, 1998). We developed a draft laying out several contrasting models ofdemocracy and held several online conferences using the University ofMaryland’s ICONS World Wide Web model to debate these models. Themodels and items were further refined during the March 1998 NRC meeting.
The models included the Generic or Rule of Law Model, the Liberalism Model,the Pluralism Model, the Participation Model, the Communitarian Model, theSocial Welfare Model, and the Elitism Model. Items were written to cover thesemodels (each item usually relating to more than one model); they were phrasedto ascertain whether respondents believed that a given situation or conditionwould be good or bad for democracy. A sample item is: When many differentorganizations [associations] are available [exist] for people who wish to belong to them,that is [alternatives: very good for democracy, good fordemocracy, bad for democracy, very bad for democracy]. This formulation allowed usto include negative as well as positive attributes (e.g., statements describingnepotism). Thirty-nine items in the pilot and 25 in the final instrument wereconcerned with the concept of democracy. A similar process involving a reviewof a range of possible items, the inclusion of 21 items in the pilot, and the finalchoice of 15 items for the test was used to develop the concept of citizenshipitem set. Content Domains I, II, and III were covered in both the concept ofdemocracy and the concept of citizenship items.
A similar answer format (with four choices, such as “strongly agree”, “agree”,“disagree”, and “strongly disagree”, and a separate “don’t know” response) wasused for the large majority of the survey. Attitude items were rewritten fromversions used with adults to make them shorter, more easily translated, andmore suitable for 14-year-old students.
The development of short survey instruments for teachers and for school heads(principals) began at the March 1998 meeting and covered the same contentdomains as the student instrument, but also included questions about schoolcontext and instruction. These instruments were piloted in the same countriesand at the same time as the student instruments.
CHAPTER 2 DEVELOPMENT OF THE CIVED INSTRUMENTS

24 IEA CIVIC EDUCATION STUDY TECHNICAL REPORT
The Process of Test and Survey Development for Upper SecondaryStudents
The test and survey for the upper secondary population was built directly onthe instrument developed for the 14-year-old students. The four domains ofcivic education content treated in the test and survey of the upper secondarystudents were:
• Democracy and its associated institutions, including the rights andresponsibilities of citizens.
• National identity, including relations between groups within countries andrelations with other countries.
• Social cohesion and diversity.
• Economics.
For the test (keyed items), the first three domains were the same as thosecovered in the 14-year-old version; economics was new to the upper secondaryversion.
All items for the survey and many items for the test were adopted from theinstruments for the 14-year-old population. The test was formed of the itemsassessing knowledge of civic content and skills in interpretation of material with civicor political content (including short-text passages and cartoons), as well as 14items about economic literacy. A number of these items were modeled after theTest of Economic Literacy (Beck & Krumm, 1999).
The survey included items assessing students’ concepts of democracy andcitizenship, students’ attitudes (e.g., feelings of trust in the government), andstudents’ current and expected participatory actions relating to politics. Inaddition to the items that had been used for the 14-year-old students, someitems on the effectiveness of political action and on the justifications for the use ofmilitary force were included. As in the 14-year-old instrument, the survey itemshad four response alternatives, each measuring the extent of endorsement.Similar to the data collection process for the 14-year-old students, the first halfof the assessment time was scheduled for the test and the second half for thesurvey. The second half also included questions about students’ perceptions ofclassroom climate, their confidence in participation at school, and backgroundinformation. In contrast to the study of 14-year-old students, the study ofupper secondary school students did not include a teacher questionnaire.
Piloting and the Resulting Final Test
The first pilot and final testing of the 14-year-old students showed that,although the difficulty levels of the cognitive items were generally adequate forthis age group, a test composed only of these items would have been too easyfor students who were two to four years older. Therefore, some new items hadto be developed. A pilot test for the upper secondary students conducted in thespring of 1999 (see next paragraph) served to test these newly developedcognitive items as well as some attitude items. The final questionnaire for theupper secondary students included all attitude items from the finalquestionnaire for the 14-year-old students and two new eight-item scales.

25
In addition, the background questionnaire, which provided demographicinformation as well as information pertaining to the students’ families and out-of-school activities, was adapted from the test for the 14-year-old students.
Between April and May 1999, six countries conducted classroom-based pilotstudies of the test and survey. Samples of about 100 to 500 students in Grades10 to 12 were tested. The pilot countries included Chile, Colombia, Estonia,Germany (which eventually decided not to participate in the main study ofupper secondary students), Israel, and the Russian Federation.
In addition to undertaking the pilot study, the NRCs were asked to evaluate thenewly developed cognitive items with respect to translation problems andstructures, contexts, and school instruction effects, and to estimate theirdifficulty.
In July 1999, the analysis of the pilot data of upper secondary school studentswas performed, and a sub-group from the ICC and the NRCs made a finaldecision about which items to include. Those research coordinators who wereunable to pilot the test agreed to abide by choices made in relation to the sixcountries. This was feasible because all non-piloting countries planning toparticipate at the upper secondary level had participated at the 14-year-oldlevel using tests with a high overlap of items.
SUMMARYIEA studies include collecting some information from participating countriesbefore the formulation of a test instrument. The IEA Civic Education Study hada particularly intensive and extensive first phase during which detailedinformation was collected from participating countries about 18 topics thatmight be included in civic education programs. The ICC, the NRCs, andmembers of the IEA research centers at the University of Maryland and theHumboldt University of Berlin participated in an iterative process ofconsultation based on written documentation and utilizing email and face-to-face meetings to form a consensus about the content of the test and surveyinstruments (for 14-year-old students). This resulted in a strong basis uponwhich to build pilot instruments in a subject area where there had previouslybeen little agreement about whether a common core of expectations forlearning exists across democratic countries.1 A similar (though shorter) processwas undertaken for the development of the teacher and school questionnairesand the development of the test and survey for the upper secondarypopulation.
1 Two books published by IEA detail this process: Torney-Purta et al. (1999) and Steiner-Khamsi,Torney-Purta, and Schwille (2002). LeTendre (2002) compares the use of case study material in theIEA Civic Education Study favorably to its use in TIMSS, especially because the case studies had aplace in the process that allowed them to feed directly into the study and instrument design.
CHAPTER 2 DEVELOPMENT OF THE CIVED INSTRUMENTS

26 IEA CIVIC EDUCATION STUDY TECHNICAL REPORT
REFERENCESBeck, K., & Krumm, V. (1999). Wirtschaftskundlicher Bildungtest (WBT) (Manual). Goettingen:Hoegrefe.
Beetham, D. (1993). Key principles and indices for a democratic audit. In D. Beetham (Ed.),Defining and measuring democracy (pp. 25–43). Bakersfield, CA: Sage Publications.
Frederikson, N., Mislevy, R., & Bejar, I. (1993). Test theory for a new generation of tests. Hillsdale,NJ: Lawrence Erlbaum Associates.
Held, D. (1996). Models of democracy. Stanford, CA: Stanford University Press.
Janoski, T. (1998). Citizenship and civil society: A framework of rights and obligations in liberal,traditional and social democratic regimes. Cambridge: Cambridge University Press.
LeTendre, G. (2002). Advancements in conceptualizing and analyzing cultural effects in cross-national studies of educational achievement. In A. C. Porter and A. Gamoran (Eds.),Methodological advances in cross-national surveys of educational achievement (pp. 198–228).Washington, D.C.: National Academy Press.
Slater, J. (1995). Teaching history in the new Europe. London: Cassell.
Steiner-Khamsi, G., Torney-Purta, J., & Schwille, J. (2002). New paradigms and recurring paradoxesin education for citizenship. Amsterdam: Elsevier Press.
Torney-Purta, J., Schwille, J., & Amadeo, J. (1999). Civic education across countries: Twenty-fournational case studies from the IEA Civic Education Project. Amsterdam: International Association forthe Evaluation of Educational Achievement (IEA).

27
Chapter 3:
TRANSLATION PROCEDURES, FIELDOPERATIONS, AND QUALITYASSURANCE 1
Wolfram Schulz and Roumiana Nikolova
INTRODUCTIONThe IEA Civic Education Study (CivEd), which involved 29 countries and twostudent populations with over 140,000 students, was guided by theInternational Steering Committee (ISC) and coordinated by the InternationalCoordinating Center (ICC). However, the national research centers in eachparticipating country were responsible for implementing the design of thestudy in accordance with the international standards. Survey and testinstruments, as well as field procedures, were developed through an extensiveprocess of cooperation and consensus among the participants. The datacollection within countries was carried out by the national research centers.
Each national research team was responsible for translating the internationalinstruments and procedures and adapting them to local conditions,implementing the field operation instructions, and organizing data collectionand quality control operations. This combination of international cooperationand national implementation is an efficient and cost-effective approach toconducting international comparative studies, and it has become the standardfor IEA studies. It requires close collaboration among participants, and thevalidity and reliability of the results depend to a large extent on eachparticipant adhering to the prescribed procedures at all times.
The ISC and the ICC made considerable efforts to develop standardizedmaterials and procedures to ensure that the data collected in all 29 countrieswould be comparable. This chapter describes these efforts, which include theprocesses of instrument translation and translation verification, theimplementation of field operations, and the use of quality assurance measuresduring the testing period. Quality assurance standards for IEA studies requiremonitoring of instrument translation, standards for test administration, andmeasures of quality control during the process of data collection.
1 Many procedures described here and parts of this chapter were adapted from the IEA TIMSS study; seeO’Connor and Malak (2000) and Gonzalez and Hastedt (2000).
28 IEA CIVIC EDUCATION STUDY TECHNICAL REPORT
Questionnaire Translation
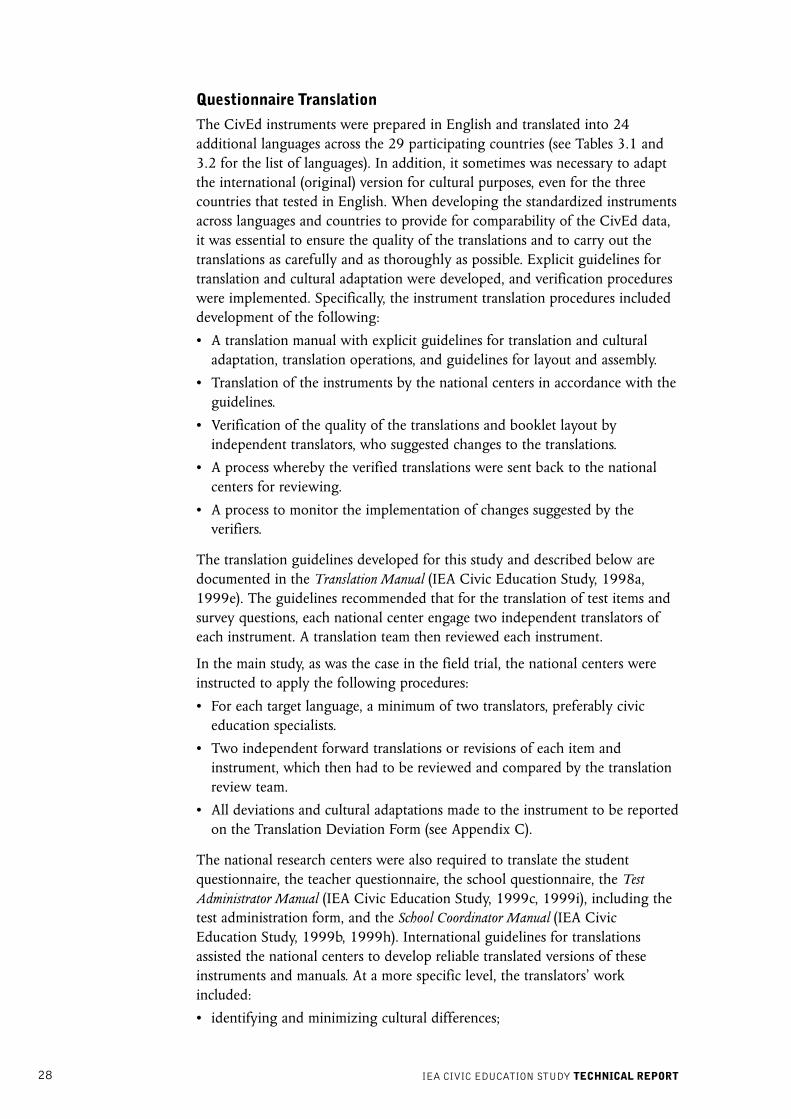
The CivEd instruments were prepared in English and translated into 24additional languages across the 29 participating countries (see Tables 3.1 and3.2 for the list of languages). In addition, it sometimes was necessary to adaptthe international (original) version for cultural purposes, even for the threecountries that tested in English. When developing the standardized instrumentsacross languages and countries to provide for comparability of the CivEd data,it was essential to ensure the quality of the translations and to carry out thetranslations as carefully and as thoroughly as possible. Explicit guidelines fortranslation and cultural adaptation were developed, and verification procedureswere implemented. Specifically, the instrument translation procedures includeddevelopment of the following:
• A translation manual with explicit guidelines for translation and culturaladaptation, translation operations, and guidelines for layout and assembly.
• Translation of the instruments by the national centers in accordance with theguidelines.
• Verification of the quality of the translations and booklet layout byindependent translators, who suggested changes to the translations.
• A process whereby the verified translations were sent back to the nationalcenters for reviewing.
• A process to monitor the implementation of changes suggested by theverifiers.
The translation guidelines developed for this study and described below aredocumented in the Translation Manual (IEA Civic Education Study, 1998a,1999e). The guidelines recommended that for the translation of test items andsurvey questions, each national center engage two independent translators ofeach instrument. A translation team then reviewed each instrument.
In the main study, as was the case in the field trial, the national centers wereinstructed to apply the following procedures:
• For each target language, a minimum of two translators, preferably civiceducation specialists.
• Two independent forward translations or revisions of each item andinstrument, which then had to be reviewed and compared by the translationreview team.
• All deviations and cultural adaptations made to the instrument to be reportedon the Translation Deviation Form (see Appendix C).
The national research centers were also required to translate the studentquestionnaire, the teacher questionnaire, the school questionnaire, the TestAdministrator Manual (IEA Civic Education Study, 1999c, 1999i), including thetest administration form, and the School Coordinator Manual (IEA CivicEducation Study, 1999b, 1999h). International guidelines for translationsassisted the national centers to develop reliable translated versions of theseinstruments and manuals. At a more specific level, the translators’ workincluded:
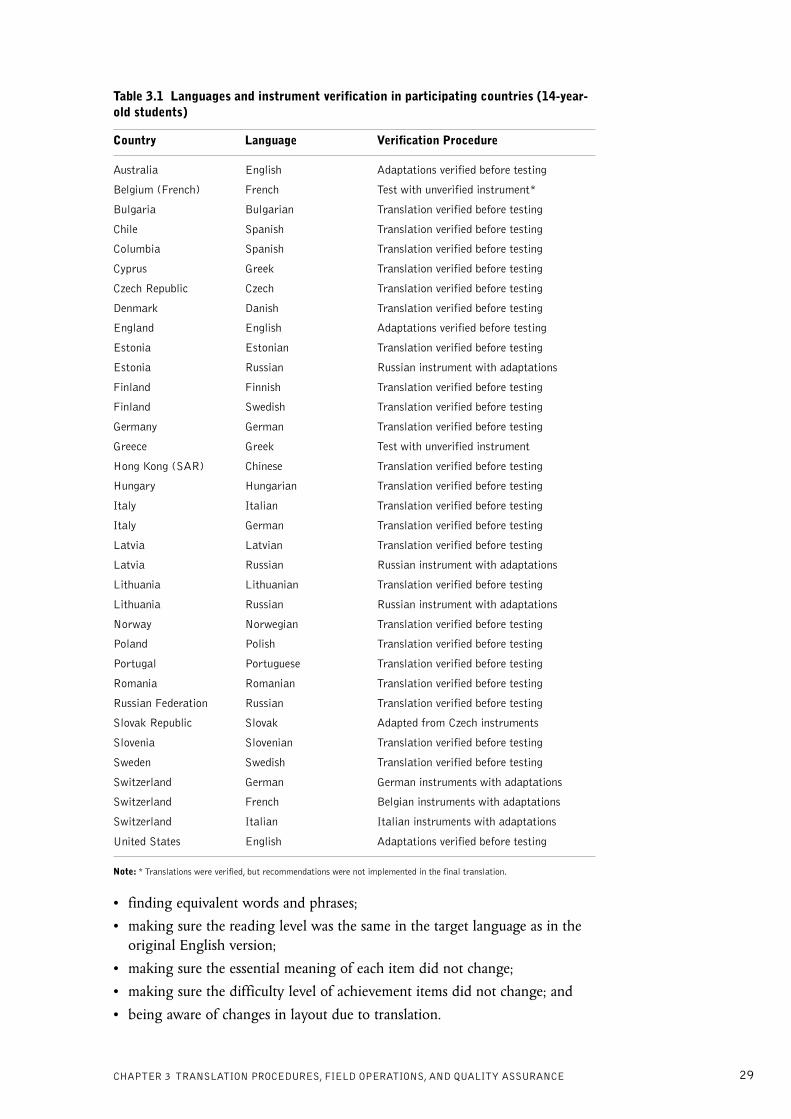
• identifying and minimizing cultural differences;
29
• finding equivalent words and phrases;
• making sure the reading level was the same in the target language as in theoriginal English version;
• making sure the essential meaning of each item did not change;
• making sure the difficulty level of achievement items did not change; and
• being aware of changes in layout due to translation.
Table 3.1 Languages and instrument verification in participating countries (14-year-old students)
Country Language Verification Procedure
Australia English Adaptations verified before testing
Belgium (French) French Test with unverified instrument*
Bulgaria Bulgarian Translation verified before testing
Chile Spanish Translation verified before testing
Columbia Spanish Translation verified before testing
Cyprus Greek Translation verified before testing
Czech Republic Czech Translation verified before testing
Denmark Danish Translation verified before testing
England English Adaptations verified before testing
Estonia Estonian Translation verified before testing
Estonia Russian Russian instrument with adaptations
Finland Finnish Translation verified before testing
Finland Swedish Translation verified before testing
Germany German Translation verified before testing
Greece Greek Test with unverified instrument
Hong Kong (SAR) Chinese Translation verified before testing
Hungary Hungarian Translation verified before testing
Italy Italian Translation verified before testing
Italy German Translation verified before testing
Latvia Latvian Translation verified before testing
Latvia Russian Russian instrument with adaptations
Lithuania Lithuanian Translation verified before testing
Lithuania Russian Russian instrument with adaptations
Norway Norwegian Translation verified before testing
Poland Polish Translation verified before testing
Portugal Portuguese Translation verified before testing
Romania Romanian Translation verified before testing
Russian Federation Russian Translation verified before testing
Slovak Republic Slovak Adapted from Czech instruments
Slovenia Slovenian Translation verified before testing
Sweden Swedish Translation verified before testing
Switzerland German German instruments with adaptations
Switzerland French Belgian instruments with adaptations
Switzerland Italian Italian instruments with adaptations
United States English Adaptations verified before testing
Note: * Translations were verified, but recommendations were not implemented in the final translation.
CHAPTER 3 TRANSLATION PROCEDURES, FIELD OPERATIONS, AND QUALITY ASSURANCE

30 IEA CIVIC EDUCATION STUDY TECHNICAL REPORT
The Translation Manual also provided guidelines regarding decisions aboutvocabulary, meaning, layout, and cultural adaptations. For all countries,including the English-speaking countries, where some adaptations according tolanguage use or the socio-cultural or political context had to be made, it wasimportant to ensure equivalence of the items across languages. The originalinstruments (in English) contained alternatives or clarifications of terms inbrackets for those questions where an adaptation was likely. Furthermore, theinternational instruments were sent with detailed translation notes to ensureaccurate translation. These notes clarified acceptable adaptations, indicatedchanges in item wording from the field trial, and contained specific instructions(e.g., a description of how to translate and adapt graphics in the civicknowledge test).
The national teams were instructed not to simplify or clarify the test items,because doing so would have influenced the difficulty of the items. For themultiple-choice items used in the civic knowledge test, translators had to payparticular attention to the correspondence between words in each question andthe words in the choices. Some items required an exact (verbatim) matchbetween words in the question and words in the choices; that is, if the words inthe question were repeated verbatim in the distracters of the internationalEnglish version, they had to be repeated verbatim in the translation.
Table 3. 2 Languages and instrument verification in participating countries (uppersecondary students)
Country Language Verification Procedure
Chile Spanish Translation verified before testing
Columbia Spanish Translation verified before testing
Cyprus Greek Translation verified before testing
Czech Republic Czech Translation verified before testing
Denmark Danish Translation verified before testing
Estonia Estonian Translation verified before testing
Estonia Russian Russian instrument with adaptations
Hong Kong (SAR) Chinese Translation verified before testing
Israel Hebrew Translation verified before testing
Israel Arabic Translation verified before testing
Latvia Latvian Translation verified before testing
Latvia Russian Russian instrument with adaptations
Norway Norwegian Translation verified before testing
Poland Polish Translation verified before testing
Portugal Portuguese Translation verified before testing
Russian Federation Russian Translation verified before testing
Slovenia Slovenian Translation verified before testing
Sweden Swedish Translation verified before testing
Switzerland German Translation verified before testing

31
All changes to the format of a question required prior approval from the ICC.When in doubt, the national centers had to send a copy of the original itemand a copy of the proposed item format to the international center for approval.
In an international study such as the IEA Civic Education Study, many changesin the questions are usually required from country to country because ofdifferences in culture, quite apart from language. Terms used in the CivEdinstrument needed to be equally familiar to all students, and culturaladaptations therefore were often needed to ensure this. Concepts or expressionsthat were not common to all cultures and not related to the substance of thequestions had to be adapted to the cultural context. Changes in names, forexample in fictitious newspaper articles used as stimuli in the cognitive test,had to be similar in length and complexity to the originals. National centerswere asked to ensure that, in the process of translation, the changes made forcultural (or linguistic) reasons were made in a way that would not affect thedifficulty levels of items, and that they were made consistently.
There were two possible levels of modifications to the instruments: the classesof allowed changes (applicable to all countries equally) and, within each ofthese classes, specific changes made by one or a few countries. Whenmodifying the text of an item, translators were requested to take the meaningof the question, the reading level of the text, the difficulty level of the item,and the likelihood of another possible correct answer for the test item intoaccount. Any changes made to items had to be noted in the TranslationDeviation Form (see Appendix C).
TRANSLATION VERIFICATIONWhen the translation and layout had been completed, the national centers wereasked to submit their national school, teacher, and student questionnaires to theinternational center for verification of the translations. The people who did thisverification work were independent language experts selected by theinternational center. Each verifier was a native speaker of his or her respectivelanguage with a good command of English and who did not have any form ofworking relationship with the respective national center. The verifiers checkedthe translated questionnaires against the English original and the completedTranslation Verification Report Form (see Appendix C), on which they listedany minor or major deviations from the original. These, together with anysuggestions for improvement, were then sent back to the national centers. Thecenters were then asked to consider any suggestions for changes in the wordingbefore deciding on the final version of the questionnaires.
The translation verification procedures were applied twice for most countries.The first verification was carried out for the instruments used in the 1998 fieldtrial, after the data collection. The verification results were discussed with thenational centers and then used to improve the translation of the finalinstruments for the main study in 1999. Second, the final national instrumentswere verified prior to the data collection. A verification of translatedinstruments was carried out for both the 14-year-old students and the uppersecondary students.
CHAPTER 3 TRANSLATION PROCEDURES, FIELD OPERATIONS, AND QUALITY ASSURANCE

32 IEA CIVIC EDUCATION STUDY TECHNICAL REPORT
For the 14-year-olds, the instruments were translated into 22 differentlanguages. Table 3.1 (above), which shows the languages used in each country,also indicates whether instruments were verified before testing took place.Some countries used the already translated instruments from another country.For example, Switzerland adapted the questionnaires from Germany, Belgium(French), and Italy, and the Baltic countries used the Russian questionnaire. Inthese cases, questionnaires were checked for adaptations only. In Belgium(French) and Greece, due to organizational problems, the national centers didnot take the verification results into account prior to the field study. However,the verification results enabled the ICC to check for translation errors whenadjudicating items for scaling and preparing the analysis.
For the instruments used in the survey of the upper secondary students, asomewhat different procedure was followed. As most parts of the (student andschool) questionnaires were identical to the ones used for the 14-year-oldstudents, only the (modified) civic knowledge test and some additionalquestions had to be verified. An exception was Israel, which had notparticipated in the data collection among 14-year-old students. Here, both theArabic and the Hebrew questionnaires were completely verified. Table 3.2above shows the languages used for the survey and test among 16- to 18-year-old students in each country. Questionnaires for this part of the IEA CivicEducation Study were translated into 16 languages.
FIELD OPERATIONS
Pilot Study
The data collection of the IEA Civic Education Study followed detailedguidelines describing the field operations that the national research centers inthe participating countries were required to implement. Pilot studies in 1998(14-year-old students) and 1999 (upper secondary students) were not onlydesigned to pilot cognitive tests and questionnaire material (see Chapter 2) butalso to replicate most of the sampling and field procedures that participantswould encounter in the main study. Within-school sampling, contactingschools, test administration, and data-entry and data-cleaning procedures werecarried out by a majority of countries one year before the actual data collectiontook place. This was done to ensure that the national centers were familiar withthe data collection procedures and to test the international procedures acrosscountries.
National Research Coordination
In international studies, similar procedures for data collection across countriesare crucial for obtaining comparable data. The national research coordinators(NRCs) were the key persons in conducting the field operations in eachcountry and were also responsible for implementing the internationally agreedprocedures and preparing the data according to the international specifications.The ICC provided the national centers with the following detailed proceduralmanuals:
• The Sampling Manual (IEA Civic Education Study, 1998b, 1999f ) defined thetarget population and described the procedure for obtaining a school sample.

33
• The Field Operations Manual (IEA Civic Education Study, 1999a, 1999g) gavea comprehensive description of all procedural aspects of the IEA CivicEducation Study in a country from the delivery of test instruments andquestionnaires through to the cleaning and delivery of data sets.
• The School Coordinator Manual (IEA Civic Education Study, 1999b, 1999h)described the activities to be undertaken by the school coordinator fororganizing the test and questionnaire administration, distributing thequestionnaires to teachers and school principals, and handling the test andquestionnaire materials at school.
• The Test Administrator Manual (IEA Civic Education Study, 1999c, 1999i)described in detail the procedures from the beginning of the testadministration to the time of returning test and questionnaire materials toeach national center.
• The Manual for Entering the CIVIC Data (IEA Civic Education Study, 1999d,1999j) provided the coding and data entry personnel in the national centerswith the necessary information to enter and verify the data. It also definedthe variables and file formats in the data files, provided instructions forverification of the data, and assisted national coordinators in the subsequentanalysis of their data.
Selection of Civic-related Subjects
In the IEA Civic Education Study, the teacher questionnaire was administeredto up to three different teachers of the sampled class who taught civiceducation or civic education-related subjects. However, because civic education-related subjects are labeled differently across countries and because the samesubject can have different degrees of “civic-relatedness” across countries, aprocedure was implemented that used the cognitive items of the civicknowledge test to identify the three most appropriate subjects and theirteachers in a country. Once the subjects had been identified, schools were toldwhich subjects and teachers they should enter in the forms.
The subjects were determined by means of a Subject Allocation Grid (seeAppendix C). The rows of the grid represent the items (38 items for the 14-year-old students and 43 items for the upper secondary students) in thecognitive test; the columns represent civic education and other subjects relatedto civic education. Therefore, before the grid could be completed, the names ofthe subjects had to be inserted in the header of the grid. Then, for each of theitems in the cognitive test, the national centers had to determine the subject inwhich the content of the respective item was taught in the target grade or hadbeen taught prior to the target grade. Where this could be determined for anitem, the respective cell in the grid then had to be checked. After clarifying towhich subject the items belonged, the number of checkmarks per subject werecounted and reported in the last row of the Subject Allocation Grid (sum ofticks). The subject with the most checkmarks was defined as “civic education-related subject No. 1”, the subject with the second highest number ofcheckmarks as “civic education-related subject No. 2”, and the subject with thethird highest number of ticks as “civic education-related subject No. 3”. Thenational centers were advised to undertake the subject allocation with the
CHAPTER 3 TRANSLATION PROCEDURES, FIELD OPERATIONS, AND QUALITY ASSURANCE

34 IEA CIVIC EDUCATION STUDY TECHNICAL REPORT
assistance of the National Civic Education Expert Panel. Where two subjectsreceived the same number of checkmarks, the national experts determined themost appropriate allocation—that is, “subject 1”, “subject 2”, or “subject 3”.
Contacting Schools and Test Preparation
After the sample of schools had been drawn, the national centers were requiredto engage in a series of tasks to obtain the cooperation of the sampled schoolsand ensure high response rates. In countries where the Ministry of Educationcould require every selected school to participate in the study, obtainingpermission for the testing was relatively straightforward. However, in thosecountries where permission had to be obtained from various school authorities,getting permission from all these bodies tended to be a long process. In somecountries, the national centers had to obtain the permission of regional, state,and/or district authorities.
Often, the authorities at higher levels gave permission to undertake theassessment but allowed the school principal in each selected school to decidewhether the school should participate. In such instances, permission had to besought directly from the school principal, with the national centers having todevelop particular strategies to ensure permission (e.g., personal letters signedby higher officials, telephone calls). To obtain the highest possible acceptancerate at this stage, special guidelines regarding the letter to school principalswere given to the national centers. This had to include a description of thepurpose and the significance of the study, and it had to be written in easilyunderstood language so that copies could be distributed to parents, localcommunity leaders, local newspapers, etc.
In the letter, the cooperation of the schools was invited by giving precisedetails about what participation would involve (e.g., the grade and number ofclasses involved, the length of the testing sessions, the approximate timerequired to complete the questionnaires). Proposed dates were given foradministration of the instruments. Any benefits that individual schools mightreceive from their participation in the study (e.g., feedback on school data,exposure of teachers from participating classes to a range of student testingtechniques) and a guarantee that students and schools would be grantedanonymity in all published results were explicitly stated. The letter also askedthe school principals to appoint an individual in their school who could serveas the school coordinator (see below) and take responsibility for administrativearrangements (e.g., arrange a room for testing) for the study in the school.Finally, the school principals were invited to contact the members of thenational centers if they needed further information before making theirdecision.
After a reasonable period of time, those school principals who had not repliedto the letter were contacted by phone calls or through their regional offices,and encouraged to respond with a positive decision as soon as possible. Once aschool principal had decided to participate, he or she was sent a follow-upletter, which offered thanks for the school’s cooperation and confirmed thatfuture correspondence regarding the study would be addressed to the schoolcoordinator.

35
The school coordinator was the key person in arranging the actual assessmentwithin the school. The school principal usually identified a teacher as schoolcoordinator, but the national centers could also appoint a member of theircentral team or a member of their team of test administrators to be the schoolcoordinator. Sometimes the school coordinator was also the test administrator.The school coordinators were also required to provide the list of civiceducation classes in the target grade in the school, help the national centerdetermine the dates of test administration, and provide the necessaryinformation about the class in the target grade. They had to make thearrangements for testing, distribute parental permission forms (if necessary),and ensure that these were signed and returned on time. They were also askedto convey the teacher and school questionnaires to the appropriate members ofstaff and to return the completed testing materials, questionnaires, and forms tothe national center.
Before classes could be selected, eligible classes within the selected schools hadto be identified and listed. The classes to be sampled were those relating tosome form of civic education instruction and were not to be “streamed” or“tracked”; that is, all classes had to have a similar level of student abilities andinstruction. In educational systems where all students in a class or homeroomreceive the same instruction in all subjects, a “civic class” was deemed simply tocorrespond to this section within the school (such as 8a, 8b, etc.). However, inother educational systems, students form different groups or courses forinstruction according to subject areas. In these countries, the national centershad to sample these groups or courses instead of classes or homerooms. Theinstructional units were sampled for instruction in the “civic education-relatedsubject No. 1” as determined by the Subject Allocation Grid.
School coordinators were asked for a list of all civic-related classes in the targetgrade, and the national centers prepared a Class Sampling Form for samplingclasses and selecting the civic education class (see Appendix C). After classeshad been selected by the national center, the school coordinators were given aTeacher-Student Linkage Form on which to record student and teacher namesfor each sampled class (see Appendix C).
In the procedures for the assessment of the upper secondary students in 1999/2000, a teacher questionnaire was not administered. Instead, the schoolcoordinators were asked to provide information about the students in thesampled class on a Student Tracking Form, which the national centers hadprepared for the selected classes and then sent to each school coordinator. Thisform was of crucial importance for identifying students to be tested and forassigning them unique student IDs. The form also included a record of theparticipation status for each sampled student. The school coordinator wasresponsible for listing the students of the selected classes on the form and thensubmitting it to the NRC.
CHAPTER 3 TRANSLATION PROCEDURES, FIELD OPERATIONS, AND QUALITY ASSURANCE

36 IEA CIVIC EDUCATION STUDY TECHNICAL REPORT
Exclusions of Students
All students who were enrolled in the target grade belonged to the targetpopulation. However, some students within the selected schools were unable totake part in the testing because of various disabilities. The number of studentsin this category was held to a minimum to avoid biasing internationalcomparisons. It was therefore important to carefully define the conditions andcategories under which students could be excluded.
The following general categories for the exclusion of students within schoolswere used and were adapted to fit the context of each educational system.
• Functionally disabled students permanently physically disabled in such a way that theycould not perform in the IEA Civic Education Study testing situation: It was expectedthat functionally disabled students who could respond to the test would beincluded in the testing.
• Educable mentally retarded students who were considered in the professional opinion ofthe school principal or by other qualified staff members to be educable mentallyretarded or who had been psychologically tested as such: This included students whowere emotionally or mentally unable to follow even the general instructionsof the test.
• Students with limited proficiency in the test language and so unable to read or speak thelanguage of the test: These students were expected to be unable to overcomethe language barrier in the test situation. Typically, a student who hadreceived less than one year of instruction in the language of the test wasexcluded from testing.
In some educational systems, these students are in special schools or specialclasses, and it was possible to exclude these schools or classes from the sample.However, in other educational systems this is not the case. For example, incountries where such students are integrated into the mainstream schoolingsystem, these students are not in separate classes. They accordingly had to beexcluded from the test administration by the school principal or other qualifiedstaff member. Detailed instructions were given to the school coordinator.
Test Administration and Data Entry
Using the information about students and teachers provided by the school, thenational centers prepared the Student Tracking Form2 and the TeacherTracking Form (for the 14-year-old students only) (Appendix C), whichcontained the names of students and teachers to be assessed or surveyed. Thesewere sent to the schools together with the test material and questionnaires.After the test administration, the school coordinators returned the two forms(including participation status) and testing materials to the national centers.
Test administrators were responsible for ensuring that each student received thecorrect testing materials, for administering the test in accordance with theinstructions in the Test Administrator Manual, for ensuring the correct timing ofthe test and recording the time spent on it, and for recording student
2 As outlined above, the Student Tracking Form for the survey of the upper secondary students had beenpreviously completed by the school coordinators.

37
participation on the Student Tracking Form. In some countries, as notedpreviously, the school coordinators were also responsible for the testadministration. Ideally, the test administrators were not to be the class teachersof the tested class but could be other teachers of the tested class, other teachersfrom the school, other school personnel, civic education teachers, or externalstaff.
In the study of the 14-year-olds, 10 of the participating countries engagedexternal test administrators. In seven countries, the school coordinatorsadministered the tests. In the majority of the countries, class teachers were usedas test administrators, followed by other teachers of the tested class, civiceducation teachers, and other school personnel. In the study of the uppersecondary students, the majority of the 16 participating countries involvedcivic education teachers and other teachers of the tested class; some countriesalso used class teachers. Only two countries reported the appointment ofexternal test administrators. In both populations, the test administratorsreceived training mainly through formal sessions and/or written instructions.In a few countries, instructions were also given by telephone.
The national centers had to ensure the security of testing material from thetime of receiving the international instruments until submitting data to the IEAData Processing Center (DPC). Test materials were sent to schools and returnedto the national centers immediately after test administration. Data entry wasorganized at the national centers or through sub-contractors. About half of theparticipating countries used their own staff for data entry. In this instance,special training sessions were conducted for the staff. In the majority of thecountries a percentage of test booklets were entered twice as a verificationprocedure to assure the quality of the data entry process. The percentage ofdouble-entered data ranged from 1 to 100 percent. A data entry programdeveloped by the IEA DPC together with instructions about how to enter,clean, and submit the data were distributed to the participating countries.
QUALITY CONTROL PROCEDURES DURING AND AFTERTHE DATA COLLECTIONStandards for IEA studies require that certain quality control measures beundertaken during the data collection process. Ideally, quality control measuresfor IEA studies should include personal interviews with the NRCs and visits toa sub-sample of tested schools to observe test administration (see, for example,O’Connor & Stemler, 2000). However, limitations in funding for the IEA CivicEducation Study imposed constraints on the extent of quality control and didnot permit these kinds of monitoring activities. However, three measures wereimplemented after completion of the testing:
• phone calls to schools;
• quality control questionnaires completed by national centers;
• NRC survey reports.
The national centers were requested to make phone calls to 25 percent of the testedschools the day after the testing had taken place. The school coordinator in eachschool was asked how the testing had been done, if there had been any
CHAPTER 3 TRANSLATION PROCEDURES, FIELD OPERATIONS, AND QUALITY ASSURANCE

38 IEA CIVIC EDUCATION STUDY TECHNICAL REPORT
problems, and if there had been deviations from the testing procedure. Most ofthe participating countries (both populations tested) reported that nationalcenter staff made check-up calls after the testing had taken place. In threecountries, external agencies were hired to do the telephone check-upprocedures. The national centers were provided with guidelines for thetelephone interviews. The sub-sample of tested schools was a simple randomsample of participating schools. The size of the quality assurance sample ofschools in the different countries ranged between 10 and 176 schools. Between10 and 60 percent of the tested schools received check-up calls after testing. Ina number of countries, organizational problems made it impossible for thenational centers to implement the phone calls. Some countries used othermeasures of quality control, such as quality control questionnaires completedby the school coordinator, or quality control visits made by national centerstaff to some of the tested schools.
After completion of the main study, the national centers were asked tocomplete a quality control questionnaire to determine if procedures had beenfollowed during the process of data collection and whether any deviations hadoccurred, and to give the national research centers an additional guideline fortheir work. According to the completed questionnaires, national centers ingeneral had followed the procedures outlined in the manuals. However, in somecases, funding and staffing restrictions within the national center had made itextremely difficult to implement additional measures of quality control.
The quality control questionnaire also asked the national centers to report anyspecial circumstances that could have affected the testing or students’ responsesin their countries. Although the majority of the centers reported no suchmitigating events, in some countries the study had been affected by teacher orstudent strikes. One European country referred to possible effects of thepresidential elections running at that time, while the USA reported thathurricanes had caused problems with testing. In some Central and EasternEuropean countries, testing and the survey were overshadowed by the war inKosovo.
Eight national centers commented on the difficulty of obtaining theparticipation of schools in their countries. Special faxes, letters,recommendations from their ministries or teachers’ organizations, andpersistent phone calls were the most important measures applied to improveparticipation rates. Most of the national centers, however, said theyencountered no difficulties in obtaining cooperation from schools. Interestingly,in the Eastern European countries that took part in the study and in countrieswhere test administration was carried out on behalf of a central authority, suchas a ministry of education, few difficulties were reported.
The procedures associated with the printing and security of test material wasanother important aspect covered in the quality control questionnaire. Thenational centers were asked whether errors had been detected during theprinting process and what procedures had been in place to protect the securityof the test material. Several of the national centers discovered printing errors.The most frequently reported concerns were “pages missing”, “bindingproblems”, and “page ordering”. All national centers reported that they had

39
followed procedures to protect the security of the test material. In most casesthe materials had been kept locked either in the schools or at the nationalcenters and had been sent directly after testing to the centers. No breaches ofsecurity were reported.
After completing the data collection, the national centers were requested tosubmit a NRC Survey Report to the ICC. The report required each center todescribe and document any unusual occurrences or deviations from prescribedprocedures with regard to:
• sampling;
• test instruments;
• field operations;
• test administration;
• data entry;
• anything that might help to interpret the main survey data or explainpossible anomalies.
Most national centers complied with this request. Although many minor delayswere recorded, most national centers generally managed to follow theprescribed procedures and to collect their data in a satisfactory manner.
SUMMARYConsiderable efforts were made to ensure a high quality of testing procedures.The translations of instruments were monitored through a two-phasedverification for both the pilot and main studies. Detailed documents helped thenational centers follow the internationally agreed field procedures, and someadditional quality assurance measures were implemented to ensure internationalcomparability. Reports from the national centers and the quality controlquestionnaires indicate that the procedures implemented for the IEA CivicEducation Study were generally followed and that the obtained data were ofhigh quality.
REFERENCESGonzalez, E., & Hastedt, D. (2000). TIMSS field operations and data preparation. In M. O.Martin, K. D. Gregory, & S. E. Stemler (Eds.), TIMSS 1999 technical report (pp. 119–132).Chestnut Hill, MA: Boston College.
IEA Civic Education Study. (1998a). Translation manual (CIVIC Reference No. 98–0102).Berlin: HU Berlin.
IEA Civic Education Study. (1998b). School sampling manual (CIVIC Reference No. 98–0101).Hamburg: IEA Data Processing Center.
IEA Civic Education Study. (1999a). Field operations manual (CIVIC Reference No. 99–0001).Hamburg/Berlin: IEA Data Processing Center/HU Berlin.
IEA Civic Education Study. (1999b). School coordinator manual (CIVIC Reference No. 99–0002).Hamburg: IEA Data Processing Center.
IEA Civic Education Study. (1999c). Test administrator manual (CIVIC Reference No. 99–0003).Hamburg: IEA Data Processing Center.
IEA Civic Education Study. (1999d). Manual for entering the CIVIC data (CIVIC Reference No.99–0004). Hamburg: IEA Data Processing Center.
CHAPTER 3 TRANSLATION PROCEDURES, FIELD OPERATIONS, AND QUALITY ASSURANCE

40 IEA CIVIC EDUCATION STUDY TECHNICAL REPORT
IEA Civic Education Study. (1999e). Translation manual: Main study of the older population (CIVICReference No. 99–0204). Berlin: HU Berlin.
IEA Civic Education Study. (1999f ). School sampling manual (CIVIC Reference No. 99–0209).Hamburg: IEA Data Processing Center.
IEA Civic Education Study. (1999g). Field operations manual (older population) (CIVICReference No. 99–0206). Berlin: HU Berlin.
IEA Civic Education Study. (1999h). School coordinator manual (older population) (CIVICReference No. 99–0207). Berlin: HU Berlin.
IEA Civic Education Study. (1999i). Test administrator manual (older population) (CIVICReference No. 99–0208). Berlin: HU Berlin.
IEA Civic Education Study. (1999j). Manual for entering the CIVIC data (CIVIC Reference No.99–0210). Hamburg: IEA Data Processing Center.
O’Connor, K. M., & Malak, B. (2000). Translation and cultural adaptation of the TIMSSinstruments. In M. O. Martin, K. D. Gregory, & S. E. Stemler (Eds.), TIMSS 1999 technical report(pp. 89–100). Chestnut Hill, MA: Boston College.
O’Connor, K. M., & Stemler, S. E. (2000). Quality control in the TIMSS data collection. In M.O. Martin, K. D. Gregory, & S. E. Stemler (Eds.), TIMSS 1999 technical report (pp. 135–154).Chestnut Hill, MA: Boston College.

41
Chapter 4:
THE CIVED SAMPLING DESIGNHeiko Sibberns and Pierre Foy
OVERVIEWThis chapter describes the procedures implemented in the IEA Civic Education(CivEd) Study to ensure proper sampling of the student population in eachparticipating country. To be acceptable, the national sample designs had toresult in probability samples that gave accurate weighted estimates ofpopulation parameters, and for which estimates of sampling variance could becomputed. The CivEd sample design was identical to the one used for TIMSS1999, which in turn was based on the TIMSS 1995 sample design. The CivEdsample design was chosen to balance analytical requirements and operationalconstraints. However, it was kept simple enough for all participants toimplement. The quality of the samples depended very much on the accuracy ofthe information available at the design stage and on the sampling procedures.
The national research coordinators (NRCs) were aware that the CivEd samplingprocedures were complex. Centrally collecting the necessary information aboutthe national educational systems would have placed considerable demands onresources and expertise. At the same it was realized that only a limited numberof qualified sampling personnel were available at the national centers.Therefore, it was mandatory to keep all procedures as simple as possible. Allsampling procedures within schools, like the selection of classes or students,especially needed to be straightforward.
The International Coordination Center (ICC) and the IEA Data ProcessingCenter (DPC) provided manuals and expert advice to help the NRCs adapt theCivEd sample design to their educational system. The CivEd school samplingmanuals for the 14-year-old students and for the upper secondary studentsdescribed how to implement the international sample design and adapt it tothe participating countries’ specific requirements. The manuals included adviceon planning, implementing, and documenting all phases of the schoolsampling process. The survey operations manuals and the school coordinatormanuals described the selection of classes within schools and theadministration and monitoring of the procedures used to identify and trackrespondents and non-respondents.
In addition, the NRCs had access to expert support. The IEA DPC, in closecooperation with Statistics Canada, reviewed and approved the nationalsampling plans, sampling data, sampling frames, and sample selections.Statistics Canada assisted nearly half of the countries that participated in thesurvey of the 14-year-olds with their sampling procedures. The samples forthese countries were drawn simultaneously with the TIMSS 1999 samples.
1 This chapter is based on Chapter 2 of the TIMSS 1999 Technical Report (Foy & Joncas, 2000).
1

42 IEA CIVIC EDUCATION STUDY TECHNICAL REPORT
The NRCs were allowed to modify the CivEd sample design so as to meet therequirements of their national educational systems or to address nationalresearch questions requiring changes in the design. However, the ICC had toapprove these adjustments, and the IEA DPC to monitor them.
TARGET POPULATION AND EXCLUSIONIn all IEA studies, the target population is known as the international desiredpopulation. The international desired target population for the survey of 14-year-olds was as follows:
• All students enrolled on a full-time basis in that grade in which moststudents aged 14:00 to 14:11 [years: month] are found at the time of testing.
The international desired target population for the survey of upper secondarystudents was as follows:
• All students enrolled on a full-time basis in that grade in which moststudents aged 16:00 to 16:11 [years: month] or 17:00 to 17:11 [years:month] or 18:00 to 18:11 [years: month] are found at the time of testing.
Given that no international definition of the upper secondary target populationcould be agreed upon within the constraints of the different participatingcountries, each country was free to select that grade closest to the end of theupper secondary school that interested the national research groups and/orfunders.
School and Within-School Exclusions
The IEA Civic Education Study expected all participating countries to definenational desired populations to correspond as closely as possible to the internationaldesired population. However, sometimes it was necessary to make changes inorder to adapt to national restrictions. For example, countries had to restrictcoverage by excluding remote regions or segments of their educational system.Appendix D documents any deviations from the international desiredpopulation.
Using the national desired population as a basis, participating countries had tooperationally define their population for sampling purposes. These definitionsdetermined the national defined population and the sampling frame from whichschools were randomly selected during the first stage of sampling. The nationaldefined population could be a subset of the national desired population. Allschools and students excluded from the national desired population were referredto as the excluded population.
Participants in the IEA Civic Education Study were required to keep theexcluded population under five percent of the national desired population.Exclusions could occur at the school level, at the student level, or at both levels.Because the national desired population was restricted to the target grade,schools not containing the target grade were considered to be outside the

43
scope of the sampling frame. Participating countries could exclude schools forthe following reasons:
• They were in geographically remote regions.
• They were of extremely small size.
• They offered a curriculum, or school structure, that was different from themainstream educational system.
• They provided instructions only to students in the exclusion categoriesdefined as “within-sample” exclusions.
Within-sample exclusions were limited to students who, because of a disability,were unable to take the civic knowledge test. The NRCs were asked to definethe anticipated within-school exclusion. Because definitions can varyinternationally, the NRCs were also asked to follow certain rules for definingthese exclusion groups. The size of exclusions had to be estimated. It had to bein line with the five percent rule specified above.
The international within-school exclusion rules were specified as follows:
• Educable mentally retarded students: These were students who were considered,in the professional opinion of the school principal or other qualified staffmembers, to be educable mentally disabled, or students who had beendiagnosed by psychological tests as such. This group included students whowere emotionally or mentally unable to follow even the general instructionsof the civic knowledge test.
• Functionally disabled students: These were students who were permanentlyphysically disabled in such a way that they could not perform the civicknowledge test. Functionally disabled students who could perform the testwere included.
• Non-native speakers: These were students who could not speak or read thelanguage of the test. Typically, a student who had received less than one yearof instruction in the language of the test was excluded. However, thisdefinition was adapted by the national centers in order to match the nationalcontext.
The aim of the sampling procedures was to ensure that the effective targetpopulation would be as close as possible to the international desiredpopulation. Any exclusion of students from the international desired targetpopulation had to be accounted for, both at the school and the student level.
The size of the excluded population was documented and served as an index ofcoverage and representativeness of the selected samples. The different stages ofpossible exclusions between the international desired target population and theeffective target population are illustrated in Figure 4.1.
CHAPTER 4 THE CIVED SAMPLING DESIGN

44 IEA CIVIC EDUCATION STUDY TECHNICAL REPORT
Figure 4.1 Population definitions and exclusions
SAMPLE DESIGNThe basic sample design of the IEA Civic Education Study is generally called atwo-stage stratified cluster sample design. The first stage consisted of a sampleof schools that had been stratified in a number of countries. The second stageconsisted of a single civic education class selected from the target grade insampled schools. It was also permissible to add a third stage where studentswere sampled within classrooms.
Units of Analyses and Sampling Units
The analytical focus of the IEA Civic Education Study was the learning andattitudes of students and the instructional and school characteristics influencingthe learning and attitudes. The sample design had to address the measurementof variables at student level and classroom/school level that were deemed toinfluence learning and attitudes and the collection of data on specificcharacteristics of instruction and the school. Because schools, classrooms, andstudents were all considered potential units of analyses, they had to beregarded as sampling units.
Although intact classrooms were sampling units in the second sampling stage,the ultimate sampling elements were students. Consequently, it was importantthat every student from the target grade be a member of one, and only one,civic education class (or untracked homeroom) in a school from which thesampled class was to be selected. In most educational systems, the civiceducation class coincided with a homeroom class. However, it was also possiblethat a different subject could be selected for sampling purposes, for examplehistory, if civic education as a subject was not taught in the target grade of theselected school (see Chapter 3 for details).
International DesiredTarget Population
National DesiredTarget Population
National DefinedTarget Population
EffectiveTarget Population
Exclusion fromNational Coverage
School-LevelExclusions
Within-SampleExclusions

45
Sampling Precision and Sample Size
Sample sizes in the IEA Civic Education Study had to be determined in orderto meet the analytical requirements. Since students were the principal units ofanalysis, it was important to produce reliable estimates of students’characteristics. The CivEd standard for sampling precision required that allpopulation samples had an effective sample size of at least 400 for thecognitive scales. Phrased differently, the standard errors of the samples werenot to be greater than those obtained by a simple random sample of 400students.
An effective sample size of 400 results approximately in the following 95percent confidence limits for sample estimates of population means,percentages, and correlation coefficients:
• Means: M ± 0.1 s (where M is the mean estimate and s is the estimatedstandard deviation.
• Percentage: p ± 5% (where p is the estimated percentage).
• Correlations: r ± 0.1 (where r is the correlation estimate).
To obtain sufficient data for reliable analyses at the school and class levels, atleast 150 schools had to be selected from the target population. A sample of150 schools results in 95 percent confidence limits for school-level and class-level mean-estimates, which are precise to within ± 16 percent of theirstandard deviation. To achieve this level of precision, countries had to sampleat least 150 schools, even if smaller school samples would have met thestudent-level requirements.
The precision of multi-stage cluster sample designs is generally affected by theso-called clustering effect. A classroom as a sampling unit is a cluster ofstudents who tend to be more like each other than like other members of thepopulation. The intra-class correlation is a measure of this similarity. Sampling30 students from a single classroom, when the intra-class correlation isdifferent from zero, results in less information than a simple random sample of30 students across all classrooms in a school. Such a sample design is lessefficient, in terms of information per sampled student, than a simple randomsample of the same size. This clustering effect had to be taken into accountwhen determining the overall sample sizes in the IEA Civic Education Study.
The magnitude of the clustering effect is determined by the size of the clusterand the size of the intra-class correlation. When planning the sample, eachcountry had to choose a value for the intra-class correlation and a value for theexpected cluster size (known as minimum cluster size). The intra-classcorrelation was estimated from previous studies like TIMSS 1995, or fromnational assessments. In the absence of any measures, an intra-class correlationof 0.3 was assumed. Since all countries except one chose to test intactclassrooms, the minimum cluster size was set to the average classroom size. Thespecification of the minimum cluster size affected the treatment of smallschools and small classrooms as well as the number of schools to be sampled.
Sample design tables were produced and included in the CivEd samplingmanuals. These tables presented the number of schools to be sampled to meet
CHAPTER 4 THE CIVED SAMPLING DESIGN

46 IEA CIVIC EDUCATION STUDY TECHNICAL REPORT
the precision requirements for a range of intra-class correlations and minimumcluster sizes (for an example, see Table 4.1).
Table 4.1 Example of a sample design table (95% confidence limits for means ±0.1s /percentages ±5.0%)
MCS Intra-class Correlation
0.1 0.2 0.3 0.4 0.5 0.6 0.7 0.8 0.9
5 A 112 144 176 208 240 272 304 336 368
N 560 720 880 1,040 1,200 1,360 1,520 1,680 1,840
10 A 76 112 148 184 220 256 292 328 364
N 760 1,120 1,480 1,840 2,200 2,560 2,920 3,280 3,640
15 A 64 102 139 176 214 251 288 326 363
N 960 1,530 2,085 2,640 3,210 3,765 4,320 4,890 5,445
20 A 58 96 134 172 210 248 286 324 362
N 1,160 1,920 2,680 3,440 4,200 4,960 5,720 6,480 7,240
25 A 150 150 150 172 211 249 287 326 364
N 3,750 3,750 3,750 4,300 5,275 6,225 7,175 8,150 9,100
30 A 52 91 130 168 207 246 284 323 362
N 1,560 2,730 3,900 5,040 6,210 7,380 8,520 9,690 10,860
35 A 150 150 150 169 208 246 285 324 363
N 5,250 5,250 5,250 5,915 7,280 8,610 9,975 11,340 12,705
40 A 49 88 127 166 205 244 283 322 361
N 1,960 3,520 5,080 6,640 8,200 9,760 11,320 12,880 14,440
45 A 150 150 150 167 206 245 284 323 362
N 6,750 6,750 6,750 7,515 9,270 11,025 12,780 14,535 16,290
50 A 48 87 126 165 204 244 283 322 361
N 2,400 4,350 6,300 8,250 10,200 12,200 14,150 16,100 18,050
Note: A = number of sampled schools; N = number of sampled students in the target grade.
Stratification
Stratification is the grouping of sampling units in the sampling frame accordingto some attribute or variable prior to the sample selection. It is generally usedfor the following reasons:
• To improve the efficiency of the sample design, thereby making surveyestimates more reliable.
• To apply different sample designs, or disproportionate sample-sizeallocations, to specific groups of schools (such as those in specific regions orschool types).
• To ensure adequate representation in the sample of specific groups from thetarget population.

47
Examples of stratification variables for school samples are geography (such asregions or provinces), school type (such as public or private), and level ofurbanization (rural/urban). Stratification variables in the CivEd sample designcould be explicit, implicit, or both.
Explicit stratification consists of building separate school lists, or samplingframes, according to the stratification variables under consideration. If, forexample, “regions” was an explicit stratification variable, separate samplingframes were constructed for each region. Different sample designs, or differentsampling fractions, could be applied to each sampling frame. In practice, themain reason for constructing explicit strata was disproportionate allocation ofthe school sample across strata. For example, a country might require an equalnumber of schools for each stratum regardless of the relative size of thestratum.
Implicit stratification makes use of a single school sampling frame, but sorts theschools in the frame according to a set of stratification variables. This is asimple way of guaranteeing proportional allocation without the complexity ofexplicit stratification. Implicit stratification can also improve the reliability ofsurvey estimates, provided the stratification variables are related to school meanstudent achievement.
Replacement Schools
Although participants in the IEA Civic Education Study placed great emphasison securing school participation, it was anticipated that it would be difficult formany countries to achieve a 100 percent participation rate. To address thissituation, two replacement schools were selected together with the originallysampled schools. The use of implicit stratification variables and the subsequentordering of the school sampling frame by school size ensured thatcharacteristics of the sampled school were similar to those of the replacementschools. Although this procedure does not guarantee the absence of potentialbias in population estimates, it helps to minimize it.
First Sampling Stage
The sample-selection method used in this study involved a systematicprobability proportional to size (PPS) technique. This technique requires somemeasure of size (MOS) of the sampling units. Ideally, this is the number ofsampling elements within the unit (e.g., the number of students in the targetgrade in the school). If this information is not available, some highly correlatedmeasure like total school enrolment is used.
Schools in each explicit stratum were listed in order of the implicit stratificationvariables, together with the MOS of each school. They were also sorted byMOS. The measure of size was accumulated from school to school, and therunning total was listed next to each school. The total cumulative MOS was ameasure of the size of the population of sampling elements. Dividing thisfigure by the number of schools to be sampled gave the sampling interval.
The first school was sampled by choosing a random number between one andthe sampling interval. The school whose cumulative MOS contained the
CHAPTER 4 THE CIVED SAMPLING DESIGN

48 IEA CIVIC EDUCATION STUDY TECHNICAL REPORT
random number was the first sampled school. By adding the sampling intervalto the random number, a second school was identified. This process ofconsistently adding the sampling interval to the previous selection numberresulted in a PPS sample of the required size.
As each school was selected, the next school in the sampling frame wasdesignated as a replacement school for use should the sampled school notparticipate. The school after the first replacement was the second replacementand was to be used if neither the sampled school nor the first replacementparticipated.
Major benefits of the PPS sample selection method are that it is easy toimplement and that it is easy to verify that it has been implemented properly.
Small Schools
Small schools tend to be problematic in PPS samples because students sampledfrom these schools get disproportionately large sampling weights; when theschool size falls below the minimum cluster size, it reduces the overall sample.A school was defined as a small school in the IEA Civic Education Study if itwas smaller than the minimum cluster size. If, for example, the minimumcluster size for a country was set at 20, then a school with fewer than 20students in the target grade was considered a small school.
The following two steps were implemented to deal with small schools:
• Extremely small schools: Extremely small schools were defined as schools withstudents numbering under half the minimum cluster size. If studentenrolment in these schools was less than two percent of the eligiblepopulation, they were excluded, provided the overall exclusion rate did notexceed the five percent criterion.
• Explicit stratum of small schools: If less than 10 percent of the eligible studentswere enrolled in small schools, no additional action was required. However,if more than 10 percent of the students were enrolled in small schools, anexplicit stratum of small schools was required. The number of schoolssampled from this stratum remained proportional to the stratum size, but allschools had an equal probability of selection. This action ensured greaterstability in the resulting sampling weights.
Optional Preliminary Sampling Stage
Some very large countries chose to introduce a preliminary sampling stagebefore sampling schools. This consisted of a PPS sample of geographic regions.A sample of schools was then selected from each sampled region. This designwas mostly a cost reduction measure where the construction of acomprehensive list of schools would have been either impossible or tooexpensive. Also, the additional sampling stage reduced the dispersion of theschool sample, thereby reducing travel costs. Sampling guidelines were put inplace to ensure that an adequate number of units were sampled at thispreliminary stage. The sampling frame had to consist of at least 80 primarysampling units, of which at least 40 had to be sampled.

49
Second Sampling Stage
The second sampling stage consisted of selecting classrooms within sampledschools. As a rule, one classroom was selected per school, although oneparticipant opted to sample two classrooms. Classrooms were selected withequal probability or with probability proportional to size. When all students ina selected classroom were tested, the classrooms had to be selected with equalprobability.
Small Classrooms
Classrooms in an educational system generally tend to be of similar size. Butsmall classrooms sometimes are devoted to special activities, such as remedial oraccelerated programs. These may become problematic because classroomsselected with PPS can lead to a shortfall in sample size and thereby introducesome instability in the sample weights. To avoid this problem, the classroomsampling procedure specified that any classroom of less than minimum clustersize must be combined with another classroom from the same grade andschool. The resulting pseudo-classroom then constituted a sampling unit.
PARTICIPATION RATESWeighted and unweighted response rates were computed for each participatingcountry at school level and at student level.
School-level Participation Rate
The minimum acceptable school-level participation rate, before the use ofreplacement schools, was set at 85 percent. This criterion was applied to theunweighted school response rate. School response rates were computed bothweighted and unweighted, with and without replacement schools. Only theweighted response rates were reported for the 14-year-old students. For theupper secondary students, the unweighted participation rate after replacementwas also reported (see Chapter 6 for details on the calculation of unweightedand weighted school-level participation rates).
Student-level Participation Rate
Like the school-level participation rate, the minimum acceptable student-within-school participation rate was set at 85 percent. This criterion wasapplied to the unweighted participation rates. Both weighted and unweightedparticipation rates were computed, but only the weighted participation rateswere reported (see Chapter 6 for details on the calculation of unweighted andweighted student-level participation rates).
Overall Participation Rates
The minimum overall participation rate was set at 75 percent. This rate wascalculated as the product of the weighted school-level participation ratewithout replacement schools and the weighted student-level participation rate.Weighted overall participation rates were calculated and reported both withand without replacement schools. (See Chapter 6 for details on the calculationof unweighted and weighted overall participation rates.)
CHAPTER 4 THE CIVED SAMPLING DESIGN

50 IEA CIVIC EDUCATION STUDY TECHNICAL REPORT
COMPLIANCE WITH SAMPLING GUIDELINESGenerally, the NRCs made every attempt to meet the sampling requirements.However, not all countries met these requirements. Ten countries out of the 28that participated in the survey of the 14-year-olds and seven countries out ofthe 16 that participated in the survey of the upper secondary students failed toachieve a weighted overall participation rate of 75 percent before replacement(see Table 4.2).
Three countries in the survey of the 14-year-old students had a weightedoverall participation rate of less than 75 percent even after replacement schoolshad been included; these countries were reported with footnotes in theinternational reports (see Table 4.3). In the survey of the upper secondarystudents, four countries failed to meet a participation rate of 75 percent afterreplacement (see Table 4.4).
Colombia and Hong Kong (SAR) did not satisfy the guidelines for samplingprocedures in the survey of the upper secondary students. Their data could notbe weighted and were not reported with the data from the other participatingcountries. (They were, however, reported in an appendix.)
In eight out of the 28 countries participating in the survey of the 14-year-olds,the effective sample sizes for the combined civic knowledge scale were below400, and in four of them they were below 300 (see Table E.1 in Appendix E).Among the countries participating in the survey of the upper secondarystudents, seven out of 14 countries fell short of achieving an effective samplesize of 400 students for the combined civic knowledge scale; four had aneffective sample size below 300 students (see Table E.2 in Appendix E).
However, failure to achieve the standard of collecting data from an effectivesample size of 400 students in some of the countries did not jeopardize thecross-country comparability of these data. As the size of standard errorsincreased with decreasing effective sample sizes, the lack of precision inestimating population means from smaller samples was taken into account inthe calculation of significance tests for cross-country comparisons (see Chapter10 for details of the reporting of cross-country comparisons).

51
Table 4.2 Countries grouped according to their compliance with sampling implemen-tation and participation rates
14-year-old Students Upper Secondary Students
Countries satisfying guidelines for sample participation rates
Bulgaria Chile
Chile Cyprus
Cyprus Czech Republic
Czech Republic Latvia
Estonia Poland
Finland Russian Federation
Greece Slovenia
Hong Kong (SAR)
Hungary
Italy
Latvia
Lithuania
Poland
Portugal
Romania
Russian Federation
Slovenia
Sweden
Countries satisfying guidelines for sample participation rates only after inclusion ofreplacement schools
Australia Israel
Colombia Sweden
England Switzerland (German)
Germany*
Slovak Republic
Switzerland
United States
Countries not satisfying guidelines for sample participation rates
Belgium (French) Denmark
Denmark Estonia
Norway Norway
Portugal
Countries not satisfying guidelines for sampling procedures
Colombia
Hong Kong (SAR)
Note: *National defined population covers less than all of the international desired population.
CHAPTER 4 THE CIVED SAMPLING DESIGN
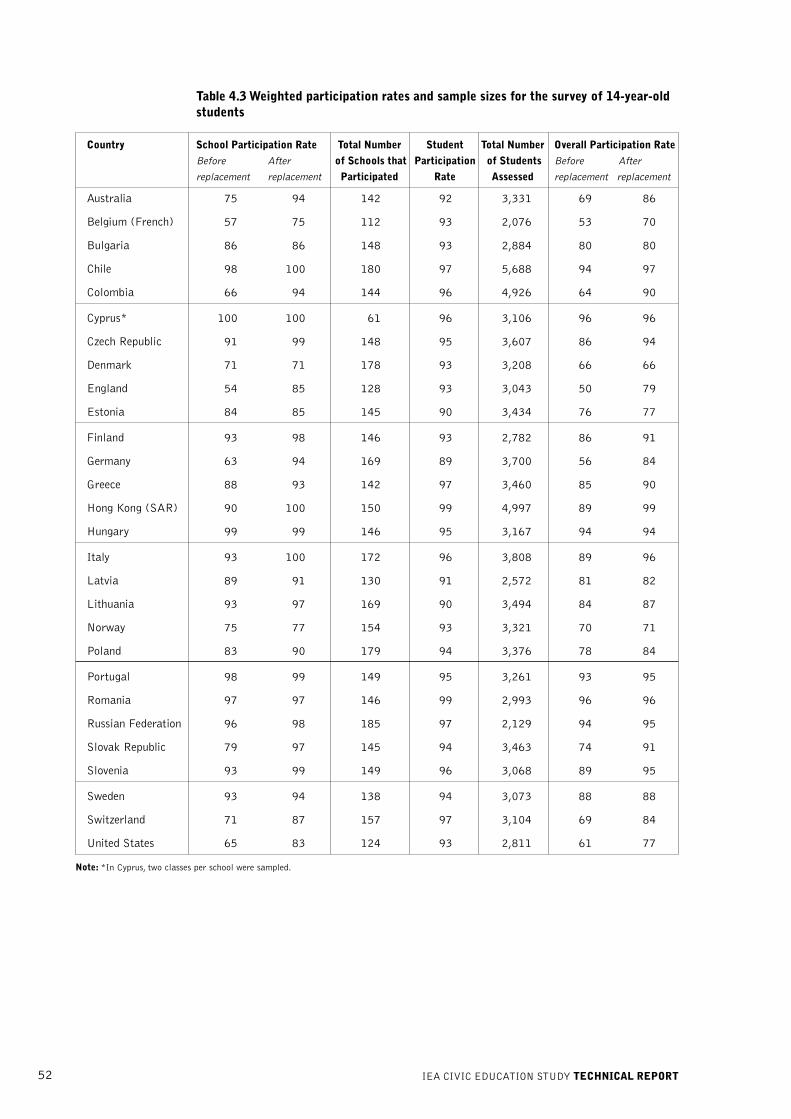
52 IEA CIVIC EDUCATION STUDY TECHNICAL REPORT
Table 4.3 Weighted participation rates and sample sizes for the survey of 14-year-oldstudents
Country School Participation Rate Total Number Student Total Number Overall Participation Rate
Before After of Schools that Participation of Students Before After
replacement replacement Participated Rate Assessed replacement replacement
Australia 75 94 142 92 3,331 69 86
Belgium (French) 57 75 112 93 2,076 53 70
Bulgaria 86 86 148 93 2,884 80 80
Chile 98 100 180 97 5,688 94 97
Colombia 66 94 144 96 4,926 64 90
Cyprus* 100 100 61 96 3,106 96 96
Czech Republic 91 99 148 95 3,607 86 94
Denmark 71 71 178 93 3,208 66 66
England 54 85 128 93 3,043 50 79
Estonia 84 85 145 90 3,434 76 77
Finland 93 98 146 93 2,782 86 91
Germany 63 94 169 89 3,700 56 84
Greece 88 93 142 97 3,460 85 90
Hong Kong (SAR) 90 100 150 99 4,997 89 99
Hungary 99 99 146 95 3,167 94 94
Italy 93 100 172 96 3,808 89 96
Latvia 89 91 130 91 2,572 81 82
Lithuania 93 97 169 90 3,494 84 87
Norway 75 77 154 93 3,321 70 71
Poland 83 90 179 94 3,376 78 84
Portugal 98 99 149 95 3,261 93 95
Romania 97 97 146 99 2,993 96 96
Russian Federation 96 98 185 97 2,129 94 95
Slovak Republic 79 97 145 94 3,463 74 91
Slovenia 93 99 149 96 3,068 89 95
Sweden 93 94 138 94 3,073 88 88
Switzerland 71 87 157 97 3,104 69 84
United States 65 83 124 93 2,811 61 77
Note: *In Cyprus, two classes per school were sampled.

53CHAPTER 4 THE CIVED SAMPLING DESIGN
REFERENCEFoy, P., & Joncas, M. (2000). Sample design. In M. O. Martin, K. D. Gregory, & S. E. Stemler(Eds.), TIMSS 1999 technical report (pp. 29–45). Chestnut Hill, MA: Boston College.
Table 4.4 Participation rates and sample sizes for the survey of upper secondarystudents
Country School Participation Rate Total Number Student Total Number Overall Participation Rate
Before Before After After of Schools that Participation of Students Before After
replacement replacement replacement Participated Rate Assessed replacement replacement
(weighted) (weighted) (unweighted) (weighted) (weighted)
Chile 99 100 100 180 96 5,777 95 96
Colombia * * 92 149 * 5,347 * *
Cyprus 100 100 98 41 89 1,700 89 89
Czech Republic 96 98 98 147 92 3,362 89 91
Denmark 71 71 71 141 88 2,761 62 62
Estonia 75 77 86 142 91 3,215 68 70
Hong Kong (SAR) * * 54 81 * 5,810 * *
Israel 88 98 98 233 84 4,430 74 83
Latvia 84 87 86 125 97 2,756 81 85
Norway 83 83 83 124 88 2,099 72 72
Poland 90 100 100 150 93 4,050 83 93
Portugal 94 94 95 149 79 2,795 74 74
Russian Federation 98 98 95 165 97 1,787 94 94
Slovenia 96 96 94 145 88 3,746 84 84
Sweden 90 91 89 88 76 2,678 69 76
Switzerland (German) 69 95 95 69 94 1,270 65 90
Note: *Participation rates are not reported for Colombia and Hong Kong (SAR) because only unweighted data wereavailable.

54 IEA CIVIC EDUCATION STUDY TECHNICAL REPORT

55
Chapter 5:
DATA MANAGEMENT ANDCONSTRUCTION OF THE CIVEDDATABASEHeiko Sibberns
OVERVIEWThe IEA Civic Education Study (CivEd) data were processed in a closecooperation between the national research centers, the IEA Data ProcessingCenter (DPC), and the International Coordinating Center (ICC) at theHumboldt University Berlin. Each of these institutions was responsible forspecific aspects of the data processing. The ICC was responsible for the overallcoordination of data management procedures.
Data processing consisted of the following general tasks: data entry, creation ofthe international database, calculation of sampling weights, scaling of cognitiveand attitude items, and the analyses of the background data. This chapterdescribes the data entry tasks undertaken by each national research coordinator(NRC), the data checking and database creation implemented by the IEA DPC,and the steps taken to ensure data quality and the accuracy of the internationaldatabase. It also illustrates the responsibilities of each participant in creating theinternational database, the structure of the data files submitted by each country,the resulting files in the international database, and the rules, methods, andprocedures used for data verification and manipulation and the software used inthis process.
Data Flow
The data collected for the IEA Civic Education Study were entered at thenational research centers of the participating countries into data files with acommon, internationally predefined format. These files were transmitted to theIEA DPC for editing and verification. The major responsibilities of the DPCwere as follows: to define the structure of the database to be transmitted by theNRCs; to check that incoming data matched the international standards; toadapt the structure where necessary; to implement and apply editing rules toverify the consistency and accuracy of the data; to correspond with the NRCsto ensure accuracy and comparability; to produce summary statistics for allrelevant variables, including weighting statistics for the ICC; to add all relevantweighting variables to the database; and, finally, on the basis of input from theNRCs, to construct the core of the international database, that is, all datawithout scale scores.

56 IEA CIVIC EDUCATION STUDY TECHNICAL REPORT
Upon data verification and weighting, all data were sent to the ICC for scalingand scoring (see Chapter 7 for further information). Once scale scores had beencalculated at the ICC, they were sent to the DPC for inclusion into theinternational database. The ICC then prepared the tables and figures for thereports and coordinated the publication of the results of this study.
DATA ENTRY AT THE NATIONAL RESEARCH CENTERSEach national research center was responsible for transcribing the informationfrom the student, teacher, and school questionnaires into computer data files.The data-entry software DataEntryManager (DEM), which had been adapted forthe needs of the IEA Civic Education Study, was provided to each participatingcountry, together with a Manual for Entering the Civic Education Data (IEA CivicEducation Study, 1999a, 1999b) and codebooks defining the structure of thedata. A codebook defined the variable names for each variable in thequestionnaire, its position in the data file, and its field length, labels, validranges, missing values, and default values.
Because of the importance of the structure as defined by the codebooksprovided with the DEM software, the NRCs were strongly encouraged to useDEM for entering the CivEd data. If, for example, for contractual reasons,countries had to use other data entry systems, output from other software hadto meet the structure as defined in the codebook.
To facilitate data entry, the codebooks and their corresponding data files weredesigned to match the questionnaires. As a consequence, there was one data fileper instrument. Each country was supposed to submit three data files, thestudent data file, the teacher data file, and the school data file.
• The student data file contained one record for every student listed on thestudent tracking form for each sampled class, including students who did notparticipate and students who were excluded or had left the schoolpermanently. The data on the student data file came from the studenttracking form, the teacher-student linkage form, and the studentquestionnaires.
• The teacher data file contained one record for each teacher. The data for thisfile came from the teacher tracking form and the teacher questionnaires.
• The school data file contained one record for each school sampled to take partin the study regardless of whether the school participated or not. The datafor this file came from the school tracking form and the schoolquestionnaires.
INFORMATION RECEIVED BY THE IEA DATA PROCESSINGCENTERIn addition to the data file and the corresponding codebooks, countries wererequested to submit additional information necessary for data verification. Thisincluded a report of all field-work activities, completed data management forms(including all national adaptations or changes to the questionnaires and thestudents’ participation status), and copies of the national questionnaires.

57
DATA EDITING AT THE IEA DATA PROCESSING CENTEROnce each national research center had entered all data, it submitted the files tothe IEA DPC for review and further processing into the international database,a process that is generally referred to as data cleaning or data editing. On theone hand, data editing for the IEA Civic Education Study aimed at identifying,documenting, and, if necessary, correcting deviations from the international filestructure. On the other hand, the goal was to correct key-puncher errors,systematic deviations from the international data formats, linkage problemsacross data files, inconsistent tracking information both within and across files,and inconsistencies within and across observations. The main objective of thisprocess was the creation of a database containing accurate, consistent, andcomparable data.
Data editing consisted of several checks, some of which were repeated untilsatisfactory results could be achieved. During the first step, all incoming datawere compared to the international file structure. Deviations like changes offield length and deletion of variables were corrected in order to perform allfurther checks with equally structured data files. In a second step, all problemswith identification variables, participation status variables, valid ranges, andinconsistent answers were documented and, if necessary, solved. During thisstep, distributions of all variables were generated in order to detect unusualdata. In a final step, data files were reviewed for possible linkage errors acrossfiles and, if necessary, corrected.
Two main processes could be distinguished in the data editing. First, ifproblems could be solved unambiguously, automatic changes were performedby a program. Second, if automatic changes could not be made, IEA DPC staffhad to use auxiliary information to make the necessary changes to the data.
STANDARDIZATION OF THE NATIONAL FILE STRUCTUREIn the first step of data editing, the incoming data were compared to theinternationally defined file structure. This step was necessary in order toperform all subsequent editing steps requiring a standardized file structure.Even though the codebooks provided with the DEM program gave clear andunambiguous instructions about the structure of the data files that each countrywas expected to submit to the DPC, some countries decided to use differentdata entry systems or to submit the data in different formats. In most cases,these changes were due to adaptations to the national design.
The instructions for entering the CivEd data asked the countries to use DEMand to submit all data emerging from DEM in extended dBase format files.However, data were received in fixed format ASCII files, tab-delimited, SPSS,or SAS formats.
After all data had been transformed into one standard format, the structure ofthe files was reviewed and compared to the international structure. Alldeviations were identified. A program scanned the files of each participatingcountry to identify the following problems:• international variables omitted;• national variables added; and• different variable length or decimal positions.
CHAPTER 5 DATA MANAGEMENT AND CONSTRUCTION OF THE CIVED DATABASE

58 IEA CIVIC EDUCATION STUDY TECHNICAL REPORT
Together with the data files, the documentation provided by the nationalcenters was reviewed. On the basis of the initial checks, the IEA DPC outlinedand implemented the changes necessary to standardize the file structure.
CLEANING RULES AND PROCEDURESAfter the transformation of national data into the international file structure,standard cleaning routines were applied to the data. In a first step, a diagnosticprogram detected possible problems in the data. During this step, the followinggroups of problems were under consideration:
• valid ranges;
• duplicate records;
• flaws in the ID system;
• participation status (from the tracking form) against data (from thequestionnaire);
• participation status against exclusion status; and
• inconsistencies in participants’ answers.
All problems detected in this step were reported in an error database. In asecond step, routine programs were used to solve many of these errors. Most ofthem were due to the wrong usage of missing values. In a third step, remainingproblems were addressed by manual operation, which required thoroughreviews of tracking forms or further communication with the NRCs.
When all automatic and manual changes had been applied to the data, thediagnostic program used in the first step was applied again, and the resultingerror database was compared to the previous error database. Ideally, at the endof this procedure, all problems should have been removed from the data.However, it sometimes happened that problems persisted or new problems werecreated in the data. The data cleaning steps then had to be repeated until noproblems remained.
The review of file linkages between files was based on the information from allfiles involved in the study. Only records from participating respondents wereused in this final data-cleaning step. During NRC meetings, the NRCs receiveddetailed reports on database problems and the solutions applied to the data.
DATA PRODUCTSData products sent by the IEA DPC to the ICC included both data files anddata summaries, depending on the needs of the ICC.
Data summaries contained unweighted summary statistics for each participatingcountry on each variable in the survey instrument. The display for categoricalvariables, which represented the majority of variables in the data files, includedthe percentage of respondents choosing each of the options on the question,the percentage of respondents choosing none of the valid responses, and thepercentage of students to whom the question had not been administered. Thesesummaries were used for an in-depth review of the data. If, for example, noanswer was found in a particular response category, the corresponding questionas used in the country was scrutinized to detect possible printing errors. Table5.1 shows an example of a summary statistic.

59
Table 5.1 Example of summary statistics for student questionnaire item
78 SQ2-2/7A BSGADU1 MOTHER/STEPM/GUAR LIVES AT HOME ALL THE TIMEValid Ranges: BSGADU1$’1298'
Country Omit NR 0 1 2 3 4 5 6 7 8 9 10
AUS 5.6 • • 6.3 88.1 • • • • • • • •
BFR 5.2 • • 14.6 80.1 • • • • • • • •
BGR 3.2 • • 14.1 82.7 • • • • • • • •
CHE 3.6 • • 6.7 89.7 • • • • • • • •
CHL 5.4 • • 9.2 85.4 • • • • • • • •
COL 7.8 • • 11.7 80.5 • • • • • • • •
CYP 5.0 • • 3.6 91.4 • • • • • • • •
CZE 1.6 • • 6.0 92.4 • • • • • • • •
DEU 4.8 • • 4.5 90.7 • • • • • • • •
DNK 4.1 • • 6.3 89.7 • • • • • • • •
ENG 4.3 • • 4.7 91.0 • • • • • • • •
EST 5.5 • • 6.0 88.4 • • • • • • • •
FIN 4.4 • • 5.8 89.8 • • • • • • • •
GRC 6.0 • • 10.3 83.7 • • • • • • • •
HKG 2.8 • • 4.8 92.4 • • • • • • • •
HUN 4.5 • • 10.6 84.9 • • • • • • • •
ITA • • • • • • • • • • • • •
LTU 5.9 • • 3.9 90.2 • • • • • • • •
LVA 7.3 • • 8.0 84.7 • • • • • • • •
NOR 5.3 • • 6.9 87.8 • • • • • • • •
POL 3.1 • • 9.1 87.7 • • • • • • • •
PRT 3.9 • • 8.7 87.4 • • • • • • • •
ROM 6.0 • • 14.5 79.4 • • • • • • • •
RUS 6.9 • • 6.8 86.4 • • • • • • • •
SVK 1.3 • • 4.1 94.6 • • • • • • • •
SVN 4.5 • • 8.5 86.9 • • • • • • • •
SWE 7.1 • • 6.1 86.9 • • • • • • • •
USA 2.2 • • 5.3 92.5 • • • • • • • •
CHAPTER 5 DATA MANAGEMENT AND CONSTRUCTION OF THE CIVED DATABASE

60 IEA CIVIC EDUCATION STUDY TECHNICAL REPORT
Data files at various stages of the study, reflecting different states of dataediting, were submitted to the ICC. First, the student files were submitted thathad been processed completely, followed by teacher and school data. Onceweights were available, the student file was augmented by the correspondingvariables and submitted to the ICC.
In addition to the original data, a student-teacher linkage file had to be created,reflecting the existence of multiple teachers per student. This file, which couldbe matched to both the student data and the teacher data, contained adjustedstudent weights. Here, the weights of all teacher-linkages for one student, whocould have up to three different teachers, added up to one student weight.
COMPUTER SOFTWAREdBase was used as the standard database program for the incoming data. Allsubsequent programs, like diagnostic tools, programs to change the data, toolsto create tables for item statistics or graphics related to this, and programs tocreate summary statistics, were produced in the SAS environment. For itemanalyses, the DPC made use of ACER Quest software (Adams & Khoo, 1996)and ACER ConQuest software (Wu, Adams, & Wilson, 1997).
Since SAS is rarely used by the Civic Education NRCs, all data were convertedinto SPSS format in a final step. These data files were submitted to the ICC forfurther analyses and later dispatched to the NRCs.
SUMMARYThe data processing for the IEA Civic Education Study was a cooperativeprocess involving the NRCs, the IEA DPC, and the ICC. The structures andprocedures implemented for processing data were found to be very successfuland ensured a high quality of the database. The national research centers wereprovided with data entry facilities and detailed guidelines about their use andpossible adaptation. The DPC then implemented complex procedures for datacleaning and editing, reviewed possible data errors, checked file linkages,provided data summary statistics, and successfully created the internationalfully weighted CivEd database consisting of student, teacher, and school data.
REFERENCESAdams, R. J., & Khoo, S. (1996). Quest: The Interactive Test Analysis System (computer program).Camberwell, Vic.: Australian Council for Educational Research.
IEA Civic Education Study. (1999a). Manual for entering the CivEd data (CIVIC Reference No.99–0004). Hamburg: IEA Data Processing Center.
IEA Civic Education Study. (1999b). Manual for entering the CivEd data (CIVIC Reference No.99–0210). Hamburg: IEA Data Processing Center.
Wu, M. L., Adams, R. J., & Wilson, M. R. (1997). ConQuest: Multi-Aspect Test Software (computerprogram). Camberwell, Vic.: Australian Council for Educational Research.

61
Chapter 6:
WEIGHTING PROCEDURESHeiko Sibberns and Pierre Foy
OVERVIEWThe basic sample design used in the IEA Civic Education Study (CivEd) wasthe same as that used in TIMSS 1999—a two-stage stratified cluster design,with schools as the first stage and classrooms as the second. The designrequired schools to be sampled using a probability proportional to size (PPS)systematic method and classrooms to be sampled with equal probabilities. IEACivic Education Study participants adapted the basic design to therequirements of their education systems, with guidance from the CivEdsampling consultants at the IEA Data Processing Center (DPC) and StatisticsCanada. Very large countries could add an extra, preliminary stage, wheredistricts or regions were sampled first, and then schools within districts.Participants used stratifications to improve the precision of their samples whereappropriate. These adaptations could be quite complex, as can be seen from theinformation in Appendix D, which shows how the CivEd design wasimplemented in each country.
While CivEd’s multi-stage stratified cluster design provided the basis for anefficient and manageable data collection in a school environment, it resulted indifferential probabilities of selection for the ultimate sampling elements, thestudents. Consequently, one student in the assessment did not necessarilyrepresent the same proportion of students in the population as another, aswould have been the case with a simple random sampling approach. Toaccount for differential probabilities of selection due to the design and toensure proper survey estimates, CivEd computed a sampling weight for eachparticipating student. The ability to provide proper sampling weights was anessential characteristic of an acceptable sample design in CivEd, sinceappropriate sampling weights were essential for the computation of accuratesurvey estimates. This chapter describes the procedure for calculating samplingweights for the CivEd data.
WEIGHTING PROCEDUREThe weighting procedure required three steps, reflecting the CivEd sampledesign. The first step consisted of calculating a school weight; this alsoincorporated weighting factors from any additional front-end sampling stagessuch as districts or regions. A school-level participation adjustment was thenmade to the school weight to compensate for any sampled schools that did notparticipate. That adjustment was calculated independently for each explicitstratum.
1 This chapter is based on Chapter 11 in the TIMSS 1999 Technical Report (Foy, 2000).
1

62 IEA CIVIC EDUCATION STUDY TECHNICAL REPORT
Mn.mi
N
i =1
In the second step, a classroom weight was calculated. No classroom-levelparticipation adjustment was necessary, since, in most cases, a single classroomwas sampled in each school. If a school agreed to take part in the study but thesampled classroom refused to participate, the non-participation adjustment wasmade at the school level. If one of two selected classrooms in a school did notparticipate, the classroom weight was calculated as though a single classroomhad been selected in the first place. The classroom weight was calculatedindependently for each school.
The third and final step consisted of calculating a student weight. A non-participation adjustment was made to compensate for students who did nottake part in the testing. The student weight was calculated independently foreach sampled classroom. The basic sampling weight attached to each studentrecord was the product of the three intermediate weights: the first stage(school) weight, the second stage (classroom) weight, and the third stage(student) weight. The overall student sampling weight was the product of thesethree weights and the two non-participation adjustments—school level andstudent level.
SAMPLING WEIGHTS
The First Stage (School) Weight
The first stage weight represented the inverse of the first stage selectionprobability assigned to a sampled school. The CivEd sample design requiredthat school selection probabilities be proportional to the school size (PPS),with school size being the enrolment in the target grade. The basic first-stageweight BWsc for the i th sampled school was thus defined as
BW i =where n was the number of sampled schools and mi was the measure of size forthe i th school. M—the total number of students in the stratum underconsideration—was defined as
M =∑mi
where N was the total number of schools in the explicit stratum.
The basic first stage weight also incorporated weighting factors resulting fromany additional front-end sampling stages that were applied. The calculation ofsuch weighting factors was similar to that of the first stage weight, sincegeographical regions were also sampled using the PPS method. The resultingfirst stage weight in such cases was simply the product of the “region” weightand the first stage weight, as described earlier.
In some countries, schools were selected with equal probabilities. Thisgenerally occurred when no reliable measure of school size was available. Insome countries, explicit strata had been defined to deal with very large schoolsor with small schools. In these strata, schools were sampled with equalprobability.
sc

63
Under equal probability sampling, the basic first-stage weight for the i th
sampled school was defined as
BW isc =
where n was the number of sampled schools and N was the total number ofschools in the explicit stratum. The basic weight for all sampled schools in anexplicit stratum was identical in this context.
School Non-Participation Adjustment
First stage weights were calculated for all sampled schools and replacementschools that participated. A school-level participation adjustment was requiredto compensate for schools that were sampled but did not participate and werenot replaced. Sampled schools that were found to be ineligible were removedfrom the calculation of this adjustment. The school-level participationadjustment was calculated separately for each explicit stratum. This adjustment,Asc, was calculated as follows:
Asc =
where ns was the number of originally sampled and participating schools, nr1
and nr2 the number of participating first and second replacement schools, andnnr the number of originally sampled schools that did not participate.
The final first stage weight, FWsc, for the i th school, corrected for non-participating schools, thus became
FW isc
= Asc .BW i
sc
The Second Stage (Classroom) Weight
The second stage weight represented the inverse of the second stage selectionprobability assigned to a sampled classroom. Although almost all CivEdparticipants sampled intact classrooms using equal probability sampling, it alsowas permissible to sub-sample students within classes. Procedures forcalculating sampling weights are presented below for both approaches.
Equal probability weighting: For the i th school, Ci was the total number ofclassrooms and ci the number of sampled classrooms. Using equal probabilitysampling, the final second stage weight assigned to all sampled classrooms inthe i th school was
FW icl1 =
As a rule, ci took the value 1 or 2 and remained fixed for all sampled schools.In those cases where ci took the value 2 and only one of the sampledclassrooms participated, the second stage weight was adjusted by multiplying itby 2.
Nn
ns + nr1 + nr2 + nnr
ns + nr1 + nr2
CHAPTER 6 WEIGHTING PROCEDURES
Ci
ci

64 IEA CIVIC EDUCATION STUDY TECHNICAL REPORT
i,jst
Srs + Snr
Srs
i,jst
1R i,j
st
The Third Stage (Student) Weight
The third stage weight represented the inverse of the third stage selectionprobability attached to a sampled student. Although almost all participantssampled intact classrooms where all eligible students were to be tested, somecountries with large classes took a sub-sample of students from within thesampled classes. Procedures for calculating weights are presented below forboth sampling approaches. The third stage weight was calculatedindependently for each sampled classroom.
Sampling intact classrooms: If intact classrooms were sampled, the basic third stageweight for the j th classroom in the i th school was simply
BW =1.0Sub-sampling students within sampled classrooms: If students were sub-sampledwithin the sampled classrooms, the basic third stage weight for the j th
classroom in the i th school was
BW =
where Ngi was the number of enrolled and eligible students in classroom g andrgi the number of sampled students in this classroom.
Adjustment for Student Non-Participation
The student non-participation adjustment was calculated separately for eachparticipating classroom as follows:
A =Here, Srs was the number of participating students and Snr the number of non-participating students in the sampled classroom. This adjustment is the inverseof the unweighted student participation rate, Rst, for the correspondingclassroom:
A =
The third and final stage weight for the j th classroom in the i th school thusbecame
FW = A .BW
Overall Sampling Weight
The overall sampling weight was simply the product of the final first stageweight, the final second stage weight, and the final third stage weight. Whenintact classrooms were tested, the overall sampling weight was
W = A .BW .FW . A .BWor
W = FW .FW .FWIt is important to note that sampling weights varied by school and classroom,but that students within the same classroom had the same sampling weights.
Ngi
rgi
i,jst l
i,jsc
isc
i,jcl l
i,jst
i,j isc
i,jst l
i,jcl l
i,jc/l
i,jst l
i,jst l
i,jst
i,jst l

65
PARTICIPATION RATESSince lack of participation by sampled schools or students could lead to bias inthe results, a variety of participation rates were computed to reveal howsuccessful countries had been in securing participation from their sampledschools. To monitor school participation, three school participation rates werecomputed: originally sampled schools only; sampled and first replacementschools; and sampled and both first and second replacement schools. Inaddition, student and overall participation rates were computed.
Unweighted School Participation Rates
Two unweighted school participation rates were computed:
R = unweighted school participation rate for originally sampledschools only
R = unweighted school participation rate, including sampled, first, andsecond replacement schools.
Each unweighted school participation rate was defined as the ratio of thenumber of participating schools to the number of originally sampled schools,including any ineligible schools. The rates were calculated as follows:
R =
R =
Unweighted Student Participation Rate
The unweighted student participation rate for j classrooms within i schools wascomputed as follows:
R =
Unweighted Overall Participation Rates
Two unweighted overall participation rates were computed for each country.They were as follows:
R = unweighted overall participation rate for originally sampledschools only
R = unweighted overall participation rate, including sampled, first,and second replacement schools.
For each country, the overall participation rate was defined as the product ofthe unweighted school participation rate and the unweighted studentparticipation rate. They were calculated as follows:
R = R .R
R = R .R
CHAPTER 6 WEIGHTING PROCEDURES
sc–sunw
sc–r2unw
ns
ns + nr1 + nr2 + nnr
sc–sunw
ns + nr1 + nr2
ns + nr1 + nr2 + nnr
sc–r2unw
stunw
∑s
∑s + ∑s
i, jrs
i, ji, jrs
i, jnr
i, j i, j
ov–sunw
ov–r2unw
ov–sunw
sc–sunw
stunw
ov–r2unw
sc–r2unw
stunw

66 IEA CIVIC EDUCATION STUDY TECHNICAL REPORT
Weighted School Participation Rates
In TIMSS 1995, the weighted school-level participation rates were computedusing school sampling frame information. However, as in TIMSS 1999, theIEA Civic Education Study used student-level information. This alternatemethod has two advantages:
1. All data users can easily replicate school participation rates since all requireddata are available from the international database.
2. These rates more accurately reflect the current size of the target populationbecause they rely on up-to-date within-school sampling information.
The TIMSS 1995 method relied on school data as reported on the samplingframe (see Dumais, 1998; Foy, Rust, & Schleicher, 1996), which often were notup to date with regard to current school enrolment. However, both methods areequivalent when assuming an up-to-date sampling frame, and so should yieldcomparable results in practice.
Two weighted school-level participation rates were computed using thealternate method. They were as follows:
R = weighted school participation rate for originally sampledschools only
R = weighted school participation rate, including sampled, first,and second replacement schools.
The weighted school participation rates were calculated as follows:
R =
R =
Here, both the numerator and denominator were summations over allresponding students, and the appropriate classroom-level and student-levelsampling weights were used. Note that the basic school-level weight appears inthe numerator, whereas the final (adjusted) school-level weight appears in thedenominator.
The denominator remains unchanged in both equations and is the weightedestimate of the total enrolment in the target population. The numerator,however, changes from one equation to the next. Only students from originallysampled schools were included in the first equation; students from first andsecond replacement schools were added in the second equation.
sc–swtd
sc–r2wtd
sc–swtd
isc
i, j
si, jclx
i, jstx
isc
i, j
s+r1+r2i, jclx
i, jstx
sc–r2wtd
isc
i, j
i, jclx
i, jstx
isc
i, j
s+r1+r2i, jclx
i, jstx
s+r1+r2
∑BW .FW .FW
∑ FW .FW .FW
∑ BW .FW .FW
∑ FW .FW .FW

67CHAPTER 6 WEIGHTING PROCEDURES
ov–swtd
ov–r2wtd
ov–swtd
sc–swtd
stwtd
ov–r2wtd
sc–r2wtd
stwtd
Weighted Student Participation Rate
The weighted student response rate was computed as follows:
R =
Here, both the numerator and denominator were summations over allresponding students, and the appropriate classroom-level and student-levelsampling weights were used. Note that the basic student weight appears in thenumerator, whereas the final student weight appears in the denominator.Furthermore, the denominator in this formula was the same quantity thatappeared in the numerator of the weighted school-level participation rate forall participating schools, including originally sampled and replacement schools.
Weighted Overall Participation Rates
Two weighted overall participation rates were computed. They were asfollows:
R = weighted overall participation rate for originally sampledschools only
R = weighted overall participation rate, including sampled, first,and second replacement schools.
The weighted overall participation rate was defined as the product of theappropriate weighted school participation rate and the weighted studentparticipation rate. They were computed as:
R = R .R
R = R .R
SUMMARYThe multi-stage nature of the CivEd sampling design meant that students weresampled with varying probabilities. Consequently, if statistics computed fromthe sample data were to accurately reflect population values, the CivEdsampling weights had to be used when analyzing the data.
REFERENCESDumais, J. (1998). Implementation of the TIMSS sampling design. In M. O. Martin & D. L.Kelly (Eds.), TIMSS technical report, volume III: Implementation and analysis—final year of secondaryschool (pp. 15–35). Chestnut Hill, MA: Boston College.
Foy, P. (2000). Sampling weights. In M. O. Martin, K. D. Gregory, & S. E. Stemler (Eds.),TIMSS 1999 technical report (pp. 189–200). Chestnut Hill, MA: Boston College.
Foy, P., Rust, K., & Schleicher, A. (1996). Sample design. In M. O. Martin & D. L. Kelly (Eds.),TIMSS technical report, volume I: Design and development (pp. 4.1–4.17). Chestnut Hill, MA: BostonCollege.
stwtd
isc
i, j
i, jclx
i, jstx
i, j
s+r1+r2i, jclx
i, jstx
s+r1+r2
∑ BW .FW .BW
∑ FW .FW .FWisc

68 IEA CIVIC EDUCATION STUDY TECHNICAL REPORT
69
Chapter 7:
SCALING PROCEDURES FORCOGNITIVE ITEMSWolfram Schulz and Heiko Sibberns
OVERVIEWThis chapter describes the procedures used to scale the test items in the IEACivic Education Study (CivEd) that were administered to assess the domains ofcivic content knowledge, skills in interpreting political communication, and economicliteracy (upper secondary students only). These procedures comprised thefollowing steps:
• Analysis of dimensionality to determine the existence of sub-dimensions.
• Calibration of test items within participating countries and review of itemstatistics.
• Analysis of country-by-item interaction to safeguard the appropriateness oftest items across participating countries.
• Adjudication of items based on national and international item statistics.
• Calibration of international items parameters.
• Subsequent scaling of test items using the international item parameters andtransformation of maximum likelihood (logit) scores into an internationalmetric.
The two basic reports on the IEA Civic Education Study (Amadeo, Torney-Purta, Lehmann, Husfeldt, & Nikolova, 2002; Torney-Purta, Lehmann,Oswald, & Schulz, 2001) contain appendices that lay out the contentframework around which the test was developed and serve as a reference forthe topics of individual items.
THE SCALING MODELThe tests used in the IEA Civic Education Study consisted of 38 multiple-choice items for the standard population of 14-year-old students and 43multiple-choice items for the older population of upper secondary students.Sixteen items used for the assessment of the 14-year-old students were alsoincluded in the test for the upper secondary students to provide a link betweenboth tests that would allow reporting of students’ test scores for the twoassessments on the same international metric.
Each multiple-choice item consisted of four answer categories, one with thecorrect response and three with incorrect responses (distracters). For scalingpurposes, correct answers were coded as 1, and incorrect and not-attempteditems as 0. The IRT One-Parameter Model (Rasch, 1960) for dichotomous datadescribes the probability of scoring 1 rather than 0 depending on the ability

70 IEA CIVIC EDUCATION STUDY TECHNICAL REPORT
n. This is modeled as
Pi() =
where Pi() is the probability of person n to score 1 on item i.
n is the ability
of person n and i the difficulty of item i.
Maximum likelihood (ML) estimates of ability are produced by maximizing theabove equation with respect to
n , that is, solving the likelihood expressions
∑ r – ∑ = 0
for each case n, where rx is the sum score obtained from a set of k items. This
can be achieved by applying the Newton-Raphson method.1 However, solvingthe above equation does not provide estimates for zero or perfect scores, that is,no estimates will be obtained for students with no correct answers or thosewho have answered all test items correctly.2 Therefore, a small constant of .3was added to the lowest category, and the same quantity was subtracted fromthe maximum scores in order to obtain estimates for these cases.3
The international item parameters were estimated with ACER ConQuest (Wu,Adams, & Wilson, 1997), using marginal maximum likelihood estimation.Here, item difficulty parameters are estimated conditional on the assumeddistribution of abilities in a population; the likelihood depends on the itemparameter and the parameters of the ability distribution with mean µ andstandard deviation . ACER ConQuest was used for the estimation of theinternational item parameters and the ML ability estimates.4
In the one-parameter Rasch model, each raw score corresponds to one abilityestimate, so that the percentage of correct answers in a single test design—aswas used in the IEA Civic Education Study—typically shows a very highcorrelation with ML estimates. However, using the Rasch model instead of thepercentage of correct answers or simple raw scores has the followingadvantages:
• The use of an IRT scaling model enables the researcher to apply a widerrange of scaling analysis, including the assessment of item fit and theanalysis of differential item functioning.
• Items with problematic item characteristics in one or more countries can beomitted in the scaling of the respective student data sets withoutjeopardizing the comparability of the results.
• In regard to the IEA Civic Education Study, the use of link items allowedcomparable proficiency estimates for both populations to be estimated from
exp (n – i )
1 + exp (n – i )
i Ω j=1
k exp (n – i )
1 + exp (n – i )
1 This method is described in detail in Hambleton and Swaminathan (1985).2 In the survey of 14-year-olds, the percentage of students with zero scores was negligible and only an
average of one percent had perfect scores. Similar figures were found in the survey of upper secondarystudents.
3 An alternative would have been the use of weighted likelihood estimation (see Warm, 1989), whichprovides ability estimates for zero and perfect scores.
4 For the national sub-samples, items were calibrated with the scaling software ACER Quest, which usesunconditional maximum likelihood (see Adams & Khoo, 1996).

71
the whole set of available test items. Comparing percentages of correctanswers or raw scores would have limited reporting to the common subset ofitems used in both assessments.
The ML estimates reported in this study are attenuated, that is, they do includemeasurement error. Furthermore, a well-known property of ML estimates isthat they are biased to a certain extent. In particular, variances tend to beoverestimated when this kind of ability estimate is used. More sophisticatedtechniques, like the computation of so-called plausible values that are drawnfrom an expected distribution based on the scaling model and other availablebackground information (conditioning variables), usually provide betterpopulation estimates and are used in international assessments like TIMSS andPISA (see Adams, 2002; Adams, Wu, & Macaskill, 1997; Mislevy, 1991).However, within the scope and timelines of the IEA Civic Education Study, itwas not possible to apply more complex scaling methods.
ANALYSIS OF TEST DIMENSIONALITYThe civic knowledge test for the 14-year-old students consisted of twodifferent types of items: those aiming primarily at content knowledge and thosedesigned to measure skills in interpreting political communication. In addition, thecivic knowledge test for the upper secondary students used a third type of itemto assess economic literacy. Consequently, it was necessary to analyze thedimensionality of test items to find out whether sub-scales could be reported inaddition to a combined total civic knowledge scale.
Confirmatory factor analyses (CFA) with structural equation modeling (SEM)of the dimensional item structure were presented in the international reports.The LISREL program (Jöreskog & Sörbom, 1993) was used for the parameterestimation, and graphical displays were included to illustrate the relationshipbetween latent dimensions and items (Amadeo et al., 2002, p. 49; Torney-Purtaet al., 2001, p. 61).
In addition to the CFA, multi-dimensional IRT models were estimated usingthe ACER ConQuest software (see Wu et al., 1997, pp. 85ff ), which are moreappropriate for the analysis of dichotomous test items. Table 7.1 shows thelatent correlations between factors as derived from the multi-dimensional IRTmodels and the respective changes in deviances and degrees of freedom thatillustrate the model fit. The estimated latent correlations are similar to thoseobtained from the CFA with structural equation modeling. Furthermore, thedifference in deviance and its corresponding degrees of freedom5 indicates thatfor both populations the multi-dimensional models provide a significantlybetter model fit than the alternative one-dimensional models.
The results of the analysis of item dimensionality indicated that bothdimensions referred to highly similar but not identical components of studentperformance. Therefore, it was decided to report content knowledge andinterpretative skills as sub-scales in addition to the combined civic knowledgescale.
5 The deviance is a statistic that indicates how well the item response model fits the data. Whencomparing the fit for two different models, this value can be compared to a chi-square distribution,where the degrees of freedom are equal to the difference in the number of parameters to be estimatedfor each model.
CHAPTER 7 SCALING PROCEDURES FOR COGNITIVE ITEMS

72 IEA CIVIC EDUCATION STUDY TECHNICAL REPORT
Table 7.1 Latent correlations between sub-dimensions of civic knowledge
14-year-old Students Upper Secondary Students
Latent correlation between...
Content knowledge and .925 .943interpretative skills
Economic literacy and – .890content knowledge
Economic literacy and – .929interpretative skills
Deviance for...
One-dimensional model 570,045 316,998
Multi-dimensional model 569,557 317,493
Model fit
Difference in deviance 488 494
Degrees of freedom 2 5
N of cases 14,000 8,000
Note: ACER ConQuest estimates for the international calibration sample of 14-year-olds.
Although the estimated latent correlations between content knowledge andinterpretative skills were very high, the results showed that both dimensionsreferred to highly similar but not identical components of student performance.Therefore, it was decided to report two sub-scales in addition to the combinedcivic knowledge scale. Given that economic literacy was not generally regardedas part of civic education and that it also had a lower correlation with contentknowledge, this item type was not included in the combined civic knowledgescale, and the results on economic literacy were reported separately for theupper secondary students.
ITEM ANALYSISThe scaling properties of the test items were reviewed at two levels:
• At the international level, analyses were based on the internationalcalibration sample, with 500 students randomly selected from each country.
• At the national level, within-country item analysis based on the country datasets indicated whether a test item had been translated correctly and whetherit was appropriate for the national context of a country.
Items should have a good discrimination, that is, the correct answer to a testquestion needs to be highly correlated with the ability measured by a test.Conversely, the distracters used in a multiple-choice question should benegatively correlated. Test items should also cover a suitable range of abilitiesin the target population; test questions that are too hard or too easy do notcontribute sufficiently to the estimation of ability.
The goodness of fit for individual test items can be determined by calculating amean square statistic (MNSQ ) (Wright & Masters, 1982), which can beobtained from the standardized residuals

73
where xi is the observed scores on item i, E(x
i ) the expected scores according
to the Rasch model, and wi the variance of item i. The variance for a
dichotomous test item is calculated as
where Pin is the probability for person n to answer item i correctly, and Ndenotes the number of test respondents. An unweighted (outfit) mean squarestatistic, ui, can be obtained from
As this statistic is likely to be affected by outliers, a weighted (infit) MNSQstatistic v
i is used, which is calculated as
where the sum of standardized residuals zi is weighted by the item variance wi.
Values greater than 1.2 are typically viewed as an indication of poor item fit,whereas values below .8 indicate a discrimination that is considerably higherthan expected. So-called item characteristic curves (ICCs) are plots of theaverage percentage of correct answers for ability groups against their expectedperformance on an item, and give additional graphical information on item fit.
The item statistics that were used for the item review at the national level werecomputed with the ACER QUEST software. The item analysis at theinternational level, however, was done with the ACER ConQuest program. Thefit statistics provided by this software have a similar interpretation but theircomputation differs from the one outlined above (see Wu et al., 1997, p. 140ff ).
International Item Analysis and Calibration
Figure 7.1 shows how the difficulty of test items developed to measure civicknowledge corresponded to the estimated latent abilities in the targetpopulation of 14-year-old students (ACER ConQuest estimates). The overalltest was relatively easy but still covered an appropriate range of abilities.
The match was less satisfactory for the upper secondary students (see Figure7.2). This was partly due to the need to use items from the test designed for14-year-olds in order to obtain comparable ability scores. Furthermore, it wasobvious that there were not sufficient items to describe higher levels of civicknowledge in this population. A closer match between abilities and test itemswas achieved for economic literacy (see Figure 7.3). However, the limitednumber of items places some constraints on the description of abilities in thisdomain.
zi =xi – E(xi )
wi
wi = ∑ Pin (1 – Pin )
N
n=1
2N
n=1ui = ∑ zi
2
vi =N
n=1
N
n=1
CHAPTER 7 SCALING PROCEDURES FOR COGNITIVE ITEMS
∑ wizi
∑ wi

74 IEA CIVIC EDUCATION STUDY TECHNICAL REPORT
Figure 7.1 Latent ability estimates and item thresholds for the total civic knowledgetest items (14-year-old students)
|
5 |
|
|
|
|
|
X |
4 |
X |
X |
XX |
XX |
XXX |
3 XXXXXXX |
XXXXXXXX |
XXXXXX |
XXXXXXXX |
XXXXXXXXXXXX |
XXXXXXXXXXXXXX |
XXXXXXXXXXXXXX |
2 XXXXXXXXXXXXXX |
XXXXXXXXXXXXXXXXXXXXXX |
XXXXXXXXXXXXXXXXXXXXX |
XXXXXXXXXXXXXXXXXXXXX |
XXXXXXXXXXXXXXXXXXXXXXXXXX | 34
XXXXXXXXXXXXXXXXXXXXXXXXXXXXXXX |
XXXXXXXXXXXXXXXXXXXXXXXXXXXXX |
1 XXXXXXXXXXXXXXXXXXXXXXXXXXXXXXXXXXX | 22
XXXXXXXXXXXXXXXXXXXXXXXXXXXXX | 21
XXXXXXXXXXXXXXXXXXXXXXXXX | 27 38
XXXXXXXXXXXXXXXXXXXXXXXXXXXXX | 15 17 26
XXXXXXXXXXXXXXXXXXXXXXXXXXXXXX | 29 31
XXXXXXXXXXXXXXXXXXXXXXXXXXXXXXXX | 18 36
XXXXXXXXXXXXXXXXXXXXXXXXXXXXXXXXXXXXXXXX | 10 14 25 28
0 XXXXXXXXXXXXXXXXXXXXXXXXXXXXXXXX | 5 8 19 30
XXXXXXXXXXXXXXXXXXXXXXXXXXX | 23 32
XXXXXXXXXXXXXXXXX | 4 7 13 35
XXXXXXXXXXXXXXXXXXX | 9 24
XXXXXXXXXXXXXXXXXXXXXX | 11 12 37
XXXXXXXXXXXXX | 3 6
XXXXXXXXXXX | 2 20 33
-1 XXXXXXXXX | 1
XXXXXX |
XXXX |
XXX | 16
XX |
XX |
X |
-2 |
|
|
|
|
|
|
-3 |
|
Note: ACER ConQuest estimates of latent ability distribution and test item thresholds (rp =.5) for the international
calibration sample of 14-year-olds.

75
Figure 7.2 Latent ability estimates and item thresholds for the total civic knowledgetest items (upper secondary students)
|
6 |
|
|
|
|
|
5 X |
|
X |
X |
XX |
XX |
XXX |
4 XXXXXXX |
XXXXXXX |
XXXXXX |
XXXXXXXX |
XXXXXXXXXXXX |
XXXXXXXXXXXXXXX |
3 XXXXXXXXXXXXXX |
XXXXXXXXXXXXXXX |
XXXXXXXXXXXXXXXXXXXXXXXX |
XXXXXXXXXXXXXXXXXXXXXXX |
XXXXXXXXXXXXXXXXXXXXXXXXX |
XXXXXXXXXXXXXXXXXXXXXXXXXXXXXXXX |
2 XXXXXXXXXXXXXXXXXXXXXXXXXXXXXXXXXXXX |
XXXXXXXXXXXXXXXXXXXXXXXXXXXXXXXXX |
XXXXXXXXXXXXXXXXXXXXXXXXXXXXXXXXXXXXXXXX |
XXXXXXXXXXXXXXXXXXXXXXXXXXXXXXXXXX |
XXXXXXXXXXXXXXXXXXXXXXXXXXX |
XXXXXXXXXXXXXXXXXXXXXXXXXXXXXX | 9
XXXXXXXXXXXXXXXXXXXXXXXXXXXXXXX | 19
1 XXXXXXXXXXXXXXXXXXXXXXXXXXXXXXXX |
XXXXXXXXXXXXXXXXXXXXXXXXXXXXXXXXXXXXXX |
XXXXXXXXXXXXXXXXXXXXXXXXXXXXXX | 10 15 17 21
XXXXXXXXXXXXXXXXXXXXXXXXXX | 20 22 25
XXXXXXXXXXXXXXXX | 5 14 18 23
XXXXXXXXXXXXXXXXXX | 7 13
0 XXXXXXXXXXXXXXXXXXXX | 26
XXXXXXXXXXXX | 6
XXXXXXXXXXXX | 11 24
XXXXXXXXXX | 12
XXXXXXXX | 3
XXXX | 4 16
-1 XXXX |
XXX |
XXX |
X | 1 8
X |
X | 2
|
-2 X |
|
|
|
|
|
-3 |
Note: ACER ConQuest estimates of latent ability distribution and test item thresholds (rp=.5) for the international
calibration sample of upper secondary students.
CHAPTER 7 SCALING PROCEDURES FOR COGNITIVE ITEMS

76 IEA CIVIC EDUCATION STUDY TECHNICAL REPORT
Figure 7.3 Latent ability estimates and item thresholds for economic literacy testitems (upper secondary students)
|
5 |
|
|
|
|
|
4 X |
|
X |
XX |
XX |
X |
XXX |
3 XXXXXXX |
XXXXXXXX |
XXXXXX |
XXXXXXXX |
XXXXXXXXXXXXX |
XXXXXXXXXXXXXXX |
XXXXXXXXXXXXXX |
2 XXXXXXXXXXXXXXXX |
XXXXXXXXXXXXXXXXXXXXXXXX |
XXXXXXXXXXXXXXXXXXXXXXXXX |
XXXXXXXXXXXXXXXXXXXXXXXXXX |
XXXXXXXXXXXXXXXXXXXXXXXXXXXXXX |
XXXXXXXXXXXXXXXXXXXXXXXXXXXXXXXXXXXX | 10
1 XXXXXXXXXXXXXXXXXXXXXXXXXXXXXXXXXXX |
XXXXXXXXXXXXXXXXXXXXXXXXXXXXXXXXXXXXXXX |
XXXXXXXXXXXXXXXXXXXXXXXXXXXXXXXXXX | 7
XXXXXXXXXXXXXXXXXXXXXXXXXX | 14
XXXXXXXXXXXXXXXXXXXXXXXXXXXXXXX |
XXXXXXXXXXXXXXXXXXXXXXXXXXXXXXX | 9
XXXXXXXXXXXXXXXXXXXXXXXXXXXXXXXXXX | 4
0 XXXXXXXXXXXXXXXXXXXXXXXXXXXXXXXXXXXXXXXX | 8
XXXXXXXXXXXXXXXXXXXXXXXXXXXXXXX | 2 5 13
XXXXXXXXXXXXXXXXXXXXXXXXXXXX | 11 12
XXXXXXXXXXXXXXXXX | 3
XXXXXXXXXXXXXXXXXXX | 1 6
XXXXXXXXXXXXXXXXXXXXX |
XXXXXXXXXXXX |
-1 XXXXXXXXXX |
XXXXXXXXX |
XXXXXXX |
XXXX |
XXXX |
XXX |
-2 XXX |
X |
X |
X |
X |
X |
|
-3 |
|
|
|
|
Note: ACER ConQuest estimates of latent ability distribution and test item thresholds (rp =.5) for the international
calibration sample of upper secondary students.

77
Figures 7.4 and 7.5 show the ICCs for test items 21 and 27 that had thehighest weighted MNSQ values in the civic knowledge test for the uppersecondary students. These items had a relatively low discrimination. Asillustrated by the ICC plots, for both test items the observed ICCs were slightlyshallower than the expected ones, that is, the percentages of correct answerswere higher than expected for low achievers but lower than expected for moreknowledgeable students. However, the item fit for both items was still withinthe acceptable range at the international level.
Figure 7.4 Item characteristic curve of test item number 21 (weighted MNSQ = 1.07)
Figure 7.5 Item characteristic curve of test item number 27 (weighted MNSQ = 1.03)
543210-1-2-3-4-5
ObservedTHETA
ExpectedTHETA
1.0
.5
0
543210-1-2-3-4-5
ObservedTHETA
ExpectedTHETA
1.0
.5
0
An additional criterion for the use of a test item on the international level wasan acceptable item fit in more than 20 of the 28 participating countries. All 38items used in the civic knowledge test for the 14-year-olds met this criterionand were included in the international item calibration. Three items used in theassessment of the upper secondary students did not meet this criterion andwere excluded from scaling.
CHAPTER 7 SCALING PROCEDURES FOR COGNITIVE ITEMS
78 IEA CIVIC EDUCATION STUDY TECHNICAL REPORT
National Item Analyses and Item Adjudication
In addition to the international item analyses, a number of diagnostic statisticswere computed for each item in each country. These statistics were carefullyreviewed for any occurrence of unusual item behavior. The following indicatedproblematic item characteristics.
• An item was found to be relatively easier or harder than expected.
• The discriminating power of an item, as measured by its correlation with theoverall score, was unusually low.
• An item did not meet the minimum requirements for fit statistics.
Whenever any of the above happened, the test booklets were reviewed forpossible translation or printing problems, and, when necessary, the NRC wasconsulted. In addition, NRCs were asked to advise on whether a problematicitem might be inappropriate for their national context. Items that were detectedto have a flaw in a country were removed from the database for that country.
The basic statistics for the item review were calculated at the IEA DataProcessing Center (DPC) and summarized in tabular and graphical form.6 Itemstatistics were calculated for each of the 28 countries participating in the studyof the 14-year-old students and for each of the 16 countries7 participating inthe study of the upper secondary students. If a country tested more than onegrade, separate analyses for each grade were performed. For each item, thebasic item analyses display included the following information (for an example,see Table 7.2):
• The number of students who responded in each country.
• The difficulty level (percentage of students that answered that itemcorrectly).
• The discrimination index (point biserial correlation between success and thetotal score).
• The percentage of students that chose each option, including the percentagesfor omitting, not reached, and invalid answers.
• The point biserial correlation between each option and the total score.
• Preliminary Rasch results.
• The average item difficulty and the average item discrimination.
The item review tables contained the following statistics:
• N (correct answers): This is the number of students to whom the item wasadministered. If the item had not been attempted due to lack of time, thestudent data were coded as incorrect for the item analyses.
• DIFF (correct answers): The item difficulty was the percentage of students thatprovided a correct response to that item. When computing this statistic, notreached items were treated as wrong.
6 For the upper secondary students, the item statistics were prepared at the IEA InternationalCoordinating Center.
7 Note that among these countries, data for Colombia and Hong Kong (SAR) were not included in thetables of the international report due to missing student weights.

79CHAPTER 7 SCALING PROCEDURES FOR COGNITIVE ITEMS
Pop
ulat
ion:
‘2’
Sca
le: A
LL
CO
L1
and
CO
L 2
I
tem
: BS
101
Lab
el: R
OL
E O
F C
ITIZ
EN
IN
DE
MO
CR
. CO
UN
TR
Y
Pag
e 1
Cor
rect
Ans
wer
Per
cent
ages
for
Eac
h A
lter
nati
veP
oint
Bis
eria
ls f
or E
ach
Alt
erna
tive
Ras
chG
roup
Dif
ficu
ltie
sIn
tern
. Mea
nC
OU
NT
RY
ND
IFF
DIS
CR
FL
AG
SA
BC
DW
OM
ITN
RA
BC
DW
OM
ITN
RR
DIF
FS
EF
IT I
DIF
FID
ISC
R
AU
S1
3301
84.4
.37
...q.
......
.8.
284
.4*
3.9
2.6
0.0
0.8
0.0
-.21
.37*
-.23
-.15
.00
-.10
.00
-1.2
10.
051.
03.
..
.82
.3.3
7B
FR
120
7479
.8.4
0...
q....
....
11.2
79.8
*4.
82.
70.
11.
40.
0-.
22.4
0*-.
23-.
17.0
0-.
12.0
0-1
.11
0.06
0.97
..
..
82.3
.37
BG
R1
2854
86.7
.34
...q.
......
.5
.886
.7*
4.4
2.6
0.0
0.5
0.0
-.17
.34*
-.25
-.12
.00
-.07
.00
-1.6
50.
060.
97.
..
.82
.3 .3
7C
HL
156
7753
.3.4
1...
......
...17
.253
.3*
11.3
14.7
0.0
3.5
0.0
-.16
.41*
-.23
-.14
.00
-.13
.00
0.17
0.03
1.05
..
. .
82.3
.37
CO
L1
5038
36.4
.28
....Q
...F.
..43
.936
.4*
9.0
8.3
0.0
2.4
0.0
-.14
.28*
-.13
-.06
.00
-.07
.00
0.54
0.03
1.14
..
. .
80.4
.37
CY
P1
3093
82.0
.39
...q
......
..10
.782
.0*
1.9
4.8
0.0
0.5
0.0
-.24
.39*
-.22
-.19
.00
-.07
.00
-0.5
70.
050.
99.
..
.82
.3.3
7C
ZE
135
9993
.7.3
8...
q....
....
2.8
93.7
*1
.61
.80
.00
.10
.0-.
24.3
8*-.
19-.
21.0
0-.
05.0
0-1
.75
0.07
0.91
..
. .
82.3
.37
DE
U1
3750
82.4
.36
...q.
......
.7.
982
.4*
2.5
3.8
0.7
2.7
0.0
-.16
.36*
-.17
-.20
-.09
-.15
.00
-1.1
30.
051.
00.
..
.82
.1 .3
7D
NK
131
9177
.2.4
4...
q....
....
12.6
77.2
*7.
50.
8 0
.02.
00.
0-.
24.4
4*-.
25-.
11.0
0-.
20.0
0-0
.80
0.05
1.00
..
. .
80.5
.37
DN
K2
2653
84.0
.41
...q.
......
.9.
884
.0*
4.9
0.8
0.0
0.6
0.0
-.25
.41*
-.26
-.13
.00
-.12
.00
-0.9
00.
061.
01.
..
.80
.5.3
7E
NG
130
1175
.1.3
6...
q....
....
16.1
75.1
*4.
62.
90.
01.
30.
0-.
21.3
6*-.
23-.
12.0
0-.
10.0
0-0
.64
0.05
1.06
..
. .
82.1
.37
EST
134
1882
.4.3
3...
q....
....
13.8
82.4
*1
.51
.30
.10
.90
.0-.
26.3
3*-.
12-.
11-.
03-.
09.0
0-1
.33
0.05
0.98
..
. .
82.3
.37
FIN
130
0487
.5 .4
2...
q....
....
7.5
87.5
*2.
02.
40.
20.
40.
0-.
29.4
2*-.
20-.
14-.
11-.
12.0
0-1
.08
0.06
0.94
..
. .
82.3
.37
FIN
229
4293
.3.3
8...
q....
....
3.8
93.3
*1.
11.
20.
10.
50.
0-.
24.3
8*-.
21-.
14-.
03-.
14.0
0-1
.41
0.08
0.95
..
. .
82.3
.37
GR
C1
3711
84.8
.41
...q.
......
.11
.084
.8*
1.2
2.7
0.0
0.4
0.0
-.29
.40*
-.19
-.19
.00
-.07
.00
-0.8
90.
050.
97.
..
.82
.3.3
7H
KG
149
9379
.6.3
4...
q....
F...
11.5
79.6
*7.
01.
60.
00.
30.
0-.
16.3
4*-.
27-.
11 .0
0-.
07.0
0-0
.73
0.04
1.15
..
. .
80.5
.37
HU
N1
3160
93.8
.29
...q.
......
.4
.193
.8*
1.2
0.7
0.0
0.1
0.0
-.20
.29*
-.17
-.11
.00
-.04
.00
-2.1
80.
080.
96.
..
.82
.3.3
7IT
A1
3808
80.8
.36
...q.
......
.14
.780
.8*
1.6
2.7
0.0
0.2
0.0
-.25
.36*
-.17
-.19
.00
-.04
.00
-0.6
00.
051.
04.
..
.82
.3 .3
7IT
A2
3300
78.8
.36
...q.
......
.15
.478
.8*
2.2
3.4
0.0
0.2
0.0
-.24
.36*
-.19
-.19
.00
-.03
.00
-0.7
50.
051.
03.
..
.82
.3.3
7LT
U1
3494
80.7
.36
...q.
......
.13
.780
.7*
2.3
1.8
0.0
1.5
0.0
-.26
.36*
-.16
-.12
.00
-.11
.00
-1.2
60.
050.
98.
..
.82
.3.3
7LV
A1
2840
83.6
.36
...q.
......
.9
.383
.6*
2.6
3.4
0.0
1.2
0.0
-.23
.36*
-.17
-.18
.00
-.08
.00
-1.5
10.
050.
96.
..
.82
.3.3
7N
OR
133
2579
.5.4
3...
q....
....
11.4
79.5
*4.
13.
40.
51.
10.
0-.
25.4
3*-.
22-.
19-.
07-.
10.0
0 -
0.72
0.05
0.99
..
. .
82.3
.37
NO
R2
1016
83.7
.46
...q.
......
.9.
583
.7*
3.4
1.9
0.1
1.4
0.0
-.31
.46*
-.25
-.11
.01
-.17
.00
-0.
650.
090.
96.
..
.82
.3.3
7P
OL
137
5993
.2.3
2...
q....
....
3.9
93.2
*0
.71
.80
.00
.30
.0-.
23.3
2*-.
13-.
16 .0
0-.
06.0
0-1
.88
0.07
0.96
..
. .
80.8
.37
PR
T1
3234
62.9
.39
......
......
14.4
62.9
*10
.411
.30
.10
.90
.0 -
.11
.39*
-.25
-.22
-.06
-.04
.00
-0.0
7 0
.04
1.02
..
. .
82.3
.37
PR
T2
3162
74.5
.45
......
......
11.1
74.5
*6
.57
.20
.00
.70
.0-.
20.4
5*-.
26-.
23-.
02-.
10.0
0-0
.09
0.05
0.96
..
. .
82.3
.37
RO
M1
3031
82.6
.39
...q
......
..6.
382
.6*
3.2
7.6
0.1
0.2
0.0
-.20
.39*
-.18
-.24
-.06
-.06
.00
-1.5
40.
050.
94.
..
.82
.3.3
7R
US
121
2983
.3.3
5 ..
.q...
.....
9.1
83.3
*5.
31.
80.
00.
50.
0-.
20.3
5*-.
23-.
15.0
0-.
02.0
0-1
.25
0.06
1.02
..
. .
82.3
.37
SV
K1
3554
96.1
.26
P..q
......
..2
.396
.1*
0.6
0.9
0.0
0.1
0.0
-.19
.26*
-.08
-.15
.00
-.01
.00
-2.2
70.
090.
97.
..
.82
.3.3
7S
VN
130
8192
.7.2
9 ..
.q...
.....
2.8
92.7
*1.
52.
40.
00.
60.
0-.
17.2
9*-.
16-.
16.0
2-.
06.0
0-2
.06
0.07
0.96
..
. .
82.3
.37
SW
E1
3157
72.6
.41
...q.
......
.17
.972
.6*
5.6
2.7
0.3
0.9
0.0
-.22
.41*
-.25
-.18
-.06
-.08
.00
-0.4
90.
041.
03.
..
.80
.5.3
7S
WE
231
1079
.3.4
4...
q....
....
13.5
79.3
*3
.82
.50
.40
.50
.0-.
27.4
4*-.
27-.
17-.
06-.
09.0
0-0
.56
0.05
1.02
..
. .
80.5
.37
US
A1
2802
75.1
.37
......
......
12.5
75.1
*6
.35
.90
.00
.30
.0-.
23.3
7*-.
16-.
18.0
0-.
05.0
0-0
.37
0.05
1.10
..
. .
82.3
.37
Tabl
e 7.
2 E
xam
ple
of s
tati
stic
s fo
r it
em r
evie
w (
Item
1, 1
4-ye
ar-o
ld s
tude
nts)

80 IEA CIVIC EDUCATION STUDY TECHNICAL REPORT
• DISCR (correct answers): The item discrimination was computed as thecorrelation between correctly answering the item and the total score. Thiscorrelation should always be moderately positive for items with goodmeasurement properties.
• ALTERNATIVES A, B, C, D (percentages): These represent the percentage ofstudents choosing each response option for the item. Not reached items wereincluded in the denominator for these calculations.
• W (percentages): This was the percentage of students that provided an invalidresponse to a multiple-choice item. Invalid responses were typically the resultof choosing more than one response option.
• OMIT (percentages): This was the percentage of students who did not providea response to the item. Not reached items were included in the denominatorfor these calculations.
• NR (percentages): This is the percentage of students who did not reach theitem. An item was coded as not reached if there was no response to any ofthe items following it and if the response to the preceding item had beenomitted.
• ALTERNATIVES A, B, C, D (point biserials): These present the correlationbetween choosing each of the response options A, B, C, or D and the totalscore. Items with good psychometric properties have zero or negativecorrelations for the distracter options (the incorrect answers) and positivecorrelations for the correct answers. The point biserials were not correctedfor auto-correlation, that is, the total score was not reduced by the value forthe item under consideration.
• W (point biserials): This presents the correlation between an invalid response(usually caused by selecting more than one response option) and the totalscore. This correlation should always be negative or zero.
• OMIT (point biserials): This is the correlation between a binary variableindicating an omitted response to the item and the total score. Thiscorrelation should always be negative or zero.
• NR (point biserials): This is the correlation between a binary variableindicating a not reached response to the item and the total score. Thiscorrelation should always be negative or zero.
• RDIFF (Rasch): This is an estimate of the item difficulty based on a one-parameter IRT model. The difficulty of the item is expressed on the logitmetric (with a positive logit indicating a difficult item) and was scaled sothat the sum of all Rasch item difficulties was zero within each country.
• SE (Rasch): This is the standard error of the item difficulty parameter.
• FIT (Rasch): This is the weighted MNSQ value. Items that fit the Raschmodel have a fit value of 1.
As an aid to reviewers, the item analyses tables included a variety of flags,signaling the presence of one or more possible problems. The followingconditions were flagged:
• Item difficulty exceeds 95 percent in the sample as a whole.
• Item difficulty is less than 25 percent in the sample as a whole.
81
• One or more distracter percentages are less than five percent.
• One or more distracter percentages are greater than the percentage of thecorrect answer.
• The point biserial correlation for one or more of the distracters exceeds zero.
• Item discrimination is less than 0.2.
• Rasch goodness-of-fit index is less than 0.88 or greater than 1.12.
Although not all of these conditions necessarily indicate a problem, flags are auseful way to draw attention to possible sources of concern.
To provide an immediate overview of the key findings, the results of the itemanalyses were also displayed in a graphical format. Figure 7.6 shows examplesas they were used in the CivEd item reviews. Four graphs were produced:
• Percentage correct across countries.
• Item discrimination (point-biserial for correct answer).
• Fit statistics (weighted MNSQ statistic minus 1).
• Item-by-country interaction.
Here, the expectation was that countries showing an average high performancewould perform relatively well on each of the items used in the test, while low-performing countries would do less well on each of the items. When this didnot occur, that is, a high-performing country showed low performance on anitem on which other countries did well, this was called an item-by-countryinteraction. Since large item-by-country interactions can indicate some kind ofitem bias, this aspect of item performance was also included in the figures.
The graphical display for each item shows the average probability of a correctresponse across all countries, compared with the probability of a correctresponse in a particular country. The probability for each country is presentedas a 95 percent confidence interval.
Prior to the final scaling of the CivEd data, item statistics, as described above,were reviewed carefully to guarantee comparable results. Although only a smallnumber of inappropriate items were detected, several causes for problematicitem characteristics were discovered:
• Errors during translation that had not been corrected.
• Item analyses showing negative biserial correlations.
• Item-fit statistics that indicated that an item did not fit the model in acountry.
If, in a country, a serious problem8 with an item was detected during thereview, it was discarded from this particular national dataset for theinternational calibration and scaling. Table 7.3 shows the items that wereexcluded from scaling for each participating country and illustrates that in nocountry were more than 10 percent of the items excluded from the scaling.
CHAPTER 7 SCALING PROCEDURES FOR COGNITIVE ITEMS
8 Problems with items were typically due to translation errors not detected in the translation verificationor a different meaning for the item in the particular national context.

82 IEA CIVIC EDUCATION STUDY TECHNICAL REPORT
120
100
80
60
40
20
0
AU
S1
BF
R1
BG
R1
CH
L1
CO
L1
CY
P1
CZ
E1
DE
U1
DN
K1
EN
G1
EST
1
FIN
1
GR
C1
HK
G1
HU
N1
ITA
1
LTU
1
LVA
1
NO
R1
PO
L1
PR
T1
RO
M1
RU
S1
SV
K1
SV
N1
SW
E1
US
A1
7870 69 74
58
79 83
6675 79
62
8176 79
46
7262 60
6975
5949
6978
6369
77
Percent Correct
0.7
0.5
0.3
0.1
-0.1
AU
S1
BF
R1
BG
R1
CH
L1
CO
L1
CY
P1
CZ
E1
DE
U1
DN
K1
EN
G1
EST
1
FIN
1
GR
C1
HK
G1
HU
N1
ITA
1
LTU
1
LVA
1
NO
R1
PO
L1
PR
T1
RO
M1
RU
S1
SV
K1
SV
N1
SW
E1
US
A1
Discrimination
-0.3
AU
S1
BF
R1
BG
R1
CH
L1
CO
L1
CY
P1
CZ
E1
DE
U1
DN
K1
EN
G1
EST
1
FIN
1
GR
C1
HK
G1
HU
N1
ITA
1
LTU
1
LVA
1
NO
R1
PO
L1
PR
T1
RO
M1
RU
S1
SV
K1
SV
N1
SW
E1
US
A1
0.3
0.1
-0.1
BS
107
Fit (-1)
-0.1
AU
S1
BF
R1
BG
R1
CH
L1
CO
L1
CY
P1
CZ
E1
DE
U1
DN
K1
EN
G1
EST
1
FIN
1
GR
C1
HK
G1
HU
N1
ITA
1
LTU
1
LVA
1
NO
R1
PO
L1
PR
T1
RO
M1
RU
S1
SV
K1
SV
N1
SW
E1
US
A1
1.1
0.7
0.3
Item-by-country Interaction
0.1
0.5
0.9
Figure 7.6 Example of displays for item percentage correct, discrimination, fitstatistics, and item-by-country interaction

83
Table 7.3 Items excluded from scaling after item adjudication (14-year-old students)
CHAPTER 7 SCALING PROCEDURES FOR COGNITIVE ITEMS
Similar procedures were followed for the upper secondary students. Table 7.4shows that only a small number of civic knowledge and economic literacyitems were excluded from scaling.
Country Items Excluded from Scaling
Australia 12
Belgium (French) 27
Bulgaria 21, 25
Chile 22
Colombia 22
Cyprus 2, 22, 27
Czech Republic
Denmark 10, 20
England 12
Estonia 21
Finland 25, 27
Germany
Greece 2, 22, 35
Hong Kong (SAR) 2, 12, 22
Hungary 20
Italy 35
Latvia
Lithuania
Norway
Poland 31
Portugal 25
Romania 25
Russia 21
Slovak Republic
Slovenia 27
Sweden 21
Switzerland
United States 22, 34

84 IEA CIVIC EDUCATION STUDY TECHNICAL REPORT
Table 7.4 Items excluded from scaling after item adjudication (upper secondarystudents)
Linking Test Results
The tests for the 14-year-old students and the upper secondary studentsincluded a common set of 16 items. Table 7.5 shows the number of commonand unique items for each of the proficiency scales.
Table 7.5 Numbers of common and unique test items
14-year-old Students Upper Secondary Students
Unique for 14-year-old students 22
Unique for upper secondary students 10
Common items 16
Total civic knowledge 38 26
Economic literacy items 14
Country Items Excluded from Scaling
Chile
Colombia
Cyprus 9, 25, 38
Czech Republic
Denmark
Estonia
Hong Kong (SAR)
Israel 34
Latvia
Norway
Poland 29
Portugal
Russian Federation 29
Slovenia
Sweden
Switzerland 36
To place ability estimates for civic knowledge on the same scale, itemparameters for common items from the calibration for the 14-year-olds wereused for the scaling of the upper secondary students. Three of the 16 commonitems had to be discarded because their relative difficulties for the uppersecondary students were too different compared to the ones found for the14-year-olds. Therefore, only 13 out of the common set of 16 items were usedfor the equating. However, the three common items not used for anchoringwere included in the scaling with re-estimated item parameters, that is, theywere treated as if they were unique items. One of these three items (number 10)

85
was not used for the anchoring of the total civic knowledge scale but for theanchoring of the interpretative skills scale.
ITEM CALIBRATION AND COMPUTATION OF STUDENTSCORESThe international item parameters were estimated for each scale based on acalibration sample with 500 randomly selected students per country (14,000students from the 14-year-old population). Based on the results of the itemadjudication, some items were excluded from both item calibration and scaling.
Notably in two countries (Chile and Colombia), a considerable number ofstudents were not able to attempt all test items.9 Missing students’ responsesthat were likely to be due to problems with test length (“not reached items”)10
were omitted from the calibration of item parameters but were treated asincorrect for the scaling of student responses. Table 7.6 shows the internationalpercentages of correct responses and the item parameters for the three cognitivescales for each item used for the assessment of 14-year-olds in 1999.
The international item parameters and percentage correct for the three civicknowledge scales for the upper secondary students are shown in Table 7.7;anchored item parameters are printed in bold. The item parameters for theeconomic literacy scale are given in Table 7.8.
The international item parameters obtained from the calibration samples wereused to compute ML estimates for each sub-sample. The person parameters(logits) were transformed to the international metric with an international meanof 100 and a standard deviation of 20. The transformation was achieved byapplying the formula
where ’n are the student scores in the international metric,
n the original logit
scores, the international mean of student logit scores with equally weighted
country sub-samples, and its corresponding international standard deviation.
Table 7.9 shows the means and standard deviations of student logit scores (14-year-olds tested in 1999) used for the transformation into the internationalmetric of student scores. The same values as for the upper secondary studentswere used to compute the international student scores for the three civicknowledge scales for the upper secondary students. For the economic literacyscale, which was used only for the assessment of the upper secondary students,the means and standard deviations of the equally weighted country sub-samples of these students were used, so that the mean on the economic literacyscale was 100 and the standard deviation 20 for all 16 participating countries(including Colombia and Hong Kong (SAR), whose data were not included inthe reporting).
9 For example, more than 10 percent of the Colombian students did not attempt any of the last eighttest items.
10 “Not reached items” were defined as all consecutive missing values starting from the end of the testexcept for the first missing value of the missing series, which was coded as “missing”.
CHAPTER 7 SCALING PROCEDURES FOR COGNITIVE ITEMS
’n = 100 + 20n –
( )

86 IEA CIVIC EDUCATION STUDY TECHNICAL REPORT
Table 7.6 Percentage correct and item parameters for civic knowledge test items(14-year-old students)
International Item Parameters for...Item Number Percentage of Correct
Answers Total civic Content Interpretativeknowledge knowledge skills
1 79 -0.874 -0.786
2 78 -0.858 -0.772
3 78 -0.756 -0.665
4 70 -0.311 -0.216
5 65 -0.010 0.087
6 77 -0.715 -0.623
7 69 -0.249 -0.153
8 64 0.055 0.154
9 72 -0.411 -0.317
10 59 0.241 0.341
11 75 -0.557 -0.465
12 71 -0.579 -0.477
13 67 -0.153 -0.059
14 61 0.201 0.028
15 53 0.625 0.725
16 85 -1.289 -1.206
17 53 0.577 0.676
18 57 0.401 0.499
19 65 -0.048 0.046
20 77 -0.839 -0.753
21 47 0.856 0.949
22 42 1.058 1.163
23 65 -0.020 -0.202
24 71 -0.355 -0.542
25 58 0.223 0.054
26 50 0.734 0.558
27 47 0.856 0.959
28 62 0.122 0.216
29 54 0.560 0.657
30 66 -0.071 0.022
31 53 0.580 0.409
32 66 -0.122 -0.311
33 77 -0.813 -1.014
34 35 1.551 1.365
35 67 -0.249 -0.429
36 57 0.355 0.173
37 72 -0.511 -0.703
38 49 0.794 0.616

87CHAPTER 7 SCALING PROCEDURES FOR COGNITIVE ITEMS
Table 7.7 Percentage correct and item parameters for civic knowledge test items(upper secondary students)
International Item Parameters for...Item Number Percentage of Correct
Answers Total civic Content Interpretativeknowledge knowledge skills
1 91 -1.078 -0.801
2 92 -0.715 -0.623
3 85 -0.249 -0.153
4 86 0.055 0.154
5 72 0.625 0.725
6 80 0.577 0.676
7 75 0.401 0.499
8 90 -0.756 -0.665
9 54 1.684 1.717
10 67 0.845 0.173
11 80 -0.020 -0.202
12 83 -0.355 -0.542
13 75 0.223 0.054
14 71 0.560 0.657
15 68 0.734 0.558
16 86 0.122 0.216
17 68 0.993 1.079
18 71 0.610 0.728
20 60 1.499 0.978
23 67 1.057 0.588
25 68 0.826 0.921
28 70 0.895 0.429
29 71 0.817 0.394
30 80 0.211 -0.237
31 70 0.770 0.308
43 75 0.291 -0.159
Note: Anchored item parameters are given in bold type.

88 IEA CIVIC EDUCATION STUDY TECHNICAL REPORT
Table 7.9 International means and standard deviations for IRT scales (logits)
Scale Mean Standard Deviation
Content knowledge 0.95 1.36
Interpretative skills 0.63 1.49
Total civic knowledge 0.82 1.29
Economic literacy 0.67 1.55
Note: Based on the equally weighted country data for the 14-year-olds tested in 1999 for content knowledge, interpretative
skills, and total civic knowledge. Means and standard deviation for economic literacy are for the population of upper
secondary students tested in 1999/2000.
Tables 7.10 and 7.11 respectively show the country means and standarddeviations on the total civic knowledge scale for the 14-year-old students andthe upper secondary students; the standard errors were estimated using thejackknife repeated replication (JRR) technique (see Chapter 10).
Table 7.8 Percentage correct and item parameters for economic literacy test items(upper secondary students)
Item Number Percentage of Correct Answers Item Parameters forEconomic Literacy
19 75 -0.628
21 66 -0.077
22 72 -0.393
26 61 0.220
32 66 -0.135
33 73 -0.493
34 50 0.653
35 63 -0.008
36 58 0.212
37 39 1.218
38 69 -0.435
39 68 -0.353
40 66 -0.279
42 52 0.500

89CHAPTER 7 SCALING PROCEDURES FOR COGNITIVE ITEMS
Table 7.10 Means and standard deviations for the civic knowledge scale (14-year-oldstudents)
Country Means Standard Deviations
Australia 101.7 (0.79) 20.3 (.31)
Belgium (French) 94.7 (0.94) 18.3 (.49)
Bulgaria 97.6 (1.25) 19.5 (.95)
Chile 88.4 (0.69) 16.9 (.26)
Colombia 86.4 (0.91) 15.1 (.40)
Cyprus 108.1 (0.49) 19.4 (.38)
Czech Republic 102.6 (0.83) 18.8 (.36)
Denmark 100.4 (0.54) 20.9 (.30)
England 99.4 (0.62) 18.9 (.39)
Estonia 94.0 (0.54) 16.2 (.34)
Finland 109.3 (0.68) 20.5 (.29)
Germany 99.8 (0.50) 18.8 (.41)
Greece 107.9 (0.76) 21.4 (.38)
Hong Kong (SAR) 106.6 (1.10) 22.7 (.44)
Hungary 101.6 (0.63) 17.9 (.28)
Italy 105.4 (0.77) 19.3 (.41)
Latvia 91.5 (0.85) 16.5 (.47)
Lithuania 93.6 (0.71) 16.6 (.39)
Norway 102.9 (0.48) 20.5 (.36)
Poland 110.6 (1.69) 22.4 (.80)
Portugal 96.2 (0.73) 16.5 (.47)
Romania 91.6 (0.88) 16.5 (.54)
Russian Federation 99.6 (1.33) 21.2 (.89)
Slovak Republic 105.4 (0.72) 17.0 (.48)
Slovenia 100.6 (0.46) 17.7 (.30)
Sweden 99.1 (0.78) 19.6 (.50)
Switzerland 98.3 (0.80) 17.3 (.47)
United States 106.5 (1.18) 22.4 (.52)
Note: Standard errors are given in brackets.
STANDARDIZING THE INTERNATIONAL ITEMDIFFICULTIESTo assist readers with understanding the cognitive scales, item difficulty mapswere produced showing the location of items on the international civicknowledge scale. Item difficulty parameters consequently had to betransformed from their original metric to the international metric (with astudent mean of 100 and a standard deviation of 20).
The estimated item difficulties indicated the location on the ability scale wherea student had a 50 percent chance of giving the correct answer. For the itemdifficulty maps, the preference was to map items to a level of greater studentproficiency. It was therefore decided to describe the scale using those points ofproficiency where a student had a 65 percent chance of giving the correctanswer.

90 IEA CIVIC EDUCATION STUDY TECHNICAL REPORT
(
The transformation was achieved by adding the natural log of the odds of 65percent chance to the original log odds, and then transforming the result to theinternational metric by applying the same transformation as for the originalstudent scores (in logits). The standardized item difficulty d i for each item wasobtained as:
where di is the item difficulty in its original metric, the international studentmean, and
its corresponding standard deviation in the original metric (see
Table 7.7). For the described scale, only the item difficulties on the total civicknowledge scale were used; the reporting of the results for the uppersecondary students in addition presented a described scale for economicliteracy.
SUMMARYThe IRT Rasch model was used for scaling of cognitive data. IRT methodologyprovides a useful tool for analysing test items, produces sample-independentmeasures, and allows the exclusion of problematic items from scaling forindividual countries without jeopardizing the comparability of scores.
Item fit was assessed both for the international sample and the national sub-samples, and problematic items were excluded from scaling. In general, thecognitive test items had good scaling properties and most of the cognitivematerial was used for the measurement of civic knowledge and economicliteracy.
Both CFA and multi-dimensional IRT scaling were used to assess thedimensionality of the cognitive items used in the IEA Civic Education Study.
Table 7.11 Means and standard deviations for the civic knowledge scale (uppersecondary students)
Country Means Standard Deviations
Chile 107.7 (0.59) 17.7 (.27)
Cyprus 118.2 (1.53) 20.0 (.49)
Czech Republic 121.1 (0.71) 19.9 (.37)
Denmark 132.3 (0.46) 19.0 (.24)
Estonia 124.8 (0.91) 20.1 (.36)
Israel 117.6 (0.97) 22.7 (.44)
Latvia 104.8 (1.45) 20.1 (.54)
Norway 121.8 (1.23) 23.3 (.43)
Poland 117.8 (1.08) 21.1 (.49)
Portugal 121.1 (0.65) 17.8 (.30)
Russia 110.9 (1.25) 21.6 (.59)
Slovenia 115.3 (1.46) 22.0 (.95)
Sweden 130.1 (0.89) 24.2 (.69)
Switzerland 123.7 (1.92) 19.8 (.82)
Note: Standard errors are given in brackets.
d i = 100 + 20 x )di + 1n(.65/.35) –

91
Two sub-scales were derived from the cognitive test of 14-year-olds and threesub-scales from the assessment of the upper secondary students.
The use of IRT scaling allowed the computation of comparable proficiencyscores for both populations through the use of a common set of anchor items.The international metric of the content knowledge, interpreting skills, andcombined civic knowledge scales referred for both populations to a mean of100 with a standard deviation of 20 in the assessment of 14-year-olds in1999. The metric of the economic literacy scale had a mean of 100 and astandard deviation of 20 for the upper secondary students.
REFERENCESAdams, R. (2002). Scaling PISA cognitive data. In R. Adams & M. Wu (Eds.), Technical reportfor the OECD Programme for International Student Assessment (pp. 99–108). Paris: OECDPublications.
Adams, R., & Khoo, S.-T. (1996). Quest: The interactive test analysis system (computer program).Camberwell, Vic.: Australian Council for Educational Research.
Adams, R., Wu, M., & Macaskill, G. (1997). Scaling methodology and procedures for themathematical and science scales. In M. O. Martin & D. L. Kelly (Eds.), TIMSS technical report,volume II: Implementation and analysis—primary and middle school years (pp. 111–145). ChestnutHill, MA: Boston College.
Amadeo, J., Torney-Purta, J., Lehmann, R., Husfeldt, V., & Nikolova, R. (2002). Civic knowledgeand engagement: An IEA study of upper secondary students in sixteen countries. Amsterdam:International Association for the Evaluation of Educational Achievement.
Hambleton, R. K., & Swaminathan, H. (1985). Item response theory: Principles and applications.Boston, MA: Kluwer Academic Publications.
Jöreskog, K. G., & Sörbom, D. (1993). LISREL 8: User’s reference guide. Chicago: ScientificSoftware International.
Mislevy, R. (1991). Randomization-based inference about latent variables from complexsamples. Psychometrika, 56(2), 177–196.
Rasch, G. (1960). Probabilistic models for some intelligence and attainment tests. Copenhagen: Nielsen& Lydiche.
Torney-Purta, J., Lehmann, R., Oswald, H., & Schulz, W. (2001). Citizenship and education intwenty-eight countries. Amsterdam: International Association for the Evaluation of EducationalAchievement.
Warm, T. A. (1989). Weighted likelihood estimation of ability in item response theory.Psychometrika, 54(3), 427–450.
Wright, B. D., & Masters, G. N. (1982). Rating scale analysis: Rasch measurement. Chicago: MESAPress.
Wu, M. L., Adams, R. J., & Wilson, M. R. (1997). ACER ConQuest: Multi-aspect test software(computer program). Camberwell, Vic.: Australian Council for Educational Research.
CHAPTER 7 SCALING PROCEDURES FOR COGNITIVE ITEMS

92 IEA CIVIC EDUCATION STUDY TECHNICAL REPORT

93
Chapter 8:
SCALING PROCEDURES FOR LIKERT-TYPE ITEMS ON STUDENTS’CONCEPTS, ATTITUDES, AND ACTIONSWolfram Schulz
OVERVIEWThis chapter describes the scaling procedures for Likert-type items in thestudent data of the IEA Civic Education Study (CivEd). It describes theanalyses of the dimensional structure of items using structural equationmodeling (SEM) and the item response theory (IRT) scaling methodology usedto obtain individual scores on the latent dimensions.
The items on concepts, attitudes, and actions formed a vital part of the designin this subject area and took up nearly half of the instrument (see Appendix F,section F.3). They included:
• Concepts: Items that assess the concepts of students regarding democracy(Section A), citizenship (Section B), and government responsibilities (Section C).
• Attitudes: Items reflecting attitudes towards trust in institutions (Section D),national identity (Section E), rights for women, minorities, and anti-democraticgroups (Section G), immigrants (Section H), perceived relationship betweengovernment and the individual (Political Efficacy and Interest, Section I),participation in school (Section J), and the perception of teaching styles in class(Section N).
• Actions: Items concerned with participation in political discussions, media use forpolitical information (Section L), and expected political participation in the future(Section M).
The scaling process consisted of the following steps:
• Analysis of missing values, distribution of item responses, and exploratoryprincipal component analyses.
• Confirmatory factor analysis (CFA) using SEM of the theoretically expectedmodels based on data from an international sample (200 students percountry) and the national samples.
• Selection of scales based on theoretical and empirical grounds.
• Analysis of IRT (partial credit) models for the selected scales based on aninternational sample (200 students per country).
• Computation of comparative item statistics (item fit and reliabilities) acrosscountries.
• Item adjudication based on a country-by-country item calibration thatresulted in excluding items with poor scaling properties from scaling inparticular countries.

94 IEA CIVIC EDUCATION STUDY TECHNICAL REPORT
The final scaling was done using a calibration sample of 500 students from thepopulation of 14-year-old students randomly selected from the weightedcountry data. Item parameters were estimated for the calibration sample andused as anchors for subsequent scaling of country data sets. Data from theupper secondary students were scaled using the same item parameters as for the14-year-old students. This was done to make scale scores comparable acrosspopulations. Information about the sources of these items in the researchliterature is found in Torney-Purta, Lehmann, Oswald, & Schulz (2001). Inaddition, both this volume and Amadeo, Torney-Purta, Lehmann, Husfeldt, &Nikolova (2002) contain extensive analyses of the scales derived from theseitems by country and gender.
CONFIRMATORY FACTOR ANALYSES (CFA)SEM was used to confirm theoretically expected dimensions and, if necessary,to re-specify the dimensional structure. SEM takes the measurement errorassociated with the indicators into account and provides a tool for analyzingthe dimensional item structure and the estimation of the correlation betweenlatent factors.
In CFA with SEM, an expected covariance matrix is fitted according to thetheoretical factor structure. This can be done due to the possibility ofcomputing the covariances from the estimates in the model. Maximumlikelihood estimation (MLE) provides model estimates by minimizing thedifferences between the expected (∑) and the observed covariance matrix (S).1
Measures for the overall fit of a model are then obtained by comparing theexpected matrix with the observed S matrix. If the differences between bothmatrices are close to zero, then the model “fits the data”; if differences arerather large, the model “does not fit the data” and some re-specification may benecessary or, if this is not possible, the theoretical model has to be rejected.The chi-square test statistic for the null hypothesis of ∑= S becomes a ratherpoor fit measure with larger sample sizes because even small differencesbetween matrices are given as significant deviations.
The assessment of model fit for the CFA of CivEd data was based on thefollowing measures:
• The root mean square error of approximation (RMSEA) measures the“discrepancy per degree of freedom for the model” (Browne & Cudeck,1993, p. 144). A value of .05 and less indicates a close fit, values of .08 andmore indicate a reasonable error of approximation, and values greater than1.0 typically lead to the rejection of a model.
• The adjusted goodness-of-fit index (AGFI) is a “traditional” measure of model fit.It indicates the amount of variance in S explained by ∑ and should be closeto 1.0 to indicate a good model fit.
1 For ordinal variables, Jöreskog and Sörbom (1993) recommend using weighted least square estimation
(WLS) with polychoric correlation matrices and corresponding asymptotic covariance weight matricesbecause MLE requires normal distribution and continuous variables. However, for the purpose ofanalysing the dimensional structure of items, the use of covariance matrices and MLE was deemedappropriate.
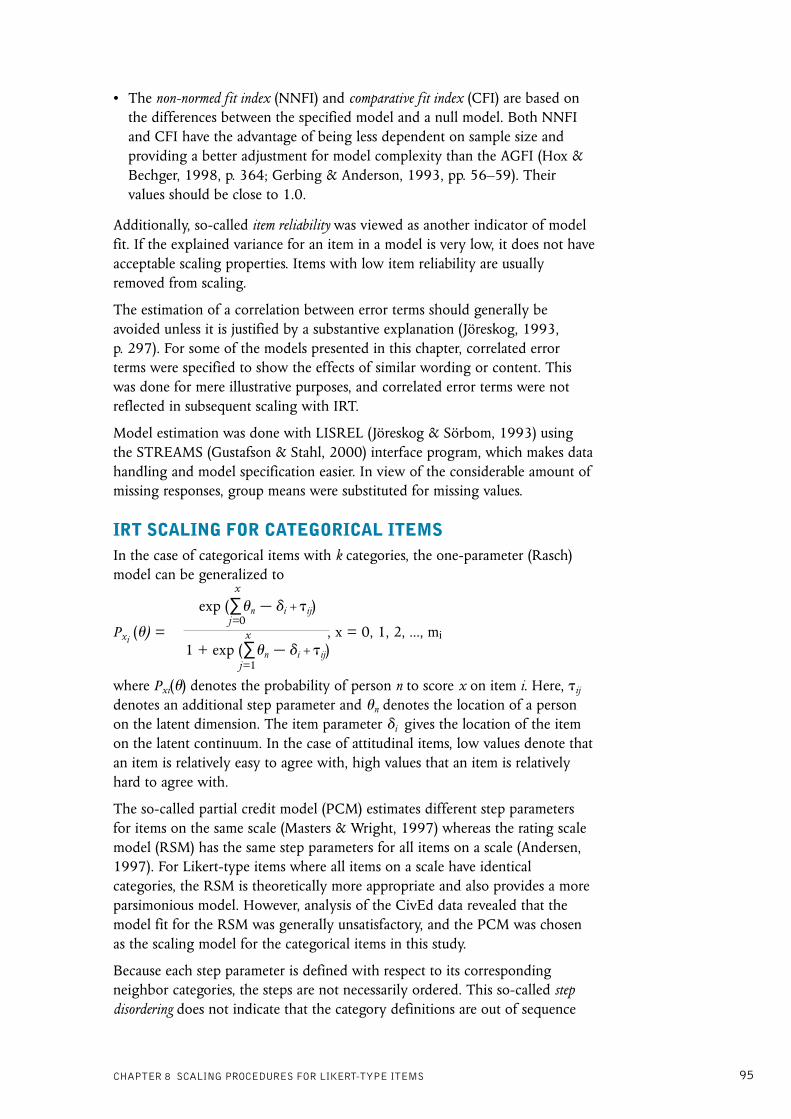
95
• The non-normed fit index (NNFI) and comparative fit index (CFI) are based onthe differences between the specified model and a null model. Both NNFIand CFI have the advantage of being less dependent on sample size andproviding a better adjustment for model complexity than the AGFI (Hox &Bechger, 1998, p. 364; Gerbing & Anderson, 1993, pp. 56–59). Theirvalues should be close to 1.0.
Additionally, so-called item reliability was viewed as another indicator of modelfit. If the explained variance for an item in a model is very low, it does not haveacceptable scaling properties. Items with low item reliability are usuallyremoved from scaling.
The estimation of a correlation between error terms should generally beavoided unless it is justified by a substantive explanation (Jöreskog, 1993,p. 297). For some of the models presented in this chapter, correlated errorterms were specified to show the effects of similar wording or content. Thiswas done for mere illustrative purposes, and correlated error terms were notreflected in subsequent scaling with IRT.
Model estimation was done with LISREL (Jöreskog & Sörbom, 1993) usingthe STREAMS (Gustafson & Stahl, 2000) interface program, which makes datahandling and model specification easier. In view of the considerable amount ofmissing responses, group means were substituted for missing values.
IRT SCALING FOR CATEGORICAL ITEMSIn the case of categorical items with k categories, the one-parameter (Rasch)model can be generalized to
Pxi () = , x = 0, 1, 2, ..., mi
where Pxi() denotes the probability of person n to score x on item i. Here, ij
denotes an additional step parameter and n denotes the location of a personon the latent dimension. The item parameter i gives the location of the itemon the latent continuum. In the case of attitudinal items, low values denote thatan item is relatively easy to agree with, high values that an item is relativelyhard to agree with.
The so-called partial credit model (PCM) estimates different step parametersfor items on the same scale (Masters & Wright, 1997) whereas the rating scalemodel (RSM) has the same step parameters for all items on a scale (Andersen,1997). For Likert-type items where all items on a scale have identicalcategories, the RSM is theoretically more appropriate and also provides a moreparsimonious model. However, analysis of the CivEd data revealed that themodel fit for the RSM was generally unsatisfactory, and the PCM was chosenas the scaling model for the categorical items in this study.
Because each step parameter is defined with respect to its correspondingneighbor categories, the steps are not necessarily ordered. This so-called stepdisordering does not indicate that the category definitions are out of sequence
exp (∑n – i + ij)
1 + exp (∑n – i + ij)
x
j=0x
j=1
CHAPTER 8 SCALING PROCEDURES FOR LIKERT-TYPE ITEMS

96 IEA CIVIC EDUCATION STUDY TECHNICAL REPORT
but only that a category defines a very narrow section of the variable. In thecase of category disordering (i.e., when the means of the latent measure are out ofsequence across categories), the need to collapse adjacent categories may arise.However, no cases of category disordering were found in the scaling analysesfor this study.
Model fit was assessed using mean square statistics (see Wright & Masters,1982; also Chapter 7 in this volume). The value of the item fit statistics shouldbe close to 1.0 to indicate a good fit according to the model. Values greaterthan 1.0 indicate that the item discrimination is less than expected, whilevalues lower than 1.0 indicate that the item discrimination is higher thanexpected. As the unweighted mean square residual (outfit) statistic may beaffected by a small number of outlying observations, the weighted mean squareresidual (infit) statistic was used as the main criterion for assessing item fit.Rasch parameters were estimated using the ConQuest program (Wu, Adams, &Wilson, 1997).
If the PCM fits the data, person parameters for the latent dimension can becomputed and used for subsequent analysis. Though highly correlated with theoriginal raw scores, this method provides a sophisticated scaling method fordealing with missing values because estimates for the latent dimension may beobtained for all respondents who have answered at least one of the items.
It should be noted that measurement error is included in the ML estimates.More sophisticated methods like the use of plausible values and conditioningon background variables can be used to obtain disattenuated populationestimates of latent variables (see Adams, Wu, & Macaskill, 1997; Mislevy,1991). But within the scope and timeline of the IEA Civic Education Study,and in view of the large number of scales, it was not possible to use morecomplex scaling techniques.
DESCRIPTION OF SCALES AND ITEMS
Concept of Citizenship
Fifteen items on citizenship behavior were administered to the students. Five ofthese items were discarded from scaling after a preliminary analysis of itemdimensionality. Table 8.1 lists the concept items on citizenship, classified alongthe following dimensions:
• A “conventional” factor (CTCON) loading on items regarding thedesirability of a citizen being politically active in conventional forms ofparticipation (voting, parties, information).
• A “social movement” factor (CTSOC) loading on items indicating thedesirability of having an active citizenship engaged with new forms ofpolitical participation as found in social movements aiming at the defense ofhuman or civil rights, the environment, etc.
Figure 8.1 shows the two-factor solution for these items, which had anacceptable model fit. The estimated correlation between the latent dimensionswas quite high (.74). Whereas the item variance explained by CTCON rangedbetween approximately 20 and 30 percent, the item factor correlation varied
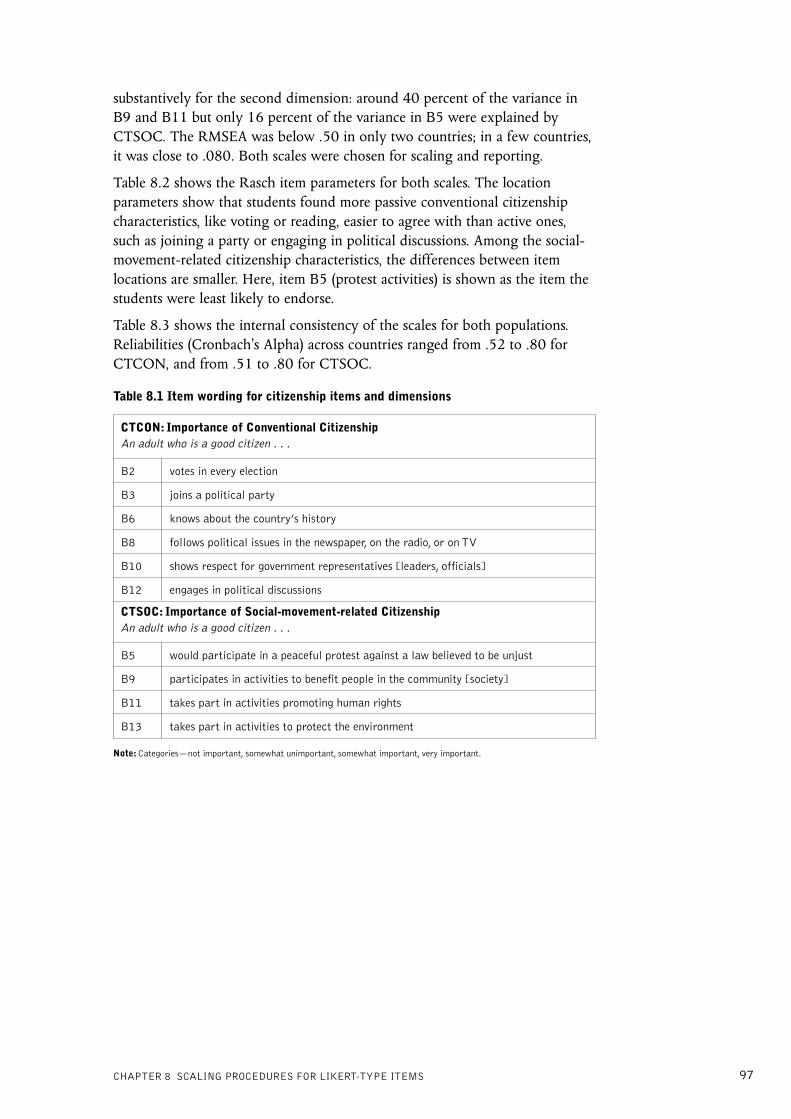
97
substantively for the second dimension: around 40 percent of the variance inB9 and B11 but only 16 percent of the variance in B5 were explained byCTSOC. The RMSEA was below .50 in only two countries; in a few countries,it was close to .080. Both scales were chosen for scaling and reporting.
Table 8.2 shows the Rasch item parameters for both scales. The locationparameters show that students found more passive conventional citizenshipcharacteristics, like voting or reading, easier to agree with than active ones,such as joining a party or engaging in political discussions. Among the social-movement-related citizenship characteristics, the differences between itemlocations are smaller. Here, item B5 (protest activities) is shown as the item thestudents were least likely to endorse.
Table 8.3 shows the internal consistency of the scales for both populations.Reliabilities (Cronbach’s Alpha) across countries ranged from .52 to .80 forCTCON, and from .51 to .80 for CTSOC.
Table 8.1 Item wording for citizenship items and dimensions
CTCON: Importance of Conventional CitizenshipAn adult who is a good citizen . . .
B2 votes in every election
B3 joins a political party
B6 knows about the country’s history
B8 follows political issues in the newspaper, on the radio, or on TV
B10 shows respect for government representatives [leaders, officials]
B12 engages in political discussions
CTSOC: Importance of Social-movement-related CitizenshipAn adult who is a good citizen . . .
B5 would participate in a peaceful protest against a law believed to be unjust
B9 participates in activities to benefit people in the community [society]
B11 takes part in activities promoting human rights
B13 takes part in activities to protect the environment
Note: Categories—not important, somewhat unimportant, somewhat important, very important.
CHAPTER 8 SCALING PROCEDURES FOR LIKERT-TYPE ITEMS

98 IEA CIVIC EDUCATION STUDY TECHNICAL REPORT
Figure 8.1 Two-factor solution for citizenship items
Note: Standardized minimum likelihood estimates for international sample of 14-year-olds. RMSEA = .056, AGFI = .96,
NNFI = .91, CFI = .93.
0.79
0.75
0.79
0.71
0.72
0.73
0.61
0.72
0.58
CTCON1.00
CTSOC1.00
B2
B3
B6
B8
B10
B12
B5 0.84
B9
B11
B13
0.50
0.46
0.46
0.54
0.52
0.52
0.40
0.65
0.62
0.53
0.74
Table 8.2 Item parameters for citizenship scales
CTCON Location Tau 1 Tau 2 Tau 3
B2 votes in every election -0.64 -0.85 -0.35 1.21
B3 joins a political party 0.90 -1.30 0.18 1.12
B6 knows about the country’s history -0.31 -0.72 -0.18 0.90
B8 follows political issues -0.19 -1.05 -0.48 1.53
B10 shows respect for representatives -0.29 -1.13 -0.36 1.49
B12 engages in political discussions 0.53 -1.57 0.09 1.48
CTSOC Location Tau 1 Tau 2 Tau 3
B5 participates in a peaceful protest 0.52 -0.97 -0.30 1.27
B9 participates in community activities -0.15 -1.28 -0.47 1.75
B11 activities promoting human rights -0.29 -1.06 -0.38 1.44
B13 activities to protect the environment -0.08 -1.04 -0.37 1.41

99
Table 8.3 Scale reliabilities for concept of citizenship
CTCON CTSOC
Country 14-year-old Upper secondary 14-year-old Upper secondarystudents students students students
Australia .69 .69
Belgium (French) .52 .54
Bulgaria .73 .65
Chile .60 .65 .51 .63
Colombia .65 .66 .55 .60
Cyprus .59 .69 .63 .69
Czech Republic .63 .66 .62 .62
Denmark .64 .64 .60 .72
England .67 .62
Estonia .58 .64 .56 .65
Finland .70 .66
Germany .61 .56
Greece .62 .62
Hong Kong (SAR) .71 .68 .63 .64
Hungary .63 .60
Israel .68 .67
Italy .60 .61
Latvia .57 .62 .53 .61
Lithuania .68 .58
Norway .69 .69 .59 .64
Poland .65 .69 .58 .68
Portugal .60 .63 .51 .66
Romania .63 .57
Russian Federation .57 .62 .62 .62
Slovak Republic .60 .58
Slovenia .64 .66 .56 .65
Sweden .71 .75 .71 .80
Switzerland .63 .71 .57 .67
United States .75 .73
International Sample .68 .70 .63 .70
Scope of Government
Items regarding the scope of government asked students to rate the extent towhich the government should have responsibilities for 12 different tasks (seeTable 8.4). Two dimensions were expected:
• Economy-related government responsibilities (GOVEC), assigned to thoseitems indicating a desire for government intervention in economicrelationships.
• Society-related government responsibilities (GOVSO), assigned to thoseitems indicating more general areas of government control.
CHAPTER 8 SCALING PROCEDURES FOR LIKERT-TYPE ITEMS

100 IEA CIVIC EDUCATION STUDY TECHNICAL REPORT
Table 8.4 Items on government responsibilities and dimensions
GOVEC: Economy-related Government ResponsibilitiesWhat responsibilities should the government have?
C1 To guarantee a job for everyone who wants one.
C2 To keep prices under control.
C5 To provide industries with the support they need to grow.
C6 To provide an adequate [decent] standard of living for the unemployed.
C7 To reduce differences in income and wealth among people.
GOVSO: Society-related Government ResponsibilitiesWhat responsibilities should the government have?
C3 To provide basic health care for everyone.
C4 To provide an adequate [decent] standard of living for old people.
C8 To provide free basic education for all.
C9 To ensure [be sure there are] equal political opportunities for men and women.
C10 To control pollution of the environment.
C11 To guarantee peace and order [stability] within the country.
C12 To promote honesty and moral behavior among people in the country.
Note: Categories—definitely not, probably not, probably, definitely.
The two-factor solution had a satisfactory model fit (see Figure 8.2). Bothlatent factors were strongly correlated, with r = .82. In all countries, theRMSEA was below .080, and in some countries the model showed a close fitto the data.
Here, the decision to choose a two-dimensional approach was taken both ontheoretical and empirical grounds. Though the correlation between bothfactors was high, the two-factor structure showed a better model fit than thealternative one-factor solution. Furthermore, the inclusion of two differentscales in this section was seen as theoretically justified and more interesting forthe reporting of country differences.

101
Figure 8.2 Two-factor solution for items on government responsibilities
Note: Standardized maximum likelihood estimates for international sample of 14-year-olds. RMSEA = .046, AGFI = .97,
NNFI = .92, CFI = .93.
Table 8.5 shows the item and step parameters used for both scales. As can beseen, most item location parameters are rather close to each other. The itemthat students were least likely to endorse on GOVEC contained the statementthat the government should reduce differences in income and wealth. Forseveral items (C1, C4, C11) step disordering occurred, an indication that somecategories described a rather narrow range of the latent continuum.
0.62
0.62
0.49
0.45
0.48
0.40
0.54
0.52
0.41
0.50
0.35
GOVEC
0.82
1.00
1.00 GOVSO
0.43
0.73
0.83
0.82
0.75
0.88
0.62
0.62
0.76
0.80
0.77
0.70
0.84
C1
C2
C5
C6
C7
C3
C4
C8
C9
C12
C11
C10
CHAPTER 8 SCALING PROCEDURES FOR LIKERT-TYPE ITEMS

102 IEA CIVIC EDUCATION STUDY TECHNICAL REPORT
Table 8.5 Item parameters for scope of government scales
GOVEC Location Tau 1 Tau 2 Tau 3
C1 guarantee a job for everyone -0.11 -0.24 -0.40 0.64
C2 keep prices under control -0.15 -0.63 -0.49 1.11
C5 provide support for industries 0.05 -1.00 -0.41 1.41
C6 standard of living for unemployed -0.14 -0.58 -0.44 1.02
C7 reduce differences in income 0.35 -0.74 -0.20 0.94
GOVSO Location Tau 1 Tau 2 Tau 3
C3 basic health care for everyone -0.04 -0.27 -0.24 0.51
C4 standard of living for old people -0.25 -0.47 -0.60 1.07
C8 free basic education for all -0.04 -0.31 -0.11 0.42
C9 equal political opportunities 0.01 -0.40 -0.29 0.68
C10 control pollution 0.16 -0.67 -0.16 0.83
C11 guarantee peace and order -0.34 -0.02 -0.24 0.26
C12 promote honesty and moral behavior 0.50 -0.74 -0.29 1.04
Table 8.6 shows the internal consistency for the scale across countries in bothpopulations. Scale reliabilities for GOVEC ranged from .36 to .83, with theaverage reliability below .60 for both populations. Alpha coefficients forGOVSO ranged from .62 to .87, and the reliability for the pooled internationalsample was .71 for the 14-year-old students and .69 for the upper secondarystudents.
Table 8.6 Scale reliabilities for scope of government scales
GOVEC GOVSO
Country 14-year-old Upper secondary 14-year-old Upper secondarystudents students students students
Australia .63 .78
Belgium (French) .52 .73
Bulgaria .83 .87
Chile .52 .54 .73 .66
Colombia .58 .60 .64 .66
Cyprus .50 .61 .65 .76
Czech Republic .54 .49 .70 .61
Denmark .45 .57 .63 .62
England .59 .71
Estonia .61 .61 .73 .70
Finland .64 .75
Germany .36 .62
Greece .59 .67
Hong Kong (SAR) .63 .59 .77 .77
Hungary .54 .71
table contd. on next page

103
Table 8.6 contd. from previous page
GOVEC GOVSO
Country 14-year-old Upper secondary 14-year-old Upper secondarystudents students students students
Israel .64 .73
Italy .54 .69
Latvia .51 .53 .70 .73
Lithuania .55 .66
Norway .52 .54 .69 .67
Poland .58 .54 .77 .65
Portugal .53 .52 .66 .63
Romania .61 .75
Russian Federation .55 .63 .73 .72
Slovak Republic .53 .67
Slovenia .55 .56 .66 .68
Sweden .51 .65 .68 .70
Switzerland .50 .43 .64 .59
United States .61 .72
International Sample .57 .58 .71 .69
Attitudes of Trust
For the items on trust in institutions, two dimensions were assumed: trust ingovernment-related institutions (TRUST) (including political parties) and trustin media (MEDIA). Additional items regarding trust in the United Nations,schools, and the people living in the country were seen as unrelated to theselatent dimensions. Table 8.7 lists the items and their corresponding dimensions.
Table 8.7 Items on trust in institutions and dimensions
TRUST: Trust in Government-related InstitutionsHow much of the time can you trust each of the following institutions?
D1 The national [federal] government
D2 The local council or government of town or city
D3 Courts
D4 The police
D8 Political parties
D11 National Parliament [Congress]
MEDIA: Trust in MediaHow much of the time can you trust each of the following institutions?
D5 News on television
D6 News on the radio
D7 News in the press [newspapers]
Note: Categories—never, only some of the time, most of the time, always.
CHAPTER 8 SCALING PROCEDURES FOR LIKERT-TYPE ITEMS

104 IEA CIVIC EDUCATION STUDY TECHNICAL REPORT
The resulting two-factor solution had a moderate fit (RMSEA = .067). Themodel fit improved after a correlation between the error terms for Items 3(courts) and 4 (police) was added to the model. As both institutions probablyare perceived as very close to each other and trust or distrust in a country’sjudicial system might affect both police and courts, a common residual variancebetween these two items is plausible. The final model in Figure 8.3 had a closefit, and the dimensional structure was also confirmed across country sub-samples. Only TRUST was retained for further scaling and inclusion in theinternational report.
Table 8.8 shows the item parameters for TRUST. The item locations indicatethat students were least likely to endorse “political parties” (Item D8) astrustworthy, but were more likely to rate the courts (Item D3) and the police(Item D4) as trustworthy. The step parameters are spread over the continuum,an indication that each category defines a broader range on the TRUSTdimension. Scale reliabilities were highly satisfactory for both populations,ranging between .63 and .83 (see Table 8.9).
Figure 8.3 Two-factor solution for trust items
Note: Standardized maximum likelihood estimates for international sample of 14-year-olds. RMSEA = .046, AGFI = .98,
NNFI = .97, CFI = .98.
0.68
TRUST
D1
D2
D3
D4
D8
D11
D5
D6
D7
0.54
0.68
0.77
0.82
0.69
0.53
0.28
0.23
0.61
0.22
MEDIA
0.57
0.68
0.55
0.43
0.48
0.85
0.88
0.62
1.00
1.00
0.25

105
Table 8.8 Item parameters for TRUST
TRUST Location Tau 1 Tau 2 Tau 3
D1 Government 0.14 -2.22 0.04 2.18
D2 Local council -0.10 -2.32 -0.04 2.35
D3 Courts -0.50 -1.76 -0.08 1.84
D4 Police -0.52 -1.48 -0.10 1.58
D8 Parties 0.90 -2.09 0.22 1.87
D11 Parliament 0.08 -1.82 -0.11 1.93
Table 8.9 Scale reliabilities for TRUST
Country 14-year-old Upper SecondaryStudents Students
Australia .79
Belgium (French) .76
Bulgaria .78
Chile .69 .74
Colombia .77 .78
Cyprus .70 .76
Czech Republic .75 .76
Denmark .76 .71
England .78
Estonia .72 .78
Finland .78
Germany .73
Greece .75
Hong Kong (SAR) .80 .73
Hungary .84
Israel .71
Italy .63
Latvia .74 .74
Lithuania .78
Norway .76 .76
Poland .75 .77
Portugal .69 .69
Romania .76
Russian Federation .72 .72
Slovak Republic .73
Slovenia .76 .75
Sweden .79 .83
Switzerland .71 .73
United States .80
International Sample .77 .79
CHAPTER 8 SCALING PROCEDURES FOR LIKERT-TYPE ITEMS

106 IEA CIVIC EDUCATION STUDY TECHNICAL REPORT
Attitudes toward the Nation
Initially, all 12 items measuring students’ attitudes toward their nation hadbeen assumed to be uni-dimensional, but the model fit for the correspondingone-factor solution was rather unsatisfactory (RMSEA = .088, AGFI = .90,NNFI = .80, CFI = .84). After the preliminary analyses, four items weredropped, and the remaining eight items were assigned to the followingdimensions (see Table 8.10):
• Protective feelings toward one’s nation (PROTC), relating to those itemsindicating perceived threats and the need to defend the country against othercountries.
• Positive attitudes toward one’s nation (PATRI), relating to items indicatingthe importance of national symbols and emotional affection towards thecountry.
The two-factor solution (see Figure 8.4) had a close fit to the sample data, andthe model fit was acceptable for all countries. The correlation of .58 betweenthe two latent factors was a clear indication that a one-dimensional model wasnot appropriate. Although the two-dimensional solution was confirmed, theitem reliabilities for items loading on the first factor were very low. Only itemsloading on the second factor (PATRI) were retained for scaling and inclusion inthe international report.
Table 8.10 Items on national identity
PROTC: Protective Feelings toward One’s Nation
E1 To help protect jobs in this country [name of country] we should buy products made
in this country [name of country].
E2 We should keep [prevent] other countries from trying to influence political decisions
in this country [name of country].
E4 We should always be alert and stop threats from other countries to this country’s
[name of country] political independence.
E12 We should stop outsiders from influencing this country’s [name of country] tradi-
tions and culture.
PATRI: Positive Attitudes toward One’s Nation
E3 The flag of this country [name of country] is important to me.
E7 I have great love for this country [name of country].
E9 This country [name of country] should be proud of what it has achieved.
E11* I would prefer to live permanently in another country.
Notes: Categories—strongly disagree, disagree, agree, strongly agree. *Reversed item.

107CHAPTER 8 SCALING PROCEDURES FOR LIKERT-TYPE ITEMS
PROTC
0.77
0.74
0.73
0.84
0.57
0.45
0.76
0.79
E1
E2
E4
E12
E3
E7
E9
E11
0.66
0.74
0.49
0.46
0.48
0.51
0.52
0.40
PATRI
1.00
1.00
0.58
Notes: Standardized maximum likelihood estimates for international sample of 14-year-olds. RMSEA =. 044, AGFI = .98,
NNFI = .95, CFI = .96.
Figure 8.4 Two-factor solution for national identity items
Table 8.11 shows the item parameters for PATRI. Item E11 (preference to liveabroad) is a reversed item and its location parameter is higher than for theother three items. The item that students were most likely to endorse was E7(love for the country).
Table 8.12 shows the scale reliabilities for PATRI. The internal consistency ofaround .70 was satisfactory for both populations. The low reliability for HongKong (SAR) may have been a result of students having a different perception ofnational identity due to Hong Kong’s past as a former British Crown colonyand its current status as a special administrative region of China.
Table 8.11 Item parameters for PATRI
PATRI Location Tau 1 Tau 2 Tau 3
E3 Flag important -0.03 -0.82 -0.48 1.30
E7 Love for this country -0.22 -0.72 -0.72 1.44
E9 Country should be proud -0.08 -1.10 -0.92 2.02
E11* Prefer to live abroad 0.34 -0.76 -0.54 1.29
Note: *Reversed item.

108 IEA CIVIC EDUCATION STUDY TECHNICAL REPORT
Table 8.12 Scale reliabilities for PATRI
Country 14-year-old Upper secondarystudents students
Australia .69
Belgium (French) .68
Bulgaria .64
Chile .61 .65
Colombia .59 .59
Cyprus .54 .61
Czech Republic .66 .67
Denmark .65 .67
England .70
Estonia .65 .68
Finland .73
Germany .77
Greece .67
Hong Kong (SAR) .47 .52
Hungary .63
Israel .80
Italy .65
Latvia .67 .72
Lithuania .65
Norway .70 .71
Poland .67 .64
Portugal .56 .61
Romania .55
Russian Federation .57 .62
Slovak Republic .65
Slovenia .64 .64
Sweden .73 .70
Switzerland .72 .81
United States .68
International Sample .69 .70
Attitudes toward Women, Minorities, and Anti-Democratic GroupsThree dimensions were assumed for items measuring attitudes toward socialgroups: desired rights or opportunities for women (WOMRT), minorities(MINOR), and anti-democratic groups (ADGR). Table 8.13 lists the items inthis section for each of these dimensions.
Figure 8.5 shows the model with a three-dimensional factor structure(WOMRT, MINOR, ADGR). The structure had a satisfactory model fit for thepooled international sample and for all country sub-samples. Estimates of thecorrelation between the three latent factors showed that WOMRT and MINORwere positively correlated whereas “intolerance for anti-democratic groups” hadnegative, but considerably lower, correlations with both WOMRT andMINOR. Only WOMRT was retained for scaling and reporting in the firstinternational report.

109
Table 8.13 Items on desired opportunities for women, minorities, and anti-democraticgroups
WOMRT: Attitudes toward Women’s Political and Economic Rights
G1 Women should run for public office [a seat in the legislature] and take part in the
government just as men do.
G4 Women should have the same rights as men in every way.
G6* Women should stay out of politics
G9* When jobs are scarce, men [should] have more right to a job than women.
G11 Men and women should get equal pay when they are in the same jobs [occupations].
G13* Men are better qualified to be political leaders than women.
MINOR: Attitudes toward Opportunities for Minorities
G2 All ethnic [racial or national] groups should have equal chances to get a good
education in this country.
G5 All ethnic [racial or national] groups should have equal chances to get good jobs in
this country.
G8 Schools should teach students to respect members of all ethnic [racial or national]
groups.
G12 Members of all ethnic [racial or national] groups should be encouraged to run in
elections for political office.
ADGR: Attitudes toward Political Rights for Anti-Democratic Groups
G3 Members of anti-democratic groups [groups that are against democracy] should be
prohibited from hosting a television show talking about these [their] ideas.
G7 Members of anti-democratic groups [groups that are against democracy] should be
prohibited from organizing peaceful [non-violent] demonstrations or rallies.
G10 Members of anti-democratic groups [groups that are against democracy] should be
prohibited from running in an election for political office.
G14 Members of anti-democratic groups [groups that are against democracy] should be
prohibited from making public speeches about these [their] ideas.
Notes: Categories-strongly disagree, disagree, agree, strongly agree. *Reversed items.
CHAPTER 8 SCALING PROCEDURES FOR LIKERT-TYPE ITEMS
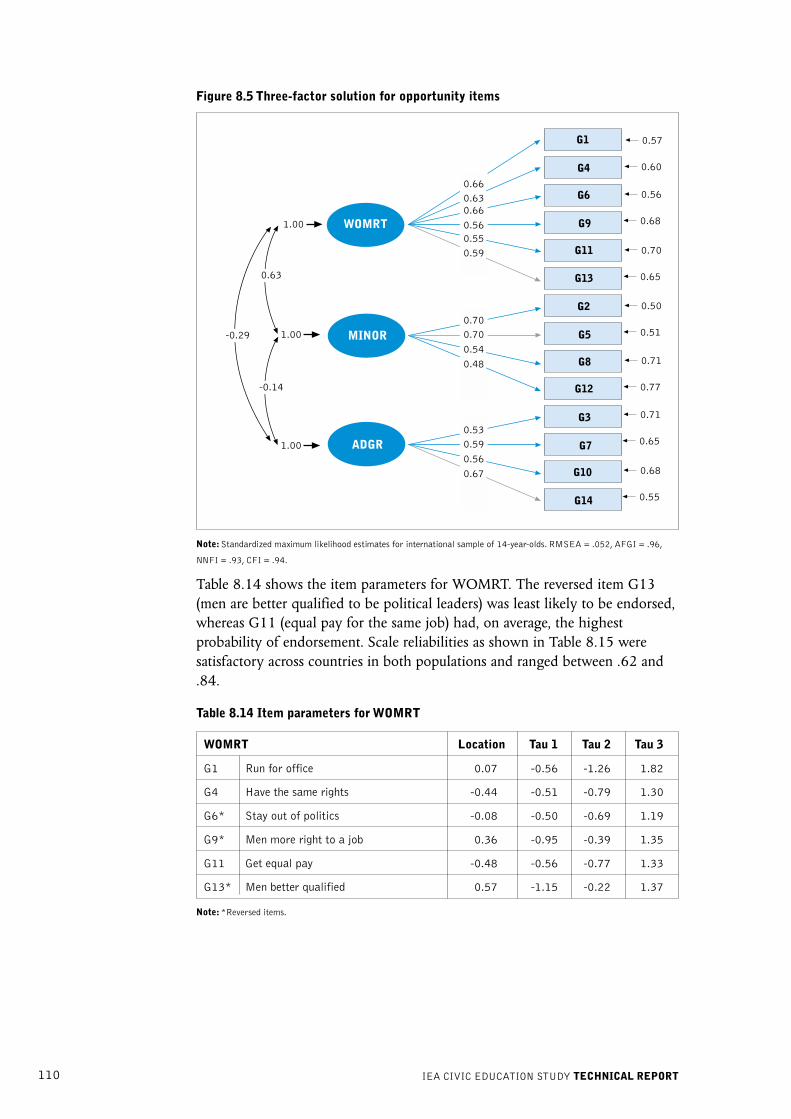
110 IEA CIVIC EDUCATION STUDY TECHNICAL REPORT
Figure 8.5 Three-factor solution for opportunity items
Note: Standardized maximum likelihood estimates for international sample of 14-year-olds. RMSEA = .052, AFGI = .96,
NNFI = .93, CFI = .94.
Table 8.14 shows the item parameters for WOMRT. The reversed item G13(men are better qualified to be political leaders) was least likely to be endorsed,whereas G11 (equal pay for the same job) had, on average, the highestprobability of endorsement. Scale reliabilities as shown in Table 8.15 weresatisfactory across countries in both populations and ranged between .62 and.84.
Table 8.14 Item parameters for WOMRT
WOMRT Location Tau 1 Tau 2 Tau 3
G1 Run for office 0.07 -0.56 -1.26 1.82
G4 Have the same rights -0.44 -0.51 -0.79 1.30
G6* Stay out of politics -0.08 -0.50 -0.69 1.19
G9* Men more right to a job 0.36 -0.95 -0.39 1.35
G11 Get equal pay -0.48 -0.56 -0.77 1.33
G13* Men better qualified 0.57 -1.15 -0.22 1.37
Note: *Reversed items.
0.57
0.60
0.56
0.68
0.70
0.65
0.50
0.51
0.71
0.77
0.71
0.65
0.68
0.55
G1
G4
G6
G9
G2
G5
G8
G3
G7
G10
G14
G12
G13
G11
0.660.630.660.560.550.59
0.700.700.540.48
0.530.590.560.67
MINOR
ADGR
WOMRT1.00
1.00
1.00
0.63
-0.14
-0.29

111
Table 8.15 Scale reliabilities for WOMRT
Country 14-year-old Upper SecondaryStudents Students
Australia .81
Belgium (French) .74
Bulgaria .69
Chile .62 .68
Colombia .63 .68
Cyprus .79 .83
Czech Republic .77 .78
Denmark .83 .79
England .82
Estonia .75 .78
Finland .84
Germany .84
Greece .81
Hong Kong (SAR) .79 .81
Hungary .80
Israel .81
Italy .80
Latvia .70 .75
Lithuania .72
Norway .83 .83
Poland .77 .79
Portugal .71 .73
Romania .72
Russian Federation .67 .73
Slovak Republic .66
Slovenia .78 .80
Sweden .76 .81
Switzerland .81 .81
United States .82
International Sample .78 .80
Attitudes toward Immigration
The student questionnaire included eight items measuring attitudes towardimmigration that were assumed to be uni-dimensional. Table 8.16 shows theitem wording and indicates the two items that had to be reversed for scaling.
The assumed one-factor solution for all these items was not entirely supportedby the results of the CFA. The resulting model fit was rather poor and, in manycountries, the RMSEA fit index was above .08. Item H7 was discarded becauseof its low item reliability. This was probably due to the wording, which did notnecessarily reflect favorable or unfavorable attitudes toward immigrants and somight have been viewed as a somewhat factual statement.
CHAPTER 8 SCALING PROCEDURES FOR LIKERT-TYPE ITEMS

112 IEA CIVIC EDUCATION STUDY TECHNICAL REPORT
The model fit for the one-factor solution without Item H7 was furtherimproved by introducing a correlation between the error terms for Items H1and H4. Both items refer to the cultural integration of immigrants. To illustratethe effect of wording on the item responses, a correlation between the errorsfor these items was estimated in the final model. The resulting model had aclose fit (see Figure 8.6).
Table 8.16 Items on immigration
IMMIG: Positive Attitudes toward Immigrants
H1 Immigrants should have the opportunity [option] to keep [continue speaking] their
own language.
H2 Immigrants’ children should have the same opportunities for education that other
children in the country have.
H3 Immigrants who live in a country for several years should have the opportunity to vote
in elections.
H4 Immigrants should have the opportunity [option] to keep [continue] their own
customs and lifestyle.
H5 Immigrants should have all the same rights that everyone else in a country has.
H6* Immigrants should be forbidden to engage in political activity.
H7* Having many immigrants makes it difficult for a country to be united and patriotic.
H8 All countries should accept refugees who are trying to escape from wars or political
persecution in other countries.
Notes: Categories—strongly disagree, disagree, agree, strongly agree. *Reversed items.
Figure 8.6 One-factor solution for immigrant items
Note: Standardized maximum likelihood estimates for international sample of 14-year-olds. RMSEA = .046, AGFI = .98,
NNFI = .98, CFI = .99.
IMMIG
0.66
0.43
0.59
0.63
0.50
0.80
0.80
H1
H2
H3
H4
H5
H8
H6
0.58
0.75
0.64
0.60
0.71
0.45
0.45
1.00
0.16
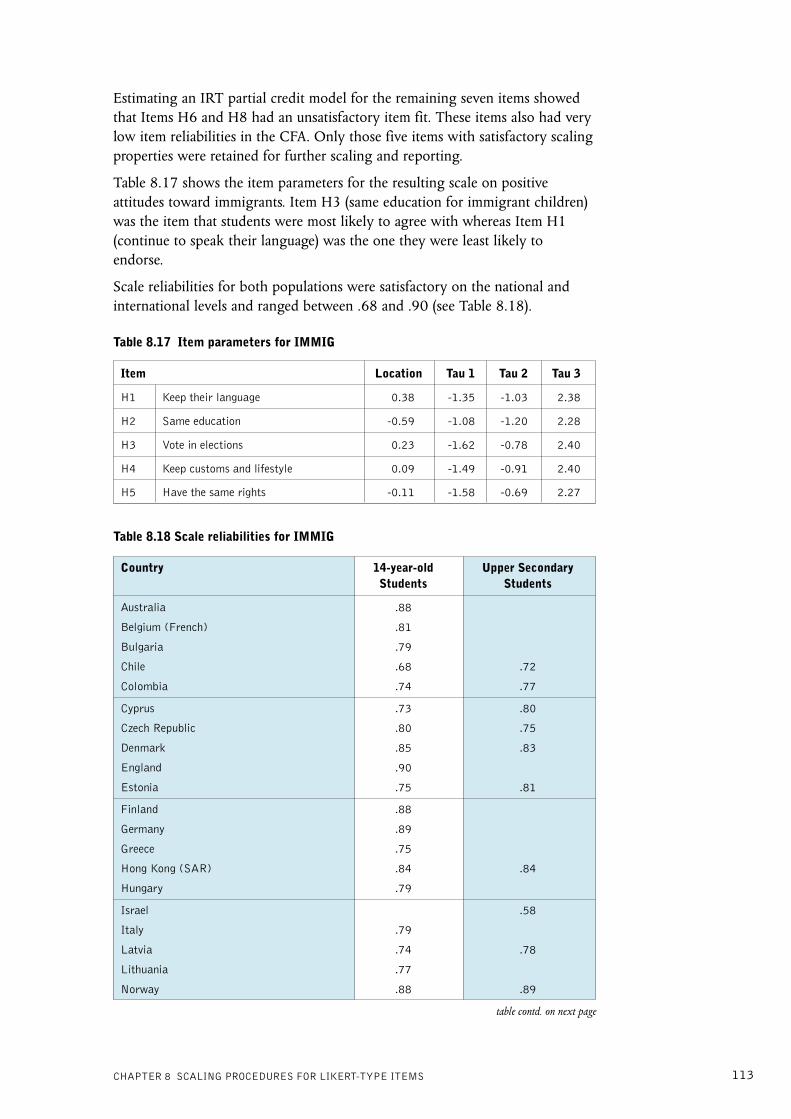
113
Estimating an IRT partial credit model for the remaining seven items showedthat Items H6 and H8 had an unsatisfactory item fit. These items also had verylow item reliabilities in the CFA. Only those five items with satisfactory scalingproperties were retained for further scaling and reporting.
Table 8.17 shows the item parameters for the resulting scale on positiveattitudes toward immigrants. Item H3 (same education for immigrant children)was the item that students were most likely to agree with whereas Item H1(continue to speak their language) was the one they were least likely toendorse.
Scale reliabilities for both populations were satisfactory on the national andinternational levels and ranged between .68 and .90 (see Table 8.18).
Table 8.17 Item parameters for IMMIG
Item Location Tau 1 Tau 2 Tau 3
H1 Keep their language 0.38 -1.35 -1.03 2.38
H2 Same education -0.59 -1.08 -1.20 2.28
H3 Vote in elections 0.23 -1.62 -0.78 2.40
H4 Keep customs and lifestyle 0.09 -1.49 -0.91 2.40
H5 Have the same rights -0.11 -1.58 -0.69 2.27
Table 8.18 Scale reliabilities for IMMIG
Country 14-year-old Upper SecondaryStudents Students
Australia .88
Belgium (French) .81
Bulgaria .79
Chile .68 .72
Colombia .74 .77
Cyprus .73 .80
Czech Republic .80 .75
Denmark .85 .83
England .90
Estonia .75 .81
Finland .88
Germany .89
Greece .75
Hong Kong (SAR) .84 .84
Hungary .79
Israel .58
Italy .79
Latvia .74 .78
Lithuania .77
Norway .88 .89
CHAPTER 8 SCALING PROCEDURES FOR LIKERT-TYPE ITEMS
table contd. on next page

114 IEA CIVIC EDUCATION STUDY TECHNICAL REPORT
Table 8.18 contd. from previous page
Country 14-year-old Upper SecondaryStudents Students
Poland .80 .82
Portugal .67 .70
Romania .67
Russian Federation .73 .80
Slovak Republic .76
Slovenia .78 .74
Sweden .90 .89
Switzerland .86 .83
United States .85
International Sample .82 81
School Participation
For the items on school participation, a single dimension was assumed. Table8.19 shows the wording of these items.
The one-dimensional solution, however, was not confirmed by the CFA. Themodel fit was poor (RMSEA = .117, AGFI = .89, NNFI = .77, CFI = .84),and in most countries the model fit was unsatisfactory. An alternative, two-dimensional model was estimated with the following two dimensions:
• General confidence in school participation (CONFS), relating to itemsindicating whether students think that student activities in school may beeffective.
• Self-confidence in school participation (SCON), relating to items indicatingwhether students themselves are willing to act.
Items J6 and J7 related to SCON, and Items J1, J2, J3, and J5 related toCONFS. Item J4 loaded on both factors because it related to the self-conceptof a student and the concept of what students can achieve through studentorganization.
Figure 8.7 shows the two-factor solution for these items. The model has a verygood fit for the international sample; in most countries, the RMSEA was below.05. The two-factor structure for this set of items was clearly supported by thedata.

115
Table 8.19 Items on school participation
CONFS: Confidence in Participation at School
J1 Electing student representatives to suggest changes in how the school is run [how to
solve school problems] makes schools better.
J2 Lots of positive changes happen in this school when students work together.
J3 Organizing groups of students to state their opinions could help solve problems in this
school.
J4* If members of my class felt they were unfairly treated, I would be willing to go with
them to speak to the teacher.
J5 Students acting together [in groups] can have more influence on what happens in this
school than students acting alone [by themselves].
J6* I am interested in participating in discussions about school problems.
J7* When school problems are being discussed I usually have something to say.
Note: Categories—strongly disagree, disagree, agree, strongly agree. *Items not included in the final scaling.
Figure 8.7 Two-factor solution for items on school participation
Note: Standardized maximum likelihood estimates for international sample of 14-year-olds. RMSEA = .032, AGFI = .99,
NNFI = .98, CFI = .99.
Because the second factor consisted of three items only, with J4 loading alsoon both factors, only the confidence in participation in school (CONFS) scalewas selected. Item J4 was discarded due to its double loading on both factors.
Table 8.20 shows the item parameters for these four items. The locationparameters are generally very close to each other, showing that they had similarprobabilities of being endorsed by the 14-year-old students.
Scale reliabilities for both populations were moderate to good in most countriesand ranged from .56 to .80 (see Table 8.21).
CONFS
0.63
0.62
0.60
0.77
0.80
0.45
0.57
J1
J2
J3
J5
J4
J6
J7
0.61
0.61
0.63
0.48
0.26
0.26
0.74
0.65
SCON
1.00
1.00
0.53
CHAPTER 8 SCALING PROCEDURES FOR LIKERT-TYPE ITEMS

116 IEA CIVIC EDUCATION STUDY TECHNICAL REPORT
Table 8.20 Item parameters for CONFS
Item Location Tau 1 Tau 2 Tau 3
J1 Electing representatives 0.23 -1.03 -1.09 2.12
J2 Students working together -0.12 -1.33 -0.93 2.26
J3 Organizing groups -0.03 -1.46 -0.98 2.44
J5 Students acting together -0.09 -1.12 -0.90 2.02
Table 8.21 Scale reliabilities for CONFS
Country 14-year-old Upper SecondaryStudents Students
Australia .76
Belgium (French) .67
Bulgaria .78
Chile .57 .64
Colombia .59 .61
Cyprus .67 .77
Czech Republic .57 .56
Denmark .72 .76
England .75
Estonia .69 .80
Finland .72
Germany .68
Greece .69
Hong Kong (SAR) .75 .77
Hungary .64
Israel .80
Italy .61
Latvia .65 .67
Lithuania .73
Norway .75 .78
Poland .75 .77
Portugal .69 .70
Romania .62
Russian Federation .56 .65
Slovak Republic .60
Slovenia .65 .64
Sweden .75 .77
Switzerland .66 .69
United States .79
International Sample .69 .73

117
Expected Political Participation
The student questionnaire included 12 items asking about the students’expected political participation. Five of these items related to conventionalparticipation (CONV), four to unconventional or social movement-relatedparticipation (UNCONV), and three to protest activities (PROTE). Table 8.22lists these items and their corresponding theoretical dimensions.
A CFA showed that this initial three-factor solution had an unsatisfactorymodel fit and was not supported by the data. Discarding five of these itemsresulted in a two-factor solution (see Figure 8.8) with political activities(POLAT) and protest activities (PROTE), which had a good model fit for theinternational sample and the country sub-samples. Only POLAT was retainedfor scaling and reporting.
Table 8.22 Items on political participation and expected dimensions
Item CONV UNCONV PROTE
M1* Vote in national elections X
M2* Get information about candidates before Xvoting in an election
M3 Join a political party X
M4 Write letters to a newspaper about social or Xpolitical concerns
M5 Be a candidate for a local or city office X
M6* Volunteer time to help [benefit] [poor or elderly] Xpeople in the community
M7* Collect money for a social cause X
M8* Collect signatures for a petition X
M9* Participate in a non-violent [peaceful] protest Xmarch or rally
M10* Spray-paint protest slogans on walls X
M11* Block traffic as a form of protest X
M12* Occupy public buildings as a form of protest X
Notes: Categories—I will certainly not do this; I will probably not do this; I will probably do this; I will certainly do this.
*Items not included in the final scaling.
CHAPTER 8 SCALING PROCEDURES FOR LIKERT-TYPE ITEMS

118 IEA CIVIC EDUCATION STUDY TECHNICAL REPORT
Figure 8.8 Two-factor solution for expected participation
Note: Standardized maximum likelihood estimates for international sample of 14-year-olds. RMSEA = .039, AGFI = .99,
NNFI = .98, CFI = .99.
The IRT scaling analysis showed that although all of these items hadsatisfactory fit statistics for the pooled international sample, Item M8 hadunsatisfactory scaling properties in all but two countries and so was discarded.
Table 8.23 shows the item parameters for the three items measuring politicalactivities (POLAT). The location parameters are very close to each other,indicating a similar level of endorsement. The scale reliabilities weresatisfactory in a majority of countries for both populations (14-year-oldstudents and upper secondary students) (see Table 8.24).
Table 8.23 Item parameters for POLAT
Item Location Location Tau 1 Tau 2 Tau 3
M3 Join political party 0.00 -1.89 0.32 1.57
M4 Write letters -0.08 -2.05 0.37 1.68
M5 Be a candidate 0.08 -1.77 0.29 1.48
POLAT
0.56
0.56
0.57
0.80
0.55
0.29
0.33M12
M11
M10
M8
M3
M4
M5
0.67
0.66
0.66
0.44
0.67
0.84
0.82
PROTE
1.00
1.00
0.30

119
Table 8.24 Scale reliabilities for POLAT
Country 14-year-old Upper SecondaryStudents Students
Australia .78
Belgium (French) .72
Bulgaria .76
Chile .69 .75
Colombia .65 .70
Cyprus .68 .72
Czech Republic .71 .75
Denmark .76 .76
England .77
Estonia .75 .81
Finland .74
Germany .72
Greece .71
Hong Kong (SAR) .82 .80
Hungary .65
Israel .77
Italy .72
Latvia .72 .73
Lithuania .79
Norway .72 .79
Poland .73 .78
Portugal .62 .67
Romania .68
Russian Federation .72 .78
Slovak Republic .72
Slovenia .69 .73
Sweden .76 .76
Switzerland .77 .75
United States .74
International Sample .73 .75
Teaching Styles
The student questionnaire included 12 items on teaching style that weredesigned to measure two different dimensions: open climate for classroomdiscussion (CCLIM), reflecting a teaching that encourages free andcontroversial discussions and respects diverging opinions, and lecturing style(LECTR), indicating a teaching style that places emphasis on lecturing andtesting achievement. Table 8.25 shows the item wording and assignment to thelatent constructs.
CHAPTER 8 SCALING PROCEDURES FOR LIKERT-TYPE ITEMS

120 IEA CIVIC EDUCATION STUDY TECHNICAL REPORT
Table 8.25 Items on teaching style
CCLIM: Open Climate for Classroom Discussion
N1 Students feel free to disagree openly with their teachers about political and social
issues during class.
N2 Students are encouraged to make up their own minds about issues.
N3 Teachers respect our opinions and encourage us to express them during class.
N5 Students feel free to express opinions in class even when their opinions are different
from most of the other students.
N7 Teachers encourage us to discuss political or social issues about which people have
different opinions.
N8 Teachers present several sides of [positions on] an issue when explaining it in class.
N9* Students bring up current political events for discussion in class.
LECTR: Lecturing Style
N4* Teachers place great importance [stress, emphasis] on learning facts or dates when
presenting history or political events.
N6* Teachers require students to memorize dates or definitions.
N10* Memorizing dates and facts is the best way to get a good grade [mark] from teachers
in these classes.
N11* Teachers lecture and the students take notes.
N12* Students work on material from the textbook.
Notes: Categories—strongly disagree, disagree, agree, strongly agree. *Items not included in the final scaling.
The initial two-factor solution for this set of items had an acceptable fit ofRMSEA = .067. Inspection of squared correlations showed that the itemreliabilities for Items N11 and N12 were below .10. An alternative and slightlymodified model was specified without items N11 and N12 (see Figure 8.9).Here, Item 4 (emphasis on dates and facts) also loaded on CCLIM, andcorrelated error terms for Items N1-2 and N7-9 were included. Items N1 andN2 have a very similar meaning (disagreement, own minds), and Items N7 andN9 both emphasize discussion of issues, similarities that are reflected in thecommon residual variance terms for these pairs of items. Figure 8.9 shows thefinal two-factor solution, which had a satisfactory model fit. Given that thelecturing style construct was measured with only three items, one of themclearly related to both factors, a decision was made to retain only open climatefor classroom discussion (CCLIM) with the six items that had the highestfactor loadings.
Table 8.26 shows the IRT item parameter for the teaching style scale. Item N5(students feel free to express their opinion) was, on average, the item studentswere most likely to agree with, whereas Item N7 (teachers encourage us todiscuss political and social issues) was the one students found hardest one toendorse. Table 8.27 shows that scale reliabilities were highly satisfactory forboth international samples (.77 for the 14-year-old students and .79 for theupper secondary students); the range was between .68 and .83 across thecountries.

121
Figure 8.9 Two-factor solution for classroom items
Note: Standardized maximum likelihood estimates for international sample of 14-year-olds. RMSEA = .042, AGFI = .99,
NNFI = .96, CFI = .97.
Table 8.26 Item parameters for CCLIM
Item Location Tau 1 Tau 2 Tau 3
N1 Students disagree openly 0.13 -0.95 -0.23 1.18
N2 Students are encouraged -0.24 -1.04 -0.18 1.23
N3 Teachers respect opinions -0.17 -0.89 -0.19 1.08
N5 Students feel free -0.35 -1.13 -0.17 1.31
N7 Teachers encourage 0.65 -1.25 -0.30 1.54
N8 Teacher presents several sides -0.02 -1.29 -0.35 1.64
CCLIM
0.75
0.65
0.58
0.68
0.72
0.71
0.83
0.69
0.52
0.65
N1
N2
N3
N5
N7
N8
N9
N4
N6
N10
0.50
0.59
0.65
0.57
0.53
0.53
0.41
0.34
0.69
0.59
0.39LECTR
0.15
0.21
1.00
1.00
0.16
CHAPTER 8 SCALING PROCEDURES FOR LIKERT-TYPE ITEMS

122 IEA CIVIC EDUCATION STUDY TECHNICAL REPORT
Table 8.27 Scale reliabilities for CCLIM
Country 14-year-old Upper SecondaryStudents Students
Australia .81
Belgium (French) .78
Bulgaria .72
Chile .73 .78
Colombia .69 .76
Cyprus .68 .76
Czech Republic .78 .75
Denmark .82 .77
England .80
Estonia .75 .79
Finland .80
Germany .78
Greece .71
Hong Kong (SAR) .79 .81
Hungary .71
Israel .78
Italy .79
Latvia .72 .78
Lithuania .70
Norway .79 .80
Poland .82 .82
Portugal .73 .78
Romania .69
Russian Federation .75 .78
Slovak Republic .75
Slovenia .73 .72
Sweden .79 .83
Switzerland .79 .82
United States .82
International Sample .77 .79
THE PROCESS OF ITEM ADJUDICATIONItem parameters and fit statistics for each country’s data sets were estimated forthe item adjudication. The adjudication was based on the resulting itemstatistics. The following conditions were set as an indication of problematicscaling properties that could lead to the discarding of items from scaling:
• The weighted mean square residual of an item in any country is anindication of item misfit.
• Items should have a satisfactory item-total correlation.
• No category disordering should be observed, that is, means of latent estimatesshould not be out of sequence across categories.
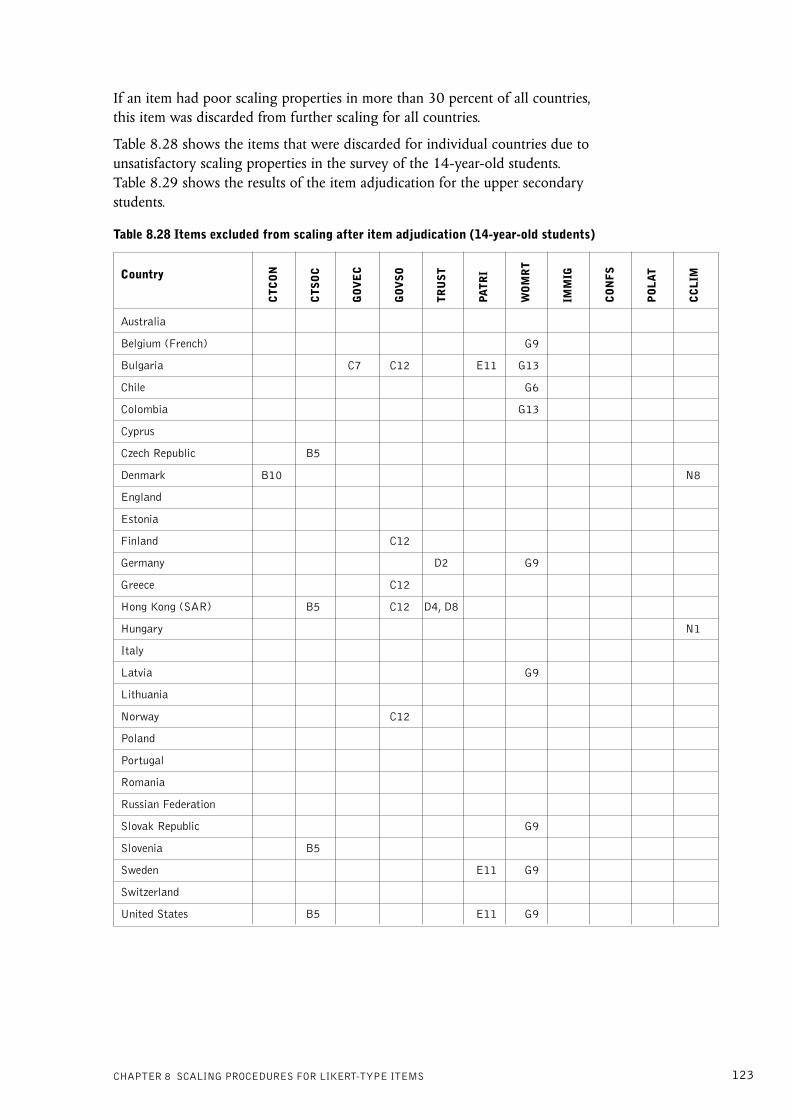
123
If an item had poor scaling properties in more than 30 percent of all countries,this item was discarded from further scaling for all countries.
Table 8.28 shows the items that were discarded for individual countries due tounsatisfactory scaling properties in the survey of the 14-year-old students.Table 8.29 shows the results of the item adjudication for the upper secondarystudents.
Table 8.28 Items excluded from scaling after item adjudication (14-year-old students)
Country
Australia
Belgium (French) G9
Bulgaria C7 C12 E11 G13
Chile G6
Colombia G13
Cyprus
Czech Republic B5
Denmark B10 N8
England
Estonia
Finland C12
Germany D2 G9
Greece C12
Hong Kong (SAR) B5 C12 D4, D8
Hungary N1
Italy
Latvia G9
Lithuania
Norway C12
Poland
Portugal
Romania
Russian Federation
Slovak Republic G9
Slovenia B5
Sweden E11 G9
Switzerland
United States B5 E11 G9
CT
CO
N
CT
SO
C
GO
VE
C
GO
VS
O
TR
US
T
PAT
RI
WO
MR
T
IMM
IG
CO
NF
S
PO
LA
T
CC
LIM
CHAPTER 8 SCALING PROCEDURES FOR LIKERT-TYPE ITEMS

124 IEA CIVIC EDUCATION STUDY TECHNICAL REPORT
STUDENT SCORESAfter the item adjudication, international item parameters were estimated foreach scale based on a calibration sample of 500 randomly selected students percountry (14,000 students from the population of 14-year-old students). Theseitem parameters were used to compute ML estimates for each sub-sample. Onthe basis of the results of the item adjudication, some items were excluded fromscaling.
The person parameters (logits) were transformed to the international metricwith an international mean of 10 and a standard deviation of 2. Thetransformation was achieved by applying the formula
where ’n are the student scores in the international metric, n the original logit
scores, is the international mean of student logit scores with equallyweighted country sub-samples, and is the corresponding internationalstandard deviation.
For the upper secondary students, the same item parameters derived from thepopulation of 14-year-old students were used to scale the data. The resultingstudent scores were transformed to the same international metric. Table 8.30shows the means and standard deviations of student logit scores (14-year-oldstested in 1999) used for the transformation into the international metric.
Table 8.29 Items excluded from scaling after item adjudication (upper secondarystudents)
CT
CO
N
CT
SO
C
GO
VE
C
GO
VS
O
TR
US
T
PAT
RI
WO
MR
T
IMM
IG
CO
NF
S
PO
LA
T
CC
LIMCountry
Chile
Colombia G13
Cyprus
Czech Republic B5
Denmark
Estonia
Hong Kong (SAR) C12
Israel E11 H3
Latvia C12 G9
Norway
Poland
Portugal
Russian Federation G9
Slovenia B5
Sweden E11 G9
Switzerland G9
’n = 10 + 2n –
( )

125
Table 8.30 International means and standard deviations for IRT scales (logits) for 14-year-old students tested in 1999
Scale Mean Standard Deviation
CTCON 0.35 1.09
CTSOC 1.13 1.37
GOVSOC 1.00 1.10
GOVEC 1.54 1.24
TRUST 0.05 1.39
PATRI 1.32 1.44
WOMRT 1.57 1.54
IMMIG 1.28 1.86
CONFS 1.42 1.64
POLAT -1.43 1.79
CCLIM 0.76 1.32
SUMMARYEleven scales were constructed for the Likert-type items on the students’concepts, attitudes, and actions. Generally, the expected dimensional structureswere confirmed in the CFA. In some cases, a re-specification was deemedappropriate and some of the initially hypothesized dimensions were notsupported by the data. Despite the relative shortness of most scales, theirreliabilities across countries were mostly satisfactory.
The IRT partial credit model was used for the scaling of Likert-type items. Useof this methodology allowed a better assessment of item fit and an elegant wayof dealing with the problem of missing responses. ML estimates were computedand then transformed into international scores, giving international averages of10 and standard deviations of 2.
REFERENCESAdams, R., Wu. M., & Macaskill, G. (1997). Scaling methodology and procedures for themathematical and science scales. In M. O. Martin & D. L. Kelly (Eds.), TIMSS technical report,volume II: Implementation and analysis—primary and middle school years (pp. 111–145). ChestnutHill, MA: Boston College.
Amadeo, J., Torney-Purta, J., Lehmann, R., Husfeldt, V., & Nikolova, R. (2002). Civic knowledgeand engagement: An IEA study of upper secondary students in sixteen countries. Amsterdam:International Association for the Evaluation of Educational Achievement (IEA).
Andersen, E. B. (1997). The rating scale model. In W. J. van der Linden & R. K. Hambleton(Eds.), Handbook of modern item response theory (pp. 67–84). New York/Berlin/Heidelberg:Springer.
Browne, M. W., & Cudeck, R. (1993). Alternative ways of assessing model fit. In K. A. Bollen& S. J. Long (Eds.), Testing structural equation models (pp. 36–162). Newbury Park/London: SagePublications.
Gerbing, D. W., & Anderson, J. C. (1993). Monte Carlo evaluations of goodness-of-fit indicesfor structural equation models. In K. A. Bollen & S. J. Long (Eds.), Testing structural equationmodels (pp. 136–162). Newbury Park/London: Sage Publications.
CHAPTER 8 SCALING PROCEDURES FOR LIKERT-TYPE ITEMS

126 IEA CIVIC EDUCATION STUDY TECHNICAL REPORT
Gustafsson, J. E & Stahl, P. A. (2000). STREAMS user’s guide, Version 2.5 for Windows. Mölndal,Sweden: MultivariateWare.
Hox, J. J., & Bechger, T. M. (1998). An introduction to structural equation modeling. FamilyScience Review, 11(4), 234–373.
Jöreskog, K. G. (1993). Testing structural equation models. In K. A. Bollen & S. J. Long (Eds.),Testing structural equation models (pp. 294–316). Newbury Park/London: Sage Publications.
Jöreskog, K. G., & Sörbom, D. (1993). LISREL 8 user’s reference guide. Chicago: ScientificSoftware International.
Masters, G. N., & Wright, B. D. (1997). The partial credit model. In W. J. van der Linden & R.K. Hambleton (Eds.), Handbook of modern item response theory (pp. 101–122). New York/Berlin/Heidelberg: Springer.
Mislevy, R. (1991). Randomization-based inference about latent variables from complexsamples. Psychometrika, 56(2), 177–196.
Torney-Purta, J., Lehmann, R., Oswald, H., & Schulz, W. (2001). Citizenship and education intwenty-eight countries: Civic knowledge and engagement at age fourteen. Amsterdam: InternationalAssociation for the Evaluation of Educational Achievement (IEA).
Wright, B. D., & Masters, G. N. (1982). Rating scale analysis: Rasch measurement. Chicago: MESAPress.
Wu, M. L., Adams, R. J., & Wilson, M. R. (1997). ConQuest: Multi-aspect test software (computerprogram). Camberwell, Vic.: Australian Council for Educational Research.

127
Chapter 9:
MAPPING STUDENT SCORES TO ITEMRESPONSESWolfram Schulz
OVERVIEWIn the IEA Civic Education Study (CivEd), categorical items from the studentquestionnaire were scaled using item response theory (IRT) modeling.Maximum likelihood (ML) estimates (logits) for the latent dimension weretransformed to a scale with an international average of 10 and a standarddeviation of 2. These scores can be interpreted by comparing individual scoresor group average scores to the international mean, but they do not revealanything about the actual item responses. Nor is it possible to determine fromscale score values the extent to which students endorsed the items used for themeasurement of the latent variable.
This chapter describes how the properties of the IRT scaling for categoricalitems were used to describe item characteristics and to map scale scores againstexpected item responses. The scale positive attitudes toward women’s political andeconomic rights (see details on scaling in Chapter 8) and particularly the(negatively phrased) Item G9 (When jobs are scarce, men [should] have morerights to a job than women) are chosen to illustrate methodology andprocedure (see details on scaling in Chapter 8). As the scale was designed tomeasure positive attitudes, and the example item was negatively phrased, it hadto be reversed so that its four categories were coded 0 (strongly agree), 1(agree), 2 (disagree), and 3 (strongly disagree).
PROPERTIES OF THE PARTIAL CREDIT MODELThe partial credit model (see Masters & Wright, 1997; Wright & Masters,1982) used in the IEA Civic Education Study is an extension of the Rasch one-parameter model for dichotomous items (Rasch, 1960) and can be written as
Pxi () = , x = 0, 1, 2, ..., m
i
where Pxi () denotes the probability of person n to score x on item i, ij gives
the location of step j for item i on the latent dimension, and n denotes thelocation of person n on the latent dimension.1
exp (∑n – ij)
1 + exp (∑n – ij)
x
j=0
k
j=1
1 Note that the form of the equation is slightly different from that given in Chapter 8, where an itemparameter i and step parameter ij are used. The “delta” parameters for an item are equal to the sumsof its location parameter and its step parameters, that is, ij = i + ij.

128 IEA CIVIC EDUCATION STUDY TECHNICAL REPORT
From the item parameters, it is possible to derive the probabilities for choosingeach item response. Figure 9.1 shows the item characteristic curves for ItemG9. Each of the four curves represents the probability of choosing a categorydepending on the person’s score on the latent dimension . The four curves arenot empirical curves but depend entirely on the estimated model. If the itemfits the model, one can predict the probabilities to select a certain category foreach scale score.
Figure 9.1 Category characteristic curves for Item G9
The four curves can be computed based on the parameters 1, 2, and 3. The parameters indicate points of intersection for each category curve on thelatent dimension. 1 corresponds to the logit at the intersection between thelowest category 0 and the next category 1, 2 is determined by the intersectionbetween scores 1 and 2, and 3 by the intersection between categories 2 and 3.This means that, for logit scores below 1, the lowest category (strongly agree)is the one most likely to be chosen, between 1 and 2 is the second category(agree) most likely to be chosen, and so on.
For some items, due to reversed parameters, it may happen that a category isless likely to be chosen than others at any point of the latent continuum.However, this does not mean that this category is not chosen; it may still have areasonable probability of response for a range of scores.
A second possibility for describing the item characteristics as derived from thepartial credit model is summing the probabilities for curves, that is, computingthe odds of scoring higher than a particular category. The results for Item G6are displayed in Figure 9.2. The three vertical lines denote the points on thelatent continuum where it becomes more likely to score >0, >1, or >2. Theselocations k—so-called Thurstonian thresholds—can be obtained through aniterative procedure.
-4.00 -3.00 -2.00 -1.00 1.00 2.00 3.00.00 4.000.0
.2
.4
.6
.8
1.0
THETA
Pro
babi
lity
Strongly Agree Strongly DisagreeDisagreeAgree
1 2 3

129
Figure 9.2 Summed category probabilities for Item G9
Summed probabilities are not identical with expected item scores. They have tobe understood in terms of the odds of scoring at least a particular category. Forexample, 1 is the point on the latent dimension where scoring 1 or morebecomes more likely than scoring the lowest category 0.
A third way of describing item properties using the partial credit model is thecomputation of expected item scores. The expected item scores can becalculated as the sum of the products of each category probability Pijh with itscorresponding category score h:
Figure 9.3 shows the expected item scores as a function of the latent variable .The lowest category 0 (strongly agree) may be defined as the range of attitudesfor which the expected score is between 0 and 0.5. Likewise, the probability ofchoosing the second category (agree) would be highest for the range of scorepoints with an expected scale score from 0.5 to 1.5, and so on.
Based on this information, it is possible to map the latent score against theexpected item responses. In order to provide such a mapping, it is necessary tofind those points on the latent variable at which Ex = 0.5, 1.5, etc. Thethresholds k that give the corresponding locations on can be estimated withan iterative procedure that calculates expected scores for each (decimal) pointon the latent variable.
-4.00 -3.00 -2.00 -1.00 1.00 2.00 3.00.00 4.000.0
.2
.4
.6
.8
1.0
THETA
Pro
babi
lity
Strongly Agree Strongly DisagreeDisagreeAgree
1 2 3
CHAPTER 9 MAPPING STUDENT SCORES TO ITEM RESPONSES
Ex = ∑ hPijh
m1
h= 0
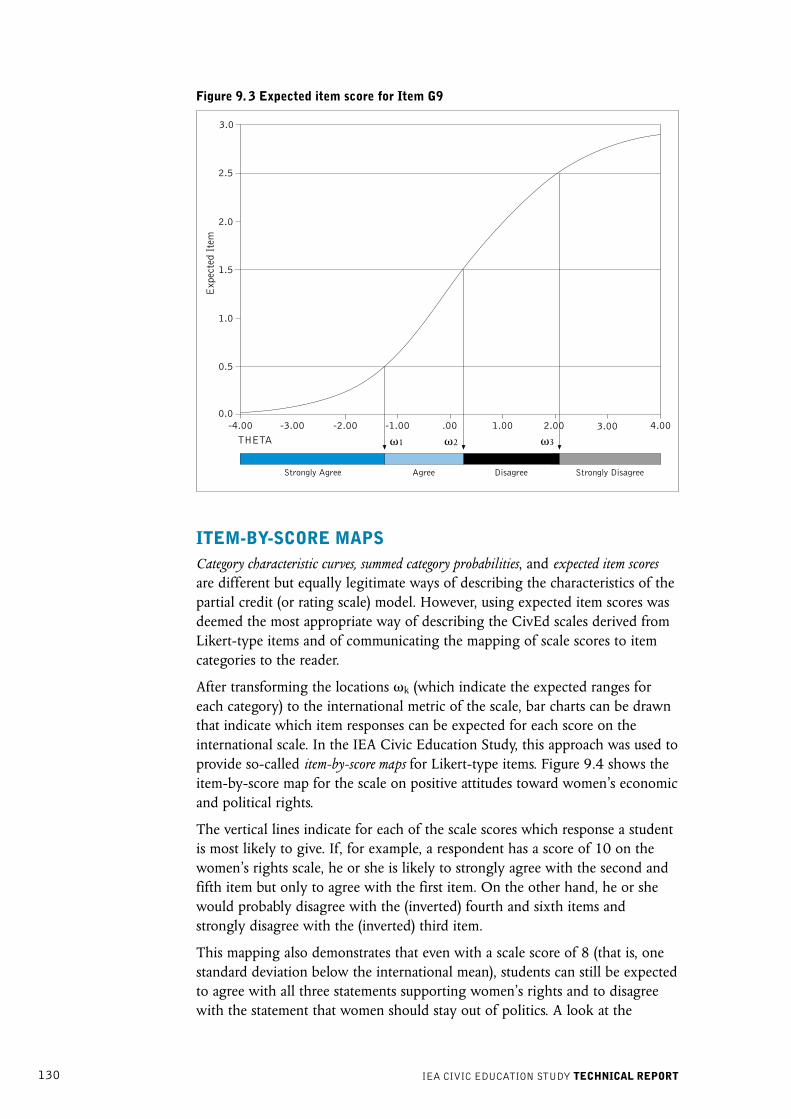
130 IEA CIVIC EDUCATION STUDY TECHNICAL REPORT
Figure 9. 3 Expected item score for Item G9
ITEM-BY-SCORE MAPSCategory characteristic curves, summed category probabilities, and expected item scoresare different but equally legitimate ways of describing the characteristics of thepartial credit (or rating scale) model. However, using expected item scores wasdeemed the most appropriate way of describing the CivEd scales derived fromLikert-type items and of communicating the mapping of scale scores to itemcategories to the reader.
After transforming the locations k (which indicate the expected ranges foreach category) to the international metric of the scale, bar charts can be drawnthat indicate which item responses can be expected for each score on theinternational scale. In the IEA Civic Education Study, this approach was used toprovide so-called item-by-score maps for Likert-type items. Figure 9.4 shows theitem-by-score map for the scale on positive attitudes toward women’s economicand political rights.
The vertical lines indicate for each of the scale scores which response a studentis most likely to give. If, for example, a respondent has a score of 10 on thewomen’s rights scale, he or she is likely to strongly agree with the second andfifth item but only to agree with the first item. On the other hand, he or shewould probably disagree with the (inverted) fourth and sixth items andstrongly disagree with the (inverted) third item.
This mapping also demonstrates that even with a scale score of 8 (that is, onestandard deviation below the international mean), students can still be expectedto agree with all three statements supporting women’s rights and to disagreewith the statement that women should stay out of politics. A look at the
-4.00 -3.00 -2.00 -1.00 1.00 2.00 3.00.00 4.000.0
0.5
1.0
2.0
2.5
3.0
THETA
Exp
ecte
d It
em
Strongly Agree Strongly DisagreeDisagreeAgree
1 2 3
1.5

131
international metric might suggest that students with this score will hold morenegative attitudes toward women’s rights.
Figure 9.4 Item-by-score map for women’s economic and political rights
SUMMARYIRT scores cannot be interpreted with regard to their content unless they aremapped to the expected item responses. Item-by-score maps illustrate that forsome scales even scores of one standard deviation below the internationalaverage may still indicate rather positive responses. This situation would nothave been revealed by the international score values indicating the positionrelative to the international average. The item-by-score maps used in thereports of the IEA Civic Education Study enable readers of reports to interpretmeans and mean differences of IRT scale scores between countries or groups ofstudents.
Item
Women should run for public office andtake part in the government just as mendo.
Women should have the same rights asmen in every way.
Women should stay out of politics.(negative)
When jobs are scarce, men have moreright to a job than women.(negative)
Men and women should get equal paywhen they are in the same jobs.
Men are better qualified to be politicalleaders than women.(negative)
Sum
...public office 4 7 48 41 100
...same rights 3 6 32 58 100
...politics 52 33 9 6 100
...job 40 35 17 8 100
...equal pay 3 6 33 58 100
...political leaders 36 36 19 9 100
Note: The bars indicate the expected response of an item for a given scale score on the horizontal axis. International itemfrequencies are based on all 28 equally weighted country data.
stronglydisagree agree strongly agree
International Item Frequencies(percent)
Scores
4 6 8 10 12 14 16
strongly disagree
disagree
agree
strongly agree
disagree
...job
CHAPTER 9 MAPPING STUDENT SCORES TO ITEM RESPONSES
Source: IEA Civic Education Study, Standard Population of 14-year-olds tested in 1999.

132 IEA CIVIC EDUCATION STUDY TECHNICAL REPORT
REFERENCESMasters, G. N., & Wright, B. D. (1997). The partial credit model. In W. J. van der Linden & R.K. Hambleton (Eds.), Handbook of modern item response theory (pp. 101–122). New York/Berlin/Heidelberg: Springer.
Rasch, G. (1960). Probabilistic models for some intelligence and attainment tests. Copenhagen: Nielsen& Lydiche.
Wright, B. D., & Masters, G. N. (1982). Rating scale analysis: Rasch measurement. Chicago: MESAPress.

133
Chapter 10:
REPORTING STUDENT AND TEACHERDATAWolfram Schulz and Rainer Lehmann
OVERVIEWThis chapter describes how the international student and teacher data werereported. Test and questionnaire results were compared across countries, andcountry averages were compared with the international average. Reportingrequired an appropriate treatment of missing values, procedures to estimate thesampling variance, the computation of significance tests for mean differences,and a correction for multiple comparisons. The chapter also describes theanalysis of the effects of background and school variables on civic knowledgeand civic engagement, and the reporting of data from the teacher survey.
TREATMENT OF MISSING VALUESIn most types of survey research, large amounts of missing data often causeproblems with data analysis. For the reporting of cognitive items used in theIEA Civic Education Study (CivEd), missing responses were generally treated asincorrect responses unless the respective item had not been administered or hadbeen excluded from scaling. However, so-called “not reached items”, that is,items at the end of the test that students had been unable to attempt due tolack of time, were treated as missing responses for the international itemcalibration (see Chapter 7 for details).
For background and Likert-type items on students’ concepts, attitudes, andactions, higher amounts of missing values needed to be addressed. A variety ofmethods are available to deal with item non-response (see Winglee, Kalton,Rust, & Kaspryzk, 2001). Imputation methods can be considered, such as EMalgorithms (using an iterative maximum likelihood procedure providing estimatesof means and variance-covariance matrices based on all available data for eachrespondent); so, too, can available case analysis (using all available data fromstudents for regression analysis in a pair-wise fashion), or hot-deck imputation(where missing values are actually substituted based on information availablefor classes of respondents). The use of imputation methods, however, iscomputationally extensive and would have required additional resources andtime for data analysis and management that were not available prior to thepublication of the two first international reports. Nonetheless, secondaryanalysis might reconsider imputation methods as ways of dealing with theconsiderable amount of missing data in some parts of the questionnaire data.
1 Parts of this chapter are based on Chapter 12 in the TIMSS Technical Report on the estimation ofsampling variance (see Gonzalez & Foy, 2000) and Chapter 16 in the same volume on the reporting ofstudent achievement (see Gonzalez & Gregory, 2000).
1

134 IEA CIVIC EDUCATION STUDY TECHNICAL REPORT
For the reporting of the non-cognitive components of the CivEd data, missingresponses, not administered items, and “don’t know” responses generally werenot included in the calculation of percentages and means. In some cases, adifferent treatment for “don’t know” responses might have been considered,2
but for consistency reasons such responses were excluded from reporting. IRTscaling of the Likert-type items used in this study provided an elegant way ofreducing the amount of missing information. This technique allowed us toobtain student scores for all students who had responded to at least one item ina scale (see Chapter 8 for details).
ESTIMATION OF SAMPLING VARIANCEStudent samples were obtained through two-stage cluster sampling procedures.During the first stage, schools were sampled from a sampling frame with aprobability proportional to their size; during the second stage, intactclassrooms were randomly sampled within schools (see Chapter 4 on the CivEdsampling design). Cluster sampling techniques permit an efficient andeconomic data collection, but given that the aforementioned samples were notsimple random samples, the usual formula to obtain standard errors forpopulation estimates was not appropriate.
Replication techniques provide tools to estimate the correct sampling varianceon population estimates (Gonzalez & Foy, 2000; Wolter, 1985). For the IEACivic Education Study, the jackknife repeated replication technique (JRR) wasused to compute standard errors for population means, percentages, andregression coefficients.
The JRR method for stratified samples generally requires pairing sampledschools as the primary sampling units (PSUs) into pseudo-strata or samplingzones. The assignment of schools to sampling zones therefore needed to beconsistent with the sampling frame from which they were sampled. In countrieswhere explicit stratification had been used, sampling zones were constructedwithin explicit strata. In the case of odd numbers of schools within an explicitstratum or of no explicit stratification within the sampling frame, the remainingschools were randomly divided into two halves to form pseudo-schools. InCyprus, where all schools were tested and two classrooms within each schoolhad been sampled, schools were defined as sampling zones and classrooms assampling units. Table 10.1 shows the number of sampling zones used in eachparticipating country.
2 In the case of items on media use, for example, it could be assumed that students who selected the“don’t know” category were not doing any such activities. Here, the percentages of students reportingto read newspapers or watch TV news more frequently that included students with “don’t know”responses might have provided better population estimates.

135
Table 10.1 Range of sampling zones used in each country
Country 14-year-old Upper SecondaryStudents Students
Australia 75
Belgium (French) 56
Bulgaria 74
Chile 75 75
Colombia 73
Cyprus 61 41
Czech Republic 75 75
Denmark 75 71
England 64
Estonia 75 72
Finland 73
Germany 75
Greece 75
Hong Kong (SAR) 75
Hungary 73
Israel 75
Italy 75
Latvia 66 63
Lithuania 75
Norway 75 62
Poland 75 75
Portugal 75 75
Romania 74
Russian Federation 56 56
Slovak Republic 73
Slovenia 75 73
Sweden 70 75
Switzerland 75 35
United States 40
Within each of these sampling zones, one school was randomly assigned avalue of 2 while the other school received a value of 0. Jackknife replicates wereformed by giving one of the paired schools a contribution of zero and theother school a double contribution; all other schools outside the sampling zonehad a contribution of one.
The replicate weights were then obtained by simply multiplying student weightswith the jackknife indicators of each replicate. As a result, for each jackknifereplicate a weight was added to the data file where, for one sampling zone at atime, one school received a double weight and one other school a zero weight.Table 10.2 illustrates this procedure with a simple example of 24 students fromsix different schools (A–F) paired into three sampling zones.
CHAPTER 10 REPORTING STUDENT AND TEACHER DATA

136 IEA CIVIC EDUCATION STUDY TECHNICAL REPORT
Table 10.2 Example for computation of replicate weights
ID Student School Sampling Jackknife Replicate Replicate ReplicateWeight Zone Indicator Weight 1 Weight 2 Weight 3
01 5.2 A 1 0 0.0 5.2 5.2
02 5.2 A 1 0 0.0 5.2 5.2
03 5.2 A 1 0 0.0 5.2 5.2
04 5.2 A 1 0 0.0 5.2 5.2
05 9.8 B 1 2 19.6 9.8 9.8
06 9.8 B 1 2 19.6 9.8 9.8
07 9.8 B 1 2 19.6 9.8 9.8
08 9.8 B 1 2 19.6 9.8 9.8
09 6.6 C 2 2 6.6 13.2 6.6
10 6.6 C 2 2 6.6 13.2 6.6
11 6.6 C 2 2 6.6 13.2 6.6
12 6.6 C 2 2 6.6 13.2 6.6
13 7.2 D 2 0 7.2 0.0 7.2
14 7.2 D 2 0 7.2 0.0 7.2
15 7.2 D 2 0 7.2 0.0 7.2
16 7.2 D 2 0 7.2 0.0 7.2
17 4.9 E 3 2 4.9 4.9 9.8
18 4.9 E 3 2 4.9 4.9 9.8
19 4.9 E 3 2 4.9 4.9 9.8
20 4.9 E 3 2 4.9 4.9 9.8
21 8.2 F 3 0 8.2 8.2 0.0
22 8.2 F 3 0 8.2 8.2 0.0
23 8.2 F 3 0 8.2 8.2 0.0
24 8.2 F 3 0 8.2 8.2 0.0
For each country sample, 75 replicate weights were computed regardless of thenumber of sampling zones, allowing for 150 schools per country. For countrieswhere more than 150 schools had been sampled, schools were collapsed toform larger pseudo-schools in order to keep the total number to 75. Incountries with fewer sampling zones, the remaining replicate weights wereequal to the original sampling weight.
To compute the sampling variance for the statistic t, the statistic is estimatedonce for the original sample S and then for each of the jackknife replicates.The JRR variance is computed using the formula
Varjrr (t)
= ∑[t( Jh) – t(S)]
where H is the number of sampling zones, t(S) the statistic t estimated for thepopulation using the original sampling weights, and t( Jh) the same statisticestimated using the weights for the h th jackknife replicate. The standard errorfor t is
(t)
= Varjrr
(t)
H
h=1
2

137
The computation of JRR variance can be obtained for any statistic. Standardstatistical software generally does not include any procedures for replicationtechniques. For the IEA Civic Education Study, SPSS macros were used toestimate JRR variance for means and percentages, and the software WesVarPC(Weststat Inc., 1997) provided standard errors for the coefficients of theregression models presented in both international reports.
REPORTING OF MEAN DIFFERENCES ACROSS COUNTRIESThe aim of the international reports of the IEA Civic Education Study was tocompare test and survey results across participating countries, that is, means ofscales and percentages were compared in graphs and tables. Each populationestimate was accompanied by its standard error. In addition, tests ofsignificance for the difference between estimates were provided to describe theprobability that differences were just a result of sampling error.
The following types of significance tests were reported:
• differences in population estimates between countries;
• differences in population estimates between countries and the internationalmean; and
• differences in population estimates between sub-groups within countries.
Multiple comparison charts allowed the comparison of population estimatesbetween one country and other participating countries. The significance testsincluded an adjustment for multiple comparison using a Bonferroni adjustment.This was necessary, as the probability of erroneously stating significantdifferences (the so-called Type I error) increases with the number ofsimultaneous comparisons.
To test the significance between two means at the .95 level, a critical value of1.96 is used for the test statistics. Any value higher than the critical valueindicates that there is a .95 probability that this difference is not the result ofsampling error. Conversely, there is a .05 chance that a difference is found thatdoes not exist. When several means are compared with one another at the sametime, the probability of making a Type I error is the product of theprobabilities for each comparison. Thus, the chance of making such an errorincreases with the number of comparisons.
For multiple comparisons in the IEA Civic Education Study, a Dunn-Bonferroniadjustment was used that increased the critical value for significance tests whenmultiple comparisons were made (Dunn, 1961). This meant that for thestandard population of 14-year-old students in the 28 participating countries,the number of simultaneous comparisons for each country was 27. Theresulting critical value for the 14-year-old students adjusted for 27simultaneous comparisons was 3.11295, and the critical value for the uppersecondary students adjusted for 13 simultaneous comparisons was 2.89052.
Differences between country means were considered significant when the teststatistic t was greater than the critical value. t is calculated by dividing thedifference by its standard error as given in the formula
SEdif_ij = SEi2 + SEj
2
CHAPTER 10 REPORTING STUDENT AND TEACHER DATA

138 IEA CIVIC EDUCATION STUDY TECHNICAL REPORT
where SEdif_ij
is the standard error of the difference and SEi and SE
j are the
sampling standard errors of the compared countries i and j.
When comparing the country means with the international average, it wasnecessary to take into account that the respective country had contributed tothe international standard error. This was achieved by calculating the standarderror SE
dif_ic of the difference between the international average and the country
mean as
where SEc is the sampling standard error for country c and SE
k for country k,
and N is the number of participating countries. This formula was used fordetermining the statistical significance of differences between countries and theinternational averages for cognitive and attitudinal scales throughout thereports.
COMPARING DATA FROM DIFFERENT POPULATIONSWe stated at the beginning of this report that the national samples that weredrawn for the study of the upper secondary students did not conform to auniform international definition of the target population. For pragmaticreasons, countries were left free to choose a grade or study program thatappeared important as a subject of investigation and for which funding couldbe obtained. The implications of such a strategy were clear from the verybeginning: comparisons of results obtained for different age groups would bevery difficult to defend, both within and across countries.
In principle, this situation applied to all measures reported in the descriptivereports for the upper secondary students no matter whether test results orstudent attitudes were concerned, and it was due to the fact that differencesbetween samples were confounded by the following:
• effects related to the chosen grade;
• effects related to the age of the students within the chosen grade; and
• effects related to the nature of the study programs of the chosen grade, inparticular to the coverage of the respective age group.
Table 10.3 illustrates the main differences between the upper secondarysamples assessed in the IEA Civic Education Study. Whereas in some countrieslike Norway or Poland all upper secondary students were included, othercountries like Denmark included a rather selective population definition. Thesedifferences were due not only to the way of defining target populations for thisparticular study, but also to the differences between the educational systems ofthe participating countries. The coverage index, calculated as the ratio of theestimated target population size divided by the estimated size of thecorresponding age group (see Amadeo, Torney-Purta, Lehmann, Husfeldt, &Nikolova, 2002, p. 34), illustrates the extent to which the data can be seen asrepresentative for age groups in a country. It ranged from .39 in Switzerland(German-speaking cantons) to .99 in Norway. The table also shows that thegrade difference between the population of 14-year-old students and the
SEdif_ic =
N
k=1((N–1)2 –1)SEi
2 + ∑SEk2
N
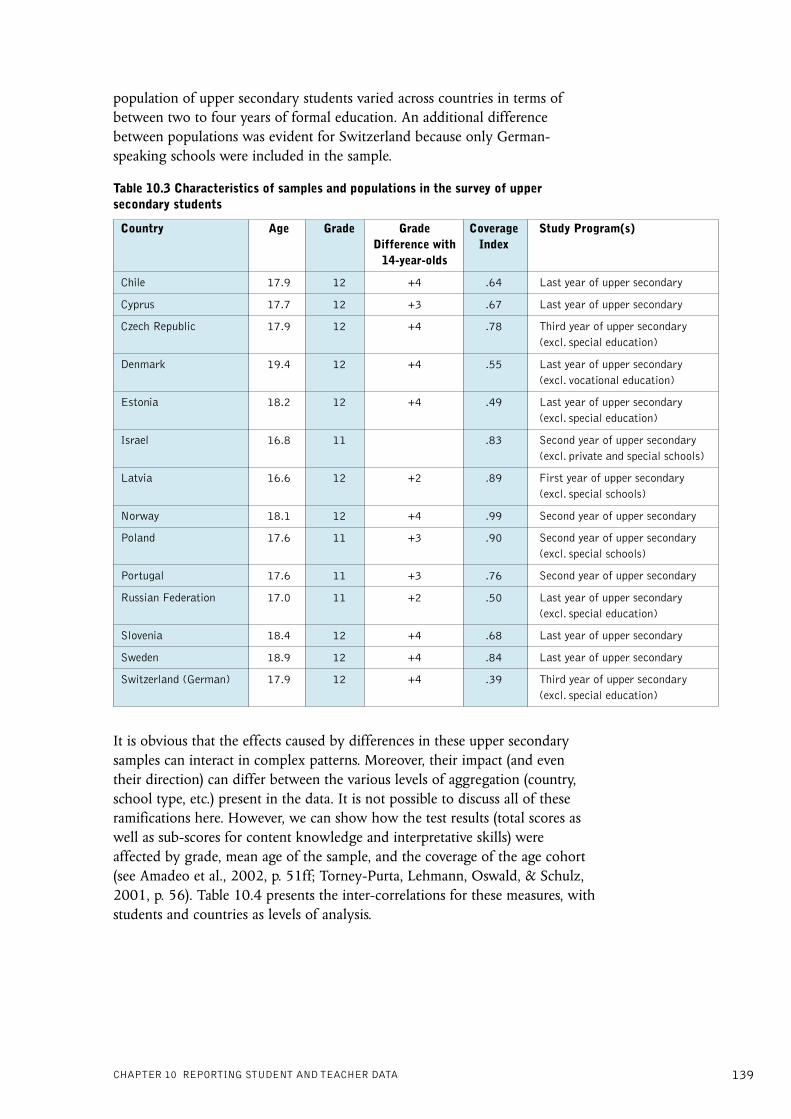
139
population of upper secondary students varied across countries in terms ofbetween two to four years of formal education. An additional differencebetween populations was evident for Switzerland because only German-speaking schools were included in the sample.
Table 10.3 Characteristics of samples and populations in the survey of uppersecondary students
Country Age Grade Grade Coverage Study Program(s)Difference with Index
14-year-olds
Chile 17.9 12 +4 .64 Last year of upper secondary
Cyprus 17.7 12 +3 .67 Last year of upper secondary
Czech Republic 17.9 12 +4 .78 Third year of upper secondary(excl. special education)
Denmark 19.4 12 +4 .55 Last year of upper secondary(excl. vocational education)
Estonia 18.2 12 +4 .49 Last year of upper secondary(excl. special education)
Israel 16.8 11 .83 Second year of upper secondary(excl. private and special schools)
Latvia 16.6 12 +2 .89 First year of upper secondary(excl. special schools)
Norway 18.1 12 +4 .99 Second year of upper secondary
Poland 17.6 11 +3 .90 Second year of upper secondary(excl. special schools)
Portugal 17.6 11 +3 .76 Second year of upper secondary
Russian Federation 17.0 11 +2 .50 Last year of upper secondary(excl. special education)
Slovenia 18.4 12 +4 .68 Last year of upper secondary
Sweden 18.9 12 +4 .84 Last year of upper secondary
Switzerland (German) 17.9 12 +4 .39 Third year of upper secondary(excl. special education)
It is obvious that the effects caused by differences in these upper secondarysamples can interact in complex patterns. Moreover, their impact (and eventheir direction) can differ between the various levels of aggregation (country,school type, etc.) present in the data. It is not possible to discuss all of theseramifications here. However, we can show how the test results (total scores aswell as sub-scores for content knowledge and interpretative skills) wereaffected by grade, mean age of the sample, and the coverage of the age cohort(see Amadeo et al., 2002, p. 51ff; Torney-Purta, Lehmann, Oswald, & Schulz,2001, p. 56). Table 10.4 presents the inter-correlations for these measures, withstudents and countries as levels of analysis.
CHAPTER 10 REPORTING STUDENT AND TEACHER DATA

140 IEA CIVIC EDUCATION STUDY TECHNICAL REPORT
Table 10.4 Inter-correlations between cognitive scales and student and samplecharacteristics in 14 countries
Total Civic Content Interpretative Grade Student Cohort
Knowledge Knowledge Skills Tested Age Coverage
Total Civic Knowledge .893 .948 .492 .755 -.152
Content Knowledge .892 .713 .388 .592 -.046
Interpretative Skills .908 .664 .553 .790 -.227
Grade Tested .178 .116 .206 .761 -.136
Student Age .112 .070 .129 .510 -.214
Note: Lower diagonal: between students; upper diagonal: between countries.
The table shows that the correlation coefficients for countries as the unit ofanalysis (upper diagonal) were generally higher than those for the students(lower diagonal), especially in the cases of “grade tested” and “student age”.This effect, which is called “aggregation bias”, is attributable to neglecting thebetween-students variance within countries, and it renders any attempt toadjust statistically for sample differences between countries subject to criticism.
Given the inadequacies of attempts to adjust for differences in the definedtarget populations at the upper secondary level, comparisons between the14-year-old students and the upper secondary students could only be presentedwith the caveat that it was impossible to control for the potentiallyconfounding effects of age and cohort coverage. This led to choosing agraphical presentation that included information on the observed achievementlevels in the two national samples, the mean age for the two samples, and thecoverage of the age cohort in the upper secondary sample (Amadeo et al.,2002, pp. 64, 66ff ). Moreover, any attempt to estimate standard errors ofachievement differences between the two samples in each country would havesuggested a level of precision that, under the given circumstances, simply couldnot have been attained.
REPORTING OF GENDER DIFFERENCESThe IEA Civic Education Study reported the differences in civic knowledgebetween females and males. This was done by applying the formula
SEdif_ij = SEi2 + SEj
2
where SEdif_ij is the standard error of the difference and SEi and SEj are thesampling standard errors of males (i) and females (j). Simple t-tests with acritical value corrected for multiple comparisons were applied to determinestatistical significance.
The formula used to calculate the standard error of the difference assumes thatsampling standard errors on the means have been calculated for independentsamples, which was clearly not the case for males and females because bothgroups were parts of the same school samples. Computing the correct standarderrors using replication methods was not feasible due to time constraints whenpreparing the first international report.

141CHAPTER 10 REPORTING STUDENT AND TEACHER DATA
Table 10.5 Comparison of standard errors for gender differences in civic knowledgefor 14-year-old students
Country Difference between Reported Standard JRR StandardMales and Females Errors of Difference Errors of Difference
Australia 2.37 1.40 1.18
Belgium (French) 4.52 1.68 1.46
Bulgaria 2.24 1.96 1.20
Chile -1.68 1.14 0.83
Colombia 0.36 1.70 1.65
Cyprus 0.25 0.91 0.81
Czech Republic -1.68 1.30 0.78
Denmark -2.53 0.98 0.85
England -0.12 1.28 1.32
Estonia 1.40 0.90 0.67
Finland 1.59 1.15 0.91
Germany -1.43 0.92 0.84
Greece 2.07 1.18 0.70
Hong Kong (SAR) 1.08 1.80 1.32
Hungary 0.86 1.04 0.78
Italy 2.10 1.41 1.30
Latvia 3.92 1.32 0.83
Lithuania 2.32 1.08 0.59
Norway -0.52 0.92 0.86
Poland 2.72 2.62 1.48
Portugal -1.44 1.16 0.72
Romania 0.42 1.35 0.74
Russian Federation -0.25 2.05 1.14
Slovak Republic -0.18 1.14 0.70
Slovenia 3.75 0.83 0.72
Sweden 1.14 1.34 1.10
Switzerland -2.34 1.22 0.60
United States 1.86 1.80 0.94
Table 10.5 shows the reported standard errors on the difference in civicknowledge between males and females in the population of 14-year-oldstudents compared to those derived using the JRR method. In most countries,the jackknifed standard errors of gender differences in civic knowledge weresmaller than the reported ones. Similar figures (see Tables 10.6, 10.7, and10.8) were obtained when comparing the reported standard errors and thoseobtained through JRR estimation for gender differences in content knowledge,interpretative skills, and economic literacy for the population of uppersecondary students.

142 IEA CIVIC EDUCATION STUDY TECHNICAL REPORT
Table 10.6 Comparison of standard errors for gender differences in contentknowledge for upper secondary students
Country Difference between Reported Standard JRR StandardMales and Females Errors of Difference Errors of Difference
Chile -1.78 0.43 0.42
Cyprus 0.12 0.89 0.66
Czech Republic -1.35 0.53 0.52
Denmark -2.65 0.32 0.30
Estonia -1.16 0.50 0.38
Israel -0.88 0.60 0.50
Latvia 0.12 1.05 0.78
Norway -2.24 0.83 0.74
Poland -1.92 0.74 0.65
Portugal -2.65 0.47 0.40
Russian Federation -1.46 0.85 0.43
Slovenia -0.50 0.98 0.71
Sweden 0.30 0.59 0.50
Switzerland -1.53 1.13 1.04
Table 10.7 Comparison of standard errors for gender differences in interpretativeskills for upper secondary students
Country Difference between Reported Standard JRR StandardMales and Females Errors of Difference Errors of Difference
Chile -1.98 1.20 1.26
Cyprus 1.58 2.12 1.28
Czech Republic -1.70 1.23 1.27
Denmark -6.08 0.88 0.85
Estonia -1.59 1.43 1.00
Israel 0.41 1.50 1.21
Latvia 1.36 2.07 1.61
Norway -3.06 1.88 1.68
Poland -0.80 1.63 1.38
Portugal -4.40 0.93 0.76
Russian Federation -2.68 1.73 1.06
Slovenia -0.85 2.00 1.50
Sweden 0.75 1.32 1.16
Switzerland -3.23 3.29 1.75

143CHAPTER 10 REPORTING STUDENT AND TEACHER DATA
Table 10.8 Comparison of standard errors for gender differences in economic literacyfor upper secondary students
Country Difference between Reported Standard JRR StandardMales and Females Errors of Difference Errors of Difference
Chile -5.28 0.98 0.94
Cyprus 0.24 2.03 1.40
Czech Republic -5.23 1.17 1.19
Denmark -8.16 1.14 1.05
Estonia -6.40 1.08 0.73
Israel -3.64 1.28 1.01
Latvia -1.82 1.94 1.44
Norway -5.91 1.57 1.37
Poland -2.90 1.34 1.20
Portugal -6.42 0.86 0.62
Russian Federation -5.19 1.88 1.04
Slovenia -4.61 1.66 1.27
Sweden -4.09 1.18 1.10
Switzerland -9.22 3.19 2.65
REPORTING OF MULTIPLE REGRESSION ANALYSISThe reporting of the results from the IEA Civic Education Study not onlydescribe knowledge, concepts, and attitudes in the participating countries butalso provide a first analysis of potential explanatory variables for studentoutcomes. Multiple regression analysis was used to describe the effects ofbackground and school variables on civic knowledge and civic engagement (asmeasured by the students’ expectation to vote as an adult).
Effects of predictors on the criterion variables in these models should generallynot be interpreted as causal. Some of the significant effects might well be dueto a non-recursive relationship. It is also recognized that for some of thesefactors school-level effects might be hypothesized that would have required amulti-level analysis. However, this type of regression analysis was deemedappropriate to give a first indication of variables associated with civicknowledge and civic engagement, and to estimate how much of the variance atthe student level could be accounted for by these factors.
For the 14-year-old students, a simple path model with manifest variables wasestimated for the calibration sample consisting of 500 randomly selectedstudents per country, with both civic knowledge and civic engagementincluded as endogenous variables. Then, for each participating country, twodifferent multiple regression models were estimated, each using the same setsof predictor variables. Model A was the multiple regression model for civicknowledge (as measured by the total civic knowledge scale), and Model B wasthe model for civic engagement (as measured by a Likert-type item on thestudents’ expectation to vote as an adult).

144 IEA CIVIC EDUCATION STUDY TECHNICAL REPORT
For the reporting on the upper secondary students, separate regression modelsrather than a path model were estimated for civic knowledge and civicengagement. Some additional predictor variables were also included.
Table 10.9 lists all variables that were included in the multiple regressionmodels A and B. (For a more detailed description of the variables, see Amadeoet al., 2002, p. 145ff; Torney-Purta et al., 2001, p. 148.) Many of the variablesused in these models were non-continuous categorical variables, and the OLSestimates for these kinds of data can be biased. This concern was particularlyproblematic in the case of the indicator for civic engagement, where a non-continuous Likert-type item was used as the criterion variable. The(methodologically more appropriate) use of logistical regression modeling,however, would have rendered rather complex results that would have beendifficult to communicate to the reader. Furthermore, using the same type ofmodeling for both dependent variables provided a consistent way of reportingthe results of these analyses.
All multiple regression models were checked for multi-collinearity. For the14-year-olds, the highest correlation between predictors was found forexpected education (in years) and home literacy (number of books at home)with r = .29 (international calibration sample from 28 countries); for the uppersecondary students it was r = .32 for students’ reports on reading news in thenewspaper and watching TV news (international calibration sample from 14countries).
Table 10.9 Variables in the multiple regression models
Variables Type Model Population*
Criterion
Civic knowledge IRT score A 2 & 3
Expectation to vote Likert-type item B 2 & 3
Predictors
Gender (female) dichotomous A & B 2 & 3
Number of people at home continuous A & B 3
Number of books at home categorical A & B 2 & 3
Educational level of parents dichotomous A & B 3
Expected years of education categorical A & B 2 & 3
Open classroom climate IRT score A & B 2 & 3
Having learned to vote Likert-type item B 2 & 3
Participation in student council dichotomous A & B 2 & 3
Civic knowledge IRT score B 2 & 3
Reading news in newspaper Likert-type item A & B 3
Watching TV news Likert-type item A & B 2 & 3
Political interest Likert-type item A & B 3
Spending evenings outside categorical A & B 2 & 3
Note: *Population 2 = 14-year-old students; Population 3 = upper secondary students.

145
Listwise-exclusion of missing values was chosen for these analyses. This choiceled to a considerable reduction of cases in some countries, particularly forModel B. The Swiss data were not included in the regression models for theupper secondary students because the relatively small sample size would havebeen even further reduced by the number of missing values. Table 10.10 showsthe weighted percentages of cases excluded from the analysis for eachregression model.
The JRR method was applied to determine the standard errors of theunstandardized regression coefficients and the significance of each coefficient.Significance tests were adjusted for multiple comparisons using the Dunn-Bonferroni correction. To simplify the interpretation of the results within eachcountry, standardized regression coefficients were used and non-significantcoefficients were omitted from the tables in the report.
CHAPTER 10 REPORTING STUDENT AND TEACHER DATA
Table 10.10 Weighted percentage of missing cases for multiple regression analyses
14-year-old Upper SecondaryStudents Students
Country Model A Model B Model A Model B
Australia 13 24
Belgium (French) 18 29
Bulgaria 12 30
Chile 6 19 4 12
Colombia 8 13
Cyprus 4 11 7 13
Czech Republic 3 16 5 13
Denmark 13 30 12 17
England 16 30
Estonia 5 23 9 16
Finland 5 22
Germany 8 21
Greece 5 14
Hong Kong (SAR) 13 26
Hungary 4 7
Israel 18 22
Italy 3 22
Latvia 9 28 15 31
Lithuania 8 30
Norway 12 27 35 39
Poland 4 13 8 12
Portugal 7 18 7 11
Romania 4 15
Russian Federation 4 15 18 22
Slovak Republic 2 8
Slovenia 5 17 6 12
Sweden 13 31 17 23
Switzerland 11 30
United States 13 23
International Mean 8 21 12 19

146 IEA CIVIC EDUCATION STUDY TECHNICAL REPORT
However, the use of standardized coefficients was not appropriate for thecomparison of regression coefficients across countries because the differencesin variances between countries would have affected the standardization. Tables10.11 and 10.12 show the unstandardized coefficients and their respectivestandard errors for the multiple regression models for civic knowledge andcivic engagement in the 28 countries that participated in the survey of 14-year-old students. Tables 10.13 and 10.14 present the unstandardized coefficientsand JRR standard errors of the regression models for the survey of uppersecondary students in 13 countries. The regression coefficients and thestandard errors for the effect of civic knowledge on civic engagement (ModelB, Tables 10.12 and 10.14) were multiplied by 10 to avoid too small numbersin these tables. The effect coefficients thus indicated the increase in the score ofthe criterion variable with half a standard error of the civic knowledge score,which was equal to 10 score points.
Note: JRR estimates of standard errors are in brackets. table contd. on next page
Table 10.11 Unstandardized coefficients and standard errors of multiple regression models for civic knowl-edge (14-year-old students)
Country Constant Gender Home Expected Classroom School Evenings Television
(Female) Literacy Education Climate Council Outside News
Australia 71.67 .36 2.60 2.95 .71 5.58 -2.85 2.81
(2.63) (1.01) (0.34) (0.42) (0.18) (0.97) (0.49) (0.46)
Belgium (French) 56.76 2.24 3.09 2.96 1.51 1.10 -1.96 2.32
(2.42) (1.23) (0.42) (0.37) (0.22) (1.18) (0.41) (0.60)
Bulgaria 67.01 -.25 3.02 3.76 .84 .47 -.90 1.31
(2.89) (0.98) (0.60) (0.51) (0.25) (1.74) (0.48) (0.55)
Chile 57.45 -1.90 3.33 3.03 .99 -1.36 -.18 1.71
(1.70) (0.59) (0.23) (0.15) (0.15) (1.04) (0.22) (0.32)
Colombia 69.66 -.24 2.25 1.74 .52 1.71 -.78 .56
(1.94) (1.23) (0.47) (0.30) (0.27) (0.92) (0.26) (0.55)
Cyprus 77.74 -2.64 1.32 5.46 .64 6.81 -1.19 .89
(2.68) (0.82) (0.30) (0.32) (0.21) (0.72) (0.43) (0.45)
Czech Republic 68.80 -4.60 2.23 7.29 .78 3.01 -2.02 .26
(2.63) (0.62) (0.31) (0.29) (0.24) (1.06) (0.40) (0.51)
Denmark 61.60 -3.53 2.12 4.72 1.99 4.29 -3.34 1.79
(2.57) (0.71) (0.33) (0.33) (0.17) (0.72) (0.40) (0.48)
England 71.96 -1.67 3.86 2.52 1.16 3.51 -3.56 2.06
(2.11) (0.99) (0.23) (0.34) (0.18) (0.97) (0.36) (0.33)
Estonia 65.25 -1.10 2.18 3.14 1.32 .58 -3.76 1.37
(2.48) (0.63) (0.33) (0.24) (0.19) (0.82) (0.31) (0.36)
Finland 80.93 -1.54 1.86 6.54 .23 .84 -2.64 2.81
(2.70) (0.87) (0.33) (0.36) (0.25) (0.87) (0.47) (0.49)
Germany 67.50 -3.05 3.69 3.50 1.21 3.41 -2.55 1.87
(2.58) (0.66) (0.25) (0.32) (0.19) (1.08) (0.32) (0.36)
Greece 71.06 -1.38 1.88 6.55 1.19 5.60 -2.28 1.26
(2.72) (0.65) (0.35) (0.41) (0.24) (0.66) (0.56) (0.54)

147CHAPTER 10 REPORTING STUDENT AND TEACHER DATA
Country Constant Gender Home Expected Classroom School Evenings Television
(Female) Literacy Education Climate Council Outside News
Hong Kong (SAR) 79.61 -1.21 -.21 2.59 .90 2.32 -5.60 6.33
(2.73) (1.04) (0.30) (0.27) (0.20) (0.83) (0.47) (0.49)
Hungary 65.95 -1.78 2.32 6.44 .53 2.32 -2.04 .55
(1.99) (0.61) (0.27) (0.36) (0.14) (0.77) (0.34) (0.39)
Italy 71.12 -1.21 2.76 3.42 1.25 .53 -1.96 2.37
(2.36) (0.95) (0.31) (0.35) (0.23) (1.02) (0.34) (0.46)
Latvia 60.44 1.40 2.10 3.18 1.24 2.30 -1.76 1.38
(2.38) (0.75) (0.39) (0.30) (0.19) (1.37) (0.41) (0.37)
Lithuania 63.96 .14 1.86 3.60 1.15 2.71 -1.24 1.57
(1.99) (0.58) (0.31) (0.27) (0.20) (0.97) (0.35) (0.34)
Norway 63.71 -3.03 2.96 4.69 1.30 5.42 -2.76 2.66
(2.60) (0.74) (0.34) (0.40) (0.21) (0.86) (0.53) (0.51)
Poland 69.10 -1.98 2.43 6.89 .20 2.80 -1.49 2.74
(2.85) (1.08) (0.37) (0.77) (0.18) (1.50) (0.41) (0.47)
Portugal 71.94 -3.65 2.55 2.70 1.32 -.51 -2.17 .91
(2.29) (0.61) (0.37) (0.17) (0.21) (0.61) (0.33) (0.37)
Romania 75.29 -1.46 1.22 2.77 .62 1.54 -1.67 1.26
(2.88) (0.80) (0.36) (0.41) (0.28) (1.18) (0.45) (0.42)
Russian Federation 61.67 -3.44 3.63 1.77 2.23 3.09 -2.34 1.20
(4.78) (1.00) (0.63) (0.34) (0.36) (1.53) (0.75) (0.61)
Slovak Republic 62.51 -1.93 2.21 4.72 1.39 1.73 .01 1.92
(2.45) (0.54) (0.33) (0.35) (0.19) (2.17) (0.29) (0.37)
Slovenia 64.42 .27 1.57 5.33 1.34 4.79 -1.29 1.32
(2.08) (0.62) (0.27) (0.26) (0.23) (0.87) (0.32) (0.39)
Sweden 58.56 -3.14 3.23 4.57 1.69 3.58 -1.54 .86
(2.83) (1.00) (0.42) (0.41) (0.26) (0.83) (0.43) (0.64)
Switzerland 69.88 -3.94 3.05 3.99 1.11 -.75 -1.24 .81
(2.62) (0.63) (0.34) (0.39) (0.23) (1.48) (0.39) (0.45)
United States 64.49 -1.49 3.93 4.97 1.16 2.88 -2.49 1.63
(2.65) (0.79) (0.46) (0.37) (0.19) (1.00) (0.54) (0.60)
Table 10.11 contd.from previous page
Note: JRR estimates of standard errors are in brackets.

148 IEA CIVIC EDUCATION STUDY TECHNICAL REPORT
Country Constant Gender Home Expected Classroom Learned School Evenings Television Civic
(Female) Literacy Education Climate to Vote Council Outside News Knowledge
Australia 0.56 0.03 0.03 0.04 0.06 0.12 0.08 -0.07 0.18 0.12
(0.13) (0.03) (0.01) (0.02) (0.01) (0.02) (0.03) (0.02) (0.03) (0.01)
Belgium (French) -0.32 0.17 0.03 0.08 0.05 0.17 -0.03 -0.06 0.19 0.15
(0.21) (0.05) (0.02) (0.02) (0.02) (0.03) (0.08) (0.03) (0.03) (0.02)
Bulgaria 0.05 0.04 0.04 0.04 0.06 0.13 0.12 0.01 0.19 0.09
(0.19) (0.05) (0.02) (0.02) (0.02) (0.03) (0.06) (0.02) (0.03) (0.01)
Chile 0.23 -0.04 0.03 0.02 0.06 0.31 0.04 0.00 0.13 0.09
(0.15) (0.04) (0.02) (0.01) (0.01) (0.02) (0.04) (0.02) (0.02) (0.01)
Colombia 0.61 0.05 0.02 0.03 0.08 0.20 -0.01 -0.01 0.17 0.08
(0.15) (0.04) (0.02) (0.01) (0.01) (0.02) (0.06) (0.02) (0.03) (0.01)
Cyprus 2.43 0.01 -0.02 0.04 0.03 0.06 0.01 -0.03 0.13 0.04
(0.16) (0.03) (0.01) (0.01) (0.01) (0.02) (0.03) (0.02) (0.02) (0.01)
Czech Republic -0.46 -0.10 0.05 0.10 0.00 0.27 0.09 -0.02 0.16 0.16
(0.20) (0.04) (0.02) (0.02) (0.01) (0.03) (0.06) (0.02) (0.04) (0.01)
Denmark 1.09 0.08 0.05 0.06 0.04 0.12 0.03 0.02 0.14 0.08
(0.12) (0.03) (0.01) (0.01) (0.01) (0.02) (0.03) (0.02) (0.02) (0.01)
England 0.73 -0.04 0.06 0.06 0.04 0.16 0.09 -0.03 0.17 0.10
(0.17) (0.04) (0.02) (0.02) (0.01) (0.02) (0.04) (0.02) (0.03) (0.01)
Estonia -0.25 0.12 0.04 0.05 0.04 0.24 0.06 -0.04 0.14 0.15
(0.17) (0.04) (0.02) (0.01) (0.01) (0.02) (0.05) (0.02) (0.02) (0.01)
Finland 1.04 0.06 0.04 0.12 0.03 0.27 0.07 0.01 0.08 0.05
(0.16) (0.03) (0.02) (0.02) (0.01) (0.02) (0.04) (0.02) (0.03) (0.01)
Germany -0.27 -0.09 0.09 0.02 0.04 0.24 0.14 0.00 0.12 0.15
(0.15) (0.03) (0.02) (0.01) (0.01) (0.03) (0.06) (0.02) (0.02) (0.01)
Greece 0.95 0.12 -0.01 0.03 0.08 0.09 0.08 -0.03 0.17 0.08
(0.17) (0.03) (0.01) (0.01) (0.01) (0.02) (0.04) (0.02) (0.02) (0.01)
Hong Kong (SAR) 0.46 0.03 0.00 0.03 0.07 0.21 0.05 -0.04 0.19 0.08
(0.12) (0.03) (0.01) (0.01) (0.01) (0.02) (0.03) (0.02) (0.02) (0.01)
Hungary 1.08 0.03 0.05 0.04 0.03 0.16 0.09 -0.01 0.15 0.08
(0.14) (0.02) (0.02) (0.02) (0.01) (0.02) (0.03) (0.02) (0.02) (0.01)
Italy 0.49 -0.03 0.00 0.06 0.03 0.17 -0.07 -0.05 0.17 0.12
(0.14) (0.03) (0.02) (0.02) (0.01) (0.02) (0.05) (0.02) (0.03) (0.01)
Latvia -0.21 0.18 0.02 0.03 0.07 0.24 -0.02 -0.05 0.25 0.11
(0.26) (0.05) (0.03) (0.02) (0.01) (0.03) (0.06) (0.03) (0.03) (0.02)
Lithuania 0.82 0.08 0.02 0.04 0.04 0.08 0.06 -0.04 0.21 0.10
(0.12) (0.04) (0.02) (0.01) (0.01) (0.02) (0.04) (0.02) (0.03) (0.01)
Norway 0.78 0.01 0.02 0.06 0.03 0.13 0.10 0.03 0.18 0.10
(0.12) (0.03) (0.01) (0.02) (0.01) (0.02) (0.03) (0.02) (0.03) (0.01)
Poland 0.85 0.12 -0.01 0.08 0.03 0.13 0.04 -0.02 0.19 0.09
(0.18) (0.03) (0.01) (0.01) (0.01) (0.02) (0.03) (0.01) (0.04) (0.01)
Portugal 1.05 -0.06 0.00 0.04 0.04 0.13 0.02 -0.01 0.13 0.11
(0.14) (0.03) (0.01) (0.01) (0.01) (0.02) (0.04) (0.02) (0.02) (0.01)
Table 10.12 Unstandardized coefficients and standard errors of multiple regressionmodels for expected vote (14-year-old students)
Notes: JRR estimates of standard errors below coefficients are in brackets. Coefficients and standard errors for civic knowledge are multiplied by 10.
table contd. on next page
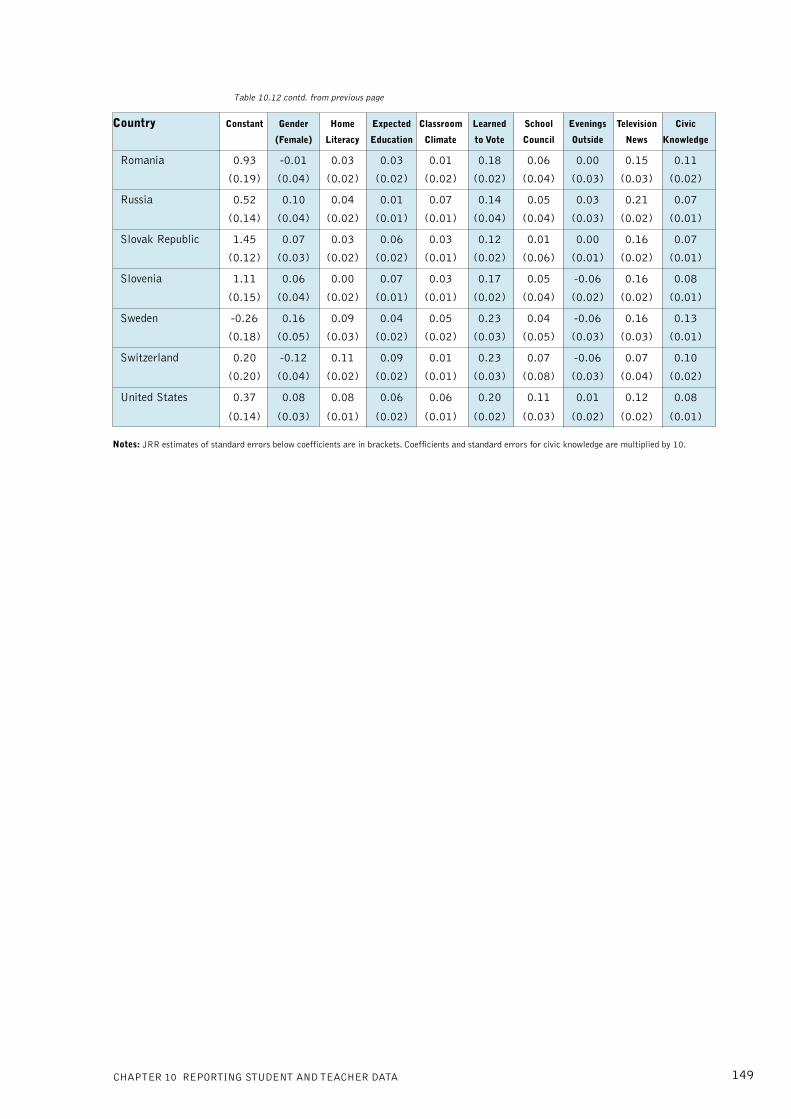
149CHAPTER 10 REPORTING STUDENT AND TEACHER DATA
Country Constant Gender Home Expected Classroom Learned School Evenings Television Civic
(Female) Literacy Education Climate to Vote Council Outside News Knowledge
Romania 0.93 -0.01 0.03 0.03 0.01 0.18 0.06 0.00 0.15 0.11
(0.19) (0.04) (0.02) (0.02) (0.02) (0.02) (0.04) (0.03) (0.03) (0.02)
Russia 0.52 0.10 0.04 0.01 0.07 0.14 0.05 0.03 0.21 0.07
(0.14) (0.04) (0.02) (0.01) (0.01) (0.04) (0.04) (0.03) (0.02) (0.01)
Slovak Republic 1.45 0.07 0.03 0.06 0.03 0.12 0.01 0.00 0.16 0.07
(0.12) (0.03) (0.02) (0.02) (0.01) (0.02) (0.06) (0.01) (0.02) (0.01)
Slovenia 1.11 0.06 0.00 0.07 0.03 0.17 0.05 -0.06 0.16 0.08
(0.15) (0.04) (0.02) (0.01) (0.01) (0.02) (0.04) (0.02) (0.02) (0.01)
Sweden -0.26 0.16 0.09 0.04 0.05 0.23 0.04 -0.06 0.16 0.13
(0.18) (0.05) (0.03) (0.02) (0.02) (0.03) (0.05) (0.03) (0.03) (0.01)
Switzerland 0.20 -0.12 0.11 0.09 0.01 0.23 0.07 -0.06 0.07 0.10
(0.20) (0.04) (0.02) (0.02) (0.01) (0.03) (0.08) (0.03) (0.04) (0.02)
United States 0.37 0.08 0.08 0.06 0.06 0.20 0.11 0.01 0.12 0.08
(0.14) (0.03) (0.01) (0.02) (0.01) (0.02) (0.03) (0.02) (0.02) (0.01)
Notes: JRR estimates of standard errors below coefficients are in brackets. Coefficients and standard errors for civic knowledge are multiplied by 10.
Table 10.12 contd. from previous page

150 IEA CIVIC EDUCATION STUDY TECHNICAL REPORT
Cou
ntry
Con
stan
tG
ende
rP
eopl
e in
Hom
eP
aren
tal
Exp
ecte
dC
lass
room
Sch
ool
Rea
ding
Tele
visi
onIn
tere
stE
veni
ngs
(Fem
ale)
Hou
seho
ldL
iter
acy
Edu
cati
onE
duca
tion
Clim
ate
Cou
ncil
New
spap
erN
ews
in P
olit
ics
Out
side
Chi
le86
.707
-3.5
70-.
731
2.20
66.
240
3.70
2.2
23.0
061.
745
.882
1.40
4-.
332
(2.0
80)
(.77
3)(.
119)
(.26
2)(.
735)
(.24
8)(.
143)
(.72
6)(.
396)
(.38
3)(.
227)
(.22
5)
Cyp
rus
100.
094
-.14
2-1
.481
1.02
65.
810
5.30
6.0
326.
088
.422
1.57
41.
710
-2.5
37
(4.6
86)
(1.3
24)
(.74
8)(.
438)
(1.2
32)
(.84
0)(.
249)
(1.0
17)
(.68
6)(.
635)
(.46
7)(.
840)
Cze
ch R
epub
lic96
.862
-4.6
94-.
723
2.42
93.
271
6.03
6.3
06.1
22.3
62.0
252.
395
-.61
7
(3.2
79)
(.88
7)(.
309)
(.34
5)(.
857)
(.38
0)(.
235)
(.92
8)(.
528)
(.51
9)(.
428)
(.39
3)
Den
mar
k11
0.30
0-7
.547
-.44
02.
061
3.40
63.
188
.402
.636
.745
-.81
33.
871
-1.5
84
(2.6
44)
(.71
5)(.
294)
(.31
0)(.
929)
(.32
7)(.
195)
(.70
7)(.
437)
(.58
4)(.
458)
(.51
2)
Est
onia
101.
977
-3.2
32-.
117
2.45
75.
605
.702
.631
.725
.973
1.22
22.
339
-4.3
88
(4.3
29)
(.93
0)(.
345)
(.44
2)(1
.393
)(.
671)
(.21
5)(1
.026
)(.
629)
(.75
4)(.
610)
(.63
1)
Isra
el10
1.29
0-2
.668
-2.3
391.
678
6.95
03.
253
.745
1.44
03.
263
-.11
91.
196
-1.2
70
(2.6
14)
(.89
4)(.
225)
(.29
7)(.
749)
(.33
5)(.
179)
(.81
4)(.
418)
(.49
4)(.
372)
(.44
1)
Lat
via
66.9
61-1
.972
-1.0
181.
597
5.34
03.
849
1.90
3-1
.646
.995
1.13
33.
008
-2.7
34
(3.5
28)
(1.3
27)
(.30
4)(.
617)
(1.3
12)
(.46
7)(.
289)
(1.2
53)
(.52
9)(.
613)
(.65
2)(.
541)
Nor
way
83.9
15-7
.820
-.87
72.
989
.785
5.32
7.9
28.0
441.
937
1.07
14.
264
-1.1
34
(5.4
41)
(1.3
91)
(.50
2)(.
488)
(1.0
07)
(.57
3)(.
338)
(1.1
75)
(1.0
69)
(1.0
82)
(.64
8)(.
775)
Pol
and
97.7
22-3
.859
-1.2
642.
522
5.81
84.
776
.050
-3.0
901.
879
1.35
81.
160
-2.8
55
(2.4
08)
(1.0
56)
(.23
7)(.
384)
(1.1
74)
(.45
5)(.
190)
(1.1
41)
(.54
1)(.
511)
(.48
7)(.
402)
Por
tuga
l10
0.91
1-6
.145
-1.0
021.
489
4.46
53.
856
.882
-.20
3-.
697
.693
2.85
6-1
.739
(3.4
45)
(.81
4)(.
335)
(.31
2)(1
.152
)(.
313)
(.24
6)(.
799)
(.58
3)(.
631)
(.40
5)(.
398)
Rus
sian
Fed
erat
ion
73.8
69-4
.403
.175
1.47
17.
252
1.58
11.
676
3.07
3-.
386
1.97
82.
735
-2.5
33
(6.3
76)
(1.0
05)
(1.0
80)
(.74
1)(1
.346
)(.
583)
(.38
8)(1
.253
)(.
699)
(1.0
21)
(.92
0)(.
733)
Slo
veni
a76
.001
-1.3
79-.
610
2.63
44.
573
2.23
21.
544
4.49
11.
319
4.65
0-.
611
-.11
9
(3.7
19)
(1.4
48)
(.29
6)(.
556)
(1.2
52)
(.64
0)(.
296)
(1.9
49)
(.56
3)(.
857)
(.71
7)(.
672)
Sw
eden
90.4
62-4
.743
-2.6
234.
045
5.11
41.
473
1.90
22.
988
2.04
1.4
294.
071
-1.8
39
(6.4
66)
(1.0
15)
(.68
6)(.
556)
(1.2
78)
(.79
6)(.
343)
(.67
8)(.
923)
(1.2
12)
(.65
5)(.
602)
Not
e: J
RR
est
imat
es o
f st
anda
rd e
rror
s ar
e in
bra
cket
s.
Tabl
e 10
.13
Uns
tand
ardi
zed
coef
fici
ents
and
sta
ndar
d er
rors
of
mul
tipl
e re
gres
sion
mod
els
for
civi
c kn
owle
dge
(upp
er s
econ
dary
stu
dent
s)

151CHAPTER 10 REPORTING STUDENT AND TEACHER DATA
Tabl
e 10
.14
Uns
tand
ardi
zed
coef
fici
ents
and
sta
ndar
d er
rors
of
mul
tipl
e re
gres
sion
mod
els
for
expe
ctat
ion
to v
ote
(upp
er s
econ
dary
stu
dent
s)
Cou
ntry
Con
stan
tG
ende
rP
eopl
e in
Hom
eP
aren
tal
Exp
ecte
dC
lass
room
Lea
rned
Sch
ool
Civ
icR
eadi
ngTe
levi
sion
Inte
rest
Eve
ning
s(F
emal
e)H
ouse
hold
Lit
erac
yE
duca
tion
Edu
cati
onC
limat
eto
Vot
eC
ounc
ilK
now
ledg
eN
ewsp
aper
New
sin
Pol
itic
s O
utsi
de
Chi
le.5
08.1
39.0
03-.
009
.083
.028
.011
.236
.094
.050
.113
.090
.277
.012
(.12
6)(.
031)
(.00
7)(.
012)
(.03
1)(.
013)
(.00
9)(.
015)
(.03
3)(.
007)
(.02
3)(.
020)
(.01
6)(.
012)
Cyp
rus
1.95
7.0
83.0
33.0
00-.
006
.009
.029
.089
.104
.036
.053
.112
.091
-.07
9(.
245)
(.03
8)(.
013)
(.02
2)(.
042)
(.02
3)(.
012)
(.02
9)(.
039)
(.01
3)(.
022)
(.03
9)(.
018)
(.02
8)
Cze
ch R
epub
lic-.
046
-.02
7.0
13.0
37.0
54.0
94.0
26.2
29.0
96.1
05.0
62.0
51.2
01-.
021
(.17
6)(.
031)
(.01
7)(.
019)
(.03
2)(.
014)
(.01
1)(.
020)
(.04
1)(.
010)
(.02
6)(.
025)
(.02
5)(.
020)
Den
mar
k2.
024
-.00
4.0
09.0
14.0
51.0
06.0
07.1
27.0
31.0
29.0
10.0
82.1
77.0
16(.
110)
(.02
2)(.
007)
(.01
0)(.
024)
(.01
0)(.
006)
(.01
5)(.
018)
(.00
6)(.
016)
(.02
3)(.
013)
(.01
4)
Est
onia
.731
.099
.005
.039
.093
.011
.017
.233
.015
.064
.082
.090
.087
-.03
6(.
180)
(.03
9)(.
012)
(.02
6)(.
026)
(.02
3)(.
007)
(.02
1)(.
041)
(.01
0)(.
027)
(.02
6)(.
020)
(.01
8)
Isra
el1.
270
.080
-.02
4.0
02.0
60.0
07.0
31.0
51.0
92.0
75.1
92.1
15.0
43.0
43(.
135)
(.02
7)(.
007)
(.01
2)(.
028)
(.01
1)(.
006)
(.01
3)(.
022)
(.00
8)(.
021)
(.02
3)(.
017)
(.01
6)
Lat
via
-.26
5.0
47.0
15.0
53.0
30.0
31.0
67.2
23-.
004
.077
.039
.263
.088
-.02
2(.
282)
(.05
8)(.
018)
(.02
8)(.
041)
(.01
7)(.
010)
(.03
1)(.
051)
(.01
6)(.
041)
(.06
2)(.
027)
(.02
6)
Nor
way
1.24
3.0
51-.
030
.015
.066
.074
.033
.176
-.04
0.0
31.1
07.0
82.1
52.0
33(.
244)
(.03
8)(.
015)
(.01
5)(.
035)
(.02
2)(.
010)
(.03
1)(.
045)
(.01
0)(.
040)
(.04
2)(.
019)
(.03
1)
Pol
and
1.61
8.1
25.0
10.0
04.0
27.0
44.0
20.1
36-.
002
.044
.072
.125
.066
-.02
0(.
145)
(.02
6)(.
007)
(.01
1)(.
028)
(.01
5)(.
006)
(.01
5)(.
037)
(.00
6)(.
019)
(.02
2)(.
017)
(.01
3)
Por
tuga
l1.
668
.096
.008
-.00
6.0
5002
7.0
02.1
56.0
06.0
41.0
59.1
04.1
71-.
018
(.16
8)(.
034)
(.01
2)(.
015)
(.04
3)(.
014)
(.01
3)(.
018)
(.02
9)(.
009)
(.02
1)(.
030)
(.02
3)(.
018)
Rus
sian
Fed
erat
ion
1.69
4-.
032
-.03
5.0
26-.
055
.003
.029
.165
.059
.048
.029
.116
.072
-.00
1
(.21
9)(.
045)
(.03
9)(.
025)
(.03
3)(.
022)
(.00
8)(.
030)
(.04
2)(.
009)
(.03
4)(.
042)
(.03
0)(.
024)
Slo
veni
a1.
331
.051
.017
.023
-.06
8.0
01.0
34.1
33.1
55.0
48.1
09.1
10.0
52-.
016
(.17
3)(.
040)
(.01
3)(.
016)
(.04
7)(.
015)
(.01
3)(.
030)
(.04
7)(.
011)
(.02
4)(.
029)
(.01
8)(.
018)
Sw
eden
.567
.064
-.01
8.0
56.0
34.0
22.0
38.1
28.0
17.0
97.0
93.0
55.0
86.0
02(.
177)
(.04
5)(.
027)
(.02
0)(.
043)
(.02
0)(.
012)
(.03
0)(.
038)
(.01
2)(.
035)
(.03
2)(.
024)
(.02
0)
Not
es: J
RR
est
imat
es o
f st
anda
rd e
rror
s ar
e in
bra
cket
s. C
oeff
icie
nts
and
stan
dard
err
ors
for
civi
c kn
owle
dge
are
mul
tipl
ied
by 1
0.

152 IEA CIVIC EDUCATION STUDY TECHNICAL REPORT
REPORTING OF TEACHER DATA (14-YEAR-OLD STUDENTS)The assessment and survey of the 14-year-old students were accompanied by ateacher survey. In a loosely bounded curricular field such as civic education, itis a particular challenge to draw a sample of teachers that is comparable acrosscountries. From the case study data obtained during Phase I of the IEA CivicEducation Study, it was known that in some countries civic education isaffiliated with history and in other countries with mother tongue, or that italso may be taught as a specific subject. For some countries, civic education iseven lodged in the domain of religious instruction, while for others it isdeveloped as a specific amalgamated school subject called social studies thatdraws teachers from multiple social science disciplinary backgrounds. Civiceducation may also be found in some countries as an encompassing cross-curricular concern of the whole school. In this case, teachers from alldisciplinary backgrounds may teach in the field.
To ensure a comparable sample across countries, a subject allocation grid (seeAppendix C) was composed that listed the topics from which items for thecognitive part of the student questionnaire were drawn. The national researchcoordinators were asked to identify which teachers, teaching which subjects,were primarily responsible for covering these topics in their countries (seeChapter 3 for details). Each sampled school was asked to administer theteacher questionnaire to three such teachers. Schools were asked to choosetheir teachers in this sequence:
1. Three teachers of civic education-related subjects teaching the tested class ofstudents.
2. If three teachers could not be selected this way, then other teachers of civiceducation-related subjects of a parallel, previous, or following grade withinthe school.
The second condition applied to almost all countries. Selected teachers whodeclined to participate were not substituted. Thus, the questionnaire wasadministered to both teachers “linked” and “not linked” to the tested class.Reporting of teacher data, however, was restricted to teachers who reportedthat they were teaching the tested class.
As the selection procedure for the teacher questionnaire was based onparticipating students, the sampled teachers did not necessarily represent allteachers from civic-related subjects in a country but rather the teachers of therepresentative samples of students sampled for this study. Consequently, thereporting of teacher data in the IEA Civic Education Study was linked to thestudent sample, and the teacher results were weighted with the number ofstudents they were teaching. The unit of analysis for all results was the student,not the teacher. If a student was taught by more than one teacher, the student’sweight was distributed equally between the teachers who were teaching thestudent. Teacher data from Colombia and the United States were omitted fromthe international report due to country-specific problems regarding the linkagebetween students and teachers. However, all teacher data have been included inthe international database.

153CHAPTER 10 REPORTING STUDENT AND TEACHER DATA
Table 10.15 shows a fictitious example of how teachers were linked to studentweights. In this example, the weights of students 1 to 10 have been assigned toteachers A, B, and C. Whereas teacher C teaches only one group of students(students 6 to 10), teachers A and B teach the same group of students (students1 to 5). Thus, student weights for the latter group of students have beendivided by the number of teachers per students (in this case two) and assignedto both teachers. The sum of weights in the resulting weighted teacher file wastherefore always equal to the sum of weights in the student file (as shown inthe example).
Table 10.15 Example for the assignment of student weights to teacher data
Teacher Student Original Student Weight Assigned Weight
A 1 7.2 3.6
B 1 3.6
A 2 7.2 3.6
B 2 3.6
A 3 7.2 3.6
B 3 3.6
A 4 7.2 3.6
B 4 3.6
A 5 7.2 3.6
B 5 3.6
C 6 4.9 4.9
C 7 4.9 4.9
C 8 4.9 4.9
C 9 4.9 4.9
C 10 4.9 4.9
Sum of Weights 60.5 60.5
Data based on the teacher survey were generally presented as percentages ofstudents whose teachers reported characteristics, attitudes, or instructionalstrategies, or as “student-weighted” averages. Standard errors were estimatedusing the JRR method, as was done for the reporting of student data.
It should be noted that data from a representative teacher survey based on arandom sample of the same target population in a given country might produceresults different from those obtained in the IEA Civic Education Study. Theapproach used here, however, is consistent with the goal of this study, whichwas to collect data on the instructional context of civic education for 14-year-old students.

154 IEA CIVIC EDUCATION STUDY TECHNICAL REPORT
REFERENCESAmadeo, J., Torney-Purta, J., Lehmann, R., Husfeldt, V., & Nikolova, R. (2002). Civic knowledgeand engagement: An IEA study of upper secondary students in sixteen countries. Amsterdam:International Association for the Evaluation of Educational Achievement (IEA).
Dunn, O. J. (1961). Multiple comparisons among means. Journal of the American StatisticalAssociation, 56, 52–64.
Gonzalez, E. J, & Foy, P. (2000). Reporting student achievement in mathematics and science. InM. O. Martin, K. D. Gregory, & S. E. Stemler (Eds.), TIMSS 1999: Technical report (pp. 279–295). Chestnut Hill, MA: Boston College.
Gonzalez, E. J, & Gregory, P. (2000). Estimation of sampling variance. In M. O. Martin, K. D.Gregory, & S. E. Stemler (Eds.), TIMSS 1999: Technical report (pp. 203–222). Chestnut Hill, MA:Boston College.
Torney-Purta, J., Lehmann, R., Oswald, H., & Schulz, W. (2001). Citizenship and education intwenty-eight countries: Civic knowledge and engagement at age fourteen. Amsterdam: InternationalAssociation for the Evaluation of Educational Achievement (IEA).
Weststat, Inc. (1997). A user’s guide to WesVarPC. Rockville, MD: Author.
Winglee, M., Kalton, G., Rust, K., & Kasprzyk, D. (2001). Handling item non-response in theU.S. component of the IEA reading literacy study. Journal of Educational and Behavioral Statistics,26(3), 343–359.
Wolter, K. M. (1985). Introduction to variance estimation. New York: Springer.

155
APPENDIX A: ACKNOWLEDGMENTS
The IEA Civic Education Study began Phase 1 in 1994, transitioning in 1997into Phase 2. The results of case studies carried out during Phase 1 werepublished in Civic Education Across Countries: Twenty-four National Case Studiesfrom the IEA Civic Education Project (IEA, 1999). The results of a survey of 14-year-olds were published in Citizenship and Education in Twenty-Eight Countries:Civic Knowledge and Engagement at Age Fourteen (IEA, 2001), and the results of asurvey of upper secondary students in Civic Knowledge and Engagement: An IEAStudy of Upper Secondary Students in Sixteen Countries (IEA, 2002). Webinformation on this study can be found at > http://www.wam.umd.edu/~iea<.
The study has been a truly collaborative effort among hundreds of individualsaround the world. Staff from the national research centers in each participatingcountry, the International Association for the Evaluation of EducationalAchievement (IEA), the International Coordinating Center for Phase 1 at theUniversity of Maryland, the International Coordinating Center for Phase 2 atthe Humboldt University in Berlin, the IEA Data Processing Center, themembers of the International Steering Committee, advisors, and fundingagencies worked closely together to develop and implement the IEA CivicEducation Study. Its success would not have been possible without the tirelessefforts of all involved.
Individuals and organizations participating in this study are acknowledged fortheir contributions. Given that the study spanned more than eight years, the listmay not include all who have contributed throughout the life of this project.Any omission is inadvertent. The IEA Civic Education Study also would like tothank the 140,000 students who responded to the IEA Civic Educationsurveys of 14-year-old and upper secondary students. Without the cooperationof school administrators, teachers, and students, we would not have beenprivileged to have this glimpse into the civic world of young people acrossthree continents.
FUNDING AGENCIESSince 1998, the major funder for the international coordination of Phase 2(reported in this volume) has been the Deutsche Forschungsgemeinschaft (DFGor German Science Association) through a grant to the Humboldt University ofBerlin to support the International Coordinating Center. Since 2000,substantial additional funding for analysis and publication has been providedby the William T. Grant Foundation through a grant to the University ofMaryland at College Park (Department of Human Development). Otherfunding and support in Germany came from the Bundeszentrale für PolitischeBildung (Federal Agency for Civic Education), and in the United States fromthe National Center for Education Statistics of the United States Department ofEducation (for quality control and scaling) and the Carnegie Corporation ofNew York (for instrument preparation during the transition from Phase 1 toPhase 2). The Pew Charitable Trusts of Philadelphia funded Phase 1 of thestudy.
156 IEA CIVIC EDUCATION STUDY TECHNICAL REPORT
MANAGEMENT AND OPERATIONSThe IEA Civic Education Study was conducted under the auspices of the IEA.Although the study was centrally managed by the International CoordinatingCenters at the University of Maryland during Phase 1 and at the HumboldtUniversity of Berlin during Phase 2, important activities were carried out incenters around the world. The IEA Data Processing Center (DPC) in Hamburgwas responsible for data processing, the implementation of the CivEd sampledesign and the calculation of sampling weights.
The IEA Secretariat in Amsterdam provided funds and support throughoutboth phases of the study, and managed matching funds from the participatingcountries. Barbara Malak-Minkiewicz was the liaison between the researchcenters and the Secretariat. Hans Wagemaker (Executive Director), AlejandroTiana Ferrer (Chair), and Leendert Dijkhuizen (Financial Officer) providedimportant support throughout this study.
Paula Wagemaker provided thoughtful editing of this volume that was alwaysresponsive to authors’ concerns, and Becky Bliss designed the publication withskill.
INTERNATIONAL COORDINATING CENTER (PHASE 1)Judith Torney-Purta, International Coordinator and Chair of International SteeringCommitteeJo-Ann Amadeo, Senior Researcher
INTERNATIONAL COORDINATING CENTER (PHASE 2)Rainer Lehmann, International CoordinatorDonald Gray, Associate International Coordinator (1997–1998)Wolfram Schulz, Associate International Coordinator (1998–2001)Vera Husfeldt, Associate International Coordinator (2001–2002)Roumiana Nikolova, Associate International Coordinator (2002–2003)
IEA DATA PROCESSING CENTERHeiko Sibberns, Senior ResearcherPierre Foy, Senior ResearcherAngelica Barajas, Research AssistantJens Brockmann, Research AssistantUrsula Itzlinger, Research AssistantKristin Habeck, Research Assistant

157
NATIONAL RESEARCH COORDINATORSThe IEA Civic Education Study national research coordinators (NRCs) andtheir staff had the enormous task of implementing the study design in theircountries. They had to obtain funding, attend international meetings,contribute to the development of the international study, adapt internationalprocedures and instruments to their national context, work with schools toarrange test and questionnaire sessions, arrange the data entry, prepare data filesfor submission to the IEA Data Processing Center, and prepare national reports.The commitment and competence of the NRCs over nearly seven years madethis collaborative effort both successful and enjoyable. They participated inevery part of Phase 2, from reviewing instruments, to sampling, testing, andsupervising data entry, and, finally, reviewing analysis and this volume. Theirthoughtful comments at meetings and as reviewers have enriched allparticipants’ understanding of this subject area and its cross-national variations.
Addresses of National Research CoordinatorsAUSTRALIAKerry KennedyUniversity of Canberra, University DriveBruce ACT 2616Email: [email protected]
BELGIUM (FRENCH)Annette Lafontaine and Christiane BlondinService de Pedagogie Experimentale5 Bld du RectoratB4000 Liege (Sart-Tilman)[http://www.ulg.ac.be/pedaexpe/SPE98.html#A3.1]Emails: [email protected]
BULGARIARoumen NikolovSofia UniversityFaculty of Math & InformaticsDepartment of Information Technology5, James Bouchier St., Sofia 1126Sofia 1126[http://www-it.fmi.uni-sofia.bg/~roumen/]Email: [email protected]
CHILELeonor CariolaMinisterio de EducaciónUCEAlameda Bernardo O’Higgins # 1146, Sector B, Piso 8Santiago[http://www.mineduc.cl]Email: [email protected]
APPENDIX A ACKNOWLEDGMENTS

158 IEA CIVIC EDUCATION STUDY TECHNICAL REPORT
COLOMBIACarlos A. Pardo and Jose Guillermo OrtizSNP-ICFESCalle 17 Nr. 3-40 piso 10Bogotá[http://www.icfes.co]Emails: [email protected]
CYPRUSConstantinos Papanastasiou and Mary KoutseliniUniversity of CyprusDepartment of EducationP.O. Box 20537CY-1678 Nicosia[http://www.ucy.ac.cy/faculty/cp/]Emails: [email protected]
CZECH REPUBLICJana Strakova and Ivana KrizovaUIV/IIESenovazne nam.26P.O. BOX c.111006 Praha 1[http://www.uiv.cz/]Emails: [email protected]
DENMARKLars-Henrik SchmidtDanmarks Pædagogiske UniversitetEmdrupvej 101DK-2400 København NVEmail: [email protected]
ENGLANDDavid KerrNational Foundation for Educational Research (NFER)The MereUpton Park, Slough, Berkshire, SLI 2DQ[http://www.nfer.ac.uk/risheets/iec.htm]Email: [email protected]
ESTONIAAnu TootsTallin University of Educational SciencesDepartment of GovernmentNarva mnt. 2510120 Tallinn[http://www.tpu.ee/]Email: [email protected]

159
FINLANDSakari SuutarinenUniversity of JyväskyläInstitute for Education ResearchP.O. Box 35, 40351Jyväskylä[http://www.jyu.fi/ktl/civics.htm]Email: [email protected]
GERMANYJürgen Baumert and Detlef OesterreichMax-Planck-Institut für BildungsforschungLentzeallee 94D-14195 Berlin[http://www.mpib-berlin.mpg.de/EuB/program/areas/projectI-4.htm]Emails: [email protected]
[email protected] Kontogiannopoulou-PolydoridesUniversity of AthensDepartment of Pre-school Education, Neo Chimio 3rd Floor13 A Navarinou St.Athens 10680[http://www.cc.uoa.gr/]Email: [email protected]
HONG KONG (SAR)Lee Wing OnHong Kong Institute of EducationCentre for Citizenship Education10 Lo Ping Road, Tai Po, New Territories[http://www.ied.edu.hk/sfe/cce/eindex.htm]Email: [email protected]
HUNGARYZsuzsa MatraiNational Institute of Public EducationCenter for Evaluation StudiesDorottya u. 81051 Budapest[http://www.oki.hu/1e.htm]Email: [email protected]
ISRAELOrit IchilovTel Aviv UniversitySchool of Education69978 Tel Avivi[http://www.tau.ac.il/education/nsm.html]Email: [email protected]
APPENDIX A ACKNOWLEDGMENTS
160 IEA CIVIC EDUCATION STUDY TECHNICAL REPORT
ITALYBruno LositoNational Center for the Evaluation of the Education System (CEDE)Villa FalconieriI-00044 Frascati (Roma)[http://www.cede.it/cede/default.htm]Email: [email protected]
LATVIAAndris KangroUniversity of LatviaFaculty of Education and PsychologyJurmalas gatve 74/76Riga LV-1083[http://www.eduinf.lu.lv]Email: [email protected]
LITHUANIAIrena ZaleskieneInstitute of PedagogyDepartment of Social SciencesM. Katkaus 442600 Vilnius[http://www.elnet.lt/pi/e-about.htm]Email: [email protected]
NORWAYRolf MikkelsenUniversity of OsloInstitute for Teacher Education and School DevelopmentPO Box 1099 Blindern0316 Oslo[http://www.ils.uio.no/civic/]Email: [email protected]
POLANDAdam FraczekUniversity of WarsawFaculty of EducationMokotowska Str.16/2000-561 Warsaw[http://www.iss.uw.edu.pl/]Email: [email protected]
PORTUGALIsabel MenezesInst. De Inovacao EducacionalTr. Das Terras de Sant ’Ana 151250 Lisboa Codex[http://www.iie.min-edu.pt/eng/iieproj.htm]Email: [email protected]

161
ROMANIAGheorghe BunescuInstitute for Education SciencesStr. Stirbei Voda, nr. 3770732 BucharestEmail: [email protected]
RUSSIAN FEDERATIONGalina KovalyovaRussian Academy of EducationCenter for Evaluating the Quality of EducationInstitute for General Secondary EducationPogodinskay st. 8, rooms 201, 202, 204119905 MoscowEmails: [email protected]
SLOVAK REPUBLICMaria CapovaSPU-National Institute for EducationPluhova 8SK - 830 +BratislavaEmail: [email protected]
SLOVENIAMarjan SimencEducational Research Institute, Pedagoski InstitutGerbiceva 62, p.p. 7661111 LjubljanaEmail: [email protected]
SWEDENSverker Hard and Kersti BlidbergSwedish National Agency for EducationSkolverketSE-106 20 Stockholm[http://www.skolverket.se/]Emails: [email protected]
SWITZERLANDFritz OserUniversity of FribourgDepartment of EducationRue Faucigny 2CH-17+Fribourg[http://www.unifr.ch/pedg/]Email: [email protected]
APPENDIX A ACKNOWLEDGMENTS

162 IEA CIVIC EDUCATION STUDY TECHNICAL REPORT
UNITED STATES OF AMERICACarole HahnEmory UniversityDivision of Educational Studies1784 Decatur Road, Suite 240Atlanta, GA 30322[http://nces.ed.gov/surveys/cived/]Email: [email protected]
CIVIC EDUCATION STUDY ADVISORY COMMITTEESThe International Coordinating Center was supported by the InternationalSteering Committee and the IEA Technical Executive Group. These committeesbrought several disciplinary perspectives, as well as viewpoints from differentparts of the world. The Steering Committee prepared the study’s overall designin the proposal, wrote and reviewed items for the instruments, planned andinterpreted data analysis, led groups at meetings, and reviewed this volume indetail. The IEA Technical Executive Group, also represented at the SteeringCommittee through its chair, Ray Adams, provided guidance on issues relatedto design, sampling, instrument construction, analysis, and reporting, andensured that the methodologies used in this study were technically sound.Heinrich Mintrop was consultant on the development and later analysis of theteacher questionnaire for the standard population (14-year-olds).
International Steering Committee
Judith Torney-Purta (Chair), United StatesRay Adams (ex-officio), AustraliaBarbara Fratczak-Rudnicka, PolandBarbara Malak-Minkiewicz, IEA SecretariatGeorgia Kontogiannopoulou-Polydorides, NRC GreeceBruno Losito, NRC ItalyIngrid Munck, SwedenHans Oswald, GermanyJohn Schwille, United StatesGita Steiner-Khamsi, United StatesLee Wing-On, NRC Hong Kong (SAR)
Technical Executive Group
Ray Adams (Chair), AustraliaPierre Foy, Canada (now IEA Data Processing Center)Larry Hedges, United StatesEugene Johnson, United StatesMichael O. Martin, United States
Consultant
Heinrich Mintrop, United States

163
APPENDIX B: TEST AND QUESTIONNAIRE DESIGN
B.1 Content Outline Serving as Guidelines for the IEA CivicEducation Study Test/Survey Issued November 1998
The first version of these guidelines was developed in May of 1996, basedprimarily on the core international framing questions developed throughinternational consultation in early 1995. The revisions made in 1997incorporated changes made after meetings on test development held inDecember 1996, February 1997, March 1997, and May 1997. They alsoincluded additional quotations from Phase 1 documents.
The material enclosed in “ ” below is taken directly from the Phase 1 reports;other material from these documents is included in more general phraseology.The materials regarding status refer to the types of items in the database wherethe topic fits best.
A pre-pilot was undertaken in 1997 in 20 countries. Some item reclassificationswere made on advice from the national research coordinators (NRCs) based ontheir pre-pilot experience. A few new items were written by NRCs at theMarch 1998 meeting and included in the pilot.
These guidelines are stated primarily in terms useful in the formulation of Type1 items (knowledge). Some topics are also suitable for Column 2 skills items(which often include some text or cartoon material to which knowledge is tobe applied). The guidelines have also been very useful in developing Column 3items, Concepts of Democracy, Concepts of Citizenship, and Concepts of theScope of Government.
Use is not made of sub-scores by content domain or sub-domain, but rather ofconstructed separate sub-scores for knowledge and skills (as well as a total).
B.2 Content Guidelines Organized by Domains I—III
Domain I: Democracy: What does democracy mean and what are its associatedinstitutions and practices (including rights and responsibilities of citizens)?
A) What are the defining characteristics of democracy as a form of social andpolitical organization?
1. Recognizes defining characteristics of democracy especially in itsleadership, including “representative democracy”, direct or “unanimousdemocracy”, “benevolent paternalistic democracy”, and constitutionalmonarchy (in a generalized way, but using other terms and also inschool settings). Some statements about citizens may be included here ifthe focus is on defining the characteristics of democracy by definingthe role played by citizens, especially understanding “sovereignty of thepeople” and “institutionalized power given to citizens through activeparticipation”.
APPENDIX B: TEST AND QUESTIONNAIRE DESIGN

164 IEA CIVIC EDUCATION STUDY TECHNICAL REPORT
2. Identifies or recognizes defining characteristics and examples of limitedand unlimited government (e.g., totalitarian and authoritarian regimes,including dictatorships, and how they can pose threats to democracy;“demagogues” and their threats; “different types of relations betweensubordinates and authorities”). Because of difficulties in translatingsome of these specifics, the term “undemocratic governments” or “non-democratic governments” is used. Understands how the rule of law canguard against excesses of “governments of persons”.
3. Understands or evaluates significant strengths of democratic systems(“peace, order and good government”, “pursuit of equality and justice”,support given to “public good” or “positive evolution of public life”, roleof real and presumed citizen efficacy, connections with economicreform and weaknesses of democratic systems (past and present),including indecisiveness, abuses of power and corruption. [Note: someitems categorized under 1 might fit here as well.]
4. Applies criteria for democracy to specific instances, problems, andscenarios; in particular, recognizes that there are sometimes gaps orconflict between the ideals of democracy and current governmental andpolitical realities (see also ways of dealing with unresponsive authoritiesin section B). Recognizes how democratic processes may be bothfostered and adapted for use in schools or informal group settings suchas school-community connections and in the “micro-politics ofeveryday life” (in addition to national or local contexts). This mayinclude appeal boards, youth movements, “pedagogical boards”, actionprojects, community service, student organizing committees, “studentgovernments or parliaments”. Understands the “implementation ofdemocracy in various sectors of life”. [Note: writing col. 1/2 multiple-choice questions about micro-politics of schools and other associationsproved difficult because of differences in the nature of theseorganizations across nations.]
5. Identifies situations where there are incentives to participate in politicallife (especially within a “dynamic view of society”) or to develop one’spolitical identity, in factors such as “political communication”,thoughtful self-interest, and concerns for concrete issues such as theenvironment. Also identifies “factors that undermine democracy”,including “fears to participate”, skepticism or apathy, “wariness ofchallenging the status quo”, “willingness to accept benevolentpaternalism”, “non-fulfillment or lack of responsibility among citizensto their obligations”, “corruption”.
6. Identifies the meaning of “political pluralism” and the role ofindividuals and individuals participating in civic groups or “non-governmental organizations” who hold influence or power indemocracy; also the role of élites, experts or highly educated orcultured persons, business groups. [Note: this is dealt with under othercategories such as IA1.]

165
7. Identifies or recognizes problems in transitions between types ofgovernment, especially during rapid democratization or “evolutions inpublic life”; changes in institutions, symbols, leaders; how institutionsand citizens cope with these changes, especially when there is also a“period of transition to a market economy”; “how to build on earlierperiods of democracy”; and how to deal with “transitions in schools’curricula”.
B) What are important democratic institutions and practices?
1. Identifies or recognizes defining characteristics, functions, andconsequences of democratic elections as ways of selecting leaders (e.g.,contested elections, “free elections”, elections that are “secret andregularly scheduled”, role of political parties, election campaigns asperiods when candidates present positions and seek support, role ofmedia, procedures for ensuring fair or “clean” elections, “freedom ofexpression exemplified in a variety of parties”).
2. Identifies “qualifications of candidates for governmental positions”.Compares and evaluates particular programs or appeals of hypotheticalcandidates or parties (use proposed newspaper format or cartoons) andshows how one might make up one’s mind in an election. Identifiesimportant characteristics to look for in leaders and how to balancestrengths of different candidates and connections between policypositions.
3. Identifies the ways that elected officials are viewed in their role aspolitical authorities. Understands what it means to have a “healthycritical attitude which holds officials accountable”; also, specific waysthey can be held accountable for their actions in democracy “throughconsultation”, “media attention”; “movements for reform”. Recognizesthat sometimes candidates once elected fail to live up to their promisesor obligations by sacrificing public interests to small group or privateinterests, “treating subordinates inappropriately”, “financial scandals”,“failing to deal with problems like unemployment”, corruption,“conflicts of interest”, “lack of concern for the common good in thebusiness of politics”; “failure to establish a 2-way communicationbetween government and people”. How citizens can effectively obtaininformation from media and other sources and deal with “non-responsiveness of officials”.
4. Identifies or recognizes “the basic characteristics of parliament, the lawand judicial system”, “foundation and evolution of law”, “goals and tasksof the legal system”, provisions for establishing laws and alsoregulations (the “rules and regulations of democratic life”); “importanceof law to communities”; also how laws are “reinforced” (made known),interpreted and enforced (to include legislative, judicial, and executiveprocesses); also dealing with police authority and with “members ofadministrative bureaucracies”. Understands what “civilian control of themilitary” requires and why it is important and “role of police asguardians of public order”.
APPENDIX B: TEST AND QUESTIONNAIRE DESIGN

166 IEA CIVIC EDUCATION STUDY TECHNICAL REPORT
5. Identifies the function of constitutions and the types of provisionsusually included in them, in particular the “rules and regulations thatpermit democratic decision-making” and “principles of delegation toregional governments”.
6. Understands what it means for power to be balanced or distributedamong branches of the government and what function this serves; alsofederal versus unitary governments (national items in countries wherethis is the structure). [Note: this was not stressed in the majority ofcountries, and there is a great deal of national specificity in the meaningof balance of power; this was to be dealt with, if at all, in the nationalitems.]
7. Understands basic economic issues and “their political implications”,“recognizes the relationship between the government and the market”,especially in an “information society”, what it means to “shift resourcesfrom the private to the public sector”, “state ownership and itsimplications”, “how the government pays for services it providesthrough taxation and borrowing”, “welfare state”, what some of thereasons are for unemployment and the policies that may be enacted thatinfluence it.
C) What are the rights and obligations of citizenship in democracy?
1. Identifies generally the rights and qualifications of citizens “common inand essential to” democracies, especially political or “civil rights” (e.g.,“vote” and “association”) and also “worship, right to fair trial”.Recognizes the extent to which voting is a right and also in somecountries an “obligation of citizens”.
2. Identifies rights usually guaranteed nationally, especially a citizen’sparticipation or “right to express dissenting opinions”, “way that votingor speaking can fight repression”, “right to associate with others” and“speak without fear”. Understands “acceptable forms of protest”, bothconventional and unconventional, “official and unofficial”, includingcivil disobedience without violence and “petitions, demonstrations,environmental actions, strikes”. Understands “right to voice andpromote their own opinions and oversee the work of political decision-makers” and “why the government needs to know people’s opinionsand why people have to make known their opinions and grievances”.Recognizes importance of “individual motivation and persistence inexercising self-determination and participation, including criticism andcivil disobedience”. Understands some of the “channels for forming andexpressing public opinion”, “how to approach state institutions withsuggestions”, “productive ways of expressing disagreement withpolitical decisions”, “how to search for non-violent solutions”, and “howto be an active, critical, and responsible member of society”.
3. Identifies the obligations, responsibilities, or “civic duties” of citizenscommon in democracies, including “willingness to participate inattending to common affairs” and “defend democratic values” and towhom these obligations are referenced (e.g., “society, the government,the family, elders”). Has skill in understanding how “rights orient

167
obligations which lead to behavior” and “readiness for continuousanalysis of information and critical thinking used in making judgments”about the citizen’s rights and responsibilities. Includes as examples“being law abiding, respecting others’ rights, supporting civic activitieswhich support the common good”, “civility”, paying taxes, “interest inconstructive democratic reform”, being informed about public issues,monitoring public officials, and voting after considering all candidatescarefully. Understands “how civic action sustains a democracy”.
4. Understands the role of media (press) in “presenting opinions to thepublic”, “right to freely present political opinion in an independentpress”, and the “right to non-censored information”. Understands “whatis necessary for the public to have confidence in the mass media”,problems when “freedom of the media conflicts with other goals”, suchas anti-racism. Recognizes arguments for censorship or governmentpress control, and why they may be appealing but should be resisted ina democracy.
5. Identifies the network of private, advisory, and voluntary associations(including those in schools) within which citizen obligations and rightsmay be encouraged and enacted, “right to create and join non-governmental interest-based associations” or “pressure groups which tellabout the needs of ordinary citizens”. Recognizes the importance of“practices exerting an influence on various causes and issues in society…, especially in local decision-making mechanisms”. Recognizes thediversity of political opinion on most issues. Develops the ability to“influence the communication environment”. Recognizes the specialstatus of “environmental issues as social issues around which group andindividual actions are centered”.
6. Identifies the relationship between “human rights” as defined ininternational documents, including UN documents, such as theUniversal Declaration of Human Rights and the Convention on Rightsof the Child and rights as defined within the country (usually in theConstitution). Also “respect for human dignity”, the need to “demandhuman rights for oneself and defend them for others”, principle of non-discrimination in human rights, “human rights issues in immigrantsocieties”, and “human rights during international collisions”.
7. Identifies rights in the economic sphere, especially in relation toowning property, labor unions, strikes, value of competition (andproblems of unfair competition), rights to social security, and “right tojoin a union”. Recognizes that some countries support a “right to aminimum standard of living”. [Note: this includes primarily ideashaving to do with individuals interacting with the economic system.]
8. Demonstrates awareness of trade-offs between individual rights, therights of others, and the good of the community (locally and on abroader level). Recognizes the existence of debates over rights such as“clean environment” or programs to aid those in poverty.
APPENDIX B: TEST AND QUESTIONNAIRE DESIGN

168 IEA CIVIC EDUCATION STUDY TECHNICAL REPORT
Domain II: National Identity and Regional and InternationalRelationships: How can the sense of national identity or national loyalty among youngpeople be described and how does it relate to sub-national and supranationalorganizations?
A) What are the characteristics of membership in a national community orsociety (sometimes referred to as “citizenry”)?
1. Recognizes the difference between ascribed citizen status (by birth, byresidence, by naturalization) versus citizenship as an acquired status (byloyalty to the state or acceptance of common norms). Recognizes termssuch as “native country”.
2. Recognizes the series of common memberships that are often associatedwith these statuses (e.g., speaking one of a selected small number oflanguages (and the lower status of certain languages)). “Aware of ways inwhich low status and lack of privilege may be associated.”
3. Recognizes the importance of “solidarity”, “unity”, or a sense of“collective identity” with the “native country” (e.g., having pride in yourcountry, “in special features such as natural beauty, education, culture, orscience”, and in being a ________; respecting the symbols of thecountry, such as the flag or statues of national heroes, documents, or“community traditions”; knowing national narratives about “patriots,national heroes or learned persons”, interpretations of historical eventssuch as the “founding of the country”, or “struggles for nationalexistence”; “identifying with the democratic constitution”; believingcertain “values and thoughts” exemplified in common literature orculture; serving in the military; defending the country from unjustcriticism; being respectful of government leaders/trusting thegovernment; being part of a sense of collective memory. In somecountries may include “filial piety extended to the government” and inothers may include “conflicts between unity and diversity”. Recognizesthe importance of patriotism and the problems associated with excessesof national identity (e.g., “chauvinistic nationalism”).
4. Recognizes that every nation has some events in its history of which itis justifiably proud. Also recognizes that every nation has some eventsof which it is not proud in its “social and its political history”, andknows something about what those events are for their country.Recognizes how nations generally sometimes deal with these issues,including “responsibility for developing countries as compensation forcolonial history”.
5. Recognizes the problems associated with national identity in “differenthistorical periods”, including times of transition (e.g., in rapiddemocratization) or of “dual citizenship”.
B) What does national identity or loyalty mean in relation to extra-nationaland supranational relationships and organizations?
1. Recognizes the nature of the role the country has played and continuesto play in global and regional spheres of influence.

169
2. Recognizes countries or groups of countries past, present, or future thathave been allies or enemies, and the nature of these “alliances ordependencies” or sense of “common traditions”, or enmities. Recognizes“neutral or mediating roles” among nations when “peace is threatened”.Understands “contributions for assuring the development of a modernnation” and “the role of international trade and everyday contact”.
3. Recognizes major supranational regional structures (in most caseswithin Europe) or international organizations (e.g., the United Nations)or organizations “concerned with finding cooperative solutions to worldissues” (e.g., Greenpeace) that may have a place in awareness, identity, orloyalty; “transforming shock and indignation over global inequalitiesinto understanding and action”.
4. Recognizes particular sub-national groups (e.g., ethnic or religiousgroups) that may have a place in the young person’s awareness, identity,or loyalty.
Domain III: Social Cohesion and Diversity: What is the make-up of the nation interms of diversity? What issues of social cohesion are raised, and how are they dealt with?
A) Which groups within the nation are seen as set apart or disenfranchised andin what ways?
1. Recognizes groups viewed as subject to discrimination in contemporarysociety (as defined, for example, by ethnicity, race, immigrant status,refugee status, mother tongue, social class, religion, gender).
2. Recognizes instances of past and present oppression or discriminationof certain groups in many societies and “racism as a violation againsthuman rights”; this includes differences in opportunities for politicalparticipation or in the extent to which certain groups serve in positionsof political leadership (“under-representation”). “Recognizes theimportance of the schools equipping males and females for equal rightsand responsibilities.” Recognizes the work of leaders and citizens whohave fought against oppression. Recognizes the seeking of enhancedpolitical power by some of these groups.
3. Recognizes tension in their society and many others betweenperceptions of the need for social cohesion and the need to recognizeand value the cultural, social, and political contributions of thesegroups. Recognizes ways of mediating conflict between these groupsand “knows about provisions to guard rights of minorities”.
4. Understands the “fundamental values of community life” and theimportance of attitudes and behaviors of respect and tolerance betweenthese groups on the part of individuals. Recognizes “world culturalplurality”, “interaction between different cultures”, and need for“equality of all cultural groups”. “Recognizes gaps in public discoursebetween friendliness and hostility.”
APPENDIX B: TEST AND QUESTIONNAIRE DESIGN
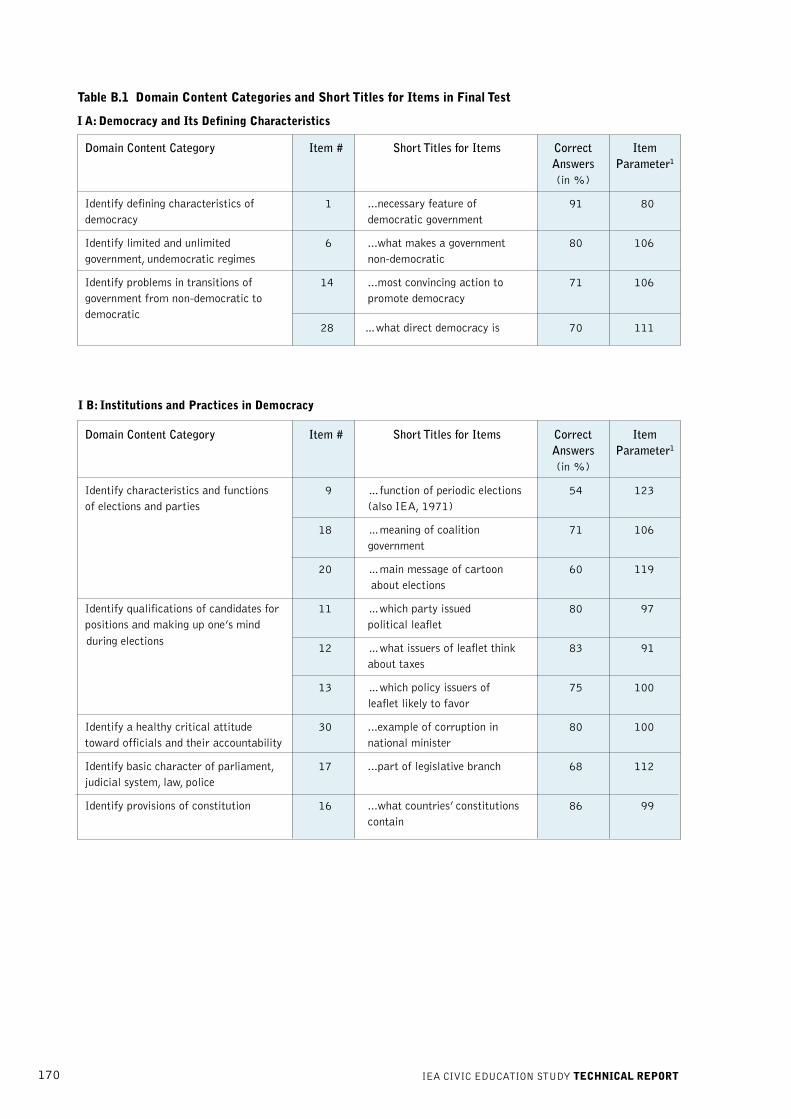
170 IEA CIVIC EDUCATION STUDY TECHNICAL REPORT
I B: Institutions and Practices in Democracy
Table B.1 Domain Content Categories and Short Titles for Items in Final Test
I A: Democracy and Its Defining Characteristics
28 …what direct democracy is 70 111
during elections
Domain Content Category Item # Short Titles for Items Correct ItemAnswers Parameter1
(in %)
Identify defining characteristics of 1 ...necessary feature of 91 80democracy democratic government
Identify limited and unlimited 6 ...what makes a government 80 106government, undemocratic regimes non-democratic
Identify problems in transitions of 14 ...most convincing action to 71 106government from non-democratic to promote democracydemocratic
Domain Content Category Item # Short Titles for Items Correct ItemAnswers Parameter1
(in %)
Identify characteristics and functions 9 …function of periodic elections 54 123of elections and parties (also IEA, 1971)
18 …meaning of coalition 71 106government
20 …main message of cartoon 60 119 about elections
Identify qualifications of candidates for 11 …which party issued 80 97positions and making up one’s mind political leaflet
12 …what issuers of leaflet think 83 91about taxes
13 …which policy issuers of 75 100leaflet likely to favor
Identify a healthy critical attitude 30 ...example of corruption in 80 100toward officials and their accountability national minister
Identify basic character of parliament, 17 ...part of legislative branch 68 112judicial system, law, police
Identify provisions of constitution 16 ...what countries’ constitutions 86 99contain

171
Table B.1 (continued)
I C: Citizenship: Rights and Duties
APPENDIX B: TEST AND QUESTIONNAIRE DESIGN
Domain Content Category Item # Short Titles for Items Correct ItemAnswers Parameter1
(in %)
Identify general rights, qualifications, 8 …a political right 90 85and obligations of citizens indemocracies
Identify citizens’ rights to participate 5 …violation of civil liberties in 72 107democracy (also IEA 1971)
Understand the role of mass media in 7 …result if large publisher buys 75 103democracy many newspapers
43 …influence of media 75 101
Identify network of associations and 3 …why organizations are 85 93differences of political opinion important in democracy
Identify the human rights defined in 2 ... purpose of Universal 92 86international documents Declaration of Human Rights
Identify rights in the economic sphere 4 …purpose of labor unions 86 98

172 IEA CIVIC EDUCATION STUDY TECHNICAL REPORT
III A: Social Cohesion and Diversity
Table B.1 (continued)
II A: National Identity
II B: International Relations
1 The reported item parameters are based on the joint scale of civic knowledge (which includes the sub-dimensions contentknowledge and interpretative skills). The item parameters mean that students with that level of proficiency had a 65 percentprobability of providing a correct response.
Domain Content Category Item # Short Titles for Items Correct ItemAnswers Parameter1
(in %)
Recognize groups subject to 15 ...an example of discrimination 68 108discrimination in pay equity
29 ...main message of a cartoon 71 110about excluding womencandidates
31 ...persistence of gender 70 109discrimination at work
Domain Content Category Item # Short Titles for Items Correct ItemAnswers Parameter1
(in %)
Recognize sense of collective identity 25 ...national or ethnic difference 68 110source of conflict as the source of conflict
Recognize that every nation has events 10 ...main message of cartoon about 67 110in its history of which it is not proud history textbooks
Domain Content Category Item # Short Titles for Items Correct ItemAnswers Parameter1
(in %)
Recognize major inter-governmental 23 ...reasons for recalling an 67 113organizations and understand diplomatic ambassadorrelations between countries

173
Table B.2 Domain Content Categories and Short Titles for Items in Final Test
I A: Democracy and Its Defining Characteristics
APPENDIX B: TEST AND QUESTIONNAIRE DESIGN
Domain Content Category Item # Short Titles for Items Correct ItemAnswers Parameter(in %)
Identify defining characteristics of 12 ...who ought to govern in 71 88democracy democracy (also IEA, 1971)
19 ...necessary feature of 65 96democratic government
Identify limited and unlimited 17 ...what makes a government 53 106government, undemocratic regimes non-democratic
Evaluate strengths and weaknesses 14 ...main message of cartoon 61 100of democratic systems about democracy
Identify incentives to participate in the 9 ...most serious threat to 72 90form of factors undermining democracy democracy
Identify problems in transitions of 29 ...most convincing action to 54 106government from non-democratic to promote democracydemocratic

174 IEA CIVIC EDUCATION STUDY TECHNICAL REPORT
Table B.2 (continued)
I B: Institutions and Practices in Democracy
Domain Content Category Item # Short Titles for Items Correct ItemAnswers Parameter(in %)
Identify characteristics and functions 11 ...function of having more 75 88of elections and parties than one political party
22 ...function of periodic elections 42 113(also IEA, 1971)
Identify qualifications of candidates for 23 ...which party issued political 65 97positions and making up one’s mind leafletduring elections
24 ...what issuers of leaflet think 71 91about taxes
25 ...which policy issuers of 58 100leaflet likely to favor
Identify a healthy critical attitude 30 ...example of corruption in 66 96toward officials and their accountability national legislature
33 ...main message of cartoon 77 84about political leader
Identify basic character of parliament, 2 ...an accurate statement 78 84judicial system, law, police about laws
13 ...main task of national 67 94legislature
Identify provisions of constitution 28 ...what countries’ constitutions 62 99contain
Understand basic economic issues and 27 ...essential characteristic of 47 110their political implications market economy
38 ...a fact (not an opinion) about 49 109taxes

175
Table B.2 (continued)
I C: Citizenship: Rights and Duties
II A: National Identity
APPENDIX B: TEST AND QUESTIONNAIRE DESIGN
Domain Content Category Item # Short Titles for Items Correct ItemAnswers Parameter(in %)
Identify general rights, qualifications, 3 ...a political right 78 85and obligations of citizens indemocracies
Identify citizens’ rights to participate 10 ...illegal activity for a political 59 101and express criticism and their limits organization
15 ...violation of civil liberties in 53 107democracy (also IEA, 1971)
Identify obligations, civic duties of 1 ...role of citizen in democratic 79 83citizens in democracy country
Understand the role of mass media in 4 ...which of a reporter’s rights 70 92democracy was violated
18 ...result if large publisher buys 57 103many newspapers
Identify network of associations and 7 ...why organizations are 69 93differences of political opinion important in democracy
34 ...main point of article about 35 121factory being shut
Identify the human rights defined in 6 ... purpose of Universal 77 86international documents Declaration of Human Rights
20 ...what is in Convention on 77 84Rights of the Child
Identify rights in the economic sphere 8 ...purpose of labor unions 64 98
Demonstrate awareness of tradeoffs 35 ...economic objections to 67 93factory being shut
Domain Content Category Item # Short Titles for Items Correct ItemAnswers Parameter(in %)
Recognize sense of collective identity 32 ...an opinion (not a fact) about 66 95flags
Recognize that every nation has events 36 ...main message of cartoon 58 102in its history of which it is not proud about history textbooks

176 IEA CIVIC EDUCATION STUDY TECHNICAL REPORT
Domain Content Category Item # Short Titles for Items Correct ItemAnswers Parameter(in %)
Recognize international economic issues 21 ...who owns multinational 47 110and organizations (other than businessesinter-governmental) active in dealingwith matters with economic implications 31 ...an opinion (not a fact) about 53 106
the environment
Recognize major inter-governmental 16 ...major purpose of United 85 77organizations Nations (also IEA, 1971)
Domain Content Category Item # Short Titles for Items Correct ItemAnswers Parameter(in %)
Recognize groups subject to 5 ...an example of discrimination 65 97discrimination in employment
26 ...an example of discrimination 50 108in pay equity
37 ...a fact (not an opinion) about 72 89women and politics
Table B.2 (continued)
II B: International Relations
III A: Social Cohesion and Diversity

177
APPENDIX C: TEST AND OPERATION FORMS
Form 1: Translation Deviation Form
Form 2: Translation Verification Report Form
Form 3: Subject Allocation Grid
Form 4: Class Sampling Form
Form 5: Teacher-Student Linkage Form
Form 6: Test Administration Form
Form 7: Student Tracking Form
Form 8: Teacher Tracking Form
APPENDIX C: TEST AND OPERATION FORMS
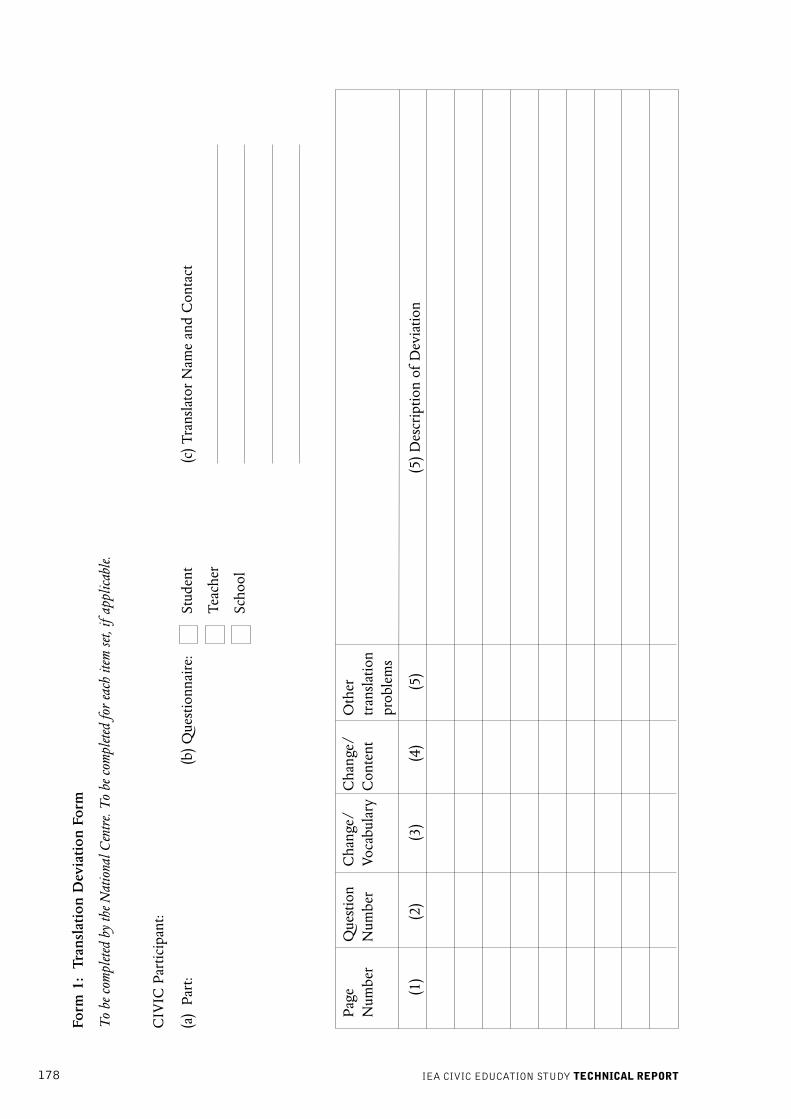
178 IEA CIVIC EDUCATION STUDY TECHNICAL REPORT
Form
1:
Tran
slat
ion
Dev
iatio
n Fo
rm
To
be c
ompl
eted
by
the
Nat
iona
l Cen
tre.
To
be c
ompl
eted
for
each
item
set,
if a
pplic
able
.
CIV
IC P
artic
ipan
t:
(a)
Part
:(b
) Que
stio
nnai
re:
Stud
ent
(c) T
rans
lato
r N
ame
and
Con
tact
Teac
her
Scho
ol
Page
Que
stio
nC
hang
e/C
hang
e/O
ther
Num
ber
Num
ber
Voca
bula
ryC
onte
nttr
ansl
atio
npr
oble
ms
(1)
(2)
(3)
(4)
(5)
(5) D
escr
iptio
n of
Dev
iatio
n

179
Form
2:
Tran
slat
ion
Veri
ficat
ion
Rep
ort F
orm
Cou
ntry
Lang
uage
Tran
slat
or´s
Nam
e
Inst
rum
ent:
Stu
dent
Que
stio
nnai
r e T
each
er Q
uest
ionn
aire
Sch
ool Q
uest
ionn
aire
(1)
(2)
(3)
(4)
(5)
Page
Que
stio
nSe
veri
tyD
escr
iptio
n of
Dev
iatio
nSu
gges
ted
Cha
nge
Num
ber
Num
ber
Cod
e
APPENDIX C: TEST AND OPERATION FORMS

180 IEA CIVIC EDUCATION STUDY TECHNICAL REPORT
Form 3: Subject Allocation Grid
Country:
Subject: Subject: Subject: Subject: Subject:
Item 1
Item 2
Item 3
Item 4
Item 5
Item 6
Item 7
Item 8
Item 9
Item 10
Item 11
Item 12
Item 13
Item 14
Item 15
Item 16
Item 17
Item 18
Item 19
Item 20
Item 21
Item 22
Item 23
Item 24
Item 25
Item 26
Item 27
Item 28
Item 29
Item 30
Item 31
Item 32
Item 33
Item 34
Item 35
Item 36
Item 37
Item 38Sum of ticks

181
CIVIC Participant: Stratum:
School Name:
[a] School ID [b] Grade [c]Minimum [d] Random Start [e] Sampling Interval* [f] First [g] SecondCluster Size Selected Class Selected Class*
Form 4: Class Sampling Form
(1) (2) (3) (4) (5)Class ID Class Name Number of Line Sampled
Students Number
* Necessary only if sampling more than one class per grade.
APPENDIX C: TEST AND OPERATION FORMS
0 . .

182 IEA CIVIC EDUCATION STUDY TECHNICAL REPORT
Form 5: Teacher-Student Linkage Form
CIVIC Participant: Stratum:
School Name:
[a] School ID [b] Grade [c] Class ID [d] Class name
(1) (2) (3) (4) (5)
Subject 1: Subject 2: Subject 3:
Teacher: Teacher: Teacher:
Class Name: Class Name: Class Name:
Link No: Link No: Link No
Student Name or Excl. Date of SexNumber Code Birth
(mmyy)

183
Form 6: Test Administration Form
Complete one form for each testing session
1. School identification code:
2. School name:
3. Class name:
4. School Coordinator:
5. Test Administrator:
6. Test Administrator’s position:
[ ]-National Center Staff
[ ]-Teacher from school but not teacher of the selected class
[ ]-Teacher of the selected class
[ ]-Other, please describe:
7. Type of testing session: [ ]-Regular [ ]-Makeup
8. Date of testing:
Scheduled starting time:
Actual schedule of the testing sessions
Start Endtime time
10a 10b Administration Session 1 (preparation of students, reading of instructions,distribution of student envelopes, etc.)
11a 11b Session 1 (Part 1 of the Student Questionnaire)
12a 12b Session 1 (Part 2 of the Student Questionnaire)
13a 13b Administration Session 2 (preparation of students, redistribution of theStudent Questionnaires etc.)
14a 14b Session 2.If the Student Questionnaire (Session 2) is administered on a differentdate, indicate the date here:
APPENDIX C: TEST AND OPERATION FORMS

184 IEA CIVIC EDUCATION STUDY TECHNICAL REPORT
15. Where there any special circumstances or unusual events during thesession?
[ ]-No [ ]-Yes - Explain:
16. Did students have any particular problems with the testing (for example,tests too difficult, not enough time provided, tiring, confusing)?
[ ]-No [ ]-Yes - Explain:
17. Were there any problems with the testing materials (for example, errors oromissions in the Student Tracking Forms, incorrect test booklet assignments,insufficient booklets)?
[ ]-No [ ]-Yes - Explain:
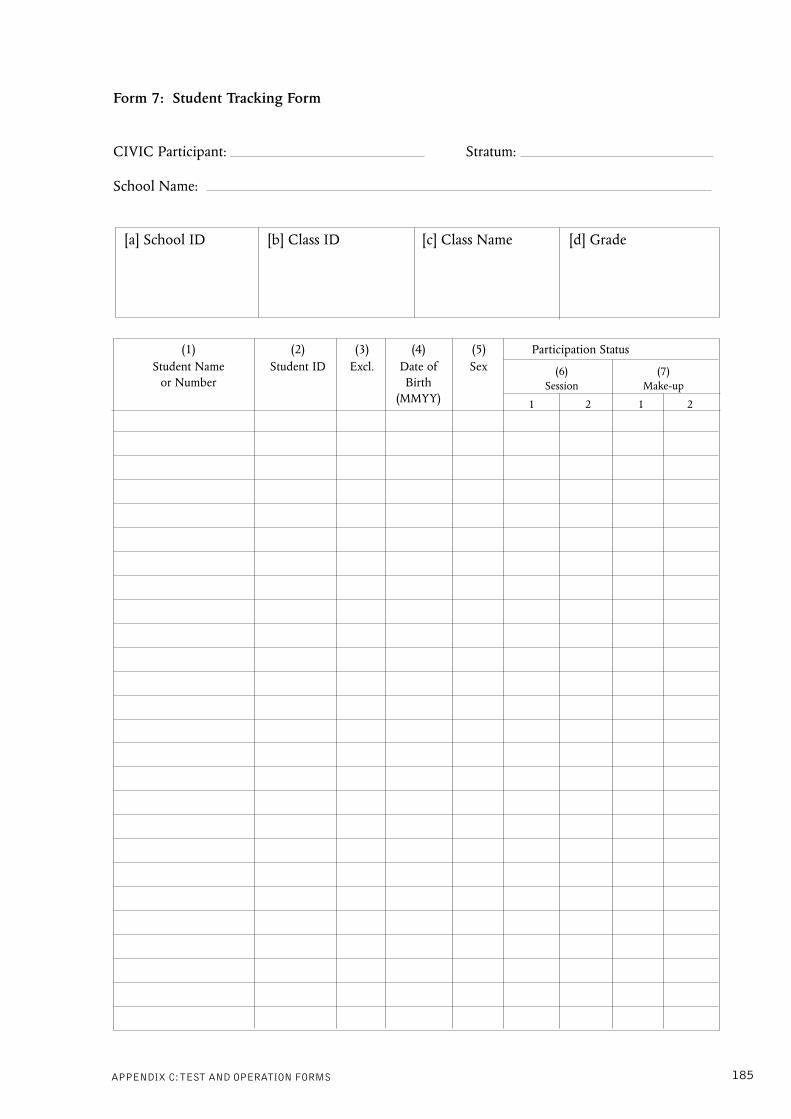
185
Form 7: Student Tracking Form
CIVIC Participant: Stratum:
School Name:
[a] School ID [b] Class ID [c] Class Name [d] Grade
(1) (2) (3) (4) (5) Participation StatusStudent Name Student ID Excl. Date of Sex
or Number Birth(MMYY)
(6) (7)Session Make-up
1 2 1 2
APPENDIX C: TEST AND OPERATION FORMS

186 IEA CIVIC EDUCATION STUDY TECHNICAL REPORT
Form
8:
Teac
her
Trac
king
For
m
CIV
IC P
artic
ipan
t: St
ratu
m:
Scho
ol I
D:
Scho
ol N
ame:
(1)
(2)
(3)
(4)
(5)
(6(7
)(8
)(9
)(1
0)
Teac
her
Nam
eTe
ache
r ID
*Li
nk N
o.Su
bjec
tG
rade
Cla
ss N
ame
Sam
pled
Elig
ible
Stu
dent
sQ
uest
ionn
aire
Part
icip
atio
n
Cla
ss I
DSt
atus
* A
teac
her
shou
ld b
e lis
ted
once
for
each
sub
ject
he
or s
he te
ache
s to
the
sele
cted
stu
dent
s, ea
ch ti
me
with
the
sam
e Te
ache
r ID
, but
a d
iffe
rent
Lin
k N
o.

187
APPENDIX D: SAMPLE CHARACTERISTICS
D.1 CIVED STANDARD POPULATION (14-YEAR-OLDS)
Introduction
The following material describes the target population definition and necessarycoverage and exclusions. It also shows the sample design for each countrywithin the standard population participating in the IEA Civic Education Study(CivEd).
AustraliaTarget PopulationIn Australia, the national desired target population was Grade 9.
Coverage and ExclusionsExclusions within the national defined target populationconsisted of very small schools, distant schools, and specialschools for the functionally and mentally disabled with atypicaleducational systems.
Sample Design• Explicit stratification was organized by states and territories
and school type, for a total of 20 explicit strata.
• No implicit stratification was used.
Table D.1 Allocation of school sample in Australia
Explicit Stratum Total Ineligible Participating Schools Non-Sampled Schools ParticipatingSchools Schools
NSW Government schools 32 0 26 5 1
NSW Catholic schools 11 0 5 3 3
NSW Independent schools 5 0 2 3 0
VIC Government schools 22 0 17 4 1
VIC Catholic schools 8 0 5 1 2
VIC Independent schools 5 0 5 0 0
QLD Government schools 20 0 17 3 0
QLD Catholic schools 5 0 5 0 0
QLD Independent schools 5 0 4 1 0
SA Government schools 8 0 7 1 0
SA Catholic schools 2 0 2 0 0
SA Independent schools 2 0 2 0 0
WA Government schools 11 0 7 3 1
WA Catholic schools 3 0 2 1 0
WA Independent schools 2 0 2 0 0
TAS Government schools 3 0 3 0 0
TAS Non-government schools 1 0 0 1 0
NT All schools 2 0 1 1 0
ACT Government schools 2 0 2 0 0
ACT Non-government schools 1 0 1 0 0
Total 150 0 115 27 8
Sampled Replacement
APPENDIX D: SAMPLE CHARACTERISTICS

188 IEA CIVIC EDUCATION STUDY TECHNICAL REPORT
Belgium (French)Target PopulationIn Belgium, the national desired target population was Grade 8.
Coverage and ExclusionsSchool-level exclusions consisted of special schools for thefunctionally and mentally disabled with atypical educationalsystems.
Sample Design• No explicit stratification was used.
• Implicit stratification was organized by type of education(academic and vocational).
Table D.2 Allocation of school sample in Belgium (French)
Explicit Stratum Total Ineligible Participating Schools Non-Sampled Schools ParticipatingSchools Sampled Replacement Schools
Belgium (French) 150 0 84 28 38
Total 150 0 84 28 38

189
Bulgaria Target PopulationIn Bulgaria, the national desired target population was Grade 8.
Coverage and ExclusionsSchool-level exclusions consisted of special schools for thefunctionally and mentally disabled with atypical educationalsystems, schools for students with criminal behavior, and verysmall schools (MOS<9).
Sample Design• Explicit stratification was organized by school size (large and
small schools), for a total of two explicit strata.
• No implicit stratification was used.
• Schools in the “small schools” stratum selected with equalprobabilities.
Table D.3 Allocation of school sample in Bulgaria
APPENDIX D: SAMPLE CHARACTERISTICS
Explicit Stratum Total Ineligible Participating Schools Non-Sampled Schools ParticipatingSchools Sampled Replacement Schools
Large schools 150 0 130 0 20
Small schools 22 0 18 0 4
Total 172 0 148 0 24

190 IEA CIVIC EDUCATION STUDY TECHNICAL REPORT
Chile Target PopulationIn Chile, the national desired target population was Grade 8.
Coverage and ExclusionsExclusions within the national defined target populationconsidered two different criteria: distant schools and small sizeschools (urban and rural schools).
Sample Design• Explicit stratification was organized by school type
(municipal, subsidized, and private paid), for a total of threeexplicit strata.
• Implicit stratification was organized by urbanization (urbanand rural schools) and geographical area (North,Metropolitan, and South), for a total of six implicit strata.
Table D.4 Allocation of school sample in Chile
Explicit Stratum Total Ineligible Participating Schools Non-Sampled Schools ParticipatingSchools Sampled Replacement Schools
Municipal schools 60 0 59 1 0
Subsidized schools 60 0 59 1 0
Private paid schools 60 0 60 0 0
Total 180 0 178 2 0
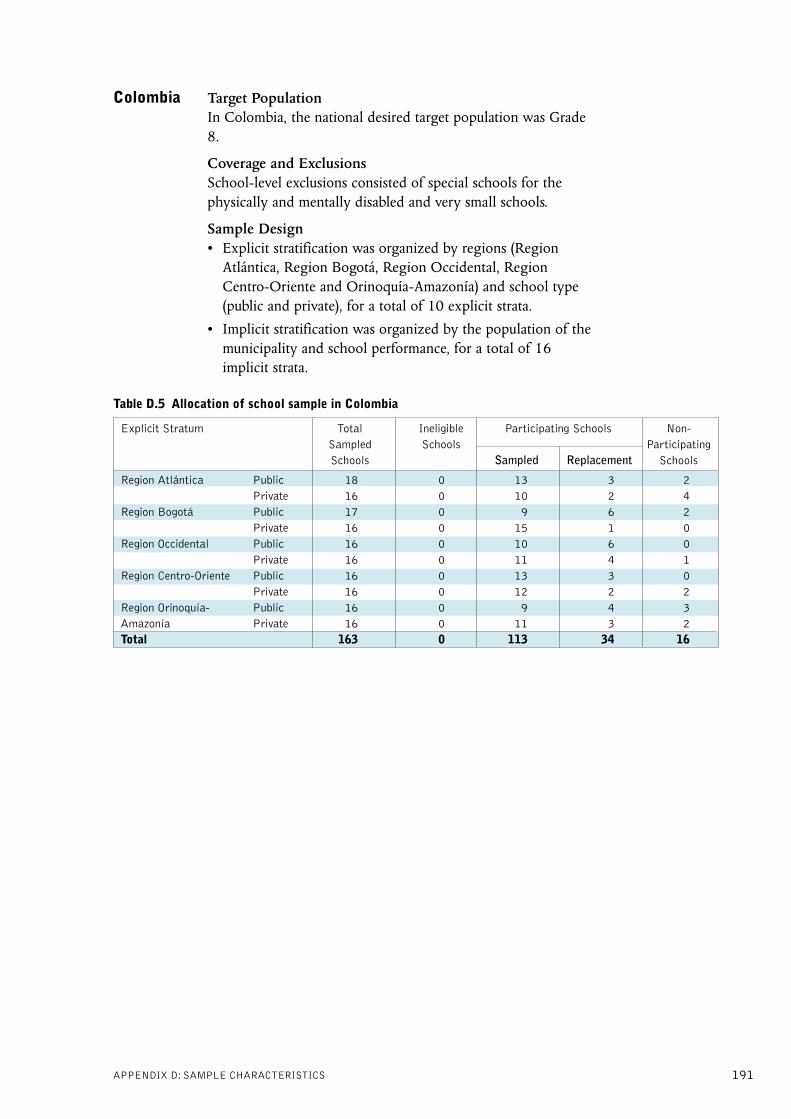
191
Colombia Target PopulationIn Colombia, the national desired target population was Grade8.
Coverage and ExclusionsSchool-level exclusions consisted of special schools for thephysically and mentally disabled and very small schools.
Sample Design• Explicit stratification was organized by regions (Region
Atlántica, Region Bogotá, Region Occidental, RegionCentro-Oriente and Orinoquía-Amazonía) and school type(public and private), for a total of 10 explicit strata.
• Implicit stratification was organized by the population of themunicipality and school performance, for a total of 16implicit strata.
Table D.5 Allocation of school sample in Colombia
Explicit Stratum Total Ineligible Participating Schools Non-Sampled Schools ParticipatingSchools Sampled Replacement Schools
Region Atlántica Public 18 0 13 3 2Private 16 0 10 2 4
Region Bogotá Public 17 0 9 6 2Private 16 0 15 1 0
Region Occidental Public 16 0 10 6 0Private 16 0 11 4 1
Region Centro-Oriente Public 16 0 13 3 0Private 16 0 12 2 2
Region Orinoquía- Public 16 0 9 4 3Amazonía Private 16 0 11 3 2Total 163 0 113 34 16
APPENDIX D: SAMPLE CHARACTERISTICS

192 IEA CIVIC EDUCATION STUDY TECHNICAL REPORT
Cyprus Target PopulationIn Cyprus, the national desired target population was Grade 8.
Coverage and ExclusionsAll existing 61 schools were included and sampled.
Sample Design• Explicit stratification was organized by districts.
• Implicit stratification was organized by school type (publicand private), for a total of two implicit strata.
Table D.6 Allocation of school sample in Cyprus
Explicit Stratum Total Ineligible Participating Schools Non-Sampled Schools ParticipatingSchools Sampled Replacement Schools
Cyprus 61 0 61 0 0
Total 61 0 61 0 0

193
Czech RepublicTarget PopulationIn the Czech Republic, the national desired target populationwas Grade 8.
Coverage and ExclusionsExclusions within the national defined target population werespecial schools for the functionally and mentally disabled withatypical educational systems and small schools.
Sample Design• Explicit stratification was organized by school type, for a
total of two explicit strata.
• Implicit stratification was organized by urbanization, for atotal of five implicit strata.
Table D.7 Allocation of school sample in Czech Republic
Explicit Stratum Total Ineligible Participating Schools Non-Sampled Schools ParticipatingSchools Sampled Replacement Schools
Basic schools 90 0 82 7 1
Gymnasia 60 0 54 5 1
Total 150 0 136 12 2
APPENDIX D: SAMPLE CHARACTERISTICS
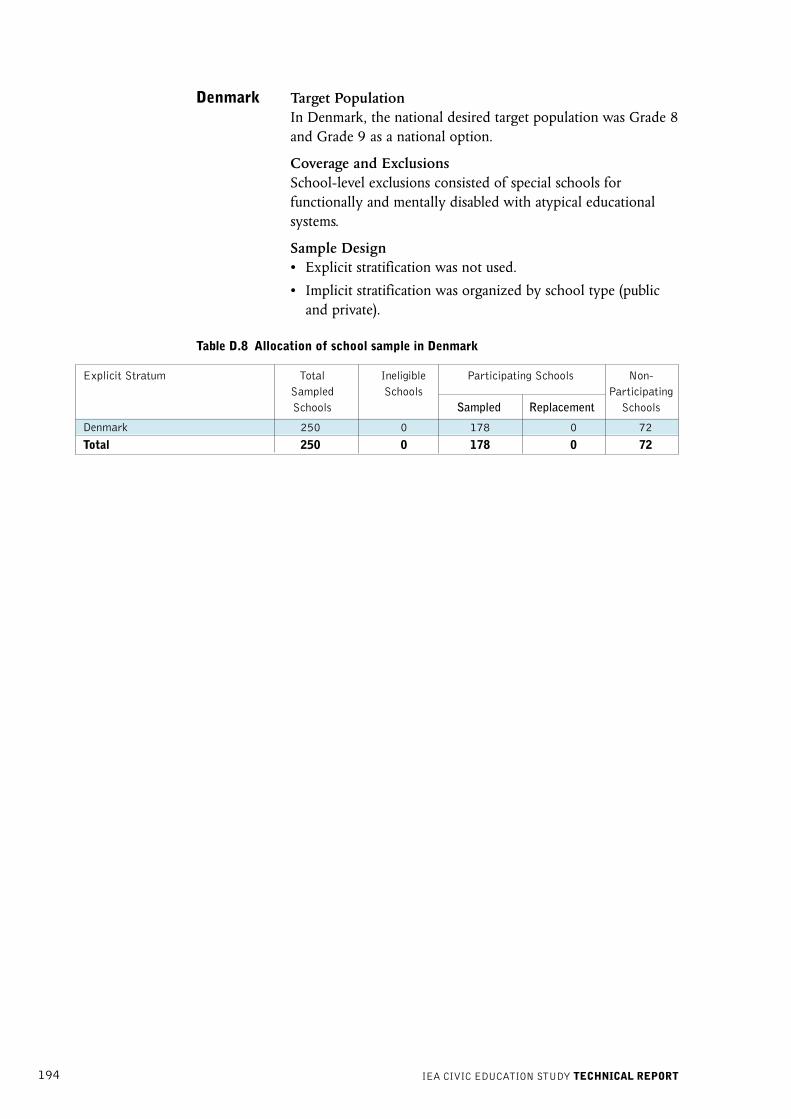
194 IEA CIVIC EDUCATION STUDY TECHNICAL REPORT
Denmark Target PopulationIn Denmark, the national desired target population was Grade 8and Grade 9 as a national option.
Coverage and ExclusionsSchool-level exclusions consisted of special schools forfunctionally and mentally disabled with atypical educationalsystems.
Sample Design• Explicit stratification was not used.
• Implicit stratification was organized by school type (publicand private).
Table D.8 Allocation of school sample in Denmark
Explicit Stratum Total Ineligible Participating Schools Non-Sampled Schools ParticipatingSchools Sampled Replacement Schools
Denmark 250 0 178 0 72
Total 250 0 178 0 72

195
England Target PopulationIn England, the national desired target population was Grade10.
Coverage and ExclusionsExclusions within the national defined target population werespecial schools for the functionally and mentally disabled withatypical educational systems and small schools.
Sample Design• No explicit stratification was used.
• Implicit stratification was organized by school performanceand school type, for a total of 30 implicit strata.
Table D.9 Allocation of school sample in England
Explicit Stratum Total Ineligible Participating Schools Non-Sampled Schools ParticipatingSchools Sampled Replacement Schools
England 150 0 80 48 22
Total 150 0 80 48 22
APPENDIX D: SAMPLE CHARACTERISTICS

196 IEA CIVIC EDUCATION STUDY TECHNICAL REPORT
Estonia Target PopulationIn Estonia, the national desired target population was Grade 8.
Coverage and ExclusionsExclusions within the national defined target population werespecial schools for the functionally and mentally disabled withatypical educational systems and small schools.
Sample Design• Explicit stratification was organized by regions and small
schools, for a total of seven explicit strata.
• Implicit stratification was organized by urbanization andlanguage of instruction, for a total of six implicit strata.
Table D.10 Allocation of school sample in Estonia
Explicit Stratum Total Ineligible Participating Schools Non-Sampled Schools ParticipatingSchools Sampled Replacement Schools
Central Estonia 21 0 18 0 3
North-East Estonia 27 0 23 0 4
Southern Estonia 29 0 24 1 4
Western Estonia 19 0 16 0 3
Northern Estonia 48 0 40 1 7
Small schools 8 0 7 0 1
Large schools 18 0 15 0 3
Total 170 0 143 2 25
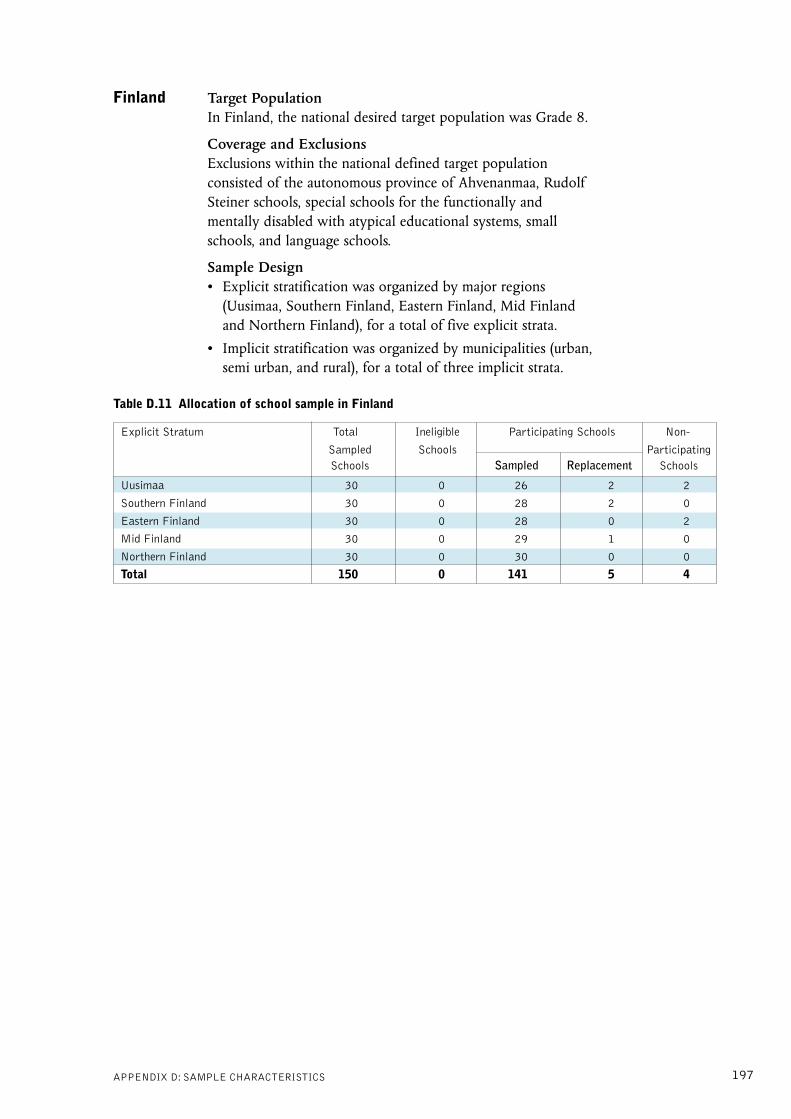
197
Finland Target PopulationIn Finland, the national desired target population was Grade 8.
Coverage and ExclusionsExclusions within the national defined target populationconsisted of the autonomous province of Ahvenanmaa, RudolfSteiner schools, special schools for the functionally andmentally disabled with atypical educational systems, smallschools, and language schools.
Sample Design• Explicit stratification was organized by major regions
(Uusimaa, Southern Finland, Eastern Finland, Mid Finlandand Northern Finland), for a total of five explicit strata.
• Implicit stratification was organized by municipalities (urban,semi urban, and rural), for a total of three implicit strata.
Table D.11 Allocation of school sample in Finland
Explicit Stratum Total Ineligible Participating Schools Non-
Sampled Schools ParticipatingSchools Sampled Replacement Schools
Uusimaa 30 0 26 2 2
Southern Finland 30 0 28 2 0
Eastern Finland 30 0 28 0 2
Mid Finland 30 0 29 1 0
Northern Finland 30 0 30 0 0
Total 150 0 141 5 4
APPENDIX D: SAMPLE CHARACTERISTICS

198 IEA CIVIC EDUCATION STUDY TECHNICAL REPORT
Germany Target PopulationIn Germany, the national desired target population wasGrade 8.
Coverage and ExclusionsExclusions within the national defined target population wereschools that follow a different curriculum and special schoolsfor the functionally and mentally disabled with atypicaleducational systems. Three federal states (“Bundeslaender”),Bremen, Hessen, and Niedersachsen) refused to participate inthe study, and one federal state (Baden-Wuerttemberg) did notpermit testing in high schools (“Gymnasium”).
Sample Design• Explicit stratification was organized by federal states (13
federal states) and school type (Gymnasium, Gesamtschule,Realschule, Hauptschule, and other schools includingRegelschule, Mittelschule, Regionalschule, andSekundarschule), for a total of 48 explicit strata.
Table D.12 Allocation of school sample in Germany
Explicit Stratum* Total Ineligible Participating Schools Non-Sampled Schools ParticipatingSchools Sampled Replacement Schools
BB Gymnasium 2 0 1 1 0
BB Gesamtschule 6 0 4 2 0
BB Realschule 1 0 1 0 0
BE Gymnasium 2 0 1 1 0
BE Gesamtschule 3 0 1 1 1
BE Realschule 2 0 1 1 0
BE Hauptschule 4 0 2 2 0
BW Realschule 6 0 3 1 2
BW Hauptschule 7 0 6 1 0
BY Gymnasium 6 0 3 3 0
BY Gesamtschule 1 0 1 0 0
BY Realschule 7 0 4 3 0
BY Hauptschule 9 0 4 4 1
HH Gymnasium 1 0 1 0 0
HH Gesamtschule 2 0 1 0 1
HH Hauptschule 4 0 1 1 2
MV Gymnasium 2 0 2 0 0
MV Gesamtschule 1 0 0 1 0
MV Realschule 2 0 2 0 0
MV Hauptschule 4 0 3 1 0
MV Other schools** 2 0 0 2 0
NW Gymnasium 11 0 7 4 0
NW Gesamtschule 9 0 3 4 2
NW Realschule 9 0 6 2 1
NW Hauptschule 9 0 7 2 0
Notes: *BB=Brandenburg, BE=Berlin, BW=Baden-Wuerttemberg, BY=Bayern, HH= Hamburg, MV=Mecklenburg-Vorpommern, NW=Nordrhein-Westfalen,RP=Rheinland-Pfalz.
**“Other schools” are schools with different study programs like Regelschule, Mittelschule, Regionalschule, or Sekundarschule.table contd. on next page

199
Table D.12 contd. from previous page
Explicit Stratum Total Ineligible Participating Schools Non-
Sampled Schools ParticipatingSchools Sampled Replacement Schools
RP Gymnasium 2 0 2 0 0
RP Gesamtschule 1 0 0 1 0
RP Realschule 2 0 2 0 0
RP Hauptschule 3 0 2 0 1
SH Gymnasium 1 0 1 0 0
SH Gesamtschule 2 0 0 1 1
SH Realschule 2 0 2 0 0
SH Hauptschule 2 0 2 0 0
SL Gymnasium 1 0 1 0 0
SL Gesamtschule 1 0 1 0 0
SL Realschule 1 0 1 0 0
SL Hauptschule 4 0 2 2 0
SL Other schools** 2 0 0 2 0
SN Gymnasium 4 0 1 3 0
SN Other schools** 18 0 10 8 0
ST Gymnasium 2 0 2 0 0
ST Gesamtschule 1 0 0 1 0
ST Realschule 3 0 2 1 0
ST Hauptschule 4 0 3 1 0
ST Other schools** 1 0 1 0 0
TH Gymnasium 2 0 1 1 0
TH Gesamtschule 1 0 0 1 0
TH Other schools** 10 0 6 3 1
Total 182 0 107 62 13
Notes: *SH=Schleswig-Holstein, SL=Saarland, SN=Sachsen, ST=Sachsen-Anhalt, TH=Thueringen.
** “Other schools” are schools with different study programs like Regelschule, Mittelschule, Regionalschule, or Sekundarschule.
APPENDIX D: SAMPLE CHARACTERISTICS

200 IEA CIVIC EDUCATION STUDY TECHNICAL REPORT
Greece Target PopulationIn Greece, the national desired target population was Grade 9.
Coverage and ExclusionsExclusions within the national defined target population wereschools delivering special education for the functionally andmentally disabled with atypical educational systems, very smallschools, and non-native-language-speaking schools.
Sample Design• Explicit stratification was organized by regions, for a total of
12 explicit strata.
• Implicit stratification was organized by school type (publicand private) and by urbanization.
Table D.13 Allocation of school sample in Greece
Explicit Stratum Total Ineligible Participating Schools Non-
Sampled Schools ParticipatingSchools Sampled Replacement Schools
East Macedon-Thrace 8 0 7 0 1
Central Macedonia 24 0 22 1 1
West Macedonia 5 0 5 0 0
Epirus 6 0 6 0 0
Thessaly 11 0 11 0 0
Ionian Islands 3 0 2 0 1
Western Greece 13 0 13 0 0
Sterea 7 0 7 0 0
Attiki 54 0 43 5 6
Peloponnese 6 0 5 1 0
Aegean Islands 7 0 5 0 2
Crete 9 0 9 0 0
Total 153 0 135 7 11
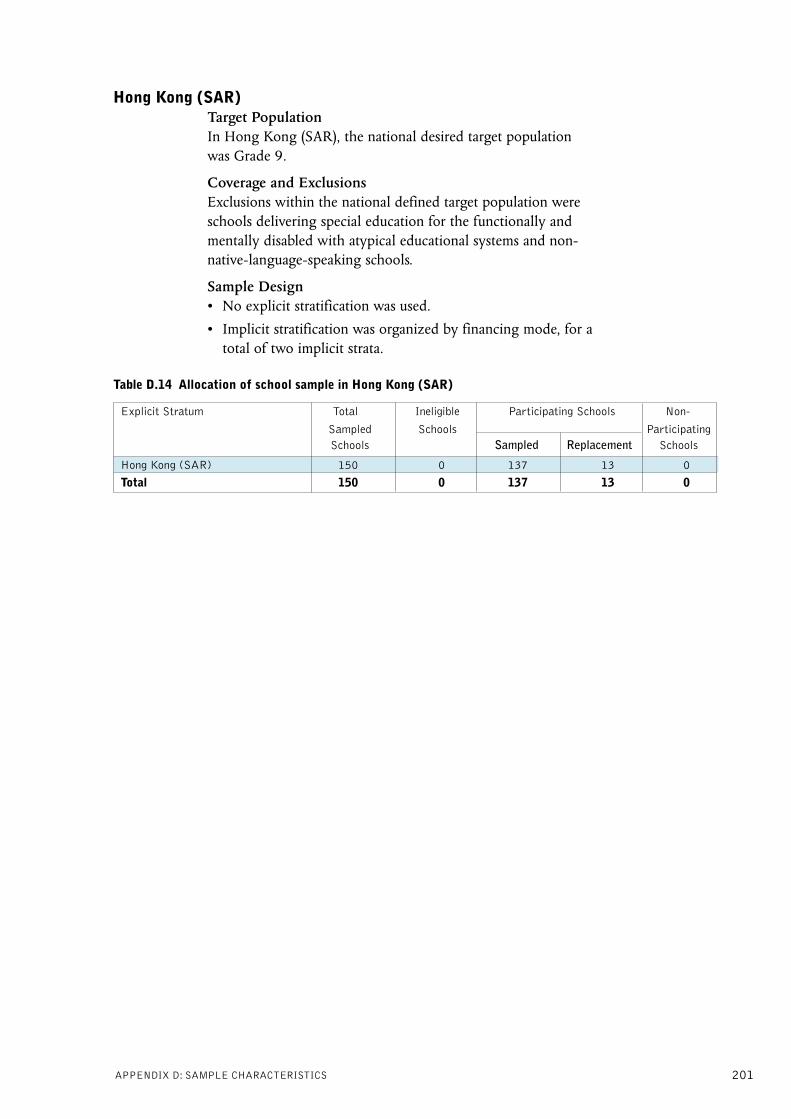
201
Hong Kong (SAR)Target PopulationIn Hong Kong (SAR), the national desired target populationwas Grade 9.
Coverage and ExclusionsExclusions within the national defined target population wereschools delivering special education for the functionally andmentally disabled with atypical educational systems and non-native-language-speaking schools.
Sample Design• No explicit stratification was used.
• Implicit stratification was organized by financing mode, for atotal of two implicit strata.
Table D.14 Allocation of school sample in Hong Kong (SAR)
Explicit Stratum Total Ineligible Participating Schools Non-
Sampled Schools ParticipatingSchools Sampled Replacement Schools
Hong Kong (SAR) 150 0 137 13 0
Total 150 0 137 13 0
APPENDIX D: SAMPLE CHARACTERISTICS

202 IEA CIVIC EDUCATION STUDY TECHNICAL REPORT
Hungary Target PopulationIn Hungary, the national desired target population was Grade 8.
Coverage and ExclusionsSchool-level exclusions consisted of special schools for thedisabled and very small schools (MOS<10.)
Sample Design• No explicit stratification was used.
• Implicit stratification was organized by urbanization andschool size.
Table D.15 Allocation of school sample in Hungary
Explicit Stratum Total Ineligible Participating Schools Non-Sampled Schools ParticipatingSchools Sampled Replacement Schools
Hungary 150 0 146 0 4
Total 150 0 146 0 4

203
Italy Target PopulationIn Italy, the national desired target population was Grade 8(population 2a) and Grade 9 (population 2b).
Coverage and ExclusionsSchool-level exclusions consisted of non-government middleschools, special schools for the functionally and mentallydisabled with atypical educational systems, and non-native-language- speaking schools.
Sample Design• No explicit stratification was used (for both populations).
• For Grade 8, implicit stratification was organized by regionand by type of municipality, for a total of 40 implicit strata.Implicit stratification for Grade 9 was organized by regionand by school category (classical education, artisticeducation, technical education, and vocational education), fora total of 80 implicit strata.
Table D.16 Allocation of school sample in Italy
Explicit Stratum Total Ineligible Participating Schools Non-Sampled Schools ParticipatingSchools Sampled Replacement Schools
Italy 172 0 161 11 0
Total 172 0 161 11 0
APPENDIX D: SAMPLE CHARACTERISTICS

204 IEA CIVIC EDUCATION STUDY TECHNICAL REPORT
Latvia Target PopulationIn Latvia, the national desired target population was Grade 8.
Coverage and ExclusionsCoverage in Latvia included students whose language ofinstruction is Latvian or Russian. School-level exclusionsconsisted of very small schools and special schools for thefunctionally and mentally disabled with atypical educationalsystems.
Sample Design• Explicit stratification was organized by school size and
language of instruction (Latvian/Russian), for a total of fiveexplicit strata.
• Implicit stratification was organized by urbanization anddistricts, for a total of 10 implicit strata.
• Schools in the Latvian- and Russian-speaking “very largeschools” and the “small rural Latvian-speaking schools” stratawere selected with equal probability.
Table D.17 Allocation of school sample in Latvia
Explicit Stratum Total Ineligible Participating Schools Non-Sampled Schools ParticipatingSchools Sampled Replacement Schools
Very large Latvian-speaking schools 11 0 11 0 0
Large Latvian-speaking schools 52 0 49 1 2
Small rural Latvian-speaking schools 12 0 12 0 0
Very large Russian-speaking schools 9 0 7 0 2
Other Russian-speaking schools 66 0 49 1 16
Total 150 0 128 2 20

205
Lithuania Target PopulationIn Lithuania, the national desired target population wasGrade 9.
Coverage and ExclusionsCoverage in Lithuania included students whose language ofinstruction was Lithuanian or , Russian, or Polish. School-levelexclusions consisted of special schools and very small schools(MOS<7).
Sample Design• Explicit stratification was organized by school size and
language of instruction (Latvian/Russian/Polish).
• Implicit stratification was organized by school type (basicand secondary), for a total of four implicit strata.
Table D.18 Allocation of school sample in Lithuania
Explicit Stratum Total Ineligible Participating Schools Non-Sampled Schools ParticipatingSchools Sampled Replacement Schools
Lithuanian-speaking large schools 133 0 127 3 3
Lithuanian-speaking small schools 17 0 16 0 1
Polish-speaking large schools 4 0 3 0 1
Polish-speaking small schools 2 0 2 0 0
Russian-speaking large schools 16 0 12 4 0
Russian-speaking small schools 2 0 2 0 0
Total 174 0 162 7 5
APPENDIX D: SAMPLE CHARACTERISTICS
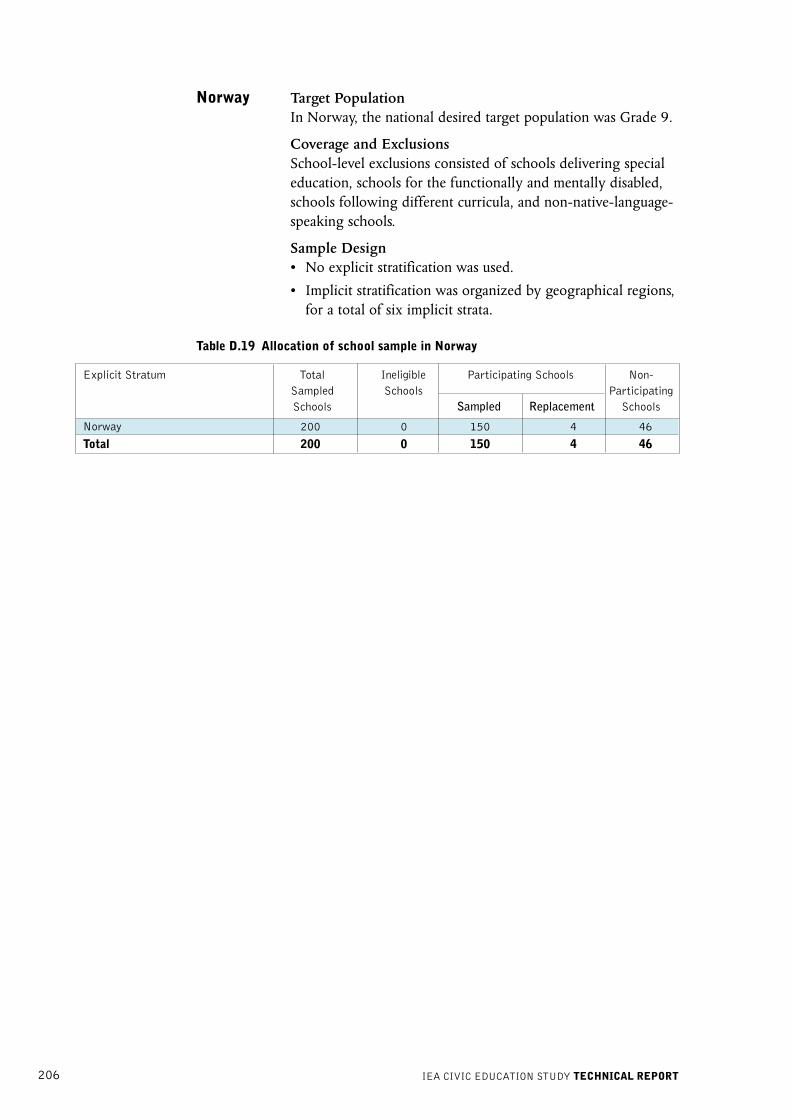
206 IEA CIVIC EDUCATION STUDY TECHNICAL REPORT
Norway Target PopulationIn Norway, the national desired target population was Grade 9.
Coverage and ExclusionsSchool-level exclusions consisted of schools delivering specialeducation, schools for the functionally and mentally disabled,schools following different curricula, and non-native-language-speaking schools.
Sample Design• No explicit stratification was used.
• Implicit stratification was organized by geographical regions,for a total of six implicit strata.
Table D.19 Allocation of school sample in Norway
Explicit Stratum Total Ineligible Participating Schools Non-Sampled Schools ParticipatingSchools Sampled Replacement Schools
Norway 200 0 150 4 46
Total 200 0 150 4 46

207
Poland Target PopulationIn Poland, the national desired target population was Grade 8.
Coverage and ExclusionsSchool-level exclusions consisted of schools delivering specialeducation for the functionally and mentally disabled withatypical educational systems.
Sample Design• No explicit stratification was used.
• No implicit stratification was used.
Table D.20 Allocation of school sample in Poland
Explicit Stratum Total Ineligible Participating Schools Non-Sampled Schools ParticipatingSchools Sampled Replacement Schools
Poland 200 0 163 16 21
Total 200 0 163 16 21
APPENDIX D: SAMPLE CHARACTERISTICS

208 IEA CIVIC EDUCATION STUDY TECHNICAL REPORT
Portugal Target PopulationIn Portugal, the national desired target population was Grade 9.
Coverage and ExclusionsSchool-level exclusions consisted of special schools forfunctionally and mentally disabled and small schools.
Sample Design• Explicit stratification was organized by region, for a total of
seven explicit strata.
• Implicit stratification was organized by school size.
Table D.21 Allocation of school sample in Portugal
Explicit Stratum Total Ineligible Participating Schools Non-Sampled Schools ParticipatingSchools Sampled Replacement Schools
Norte 55 0 54 0 1
Centro 27 0 26 1 0
Lisboa e Vale Do Tejo 47 0 46 1 0
Alentejo 8 0 8 0 0
Algarve 5 0 5 0 0
Madeira 4 0 4 0 0
Azores 4 0 4 0 0
Total 150 0 147 2 1

209
Romania Target PopulationIn Romania, the national desired target population was Grade8.
Coverage and ExclusionsSchool-level exclusions consisted of special schools for thephysically and mentally disabled and small schools (MOS<8).
Sample Design• Explicit stratification was organized by school size, for a total
of two explicit strata.
• Implicit stratification was organized by urbanization (ruraland urban), for a total of three implicit strata.
Table D.22 Allocation of school sample in Romania
Explicit Stratum Total Ineligible Participating Schools Non-Sampled Schools ParticipatingSchools Sampled Replacement Schools
Large schools 125 0 121 0 4
Small rural schools 25 0 25 0 0
Total 150 0 146 0 4
APPENDIX D: SAMPLE CHARACTERISTICS

210 IEA CIVIC EDUCATION STUDY TECHNICAL REPORT
Russian FederationTarget PopulationIn the Russian Federation, the national desired targetpopulation was Grade 8.
Coverage and ExclusionsSchool-level exclusions consisted of special schools for thefunctionally and mentally disabled with atypical educationalsystems and non-native-language-speaking schools.
Sample Design• Preliminary sampling was of 45 regions from a list of 89
regions. Nineteen regions were large enough to be sampledwith certainty and are marked with (°) in Table D.23.
• No explicit stratification was used. The explicit strata shownin Table D.23 are the 45 sampled regions.
• Implicit stratification was organized by school size (small andlarge schools) and by urbanization (village, settlement, smalltown, middle town, large town, and metropolis), for largeschools only
• Four schools were sampled per region. More schools weresampled in some certainty regions.
Table D.23 Allocation of school sample in the Russian Federation
Explicit Stratum Total Ineligible Participating Schools Non-Sampled Schools ParticipatingSchools Sampled Replacement Schools
Bashkortostan ° 4 0 4 0 0
Kabardino-Balkaria 4 0 4 0 0
Kalmykia 4 0 4 0 0
Marii Al 4 0 4 0 0
Tataria 4 0 4 0 0
Udmuttia 4 0 4 0 0
Krasnodar Kr.° 6 0 6 0 0
Altay Kr.° 4 0 4 0 0
Krasnoyarsk Kr.° 4 0 4 0 0
Primor Kr. 4 0 4 0 0
Stavropol Kr.° 4 0 4 0 0
Habarovsk Kr. 4 0 4 0 0
Belgorod Obl. 4 0 4 0 0
Vladimir Obl. 4 0 4 0 0
Volgograd Obl.° 4 0 3 1 0
Vologda Obl. 4 0 4 0 0
Ust Orda Ok. & Irkutsk Obl.° 4 0 4 0 0
Kemerovo Obl.° 4 0 3 0 1
Kirov Obl. 4 0 3 0 1
Leningrad Obl. 4 0 4 0 0
Moscow Obl.° 6 0 6 0 0
Murmansk Obl. 4 0 4 0 0
N. Novgorod Obl.° 4 0 4 0 0table contd. on next page

211
Table D.23 contd. from previous page
Explicit Stratum Total Ineligible Participating Schools Non-Sampled Schools ParticipatingSchools Sampled Replacement Schools
Novgorod Obl. 4 0 4 0 0
Omsk Obl.° 4 0 4 0 0
Novosibirsk Obl. 4 0 4 0 0
Orenburg Obl. 4 0 4 0 0
Orel Obl. 4 0 4 0 0
Komi Perm Ok. & Perm Obl.° 4 0 3 1 0
Rostov Obl.° 4 0 4 0 0
Rasan Obl. 4 0 4 0 0
Samara Obl.° 4 0 4 0 0
Saratov Obl.° 4 0 4 0 0
Sahalin Obl. 4 0 3 0 1
Sverdlovsk Obl.° 6 0 6 0 0
Smolensk Obl. 4 0 4 0 0
Tambov Obl. 4 0 4 0 0
Tver Obl. 4 0 4 0 0
Tomsk Obl. 4 0 3 1 0
Ulianovsk Obl. 4 0 4 0 0
Chelyabinsk Obl.° 4 0 3 0 1
Chita Obl. 4 0 3 0 1
Moscow° 8 0 8 0 0
Sankt Petersburg° 4 0 4 0 0
Khanty Mansi Ok. 4 0 4 0 0
Total 190 0 182 3 5
APPENDIX D: SAMPLE CHARACTERISTICS

212 IEA CIVIC EDUCATION STUDY TECHNICAL REPORT
Slovak RepublicTarget PopulationIn Slovakia, the national desired target population was Grade 8.
Coverage and ExclusionsSchool-level exclusions consisted of special schools for thefunctionally and mentally disabled with atypical educationalsystems, non-native-language-speaking schools, and very smallschools (MOS<13).
Sample Design• Explicit stratification was organized by school size (very
large gymnasiums and large gymnasiums) and by school level(basic school and gymnasium), for a total of three explicitstrata.
• Implicit stratification was organized by regions and schooltype (private and other), for a total of 11 implicit strata.
• “Very large gymnasia” were selected with equal probabilities.
• The large-school sample size in the two gymnasia strataproduced estimates by school level.
Table D.24 Allocation of school sample in the Slovak Republic
Explicit Stratum Total Ineligible Participating Schools Non-Sampled Schools ParticipatingSchools Sampled Replacement Schools
Very large gymnasia 2 0 2 0 0
Large gymnasia 28 0 21 5 2
Basic schools 120 0 94 23 3
Total 150 0 117 28 5

213
Slovenia Target PopulationIn Slovenia, the national desired target population was Grade 8.
Coverage and ExclusionsSchool-level exclusions consisted of special schools for thefunctionally and mentally disabled with atypical educationalsystems and non-native-language-speaking schools.
Sample Design• Explicit stratification was organized by school size (very
large schools and large schools), for a total of two explicitstrata.
• Implicit stratification was organized by urbanization (fivelevels), for a total of six implicit strata.
Table D.25 Allocation of school sample in Slovenia
Explicit Stratum Total Ineligible Participating Schools Non-Sampled Schools ParticipatingSchools Sampled Replacement Schools
Large schools 148 0 139 8 1
Very large schools 2 0 2 0 0
Total 150 0 141 8 1
APPENDIX D: SAMPLE CHARACTERISTICS

214 IEA CIVIC EDUCATION STUDY TECHNICAL REPORT
Sweden Target PopulationIn Sweden, the national desired target population was Grade 8.
Coverage and ExclusionsSchool-level exclusions consisted of special schools for thefunctionally and mentally disabled with atypical educationalsystems, small schools, and schools with students who had beenin Swedish schools less than one year.
Sample Design• Explicit stratification was organized by major regions,
immigrant status of school, and private schools, for a total ofseven explicit strata.
• Implicit stratification was organized by school size.
Table D.26 Allocation of school sample in Sweden
Explicit Stratum Total Ineligible Participating Schools Non-Sampled Schools ParticipatingSchools Sampled Replacement Schools
Big cities 25 0 22 0 3
Suburbs 25 0 24 1 0
Other cities 25 0 24 0 1
Rural and other areas 25 0 22 0 3
Schools with many immigrants 25 0 23 0 2
Private schools 21 0 16 2 3
Large private schools 4 0 4 0 0
Total 150 0 135 3 12

215
Switzerland Target PopulationIn Switzerland, the national desired target population wasGrade 8.
Coverage and ExclusionsSchool-level exclusions consisted of very small schools.
Sample Design• There was no explicit stratification.
• Implicit stratification was organized by languages andcantons.
Table D.27 Allocation of school sample in Switzerland
Explicit Stratum Total Ineligible Participating Schools Non-Sampled Schools ParticipatingSchools Sampled Replacement Schools
Switzerland 181 0 128 29 24
Total 181 0 128 29 24
APPENDIX D: SAMPLE CHARACTERISTICS

216 IEA CIVIC EDUCATION STUDY TECHNICAL REPORT
United States of AmericaTarget PopulationIn the United States, the national desired target population wasGrade 9.
Coverage and ExclusionsSchool-level exclusions consisted of small schools in theterritories.
Sample Design• Preliminary sampling was made of 52 primary sampling
units (PSUs) from a list of 1,027 PSUs; 10 PSUs were largeenough to be sampled with certainty.
• These PSUs were developed with the following generalproperties:
– for metropolitan areas, the PSUs consisted of cities andtheir surrounding suburban areas
– for non-metropolitan areas, the PSUs consisted of singlecounties or groups of counties
– the PSUs were always contiguous geographic areas.
Thus, special explicit stratification was applied to the USAdesign by school type and PSU size.
• Implicit stratification was organized by religiousdenomination and PSU within the private schools and byPSU and minority status within the public schools.
Table D.28 Allocation of school sample in the United States of America
Explicit Stratum Total Ineligible Participating Schools Non-Sampled Schools ParticipatingSchools Sampled Replacement Schools
Private—Certainty PSUs 4 0 3 0 1
Private—Small PSUs 7 0 5 1 1
Public—Certainty PSUs 42 0 21 12 9
Public—Large PSUs 18 0 13 1 4
Public—Small PSUs (Metro) 51 0 28 12 11
Public—Small PSUs (Non-Metro) 28 0 26 2 0
Total 150 0 96 28 26

217
Explicit Stratum Total Ineligible Participating Schools Non-Sampled Schools ParticipatingSchools Sampled Replacement Schools
Municipal scientific-humanistic 30 0 30 0 0
Municipal technical-professional 30 0 30 0 0
Subsidized scientific-humanistic 30 0 30 0 0
Subsidized technical-professional 30 0 30 0 0
Private paid schools 60 0 57 3 0
Total 180 0 177 3 0
D.2 CIVED OLDER POPULATION (UPPER SECONDARY STUDENTS)
Introduction
The following material describes the target population definition and necessarycoverage and exclusions. This material shows, as well, the sample design foreach country within the older population participating in the IEA CivicEducation Study (CivEd).
Chile Target PopulationIn Chile, the national desired target population was Grade 12for all regions within the country.
Coverage and ExclusionsSchool-level exclusions consisted of special schools for thephysically and mentally disabled with atypical educationalsystems and schools where students were unable to speak or toread the Spanish language.
Sample Design• Explicit stratification by administrative relationship with the
state (municipal, subsidized, and private) and by school track(scientific-humanistic, technical-professional, and paid) gavea total of five explicit strata.
• Implicit stratification was organized by region (north, south,and metropolitan area), for a total of three implicit strata.
Table D.29 Allocation of school sample in Chile
APPENDIX D: SAMPLE CHARACTERISTICS

218 IEA CIVIC EDUCATION STUDY TECHNICAL REPORT
Colombia Target PopulationIn Colombia, the national desired target population was Grade11. Note that the information provided on sampling wasinsufficient for adjudication and weighting.
Coverage and ExclusionsSchool-level exclusions consisted of very small schools(MCS/2).
Sample Design• Explicit stratification was used by regions (Atlántica, Bogotá,
Occidente, Centro Oriente, Orinoquía-Amazonía) and typeof schools (private or public), for a total of five explicit strata.
• Implicit stratification was organized by the population of themunicipality into four different levels and by the averagescore of schools in social studies—Colombia’s nationalexamination (Grade 11)—in four levels as well, for a total of16 implicit strata.

219
Cyprus Target PopulationIn Cyprus, the national desired target population was Grade 11.
Coverage and ExclusionsAll existing schools were included and sampled.
Sample Design• Explicit stratification was used by urbanization (rural and
urban schools) and regions (Nicosia, Limassol, Larfam, andPaphos).
• Implicit stratification was not used.
Table D.30 Allocation of school sample in Cyprus
Explicit Stratum Total Ineligible Participating Schools Non-Sampled Schools ParticipatingSchools Sampled Replacement Schools
Cyprus Nicosia (urban) 11 0 11 0 0
Cyprus Nicosia (rural) 2 0 2 0 0
Cyprus Limassol (urban) 10 0 10 0 0
Cyprus Limassol (rural) 3 0 3 0 0
Cyprus Larfarm (urban) 5 0 5 0 0
Cyprus Larfarm (rural) 4 0 4 0 0
Cyprus Paphos (urban) 4 0 4 0 0
Cyprus Paphos (rural) 3 0 2 0 1
Total 42 0 41 0 1
APPENDIX D: SAMPLE CHARACTERISTICS

220 IEA CIVIC EDUCATION STUDY TECHNICAL REPORT
Czech RepublicTarget PopulationWithin the Czech Republic, the national desired targetpopulation applied was Grade 12.
Coverage and ExclusionsSchool-level exclusions consisted of very small schools, specialschools for the functionally and mentally disabled with atypicaleducational systems, and Polish language schools.
Sample Design• Explicit stratification was organized by school track
(academic, technical, and vocational), for a total of threeexplicit strata.
• No implicit stratification was used.
Table D.31 Allocation of school sample in Czech Republic
Explicit Stratum Total Ineligible Participating Schools Non-Sampled Schools ParticipatingSchools Sampled Replacement Schools
Gymnasia 30 0 29 0 1
Technical schools 60 0 58 1 1
Vocational schools 60 0 56 3 1
Total 150 0 143 4 3

221
Denmark Target Population (pending)In Denmark, the national desired target population was Grade12.
Coverage and ExclusionsAll schools were included.
Sample Design• No explicit stratification was used.
• Implicit stratification was organized by school type.
Table D.32 Allocation of school sample in Denmark
Explicit Stratum Total Ineligible Participating Schools Non-Sampled Schools ParticipatingSchools Sampled Replacement Schools
Denmark 200 0 141 0 59
Total 200 0 141 0 59
APPENDIX D: SAMPLE CHARACTERISTICS

222 IEA CIVIC EDUCATION STUDY TECHNICAL REPORT
Estonia Target PopulationIn Estonia, the national desired target population was Grade 12.
Coverage and ExclusionsSchool-level exclusions consisted of special schools for thefunctionally and mentally disabled with atypical educationalsystems.
Sample Design• Explicit stratification was organized by five different regions
(Central, North-East, Southern, Western, and NorthernEstonia), for a total of five explicit strata.
• No implicit stratification was used.
Table D.33 Allocation of school sample in Estonia
Explicit Stratum Total Ineligible Participating Schools Non-Sampled Schools ParticipatingSchools Sampled Replacement Schools
Central Estonia 28 0 21 1 6
North-East Estonia 41 0 32 0 9
Southern Estonia 40 0 29 0 11
Western Estonia 25 0 15 2 8
Northern Estonia 78 0 42 0 36
Total 212 0 139 3 70

223
Hong Kong (SAR)Target PopulationIn Hong Kong (SAR), the national desired target populationwas Grade 12. Note that the information provided on samplingwas insufficient for adjudication and weighting.
Coverage and ExclusionsSchool-level exclusions consisted of non-native-language-speaking schools.
Sample Design• No explicit stratification was used.
• Implicit stratification was organized by mode of financing(government-aided, government, and private schools), for atotal of three implicit strata.
APPENDIX D: SAMPLE CHARACTERISTICS

224 IEA CIVIC EDUCATION STUDY TECHNICAL REPORT
Israel Target PopulationIn Israel, the national desired target population was Grade 11.
Coverage and ExclusionsSchool-level exclusions consisted of students from ultra-orthodox Jewish schools and Arab private church schools,special education schools, and schools that do not follow thestate curriculum.
Sample Design• Explicit stratification was used by type of school (Hebrew
and Arab), for a total of two explicit strata.
• Implicit stratification was organized by school type (regularstate and state religious schools), region, socioeconomicstatus within region, and number of eligible students in eachlisted school within region (descending and ascending), for atotal of 11 implicit strata.
Table D.34 Allocation of school sample in Israel
Explicit Stratum Total Ineligible Participating Schools Non-Sampled Schools ParticipatingSchools Sampled Replacement Schools
Hebrew schools 160 0 138 19 3
Arab schools 77 0 76 0 1
Total 237 0 214 19 4

225
Latvia Target PopulationIn Latvia, the national desired target population was Grade 12.
Coverage and ExclusionsCoverage in Latvia included students whose language ofinstruction is Latvian or Russian. School-level exclusionsconsisted of special schools for the physically and mentallydisabled and very small schools.
Sample Design• Explicit stratification was used by school size (very small
schools, moderately small schools, and large schools), for atotal of three explicit strata.
• Implicit stratification was organized by school type andurbanization, for a total of four implicit strata.
Table D.35 Allocation of school sample in Latvia
Explicit Stratum Total Ineligible Participating Schools Non-Sampled Schools ParticipatingSchools Sampled Replacement Schools
Very small schools 3 0 3 0 0
Moderately small schools 18 0 16 0 2
Large schools 124 0 98 8 18
Total 145 0 117 8 20
Note: Sample special note necessary.
APPENDIX D: SAMPLE CHARACTERISTICS

226 IEA CIVIC EDUCATION STUDY TECHNICAL REPORT
Norway Target PopulationIn Norway, the national desired target population was Grade12.
Coverage and ExclusionsExclusions within the national defined target population wereschools for individual education, remote schools, and extremelysmall schools.
Sample Design• Explicit stratification was not used.
• Implicit stratification was organized by counties, for a total of19 implicit strata.
Table D.36 Allocation of school sample in Norway
Explicit Stratum Total Ineligible Participating Schools Non-Sampled Schools ParticipatingSchools Sampled Replacement Schools
Large schools 5 0 4 0 1
Other schools 145 0 120 0 25
Total 150 0 124 0 26

227
Poland Target PopulationIn Poland, the national desired target population was Grade 11.
Coverage and ExclusionsSchool-level exclusions consisted of schools for students withvarious forms of physical disability and included jobpreparation schools, special basic vocational schools, specialtechnical secondary schools, special vocational secondaryschools, and special general secondary schools.
Sample Design• No explicit stratification was used.
• Implicit stratification was organized by provinces, for a totalof 16 implicit strata.
Table D.37 Allocation of school sample in Poland
Explicit Stratum Total Ineligible Participating Schools Non-Sampled Schools ParticipatingSchools Sampled Replacement Schools
Poland 150 0 135 15 0
Total 150 0 135 15 0
APPENDIX D: SAMPLE CHARACTERISTICS

228 IEA CIVIC EDUCATION STUDY TECHNICAL REPORT
Portugal Target PopulationIn Portugal, the national desired target population applied wasGrade 11.
Coverage and ExclusionsAll schools were included.
Sample Design• Explicit stratification was organized by region (Norte,
Centro, Lisboa e Vale Do Tejo, Alentejo, Algarve, Madeira,and Azores), for a total of 11 explicit strata.
• Implicit stratification was organized by school size andschool type (regular or professional), for a total of threeimplicit strata.
Table D.38 Allocation of school sample in Portugal
Explicit Stratum Total Ineligible Participating Schools Non-Sampled Schools ParticipatingSchools Sampled Replacement Schools
Norte 51 0 49 0 2
Centro 27 0 27 0 0
Lisboa e Vale Do Tejo 52 0 48 0 4
Alentejo 7 0 7 0 0
Algarve 5 0 4 0 1
Madeira 4 0 3 0 1
Azores 4 0 4 0 0
Alentejo professional 1 0 1 0 0
Algarve professional 2 0 2 0 0
Madeira professional 2 0 2 0 0
Azores professional 2 0 2 0 0
Total 157 0 149 0 8

229
Russian FederationTarget PopulationIn the Russian Federation, the national desired targetpopulation applied was Grade 11.
Coverage and ExclusionsSchool-level exclusions consisted of special schools for thephysically and mentally disabled and schools with non-Russianteaching language.
Sample Design• Explicit stratification was organized by regions.
• Implicit stratification was organized by school type (rural orurban).
Table D.39 Allocation of school sample in the Russian Federation
Explicit Stratum Total Ineligible Participating Schools Non-Sampled Schools ParticipatingSchools Sampled Replacement Schools
Bashkortostan 4 0 4 0 0
Kabardino-Balkaria 4 0 4 0 0
Kalmykia 3 0 3 0 0
Marii Al 4 0 4 0 0
Tataria 3 0 3 0 0
Udmuttia 4 0 4 0 0
Krasnodar Kr. 4 0 4 0 0
Altay Kr. 4 0 4 0 0
Krasnoyarsk Kr. 4 0 4 0 0
Primor Kr. 3 0 3 0 0
Stavropol Kr. 4 0 4 0 0
Habarovsk Kr. 6 0 6 0 0
Belgorod Obl. 4 0 4 0 0
Vladimir Obl. 4 0 4 0 0
Volgograd Obl. 4 0 4 0 0
Vologda Obl. 8 0 7 0 1
Ust Orda Ol. & Irkutsk Obl. 5 0 3 0 2
Kemerovo Obl. 4 0 4 0 0
Kirov Obl. 4 0 4 0 0
Leningrad Obl. 3 0 3 0 0
Moscow Obl. 4 0 4 0 0
Murmansk Obl. 4 0 4 0 0
N. Novgorod Obl. 3 0 3 0 0
Novgorod Obl. 3 0 3 0 0
Omsk Obl. 3 0 3 0 0
Novosibirsk Obl. 4 0 4 0 0
Orenburg Obl. 3 0 3 0 0
Orel Obl. 4 0 4 0 0
Komi Perm Ok. & Perm Obl. 4 0 4 0 0
Rostov Obl. 4 0 4 0 0
Rasan Obl. 4 0 4 0 0
Saratov Obl. 6 0 6 0 0
Sahalin Obl. 4 0 4 0 0
APPENDIX D: SAMPLE CHARACTERISTICS
table contd. on next page

230 IEA CIVIC EDUCATION STUDY TECHNICAL REPORT
Table D.39 contd. from previous page
Explicit Stratum Total Ineligible Participating Schools Non-Sampled Schools ParticipatingSchools Sampled Replacement Schools
Sverdlovsk Obl. 4 0 4 0 0
Smolensk Obl. 3 0 3 0 0
Tambov Obl. 3 0 3 0 0
Tver Obl. 3 0 3 0 0
Tomsk Obl. 2 0 2 0 0
Ulianovsk Obl. 3 0 3 0 0
Chelyabinsk Obl. 3 0 3 0 0
Chita Obl. 4 0 4 0 0
Moscow 4 0 4 0 0
Sankt Petersburg 3 0 3 0 0
Khanty Mansi Ok. 4 0 3 0 1
Total 169 0 165 0 4
Note: Samara Obl. was not included in the sample.

231
Slovenia Target PopulationIn Slovenia, the national desired target population wasGrade 12.
Coverage and ExclusionsExcept for three special schools, all schools were included.
Sample Design• No explicit stratification was used.
• Implicit stratification was organized by geographical area, fora total of three implicit strata.
Table D.40 Allocation of school sample in Slovenia
Explicit Stratum Total Ineligible Participating Schools Non-
Sampled Schools ParticipatingSchools Sampled Replacement Schools
Slovenia 151 0 145 0 6
Total 151 0 145 0 6
APPENDIX D: SAMPLE CHARACTERISTICS
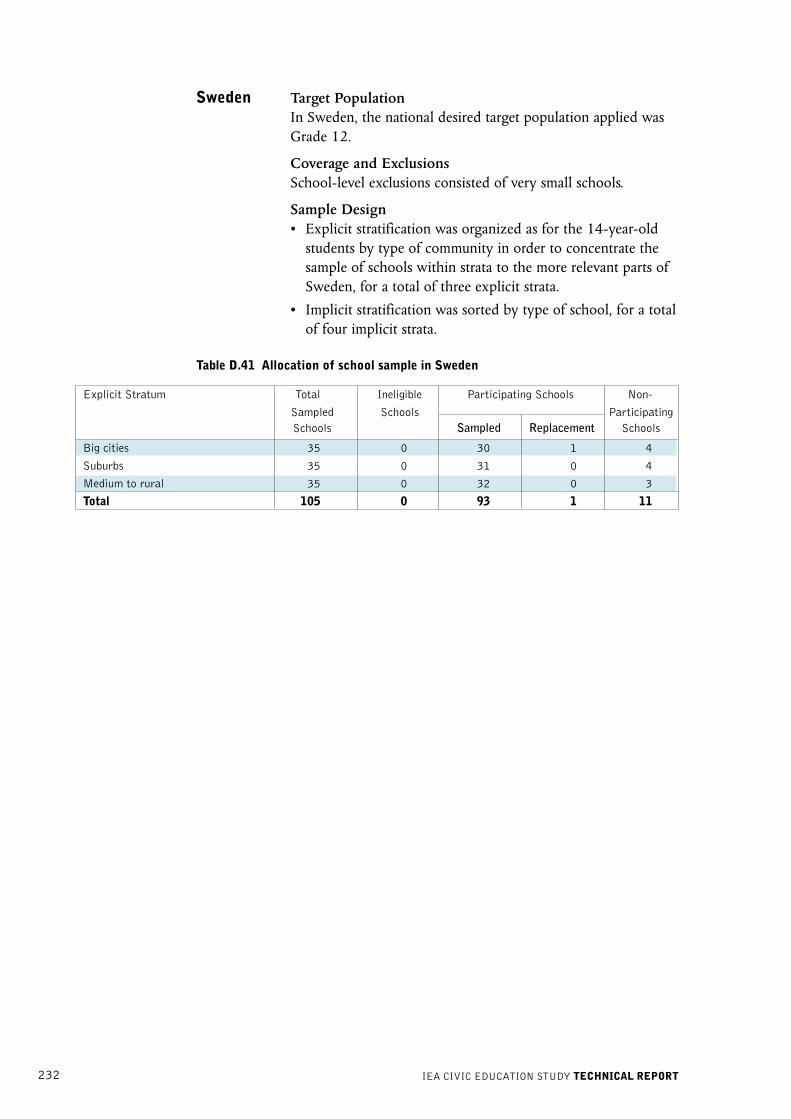
232 IEA CIVIC EDUCATION STUDY TECHNICAL REPORT
Sweden Target PopulationIn Sweden, the national desired target population applied wasGrade 12.
Coverage and ExclusionsSchool-level exclusions consisted of very small schools.
Sample Design• Explicit stratification was organized as for the 14-year-old
students by type of community in order to concentrate thesample of schools within strata to the more relevant parts ofSweden, for a total of three explicit strata.
• Implicit stratification was sorted by type of school, for a totalof four implicit strata.
Table D.41 Allocation of school sample in Sweden
Explicit Stratum Total Ineligible Participating Schools Non-
Sampled Schools ParticipatingSchools Sampled Replacement Schools
Big cities 35 0 30 1 4
Suburbs 35 0 31 0 4
Medium to rural 35 0 32 0 3
Total 105 0 93 1 11

233
Switzerland Target PopulationIn Switzerland, the national desired target population appliedwas Grade 11.
Coverage and ExclusionsSchool-level exclusions consisted of special schools for thephysically and mentally disabled.
Sample Design• Explicit stratification was organized by school type, for a
total of six strata.
• Implicit stratification was sorted by school track, for a totalof one implicit strata.
Table D.42 Allocation of school sample in Switzerland
Explicit Stratum Total Ineligible Participating Schools Non-Sampled Schools ParticipatingSchools Sampled Replacement Schools
Gymnasium 10 0 10 0 0
Berufsbildung 47 0 43 0 4
Diplommittelschule 4 0 4 0 0
Unterichtsberufe 4 0 4 0 0
Berufsmaturität 4 0 4 0 0
Anlehre 4 0 4 0 0
Total 73 0 69 0 4
APPENDIX D: SAMPLE CHARACTERISTICS

234 IEA CIVIC EDUCATION STUDY TECHNICAL REPORT
Table E.1: Total civic knowledge (content knowledge and interpretative skills)
Country Total Number of Design Effect EffectiveStudents Assessed Sample Size
Australia 3,301 5.0 660
Belgium (French) 2,075 5.5 379
Bulgaria 2,857 11.7 243
Chile 5,677 9.5 600
Colombia 4,889 17.8 275
Cyprus 3,102 2.0 1,568
Czech Republic 3,599 7.0 513
Denmark 3,192 2.1 1,498
England 3,011 3.2 929
Estonia 3,418 3.8 900
Finland 2,776 3.1 909
Germany 3,685 2.6 1,414
Greece 3,448 4.3 793
Hong Kong (SAR) 4,993 11.7 426
Hungary 3,165 3.9 807
Italy 3,808 6.1 628
Latvia 2,570 6.8 377
Lithuania 3,494 6.4 547
Norway 3,310 1.8 1,824
Poland 3,372 19.2 176
Portugal 3,234 6.3 511
Romania 2,993 8.5 352
Russian Federation 2,129 8.4 254
Slovak Republic 3,460 6.2 557
Slovenia 3,064 2.1 1,481
Sweden 3,061 4.8 631
Switzerland 3,096 6.6 468
United States 2,786 7.7 360
APPENDIX E: DESIGN EFFECTS AND EFFECTIVE SAMPLESIZE TABLES

235
Table E.2:Total civic knowledge (content knowledge and interpretative skills)
Country Total Number of Design Effect EffectiveStudents Assessed Sample Size
Chile 5,750 6.4 900
Cyprus 1,694 9.9 171
Czech Republic 3,349 4.3 786
Denmark 2,745 1.6 1,706
Estonia 3,175 6.5 488
Israel 5,750 10.5 548
Latvia 2,756 14.3 192
Norway 2,076 5.8 359
Poland 4,041 10.6 382
Portugal 2,734 3.6 750
Russian Federation 1,787 6.0 299
Slovenia 3,728 16.4 227
Sweden 2,677 3.6 739
Switzerland 1,270 11.9 106
APPENDIX E: DESIGN EFFECTS AND EFFECTIVE SAMPLE SIZE TABLES

236 IEA CIVIC EDUCATION STUDY TECHNICAL REPORT
APPENDIX F: THE CIVED INSTRUMENTS
F.1 Civic Knowledge Test Items
F.2 Student Background Items
F.3 Likert-type Items on Student Concepts, Attitudes, and Actions
F.4 Teacher Questionnaire (Standard Population only)
F.5 School Questionnaire

237
F.1 CIVIC KNOWLEDGE TEST ITEMSRelease Items for 14-year-old Students
2. Which of the following is an accurate statement about laws?
A. Laws forbid or require certain actions [behaviours].
B. Laws are made by the police.
C. Laws are valid only if all citizens have voted to accept them.
D. Laws prevent criticism of the government.
3. Which of the following is a political right? The right ...
A. of pupils to learn about politics in school
B. of citizens to vote and stand for [run for] election
C. of adults to have a job
D. of politicians to have a salary
5. A woman who has a young child is interviewed for a job at a travel agency.Which of the following is an example of discrimination [injustice]? Shedoes not get the job because ...
A. she has no previous experience.
B. she is a mother.
C. she speaks only one language.
D. she demands a high salary.
7. In a democratic country [society] having many organisations for people tojoin is important because this provides ...
A. a group to defend members who are arrested.
B. many sources of taxes for the government.
C. opportunities to express different points of view.
D. a way for the government to tell people about new laws.
11. In democratic countries what is the function of having more than onepolitical party?
A. To represent different opinions [interests] in the nationallegislature [e.g. Parliament, Congress]
B. To limit political corruption
C. To prevent political demonstrations
D. To encourage economic competition
12. In a democratic political system, which of the following ought to governthe country?
A. Moral or religious leaders
B. A small group of well-educated people
C. Popularly elected representatives
D. Experts on government and political affairs
APPENDIX F: THE CIVED INSTRUMENTS

238 IEA CIVIC EDUCATION STUDY TECHNICAL REPORT
16. What is the major purpose of the United Nations?
A. Safeguarding trade between countries
B. Maintaining peace and security among countries
C. Deciding where countries’ boundaries should be
D. Keeping criminals from escaping to other countries
17. Which of the following is most likely to cause a government to be callednon-democratic?
A. People are prevented from criticising [not allowed to criticise]the government.
B. The political parties criticise each other often.
C. People must pay very high taxes.
D. Every citizen has the right to a job.
18. Which of the following is most likely to happen if a large publisher buysmany of the [smaller] newspapers in a country?
A. Government censorship of the news is more likely.
B. There will be less diversity of opinions presented.
C. The price of the country’s newspapers will be lowered.
D. The amount of advertising in the newspapers will be reduced.
The next three questions are based on the following imaginary politicalleaflet [political advertisement].
We citizens have had enough!A vote for the Silver Party means a vote for higher taxes.
It means an end to economic growth and a waste of our nation’s resources.Vote instead for economic growth and free enterprise.
Vote for more money left in everyone’s wallet!Let’s not waste another 4 years! VOTE FOR THE GOLD PARTY.
23. This is an election leaflet [political advertisement] which has probably beenissued by ...
A. the Silver Party.
B. a party or group in opposition to [running against] the SilverParty.
C. a group which tries to be sure elections are fair.
D. the Silver Party and the Gold Party together.

239
24. The authors of the leaflet think that higher taxes are ...
A. a good thing.
B. necessary in a [free] market economy.
C. necessary for economic growth.
D. a bad thing.
25. The party or group that has issued this leaflet is likely also to be in favourof ...
A. reducing state [government] control of the economy.
B. lowering of the voting age.
C. capital punishment.
D. more frequent elections.
26. Two people work at the same job but one is paid less than the other. Theprinciple of equality would be violated if the person is paid less becauseof ...
A. fewer educational qualifications.
B. less work experience.
C. working for fewer hours.
D. gender [sex].
The next question differs from those earlier in the test. The followingquestion contains three statements of fact and one statement of opinion.Read each question, and then choose the opinion.
31. Three of these statements are facts and one is an opinion. Which of thefollowing is an OPINION?
A. Actions by individual countries are the best way to solveenvironmental problems.
B. Many countries contribute to the pollution of the environment.
C. Some countries offer to co-operate in order to diminish acid rain.
D. Water pollution often comes from several different sources.
APPENDIX F: THE CIVED INSTRUMENTS

240 IEA CIVIC EDUCATION STUDY TECHNICAL REPORT
36. What is the message or main point of this cartoon? History textbooks ...
A. are sometimes changed to avoid mentioning problematic eventsfrom the past.
B. for children must be shorter than books written for adults.
C. are full of information that is not interesting.
D. should be written using a computer and not a pencil.
The next question differs from those earlier in the test. The followingquestion contains three statements of opinion and one statement of fact.Read each question, and then choose the fact.
38. Three of these statements are opinions and one is a fact. Which of thefollowing is a FACT [the factual statement]?
A. People with very low incomes should not pay any taxes.
B. In many countries rich people pay higher taxes than poorpeople.
C. It is fair that some citizens pay higher taxes than others.
D. Donations to charity are the best way to reduce differencesbetween rich and poor.
History
Eraser

241
Additional Release Items for Upper Secondary Students
The next question is based on the following part of an article from animaginary newspaper.
OPEC TO REDUCE OIL PRODUCTION
The Organisation of Petroleum Exporting Countries met in Vienna lastweek. Leaders of the oil producing countries agreed to reduce the amountof oil each of them pump. At a press conference today, the organisation’sspokesman said that this will help to keep the world’s economy in balance.
34. Why would the OPEC countries decide to reduce their oil production?
A. To help economic growth in the world
B. To keep oil prices from falling
C. To save oil for future generations
D. To promote the development of new energy sources
35. If there were a high protective tariff [tax] in Brazil on cars made in Japan,who would most directly benefit?
A. car-makers in Japan
B. people in Brazil who buy cars made in Japan
C. car-makers in Brazil
D. the government in Japan
APPENDIX F: THE CIVED INSTRUMENTS

242 IEA CIVIC EDUCATION STUDY TECHNICAL REPORT
F.2 STUDENT BACKGROUND QUESTIONNAIRE1. On what date were you born?
Write in the month, day and year.
____ month ____ day ____ year
2. Are you a girl or a boy?
Tick one box only.
girl 1
boy 2
3. Which best describes you?
Tick one box only.
COUNTRY LIST
[A] ................................................................................. 1
[B] ................................................................................. 2
[C] ................................................................................. 3
[D] ................................................................................. 4
[E] .................................................................................. 5
4. Were you born in [country of test]?
No ..................... 1
Yes ..................... 2
5. If you were not born in [country of test], how old were you when youcame to [country of test]?
Write in your age at the time.
I was ..................... years old when I came to [name of the country].
6. How often do you speak [language of test] at home?
Tick one box only.
Never 1
Sometimes 2
Always or almost always 3
7. Does any of these people live at home with you most or all of the time?
no yes1 2
Mother or stepmother or female guardian
Father or stepfather or male guardian

243
8. Altogether, how many people live in your home?
Write in the total number of people.
....................................................... (Don’t forget to include yourself.)
9. Do you get a daily newspaper at home?
No ..................... 1
Yes ..................... 2
10. About how many books are there in your home?
Do not count newspapers, magazines or books for school; tick one box only.
None 1
1 - 10 2
11 - 50 3
51 - 100 4
101 - 200 5
More than 200 6
11. How many years of further education do you expect to complete after thisyear?
Please include vocational education and/or higher education. Tick one box only.
0 years 1
1 or 2 years 2
3 or 4 years 3
5 or 6 years 4
7 or 8 years 5
9 or 10 years 6
More than 10 years 7
12. How far in school did your mother and father go?
Tick only one box in each column.
Mother Father
Did not finish elementary school 1 1
Finished elementary school 2 2
Finished some high school 3 3
Finished high school 4 4
Some vocational/technical education 5 5after high school
Some community college, college, 6 6or university courses
Completed a bachelor’s degree at a 7 7college or university
I don’t know 0 0
APPENDIX F: THE CIVED INSTRUMENTS

244 IEA CIVIC EDUCATION STUDY TECHNICAL REPORT
13. Have you participated in the following organisations?
Tick the appropriate box in each row.
no yes
1 2
a) A student council/student government[class or school parliament]
b) A youth organisation affiliated with a politicalparty or union
c) A group which prepares a school newspaper
d) An environmental organisation
e) A U. N. or UNESCO Club
f ) A student exchange or school partnership program
g) A human rights organisation
h) A group conducting [voluntary] activities to
help the community
i) A charity collecting money for a social cause
j) Boy or Girl Scouts [Guides]
k) A cultural association [organisation] based on ethnicity
l) A computer club
m) An art, music or drama organisation
n) A sports organisation or team
o) An organisation sponsored by a religious group
14. Think about all the organisations listed above. How often do you attendmeetings or activities for any or all of these organisations?
Almost every day (4 or more days a week) 1
Several days (1 to 3 days a week) 2
A few times each month 3
Never or almost never 4
In the next few questions think about the days on which you attendschool.
15. How often do you spend time [directly] after school talking [hanging out]with your friends?
Almost every day (4 or more days a week) 1
Several days (1 to 3 days a week) 2
A few times each month 3
Never or almost never 4

245
16. How often do you spend time during the evening [after dinner or after—] outside your home with your friends?
Almost every day (4 or more days a week) 1
Several days (1 to 3 days a week) 2
A few times each month 3
Never or almost never 4
17. How much time do you spend watching television or videos on schooldays?
no time 1
less than 1 hour 2
1 to 2 hours 3
3 to 5 hours 4
more than 5 hours 5
APPENDIX F: THE CIVED INSTRUMENTS

246 IEA CIVIC EDUCATION STUDY TECHNICAL REPORT
F.3 LIKERT-TYPE ITEMS ON STUDENT CONCEPTS,ATTITUDES, AND ACTION
Scaled items
Items not in scales
Section A: Democracy
You are going to read a list of things that might happen in a country that is ademocracy. Each one of them could either be good and have positive resultsfor democracy or it could be bad and have negative results for democracy.
There are no right answers and no wrong answers to these questions,because we just want to know what you think about democracy and the thingsthat might influence it.
Please tick the box in the column which best fits your opinion. If you think that thestatement does not apply, put a tick in the circle in the last column.
What is good and what is bad for democracy?
very bad for somewhat bad somewhat good very good don’t know/democracy for democracy for democracy for democracy doesn’t apply
1 2 3 4 0
A1 When everyone has the rightto express their opinions freelythat is
A2 When differences in income andwealth between the rich and thepoor are small, that is
A3 When political leaders in powergive jobs in the government[public sector] to members oftheir family, that is
A4 When newspapers are free of allgovernment [state, political]control, that is
A5 When private businesses haveno restrictions from government,that is
A6 When one company owns allthe newspapers, that is
A7 When people demand theirpolitical and social rights, that is
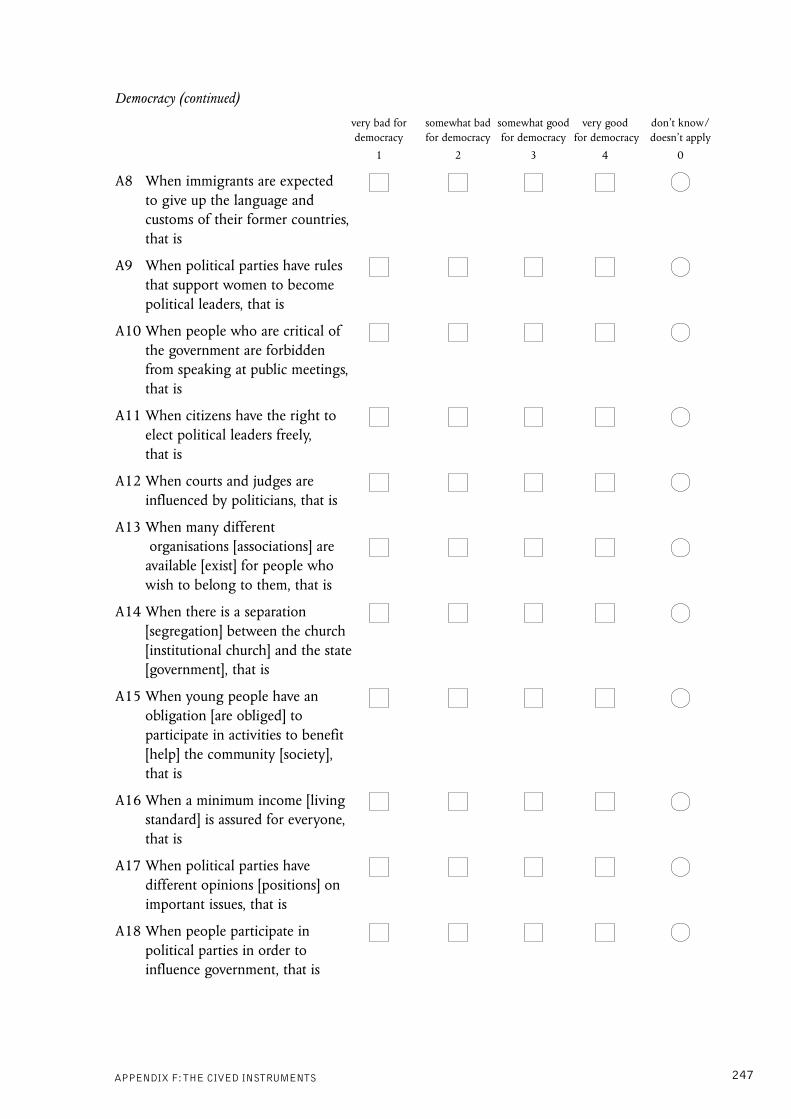
247
Democracy (continued)
very bad for somewhat bad somewhat good very good don’t know/democracy for democracy for democracy for democracy doesn’t apply
1 2 3 4 0
A8 When immigrants are expectedto give up the language andcustoms of their former countries,that is
A9 When political parties have rulesthat support women to becomepolitical leaders, that is
A10 When people who are critical ofthe government are forbiddenfrom speaking at public meetings,that is
A11 When citizens have the right toelect political leaders freely,that is
A12 When courts and judges areinfluenced by politicians, that is
A13 When many different organisations [associations] areavailable [exist] for people whowish to belong to them, that is
A14 When there is a separation[segregation] between the church[institutional church] and the state[government], that is
A15 When young people have anobligation [are obliged] toparticipate in activities to benefit[help] the community [society],that is
A16 When a minimum income [livingstandard] is assured for everyone,that is
A17 When political parties havedifferent opinions [positions] onimportant issues, that is
A18 When people participate inpolitical parties in order toinfluence government, that is
APPENDIX F: THE CIVED INSTRUMENTS

248 IEA CIVIC EDUCATION STUDY TECHNICAL REPORT
Democracy (continued)
very bad for somewhat bad somewhat good very good don’t know/democracy for democracy for democracy for democracy doesn’t apply
1 2 3 4 0
A19 When laws that women claimare unfair to them are changed,that is
A20 When all the television stationspresent the same opinion aboutpolitics, that is
A21 When people refuse to obey alaw which violates human rights,that is
A22 When newspapers are forbiddento publish stories that mightoffend ethnic groups [immigrantgroups, racial groups, nationalgroups], that is
A23 When wealthy business peoplehave more influence ongovernment than others, that is
A24 When government leaders aretrusted without question, that is
A25 When people peacefully protestagainst a law they believe to beunjust, that is
Section B: Good Citizens
In this section there are some statements that could be used to explain what a good adult citizen isor what a good adult citizen does. There are no right and wrong answers to these questions.
For each of these statements, tick one box to show how important you believe each is forexplaining what a good adult citizen is or does.
An adult who is a good citizen ...
not somewhat somewhat very don’t know/important unimportant important important doesn’t apply
1 2 3 4 0
B1 obeys the law
B2 votes in every electiona
B3 joins a political partya
B4 works hard

249
Good citizens (continued)not somewhat somewhat very don’t know/
important unimportant important important doesn’t apply
1 2 3 4 0
B5 would participate in a peacefulprotest against a law believed tobe unjustb
B6 knows about the country’shistorya
B7 would be willing to serve in themilitary to defend the country
B8 follows political issues in thenewspaper, on the radio or on TVa
B9 participates in activities to benefitpeople in the community [society] b
B10 shows respect for governmentrepresentatives [leaders, officials] a
B11 takes part in activities promotinghuman rightsb
B12 engages in political discussionsa
B13 takes part in activities to protectthe environmentb
B14 is patriotic and loyal [devoted] tothe country
B15 would be willing to ignore[disregard] a law that violatedhuman rights
a Scaled Item: Importance of Conventional Citizenship.b Scaled Item: Importance of Social-movement-related Citizenship.
APPENDIX F: THE CIVED INSTRUMENTS

250 IEA CIVIC EDUCATION STUDY TECHNICAL REPORT
Section C: Government
Below you will find some statements about the responsibilities of thegovernment [state].
What responsibilities should the government have?
Read each of these statements and tick the appropriate box to decide whether what isdescribed should or should not be the government’s [state’s] responsibility.
definitely probably probably definitely don’t knowshould not be should not be should be the should be the
the government’s the government’s government’s government’s responsibility responsibility responsibility responsibility
1 2 3 4 0
C1 To guarantee a job for everyonewho wants oned
C2 To keep prices under controld
C3 To provide basic health carefor everyonec
C4 To provide an adequate[decent] standard of living forold peoplec
C5 To provide industries with thesupport they need to growd
C6 To provide an adequate[decent] standard of living forthe unemployedd
C7 To reduce differences inincome and wealth amongpeopled
C8 To provide free basic educationfor allc
C9 To ensure [be sure there are]equal political opportunitiesfor men and womenc
C10 To control pollution of theenvironmentc
C11 To guarantee peace and order[stability] within the countryc
C12 To promote honesty and moralbehaviour among people in the countryc
c Scaled Item: Concept of Society-related Government Responsibilities.d Scaled Item: Concept of Economy-related Government Responsibilities.

251
SECTION D: TRUST IN INSTITUTIONSIn this section we will name several institutions in this country [name ofcountry]:
How much of the time can you trust each of the following institutions?
Consider each of these institutions and select the box in the column which shows how youfeel you can trust them.
never only some most of always don’t knowof the time the time
1 2 3 4 0
D1 The national [federal] government[in ______(the national seat ofgovernment)]e
D2 The local council or governmentof your town or citye
D3 Courtse
D4 The policee
D5 News on television
D6 News on the radio
D7 News in the press [newspapers]
D8 Political partiese
D9 United Nations
D10 Schools [educational institutions]
D11National Parliament [Congress]e
D12 The people who live in thiscountry [name of country]
e Scaled Item: Trust in Government-related Institutions.
APPENDIX F: THE CIVED INSTRUMENTS

252 IEA CIVIC EDUCATION STUDY TECHNICAL REPORT
strongly disagree agree strongly don’t knowdisagree agree
1 2 3 4 0
E1 To help protect jobs in thiscountry [name of country] weshould buy products made in thiscountry [name of country]
E2 We should keep [prevent] othercountries from trying to influencepolitical decisions in this country[name of country]
E3 The flag of this country [name ofcountry] is important to mef
E4 We should always be alert andstop threats from other countriesto this country [name ofcountry]’s political independence
E5 This country [name of country]deserves respect from othercountries for what we haveaccomplished
E6 There is little to be proud of inthis country [name of country]’shistory
E7 I have great love for this country[name of country]f
E8 People should support theircountry even if they think theircountry is doing somethingwrong
Section E: Our Country
In this section you will find some statements about this country [name ofcountry].
Please read each statement and select the box in the column which correspondsto the way you feel about the statement.
In the next sections you will find statements on different topics.
You may agree with some of the statements and disagree with others. Sometimes you willfeel that you disagree or agree strongly, and sometimes you will feel less strongly.
There are no right and wrong answers to these questions, we just want to know youropinion.

253
Our country (continued)strongly disagree agree strongly don’t knowdisagree agree
1 2 3 4 0
E9 This country [name of country]should be proud of what it hasachievedf
E10 The national anthem of thiscountry [name of country] isimportant to me
E11 I would prefer to livepermanently in another countryf
E12 We should stop outsiders frominfluencing this country [name ofcountry]’s traditions and culture
f Scaled Item: Positive Attitudes toward One’s Nation.
APPENDIX F: THE CIVED INSTRUMENTS

254 IEA CIVIC EDUCATION STUDY TECHNICAL REPORT
Section F: Opportunities 1
In this section there are some statements about the chances which members ofcertain groups REALLY DO HAVE in this country [name of country].
Please read each statement and select the box in the column which corresponds to the wayyou feel about the statement.
strongly disagree agree strongly don’t knowdisagree agree
1 2 3 4 0
F1 Children who are members ofcertain ethnic groups [immigrantgroups, national groups, racialgroups] have fewer chances thanother children to get a [good]secondary [high school] education in this country
F2 Girls have fewer chances thanboys to get a [good] secondary[high school] education in thiscountry
F3 Children from poor families havefewer chances than others to geta [good] secondary [high school]education in this country
F4 Children who live in rural[farming] areas have fewerchances than others to get a[good] secondary [high school]education in this country
F5 Adults who are members ofcertain ethnic groups [immigrantgroups, national groups, racialgroups] have fewer chances thanothers to get good jobs in thiscountry
F6 Women have fewer chances thanmen to get good jobs in thiscountry

255
Section G: Opportunities 2
In this section there are some statements about the opportunities whichmembers of certain groups SHOULD HAVE in this country [name of thecountry].
Please read each statement and select the box in the column which corresponds to the wayyou feel about the statement.
strongly disagree agree strongly don’t knowdisagree agree
1 2 3 4 0
G1 Women should run for publicoffice [a seat in the legislature]and take part in the governmentjust as men doh
G2 All ethnic [racial or national]groups should have equal chancesto get a good education in thiscountry
G3 Members of anti-democraticgroups [groups that are againstdemocracy] should be prohibitedfrom hosting a television showtalking about these [their] ideas
G4 Women should have the samerights as men in every wayh
G5 All ethnic [racial or national]groups should have equal chancesto get good jobs in this country
G6 Women should stay out of politicsh
G7 Members of anti-democraticgroups [groups that are againstdemocracy] should be prohibitedfrom organising peaceful [non-violent] demonstrations or rallies
G8 Schools should teach students torespect members of all ethnic[racial or national] groups
G9 When jobs are scarce, men[should] have more right to ajob than womenh
G10 Members of anti-democraticgroups [groups that are againstdemocracy] should be prohibitedfrom running in an election forpolitical office
APPENDIX F: THE CIVED INSTRUMENTS

256 IEA CIVIC EDUCATION STUDY TECHNICAL REPORT
Opportunities 2 (continued)
strongly disagree agree strongly don’t knowdisagree agree
1 2 3 4 0
G11 Men and women should getequal pay when they are in thesame jobs [occupations]h
G12 Members of all ethnic [racial ornational] groups should beencouraged to run in electionsfor political office
G13 Men are better qualified to bepolitical leaders than womenh
G14 Members of anti-democraticgroups [groups that are againstdemocracy] should be prohibitedfrom making public speechesabout these [their] ideas
h Scaled Item: Positive Attitudes toward Women’s Political and Economic Rights.

257
Section H: Immigrants
Listed below you will read several statements about immigrants andimmigration in this country [name of country].
Please read each statement and select the box in the column which correspondsto the way you feel about the statement.
strongly disagree agree strongly don’t knowdisagree agree
1 2 3 4 0
H1 Immigrants should have theopportunity [option] to keep[continue speaking] their ownlanguageg
H2 Immigrants’ children shouldhave the same opportunities foreducation that other children inthe country haveg
H3 Immigrants who live in a countryfor several years should have theopportunity to vote in electionsg
H4 Immigrants should have theopportunity [option] to keep[continue] their own customsand lifestyleg
H5 Immigrants should have all thesame rights that everyone else ina country hasg
H6 Immigrants should be forbiddento engage in political activity
H7 Having many immigrants makesit difficult for a country to beunited and patriotic
H8 All countries should acceptrefugees who are trying to escapefrom wars or political persecutionin other countries
g Scaled Item: Trust in Government-related Institutions.
APPENDIX F: THE CIVED INSTRUMENTS

258 IEA CIVIC EDUCATION STUDY TECHNICAL REPORT
Section I: The Political System
In this section there are some statements about the political system and yourpersonal view on politics in general.
Please read each statement and select the box in the column which correspondsto the way you feel about the statement.
strongly disagree agree strongly don’t knowdisagree agree
1 2 3 4 0
I1 The government [people ingovernment] cares [care] a lotabout what all of us think aboutnew laws
I2 I know more about politics thanmost people my age
I3 The government [people ingovernment] is [are] doing itsbest to find out what people[ordinary people] want
I4 The powerful leaders ingovernment [Government] carevery little about the opinions ofpeople [ordinary people]
I5 When political issues orproblems are being discussed,I usually have something to say
I6 In this country a few individualshave a lot of political powerwhile the rest of the people havevery little power
I7 The politicians quickly forgetthe needs of the voters whoelected them.
I8 I am able to understand mostpolitical issues easily
I9 When people get together[organise] to demand change,the leaders in government listen
I10 I am interested in politics

259
Section J: School
Listed below you will find some statements on students’ partipation in schoollife.
Please read each statement and select the box in the column which corresponds to the wayyou feel about the statement.
strongly disagree agree strongly don’t knowdisagree agree
1 2 3 4 0
J1 Electing student representativesto suggest changes in how theschool is run [how to solveschool problems] makes schoolsbetterj
J2 Lots of positive changes happenin this school when studentswork togetherj
J3 Organising groups of studentsto state their opinions couldhelp solve problems in thisschoolj
J4 If members of my class felt theywere unfairly treated, I would bewilling to go with them to speakto the teacher
J5 Students acting together[in groups] can have moreinfluence on what happens inthis school than students actingalone [by themselves] j
J6 I am interested in participatingin discussions about schoolproblems
J7 When school problems are beingdiscussed I usually havesomething to say
j Scaled Item: Confidence in Participation at School.
APPENDIX F: THE CIVED INSTRUMENTS
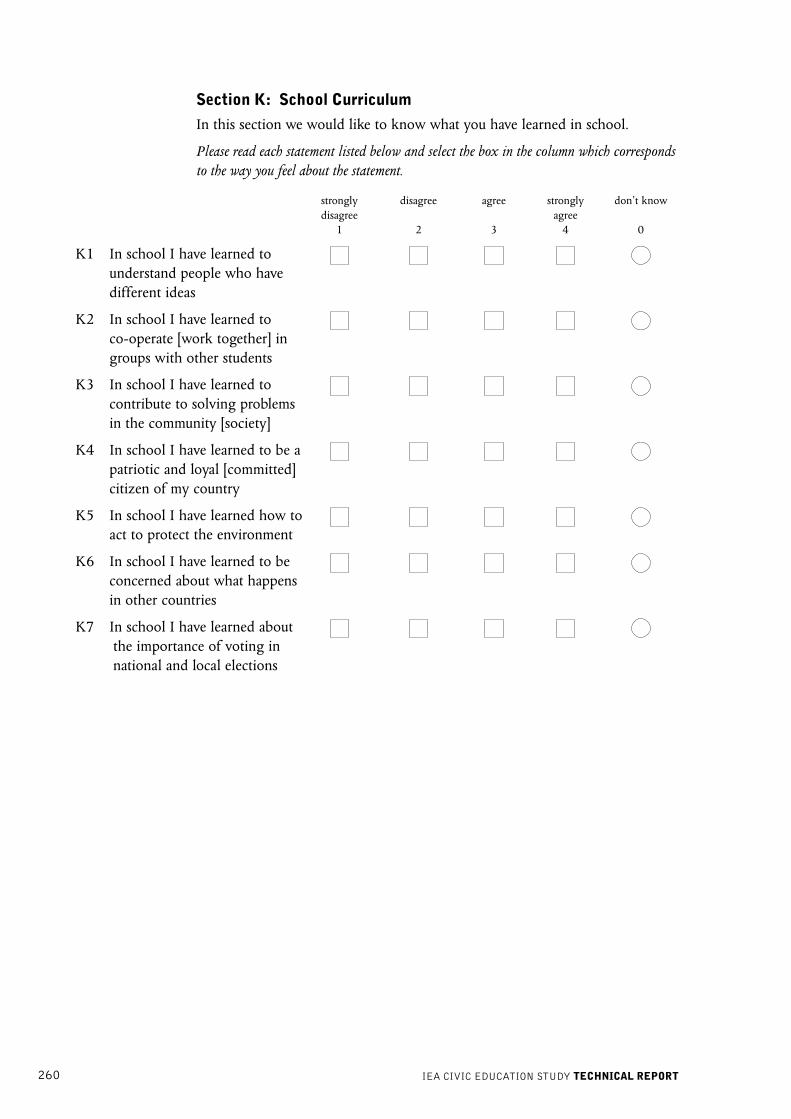
260 IEA CIVIC EDUCATION STUDY TECHNICAL REPORT
Section K: School Curriculum
In this section we would like to know what you have learned in school.
Please read each statement listed below and select the box in the column which correspondsto the way you feel about the statement.
strongly disagree agree strongly don’t knowdisagree agree
1 2 3 4 0
K1 In school I have learned tounderstand people who havedifferent ideas
K2 In school I have learned toco-operate [work together] ingroups with other students
K3 In school I have learned tocontribute to solving problemsin the community [society]
K4 In school I have learned to be apatriotic and loyal [committed]citizen of my country
K5 In school I have learned how toact to protect the environment
K6 In school I have learned to beconcerned about what happensin other countries
K7 In school I have learned aboutthe importance of voting innational and local elections

261
Section L: Political Action 1
In this set of questions you will find some activities related to politics.
For each of these activities, tick the box to show how often you do it.
How often do you have discussions of what is happening in your national [yourcountry’s] politics [government]?
never rarely sometimes often don’t know1 2 3 4 0
L1 With people of your own age[peers]
L2 With parents or other adultfamily members
L3 With teachers
How often do you have discussions of what is happening in internationalpolitics?
never rarely sometimes often don’t know1 2 3 4 0
L4 With people of your own age[peers]
L5 With parents or other adultfamily members
L6 With teachers
How often do you ...
never rarely sometimes often don’t know1 2 3 4 0
L7 read articles (stories) in thenewspaper about what ishappening in this country?
L8 read articles (stories) in thenewspaper about what ishappening in other countries?
L9 listen to news broadcasts ontelevision?
L10 listen to news broadcasts on theradio?
APPENDIX F: THE CIVED INSTRUMENTS
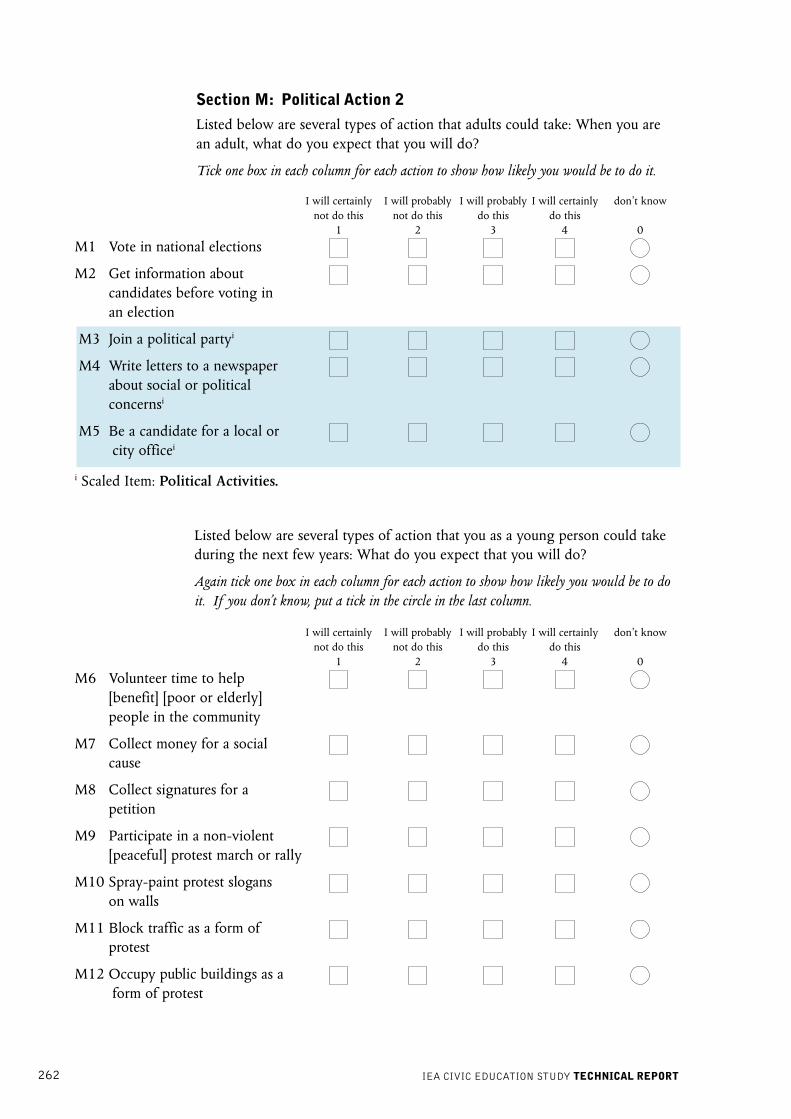
262 IEA CIVIC EDUCATION STUDY TECHNICAL REPORT
Section M: Political Action 2
Listed below are several types of action that adults could take: When you arean adult, what do you expect that you will do?
Tick one box in each column for each action to show how likely you would be to do it.
I will certainly I will probably I will probably I will certainly don’t knownot do this not do this do this do this
1 2 3 4 0
M1 Vote in national elections
M2 Get information aboutcandidates before voting inan election
M3 Join a political partyi
M4 Write letters to a newspaperabout social or politicalconcernsi
M5 Be a candidate for a local orcity officei
i Scaled Item: Political Activities.
Listed below are several types of action that you as a young person could takeduring the next few years: What do you expect that you will do?
Again tick one box in each column for each action to show how likely you would be to doit. If you don’t know, put a tick in the circle in the last column.
I will certainly I will probably I will probably I will certainly don’t knownot do this not do this do this do this
1 2 3 4 0
M6 Volunteer time to help[benefit] [poor or elderly]people in the community
M7 Collect money for a socialcause
M8 Collect signatures for apetition
M9 Participate in a non-violent[peaceful] protest march or rally
M10 Spray-paint protest sloganson walls
M11 Block traffic as a form ofprotest
M12 Occupy public buildings as aform of protest

263
Section N: Classrooms
The next part of the questionnaire includes some statements about things thathappen in your school. When answering these questions think especially aboutclasses in history, civic education or social studies [other civic-related subjects].
Please read each statement and select the box in the column which corresponds to the wayyou feel about the statement.
never rarely sometimes often don’t know1 2 3 4 0
N1 Students feel free to disagreeopenly with their teachers aboutpolitical and social issues duringclassk
N2 Students are encouraged to makeup their own minds about issuesk
N3 Teachers respect our opinionsand encourage us to express themduring classk
N4 Teachers place great importance[stress, emphasis] on learningfacts or dates when presentinghistory or political events
N5 Students feel free to expressopinions in class even when theiropinions are different from mostof the other studentsk
N6 Teachers require students tomemorise dates or definitions
N7 Teachers encourage us to discusspolitical or social issues aboutwhich people have differentopinionsk
N8 Teachers present several sides of[positions on] an issue whenexplaining it in classk
N9 Students bring up currentpolitical events for discussion inclass
N10 Memorising dates and facts is thebest way to get a good grade[mark] from teachers in theseclasses
APPENDIX F: THE CIVED INSTRUMENTS

264 IEA CIVIC EDUCATION STUDY TECHNICAL REPORT
N11 Teachers lecture and the studentstake notes
N12 Students work on material fromthe textbook
k Scaled Item: Open Classroom Climate for Discussion.

265
Section O: Effectiveness of Political Action (Older Population only)
There are many opinions on how one can effectively influence decisions insociety. Here is a list of a few ways that are used. How effective do you thinkthey are.
For each of these activities, tick one box to show how effective you think it is.
not at little somewhat very don’t knowall effective effective effective effective
1 2 3 4 0
O1 Working in political parties
O2 Working in local action groups
O3 Working in trade unions
O4 Voting in elections
O5 Personally contactinginfluential people
O6 Participating in publicdemonstrations
O7 Working to get attention bythe press, radio and TV
O8 Participating in illegal protest activities
APPENDIX F: THE CIVED INSTRUMENTS

266 IEA CIVIC EDUCATION STUDY TECHNICAL REPORT
Section P:Use of Military Force (Older Population only)
In your opinion, how justified is the use of military force by one countryagainst another for each of the following reasons.
For each of these reasons, tick one box to show how justified you think the use of militaryforce is.
definitely unjustified justified definitely don’t knowunjustified justified
1 2 3 4 0
P1 To enforce compliance withUN resolutions
P2 To defend itself when attacked
P3 To act against terroristorganisations
P4 To stop violations of humanrights
P5 To get back [retrieve] occupiedterritories
P6 To prevent a possible futureattack
P7 To get back [retrieve] holy[sacred] places
P8 To destroy nuclear and chemicalweapons factories

267
F.4 TEACHER QUESTIONNAIRE (STANDARDPOPULATION ONLY)
Part 1: Work Experience and Education
1. What [civic-related subject(s)] do you teach this school year?
2. Do you teach in the tested class?
No 1
Yes 2
[If yes, what subject ]
3. Are you the home room/class teacher of the tested class?
No 1
Yes 2
4. For how many years, including the present year, have you been teachingaltogether?
years.
5. For how many years, including the present year, have you been teaching[civic education or a civic education-related subject]?
years.
6. What is the highest level of formal education you have completed?
[A] ................................................................................. 1
[B] ................................................................................. 2
[C] ................................................................................. 3
[D] ................................................................................. 4
[E] .................................................................................. 5
7. Do you hold a degree from an academic/teacher education institution in adiscipline related to civic education?
No 1
Yes 2
If yes, please name...
discipline/s: level of the degree/s:
1. 1.
2. 2.
3. 3.
4. 4.
5. 5.
APPENDIX F: THE CIVED INSTRUMENTS

268 IEA CIVIC EDUCATION STUDY TECHNICAL REPORT
8. Have you participated in in-service professional development activities ortraining in a discipline related to civic education?
No 1
Yes 2
If yes, what was/were the name/s of the course/s:
1.
2.
3.
4.
5.
9. How old are you?
Under 25 1
25–29 2
30–39 3
40–49 4
50–59 5
60 or more 6
10. Are you female or male?
Female 1
Male 2

269
Part 2: Views on Civic Education
With the statements in this section we would like to inquire about your views on civiceducation in the curriculum of schools.
Section A:How should civic education be taught?
Please rate the statements below on the following scale:
strongly disagree agree stronglydisagree agree
Civic education ... 1 2 3 4
A1 should be taught as a specific subject
A2 should be taught integrated into subjectsrelated to human and social sciences, likehistory, geography, languages, religion,ethics, law
A3 should be integrated into all subjects taughtat school
A4 should be an extra-curricular activity
Section B: What is worth learning in civic education?
Please rate the statements below on the following scale:
strongly disagree agree stronglydisagree agree
1 2 3 4
B1 There is broad consensus in our society as towhat is worth learning in civic education
B2 Teachers should negotiate with studentswhat is to be studied in civic education
B3 Teachers should teach according tocurriculum standards/requirements in thearea of civic education
B4 What is important in civic education cannotbe taught in school
B5 Because of conflicts and different opinions insociety there cannot be agreement on whatshould be taught in civic education
B6 Changes have been so rapid in recent yearsthat teachers often do not know what toteach in civic education
APPENDIX F: THE CIVED INSTRUMENTS

270 IEA CIVIC EDUCATION STUDY TECHNICAL REPORT
Section C:How much does civic education matter?
Please rate the statements below on the following scale:
strongly disagree agree stronglydisagree agree
1 2 3 4
C1 Teaching civic education makes a differencefor students’ political and civic development
C2 Teaching civic education at school matters agreat deal for our country
C3 Schools are irrelevant for the developmentof students’ attitudes and opinions aboutmatters of citizenship
C4 Education authorities pay little attention tocivic education
Section D: What is emphasised in civic education at yourschool?
Tick only one box for each column!
When I look at civic education in my school, I believe most emphasis...
is placed on should be placed on
knowledge about society 1 1
student independent (critical) thinking 2 2
student participation in community and political 3 3activities
development of values 4 4
Section E: What do students learn in your school?
Please rate the statements below on the following scale:
strongly disagree agree stronglydisagree agree
1 2 3 4
E1 In our school students learn to understandpeople who have different [ideas/points ofview]
E2 In our school students learn to co-operate[work together] in groups with other students
E3 In our school students learn to contribute tosolve problems in the community [society]
E4 In our school students learn to be patrioticand loyal [committed] citizens of theircountry

271
What do students learn in your school (continued)
strongly disagree agree stronglydisagree agree
1 2 3 4
E5 In our school students learn how to act toprotect the environment
E6 In our school students learn to be concernedabout what happens in other countries
E7 In our school students learn about theimportance of voting in national and localelections
Section F:What should students learn to become good citizens?
Please rate the items below on the following scale:
To become a good adult citizen students should learn to recognise theimportance of ...
strongly disagree agree stronglydisagree agree
1 2 3 4
F1 obeying the law
F2 voting on every election
F3 joining a political party
F4 working hard
F5 participating in a peaceful protest against alaw believed to be injust
F6 knowing about the country’s history
F7 being willing to serve in the military todefend the country
F8 reading about [following] political issues inthe newspaper, on the radio or on TV
F9 participating in activities to help people inthe community [society]
F10 showing respect for governmentrepresentatives [leaders, officials]
F11 taking part in activities promoting humanrights
F12 engaging in political discussion
F13 being patriotic and loyal [devoted] to thecountry
F14 ignoring [disregarding] a law that violatedhuman rights
APPENDIX F: THE CIVED INSTRUMENTS

272 IEA CIVIC EDUCATION STUDY TECHNICAL REPORT
Part 3: The Teaching of [Civic Education-related] Subjects,Activities, and Lessons
Section G:How do you plan for civic education? When you preparefor civic education-related activities, from what sources do youdraw?
Please rate the importance of each source on the following scale:
not important less important important very important
1 2 3 4
G1 Official curricula or curricular guidelinesor frameworks
G2 Official requirements (standards) in thearea of civic education
G3 Your own ideas of what is important toknow in civic education
G4 Original sources (such as constitutions,human rights declarations)
G5 [Approved] Textbooks
G6 Materials published by commercialcompanies, public institutes, or privatefoundations
G7 Self-produced materials
G8 Media (newspapers, magazines, television)

273
Sec
tion
H: W
hat
topi
cs d
o yo
u te
ach?
The
follo
win
g ta
ble
cont
ains
a li
st o
f 20
topi
cs.
Plea
se r
ate
them
by
chec
king
the
appr
opri
ate
boxe
s in
the
tabl
e ac
cord
ing
to...
(a)
How
impo
rtan
t do
y ou
thin
k(b
)H
ow c
onfid
ent (
wel
l equ
ippe
d)(c
)H
ow m
uch
oppo
rtun
ity d
oth
is to
pic
is fo
r ci
vic
educ
atio
n?do
you
fee
l to
deal
with
this
stud
ents
up
to &
inc l
udin
gto
pic?
grad
e [x
x] h
ave
to le
arn
this
topi
c?
not
of li
ttle
impo
rtan
tve
ryno
t at
Litt
leco
nfid
ent
very
not a
tlit
tleco
nsid
erab
leve
ryim
port
ant
impo
rtan
ceim
port
ant
all
conf
iden
tco
nfid
ent
all
muc
hLi
st o
f To
pics
12
34
12
34
12
34
H1
Nat
iona
l Con
stitu
tion
and
Sta t
e/po
litic
al in
stitu
tions
H2
Citi
zens
’ rig
hts
and
oblig
atio
nsH
3D
iffe
rent
con
cept
ions
of
dem
ocra
cyH
4[D
iffe
rent
/Com
para
tive]
pol
itica
l sys
tem
sH
5El
ectio
n an
d el
ecto
ral s
yste
ms
H6
The
judi
cial
sys
tem
H7
Hum
an a
nd c
ivil
righ
tsH
8Im
port
ant e
vent
s in
the
natio
n’s
hist
ory
H9
Inte
rnat
iona
l org
anis
atio
nsH
10In
tern
atio
nal p
robl
ems
and
rela
tions
H11
Mig
ratio
ns o
f pe
ople
H12
Econ
omic
issu
esH
13So
cial
Wel
fare
H14
Trad
e/La
bour
Uni
ons
H15
Equa
l opp
ortu
nitie
s fo
r w
omen
and
men
H16
Cul
tura
l dif
fere
nces
and
min
oriti
esH
17En
viro
nmen
tal i
ssue
sH
18C
ivic
vir
tues
H19
Dan
gers
of
prop
agan
da a
nd m
anip
ulat
ion
H20
Med
ia
APPENDIX F: THE CIVED INSTRUMENTS
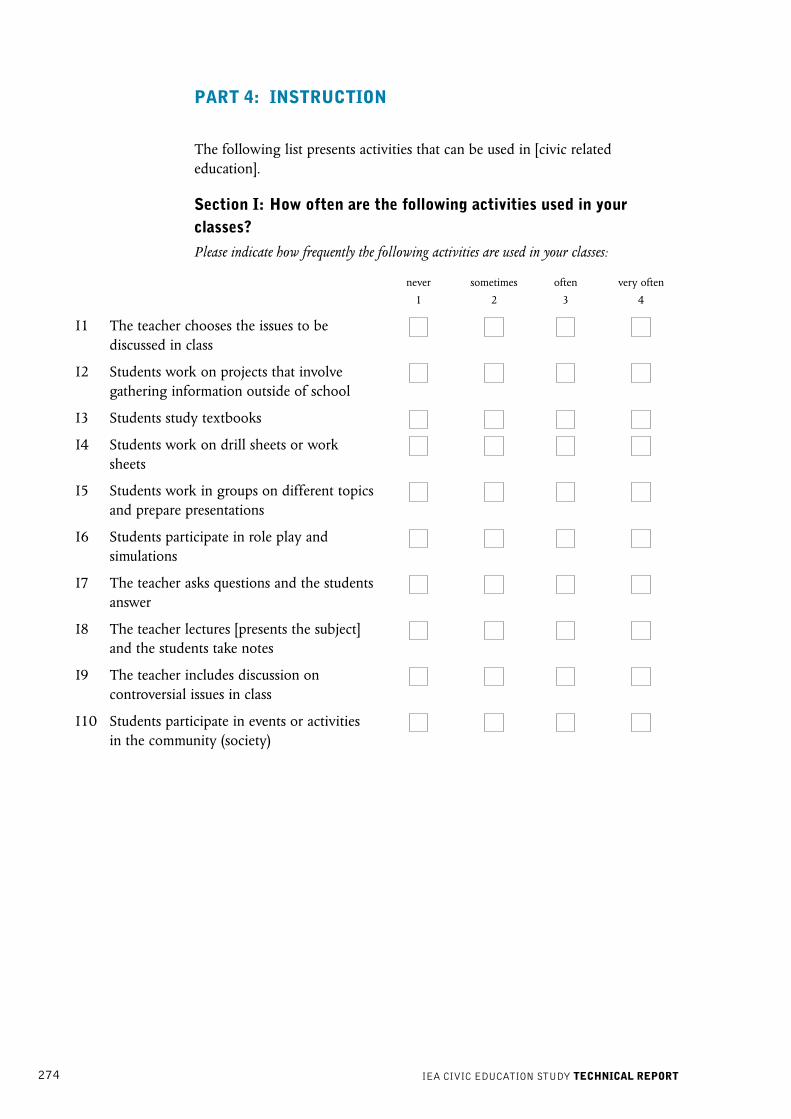
274 IEA CIVIC EDUCATION STUDY TECHNICAL REPORT
PART 4: INSTRUCTION
The following list presents activities that can be used in [civic relatededucation].
Section I: How often are the following activities used in yourclasses?
Please indicate how frequently the following activities are used in your classes:
never sometimes often very often
1 2 3 4
I1 The teacher chooses the issues to bediscussed in class
I2 Students work on projects that involvegathering information outside of school
I3 Students study textbooks
I4 Students work on drill sheets or worksheets
I5 Students work in groups on different topicsand prepare presentations
I6 Students participate in role play andsimulations
I7 The teacher asks questions and the studentsanswer
I8 The teacher lectures [presents the subject]and the students take notes
I9 The teacher includes discussion oncontroversial issues in class
I10 Students participate in events or activitiesin the community (society)

275
Section J: In your view, what needs to be improved about civiceducation in your school?
Select the three most important items listed below by checking the three appropriate boxes.
We need...
J1 more materials and textbooks
J2 better materials and textbooks
J3 additional training in teaching methods
J4 additional training in subject matter knowledge
J5 more co-operation between teachers in different subject areas
J6 more instructional time allocated to civic education
J7 more co-operation with external experts
J8 more opportunities for special projects
J9 more resources for extra-curricular activities
J10 more autonomy for school decisions
Section K: How do you assess students?
Please check appropriate box. Tick two boxes only!
When I assess students in civic-related education, I primarily rely on...
K1 written compositions or essays
K2 multiple-choice tests
K3 oral assessments
K4 oral participation
K5 other forms of assessment:please specify:
K6 no specific assessment
APPENDIX F: THE CIVED INSTRUMENTS
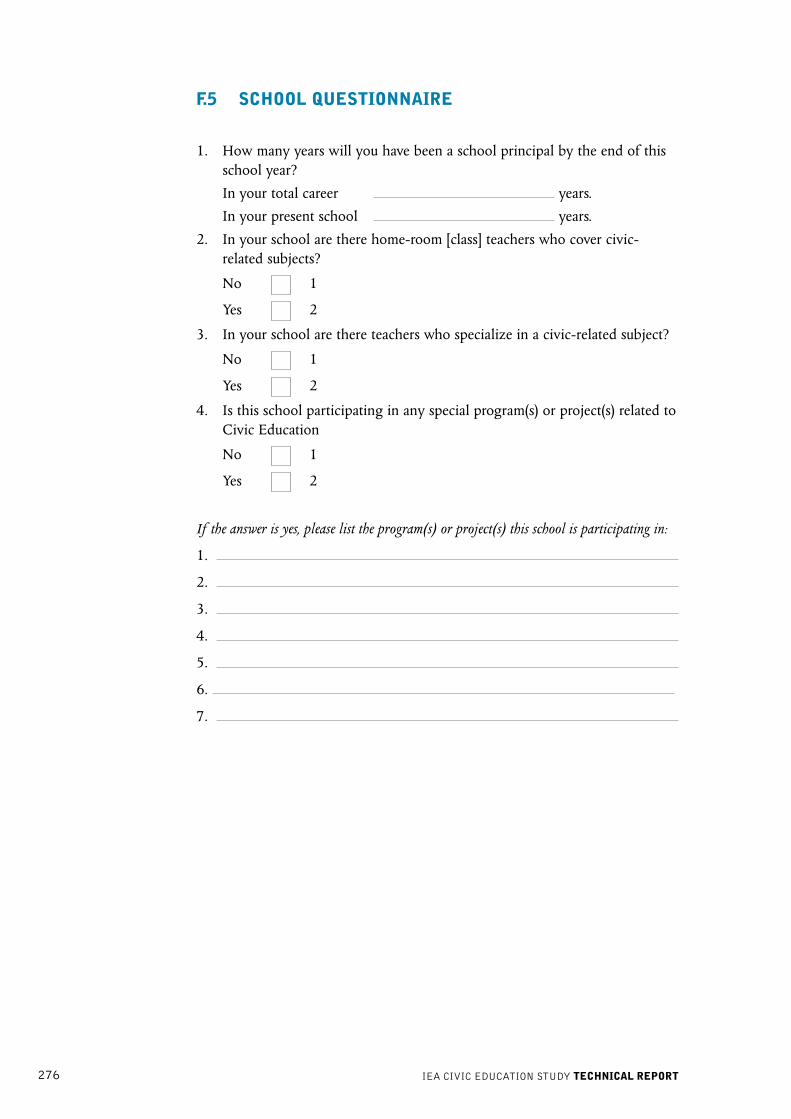
276 IEA CIVIC EDUCATION STUDY TECHNICAL REPORT
F.5 SCHOOL QUESTIONNAIRE
1. How many years will you have been a school principal by the end of thisschool year?
In your total career years.
In your present school years.
2. In your school are there home-room [class] teachers who cover civic-related subjects?
No 1
Yes 2
3. In your school are there teachers who specialize in a civic-related subject?
No 1
Yes 2
4. Is this school participating in any special program(s) or project(s) related toCivic Education
No 1
Yes 2
If the answer is yes, please list the program(s) or project(s) this school is participating in:
1.
2.
3.
4.
5.
6.
7.

277
5. Are the following organizations available for students to join in the schoolor community?
No Yes1 2
a) A student council/student government [class or school parliament]
b) A youth organisation affiliated with a political party or union
c) A group which prepares a school newspaper
d) An environmental organisation
e) A U. N. or UNESCO Club
f ) A student exchange or school partnership program
g) A human rights organisation
h) A group conducting [voluntary] activities to help the community
i) A charity collecting money for a social cause
j) Boy or Girl Scouts [Guides]
k) A cultural association [organisation] based on ethnicity
l) A computer club
m) An art, music or drama organisation
n) A sports organisation or team
o) An organisation sponsored by a religious group
6. How should civic education be taught?
Please give us your personal opinion and rate the statements below on the following scale:Civic education ...
strongly disagree agree stronglydisagree agree
1 2 3 4
a) should be taught in/as a specific subject
b) should be taught integrated into subjectsrelated to human and social sciences, likehistory, geography, languages, religion,ethics, law
c) should be integrated into all subjects taughtat school
d) should be an extra-curricular activity
APPENDIX F: THE CIVED INSTRUMENTS

278 IEA CIVIC EDUCATION STUDY TECHNICAL REPORT
7. Which of the following statements holds true for students of this school?
Please give us your personal opinion and rate the statements below on the following scale:
strongly disagree agree stronglydisagree agree
1 2 3 4
a) Students in this school learn to understand
people who have different ideas
b) Students in this school learn to co-operate[work together] in groups with other students
c) Students in this school learn to contribute tosolving problems in the community [society]
d) Students in this school learn to be a patrioticand loyal [committed] citizen of our country
e) Students in this school learn how to act toprotect the environment
f ) Students in this school learn to beconcerned about what happens in othercountries
g) Students in this school learn about theimportance of voting in national and localelections
8. In your school, how do parents become involved?
They... never sometimes often1 2 3
a) notify the school about learning problems of their children
b) make sure that their child completes his/her homework
c) raise and/or contribute funds other than tuition fees

279
9. What is your best guess about the socioeconomic [background] of studentsin your schools:
a) below average %
b) close to average %
c) above average %
10. What is the total enrollment of full-time students in your school?
Please, write in a number on each line.
a) In target grade boys girls
b) In school boys girls
c) Average size of class in target grade
d) Average size of class in school
11. Is your school ...
a state school 1
a private school 2
12. Please, indicate how frequently each of the following occurs at yourschool:
never sometimes often1 2 3
a) Vandalism
b) Drugs
c) Truancy
d) Racism
e) Religious intolerance
f ) Alcohol
g) Bullying
h) Violence
13. How are the students in your school admitted?
They are assigned 1
They have a choice 2
Other 3
please specify: __________________
APPENDIX F: THE CIVED INSTRUMENTS

280 IEA CIVIC EDUCATION STUDY TECHNICAL REPORT
14. The following questions refer to different aspects of instructional time forGrade [target grade]
Please, write in a number on each line.
How many instructional weeks are there in a school year?
Weeks
How many class periods are there in a school week?
Hours
How many instructional minutes are there in an average class period?
Minutes
15. Which of the following grade levels are found in your school? [Country-specific Grade Description]
no yes1 2
a.) Pre-kindergarten
b.) Kindergarten
c.) Grade 1
d.) Grade 2
e.) Grade 3
f.) Grade 4
g.) Grade 5
h.) Grade 6
i.) Grade 7
j.) Grade 8
k.) Grade 9
l.) Grade 10
m.) Grade 11
n.) Grade 12
o.) Grade 13
16. How many full-time (or full-time equivalent) teaching teachers are there inyour school?
Exclude non-teaching principal and administrators. If there are no male or no femaleteachers, please enter ‘0’.
male teachers.
female teachers.

281
17. How many hours (class period) per week are students required to take in...
a.) History [subject 1]Grade ___ Grade ___
[previous grade] [target grade]
less than one hour 1 1
one to two hours 2 2
three to four hours 3 3
five to six hours 4 4
b.) Social Sciences/Civic Education [subject 2]
Grade ___ Grade ___
[previous grade] [target grade]
less than one hour 1 1
one to two hours 2 2
three to four hours 3 3
five to six hours 4 4
c.) Law and Economics [International option] [subject 3]
Grade ___ Grade ___
[previous grade] [target grade]
less than one hour 1 1
one to two hours 2 2
three to four hours 3 3
five to six hours 4 4
APPENDIX F: THE CIVED INSTRUMENTS

This volume contains the technical report for the IEA Civic Education Study
conducted by the International Association for the Evaluation of
Educational Achievement (IEA). IEA, headquartered in Amsterdam, is a
consortium of educational research organizations in more than 60 countries,
with a history of conducting cross-national research in education.
During 1999, researchers surveyed nearly 90,000 14-year-old students in 28
countries. Findings for this age group were released in 2001 and reported in
Citizenship and Education in Twenty-eight Countries: Civic Knowledge and
Engagement at Age Fourteen (Torney-Purta, Lehmann, Oswald, & Schulz).
In the following year, over 50,000 upper secondary students (ranging in age
from 16 to 19 years) from 16 countries received a similar test and the same
survey of civic concepts and attitudes. Findings for the upper secondary
students were released in 2002 and reported in Civic Knowledge and
Engagement. An IEA Study of Upper Secondary Students in Sixteen
Countries (Amadeo, Torney-Purta, Lehmann, Husfeldt, & Nikolova).
This latest technical report will enable fellow researchers in the field to
evaluate published reports, monographs and articles based upon these data
and to conduct their own analyses of the international data sets available
from IEA. This volume includes detailed information on instrument
development, translation procedures, field operations, quality assurance
procedures, sampling design, data management, database construction,
weighting procedures, scaling methodology and reporting of data from the
survey.