ie 3265 r. lindeke, ph. d. quality management in pom –part i
Post on 21-Dec-2015
220 views
TRANSCRIPT

IE 3265R. Lindeke, Ph. D.
Quality Management in POM –Part I

Topics
• Managing a Quality System– Total Quality Management (TQM)
• Achieving Quality in a System– Look early and often – 6 Sigma – an approach & a technique– Make it a part of the process
• The Customers Voice in Total Quality Management – QFD and the House of Quality
• Quality Engineering– Loss Function– Quality Studies– Experimental Approaches
• T.M.; FMEA; Shainin

1. Maynard's Industrial Engineering Handbook, 5th ed., McGraw-Hill, 2001.
Total Quality Management – consider this:
• TQM as a philosophy states that Quality is a TOP Management responsibility with Customer Satisfaction as the primary target, continuous improvement as the credo, the way of action being based on FACTS and not opinions, while every employee must be involved.1
• The strategy is to concentrate on simplification and improvement of processes and organizing action around supplier-customer relations (internal as well as external). – Use of inter-disciplinary teams for improvement and
problem solving, to monitor and ACT on internal and external quality information is critical.
– Each organization should continuously benchmark themselves against their competition and train all employees in the philosophy of TQM!

Total Quality ManagementAccording to Feigenbaum:
“Total quality control is an effective system for integrating the quality development, quality-maintenance, and quality improvement efforts of the various groups in an organization so as to enable marketing, engineering, production, and service at the most economical levels which allow for full customer satisfaction.”

Deming's 14 points for Quality Achievement
1. Create consistence of purpose toward improvement of product or service, with the aim to become cometitive, stay in business and provide jobs.
2. Adopt the new philosophy. We are in a new economic age. Live no longer with defective methods and poor workmanship.
3. Cease dependence on inspection. Require statistical evidence of process control from suppliers.

Deming's 14 points for Quality Achievement
4. End the practice of rewarding business on the basis of price. Reduce the number of suppliers.
5. Improve Constantly and forever. Use statistical methods to detect the sources of problems
6. Institute modern aids for training on the job.
7. Institute leadership. Improve supervision

Deming's 14 points for Quality Achievement
8. Drive out the fear to express ideas and report problems
9. Break down barriers between departments
10. Eliminate production quotas, slogans and exhortations
11. Create work standards that account for quality

Deming's 14 points for Quality Achievement
12. Institute a training program in statistical methods
13. Institute a program for retraining people in new skills
14. Put everybody in the company to work to accomplish the transformation. The transformation is everybody's job. Emphasize the 13 proceeding points every day.

Achieving Higher Quality Levels-- focusing on the Production System
• Many times companies are tempted to spend more for higher quality
• However, Rarely can quality be bought or inspected in – it must flow from a good process where quality is made a part of everyone’s Job
• We must understand that tighter tolerances are a last resort that lead to non-linear extra costs and quality can be achieved through other means
• We must analyze our products and processes to determine what factors actually lead to producing quality in the processes and get control of them
Achieving Quality
• Inspect EARLY and often – make it part of each Operators Duties
• If possible Early means by the supplier!
• An operator is both a Customer of incoming quality as well as a supplier of down-stream quality – they have a vested interest in a better quality level
• Never rest until its perfect! – (which it can never be) since the targets keep moving.


Examining this Production Flow Chart
• A total of 81 steps are documented• Of this number, 50 include inspection
(about 62%!)• 22 of the 50 inspections are performed
during a processing operation (45%) so they add no (or little) cost to the process
• The ‘topmost’ step is incoming inspection• The last steps are inspection during
packing and analyzing Returned Items

Make Quality An Integral Part Of Manufacturing And Service
• Develop and document good habits and processes
• Design Quality assurance (inspecting for acceptability) into the system so as to put it close to the possible source of any problems
• Check Quality Early and Often • Maintain Quality Performance records
– Identify & Correct problem processes– Develop (and nurture) highly reliable
product sources and suppliers– As quality improves reduce quality
inspections!!!
Summarizing:
• Defects found early are much less costly that those found later in the product life cycle
• “Make it right the First Time”

7 Tools of Quality Improvement
• Check sheets used to gather information on problem under investigation – where and how much
• Pareto Diagram – the so called 80-20 chart used to identify the “vital few” that cause the most problems – helps to focus the improvement studies
• Histogram – shows stratification in production
• Scatter Diagram – used to identify relationships between variables

7 Tools of Quality Improvement
• Flow Charts – describes, visually, the process under study. Allows teams to focus on problem areas and structural issues
• Cause-and-effect diagrams – also called fishbone diagrams relates relationships between various factors influencing the problem under study.
• Control Chart – charts of SPC to that assess status of the problem under study.

An Aside – Quality and Process Control in Foundry
• Lets look again at last week Economics Problem
• Your Homework saw only part of the whole problem
• Those “separated” parts that didn’t justify saving the machine
• Total Quality Management suggest that we strive for continuous improvement and delight our customers by exceeding their expectations
• Lets see what fixing quality and getting smaller lots through in less time can do for us.

Machine Replacement analysis – After Tax Basis with added QuickChange Tooling
• When purchased, average “Lot Size” was 7500 molds and patterns took 45 minutes to change
• Currently, production lot size has fallen to 375 molds but with significant investment pattern change is now 5 minutes– Indicates 375/310 = 1.21 hr/pattern ‘run’ or 375 molds
every 1.21+0.083 (1.29) hours with pattern change– Real Production rate is: 290 molds/hr (580 parts/hr)!
(fixing the horrors of JIT!)

Machine Replacement analysis – After Tax Basis
• “Product Issues”– Prod Costs (labor/mat’l/etc.) = 7.00– Avg. Sale Price = 8.00– NOTE: in most JIT systems cost must drop 5 –
10% annually to customer!!!!• Annual Income Defender (Rev – Costs)
– Costs: Pr. Cost (All Castings) + Q. Costs + M. Costs = 7*(580*18*251) + 109150 + 12000 = $18,364,230
– Revenue: Price * #Good Parts = 8*(580*18*.971*251) = $20,355,578
– Income: 20,355,578 - $ 18,364,230 = $1,891,350

ATCF for this case w/ Quick Change tooling added on:
YR BTCF Deprec. Tax. Inc Taxes ATCF NPV at 12%
0 -650000 na -103750 39425 -610575 -610,575.00
1 1891492.2 156250 1735242 -659392 1232100 1,100,142.23
2 1891492.2 111250 1780242 -676492 1215000 968,598.13
3 1891492.2 111250 1780242 -676492 1215000 864,837.11
4 1891492.2 111250 1780242 -676492 1215000 772,132.60
5 1891492.2 56250 1835242 -697392 1194100 677,532.43
5 220000 220000 -83600 136400 77,393.36
PV@12% $3,850,060.87

Present Worth Comparison -- Now
• We are much closer to the Challengers NPW of $4,422,000 but still we still “make the purchase”
• Lets see the effect of fixing the Quality Issues– Now we work 20 hour/day– Quality Iceberg costs fall to $7000 to do
spot inspections and pay warranty claims
– Production Quality increases to 99.5% good!

Machine Replacement analysis – After Tax Basis with Quality Issuss ‘Fixed’
• When purchased, average “Lot Size” was 7500 molds and patterns took 45 minutes to change
• Currently, production lot size has fallen to 375 molds but without significant investment pattern change is still 45 minutes– Indicates 375/310 = 1.21 hr/pattern ‘run’ or 375 molds
every 1.21+.75 (1.96) hours with pattern change– Real Production rate is: 190 molds/hr (380 parts/hr)!
(still experiencing the horrors of JIT!)

Machine Replacement analysis – After Tax Basis
• “Product Issues”– Prod Costs (labor/mat’l/etc.) = 7.00– Avg. Sale Price = 8.00
• Annual Income Defender (Rev – Costs)– Costs: Pr. Cost (All Castings) + Q. Costs + M. Costs
= 7*(380*20*251) + 7000 + 12000 = $13,372,200
– Revenue: Price * #Good Parts = 8*(380*20*.995*251) = $15,184,500
– Income: $15,184,500 - $13,372,200 = $1,812,300

ATCF for this case w/ Quality Issues ‘Repaired’:
YR BTCF Deprec. Tax. Inc Taxes ATCF NPV at 12%
0 -650000 na -103750 39425 -610575 -610,575.00
1 1788200 156250 1631950 -620141 1168059 1,042,959.88
2 1788200 111250 1676950 -637241 1150959 917,544.51
3 1788200 111250 1676950 -637241 1150959 819,252.62
4 1788200 111250 1676950 -637241 1150959 731,434.44
5 1788200 56250 1731950 -658141 1130059 641,195.48
5 220000 220000 -83600 136400 77,393.36
PV@12% $3,619,205.29

Present Worth Comparison -- Now
• We are close to the Challenger’s NPW of $4,422,000 but still we “make the purchase”
• But, as a rational organization, why wouldn’t we consider doing both? Then:– We can work 20 productive hour/day– Quality Iceberg costs fall to $7000 doing spot
inspections and to pay (a few) warranty claims– Production Quality increases to 99.5% good!– And our hourly production rate increases to an
average of 580 castings an hour

Machine Replacement analysis – After Tax Basis with added Q.Change Tooling
• When purchased, average “Lot Size” was 7500 molds and patterns took 45 minutes to change
• Currently, production lot size has fallen to 375 molds but with significant investment pattern change is now 5 minutes– Indicates 375/310 = 1.21 hr/pattern ‘run’ or 375 molds
every 1.21+0.083 (1.29) hours with pattern change– Real Production rate is: 290 molds/hr (580 parts/hr)!
(fixing the horrors of JIT!)

Machine Replacement analysis – After Tax Basis
• “Product Issues”– Prod Costs (labor/mat’l/etc.) = 7.00– Avg. Sale Price = 8.00
• Annual Income Defender (Rev – Costs)– Costs: Pr. Cost (All Castings) + Q. Costs + M. Costs =
7*(580*20*251) + 7000 + 12000 = $20,400,200– Revenue: Price * #Good Parts = 8*(580*20*.995*251) =
$23,176,340– Income: $23,176,340 - $20,400,200 = $2,776,150

ATCF for this case w/ Fixed Quality & Q. Change Investment
YR BTCF Deprec. Tax. Inc Taxes ATCF NPV at 12%
0 -650000 na -103750 39425 -610575 -610,575.00
1 2776336.4 156250 2620086 -995632.8 1780704 1,589,990.21
2 2776336.4 111250 2665086 -1012733 1763604 1,405,944.76
3 2776336.4 111250 2665086 -1012733 1763604 1,255,333.01
4 2776336.4 111250 2665086 -1012733 1763604 1,120,770.06
5 2776336.4 56250 2720086 -1033633 1742704 988,810.00
5 220000 220000 -83600 136400 77,393.36
PV@12% $5,827,666.39

Now we have final identified the capital source to achieve our goals!• NPW of (totally) Fixed
Defender is nearly $1.4M greater than the Challenger
• Really, if I was investigating expenditures, why wouldn’t I focus on doing both?
• A RATIONAL ORGANIZATION would investigate solving all their problems before investing in expensive new technologies

This Thinking is Captured in the Juran Trilogy

Lets consider the issue of Productivity ‘Considering Quality’
• We can define a processes Yield:– Yld = I(%G) + I(1-%G)(%R)
• I = #units started• %G is %good product• %R is %of defects that can be re-worked (at added cost)
– Per Station in a System
• Example:– Yld = 500(.94) + 500(1-.94).75 = 492.5 units on average
• Note: ¾ of the initially scraped items are recovered thru rework
– Given that direct Mfg costs are $57/unit and rework is ½ of this or $28.5
– Unit cost of each product shipped is {KdI + Kr(I(1-%G)(%R))}/Yield
– Here: {57*500 + 28.5*22.5}/492.5 = $59.17/shipped unit

Product Yield in a “Multi-Stage” System (we will neglect Rework for now)
• Yld = I(%g1)(%g2)(%g3) … (%gn)• Looking at a 4 station line with the following quality
achievements: • St1: 94%• St2: 78%• St3: 92%• St4: 87%
• Starting with 500 pieces we only see:• 500*.94*.78*.92*.87 = 293 totally good pieces make it
through the system!• But if I need 500 to ship?• Start with Yld/{(%g1)(%g2)(%g3) … (%gn)} = I (solve for I)• Here I = 852 units

Product Yield in a “Multi-Stage” System (we will neglect Rework for now)
• Given that a raw materials cost $100 here. A Quality Team may ask how much they could invest in quality improvement along this line? – say to improve quality performance by ¾
• After Improvement:– St1: %g1’ = 100-.06*.25 = .985 (98.5%)– St2: %g2’ = 100-.22*.25 = .945 (94.5%)– St3: %g3’ = 100-.08*.25 = .98 (98%)– St4: %g4’ = 100-.13*.25 = .9675 (96.75%)
• Compute a new I’ value

Product Yield in a “Multi-Stage” System (we will neglect Rework for now)
• New I’ = 500/(.985*.945*.98*.9675) = 566.53• Still many defects (so we should keep trying to
improve) but this is a raw mat’l savings of 285 unit started/day compared to the starting point
• Or a savings of about $28550 each day thus• $28550*250 = $7.1M a year saved here• This is a big bunch of $’s saved that can be
invested in fixing the quality problems!• But what would happen if we were to produce at
“6-Sigma” Levels?• 6-Sigma was developed by Motorola to push the
systems to reduce defectives to 3.4 ppm (not 2%!)

• It’s a way of measuring processes; • A goal of near perfection, represented by 3.4 defects per
million opportunities (DPMO);• An approach to changing the culture of an organization.• Most accurately, though, six sigma is defined as a broad and
comprehensive system for building and sustaining manufacturing performance, success and leadership.
• In other words, six sigma is a context within which you will be able to integrate many valuable best practices and concepts, including system thinking, continuous improvement, knowledge management, mass customization and activity based management
Six Sigma Can Be Defined In Many Ways.

Why Six Sigma?
“The central idea behind Six Sigma is that if you can measure how many “defects” you have in a process, you can systematically figure out how to eliminate them and get as close to “zero defects” as possible. Six Sigma has changed the DNA of GE in everything we do and in every product we design.”
The GE Company

Examples of the Sigma Scale
In a world at 3 sigma. . .
• There are 964 U.S. flight cancellations per day.
• In MA, 5,390 newborns are dropped each year.
• In one hour, 47,283 international long distance calls are accidentally disconnected.
In a world at 6 sigma. . .
• 1 U.S. flight is cancelled every 3 weeks.
• 1 newborn is dropped every 4 years in MA.
• It would take more than 2 years to see the same number of dropped international calls.

Examples of what life would be like if 99.9% were "good enough:"
• 1 Hour Of Unsafe Drinking Water Every Month
• 2 Long Or Short Landings At Every American Airports Each Day
• 400 Letters Per Hour Which Never Arrive At Their Destination
• 500 Incorrect Surgical Operations Each Week
• 4,000 Incorrect Drug Prescriptions Per Year
• 22,000 Checks Deducted From The Wrong Bank Account Each Hour
• 32,000 Missed Heartbeats Per Person Per Year

The Significance of ±6σ – In Complex
Manufacturing
0.00%
20.00%
40.00%
60.00%
80.00%
100.00%
0 200 400 600 800 1000 1200
Opportunities for Defects (OFD's)
Pe
rce
nta
ge
of
Un
de
fec
ted
Pro
du
cts
4.96% (950436.9 NCPPM)
99.6605768% (3394.2 NCPPM) 99.99966% (3.4 NCPPM)
885
99.7% (3000 NCPPM)99.7% (3000 NCPPM)
1 component at ±3σis Equivalent to
885 components at ±6σ!
±6σ
±3σ
1

Significance in Modern Manufacturing
• Complex assemblies with large # of parts can’t be delivered defect free without very high quality levels of individual components
• Traditional 3-Sigma system (99.7% good) are really no match for 6-Sigma Systems (99.99966% good)
• But 6-Sigma needs tools – it is a methodology as well as a quality target!
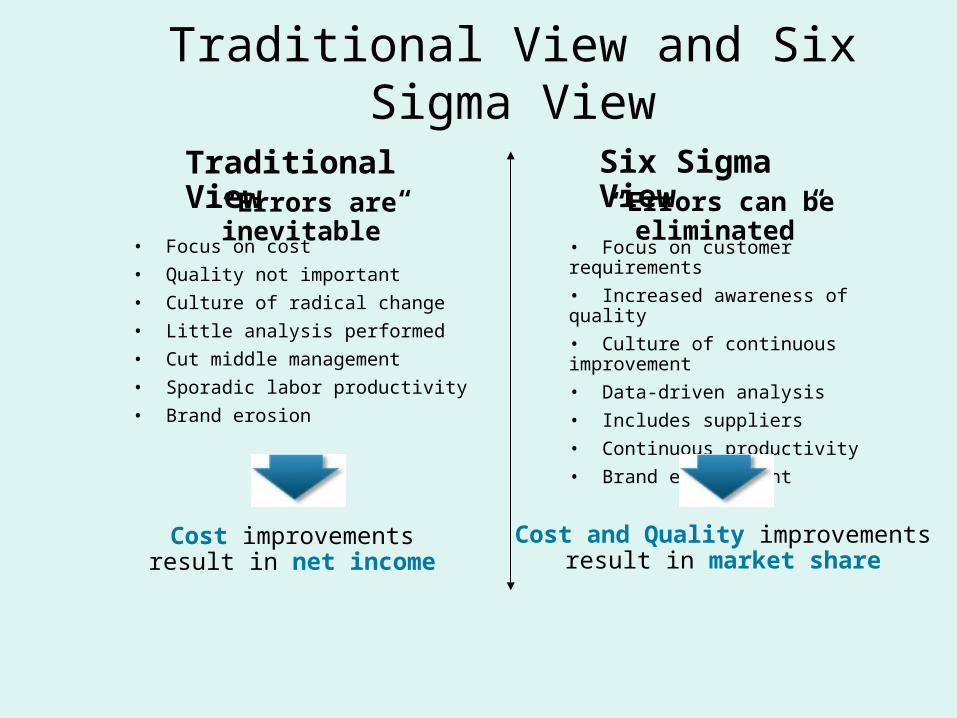
Traditional View and Six Sigma View
• Focus on customer requirements
• Increased awareness of quality
• Culture of continuous improvement
• Data-driven analysis
• Includes suppliers
• Continuous productivity
• Brand enhancement
Cost and Quality improvementsresult in market share
• Focus on cost
• Quality not important
• Culture of radical change
• Little analysis performed
• Cut middle management
• Sporadic labor productivity
• Brand erosion
Cost improvementsresult in net income
Traditional View Six Sigma View“Errors are inevitable” “Errors can be eliminated”

Recognizing Quality• Deming Prize. Established in Japan in 1951 by
quality guru W. Edwards Deming. The prestigious prize has been awarded to Japanese companies almost every year since inception in several categories.
• Malcolm Baldrige National Quality Award established by the U.S. Dept of Commerce in 1987 recognizes excellence in a) manufacturing companies b) service companies and subsidiaries, and c) small businesses.
• ISO 9000. A certification program established by the International Organization for Standards based in Switzerland. Certification can cost upwards of $1 million for large companies.

Listening to the CustomerAn important part of TQM is determining what the
customer wants. This is done via
• Focus groups• Customer interviews• Customer surveys
Downsides: customers are not in a position to think of new possibilities, or customers desires are technically impossible to achieve. Also, surveys can lead to bias depending on the manner in which questions are worded.

• The House of Quality is used to match up customers desires with capabilities during product and process design
• The Matrix allows a company to examine
– Whats vs Hows (relationship matrix)
– Whats vs Whys (Customer competitive assessment)
– Hows vs Hows (Correlation Matrix)
– How Much vs Hows (Engineering Competitive Assessment)
QFD and the Customer’s voice: Using the House of Quality
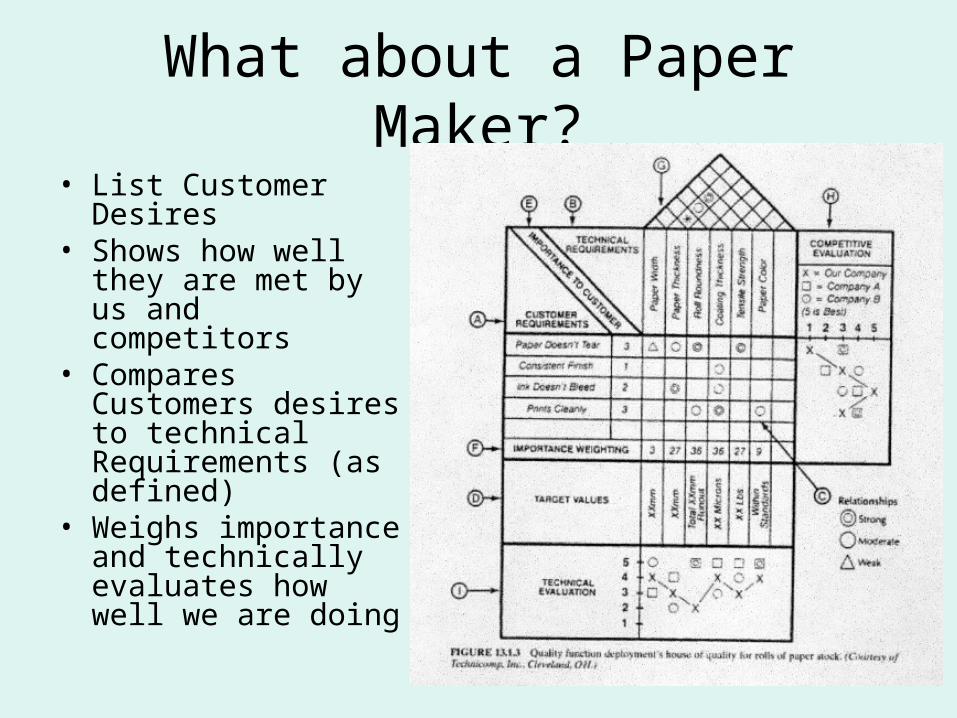
What about a Paper Maker?
• List Customer Desires
• Shows how well they are met by us and competitors
• Compares Customers desires to technical Requirements (as defined)
• Weighs importance and technically evaluates how well we are doing

Breaking down the House of Quality• See Slide

Following from the customer to the Product
• To employ the approach, companies start by assessing needs of the customer
• Then they feed the ideas forward to:– Product Design– Process Design– Production Design
• From Marketing all the way to the worker on the floor

Organizing for Quality
• The quality function should not be relegated to a single department, but should permeate the entire organization
• The quality function must have an ongoing contact with customers.
• Must transcend functional organizational boundaries
• Must be overseen from a high level of the firm.