identifying factors that influence … factors that influence enrollment in technology education...
TRANSCRIPT

IDENTIFYING FACTORS THAT INFLUENCE ENROLLMENT
IN TECHNOLOGY EDUCATION COURSES AT REEDSBURG HIGH SCHOOL
by
Mark Gronley
A Research Paper
Submitted in Partial Fulfillment of the
Requirements for the Master of Science Degree
With a Major in
Industrial and Technology Education
Approved: 2 Semester Credits
Investigation Advisor
The Graduate School University of Wisconsin-Stout
May, 2004

i
ABSTRACT Gronley Mark R (Writer) (Last Name) (First Name) (Middle Initial) IDENTIFYING FACTORS THAT INFLUENCE ENROLLMENT IN (Title) TECHNOLOGY EDUCATION COURSES AT REEDSBURG HIGH SCHOOL Industrial and Technology Education Dr. Ted Bensen May 2004 52 (Graduate Major) (Research Advisor) (Month/Year) (No. of Page American Psychological Association (APA) Publication Manual (Name of Style Manual Used in this Study)
The number of students enrolled in the Technology Education program at Reedsburg
High School has been declining. The purpose of this study was to determine the factors that
influence students’ decisions to enroll in Technology Education courses. These factors were
identified by administering a questionnaire to the tenth grade class at Reedsburg High School
during the 2002-2003 school year.
The population of this study consisted of half of the tenth grade students enrolled at
Reedsburg High School during the fourth quarter of the 2002-2003 school year. At the tenth
grade level, the students had tentatively mapped out their high school academic plan. So at this
juncture in their high school career, they had already made some choices about what electives
they would be taking in the years to come. The tenth grade students were also chosen because
they may still be able to benefit from the outcomes of this study.
The questionnaire consisted of two parts. The first part dealt with questions to find out
demographic information such as the gender of the student, family information, and the post hi
s)
gh

ii
school plans of the students. The remaining questions were designed to gather information as to
why students were not enrolling in technology education courses. Students were given between
two and five choices for each question to select when filling out this portion of the questionnaire.
The second part of the questionnaire consisted of two questions addressing the source and level
of influence they experience when enrolling in high school courses. The first question sought to
find out who influenced students to enroll in the courses that they take. The second question
posed a series of statements about negative influence on course enrollment (or choice) to which
the students responded. A three point Likert type scale was used for these two questions.
The results of the study suggest that there is no real significant data that shows there are
people influencing students not to enroll in Technology Education courses. The data also
indicated that Technology Education course offerings had a very positive image among students.
Worth noting, though, is the fact that guidance counselors and teachers have very little influence
at all on the courses that students choose to take throughout high school. The course curriculum
is a factor in why males are more interested in taking courses than the females. Another factor in
why students were not enrolling in Technology Education courses was graduation requirements.
Of the males and females that responded that they would like to take a class but didn’t, the main
reason was because of graduation requirements.
iii
Acknowledgements
I’d like to thank my research advisor Dr. Ted Bensen for all of his help while working on
my thesis. I’d like to express my appreciation and gratitude to Dr. Ted Benson for helping me
finish this paper and the time and effort that he gave to making this happen. I’d also like to
thank the students who responded to the survey and the teachers that allowed me to administer
the surveys in their classrooms.
I’d like to thank my parents for their encouragement and advice throughout the writing of
this paper. I’d also like to thank my wife for her help and never-ending support and love.

iv
Table of Contents
ABSTRACT...............................................................................................................i.
LIST OF TABLES.....................................................................................................vi.
INTRODUCTION .....................................................................................................1
Statement of the Problem...............................................................................4
Research Question .........................................................................................4
REVIEW OF LITERATURE ....................................................................................5
Reasons for Declining Enrollment in Technology Education .......................5
Factors that influence Enrollment..................................................................7
Intrapersonal ..................................................................................................8
Immediate External........................................................................................8
Remote External.............................................................................................10
METHODOLOGY ....................................................................................................11
Introduction....................................................................................................11
Subjects ..........................................................................................................11
Instrument ......................................................................................................11
Procedure .......................................................................................................12
ANALYSIS OF DATA..............................................................................................14
SUMMARY AND RECOMMENDATIONS............................................................44
Conclusions....................................................................................................44
Recommendations..........................................................................................46
REFERENCES ..........................................................................................................48
v
APPENDIX A............................................................................................................50
Set-up Letter...................................................................................................50
APPENDIX B ............................................................................................................51
Student Questionnaire....................................................................................51

vi
Tables
Table 1. Enrollment Data from 2000 to 2003 .......................................................................6
Table 2. Parent/Guardian level of education.........................................................................15
Table 3. Post-high school plans ............................................................................................16
Table 4. Individuals helping students decide on plans for after high school.........................16
Table 5. Attitude toward the Technology Education program ..............................................17
Table 6. Do any Technology Education courses sound interesting and fun? ........................17
Table 7. Have you ever wanted to take a Technology class but could not fit it into your
schedule?................................................................................................................................18
Table 8. What was the reason for not being able to fit the class into your schedule? ..........18
Table 9. Has anyone ever told you not to take a course?
If you answered yes to question 11, who was that person? ..................................................19
Table 10. How much influence does “Yourself” have on course selection? ........................20
Table 11. How much influence do “Parents/Family” have on course selection? .................21
Table 12. How much influence do “Friends” have on course selection? .............................22
Table 13. How much influence do “Guidance Counselors” have on course
selection?................................................................................................................................23
Table 14. How much influence do “Teachers” have on course selection?...........................24
Table 15. How much influence do “Others” have on course selection?...............................25
Table 16. Dislike of the image of the students in Technology education.............................27
Table 17. Class seems like a lot of work. .............................................................................28
Table 18. Lack of mechanical ability or skills. .....................................................................29

vii
Table 19. Poor experiences in middle school courses. .........................................................30
Table 20. Course content not interesting. .............................................................................31
Table 21. Subject(s) that I like are not offered .....................................................................32
Table 22. Less time for electives because of graduation requirements ................................33
Table 23. Cannot fit into my four-year plan for elective courses .........................................34
Table 24. Course content is not relevant to my future career plans......................................35
Table 25. Lack of information on course offerings ..............................................................36
Table 26. Dislike the instructor who teaches the courses .....................................................37
Table 27. Friends enrolled in the class..................................................................................38
Table 28. Parents discouraged taking the course ..................................................................39
Table 29. Guidance counselor advised not taking the course...............................................40
Table 30. Friends are not taking the course ..........................................................................41
Table 31. Feeling the course is not for college bound students ............................................42
Table 32. Other .....................................................................................................................43

1
CHAPTER I
Introduction
In today's world, technology is changing at an extremely rapid rate. This rapid pace has
made the acquisition of technical knowledge even more important. To keep pace with the
technological changes, students in high school should be taking courses (Hill, 1999). It would be
reasonable to assume that, given the increasing importance of technology in our society,
enrollment in Technology Education courses should be on the rise. In actuality, the opposite is
happening in many schools. According to (Gray 1990), the enrollment of students in
Technology Education courses is on the decline. He states that many students are opting to take
required college preparatory courses rather than elective courses like Technology Education
courses in order to be well prepared for college.
The Technology Education department in Reedsburg has been one of those schools. In
fact, in the last three years their numbers have declined steadily, which has raised concern.
During the 2000-2001 school year, 578 students out of a total school enrollment of 844 took
Technology Education courses. If this is compared to the 2002-2003 school year, where the
number of students taking Technology Education courses shrunk to 491 out of 888, one can see
that this concern is warranted. This represents a thirteen percent drop over the last three years. A
table with this information can be found on the following page. The factors that are causing this
decline are not clear at this time.

2
School Year
Total High School
Students
Students Enrolled in Technology Education Courses
Percent of Students Body
Enrolled in Technology Education Courses
Percent Change in
Enrollment from Previous
Year
2000-2001 844 578 68 % 2001-2002 876 550 63 % - 5 %
2002-2003 888 491 55 % - 8 % Table 1. Enrollment Data from 2000 to 2003
From having conversations with other technology educators, teachers, students, and
reading numerous articles the consensus is that some of the factors that may be causing declining
enrollment in courses in the high school may be:
1. Graduation requirements in Wisconsin have become more stringent. In order for
schools to meet the state standards, students may be required to take more core subject area
classes. High school teachers are feeling the stress of making sure that all the standards are met
before the students graduate. The high school curriculum has been changed to meet these
standards and it has negatively impacted Technology Education. Technology Education
classrooms do not have specific standards to meet and are left out of this push. This results in
students only being able to take a minimal number of elective courses.
2. Students may be looking ahead to classes that they may have to take for college
entrance requirements. Over the past few years colleges have raised the requirements needed to
gain entry into their schools. For example, most colleges and universities require three semesters
of a foreign language.
3. The curriculum of the Technology Education program may not be changing along
with the changing needs of technology and society. This may mean that the classes are not

3
meeting the needs and interests of today's students. "Programs that are outdated in terms of
curriculum and facilities also will have trouble attracting students" (Hill, 1999, p. 22).
Declining enrollment can have many negative effects on a program. One such effect is a
withdrawal of support. Some indicators of this problem may surface in the form of direct or
indirect warnings from immediate superiors, administrators, or peers (Hill, 1999). Disgruntled
students can also withhold their support and respect for the program. This lack of support and
respect often shows itself in the terms of budget cuts. Funding cuts can prove to be very
detrimental to a program causing teachers to be laid off and even some programs to be cut
entirely. Declining enrollment can lead to any one of these problems. More often than not, each
one tends to occur at the same time as the result of each other.
The goal of this study was to find out which of these factors, or others, are directly
contributing to the declining enrollment in the Technology Education program at Reedsburg
High School. It may not be a single reason, but a combination of many factors, which has led to
the loss of students.
There are definite signs that high school Technology Education is in trouble. One of the
most obvious signs is the decreasing number of students who are participating in these courses.
This decline is occurring in many cities and towns across the nation (Hill, 1999). In the town of
Reedsburg, Wisconsin this has become a major concern. The following chart shows this decline
as it has occurred over the last three years. Although this decline does not seem drastic from
year to year, if the decline is analyzed over the three year span one can see that the enrollment
dropped thirteen percent. This also translates into eighty-seven fewer students enrolling in
Technology Education courses. If this trend continues the program is in serious jeopardy of
having classes dropped and the possible elimination of a department member. In the present year

4
four classes were dropped from the semester schedule due to lack of student enrollment.
Therefore, the causes of declining enrollment must be identified and examined.
Statement of the Problem
The number of students enrolled in the Technology Education program at Reedsburg
High School has been declining. The purpose of this study was to determine the factors that
influence students’ decisions to enroll in Technology Education courses. These factors were
identified by administering a questionnaire to the tenth grade class at Reedsburg High School
during the 2002-2003 school year. The results of this study will help shape recommendations to
improve the enrollment and also improve the Technology Education Program.
Research Questions
This study sought to answer the following questions:
1. Who influences students not to enroll in a Technology Education course?
2. What level of influence do the people listed in the questionnaire have in the
student’s course selection?
3. What influences students not to enroll in a Technology Education course?
4. How do the influences that students face in their course selection differ between
genders?

5
CHAPTER II
Review of Literature
Reasons for Declining Enrollment in Technology Education
There is much speculation as to why the enrollment in electives is declining in many
areas of the country. One explanation is that many states have raised the graduation
requirements for high school students. These increases have put extra pressure on students to
ensure that they are adequately prepared to graduate. The state of Wisconsin requires that each
high school student successfully complete a minimum of: 4.0 credits of English, 3.0 credits of
social studies, 2.0 credits of mathematics, 2.0 credits of science, 1.5 credits of physical
education, 0.5 credits of health for a total of 13.0 credits (Wisconsin Department of Public
Instruction, 2000). The state superintendent also encourages school boards to require an
additional 8.5 credits selected from any combination of vocational education, foreign languages,
fine arts and other courses.
There has been some evidence to support this belief. A study conducted by the Center
for Policy Study in Education (Olson, 1989) reported that some evidence exists that those most
affected were noncollege-bound students. They were forced to take low-quality academic
courses in place of quality vocational courses. The result is students who had no job skills and
were not prepared for the workforce.
There are, however, other studies that show conflicting evidence. Research conducted
for the National Assessment of Vocational Education (Wirt, 1989); found that since graduation
requirements increased, declines in the average numbers of vocational credits taken were small
relative to the large increases in academic credits. They concluded that indeed students did take

6
more academic courses, but not typically at the expense of vocational education. One other
study concerning declining enrollment found "no conclusive evidence that increased graduation
requirements were negatively affecting vocational education enrollments" (Strickland, Elson, &
Frantz, 1987, p. 41). Therefore increased graduation requirements alone do not appear to explain
the declining enrollment in Technology Education.
Today there seems to be an increased preference for higher education. According to Krei
and Rosenbaum (2001), 86% of high school seniors planned to get college degrees. More and
more businesses are requiring some sort of post-secondary education, especially if there is any
desire to move up within the business. They are looking for workers with higher order thinking
skills, problem solving abilities, and greater independence (Grubb, 1996). In order to increase
economic well-being, employers stress the quality of human resources to the high schools
(Goldberger, Kazix, 1996).
Another influencing factor is parents. A large majority of parents would like to see their
children go to college. Along with this, school administrators and school faculty members seem
to take a sense of pride in high numbers of college bound students (Krei, Rosenbaum). Between
1982 and 1992 the number of high school sophomores who were encouraged to go to college by
teachers or counselors went up from 32% to 66% (Gray).
With technology advancing as its current rate, the need for further education is almost a
must. Because of this increased pressure to pursue higher education students are faced with the
need to prepare themselves more thoroughly at the high school level. With college entrance
requirements being so demanding, many students are hesitant to take Technology Education
courses in place of college-required courses (Meier, 1991). According to Gray, Wang, and
Malizia (1995), all but 7 percent of students were enrolled in the common college prep courses.
7
The University of Wisconsin-Stout (2000) requires that prospective students successfully
complete 17 college preparatory credits with the following distribution:
• four credits of English
• three credits of mathematics (Algebra I and higher)
• three credits of science
• three credits of social science
• two credits from the above areas, or foreign language
• two credits from the above areas, or fine arts, computer science and other
academic or vocational areas.
Oftentimes a college preparatory schedule leaves no room for elective Technology Education
courses (Rossetti, Elliot, Price, McClay, 1989).
Another explanation for declining enrollment is a stagnant curriculum. Lack of curricular
reform has been identified as one of the main reasons for programs experiencing enrollment
decline (Lewis, 1991). Again the point of an ever-changing technological world can be brought
to the front. If the curriculum does not keep stride, then the program becomes "boring" and "not
interesting" to students, which in turn, results in declining numbers.
To ensure a dynamic program is maintained the faculty needs to be committed to
curriculum revisions (Hill, 1999). Hill also goes on to say that for this to happen the curriculum
should be reviewed on a regular basis. It is the researcher's belief that this is a critical issue in
the Reedsburg School District.
Factors that Influence Enrollment
The decision to enroll in Technology Education courses is made by students with
influence from many factors. The barriers as classified by Lam (1982) fall into three main
categories, which include Intrapersonal, Immediate external, and Remote external.

8
Intrapersonal
Intrapersonal reasons include attitudes, images, perceptions, motivation, and value
systems. An individual will reject an activity that has had a negative image or words associated
with that activity (Social Learning and Career Decision Making, 1979). Many people believe
that Technology Education courses are for non-college bound students. This leads to the general
view that Technology Education programs are a dumping ground for the less able students. This
negative attitude towards Technology Education causes difficulty in recruitment and selection of
students (O'Neill, 1985).
In a study where students were to report their own image of Technology Education they
rated it either positive or very positive (Dube, 1987). These results would tend to refute other
research on the negative attitudes of vocational education courses. However, when asked to
comment on their friend's attitude toward vocational education courses, 51% of the students
stated that their friends had a negative image of vocational education courses. Dube believes that
it is this negative image that contributes to students not enrolling in vocational education courses.
People will choose a career or occupation which will maximize their gains and minimize
their losses. Some of these gains and losses may include money, prestige, power, and other
internal motivational factors (Herr, 1970). However, there is a belief that Technology Education
prepares students for jobs that fall short in most of these categories.
Immediate External
The Immediate external category can be broken down further into school factors and
influences of others. School factors include graduation requirements, college entrance
requirements, and curriculum. Forty-three percent of non-vocational students said they had
considered taking a vocational course of study (Jacobs, 1975). The main reasons why students
9
chose not to enroll in a vocational education course were graduation requirements and college
entrance requirements. Eighteen percent of the 43% that had considered enrolling in a
vocational education course said they were discouraged from enrolling because of classes they
needed for graduation. When the graduation requirements are raised more of the students’ day
has to be spent in academic/core courses. This leads to a decrease in the time allowed for
vocational courses.
Another school factor that has an influence on a student's course decision is the
curriculum. Jacobs found that a lack of a desired curriculum discouraged 7% of potential
students from enrolling in vocational education. Students often base their course selection on
what course will be interesting or fun.
Influences of others would include friends, parents, counselors, school personnel, and
teachers. An individual is less likely to express a preference and more likely to express a
rejection for an activity or field of study that has had consistently negatively expressed opinions
from a valued person (Social Learning and Career Decision Making, 1979).
Friends can be a very big influence on high school students. Herr (1987) found that
students will seek the advice of a friend before entering into a vocational education. The
problem is when the majority of the advice is negative. Dube (1987) found that eighty-nine
percent of students try to discourage their friends from entering into a vocational education
program, while only fourteen percent try to encourage their friends to enroll.
Parents can be an important role model in a child's life. They can add influence and
guidance into their child's decision making. Herr’s (1987) research found that students will seek
the advice of parents before enrolling in vocational education courses. Otto (1987) also found
that parents are the most influential factor when it concerns vocational education choice.

10
The results concerning the influence of teachers are conflicting. Dube (1987) found that
teachers do not influence student's choice to enroll in vocational education courses. Herr (1987)
on the other hand said that students will seek the advice of teachers before enrolling.
Counselors are another source of influence to students. A counselor's job is to advise
students as to the schedule that best fits their career needs. They do not see it as their duty to
persuade students toward one curriculum or another. Some reports show that many students
reported getting little advice on information about from their guidance counselors (Silverman &
Pritchard, 1996). Counselors are also lacking in training and guidelines to help today’s youth
prepare for their future in the work world. The value and expectations from the schools is that
counselors should foster a program to push students towards a college bound career (Krei,
Rosenbaum).
Remote External
Remote external reasons would include the socioeconomic status of the students, family
size, parental income, and parental educational levels. It has been shown that a higher number of
low socioeconomic status students enroll in vocational courses than in general courses
(Campbell, Elliot, Hotckins, & Laughlin, 1987). Tuma (1996) also found that graduates whose
parents had lower levels of education tended to earn more vocational credits than graduates
whose parents had higher levels of education.

11
CHAPTER III
Methodology
Introduction
This chapter describes the means by which this research was conducted. It provides a
detailed outline of the subjects of the study, the instrument that was used, and the procedure that
was followed.
Subjects
The population of this study consisted of half of the tenth grade students enrolled at
Reedsburg High School during the fourth quarter of the 2002-2003 school year. The sophomore
class enrollment was 207 during the 2002-2003 school year. Due to scheduling conflicts the total
number of these students who had an opportunity to participate in the study was 104. A total of
81 students brought back signed permission slips and participated in the study. At the tenth
grade level, the students had tentatively mapped out their high school academic plan. So at this
juncture in their high school career they had already made some choices about what electives
they would be taking in the years to come. The tenth grade students were also chosen because
they may still be able to benefit from the outcomes of this study.
Instrument
To acquire the appropriate data needed to address the proposed problem, a questionnaire
was used. The researcher developed the questionnaire (Appendix A). The questionnaire
consisted of two parts that were filled out by half of the 10th grade class. The first part consisted
of 13 questions. The first four questions specifically dealt with questions to find out demographic
information such as the gender of the student, family information, and the post high school plans

12
of the students. The remaining nine questions were designed to gather information as to why
students were not enrolling in Technology Education courses. Students were given between two
and five choices for each question to select when filling out this portion of the questionnaire.
Questions were phrased to help with student understanding and to help the researcher understand
the answers clearly. For example, question six asked students of their view of the program.
Instead of allowing the students to use their own descriptor of the program, the researcher opted
to give students two broad choices to select from. This allowed for more clear-cut answers in
order to make the results of the questionnaire easier to code and analyze. The second part of the
questionnaire consisted of two questions addressing the source and level of influence they
experience when enrolling in high school courses. The first question sought to find out who
influenced students to enroll in the courses that they take. The second question posed a series of
statements about negative influence on course enrollment (or choice) to which the students
responded. A three point Likert- type scale was used for these two questions. Students
responded by choosing no influence, some influence, or high influence.
Procedure
The questionnaire was administered on Tuesday, June 10, 2003. The week before the
questionnaire was administered; a letter (Appendix A) was put into each of the tenth grade
teacher's mailbox explaining what was to take place. On Monday, the day before the survey was
administered; a consent form was passed out to all tenth grade students in attendance that day.
They were instructed by their teacher that they were to return it the following day signed by their
parents or guardian. To eliminate students concerns related to teacher or other students
knowledge of their responses, an envelope was available to seal the completed surveys. The

13
surveys were also distributed and collected during the same class period, which helped ensure
anonymity in the responses.
14
CHAPTER IV
Analysis of Data
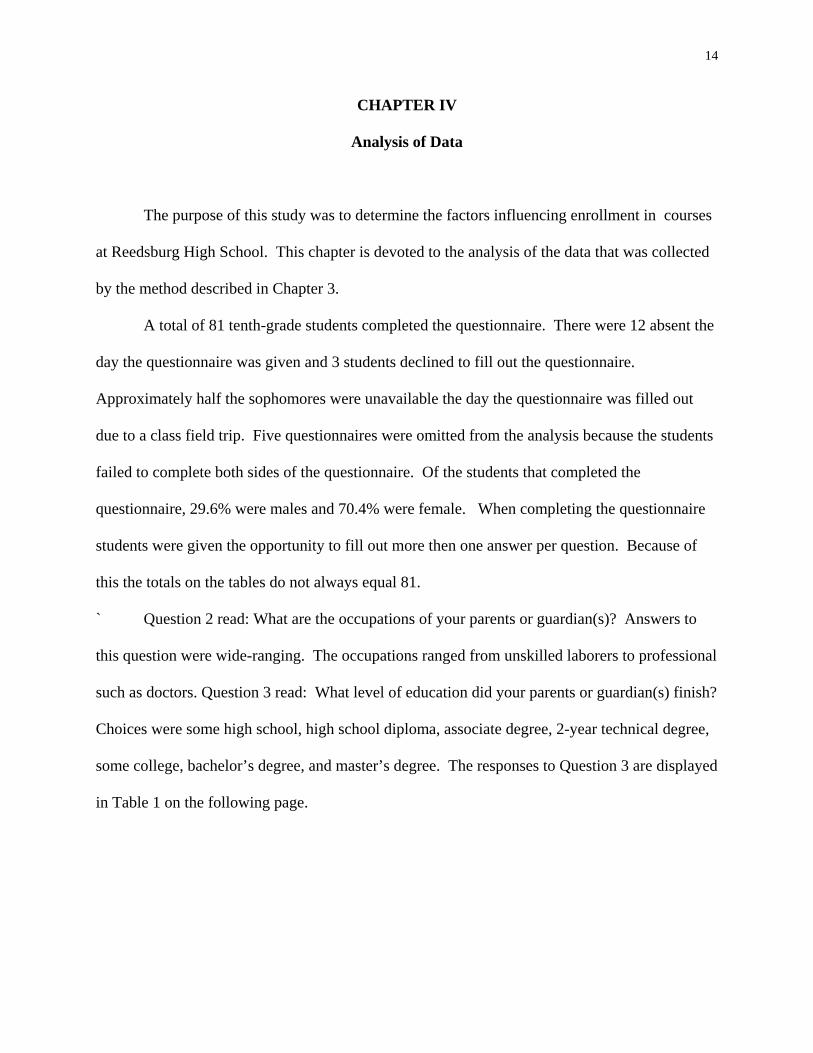
The purpose of this study was to determine the factors influencing enrollment in courses
at Reedsburg High School. This chapter is devoted to the analysis of the data that was collected
by the method described in Chapter 3.
A total of 81 tenth-grade students completed the questionnaire. There were 12 absent the
day the questionnaire was given and 3 students declined to fill out the questionnaire.
Approximately half the sophomores were unavailable the day the questionnaire was filled out
due to a class field trip. Five questionnaires were omitted from the analysis because the students
failed to complete both sides of the questionnaire. Of the students that completed the
questionnaire, 29.6% were males and 70.4% were female. When completing the questionnaire
students were given the opportunity to fill out more then one answer per question. Because of
this the totals on the tables do not always equal 81.
` Question 2 read: What are the occupations of your parents or guardian(s)? Answers to
this question were wide-ranging. The occupations ranged from unskilled laborers to professional
such as doctors. Question 3 read: What level of education did your parents or guardian(s) finish?
Choices were some high school, high school diploma, associate degree, 2-year technical degree,
some college, bachelor’s degree, and master’s degree. The responses to Question 3 are displayed
in Table 1 on the following page.

15
Level of Education of Parents Male Female Combined
Some High School 6.1% 12.5% 10.5%
High School Diploma 55.1% 30.8% 38.6%
Associate Degree 2.0% 1.9% 2.0%
2-year Technical Degree 10.2% 8.7% 9.2%
Some College 10.2% 19.2% 16.3%
Bachelor’s Degree 8.2% 16.3% 13.7%
Master’s Degree 8.2% 12.5% 9.8%
Table 2. Parent/Guardian level of education
There were seven different levels of education to choose from. The number of parents
that graduated from high school was more then twice the amount of any other choice. Almost
forty percent of parents ended their schooling at the high school level. Parents with an associate
degree totaled only two percent of the educational level.
In response to question number 4, What do you plan on doing after high school?, the
Table 2 below shows a total of 58% of the students planned on going on to a 4-year college.
When broken down by gender, the 45.8% of the male students planned to go to a four year
college and 63.2% of the females planned to go to a four year college. Also significant is that
22% of the students plan on going to a technical school. This breaks down to 37.5% of the males
planning on attending a technical school while 15.8% of the females doing the same.

16
Post High School Plans Male Female Combined
Get a Job 4.2% 3.5% 3.7%
Attend a Technical School 37.5% 15.8% 22.2%
Attend a four-year college 45.8% 63.2% 58.0%
Enter the Armed Service 12.5% 3.5% 6.2%
Undecided 0.0% 14.0% 9.9%
Other 0.0% 0.0% 0.0%
Table 3. Post-high school plans.
When choosing to answer question 5 students were allowed more then one choice when
making their decision. Question 5 stated: Who helped you decide on your plans for after high
school? Students and parents made up the highest percentage with 36.3% and 29.5%
respectively. Teachers and undecided resulted with the lowest percentages at 3.4% and 1.4%.
The results of Question 5 are shown below in Table 3.
Who helped make decisions Male Female Combined
I decided myself 45.5% 33.6% 36.3%
A teacher 6.1% 2.7% 3.4%
A Guidance Counselor 3.0% 6.2% 5.5%
Your Parents 30.3% 29.2% 29.5%
Another Relative 6.1% 5.3% 5.5%
Another Student 3.0% 4.4% 4.1%
Undecided 3.0% 0.9% 1.4%
Other 3.0% 17.7% 14.4%
Table 4. Individuals helping students decide on plans for after high school

17
Question 6 asked whether students had a positive or negative attitude towards at their
school. Question 7 addressed the attitudes of friends toward . The responses to questions six and
seven are listed in Table 4, which shows that 96.3% of the students responded that they had a
positive attitude towards the that was offered at their school. Seventy-eight out of the eighty-
one students that responded looked at the program at their school with a positive attitude.
Results are shown below in Table 4.
Number (Percentages) Male Female Combined
Individuals
Positive 23 (95.8%) 55 (96.5%) 78 (96.3%)
Negative 1 (4.2%) 2 (3.5%) 3 (3.7%)
Friends
Positive 13 (54.2%) 18 (31.6%) 31 (38.3%)
Negative 2 (8.3%) 0 (0.0%) 2 (2.5%)
I don’t know 9 (37.5%) 39 (68.4%) 48 (59.3%)
Table 5. Attitude toward the Technology Education program
Question 8 asked whether students thought any of the courses sounded interesting or fun.
Seventy-five percent of the males checked yes while 25% of the males checked no. In contrast,
33.3% of the females checked yes and 66.7% of the females checked no.
Number (Percentages) Male Female Combined
Yes 18 (75.0%) 19 (33.3%) 37 (45.7%)
No 6 (25.0%) 38 (66.7%) 44 (65.4%)
Table 6. Do any Technology Education courses sound interesting and fun?

18
When asked in Question 9 if they ever wanted to take a class but could not fit it into their
schedules 45.8% of the males said yes while only 29.8% of the females responded yes. These
responses are summarized in Table 6 below.
Number (Percentages) Male Female Combined
Yes 11 (45.8%) 17 (29.8%) 28 (34.6%)
No 13 (54.2%) 40 (70.2%) 53 (65.4%)
Table 7. Have you ever wanted to take a Technology class but could not fit it into your
schedule?
Those students who answered yes to question 9 were then asked to answer question 10
which was related to what was the reason that the students could not fit the class into their
schedule. In response, 63.6% of the males answered high school graduation requirements were
the reason, and 58.8% of the females answered high school graduation requirements were the
reason. None of the males answered that college entrance requirements were the reason, while
29.4% of the females answered that college entrance requirements were the reason.
Number (Percentages) Male Female Combined
H.S. graduation requirements 7 (63.6%) 10 (58.8%) 17 (60.7%)
College entrance requirements 0 (0.0%) 5 (29.4%) 5 (17.9%)
Other. 4 (36.4%) 2 (11.8%) 6 (21.4%)
Table 8. What was the reason for not being able to fit the class into your schedule?
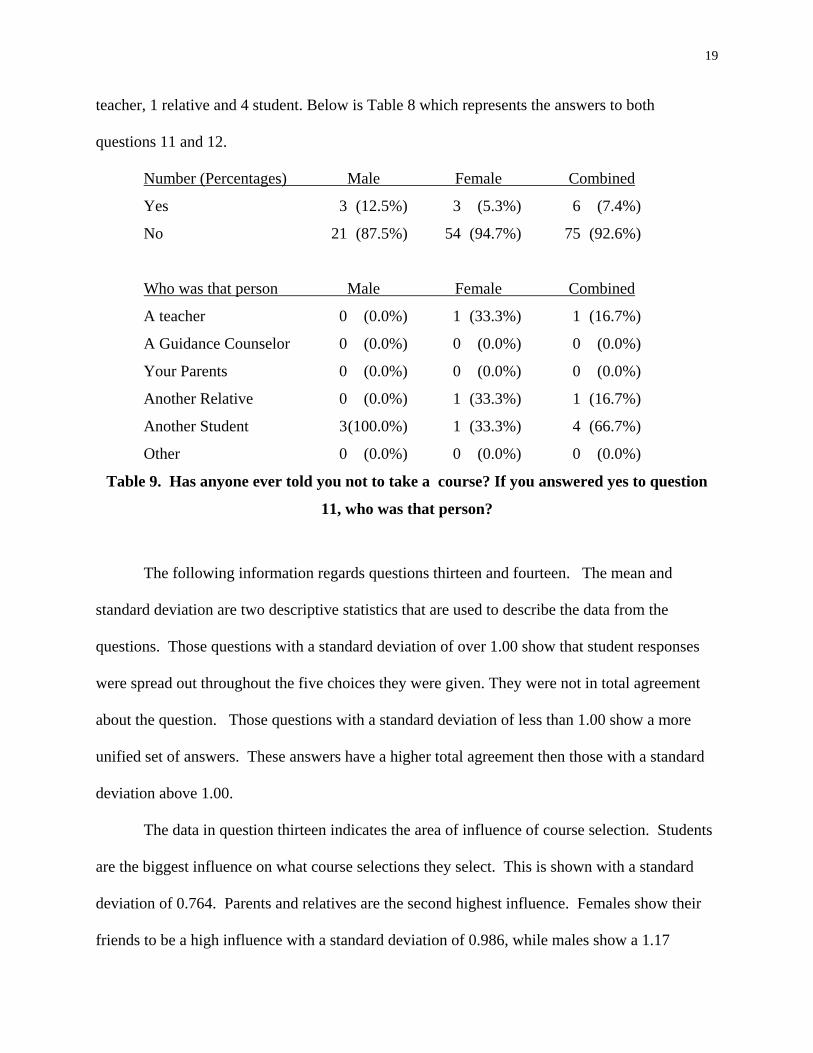
In response to Question 11: Has anyone ever told you not to take a course?, 92.6% of the
responses were no. Of those that answered yes to question 11, they were then asked in question
12 to check who had told them not to take a Technology Education course. Checked off was 1
19
teacher, 1 relative and 4 student. Below is Table 8 which represents the answers to both
questions 11 and 12.
Number (Percentages) Male Female Combined
Yes 3 (12.5%) 3 (5.3%) 6 (7.4%)
No 21 (87.5%) 54 (94.7%) 75 (92.6%)
Who was that person Male Female Combined
A teacher 0 (0.0%) 1 (33.3%) 1 (16.7%)
A Guidance Counselor 0 (0.0%) 0 (0.0%) 0 (0.0%)
Your Parents 0 (0.0%) 0 (0.0%) 0 (0.0%)
Another Relative 0 (0.0%) 1 (33.3%) 1 (16.7%)
Another Student 3 (100.0%) 1 (33.3%) 4 (66.7%)
Other 0 (0.0%) 0 (0.0%) 0 (0.0%)
Table 9. Has anyone ever told you not to take a course? If you answered yes to question
11, who was that person?
The following information regards questions thirteen and fourteen. The mean and
standard deviation are two descriptive statistics that are used to describe the data from the
questions. Those questions with a standard deviation of over 1.00 show that student responses
were spread out throughout the five choices they were given. They were not in total agreement
about the question. Those questions with a standard deviation of less than 1.00 show a more
unified set of answers. These answers have a higher total agreement then those with a standard
deviation above 1.00.
The data in question thirteen indicates the area of influence of course selection. Students
are the biggest influence on what course selections they select. This is shown with a standard
deviation of 0.764. Parents and relatives are the second highest influence. Females show their
friends to be a high influence with a standard deviation of 0.986, while males show a 1.17

20
standard deviation when it comes to influence by friends. Guidance counselors show the least
amount of influence on students when it comes to what courses they select. Teachers have some
influence on course selection while others show very little influence on course selection.
Question 13 was based on a Likert scale. Tables 10 through 14 break down the answers to
question 13.
How much influence does “Yourself” have on course selection?
Rating Scale Male Female Total
1. No Influence 0 2 2
2. Little Influence 0 0 0
3. Some Influence 2 1 3
4. Moderate Influence 4 7 11
5. High Influence 18 47 65
Mean 4.69 Standard Deviation 0.764
Response Percentages
No Influence 0.0% 3.5% 2.5%
Little Influence 0.0% 0.0% 0.0%
Some Influence 8.3% 1.8% 3.7%
Moderate Influence 16.7% 12.3% 13.6%
High Influence 75.0% 82.5% 80.2%
Table 10
How much influence do “Parents/Family” have on course selection?

21
Rating Scale Male Female Total
1. No Influence 3 1 4
2. Little Influence 3 8 11
3. Some Influence 9 14 23
4. Moderate Influence 3 23 26
5. High Influence 6 11 17
Mean 3.51 Standard Deviation 1.112
Response Percentages
No Influence 12.5% 1.8% 4.9%
Little Influence 12.5% 14.0% 13.6%
Some Influence 37.5% 24.6% 28.4%
Moderate Influence 12.5% 40.4% 32.1%
High Influence 25.0% 19.3% 21.0%
Table 11
How much influence do “Friends” have on course selection?

22
Rating Scale Male Female Total
1. No Influence 4 5 9
2. Little Influence 5 14 19
3. Some Influence 8 22 30
4. Moderate Influence 5 14 19
5. High Influence 2 2 4
Mean 2.88 Standard Deviation 1.047
Response Percentages
No Influence 16.7% 8.8% 11.1%
Little Influence 20.8% 24.6% 23.5%
Some Influence 33.3% 38.6% 37.0%
Moderate Influence 20.8% 24.6% 23.5%
High Influence 8.3% 3.5% 4.9%
Table 12
How much influence do “Guidance Counselors” have on course selection?

23
Rating Scale Male Female Total
1. No Influence 11 12 23
2. Little Influence 5 13 18
3. Some Influence 6 18 24
4. Moderate Influence 1 11 12
5. High Influence 1 3 4
Mean 2.46 Standard Deviation 1.187
Response Percentages
No Influence 45.8% 21.1% 28.4%
Little Influence 20.8% 22.8% 22.2%
Some Influence 25.0% 31.6% 29.6%
Moderate Influence 4.2% 19.3% 14.8%
High Influence 4.2% 5.3% 4.9%
Table 13

24
How much influence do “Teachers” have on course selection?
Rating Scale Male Female Total
1. No Influence 6 10 16
2. Little Influence 6 10 16
3. Some Influence 9 22 31
4. Moderate Influence 2 12 14
5. High Influence 1 3 4
Mean 2.68 Standard Deviation 1.120
Response Percentages
No Influence 25.0% 17.5% 19.8%
Little Influence 25.0% 17.5% 19.8%
Some Influence 37.5% 38.6% 38.3%
Moderate Influence 8.3% 21.1% 17.3%
High Influence 4.2% 5.3% 4.9%
Table 14

25
How much influence do “Others” have on course selection?
Rating Scale Male Female Total
1. No Influence 3 6 9
2. Little Influence 0 0 0
3. Some Influence 0 2 2
4. Moderate Influence 2 1 3
5. High Influence 1 3 4
Mean 2.61 Standard Deviation 1.704
Response Percentages
No Influence 50.0% 50.0% 50.0%
Little Influence 0.0% 0.0% 0.0%
Some Influence 0.0% 16.6% 11.1%
Moderate Influence 33.3% 8.3% 16.6%
High Influence 16.6% 25.0% 22.2%
Table 15
In question fourteen there were four main areas that showed significance. It was found
that disliking the instructor, having friends enrolled in the class, parents discouraging students to
take the course, and the guidance counselor advising students not to take the course had no
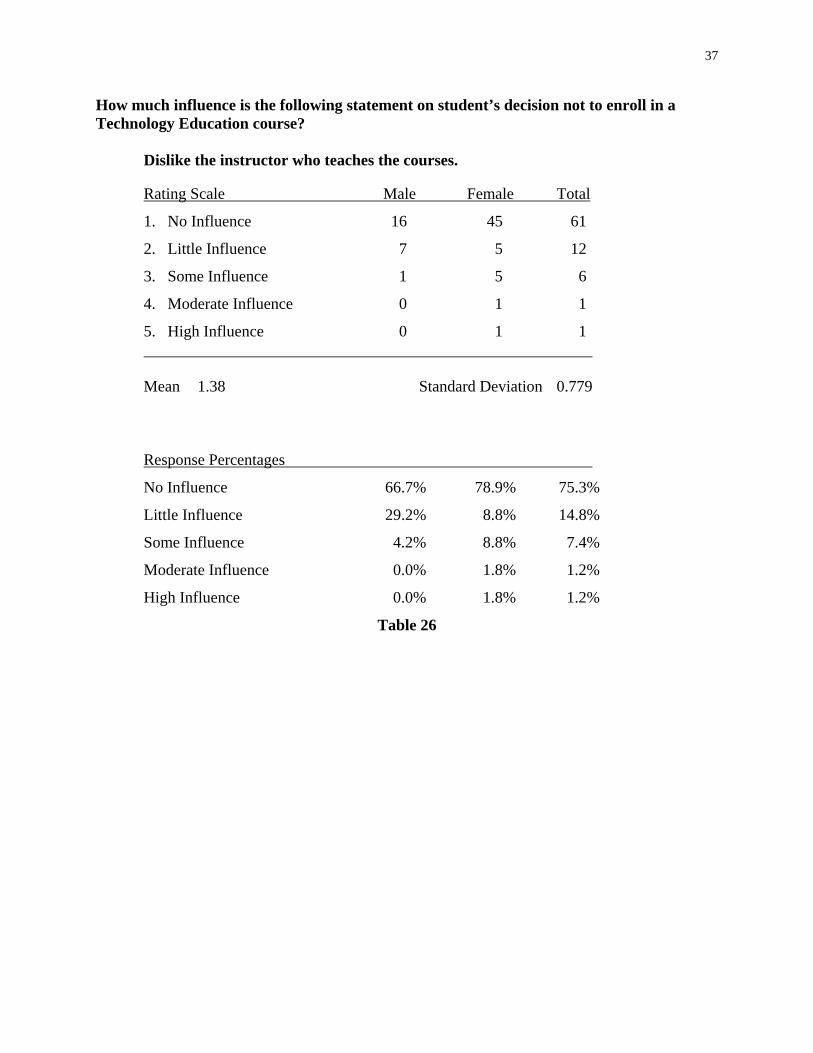
influence to little influence on the students decision not to enroll in a course.
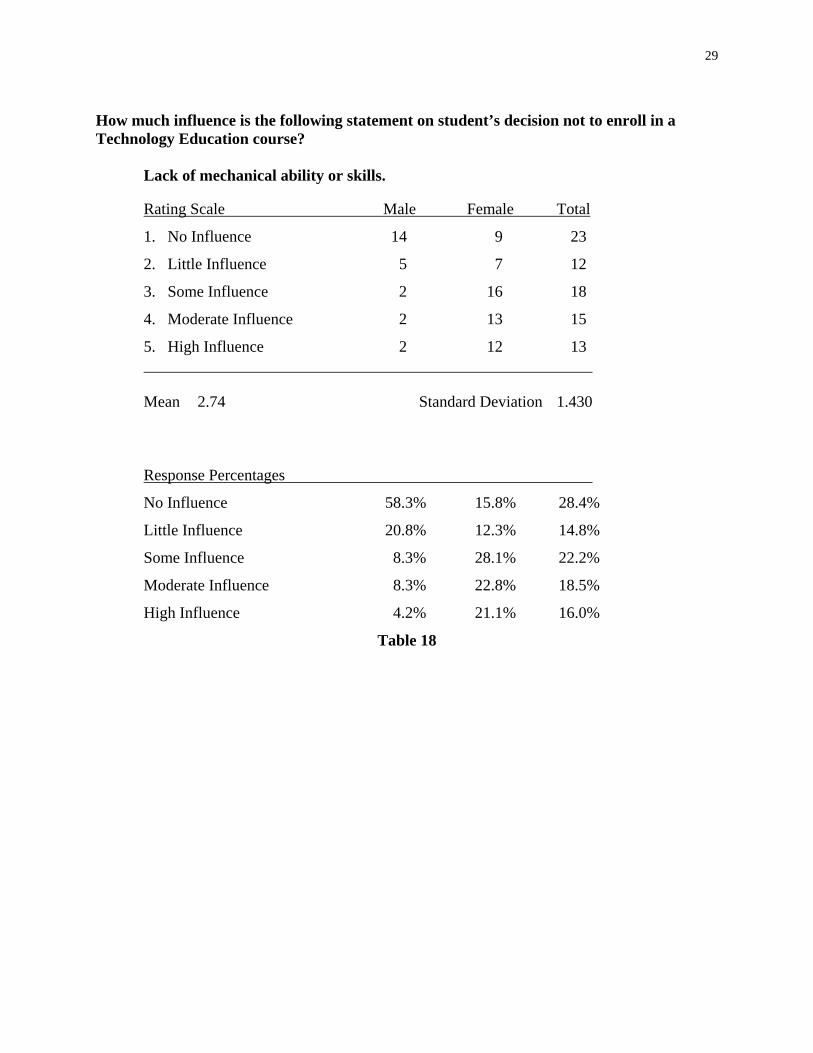
An area where the males and females disagreed on the influence on their decision not to
enroll in was in lacking mechanical ability or skills. The mean of the males was at 1.63 (in
between no influence and little influence) where the mean of the females was at 3.21 (in between
some influence and moderate influence).

26
For the following statements the standard deviation was under 1.00. This indicates that
both the males and females were in agreement with their answers. The statements were: dislike
the students in , poor experiences in middle school courses, dislike the instructor who teaches
the course, parents discourage taking the course, guidance counselor advised not taking the
course. In each of these instances more then 56% combined agreed that these statements had no
influence with the highest in agreement at 80%.
There are three statements that the males were in agreement where the females were not
in agreement. These statements were: classes seemed like a lot of work, lack of mechanical
ability or skills, and friends enrolled in the class. Each of these statements was between 45% and
55% in the belief that these statements had no influence on their decision not to enroll in a
course.
The remainder of the statements had a varied response. None of these statements had a
standard deviation of less then 1.00. This suggests that student’s answers were not in agreement
and there were a wider range of answers for the following statements. These statements were:
course content not interesting, subjects that I like are not offered, less time for electives because
of graduation requirements, can not fit into my four year plan for elective courses, course content
is not relative to my future career plans, friends are not taking the course, feeling that the course
is not for college bounds students, and the final statement was other.
Tables 16 through 32 indicate the responses that were given for question fourteen.

27
How much influence is the following statement on student’s decision not to enroll in a Technology Education course? Dislike of the image of the students in .
Rating Scale Male Female Total
1. No Influence 13 42 55
2. Little Influence 8 7 15
3. Some Influence 2 7 9
4. Moderate Influence 1 1 2
5. High Influence 0 1 0
Mean 1.48 Standard Deviation 0.787
Response Percentages
No Influence 54.2% 73.7% 67.9%
Little Influence 33.3% 12.3% 18.5%
Some Influence 8.3% 12.3% 11.1%
Moderate Influence 4.2% 1.8% 2.5%
High Influence 0.0% 0.0% 0.0%
Table 16

28
How much influence is the following statement on student’s decision not to enroll in a Technology Education course? Class seems like a lot of work.
Rating Scale Male Female Total
1. No Influence 11 22 33
2. Little Influence 8 15 23
3. Some Influence 3 13 16
4. Moderate Influence 2 6 8
5. High Influence 0 1 1
Mean 2.02 Standard Deviation 1.054
Response Percentages
No Influence 45.8% 38.6% 40.7%
Little Influence 33.3% 26.3% 28.4%
Some Influence 12.5% 22.8% 19.8%
Moderate Influence 8.3% 10.5% 9.9%
High Influence 0.0% 1.8% 1.2%
Table 17
29
How much influence is the following statement on student’s decision not to enroll in a Technology Education course? Lack of mechanical ability or skills.
Rating Scale Male Female Total
1. No Influence 14 9 23
2. Little Influence 5 7 12
3. Some Influence 2 16 18
4. Moderate Influence 2 13 15
5. High Influence 2 12 13
Mean 2.74 Standard Deviation 1.430
Response Percentages
No Influence 58.3% 15.8% 28.4%
Little Influence 20.8% 12.3% 14.8%
Some Influence 8.3% 28.1% 22.2%
Moderate Influence 8.3% 22.8% 18.5%
High Influence 4.2% 21.1% 16.0%
Table 18

30
How much influence is the following statement on student’s decision not to enroll in a Technology Education course? Poor experiences in middle school courses.
Rating Scale Male Female Total
1. No Influence 18 28 46
2. Little Influence 3 15 18
3. Some Influence 3 10 13
4. Moderate Influence 0 4 4
5. High Influence 0 0 0
Mean 1.69 Standard Deviation 0.911
Response Percentages
No Influence 75.0% 49.1% 56.8%
Little Influence 12.5% 26.3% 22.2%
Some Influence 12.5% 17.5% 16.0%
Moderate Influence 0.0% 7.0% 4.9%
High Influence 0.0% 0.0% 0.0%
Table 19

31
How much influence is the following statement on student’s decision not to enroll in a Technology Education course? Course content not interesting.
Rating Scale Male Female Total
1. No Influence 10 8 18
2. Little Influence 3 14 17
3. Some Influence 7 15 22
4. Moderate Influence 4 6 10
5. High Influence 0 14 14
Mean 2.81 Standard Deviation 1.371
Response Percentages
No Influence 41.7% 14.0% 22.2%
Little Influence 12.5% 24.6% 21.0%
Some Influence 29.2% 26.3% 27.2%
Moderate Influence 16.7% 10.5% 12.3%
High Influence 0.0% 24.6% 17.3%
Table 20

32
How much influence is the following statement on student’s decision not to enroll in a Technology Education course? Subject(s) that I like are not offered.
Rating Scale Male Female Total
1. No Influence 8 20 28
2. Little Influence 6 16 22
3. Some Influence 5 12 17
4. Moderate Influence 3 4 7
5. High Influence 2 5 7
Mean 2.30 Standard Deviation 1.261
Response Percentages
No Influence 33.3% 35.1% 34.6%
Little Influence 25.0% 28.1% 27.2%
Some Influence 20.8% 21.1% 21.0%
Moderate Influence 12.5% 7.0% 8.6%
High Influence 8.3% 8.8% 8.6%
Table 21
33
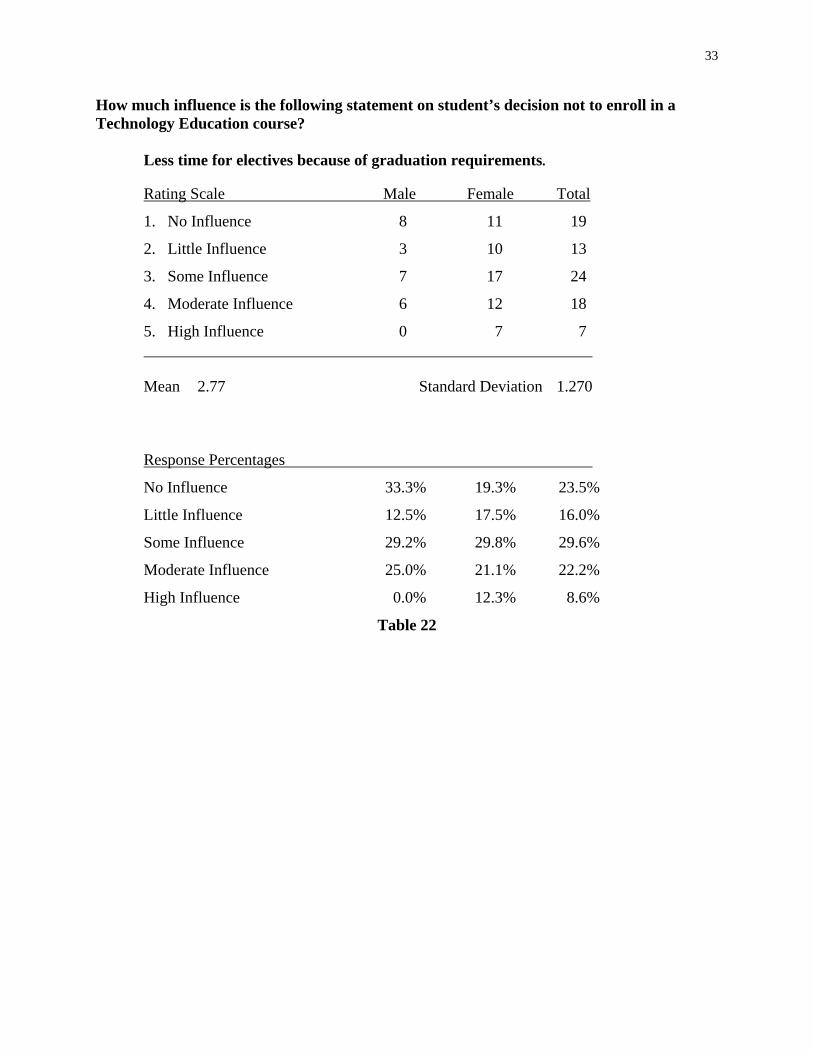
How much influence is the following statement on student’s decision not to enroll in a Technology Education course? Less time for electives because of graduation requirements.
Rating Scale Male Female Total
1. No Influence 8 11 19
2. Little Influence 3 10 13
3. Some Influence 7 17 24
4. Moderate Influence 6 12 18
5. High Influence 0 7 7
Mean 2.77 Standard Deviation 1.270
Response Percentages
No Influence 33.3% 19.3% 23.5%
Little Influence 12.5% 17.5% 16.0%
Some Influence 29.2% 29.8% 29.6%
Moderate Influence 25.0% 21.1% 22.2%
High Influence 0.0% 12.3% 8.6%
Table 22

34
How much influence is the following statement on student’s decision not to enroll in a Technology Education course? Cannot fit into my four-year plan for elective courses.
Rating Scale Male Female Total
1. No Influence 9 14 23
2. Little Influence 2 10 12
3. Some Influence 6 13 19
4. Moderate Influence 4 7 11
5. High Influence 3 13 16
Mean 2.81 Standard Deviation 1.475
Response Percentages
No Influence 37.5% 24.6% 28.4%
Little Influence 8.3% 17.5% 14.8%
Some Influence 25.0% 22.8% 23.5%
Moderate Influence 16.7% 12.3% 13.6%
High Influence 12.5% 22.8% 19.8%
Table 23

35
How much influence is the following statement on student’s decision not to enroll in a Technology Education course? Course content is not relevant to my future career plans.
Rating Scale Male Female Total
1. No Influence 8 3 11
2. Little Influence 1 5 6
3. Some Influence 9 18 27
4. Moderate Influence 4 7 11
5. High Influence 2 24 26
Mean 3.43 Standard Deviation 1.360
Response Percentages
No Influence 33.3% 5.3% 13.6%
Little Influence 4.2% 8.8% 7.4%
Some Influence 37.5% 31.6% 33.3%
Moderate Influence 16.7% 12.3% 13.6%
High Influence 8.3% 42.1% 32.1%
Table 24

36
How much influence is the following statement on student’s decision not to enroll in a Technology Education course? Lack of information on course offerings.
Rating Scale Male Female Total
1. No Influence 12 20 32
2. Little Influence 6 17 23
3. Some Influence 3 14 17
4. Moderate Influence 3 6 9
5. High Influence 0 0 0
Mean 2.04 Standard Deviation 1.024
Response Percentages
No Influence 50.0% 35.1% 39.5%
Little Influence 25.0% 29.8% 28.4%
Some Influence 12.5% 24.6% 21.0%
Moderate Influence 12.5% 10.5% 11.1%
High Influence 0.0% 0.0% 0.0%
Table 25
37
How much influence is the following statement on student’s decision not to enroll in a Technology Education course? Dislike the instructor who teaches the courses.
Rating Scale Male Female Total
1. No Influence 16 45 61
2. Little Influence 7 5 12
3. Some Influence 1 5 6
4. Moderate Influence 0 1 1
5. High Influence 0 1 1
Mean 1.38 Standard Deviation 0.779
Response Percentages
No Influence 66.7% 78.9% 75.3%
Little Influence 29.2% 8.8% 14.8%
Some Influence 4.2% 8.8% 7.4%
Moderate Influence 0.0% 1.8% 1.2%
High Influence 0.0% 1.8% 1.2%
Table 26

38
How much influence is the following statement on student’s decision not to enroll in a Technology Education course? Friends enrolled in the class.
Rating Scale Male Female Total
1. No Influence 13 29 42
2. Little Influence 5 11 16
3. Some Influence 5 12 17
4. Moderate Influence 1 5 6
5. High Influence 0 0 0
Mean 1.84 Standard Deviation 0.999
Response Percentages
No Influence 54.2% 50.9% 51.9%
Little Influence 20.8% 19.3% 19.8%
Some Influence 20.8% 21.1% 21.0%
Moderate Influence 4.2% 8.8% 7.4%
High Influence 0.0% 0.0% 0.0%
Table 27

39
How much influence is the following statement on student’s decision not to enroll in a Technology Education course? Parents discouraged taking the course.
Rating Scale Male Female Total
1. No Influence 18 41 59
2. Little Influence 1 6 7
3. Some Influence 4 9 13
4. Moderate Influence 1 1 2
5. High Influence 0 0 0
Mean 1.48 Standard Deviation 0.848
Response Percentages
No Influence 75.0% 71.9% 72.8%
Little Influence 4.2% 10.5% 8.6%
Some Influence 16.7% 15.8% 16.0%
Moderate Influence 4.2% 1.8% 2.5%
High Influence 0.0% 0.0% 0.0%
Table 28

40
How much influence is the following statement on student’s decision not to enroll in a Technology Education course? Guidance counselor advised not taking the course.
Rating Scale Male Female Total
1. No Influence 21 44 65
2. Little Influence 0 6 6
3. Some Influence 2 5 7
4. Moderate Influence 1 2 3
5. High Influence 0 0 0
Mean 1.36 Standard Deviation 0.791
Response Percentages
No Influence 87.5% 77.2% 80.2%
Little Influence 0.0% 10.5% 7.4%
Some Influence 8.3% 8.8% 8.6%
Moderate Influence 4.2% 3.5% 3.7%
High Influence 0.0% 0.0% 0.0%
Table 29

41
How much influence is the following statement on student’s decision not to enroll in a Technology Education course? Friends are not taking the course.
Rating Scale Male Female Total
1. No Influence 16 30 46
2. Little Influence 4 10 14
3. Some Influence 1 11 12
4. Moderate Influence 2 4 6
5. High Influence 1 2 3
Mean 1.84 Standard Deviation 1.149
Response Percentages
No Influence 66.7% 52.6% 56.8%
Little Influence 16.7% 17.5% 17.3%
Some Influence 4.2% 19.3% 14.8%
Moderate Influence 8.3% 7.0% 7.4%
High Influence 4.2% 3.5% 3.7%
Table 30

42
How much influence is the following statement on student’s decision not to enroll in a Technology Education course? Feeling the course is not for college bound students.
Rating Scale Male Female Total
1. No Influence 15 26 41
2. Little Influence 2 13 15
3. Some Influence 4 11 15
4. Moderate Influence 2 4 6
5. High Influence 1 3 4
Mean 1.98 Standard Deviation 1.196
Response Percentages
No Influence 62.5% 45.6% 50.6%
Little Influence 8.3% 22.8% 18.5%
Some Influence 16.7% 19.3% 18.5%
Moderate Influence 8.3% 7.0% 7.4%
High Influence 4.2% 5.3% 4.9%
Table 31

43
How much influence is the following statement on student’s decision not to enroll in a Technology Education course? Other.
Rating Scale Male Female Total
1. No Influence 2 0 2
2. Little Influence 1 0 1
3. Some Influence 0 0 0
4. Moderate Influence 1 0 1
5. High Influence 0 0 0
Mean 1.60 Standard Deviation 1.356
Response Percentages
No Influence 50.0% 0.0% 50.0%
Little Influence 25.0% 0.0% 25.0%
Some Influence 0.0% 0.0% 0.0%
Moderate Influence 25.0% 0.0% 25.0%
High Influence 0.0% 0.0% 0.0%
Table 32

44
CHAPTER V
Summary and Recommendations
Conclusions
The purpose of this study was to determine what factors influenced the decisions of
Reedsburg High School students to not enroll in Technology Education classes. The data from
this study can be used to answer the questions listed under Research Questions in Chapter 1.
There is no real significant data that suggests there are people influencing students not to enroll
in Technology Education courses. Data suggests that there is a very positive image among the
students about the Technology Education courses offered at the school. Worth noting, though, is
the fact that guidance counselors and teachers have very little influence at all on the courses
which students choose to take throughout high school. This rather unexpected result bears closer
examination. The course curriculum is a factor in why males are more interested in taking
Technology Education courses than the females. Females showed less interest in taking the
courses due to the fact they did not find it interesting. Also a factor in why students were not
enrolling in Technology Education courses was graduation requirements. Of the males and
females that responded that they would like to take a Technology Education class but didn’t, the
main reason was because of graduation requirements. Students were unable to fit electives into
their schedules and therefore ended up not taking Technology Education courses that they may
have otherwise.
Further conclusions from the research data are listed below.
1. Fifty-five percent of the parents or guardians received only a high school diploma.
From the literature review this would suggest that the enrollment in Technology

45
Education courses would be higher. The data suggests that this is not true at
Reedsburg High School.
2. Fifty-eight percent of the students responded that they were planning on going to a
four year college. The requirements for attending these colleges do not allow for
students to take extra electives like Technology Education courses that they may find
interesting, but are not required to get into the college of their choice. By not taking
electives, students have a better chance of meeting college entrance requirements.
3. Only three of the respondents stated that they have a negative attitude towards the
Technology Education program.
4. Students themselves are the biggest influence on course selection.
5. Teachers have very little influence on course selection.
6. Guidance counselors have almost no influence on course selection.
7. Females responded more strongly that others had an influence on their course
selection than the males. This was found to be true in all but three statements in
question number fourteen. Statements in which females responded had less influence
on them than the females were dislike the image of the students in , subjects that I like
are not offered, and parents discouraged taking the course.
8. Females responded that lacking mechanical ability or skills had some influence to
moderate influence on why they did not take Technology Education courses, while
the males responded that lacking mechanical ability or skills had no influence to little
influence on why they did not take Technology Education courses.
9. Females responded that the course content not being relevant to future plans had
some influence to moderate influence on why they did not take Technology
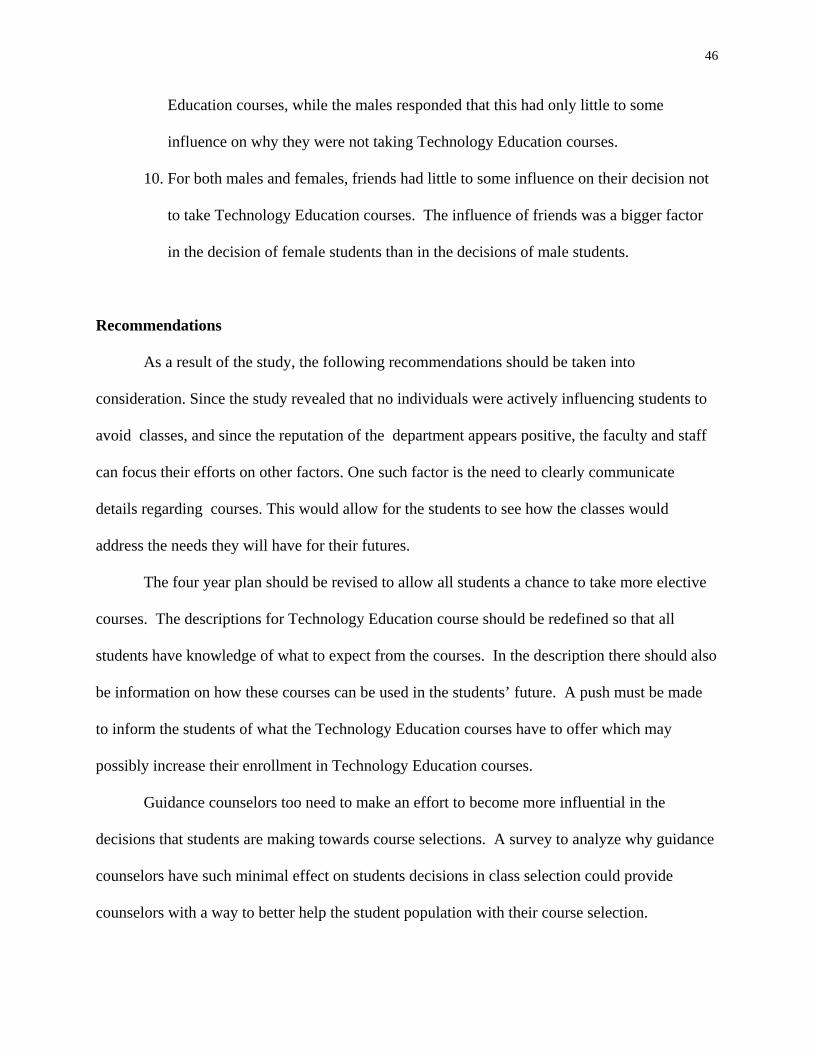
46
Education courses, while the males responded that this had only little to some
influence on why they were not taking Technology Education courses.
10. For both males and females, friends had little to some influence on their decision not
to take Technology Education courses. The influence of friends was a bigger factor
in the decision of female students than in the decisions of male students.
Recommendations
As a result of the study, the following recommendations should be taken into
consideration. Since the study revealed that no individuals were actively influencing students to
avoid classes, and since the reputation of the department appears positive, the faculty and staff
can focus their efforts on other factors. One such factor is the need to clearly communicate
details regarding courses. This would allow for the students to see how the classes would
address the needs they will have for their futures.
The four year plan should be revised to allow all students a chance to take more elective
courses. The descriptions for Technology Education course should be redefined so that all
students have knowledge of what to expect from the courses. In the description there should also
be information on how these courses can be used in the students’ future. A push must be made
to inform the students of what the Technology Education courses have to offer which may
possibly increase their enrollment in Technology Education courses.
Guidance counselors too need to make an effort to become more influential in the
decisions that students are making towards course selections. A survey to analyze why guidance
counselors have such minimal effect on students decisions in class selection could provide
counselors with a way to better help the student population with their course selection.
47
Teachers need to become more involved in the decisions that students are making when
looking at course selections. A follow up survey would be recommended to study what courses
students would be interested in taking in the Technology Education field. This could offer
teachers a bigger insight to ways to change their curriculums that could increase interest and
enrollment in Technology Education courses.

48
References
Campbell, P., Elliot, J., Hotchkins, L., & Laughlin, S., (1987). Education and labor market
experience of vocational students from three types of secondary schools. Columbus: The
Ohio State University, The National Center for Research in Vocational Education.
Dube, D. N. (1987, May). Parental attitudes toward vocational education in the Tompkins-
Seneca-Tioga area. Unpublished master's thesis.
Herr, E. L., (1987, September). Natural Allies. Vocational Education Journal. 55(6), 30-33.
Hill, C. (1999). Signs of distress in technology education programs. The Technology Teacher.
55(7), 21-26.
Introduction to UW-Stout 1999-2000. (2000). Admissions Requirements [Brochure].
Lam, J. Y. (1982). Determinants of educational plans of the indeterminant high school
graduates. The Journal of Educational Administration. 20(2), 213-229.
Lewis, T. (1991). Main currents in teacher education: Imperative for technology teacher
education. Journal of Industrial Teacher Education. 30(4), 25-52.
Olson, L. (1989, February 15). Questions raised on efficacy of stiffer math, science graduation
requirements. Education Week. p.5
O'Neill, E. J. (1985). A study of student recruitment and selection for area vocational technical
schools in Pennsylvania and selected vocational educators' opinions concerning the
process. University Park: The Pennsylvania State University.
Otto, L. B. (1987, September). Parents: Key career advisors. Vocational Education Journal.

49
Rossetti, R., Elliot, J., Price, C., & McClay, P. (1989. January). Factors that influence a student
not to enter into a high school vocational curriculum. Final Report. Columbus:
Department of Agricultural Education, The Ohio State University.
Silverman, S., & Pritchard, A.M. (1996). Building their future: Girls and technology education in
Connecticut. Journal of Technology Education. 7(2).
Social learning and career decision making. (1979). Cranston, RI: Carroll Press.
Strickland, D., Elson, D., & Frantz, N. (1987, May). Graduation requirements and vocational
enrollments. Vocational Education Journal. 62(4), 41-42.
Tuma, J. (1996, March). Trends in participation in secondary vocational education: 1982–1992.
Washington, D.C.: U.S. Department of Education, Office of Educational Research and
Improvement, National Center for Education Statistics.
Wirt, J. (1989). National assessment of vocational education: Final Report. Washington, D.C.:
U.S. Department of Education.
Wisconsin Department of Public Instruction. (2000). www.dpi.state.wi.us. [WebSite]
50
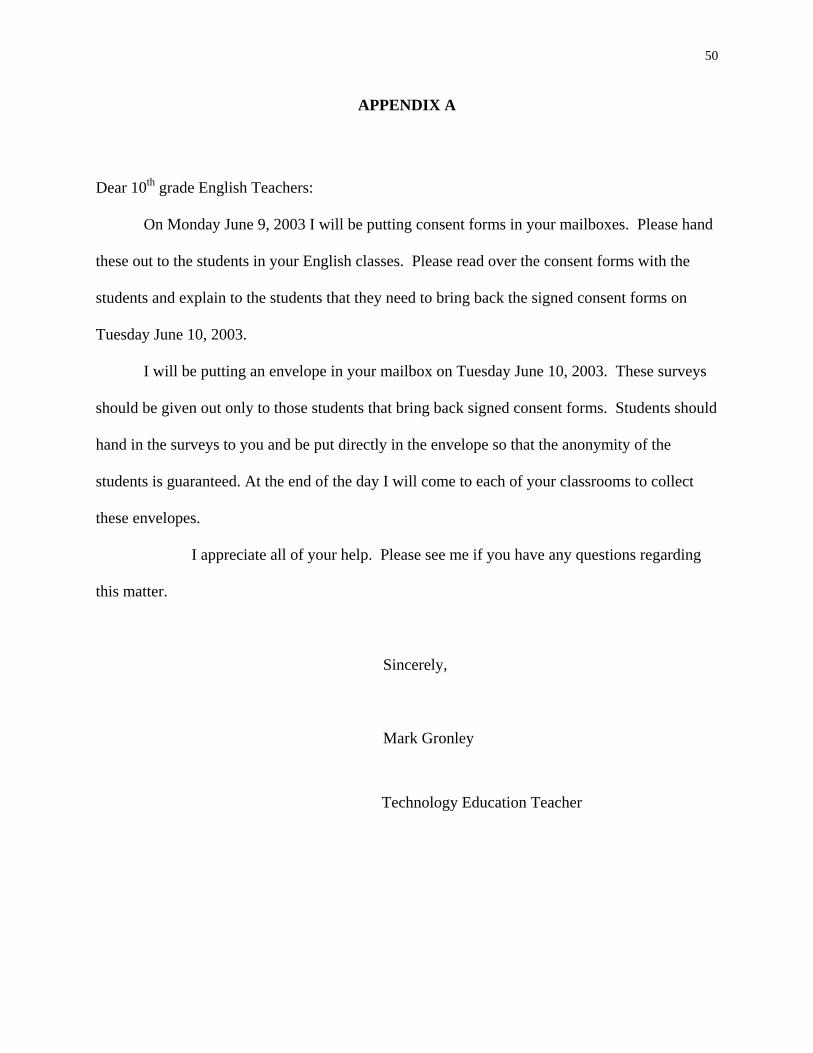
APPENDIX A
Dear 10th grade English Teachers:
On Monday June 9, 2003 I will be putting consent forms in your mailboxes. Please hand
these out to the students in your English classes. Please read over the consent forms with the
students and explain to the students that they need to bring back the signed consent forms on
Tuesday June 10, 2003.
I will be putting an envelope in your mailbox on Tuesday June 10, 2003. These surveys
should be given out only to those students that bring back signed consent forms. Students should
hand in the surveys to you and be put directly in the envelope so that the anonymity of the
students is guaranteed. At the end of the day I will come to each of your classrooms to collect
these envelopes.
I appreciate all of your help. Please see me if you have any questions regarding
this matter.
Sincerely,
Mark Gronley
Technology Education Teacher

51
APPENDIX B
Student Questionnaire
Please respond to the following statements as they relate to your course selections. Your thoughtful responses will help in improving the Technology Education Program at Reedsburg High School. Please check all the appropriate responses.
1. Male Female
2. What are the occupations of your parents or guardian(s)?
3. What level of education did your parents or guardian(s) finish? Some High School High School Diploma
Associate Degree 2-year Technical Degree Some College Bachelor’s Degree
Master’s Degree 4. What do you plan on doing after High School?
Get a Job Attend a Technical School Attend a four-year college Enter the Armed Services Undecided Other (please state)
5. Who helped you decide on your plans for after high
school? I decided myself
A teacher A guidance counselor Your parents Another relative
Another student Undecided Other (please state)
6. What is your view of the Technology Education
program at your school? Positive Negative
7. How do your friends view the Technology
Education program at your school? Positively Negatively I don’t know
8. Do any of the courses that are offered in the Technology Education department sound interesting and fun? Yes, which course? No
9. Have you ever wanted to take a Technology
Education class but could not fit it into your schedule? Yes No
10. What was the reason for not being able to fit the class into your schedule?
High School graduation requirements College entrance requirements
Other 11. Has anyone ever told you not to take a Technology
Education course? Yes No
12. If you answered YES to question #11, who was that
person? A teacher A guidance counselor Your parents Another relative
Another student Other (please state)

Using the following scale, please circle the number that best describes the way you feel about each statement. 1 2 3 4 5 No Little Some Moderate High Influence Influence Influence Influence Influence 13. How much influence do these people have on your course selection?
1 2 3 4 5 Yourself
1 2 3 4 5 Parents / Family
1 2 3 4 5 Friends
1 2 3 4 5 Guidance Counselor
1 2 3 4 5 Teacher
1 2 3 4 5 Others (please state)
14. How influential are the following statements on your decision not to enroll in a Technology Education
course? 1 2 3 4 5 Dislike the image of the students in Technology Education
1 2 3 4 5 Classes seem like a lot of work
1 2 3 4 5 Lack mechanical ability or skills
1 2 3 4 5 Poor experiences in middle school courses
1 2 3 4 5 Course content not interesting
1 2 3 4 5 Subject(s) that I like are not offered
1 2 3 4 5 Less time for electives because of graduation requirements
1 2 3 4 5 Cannot fit into my four year plan for elective courses
1 2 3 4 5 Course content is not relevant to my future career plans
1 2 3 4 5 Lack of information on course offerings
1 2 3 4 5 Dislike the instructor who teaches the course
1 2 3 4 5 Friends enrolled in the class
1 2 3 4 5 Parents discouraged taking the course
1 2 3 4 5 Guidance counselor advised not taking the course
1 2 3 4 5 Friends are not taking the course
1 2 3 4 5 Feeling that the course is not for college bound students
1 2 3 4 5 Others (please state)
THANK YOU FOR RESPONDING