identifying employment-intensive export sectors in south
TRANSCRIPT

Identifying employment-intensive export sectors in South Africa’s service industry
FM van Heerden
21760632
Dissertation submitted in partial fulfillment of the requirements for the degree Magister Commercii in International Trade at the
Potchefstroom Campus of the North-West University
Supervisor: Dr S Grater
May 2015

i
ACKNOWLEDGEMENTS
The completion of this thesis would not have been possible without the guidance and
support from my family, friends and supervisor. Here I would like to thank and
acknowledge the most influential people to this effect:
To my supervisor, Dr Sonja Grater, thank you for the guidance, inspiration
and motivation throughout this process. You have provided me with the
needed tools and inspiration to complete this study with confidence and
admiration.
To Prof. Riaan Rossouw, for your valuable inputs in developing the empirical
analysis, and the support thereafter.
To my wife, and best friend Lenate, thank you for your love and support
throughout the process. It has provided me with the courage and motivation to
complete this thesis.
To the rest of my family, thank you for the interest and support throughout my
studies.
Lastly, I give thanks to the Lord whom has provided me with countless
blessings throughout my studies, and the completion of this thesis.

ii
ABSTRACT
Unemployment within the South African economy has indicated to be a prominent
issue with an official unemployment rate of 25.2% in the year 2013 (Statistics South
Africa, 2013). The South African government released the National Growth Path that
is primarily focused on creating stable economic growth, in order to create jobs as
well as eradicate inequality. This is followed by the Industrial Policy Action Plan 2
(IPAP2) document which includes a policy package to facilitate the specific industries
that are identified for job creation (DTI, 2012). Thus, employment creation has
become a real concern within the South African context.
The highest percentage of total employment has remained within the services
industry since 2004, at a rate above 60%. This is double the combined employment
within agriculture and industry, with agriculture at 5% and industry at 25% of total
employment. Thus the services industry has contributed to the highest amount of
employment in South Africa. The exports of services have grown consistently since
the year 2004. The largest exporter within the services industry is the travel sector,
with substantial exports which peaked at 9 billion dollars in 2013. When analysing
the remaining service sectors within the South African economy, it indicates that
there can be a greater deal of growth in exports, with the majority of service sectors
exporting less than 1 billion dollars.
Export expansion can be a basis to growth in employment creation, if policy can
specifically be focused towards it. Because of the demand for methods and strategy
for employment creation, this study reviewed the literature regarding the effects of
export expansion, as well as research methods to identify labour intensive sectors
and their spill-over effects. Studies show that the increases in exports have a
predominantly positive effect on employment. Furthermore, these studies also found
prominent inter-linkages of services sectors within the economy. The aim of this
study was to determine the most employment-intensive services sectors and their
linkages with other sectors within the South African economy, in order to make
recommendations for policy makers towards sustainable economic growth and job
creation in the services sector.
The Social Accounting Matrix (SAM) used in this study model generally explains
through a general table of a region or nation, by listing the regional or national

iii
economy accounting data within a square table. Thus the main goal of the SAM
model was to form a comprehensive economic-wide database, which included
information about all the productive activities in the economy, as well as
incorporating unproductive institutions and markets, such as capital markets, factor
markets, government, households and the rest of the world. The above model can
thus be used to determine the link between a specific sectors expansion and the
labour intensity of that sector. Furthermore, the model is not only limited to measure
labour intensity, but it can also measure the specific GDP and production spill-over
effects for a specific sector within the economy.
Therefore, the study could analyse the spill-over effects of specific services sectors,
as well as the possible employment effect it could have throughout the South African
economy. The results of the study could then also be used as a strategy for export
expansion and employment creation. There is currently no policy focused strategy
for the services industry, which could become beneficial.
The first step for the empirical analysis was to identify the services sectors which are
tradable/ exportable. The following SAM services sectors are more tradable/
exportable than others in commercial terms, and thus they will be used in the
analysis of this study:
Building and Construction
Trade
Accommodation
Communication
Finance and Insurance
Real Estate
Business Services
Community, Social and Personal Services
In the second part of the study, the objective was to determine the most
employment-intensive services sectors and its linkages with other sectors within the
South African economy, in order to make recommendations for policy makers
towards sustainable economic growth and job creation in the services sector. The

iv
results of this study indicated that an increase in the exports of services in South
Africa has a definite impact on employment in the following sectors:
Production
o Accommodation, Real Estate and Building and Construction
GDP
o Accommodation, Real Estate and Building and Construction
Labour
o Community, Social and Personal Services, Accommodation, and
Business Services
Keywords: Social Accounting Matrix, exports, employment creation, services,
services sector, South Africa.
v
OPSOMMING
Werkloosheid het bewys om 'n prominente saak te wees in die Suid-Afrikaanse
ekonomie met 'n amptelike werkloosheids-koers van 25,2% in 2013 (Statistiek Suid-
Afrika, 2013). Die Suid-Afrikaanse regering het onlangs die Nasionale Groei Plan
(NGP), wat hoofsaaklik gefokus is op die skep van stabiele ekonomiese groei, om
ten einde werk te skep, sowel as om ongelykheid uit te wis. Dit word gevolg deur die
IPAP2 dokument wat 'n beleid pakket insluit, met die spesifieke nywerhede wat
geïdentifiseer is om werkskepping te fasiliteer (DTI, 2012). So het werkskepping 'n
werklike kommer binne die Suid-Afrikaanse konteks geword.
Die hoogste persentasie van totale indiensneming het binne die dienste-industrie
gebly sedert 2004, teen 'n koers bo 60%. Dit is dubbel die gekombineerde
indiensneming van landbou en nywerheid, met landbou teen 5% en nywerheid teen
25% van totale indiensneming. Dus, het die dienste bygedra tot die hoogste
hoeveelheid van die werkskepping in Suid-Afrika. Die uitvoer van dienste was
konstant sedert die jaar 2004, waar die grootste uitvoerder in die dienste-industrie
geïdentifiseer is as die reis sektor, met aansienlike uitvoere, met ʼn hoogtepunt van 9
miljard dollar in 2013. Wanneer die oorblywende diens sektore geanaliseer word
binne die Suid-Afrikaanse ekonomie, dui dit daarop dat groter groei in dienste
uitvoere bekom kan word, met die meerderheid van die diens sektore wat minder as
1 miljard dollar uitvoer.
Uitvoer uitbreiding kan 'n basis vir groei in werkskepping wees, indien beleid
spesifiek gefokus kan word tot dit. As gevolg van die vraag na metodes en strategie
vir werkskepping, bied hierdie studie ʼn oorsig oor die literatuur rakende die gevolge
van uitvoer uitbreiding, asook navorsing metodes rakende arbeidsintensiewe sektore
en hoe om sy oorloopgevolge te identifiseer. Studies toon dat die toename in
uitvoere wel predominant 'n positiewe uitwerking op indiensneming het. Verder het
hierdie studies ook prominent inter-skakeling binne die dienste sektore in die
ekonomie gevind. Die doel van hierdie studie was om die meeste werk-intensiewe
dienste sektore en sy skakeling met ander sektore in die Suid-Afrikaanse ekonomie
te bepaal, om ten einde aanbevelings vir beleidmakers tot volhoubare ekonomiese
groei en werkskepping in die dienste sektor te maak.

vi
Die SAM model verduidelik deur 'n algemene tafel van 'n streek of land, met die
aanbieding van die streeks-of nasionale ekonomie se rekeningkundige data binne 'n
vierkantige tabel. Dus, is die hoof doel om 'n omvattende ekonomie-wye databasis,
wat inligting oor al die produktiewe aktiwiteite in die ekonomie insluit, asook die
integrasie van onproduktiewe instellings en markte, soos die finansiële markte, faktor
markte, die regering, huishoudings en die res van die wêreld. Die bogenoemde
model kan dus gebruik word om die skakel tussen 'n spesifieke sektor uitbreiding en
die arbeid intensiteit van die sektor te bepaal. Verder is die model nie net beperk ten
opsigte van om arbeid intensiteit te meet nie, maar dit kan ook die spesifieke Bruto
Binnelandse Produk (BBP) en produksie oorloopgevolge vir 'n spesifieke sektor in
die ekonomie meet.
Daarom kan die studie die oorspoel effekte van spesifieke dienste sektore analiseer,
asook die indiensnemings uitwerking wat dit binne die hele Suid-Afrikaanse
ekonomie kan hê. Die resultate van die studie kan dan ook gebruik word as 'n
strategie vir uitvoer uitbreiding en werkskepping. Daar is tans geen beleid gefokus
strategie vir die dienste industrie nie, wat voordelig kan word.
Die eerste stap vir die empiriese ontleding was om die dienste sektore wat
verhandelbare/ uitvoerbaar is, te identifiseer. Die volgende SAM dienste sektore is
meer verhandelbaar/ uitvoerbaar as die ander in kommersiële terme, en dus sal
hulle in die ontleding van hierdie studie gebruik word:
Bou en Konstruksie
Handel
Akkommodasie
Kommunikasie
Finansies en Versekering
Eiendom
Korporatiewe Dienste
Gemeenskap, maatskaplike en persoonlike dienste
Die tweede deel van die studie was om die mees werk-intensiewe dienste sektore en
sy skakeling met ander sektore in die Suid-Afrikaanse ekonomie te bepaal, om ten
einde aanbevelings vir beleidmakers tot volhoubare ekonomiese groei en

vii
werkskepping in die dienste sektor te maak. Dus, ten slotte om die vraag wat in die
probleemstelling van hierdie studie was te beantwoord, 'n toename in die uitvoer van
dienste in Suid-Afrika het 'n definitiewe impak op indiensneming in die volgende
sektore:
Produksie
o Akkommodasie, Eiendom en Bou en Konstruksie
BBP
o Akkommodasie, Eiendom en Bou en Konstruksie
Arbeid
o Gemeenskap, Maatskaplike en Persoonlike dienste, Akkommodasie,
en Korporatiewe Dienste
Sleutelwoorde: Sosiale Rekeninge Matriks, uitvoere, werkskepping, dienste,
dienste sektor, Suid-Afrika.

viii
ABBREVIATIONS
ANC - African National Congress
BRICs - Brazil, Russia, India, China and South Africa
DFI - Development Finance Institution
DTI - Department of Trade and Industry
EPWP - Expanded Public Works Programme
EU - European Union
FC - Fixed Cost
GATS - General Agreement on Trade in Services
GDP - Gross Domestic Product
HIS - Information Handling Services
IDC - Industrial Development Corporation
IO - Input-Output
IPAP - Industrial Policy Action Plan
IPAP2 - Industrial Policy Action Plan 2
IPR - Intellectual Property Rights
ITA - International Trade Administration
ITC - International Trade Centre
NDP - National Development Plan
NEDP - National Exporter Development Programme
NGP - New Growth Path
NPC - National Planning Commission
OECD - Organisation for Economic Co-operation and
Development
ROW - Rest of the World
SADC - Southern African Development Community
SAM - Social Accounting Matrix
SARS - South African Revenue Services
SQAM - Standards, Quality Assurance, Accreditation and
Metrology
StatsSA - Statistics South Africa
TC - Total Cost

ix
UNCTAD - United Nations Conference on Trade and
Development
US - United States
VC - Variable Cost
WB - World Bank
WTO - World Trade Organization

x
TABLE OF CONTENTS
ACKNOWLEDGEMENTS ........................................................................................... i
ABSTRACT ............................................................................................................... ii
OPSOMMING ............................................................................................................ v
ABBREVIATIONS................................................................................................... viii
TABLE OF CONTENTS ............................................................................................. x
LIST OF FIGURES.................................................................................................. xiv
LIST OF TABLES .................................................................................................... xv
Chapter 1: Introduction ............................................................................................ 1
1.1 Introduction ....................................................................................................... 1
1.2 Background ....................................................................................................... 2
1.2.1 Types and classifications of services .......................................................... 3
1.2.2 Labour intensity of the services industry ..................................................... 8
1.2.3 Services in the South African economy ...................................................... 9
1.3 Problem statement .......................................................................................... 11
1.4 Research questions ........................................................................................ 11
1.5 Research objectives ........................................................................................ 11
1.6 Research method ............................................................................................ 12
1.6.1 Literature review ....................................................................................... 12
1.6.2 Empirical study ......................................................................................... 12
1.7 Chapter division .............................................................................................. 13
Chapter 2: Literature Review on Export Expansion and Employment Creation
in the Services Industry ......................................................................................... 15
2.1 Introduction ................................................................................................. 15
2.2 Why countries trade: Trade theory .............................................................. 16
2.2.1 Neo-classical Trade Theory ...................................................................... 16
2.2.2 Comparative Advantage Theory ........................................................... 18

xi
2.2.3 The New Trade Theory ......................................................................... 19
2.2.4 Gravity Model ....................................................................................... 20
2.3 The relationship between export expansion and employment creation ....... 21
2.3.1 Macro-level impact of increased exports on employment ......................... 21
2.3.2 Micro-level impact of increased exports on employment .......................... 26
2.4 Forward and backward linkages within specific sectors .............................. 30
2.5 Conclusion .................................................................................................. 33
Chapter 3: South African services industry ......................................................... 35
3.1 Introduction ................................................................................................. 35
3.2 The role of services in the South African economy ..................................... 36
3.2.1 South Africa’s economy in recent years .................................................... 36
3.2.2 Services in the South African economy .................................................... 39
3.2.3 South African export of services ............................................................... 40
3.3 Employment creation plans for the South African services sector............... 44
3.3.1 Industrial Policy Action Plan (IPAP) .......................................................... 44
3.3.2 National Exporter Development Programme (NEDP) and Industrial
Development Corporation (IDC) ........................................................................ 47
3.3.3 National Development Plan (NDP) and National Growth Plan (NGP) ....... 49
3.3.4 Employment division in South Africa ......................................................... 50
3.4 The relationship between employment and services exports in South Africa .. 52
3.5 Conclusion .................................................................................................. 53
Chapter 4: Methodology of the empirical analysis .............................................. 56
4.1 Introduction ..................................................................................................... 56
4.2 The Social Accounting Matrix (SAM) Multiplier Model .................................... 56
4.2.1 Describing the Social Accounting Matrix (SAM) ........................................ 56
4.2.2 Social Accounting Matrix (SAM) equations, assumptions and structure. .. 60
4.2.3 Components of Macro-SAM and Micro-SAM ............................................ 61
xii
4.2.4 Division of sectors by the Social Accounting Matrix (SAM) ....................... 62
4.3 Multiplier decompositions ................................................................................ 63
4.4 Description of the data used in the South African Social Accounting Matrix 66
4.5 South African Social Accounting Matrix (SAM) ............................................... 66
4.4.1 SAM model on a national level ................................................................. 66
4.4.2 Model design for productivity, GDP and labour within the services sector 68
4.6 Conclusion ...................................................................................................... 73
Chapter 5: Empirical Analysis and Results ......................................................... 75
5.1 Introduction ................................................................................................. 75
5.2 Selecting exportable services sectors for analysis ...................................... 75
5.2.1 Social Accounting Matrix (SAM) services sectors which are exportable ... 75
5.3 Empirical results and analysis for the services industry .............................. 76
5.3.1 Analysis for the Production Multiplier .................................................... 77
5.3.2 Analysis for the GDP multiplier ............................................................. 84
5.3.3 Analysis for the Labour Multiplier .......................................................... 89
5.4 Conclusion .................................................................................................. 95
Chapter 6: Conclusion and Recommendations ................................................... 98
6.1 Introduction ..................................................................................................... 98
6.2 Summary ......................................................................................................... 98
6.3 Policy recommendations ............................................................................... 107
6.4 Limitations ..................................................................................................... 108
6.5 Future research ............................................................................................. 108
6.6 Conclusion .................................................................................................... 109
ANNEXURES ......................................................................................................... 110
Annexure A ......................................................................................................... 110
Annexure B ......................................................................................................... 129
Annexure C ......................................................................................................... 148

xiii
List of References ................................................................................................ 167
xiv
LIST OF FIGURES
Chapter 2
Figure 2.1 Effect of supply shock on the labour market ............................................. 28
Chapter 3
Figure 3.1 GDP growth rate for South Africa 2004-2013 ........................................... 37
Figure 3.2 Annual value added by industry for gross domestic product at current
prices (R million) and percentage of GDP share ....................................................... 38
Figure 3.3 Annual value added by services sector for gross domestic product at
current prices (R million) .......................................................................................... 39
Figure 3.4 South African exports of goods and services 2004-2013 ........................ 41
Figure 3.5 South African services exports 2004-2013 in USD .................................. 42
Figure 3.6 South African services exports as per sector 2004-2013 ......................... 43
Figure 3.7 National Exporter Development Programme (NEDP) .............................. 47
Figure 3.8 Employment division of South African (% of total employment)
2004-2011 ................................................................................................................. 51
Chapter 4
Figure 4.1: SAM circular flow diagram of the economy ............................................ 59
Chapter 5
Figure 5.1 Total Production Multiplier spill-over effect throughout the primary,
manufacturing and services industry for Building and Construction in Millions of
Rand .......................................................................................................................... 82
Figure 5.2 Total GDP Multiplier spill-over effect throughout the primary,
manufacturing and services industry for Real Estate in Millions of Rand .................. 88
Figure 5.3 Total GDP Multiplier spill-over effect throughout the primary,
manufacturing and services industry Community, Social and Personal Services in
Millions of Rand ......................................................................................................... 94

xv
LIST OF TABLES
Chapter 1
Table 1.1 Modes of Supply (Summary) ....................................................................... 5
Chapter 4
Table 4.1 Map for a simplified Social Accounting Matrix (SAM) ............................... 64
Chapter 5
Table 5.1 Total effect for the production multiplier for each services sector in Millions
of Rand ...................................................................................................................... 78
Table 5.2 Total effect for the GDP multiplier for each service sector in Millions of
Rand .......................................................................................................................... 84
Table 5.3 Total effect for the labour multiplier for each service sector per unit of jobs
created ...................................................................................................................... 90

1
Chapter 1: Introduction
1.1 Introduction
The South African economy has struggled to create the necessary job opportunities
for its people with an official unemployment rate of 25.2% in 2013 (Statistics South
Africa, 2013). In real concern for the economic state South Africa is finding itself in,
the government released the National Growth Path (NGP) document. It is primarily
focused on creating stable economic growth, in order to create jobs as well as
eradicate inequality. This is followed by the IPAP2 document which includes a policy
package to facilitate processes within the specific industries that are identified for job
creation (DTI, 2012).
The NGP specifically identified core challenges for mass joblessness, poverty and
inequality in the South African economy. Despite the economic volatility since 1994
to 2008, South Africa experienced a 4% economic expansion, more or less the same
than other upper-middle income countries (Department of Trade and Industry (DTI),
2012). After 2008 the economy was also associated with high inequality and high
levels of joblessness. The position was the worst for young people, where not
enough jobs were created to absorb the new entrants into the labour market. In the
first quarter of 2010 the unemployment rate was 40% for people of the ages between
16 and 30 years, and 16% for those of the ages between 30 and 65 (DTI, 2012).
Since the lowest point of employment in the third quarter of 2010, the economy has
created 646 000 jobs up until 2013, but the official unemployment rate as released
by Statistics South Africa (STATSSA) in the first quarter of 2013 was 25.2%
(Statistics South Africa, 2013).
The South African Government published the National Development Plan (NDP) in
2011, which discusses the specific actions that will be taken to ensure sustainable
employment. One of the main strategies of the NDP is promoting exports and
competitiveness, which requires more active promotion of demand for South African
products in the domestic and foreign markets. Policy will thus focus on developing
areas which indicate competitive advantage. This should result in the share of
exports in South Africa to rise, with the growing portion of exports in non-mineral
manufacturing and services (National Planning Commission, 2011).

2
The government’s focus is directed specifically in the tourism and other services
industries, to ensure that strengthening measures promote the targeted marketing
campaigns, manage costs, quality assurance and logistics, improve training and
identify employment and entrepreneurial opportunities. This will also include
measures to improve business in terms of services such as finance and
communication, and enhancing support measures to encourage diversification (DTI,
2012).
The economic importance of services in the South African economy has grown
considerably. Not only has it become a major generator of employment but is playing
an increasing role in trade in two specific ways. Firstly, it plays an important role as
an input to manufacturing and can critically influence the competitiveness of this
sector. Secondly, parts of the services industry are highly tradable and South Africa
is increasingly becoming a significantly more important exporter of services (DTI,
2012).
The following section aims to provide a brief overview of the global trade in services
as well as South African unemployment rates and the government’s plans for
economic growth. Section 1.2 will include further explanation of the problem
statement, followed by the research questions and objectives in Sections 1.3 and
1.4., then followed by the research methodology in Section 1.5. Finally, the chapter
outline will be set out for the remainder of the thesis in Section 1.6.
1.2 Background
This section will provide an overview of the role that services has in the world
economy and the labour intensity of the service industry. This is followed by a brief
overview of the South African perspective on the services industry in its local
economy.
Globalisation is one of the most frequently used terms in the discussions of
development, trade, and international political economy. Globalisation is defined as
“the increasing integration of national economies into expanding international
markets” (Todaro & Smith, 2011:564). Public policy makers consider export
expansion as part of the globalisation process and an economic tool to create jobs

3
and, build up overseas exchange reserves in order to ultimately create a higher
standard of living (Evangelia, et al., 2005).
International trade often played a determining role in the historical growth of the
developing world, thus foreign trade can entail specific benefits. Some advantages
can include decreasing a nation’s current account deficit, as well as, an increase in
the surplus of foreign exchange and the ultimate influence on the balance of
payments (Todaro & Smith, 2011).
One of the factors that determine if a firm wants to export is the opportunity to grow
when the domestic demand is saturated. Thus the opportunity to expand and grow is
reliant on exporting (Evangelia, et al., 2005). In a study by Frederick and Barney’s
(2007), one of the main reasons for the growth in the services industry is increased
levels of services exports. Thus services exports allow for an expansion of demand,
not limited to the domestic economy, but broadened into foreign economies.
Services currently represent more than two thirds of world gross domestic product
(GDP) (World Trade Organization, 2012). The share of services value-added in
GDP tends to rise significantly with the countries level of income, standing at 73% on
average in high income countries (77% in the United States), compared with 54%
and 47% respectively in middle- and low-income countries (World Trade
Organization, 2012). Even in the latter group, the production of services is generally
a core economic activity, whose contribution to GDP is above that of both
manufacturing and agriculture. Significant differences however exist between
countries within the same income group, as for example for India and Nigeria, two
middle-income countries whose respective shares of services in GDP are 54% and
27%, or Kenya and Liberia, two low-income countries whose shares are 54% and
22% respectively (World Trade Organization, 2012). Thus, developing countries
share of production is towards services, where developing countries have a smaller
share.
1.2.1 Types and classifications of services
Services include a wide range of intangible as well as heterogeneous economic
activities, which is difficult to define. A service can be defined as a deed, a process

4
or performance, or more specifically a service can be defined as an act that one
party can offer another, which is essentially intangible and does not result in the
ownership of anything. Its delivery or production is not connected with a physical
product (Boshoff & Du Plessis, 2009). The General Agreement on Trade in Services
(GATS), defines the trade in services as the supply of services through cross-border
trade, consumption abroad, commercial presence and the presence of natural
persons as a mode of supply (Chang, et al., 1998).
The GATS Agreement defines the trade in services through four specific modes of
supply indicated as follows (World Trade Organization, 2010):
Mode 1 defines trade in services through cross-border trade, which is comparable to
international trade in goods, where a product (or in this case the service) crosses a
national frontier. This, for example, includes acquiring a loan or taking out insurance
cover domestically from a financial institution located abroad. Mode 2 is when the
service is consumed abroad, which includes the movement of consumers into the
territory of the suppliers. This, for example, will include financial services being
purchased by consumers while traveling abroad. Mode 3 entails the commercial
presence of a supplier of one country in the jurisdiction of another country, for
example, a foreign bank that establishes another branch or subsidiary in a country
abroad which provides financial services in that country. Thus the Agreement
includes foreign direct investment, including trade through commercial presence.
Mode 4 includes the supply of services through the presence of natural persons of
one country in the jurisdiction of another country. This is for example the presence of
independent financial consultants as well as the intra-corporate transfer of
managers, thus relating to independent service suppliers and the employees of
juridical persons supplying services. Table 1.1 provides a summary of the above
discussed modes of service supply.

5
Table 1.1 Modes of Supply (Summary)
Mode Supplier Presence Criteria
1. Cross-border supply Not present in the territory of the other country 1. Service delivery is within the territory of the
other country
2. Consumption abroad Not present in the territory of the other country 2. Service delivery is outside the territory of
the other country, consumed in the domestic
country by the foreign consumer
3. Commercial presence Present in the territory of the other country 3. Service delivery is within the territory of the
other country, through the commercial
presence of the supplier
4. Presence of natural person Present in the territory of the other country 4. Service delivery is within the territory of the
other country, with the supplier present as a
natural person
(World Trade Organization, 2010)
6
The defining of different services can be perceived as a difficult task. Therefore, for
the purposes of this study, services have been classified as per their characteristics.
They have been classified as hard and soft services, consumer and producer
services, and the official classification by the WTO. These are discussed below.
1.2.1.1 Hard and soft services
Hard services are the services that require limited or no local presence by the
producers, where production is separate from consumption. The service can also be
used any time after production (for example, education, life insurance, music and
architectural design). In contrast to this, soft services are the services that require
the presence of the producer, where consumption and production occur
simultaneously, such as health care, laundry and hotel services (Erramilli, 1990).
1.2.1.2 Consumer and producer services
Producer services can be defined as, support services provided for other goods and
services. For example, personal services, entertainment services, cleaning, financial,
cleaning, computing and other business services. Thus, a producer service is a
support service to producers throughout the production process. A consumer service
can then be described as the service sold to the final consumer directly for their
personal use, for example personal services such as hairdressing and beauty
treatments, and entertainment services (Mclachlan, et al., 2002).
1.2.1.3 World Trade Organization’s classification of services
In July 1991, the World Trade Organization released a document indicating the main
classifications for services by sectors. They classified the main services as; business
services; communication services; construction and related engineering services;
distribution services; educational services; environmental services; financial
services; health related and social services; tourism and travel related services;
recreational; cultural and sporting services; transport services; and other services not
included above (World Trade Organization, 2010).
In 2013, the World Trade Organization (WTO) published a report on the international
trade of commercial services. This report defines the trade of services which
includes the import and export of services as commercial services. As defined by the
WTO commercial services include transportation services, travel and other

7
commercial services, excluding government services. The above is described by the
World Trade Organization (2013) in more detail as follows:
Transportation services: “covers sea, air and other including land, internal
waterway, space and pipeline transport services that are performed by residents of
one economy for those of another, and that involve the carriage of passengers, the
movement of goods (freight), rentals (charters) of carriers with crew, and related
supporting and auxiliary services.”
Travel: “includes goods and services acquired by personal travellers, for health,
education or other purposes, and by business travellers. Unlike other services, travel
is not a specific type of service, but an assortment of goods and services consumed
by travellers. The most common goods and services covered are lodging, food and
beverages, entertainment and transportation (within the economy visited), gifts and
souvenirs.”
Other commercial services are defined by the following components:
Communication Services: “includes telecommunications, postal and courier services.
Telecommunications services encompasses the transmission of sound, images or
other information by telephone, telex, telegram, radio and television cable and
broadcasting, satellite, electronic mail, facsimile services etc., including business
network services, teleconferencing and support services. It does not include the
value of the information transported. Also included are cellular telephone services,
Internet backbone services and on-line access services, including provision of
access to the Internet.”
Construction: “covers work performed on construction projects and installation by
employees of an enterprise in locations outside the territory of the enterprise.”
Insurance services: “covers the provision of various types of insurance to non-
residents by resident insurance enterprises, and vice versa, for example, freight
insurance, direct insurance (e.g. life) and reinsurance.”
Financial services: “covers financial intermediation and auxiliary services provided by
banks, stock exchanges, factoring enterprises, credit card enterprises, and other
enterprises.”

8
Computer and information services: “is subdivided into computer services (hardware
and software related services and data processing services), news agency services
(provision of news, photographs, and feature articles to the media), and other
information provision services (database services and web search portals).”
Royalties and licence fees: “covering payments and receipts for the use of intangible
non-financial assets and proprietary rights, such as patents, copyrights, trademarks,
industrial processes, and franchises.”
Other business services: “comprising trade-related services, operational leasing
(rentals), and miscellaneous business, professional and technical services such as
legal, accounting, management consulting, public relations services, advertising,
market research and public opinion polling, research and development services,
architectural, engineering, and other technical services, agricultural, mining and on-
site processing.”
C: “is subdivided into two categories, (i) audio-visual services and (ii) other cultural
and recreational services. The first component includes services and fees related to
the production of motion pictures, radio and television programmes, and musical
recordings. Other personal, cultural, and recreational services include services such
as those associated with museums, libraries, archives, and other cultural, sporting,
and recreational activities.” (World Trade Organization, 2014:157-159)
1.2.2 Labour intensity of the services industry
In developed countries, the services industry influences approximately 70% of jobs
directly or indirectly. Furthermore, in the developed world roughly 90% of new jobs
created after 2000 are concentrated primarily towards services (Frederick & Barney,
2007).
The services industry tends to be relatively labour intensive, referring to the fact that
services use relatively more labour per unit of output. Accordingly, the costs of
wages and salaries services range from 70% to 90% of the total output, in
comparison with the manufacturing sector ranging from 5% to 40%, depending on
the degree of labour and capital intensity of each firm (Michael & Stephen, 2011).

9
The amount of output produced by either a country or firm, depends both on
productivity and the amount of input (capital and labour) used in the production
process, as illustrated by the production function (Andrew et al., 2008). Referring to
the production function relative to change in labour, to insure an increase in output, a
relative increase has to occur in the amount of labour or labour productivity. With
regards to this, the link is theoretically made that, if an increase has to be made in
output in a labour intensive sector, ultimately the sector has to increase its amount of
labour (Andrew, et al., 2008).
Using the assumption that the firm is functioning in a competitive labour market,
where the firm has a perfectly elastic supply of labour and can hire as many workers
as needed at a specific wage rate, the firm’s demand for labour is determined by the
marginal revenue product of labour (Robert & Daniel, 2005). In order for the firm to
maximize profits, they will hire workers where the supply of labour is equal to
demand for labour (Robert & Daniel, 2005).
1.2.3 Services in the South African economy
The services industry contributes 68.3% to GDP, 63% to employment and 74% to
labour formation in South Africa and has been the main source of growth for the
economy since the 1990s. The prominent influence of services is more pronounced
in the informal sector where petty trade, domestic work and minibus taxi driving are
the most common sources of income (DTI, 2010). Currently, the services industry
makes up 68.3% of the South African GDP, with the secondary industry consisting of
19.4% and the primary sector of 12.3% of South African GDP in 2013 (Statistics
South Africa, 2013). The outlook for South African exports has been looking
negative; competitiveness remains constrained as the global demand remains below
trend and the rand remains volatile. Contributing factors for export constraints
include infrastructural impediments and slow global demand (IHS Global Inc., 2014).
Since 2010 the portion for export as contribution to GDP gradually started to
increase to a maximum of 31.14% in 2013. The exports of services have grown
consistently since 2004, where a minor decline occurred between 2008 and 2009.
After 2009, services exports started increasing again, with low volatility and a minor
decrease in 2013 (IHS Global Inc., 2014).
10
Increasing the rate of job creation remains a problem in the South African economy,
and policy makers have struggled to change this over time. It has been a great task
to combine the best policies in order to create jobs as well as sustainable economic
growth (DTI, 2012). Public policy makers regard export development as an economic
tool that enables a nation to employ citizens, build overseas exchange reserves and
ultimately create a higher standard of living (Shankarmahesh, Olsen and Honeycutt,
2005:203; Edwards and Stern, 2007:1-22).
Expanding exports on its own is not enough, without identifying the essential
industries that support growth as well as the policies implemented for it, it remains
unsuccessful. The services industry currently represents two thirds of the world
share in GDP and is associated with high income countries, identifiable with higher
levels of prosperity and employment (World Trade Organization, 2012). In the IPAP2
document the DTI policy and strategy for services is predominantly focused towards
tourism and business process services (DTI, 2012). This excludes services such as
construction, trade, accommodation, transport, communication services, finance and
insurance, as well personal and other services which contribute greatly to
employment within the economy, and some of these other services sectors may
even have a greater potential for both exports as well as employment creation.
The identification of those specific service sectors which are highly labour absorbent
has not been thoroughly researched in South Africa, and more importantly which
services sectors have the highest labour intensity when exports increases has also
not been researched.
Thus, this study aims to determine the most labour absorbent services export
sectors in South Africa, as well as the spill-over effects from one services sector to
the other sectors in the economy in terms of employment creation. This will also
contribute to the constant effort of policy makers to create sustainable economic
growth and job creation in South Africa. The aim is thus to indicate not only which
services sectors are currently the most labour-intensive, but also to investigate if the
exports in certain services sectors were to be increased, what impact that would
have on employment in those sectors as well as the sectors to which they spill over.
This will assist policy makers to focus development to those services sectors that
have the highest potential in terms of employment as.
11
1.3 Problem statement
The aim of this study will be to determine the most employment-intensive services
sectors, especially when exports are increased in these sectors, and their linkages
with other sectors within the South African economy. The results can be used to
make recommendations for policy makers towards sustainable economic growth and
job creation in the services sector.
1.4 Research questions
What is the impact of the services sector on employment and growth in the South
African economy?
The following research questions arise when formulating the problem statement:
• Which services sectors have the largest labour intensity in South Africa?
• With which sectors do these services sector have the most prominent linkages
/ spill-over effects?
• What impact will an increase in the exports of the various services sectors
have on the employment these sectors?
1.5 Research objectives
The objective of this study will be to determine the most employment-intensive
service sectors and their linkages within the South African economy, in order to
determine recommendations for policy makers towards sustainable economic growth
and job creation. This together with the identification of linkages in other sectors can
support more focused policy making. The following objectives were identified when
formulating the problem statement:
• Determine which services sectors have the largest labour intensity in South
Africa.
• Determine with which sectors these services sectors have the most prominent
linkages / spill-over effects.
• Identify what impact an increase in the exports of the various services sectors
will have on the employment in each services sector.

12
• Identify what services sectors have the highest labour intensity as well as
export potential in South Africa.
1.6 Research method
In order for the study to be successful a thorough literature review and empirical
study has to be conducted. The results of the above mentioned will help to provide
the necessary guidelines to determine which service sectors are the most
employment-intensive and their linkages within the South Africa economy.
1.6.1 Literature review
The literature review will address specific theoretical issues that form the basis of the
study. Firstly, relevant studies will be reviewed, in order to examine various
methodologies for identifying employment-intensive sectors. This will include studies
on export expansion as a method for job creation, as well as, studies including
methods for identifying employment-intensive sectors.
Secondly, the influences the services industry and its export sector have on the
economy will be explored, in terms of South Africa and the World. This section will
include reports and literature on the services industry and its influence in the world
economy.
1.6.2 Empirical study
The empirical study will aim to identify which service sectors in South Africa are the
most employment-intensive using the Social Accounting Matrix (SAM) model. This
will provide a means to determine not only the most employment-intensive sectors,
but also the linkages within other sectors. The definition for the Social Accounting
Matrix is, "a summary table, which refers to a given period, representing the
production process, income distribution and redistribution which occurs between
sectors, factors of production, actors in an economic system and the "Rest of the
World" (ROW), meaning, all actors outside the economic system being studied"
(Statistics South Africa, 2005).
The empirical analysis will include a GDP, Productivity and Labour Multiplier analysis
for all twelve service sectors included within the SAM model. Each of the above
multipliers is divided into direct, indirect and induced multiplier effects.
13
1.7 Chapter division
The chapters in this study are presented as follows:
Chapter 2: Literature Review on Export Expansion and Employment Creation in the
Services Industry
The aim of this chapter will be to provide the necessary background on trade theory
in terms of services. The development of international trade theories will be
discussed. Thereafter, theory in terms of job creation, as well as the relevant link of
exports on a macro- and micro-level will be discussed.
Chapter 3: South African services industry
This chapter will address the on-going problem of unemployment in South Africa,
and the government’s plans to create jobs through economic policy and export
expansion. The services industry will then be discussed within the World and South
African context. Thereafter, the services industries’ contribution to employment and
GDP will be discussed. Finally, the GATS and IPAP documents will be discussed in
more detail.
Chapter 4: Methodology of the empirical analysis
The methodology will provide an overview of the Social Accounting Matrix (SAM)
multiplier model and more specific explanations regarding the employment aspect of
the model. A discussion of the SAM multiplier decompositions will also be included.
Furthermore, the data used for the analysis will be described. Finally, the process
used in the empirical analysis, as well as the steps taken to process and analyse the
data will be discussed.
Chapter 5: Empirical analysis and results.
The empirical study will aim to identify which services sectors in South Africa are the
most employment-intensive using the Social Accounting Matrix (SAM) model. This
will enable us to not only determine the most labour intensive sectors, but also the
linkages within other sectors. The empirical analysis will include a GDP, Productivity
and Labour Multiplier analysis for all twelve service sectors included within the SAM

14
model. Each of the above multipliers is divided into direct, indirect and induced
multiplier effects.
Chapter 6: Conclusion and Recommendations.
This chapter will conclude and summarise the results of the empirical study and its
literature. The limitations of the study will also be addressed, followed by
recommendations for application of the study’s results and possible future studies.
This chapter will also provide brief summaries of all the chapters included within the
study.
15
Chapter 2: Literature Review on Export Expansion and Employment Creation
in the Services Industry
2.1 Introduction
Globalisation has changed the structure of the world economy; where companies
and individuals were previously not affected by economic events or activities, they
now share these prospects (Stutz & Warf, 2007). This change is forcing companies
not only to adapt to higher competition and economic change, but scope of business,
which is not only limited to the domestic economy, but expanded into the modern
global economy. Thus firms and sectors within domestic economies must become
more efficient in trade and production, in order to compete with the highly efficient
markets globally. The nations not competing in these highly effective markets are left
behind in terms of development and prosperity, and they are excluded from the
highly advantageous effects as well as the negative effects associated with a global
economy.
The trade in goods globally has not yet returned to the rapid pre-economic crisis
growth rates. After a sharp fall between 2008 and 2009, the growth in goods traded
was only 5.3% in 2010 and 1.7% in 2011 (UNCTAD, 2013). Regarding the services
industry, growth also remained moderate at 1% and 2%, but specifically international
tourism grew by 4% in 2012, which also represents 30% of world exports in services.
Other services such as international transport, which is the second largest category
within commercial services grew by 4.3% in 2012 (UNCTAD, 2013). The strong
growth in services exports could be partly attributed to the constant effort from the
WTO to create more liberalised international trade.
The objective of this chapter is to provide the needed background on trade theory
and studies focussed towards employment creation. Section 2.2 will address why
countries trade, where after the relationship between export expansion and
employment creation will be discussed in Section 2.3. The forward and backward
linkages within specific sectors will be discussed in Section 2.4. Thereafter, Section
2.5 will provide a conclusion for the chapter which includes a short summary.

16
2.2 Why countries trade: Trade theory
This section will provide the relevant background on trade theory and its context for
the services industry. The trade in goods and services has been one of the central
parts of capitalism and a major factor in the linking of various parts of the world.
Whether a country can export goods successfully is not only dependant on its
resources, but also the economic conditions, the available opportunities, the effort of
the producers to trade internationally and finally the ability of producers to compete
abroad. These production factors (resources) include labour, capital,
entrepreneurship, technology and land containing raw materials (Stutz & Warf,
2007). Some countries have the population (labour) to support large industrial
complexes, while others do not. Other countries are home to a large pool of workers
(labour) with the ability to run modern machinery, while some have scientists and
engineers specialising in research-laden products. Other countries have the specific
skill of entrepreneurs who are more capable and knowledgeable than others
(Francois & Hoekman, 2010).
Most of the international trade is directly linked to a country’s specific lack of natural
or human resources, which creates the trade in the specific lacked production
factors. This is either the trade in products or services, depending on the lack, or the
specialisation of the specific country. Thus, if country A is abundant in labour inputs it
will import capital inputs from country B, and export or trade in labour inputs. The
following section will provide background on specific trade theories linked to
international trade and trade in services.
2.2.1 Neo-classical Trade Theory
The forces of international trade can be thoroughly understood by the proper
understanding of the foundations of neoclassical economics. The foundations of
neoclassical economics were built by the two Swedish economists Eli Hecksher and
his pupil Bertil Ohlin. There were four results in neoclassical trade theory namely;
factor price equalization, Stolper-Samuels proposition, Rybczynski proposition, and
Heckscher-Ohlin proposition. This section will give specific attention to the
Heckscher-Ohlin proposition, where the results argue that a country will export the
specific goods which intensively use the abundant factor of production (Van
Marrewijk, 2007).

17
The Heckscher-Ohlin proposition postulates in a neoclassical framework, with two
final goods, two factors of production, and two countries with identical homothetic
tastes, a country will export the specific goods which intensively use the abundant
factor of production, which is either capital or labour. For example, if a country is
more capital abundant, it will export capital intensive goods; if the country is more
labour abundant it will export productions of labour intensive goods. Thus the
neoclassical theory is based directly on the supply structure of the economy, with
little attention given to the demand structure of the economy (Stutz & Warf, 2007).
The Heckscher-Ohlin theory argues that as the trade patterns develop, wage rates
will tend to equalize. Thus if a country specialises in labour intensive goods, the
abundance it has in labour diminishes and the marginal productivity of labour rises,
and wages will increase. In contrast with this, when a country specialises in capital
intensive production of goods, labour becomes less scarce, the marginal productivity
of labour falls, and wages will also fall (Stutz & Warf, 2007).
The factor endowment theory states that countries will specialize in production of the
commodities, which makes use of their abundant factors of production (labour,
capital, land etc.). The factor endowment theory can be summarized on two crucial
propositions:
Firstly, products need specific productive factors in different relative proportions. For
example producing agricultural goods, requires relatively more labour per capital
than manufactured goods which requires more capital per worker than most primary
goods. Thus the factor endowment theory assumes that some products are more
capital intensive than others produced in the economy. Secondly, countries have
different factors of endowment, for example a developed country like the United
States has large amounts of capital per unit of labour, and is thus defined as a
capital-abundant country. Other countries like Egypt, India and Colombia, have less
capital and more units of labour, defining them as labour-abundant countries. Thus,
in general, developed countries are more capital-abundant and developing countries
are more labour-abundant in their individual economies (Todaro & Smith, 2011).
Traditional international trade theory can be an important stimulator of economic
growth. This also enlarges a country’s consumption capacities, increases world
output, and provides access to scarce resources and worldwide markets for products

18
where poor countries would be unable to grow. Furthermore international trade tends
to create domestic equality through the equalization of factor prices, raising the
income of real incomes of trading countries, thus making efficient use of each
country’s resource endowments (Todaro & Smith, 2011). International trade also
helps countries achieve development; specifically in the sectors of the economy
where these countries have a comparative advantage, this ultimately can help create
more effective economies of scale (Francois, 1990).
2.2.2 Comparative Advantage Theory
According to comparative advantage theory the demand side of economic structure
diversified preference comes into play, which includes physical and financial
endowment creates demand for profitable trade. It is nearly impossible for an
individual or a country to be completely self-sustaining in its demand of the simplest
lifestyle (Todaro & Smith, 2011). Thus it would be more profitable to engage in the
specific activities to which they are most suited or have a comparative advantage in
terms of their natural abilities (skills) or resource endowment (Todaro & Smith,
2011). This creates the ability to trade in the specific product or service that the
individual or country is the most effective in producing. Thus specialization is created
based on when comparative advantage arises, even in the most primitive economies
(Todaro & Smith, 2011). When countries specialize in production and export of
specific goods and services, they have a comparative advantage over other
countries. This theory was introduced by economist David Ricardo (Stutz & Warf,
2007). He also assumed labour theory (value of goods reflect the necessary labour
that goes into the production) of value and thus ignored demand. In his theory David
Ricardo concluded that, nations will specialize in the production of the commodity
that uses the least amount of labour in comparison with other nations (Stutz & Warf,
2007). In order to develop competitive advantage, skilled labour, good education and
adequate technical training is needed. This should then lead to more constructive
innovation and specialization in order to create higher competitiveness in the global
economy.
Comparative advantage trade theory has long dominated international trade theory.
The theory for comparative advantage also indicates that labour and capital share
different gains from the influence of international trade (Thomas, 2008). Typically in
19
international trade, two main gains can be identified; firstly it enlarges the world
production possibility set and secondly, the gains are enlarged when inputs are
traded (Shiozawa, 2007). The theory for comparative advantage played a
predominant role in the policy case for globalisation and free trade. In contrast to
this, while accepted by most economists, some economists would question the
theoretical assumptions of comparative advantage regarding full employment and
the ability of markets to initiate the global allocation of production on the basis of
country relative efficiency (Palley, 2003). Comparative advantage is the production of
a commodity at a lower opportunity cost than any of the alternative commodities
produced in the country. Then any surplus produce of this specific commodity can be
exported, because it is more suitable to produce than the other commodities. The
theoretical critiques for the comparative advantage theory are increasingly joined at
a political level. Thus more members of the public and politicians are questioning the
actual benefits of globalisation and international trade. This also creates scepticism
around the actual benefits and future development created by international trade and
globalisation.
2.2.3 The New Trade Theory
The new trade theory developed from the work of Helpman and Krugman first in
1979 and then later in 1985, where they assumed that international trade between
countries with similar factor proportions occurs mainly in differentiated varieties with
the basis of increasing returns to scale (Van Marrewijk, 2007). These specific
principles do not fit into the Heckschner-Ohlin neoclassical trade theory which
discusses the development of inter-industry trade between countries as the result of
their relative factor endowments (Konchyn, 2008). The new trade theory mainly
focusses on the problems of international industrial specialization of advanced
countries, convergence of their demand and industrial structures, as well as the
development of international trade among developed countries, which has focus on
intra-industry trade.
Gomory and Baumol (2000) raised concerns regarding international trade, which
were developed further by Samuelson (2004). Their studies developed theory
regarding the actual benefits or gains distribution in international trade and global
production. Their findings addressed new avenues for the effects of trade and

20
revealed the potential convergence between institutional trade theory and neo-
classical trade theory. The convergence of this operates at multiple levels:
Firstly, they found that the expansion of trade into a global market may not have the
traditionally expected benefits, but on the contrary can create countries that benefit
and other countries that may not. Secondly, they further argue the emphasis of spill-
over of production methods between countries and the transfer of technology.
Thirdly, they linked the increasing returns to scale to Post Keynesian economics,
which emphasises the effects of increasing returns to scale in international trade.
However, Gomory and Baumol (2000) linked the level of productivity to market size,
which states that an increase in market size will have the effect of higher
productivity. Fourthly, they argue for strategic trade policy in order to create greater
returns from international trade. Finally, they analysed microeconomic theory, which
is the basis of conventional trade theory. Thus, their analysis is done on conventional
trade theory’s terms and strengthens the results on the effects of trade deficits on
investment and employment (Thomas, 2008). The new issue which was raised by
Gomory and Baumol, is the evaluation of comparative advantage and the impact of
the distribution of gains from trade. The distributions of these benefits are
determined by demand and supply conditions, and these conditions change over
time. One of the critical factors is global demand patterns. A country will benefit more
from trade if international demand for its products is relatively stronger, thus the price
will be driven upwards for the country’s exports. This will create higher profits in the
exported market.
2.2.4 Gravity Model
The gravity model is based on Newton’s theory on gravitation which states that any
two objects in space attract one another according to a force that is proportional to
the product of their masses and the distance separating the objects (Stutz & Warf,
2007). Thus the gravity model states that “the force of attraction between two objects
is decided by the distance between two objects” (Lei, 2011). This can be indicated
through the following formula:
Tij = AYiYj / Dij
21
In the above formula A is constant, i and j are individually a country, T ij would be the
bilateral trade between country i and country j, Y is the economic size and finally Dij
would be the distance between country i and country j. The section that follows will
discuss theory regarding employment creation with specific focus towards the
services industry.
The gravity model has been frequently used for the analysis of bilateral trade flows
between different countries. The formula normally takes into account the value of
trade flow between the countries, nominal GDP, size of the population, physical
distance, and any other factors influencing trade cost between the countries. The
GDP measures the production capacity for the exporting country and the absorption
capacity for the importing country. Physical distance is used as a proxy for transport
costs, where the population is used as indication of country size. Thus, the gravity
model is used to provide the estimated preference for trade between the specified
countries within the model, the two opposite forces determine the volume of bilateral
trade between countries (Lei, 2011).
2.3 The relationship between export expansion and employment creation
The previous section provided the needed theoretical background for trade and its
perceived effects on an economy. This section will provide background regarding
export expansion and employment theory, and more specifically on the effects that
export has on the domestic economy on employment. This will be followed by a
discussion of the theory regarding the creation of growth in employment, with more
focus towards the services industry.
2.3.1 Macro-level impact of increased exports on employment
The new trade theory created the discussion on dynamic and static advantages,
which a country can achieve through imperfect competition, which is gained under
free trade (Krugman, 1979). In traditional neo-classical trade theory, the gains from
international trade are the source of economic growth, which is maximized through
adjustment. This is achieved through the means of economic liberalisation of the
uneven factor and resource reallocation, maintained through import substitution and
export expansion. In the process of intensifying economic liberalisation and
intensifying functional market competition, the production factors start moving from

22
the inefficient industries toward the more efficient industries. This thus develops the
economic system and international trade optimally, in order to create economies of
scale.
Based on the neoclassical free-trade model, specific theoretical answers are given in
terms of influence of trade in goods or services on development. In this model, trade
is seen as an essential stimulator of economic growth (Todaro & Smith, 2011). It also
enlarges a country’s consumption capacity, increases world output, and provides
access to specific resources and products that poor countries would never have
access to (Todaro & Smith, 2011). These advantages provides countries with the
ability to achieve development by promoting and rewarding the sectors which the
country has a comparative advantage in, whether it is in terms of labour efficiency or
factor endowment (Van Marrewijk, 2007). Furthermore, it also results in advantages
in terms of economies of scale, which is maximum output reached by minimal input
for the specific production factors.
The benefits of exports can be summarised as “gains from trade”, which includes
higher competitiveness, knowledge transfer and allocative efficiency (Harcourt,
2000). Firstly, as firms have to compete with global firms, they have to be more
innovative, use better business practices and use technology more efficiently in
order to be competitive within a global economy. Secondly, when firms enter into
export they are exposed to international technology trends, international product
design and international consumer behaviour, which contributes to knowledge
transfers. This develops the competitive performance of the firms entering into
exports. Finally, evidence indicates that long-term international business survival
enjoys faster sales and faster employment growth than the firms not entering into
long-term international business (Montgomery & Tuladhar, 2013).
Multiple studies have tried to determine the specific linkages between exports and
employment growth, such as the study done by Kiyota (2011), which analyses
employment created by the expansion of Japanese goods and services exports. The
above was measured through an empirical analysis of 1975-2006 Japanese input-
output tables. Kiyota found that employment from exports were 9.9% of total
employment. The contribution from exports increased from 6.4% in 1990 to 9.9% in
2006 (Kiyota, 2011). Leclair (2002), conducted a study to determine the effect that

23
export competition had on manufacturing employment during the United States 1991
recession. The study found that $66 000 expansion in exports created approximately
one new job, but this was all dependant on the labour-intensity of the product
exported. Finally, the study concluded that export composition has reduced and
strengthened employment at times. Consequently if job creation is within national
goals the specific labour-intensive export sectors should be promoted (Leclair,
2002).
The department of Statistics Netherlands formulated a historical Social Accounting
Matrix model for Netherlands for the year 1938. The model was developed to focus
on specific aspects of the economy like; the labour force, inter-industry relations,
balance of payments, household consumption and unemployment (Den Bakker, et
al., 1994). This process comprised of decomposing private final consumption
expenditure by the type of services and goods by each category of household. They
found that on average, 31.8% of the consumption budget was for food, 5.5% was
used for tobacco and beverages, 16.5% for durable goods and dwelling services, 1%
to consumption abroad and 28.8% for other goods and services. Finally, they
analysed employment through various non-monetary data. For this specific analysis
two distinct categories of labour were used: breadwinners (defined as a married man
or an unmarried person) and non-breadwinners (all other persons not falling into the
former category). Through the employment analysis, they concluded that, the share
of breadwinners in employment ranged from 39% in apparel manufacturing and 74%
in transport, communication and storage. The actual values are not relevant to this
study, but the measurement used indicates inter linkage within the economy. Thus
the SAM model is relevant for indicating the effect that specific economic activities
have on employment in its sub-categories.
Jones (2010) used a Social Accounting Matrix to apply a multiplier analysis in order
to measure the backward linkages between tourism and the domestic economy of
Mozambique. Jones first constructed a standard SAM model. After developing the
standard model, the analytical input-output tables were applied. In the multiplier
analysis it was assumed that prices are fixed and preferences and technology are
also fixed. The employment multipliers used measured the expected job creation in
terms of tourism growth. The study found that employment creation in the tourism
industry is similar to the other services industries and, that job creation was higher in

24
the tourism sector than the manufacturing industry, thus motivating empirically the
inter-linkages between job creation and the services industry.
Freier and Steiner (2010) structured a multi-factor labour demand model which
distinguishes between eight labour categories. They used a panel data set for
Germany, and the model was developed for the total number of workers and total
working hours. This was further divided into skilled- and unskilled-labour in full-time
employment, by using the estimated coefficient for wage-elasticity for both working
hours and workers for each of the labour input categories in each of the industries.
The estimated labour demand elasticity showed that full-time skilled and unskilled
workers are both gross substituted.
Hao et al. (2012), analysed the impact of services trade on the services industry
labour demand elasticity. They used time series data of China’s service sector from
1982 to 2009. In order for them to measure the gross impact of exports on labour
demand elasticity, they developed a co-integration regression. The study firstly
concluded that China’s services exports had a stimulating impact on the labour
demand elasticity of the domestic service market. In the long-term they found that
the substitution effect is much more powerful than the output effect, but that in the
short-term the output-effect was found to be more powerful that the substitution
effect. Secondly, they found that they could not reject the hypothesis of no
relationship between import openness and labour demand elasticity of the services
industry in the long-term. When they studied the results in the short-run, the labour
demand elasticity is weakly influenced by trade liberalisation. They found that a 10%
increase in export penetration resulted in a 2.67% increase in labour demand
elasticity as an absolute value.
Kijong (2011) analysed the impact of policy targeting specific employment
programmes by using the Social Accounting Matrix. This study proposed the
modification of the model in order to analyse the multiplier effects of a new sector.
This is accomplished through different input compositions or technology, which
creates a conventional analysis of final demand injections on the existing sectors
invalid. The comprehensive use of input-output multiplier analysis enabled him to
map out the industry-level employment generation due to an application of an
external shock. After a 9.3 billion rand injection, based on the cost estimation

25
presented by Friedman et al. (2007), the shock implemented in the model measured
the indirect and direct effects on unemployment. This also expresses the distribution
of employment across different household types, and how much the job targets
countering inequality. As designed in the new sector formulation 78.5% of direct jobs
to the ultra-poor workers and only 2.8% indirect jobs go to the ultra-poor workers.
Also the unemployment rates decreased from 62.9% to 48.2% for ultra-poor
households. Additionally, the unemployment rates decreased from 62.9% to 48.2%
for ultra-poor households. Thus, a significant effect towards ultra-poor households
was found in the analysis.
Mitra (2011) conducted a study on the effect that trade in India has on employment
focussing on the services industry. He based the study on time-series macro-data,
as well as the indirect and direct effects of exports and imports on employment. This
was also divided into the effects of trade in formal and informal services. The value
added includes the impact of imports and exports. They separated their effect by
regressing the value added originating from a particular activity on total non-
agriculture value added, and all the imports and exports corresponding to that
activity. After they substituted the results into the first equation for formal services
sector employment, they then derived the indirect and direct effects of imports and
exports on employment. In the following step, they calculated the elasticity of the
services industry employment using data from National Sample Survey cross-
sectional data for the years 1999 to 2000 and 2004 to 2005. The concluding results
indicated that exports had a positive effect on employment in trade and hotel activity,
but had a negative effect in the transport and finance industry. Slaughter (1999)
conducted a study to determine if international trade has an effect on own-price
elasticity of demand for United States labour. This specific study formulated three
main conclusions. Firstly, the demand for labour inputs became more elastic, in five
of the eight manufacturing industries, for the years 1961 to 1991. Secondly, for the
same time span, non-production labour became less elastic in demand within all
eight of the tested manufacturing sectors. Finally, they had mixed results to support
the hypothesis that trade contributes to an increase in elasticity. The study also
concluded that elasticity decreases over time, thus having the contrary effect in the
long-term.

26
Sing et al. (2012) developed a model to forecast the labour demand for the
construction industry. It is a mathematical model developed through a distribution lag
model and labour multiplier approach. This is comprised from testing data from the
Hong Kong construction projections. The labour multiplier they used assumes that
there is a relationship between construction output and labour demand per unit of
construction. Thus the labour multiplier makes use of the correlation between
construction output and labour demand. The projected labour demand can then be
calculated by applying the corresponding labour multipliers calculated from labour
deployment divided by the project expenditure for the selected project. The
development of the model was done through four steps. Firstly, the model forecast
the possible future economic conditions in terms of Gross Domestic Product. Data
used in this step was quarterly time-series data of selected economic variables.
Secondly, they used quarterly time-series data of construction output for forecasting.
Thirdly, the labour multipliers forecast the labour demand in terms of man-days.
Finally, the labour demand is forecast for the number of workers required. The study
also concluded that it is highly important to select an appropriate economic scenario
in order to create an efficient model.
Thus, from the above studies the conclusion can be made that the increase of
exports had a predominantly positive effect on employment. Furthermore, these
studies also found prominent inter-linkages of services sectors within the economy.
The following section will discuss and summarise specific firm level studies regarding
the impact of an increase in exports on employment.
2.3.2 Micro-level impact of increased exports on employment
The gains from international trade are reflected as comparative advantage, based on
the differences in factor endowments and production technologies between the
trading countries revealed under free trade. Thus firm gains from international trade
are maximized when they increase their production facilities and consolidate this
through effective Mergers and Acquisitions in order to rationalize production, reduce
the average cost of production and thus creates better competitiveness in the
international markets. International trade also creates gain through increasing
returns to scale. This is achieved by increasing production size and lowering average
costs, which is illustrated by the following equation (Robert & Daniel, 2005):

27
TC = FC + (VC)X
TC = Total Cost;
FC = Fixed Cost;
VC = Variable Cost;
X = Output
Given the above formula average production cost is equal to total cost divided by
output. Thus the larger the production scale becomes, the lower the average cost will
be, if the variable cost is constant. Thus when the quantity produced is increased it
will effectively become cheaper per unit produced, resulting in more effective
production. The average cost is represented by the following equation (Robert &
Daniel, 2005):
AC = FC/X + VC
If a firm can become more efficient in the trade of financial services for instance, it
can play a prominent role in a nation’s economic growth. This will only be effective if
multiple firms can be highly competitive in the global market based in the domestic
economy. Cui and Shen (2011) conducted a study to empirically prove that an
increase in trade of financial services could stimulate economic growth. Firstly they
found that, there is a long-term relationship between trade in financial services and
economic growth. Secondly, according to the regression equation applied,
international financial services have a positive correlated effect on economic growth.
Thus, if a firm can combine international trade in financial services and become more
efficient by lowering the cost of producing the financial services, it has the effect of
economic growth for the domestic nation.
When a firm meets a specific output for a specific price of demand, it may produce a
different amount of output and employ a different amount of employees. Then the
question arises what amount of labour will be effective for the production of the
specific firm (Andrew et al., 2008). This is indicated in Figure 2.1. The effective
labour demand curve (see Figure 2.1 ND curve) indicates what amount of labour is
needed for a specific amount of output, with productivity, capital stock and effort held
constant (Andrew, et al., 2008).

28
The labour market equilibrium requires that the aggregate quantity of labour demand
is equal to the aggregate supply of labour. The classical model for the labour market
is based on the assumption that real wages adjust quickly to equate supply and
demand for labour. Thus, the assumption can also be made that when labour supply
is low for scarce workers, real wages will be higher, and conversely, when many
labourers compete for fewer jobs, real wages will decline.
Figure 2.1 Effect of supply shock on the labour market
(Andrew, et al., 2008)
A positive supply shock can increase the marginal product of labour and increase the
demand for labour at any real wage level (Andrew, et al., 2008). Thus the labour
demand curve indicated as ND1 shifts to ND2 and the labour market equilibrium
moves from point A to equilibrium point B. This shock causes real wage to increase
from W1 to W2, and increases the full-employment level of employment from L-1 to L-
2 (Andrew, et al., 2008).
By combining the labour market equilibrium (see Figure 2.1 for the labour
equilibrium) and the production function (which measures the relationship between
amounts of output compared to labour needed as an input for production), the
amount of output a firm wants to supply can be determined (Andrew, et al., 2008).
W 2
ND2
W 1 A
B
L1
Current real
wage
Labour, N- L2
ND1
NS

29
Full-employment (potential output), Y, is the level of output that the firms in the
economy supply when the prices have fully adjusted (see Figure 2.1 for the labour
equilibrium). Thus full-employment output is when the level of aggregate
employment is equal to the full employment level, N (Andrew, et al., 2008).
Y=AF(K,N)
The above equation indicates that, for constant capital stock (K), full-employment
output (N) is determined by two determining factors, namely, full-employment level of
N, and the production function relating output to employment (Andrew et al., 2008).
When referring back to the average cost formulation, it states that the increase in
production will result in more effective production (see Section 2.3.1). Thus when
production is increased, more labour is needed to increase labour- intensive
production. This increase in production creates a surplus in production which can be
exported into foreign markets. The surplus production strategy thus, creates
employment (higher labour inputs are needed) and also lowers the average cost of
production per unit (see Section 2.3.1). This is supported by the research by
Slaughter, where he found that international trade determines labour demand
elasticity through either the output effect (increase or decrease in output) or the
substitution effect (substitution of domestic products by products imported)
(Slaughter, 1999).
Greenaway et al. (1998) investigated the impact of trade on industry- level
employment for a sample of 167 manufacturing firms in the United Kingdom. They
built a dynamic labour demand equation and incorporated exports and imports in the
panel framework from 1979 to 1991. Their study indicated that the increase in trade
volumes, causes a reduction in the demand for labour. This is consistent with the
views that increased trade liberalisation will have the effect of more efficient and
productive labour which is utilized within firms. Thus they found limited evidence that
substitution of domestic workers for foreign workers increases wage elasticity for the
derived labour demand function. The study’s shortcomings included the fact that they
did not divide labour into its categories, thus labour demand elasticity was included
into one equation. Krishna et al. (2001) used Turkish plant-level data in order to
measure the effect of trade liberalisation on labour demand elasticity. They
estimated an equation for each industry used in the data pooled. In their study, they
30
were unable to find any empirical support for the theoretical link for the impact of
trade on labour markets, but in most cases they could not ignore the hypothesis of a
positive relationship between trade openness and demand elasticity.
The studies discussed in this section indicate that firms’ gains from international
trade are maximized when they increase their production facilities to reduce the
average cost of production, thus creating better competitiveness in the international
markets. International trade also creates gain through increasing returns to scale.
When a firm meets this output for a specific price of demand, it may produce a
different amount of output and employ a different amount of employees. Full-
employment is the level of output that the firms in the economy supply when the
prices have fully adjusted. The following section will discuss the results of studies
and reports given the inter-linkages which specific services sectors have with other
sectors within economies.
2.4 Forward and backward linkages within specific sectors
The previous section discussed the relationship between export expansion and
employment creation. This section will discuss the results of studies and reports
given the inter-linkages which specific services sectors have with other sectors within
economies.
One of the most prominent dimensions of interconnectedness of industries is the
nature of buyer and supplier linkages. The scale of buyer and supplier linkages into
the local economy is a factor of the output supported by industry operations and
indirect employment (Hewings, 1982). Output growth and disposable income of
lower income households have a strong linkage. The growth of output is linked
directly to final consumption and connected services, such as transport services and
trade (Maurizio & Claudio, 2007). Sectors which make the largest contribution to
domestic employment are not the same as the sectors with the highest inter-industry
linkages (Midmore, et al., 2006).
The services industry has started to play a more prominent role within the
manufacturing value chain, due to the production process being broken down into
increasingly smaller processes. More specifically, business services are becoming
an important input for the manufacturing of goods as well as services. In 2006, the
31
OECD conducted an input-output analysis, aimed at identifying how the
manufacturing and services industries interact in the production process. The most
prominent findings were as follows (Lesher & Nordas, 2006):
The business services industry has become a prominent contributor to GDP
growth within OECD countries.
Business services within OECD countries show stronger forward linkages
than the average forward linkage within the manufacturing industry. In
contrast to this, the forward linkages for the manufacturing industry are
stronger for developing countries.
Small and developing countries within the OECD gain from trade in business
services primarily from a more specialised and broader business service
supplier. The trade in business services results in more variety, which
increases welfare.
Thus, it was found that business services are becoming increasingly more important
for OECD countries. Manufacturers and firms use these services as intermediate
inputs, which also has significant spill-over effects (Lesher & Nordas, 2006).
Furthermore, the more specialised the services sector becomes, the more productive
the sector becomes (Hauknes & Knell, 2009). Services sectors such as food, health,
recreation, child care and similar household services, as well as retail and business
services, exhibit a strong role in supporting economic activity (Kay, et al., 2007).
Multiple countries, which were agriculturally based economies, have started to
transition into more services based economies. These, countries also rely
specifically on the strong impact of tourism, which has strong backward linkages
within the economy. Thus, sectors such as accommodation and eating and drinking
sectors provide goods and services to the end-users. Furthermore, the transport
sector, which specifically supplies tourist arrivals, exhibits strong forward linkages
(Pratt, 2010). The construction industry has also shown strong linkages with other
sectors in the economy. Research has found that construction uses manufacturing
as well as services as inputs for the industry. More specifically in developed
countries, the share of manufacturing inputs for construction has decreased over
time, where services inputs have increased, indicating stronger linkages with the
services industry (Rameezdeen & Ramachandra, 2008).

32
The foundation of backward linkages for services firms is the success of these firms
within foreign markets. These services firms also need internationally competitive
manufacturing industries as support. Furthermore, the knowledge-intensive business
services sectors are the new growth creators, and because of the backward
linkages, the lack of industrialised sectors in countries can prevent growth (Conti, et
al., 2014). Thus, it is important for the domestic sectors to have strong inter-linkages
before services are exported, so that the services industry uses the domestic
economy’s inputs for exporting.
Blancas (2006) conducted a study on the inter-industry linkage that detects the flow
of funds, by using the accounting multiplier approach in the Social Accounting Matrix
model. As an empirical application for the analysis, he estimated the accounting
multipliers and the financial and real linkage indices for the Mexican economy. When
applying the inter-industry linkage analysis and the Rasmussen’s method used in the
framework for the input-output model, he estimated and identified two types of
linkage indices. The forward linkage and financial backward indices are derived from
the Social Accounting Model accounting multipliers. Both the financial institutional
and production sectors’ transactions are measured through inter-institutional
analysis, which is estimated from the Social Accounting Matrix model’s flow of funds.
The analysis consisted mainly of cross-sectional representations of the economy,
monetary and financial accounts, accounting identities and standard empirical
relations that typify developing countries. The accounting linear multipliers used are
predominantly demand driven in Keynesian tradition, where the supply constraints
are ignored. The impact of total final demand is described as a round by round final
demand that, given an injection and or change in the system, will consequently lead
to a process of multiplier effects. Each account represented different types of
linkages at each stage of path followed by exogenous cash flow injections in the way
it impacts and enters each account in the process. Finally, he could identify from the
analysis that the economy indicated dependency not on agricultural activities but
rather on services activities and manufacturing activities, commercial banks and
private economic agents, which indicates a more developed economy. On the
contrary to this, he found that in the group and individual accounts displayed,
common problems of financial disintermediation.
33
The study conducted by Ruiz-Napoles (2004) measured the effect of Mexico’s
export-led growth strategy and trade liberalisation policy on employment. The results
for the input-output analysis indicated that there was a positive relationship between
an increase in manufacturing exports and direct and indirect employment. More
specifically, exports had a reduced effect on total gross output, because of a low
level of backward linkages between exports and the domestic economy. The reason
for this could be that because of higher imports of intermediary goods for
manufacturing, the domestic backward linkages were low (Ruiz-Napoles, 2004).
Uri and Mixon (1981) endeavoured to measure the changes in employment in
variation within different manufacturing industries. The evidence indicated that
changes in imports and exports had a significant impact on employment patterns.
The study concluded that employment in industries is dependent on increases in
exports (Uri & Mixon, 1981).
Shepherd (2013) concluded in his study of services exporting firms that the services
sector has rapidly grown in importance for the developing world. He also found that
services exporting firms have mostly similar attributes to firms that export goods,
including: higher productivity, higher growth rates, higher wages, higher investments
and they are systematically larger than domestic firms (Shepherd, 2013). Lei (2011)
concluded in his study that China can use the international trade of services to
improve economic growth.
From all the studies discussed on a micro level, one can conclude that services are
playing a prominent role in the value adding process for the manufacturing industry,
and these services sectors are also prominently linked within the economy.
Furthermore, the above macro- and micro-studies found prominent linkages between
export growth and an increase in employment levels. The following chapter will
discuss the role of the services industry as well as its exports play within the South
African economy. The chapter will also discuss the economic policies in place for
employment creation, and the inter-linkages of services sectors with other sectors.
2.5 Conclusion
International trade is directly linked to a country’s specific lack of natural or human
resources, which creates the trade in the specific lacked production factors. This is

34
either the trade in products or services, depending on the lack, or the specialization
of the specific country. Thus, countries are motivated to trade because of the inability
to be self-sustaining. The benefits of exports can be summarised as “gains from
trade”, which includes higher competitiveness, knowledge transfer and allocative
efficiency. Firstly, as firms have to compete with global firms, they have to be more
innovative, use better business practices and use technology more efficiently in
order to be competitive within a global economy. Secondly, when firms enter into
export they are exposed to international technology trends, international product
design and international consumer behaviour, which contributes to knowledge
transfers. This develops the competitive performance of the firms entering into
exports. Finally, evidence indicates that long-term international business survival
enjoys faster sales and faster employment growth than the firms not entering into
long-term international business (Montgomery & Tuladhar, 2013). Multiple studies
have tried to determine the specific linkages between exports and employment
growth.
Therefore, from all the studies discussed on a macro- and micro-level, one can
conclude that services are playing a prominent role in the value adding process for
the manufacturing industry, and these services sectors are also prominently linked
within the economy. Furthermore, the studies discussed in this chapter found
prominent linkages between export growth and an increase in employment levels.
Therefore it is important to understand this link between exports and employment
within the South African economy in order for both government and firms to make
better strategic decisions.
The following chapter will discuss the South African government’s plans to create
jobs through economic policy and export expansion. It will also discuss the influence
of the services industry and its exports on the South African economy.
35
Chapter 3: South African services industry
3.1 Introduction
The aim of the previous chapter was to discuss the relevant trade theory, specifically
focusing on employment and economic growth. Furthermore, it also motivated
theoretically the impact exports have on employment and economic growth. The
objective of this chapter will then be to discuss the on-going problem of
unemployment in South Africa, as well as the government’s plans to create jobs
through economic policy and export expansion. It will also discuss the influence of
the services industry and its exports on the South African economy.
Since 1994, after the restoration of democracy, South Africa has been under the
governance of a single ruling party, the African National Congress (ANC) that has
led the government policies since then. The country has experienced some
challenges over the years, namely, violent crime, high corruption and high
unemployment, which has caused a number of educated and highly skilled
individuals to leave the country to safer destinations like the United Kingdom, New
Zealand and Australia (Statistics South Africa, 2013). There are still some positive
indications, which bare positive outlooks for the future. South Africa is faring
seemingly well on governance indicators when compared to other African nations.
South Africa is also growing in its international influence, joining BRICS, and the
country also has prominent influence and relationships with neighbouring countries.
South Africa is also seen as the gateway into Africa, featuring on international
organizations such as the African Union and the Commonwealth of Nations (IHS
Global Inc., 2014).
However, unemployment remains a great problem in South Africa. The services
sector, however, has been growing in recent years and could provide a possible
means of creating more jobs, as will be explored in this chapter and the empirical
section. The chapter outline will firstly consist of the role that services has on the
South African economy in Section 3.2. Thereafter, the different economic policy and
action plans regarding employment in South Africa, and the influence this has on the
services industry will be discussed in Section 3.3. Furthermore, the inter-linkages
that the services sectors have with other economic sectors will be discussed in

36
Section 3.4. Finally, in Section 3.5 a brief conclusion and summary will be given of
this chapter.
3.2 The role of services in the South African economy
3.2.1 South Africa’s economy in recent years
The South African economy is the most developed in Africa, but has been passed by
the Nigerian economy in 2014 (IHS Global Inc., 2014). South Africa has indicated
economic growth of 4.25% between 2001 and 2008 (pre-crises), and 1.54% in 2009
due to the financial global meltdown. In 2010, the growth rate moved to 2.89% and
increased to 3.46% in 2011. This growth was stimulated by the expansion of the
secondary and tertiary sector.
In 2012 the growth rate slumped again to 2.55%, because of rising labour unrest,
higher inflation expectations, electricity supply constraints and the decline in investor
confidence. In 2013, South Africa indicated a GDP growth rate of 1.9%, which is
lower than 2012, indicating that the economy is struggling to create the needed
growth opportunities for South Africa (Statistics South Africa, 2013). All of the above
factors have contributed to the depreciation of the South African rand against the
main world currencies. The value of the South African rand has depreciated 22.3%
between May 2012 and July 2013, stimulated by factors such as the unrest at
Lonmin’s Marikana mine in August 2012.
The South African economy has indicated an average GDP growth rate of 2.2%,
throughout the years 2008 to 2012, whereafter the GDP growth rate lowered to 1.9%
in 2013. Alongside the relatively low GDP growth rate, the average inflation rate
between 2008 and 2012 was 6.7%, with a 5.7% inflation rate for 2013. Furthermore,
the South African Current Account was in deficit for the years 2008 to 2012, with an
average of -15.85 billion dollars, and a high of -26.6 billion dollars for 2013 (Statistics
South Africa, 2013).
The economy has struggled to create the needed growth for sustainable job creation,
with high labour unrest and industrial disputes, while the South African currency
weakened. The increased amount of industrial unrest represents a significant
downside for economic growth, where wage concessions would heighten inflationary
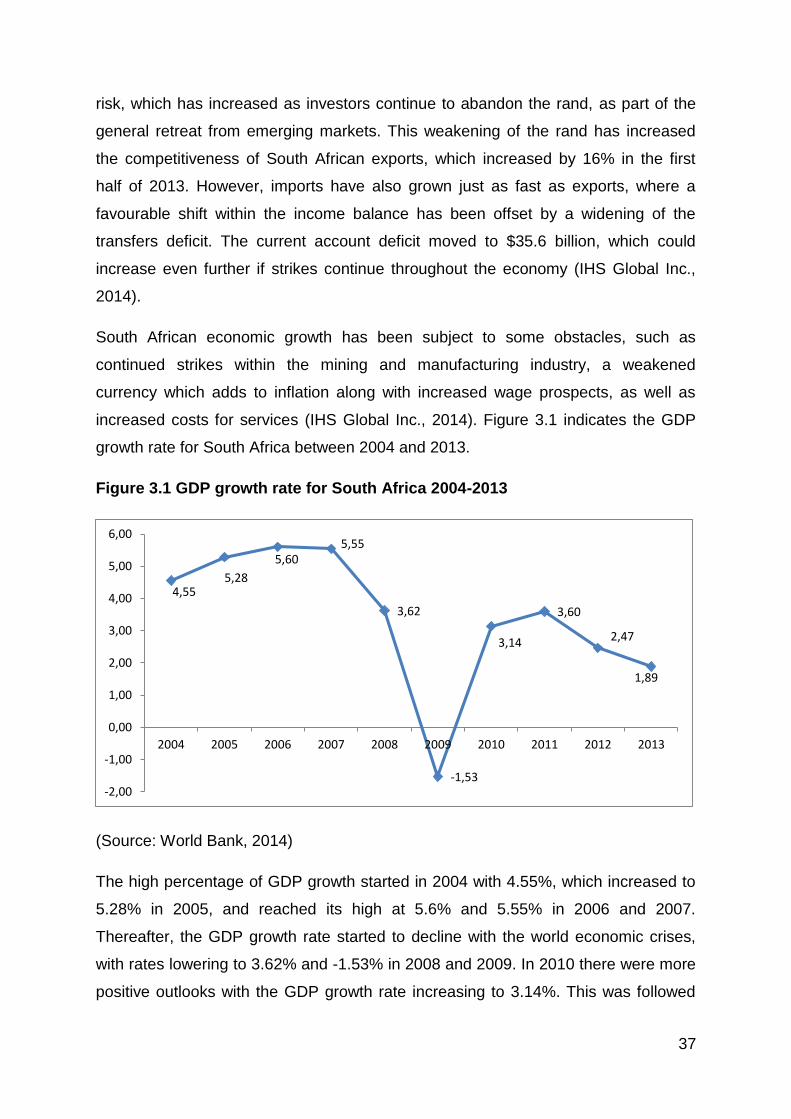
37
risk, which has increased as investors continue to abandon the rand, as part of the
general retreat from emerging markets. This weakening of the rand has increased
the competitiveness of South African exports, which increased by 16% in the first
half of 2013. However, imports have also grown just as fast as exports, where a
favourable shift within the income balance has been offset by a widening of the
transfers deficit. The current account deficit moved to $35.6 billion, which could
increase even further if strikes continue throughout the economy (IHS Global Inc.,
2014).
South African economic growth has been subject to some obstacles, such as
continued strikes within the mining and manufacturing industry, a weakened
currency which adds to inflation along with increased wage prospects, as well as
increased costs for services (IHS Global Inc., 2014). Figure 3.1 indicates the GDP
growth rate for South Africa between 2004 and 2013.
Figure 3.1 GDP growth rate for South Africa 2004-2013
(Source: World Bank, 2014)
The high percentage of GDP growth started in 2004 with 4.55%, which increased to
5.28% in 2005, and reached its high at 5.6% and 5.55% in 2006 and 2007.
Thereafter, the GDP growth rate started to decline with the world economic crises,
with rates lowering to 3.62% and -1.53% in 2008 and 2009. In 2010 there were more
positive outlooks with the GDP growth rate increasing to 3.14%. This was followed
4,555,28
5,605,55
3,62
-1,53
3,14
3,60
2,47
1,89
-2,00
-1,00
0,00
1,00
2,00
3,00
4,00
5,00
6,00
2004 2005 2006 2007 2008 2009 2010 2011 2012 2013

38
by poor performance of growth rates declining from 3.6% in 2011, to 1.89% in 2013.
Because the economic growth outlook for South Africa is not positive, and the
prospect of job creation also lowered, it is important that the public and private sector
strive to create employment and sustainable economic growth. This can only happen
if policy and the private sector goals are aligned to reach this goal. The following
figure indicates the GDP value added per sectors in millions of rand.
Figure 3.2 Annual value added by industry (percentage of GDP share in 2013)
(Source: StatsSA, 2013)
In 2013, the most prominent value addition to South African GDP was the services
industry (R2 327 795 million), with 77% of the value added portion. The
manufacturing industry (R350 345 million) and mining industry (R279 691 million)
followed, with 12% and 9% of value added respectively. Finally, the agriculture,
forestry and fishing industry (R72 431 million) had the lowest contribution of 2%.
Thus, the services industry has more than double the value added GDP contribution
within the South African economy. The growth in the manufacturing industry (12.3%)
was due to an increase in economic activity in sectors such as, food and beverages,
petroleum, chemical products, rubber and plastic products, motor vehicles, parts and
2,39%
9,23%
11,56%
76,82%
Agriculture, Forestry and Fishing
Mining and Quarrying
Manufacturing
Services
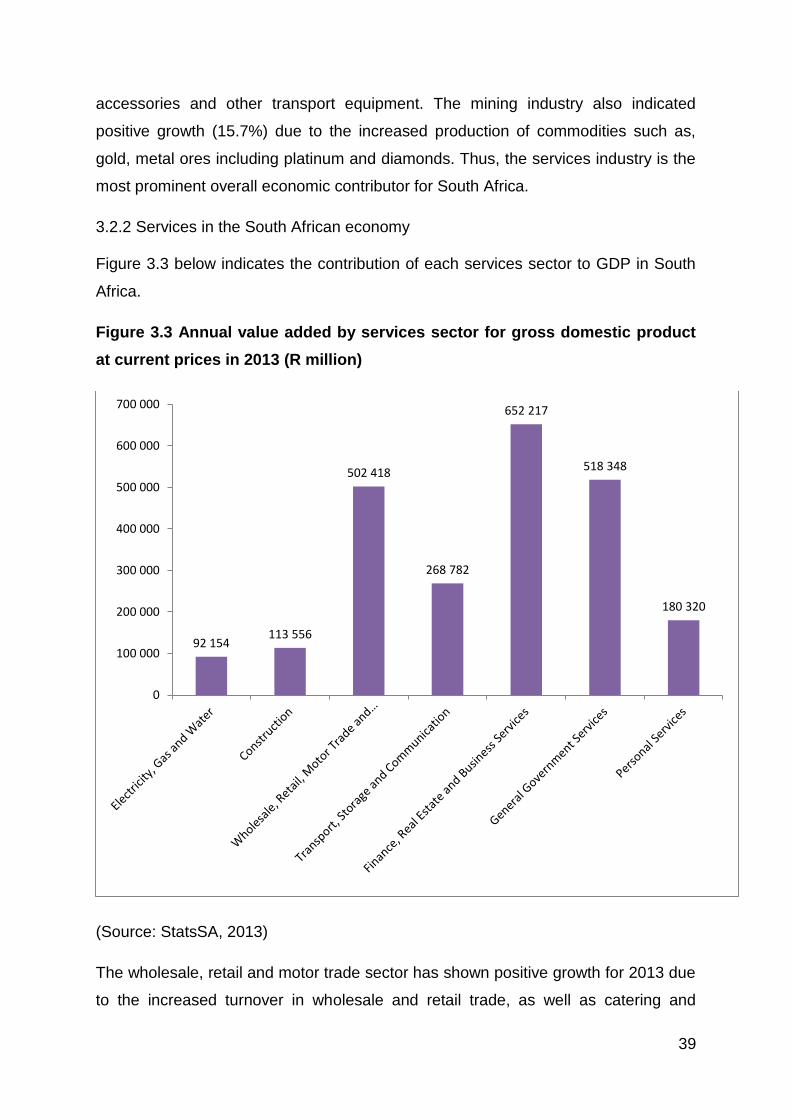
39
accessories and other transport equipment. The mining industry also indicated
positive growth (15.7%) due to the increased production of commodities such as,
gold, metal ores including platinum and diamonds. Thus, the services industry is the
most prominent overall economic contributor for South Africa.
3.2.2 Services in the South African economy
Figure 3.3 below indicates the contribution of each services sector to GDP in South
Africa.
Figure 3.3 Annual value added by services sector for gross domestic product
at current prices in 2013 (R million)
(Source: StatsSA, 2013)
The wholesale, retail and motor trade sector has shown positive growth for 2013 due
to the increased turnover in wholesale and retail trade, as well as catering and
92 154113 556
502 418
268 782
652 217
518 348
180 320
0
100 000
200 000
300 000
400 000
500 000
600 000
700 000
40
accommodation divisions. Thereafter, the increase in finance, real estate and
business services was due to the growth in commercial banking activities.
The most prominent sectoral performers for 2013 were finance, real estate and
business services which expanded from R598 billion in 2012 to R652 billion in 2013,
which represents a 21.5% of value added. The general government services industry
also indicated good expansion from R466 billion in 2012 to R518 billion in 2013,
which represents a 17.1% value adding in 2013. The wholesale, retail and motor
trade sector expanded from R455 billion in 2012 to R502 billion in 2013. The
transport, storage and accommodation sector expanded from R258 billion in 2012 to
R269 billion in 2013. The wholesale, retail and motor trade, transport, storage and
accommodation sector represents 16.6% of value added in 2013. Finally, personal
services expanded from R170 billion in 2012 to R180 billion in 2013, which
represents 11.6% of value added in 2013. The following section will provide the
relevant background on the export of services for South Africa between 2004 and
2013 (StatsSA, 2013).
3.2.3 South African export of services
The South African economy has strengths in its sound banking sector, its strong
tourism industry and investments in infrastructure. Firstly, South Africa’s banking
system is considered to be world class, with a strong regulatory and supervisory
environment, sufficient capital resources and innovative technology and
infrastructure. Secondly, in 2011 South Africa emerged as one of the most
successful tourist destinations in the world, with growing rates of visitors each year
(StatsSA, 2013).
South African exports have not seen exponential growth rates in recent years;
competitiveness remains constrained as the global demand remains below trend and
the rand remains volatile. Contributing factors for export constraints include
infrastructural impediments and slow global demand (IHS Global Inc., 2014). Figure
3.4 illustrates the percentage of GDP exported in terms of goods and services, as
well as the annual percentage of growth from 2004 to 2013.

41
Figure 3.4 South African exports of goods and services 2004-2013
(Source: World Bank, 2014)
The percentage of goods and services exports as a percentage of GDP has
remained consistent around the 30% margin since 2004, with the peak being in 2008
at 35.88%, where after it declined to 27.29% of GDP in 2009. From the year 2010
the percentage gradually started to increase again to the maximum of 31.14% in
2013. Thus, the trend seems to be moving upwards, and exports of goods and
services are playing a more prominent role as a contributor to GDP. When
comparing South Africa’s trade of goods and services with the United States, we find
that United States exports of goods and services increased by 2.8% in 2013 to a
record of 2.3 trillion dollars, which is 13.5% of GDP (International Trade
Administration, 2014). Thus, South Africa exports a larger portion of GDP than the
United States.
Figure 3.5 illustrates services exports in US dollars between 2004 and 2013, as
reported by Trade Map.
-30,00
-20,00
-10,00
0,00
10,00
20,00
30,00
40,00
2004 2005 2006 2007 2008 2009 2010 2011 2012 2013
Export of Goods and Services(% GDP)
Export of Goods and Services(Annual % Growth)

42
Figure 3.5 South African goods and services exports 2004-2013 in USD
(Sources: ITC, 2014)
The exports of goods grew consistently between 2004 and 2008, with a large decline
in 2009 (-37%) due to the global financial crises. Thereafter, the export of goods
increased to a new high in 2011 (23%), with a small decline in 2012 (-7%), where
after in 2013 (9%) exports increased again. The exports of services have grown
consistently since the year 2004, where a minor decline occurred between 2008 (-
8%) and 2009 (-7%). After 2009, services exports started increasing again, with low
volatility and a minor decrease in 2013 (-7%). Figure 3.6 illustrates the export of
services in South Africa, as divided per sector, for the years 2011 to 2013.
0
10000000
20000000
30000000
40000000
50000000
60000000
70000000
80000000
90000000
100000000
2004 2005 2006 2007 2008 2009 2010 2011 2012 2013
Total goods
Total services

43
Figure 3.6 South African services exports as per sector 2004-2013
(Source: ITC, 2014)
Industry 2004
%
Change
2004-
2005 2005
%
Change
2005-
2006 2006
%
Change
2006-
2007 2007
%
Change
2007-
2008 2008
%
Change
2008-
2009 2009
%
Change
2009-
2010 2010
%
Change
2010-
2011 2011
%
Change
2011-
2012 2012
%
Change
2012-
2013 2013
Travel 6512600 13% 7516130 7% 8119830 8% 8778780 -10% 7956170 -4% 7624450 16% 9085040 5% 9514970 5% 9995912 -8% 9244557
Transportation 1417250 8% 1533220 -3% 1487680 17% 1801240 -16% 1557230 -13% 1378120 15% 1615190 7% 1735610 0% 1730828 -1% 1721138
Other business services 742261 11% 837124 4% 868263 26% 1175430 2% 1200620 -11% 1083610 3% 1115380 9% 1231300 -9% 1131002 -13% 1003432
Financial services 425629 20% 534349 24% 705604 19% 875715 -9% 804886 -13% 715094 14% 827263 8% 901373 -1% 891159 -3% 868296
Government services,
n.i.e. 238172 8% 258906 14% 302009 6% 319879 22% 411300 -13% 364382 6% 386973 2% 396543 9% 436885 -5% 414790
Insurance services 105837 15% 124307 18% 152084 29% 214048 15% 251061 -12% 223226 18% 273046 15% 319478 -8% 295623 -11% 265563
Computerand information
services 89004 19% 109391 15% 128755 42% 222823 -10% 203161 17% 245242 15% 290021 9% 318755 -8% 294621 -12% 262445
Communications services 188542 2% 193004 26% 260336 -12% 232975 -11% 210145 4% 219212 1% 221746 -6% 208233 -12% 185263 18% 224580
Royalties and license fees 37392 17% 45302 1% 45784 13% 52914 2% 53738 -13% 47726 19% 59186 10% 6567 2% 67324 -7% 62818
Personal, cultural and
recreational services 87864 23% 113821 -10% 103347 -14% 90270 9% 98997 -36% 72797 -9% 66835 -1% 66457 -13% 58865 -8% 54359
Construction services 27977 19% 34553 14% 39980 26% 54356 6% 57950 -25% 46539 26% 62816 3% 65010 -7% 60853 -15% 52747

44
Figure 3.6 indicates that the export of services are growing and becoming a
prominent contributor towards South African GDP. The largest exporter within the
services industry is the travel sector, with substantial exports which peaked at 9
billion dollars. Analysis of the remaining services sectors within the South African
economy indicates that there can be a greater deal of growth in exports, with the
majority of services sectors exporting less than 1 billion dollars. The export of
services has also indicated volatility, where sectors have high growth rates in one
year and decreases in the following year. For example, a sector such as construction
services grew 26% between 2009 and 2010, and 3% between 2010 and 2011, and
declined by 7% between 2011 and 2012. The following section will discuss the
challenge of unemployment in South Africa and plans and policies in place to
stimulate economic growth.
3.3 Employment creation plans for the South African services sector
The previous section discussed the role that the services industry has on the South
African economy, as well as the contributions of the services industry exports. The
following section will address the ongoing challenge of unemployment within the
South African economy. This includes the specific plans and policies in place to
stimulate sustainable economic growth, job creation and export promotion.
Furthermore, we will also discuss the current employment division, as well as the
unemployment situation within the South African context.
3.3.1 Industrial Policy Action Plan (IPAP)
The South African unemployment rate of 25%, has indicated to be a problem for
policy makers. Even though the South African economy has seen some upside in
economic growth since the 2009 recession, the growth rate has failed to absorb the
needed South African labour force. South African has seen its labour force grow by
approximately 500 000 to 700 000 job seekers annually, as reported by Statistics
South Africa, whereas the economy has only been able to create about 460 000 jobs
annually.
The Industrial Policy Action Plan (IPAP) is framed by and constituted as a key pillar
of the programmatic perspective set out in the NGP (see Section 3.3.3). The
programmes set in IPAP 2014 reflect the constant readjustment and response to

45
shifting opportunities and demands, which are needed to keep this mandate alive.
The main goal of IPAP is to use the set of solutions for major fault-lines of South
Africa’s economic structure, to create a policy shift emphasis in favour of the
productive sectors of the economy. In order to deliver on the given objectives the
following key areas of intervention will continue (DTI, 2014):
i. Economy-wide
This will include stronger macro- and micro-economic policies, and greater
implementation. Furthermore, the stronger alignment of industrial policies and
programmes with the NEDP (see Section 3.3.2) will be implemented. Finally, better
alignment to specific sector strategies, particularly focused towards sectors in which
the domestic economy enjoys a global comparative advantage.
ii. Procurement
This will include efforts to secure compliance with existing public procurement
strategic supplier development measure and policies, with the overall aim to support
the manufacturing sector.
iii. Industrial finance
The strengthening of the alignment of industrial financing across the IDC (see
Section 3.3.2) and all DFI’s, through a mix of public and private sector spending.
iv. Development trade policy
The continued strengthening of developmental trade policies, which specifically
focus on selective and strategic tariffs (alignment with trade policy), more detailed
cooperation with the Customs Division of the South African Revenue Services
(SARS) and the steady strengthening of the capabilities and capacity of the
Standards, Quality Assurance, Accreditation and Metrology (SQAM) institutions.
v. Competition policy
The strengthening of interventional combat with anti-competitive and collusive
behaviour in both State Owned Companies and the private sector.
vi. Regulation and intellectual property

46
The creation of a regime to create a supportive environment for South Africa’s
industrialisation objectives like the Intellectual Property Rights (IPRs) regime.
vii. Innovation and technology
The implementation of new programmes and policies to strengthen the competitive
capabilities of the production and services sector.
The IPAP document is most prominently focused on the manufacturing industry,
because of specific reasons. The document states that these reasons include the
fact that the manufacturing industry has the highest employment and economic
multipliers. They also motivate that the manufacturing industry has high backward
linkages toward the primary industry, services industry and the entire value chain.
They also motivated that manufacturing must be central to their export strategy,
based on the labour-intensive and value-added tradable products, which has a
positive effect on the balance of trade. This includes the funding of the following
sectors to the value of (DTI, 2014):
R5.5 billion for the green industry;
R828 million in Chemicals and Allied Products;
R686 million in mining and minerals beneficiation;
R552 million in Metal, Transport and Machinery Products;
R396 million in Textiles and Clothing;
R334 million in Forestry and Wood Products;
R239 million in ICT;
R130 million in Agro-industries;
R6.6 million in Media and Motion Pictures;
R393 million in Healthcare.
Thus, the overall direction of the Industrial Policy Action Plan (IPAP) is focused more
towards the manufacturing industry (Department of Trade and Industry, 2010).
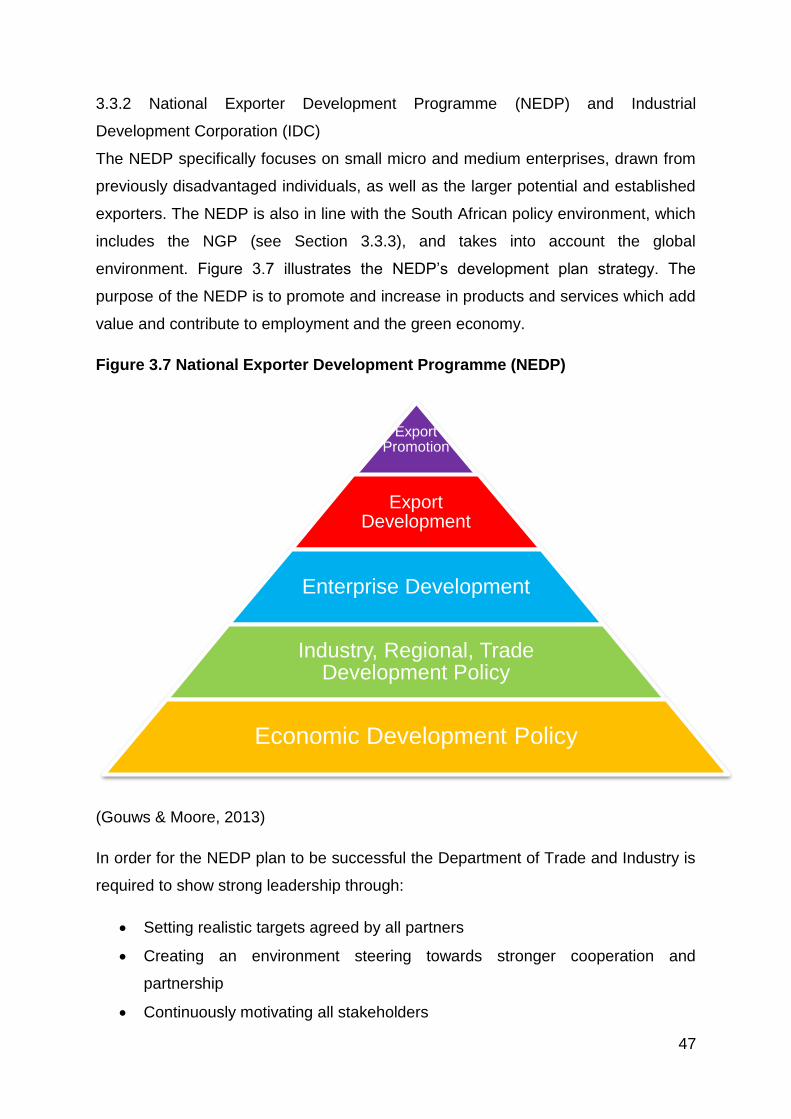
47
3.3.2 National Exporter Development Programme (NEDP) and Industrial
Development Corporation (IDC)
The NEDP specifically focuses on small micro and medium enterprises, drawn from
previously disadvantaged individuals, as well as the larger potential and established
exporters. The NEDP is also in line with the South African policy environment, which
includes the NGP (see Section 3.3.3), and takes into account the global
environment. Figure 3.7 illustrates the NEDP’s development plan strategy. The
purpose of the NEDP is to promote and increase in products and services which add
value and contribute to employment and the green economy.
Figure 3.7 National Exporter Development Programme (NEDP)
(Gouws & Moore, 2013)
In order for the NEDP plan to be successful the Department of Trade and Industry is
required to show strong leadership through:
Setting realistic targets agreed by all partners
Creating an environment steering towards stronger cooperation and
partnership
Continuously motivating all stakeholders
Export Promotion
Export Development
Enterprise Development
Industry, Regional, Trade Development Policy
Economic Development Policy
48
Establishing standards for all components of the NEDP
Ensuring that sufficient resources are available to implement the programme
Developing a monitoring and evaluation programme together with all partners.
The NEDP also has a vision to ensure the successful planning and implementation
of the plan. The mission of the NEDP includes the development of a pool of export-
ready companies, ensuring that new markets and products are developed to grow
exports, ensuring that effective resources are available for development, providing
leadership for exporters, facilitating collaboration between stakeholders in the private
and public sector, and monitoring the programme and ensuring continuous
improvement. The NEDP furthermore identified five phases of export development,
namely (Gouws & Moore, 2013):
“Phase 1: The Explorer is the enterprise that is exploring options for developing the
business, of which exporting might be a possibility.
Phase 2: The Export Aware enterprise has some idea of what exporting entails, is
export-ready in some aspects, but lacks basic export skills.
Phase 3: The Export Ready Company has the basics in place and needs to develop
an export marketing plan.
Phase 4: The Start-up Exporter is export-ready and has completed an export
marketing plan, which now needs to be implemented to achieve initial orders.
Phase 5: The Global Exporter may have been exporting for a number of years and
now needs to further penetrate markets, develop new markets, or develop new
products.”
The NEDP also supplies support services such as a national information network
including an export call centre, integrated export website, different levels of training,
mentoring arrangements and assisting with export promotion (Gouws & Moore,
2013:19).

49
3.3.3 National Development Plan (NDP) and National Growth Plan (NGP)
The National Development Plan (NDP) is South Africa’s long-term vision of an
equitable society. The NDP aims to reduce inequality and eliminate poverty by 2030.
The Commission that created this document believes that the country can create 11
million additional jobs by 2030 through (National Planning Commission, 2013):
Improving economic policy coordination and implementation
Building partnerships between the public sector, business and labour to
facilitate, direct and promote investment in labour-intensive areas
Raising competitiveness and export earnings through better infrastructure and
public services, lowering the costs of doing business, improving skills and
innovation, and targeting state support to specific sectors
Strengthening the functioning of the labour market to improve skills
acquisition, match job seekers and job openings, and reduce conflict.
They also state that in order to create economic transformation the rate of economic
growth must surpass 5% per annum. To bring this about they propose the following
implementations (National Planning Commission, 2013):
Increasing exports
More efficient and competitive infrastructure
Reducing the cost of living for low-income and working-class households
Reduced cost of regulatory compliance
A larger, more effective innovation system
Support for small businesses
An expanded skills base
Strengthened financial services
A commitment to public and private procurement
A higher rate of investment
A labour market that is more responsive to economic opportunity
Enhanced commercial diplomatic services
All of the above objectives complement the goals of the New Growth Path (NGP),
which will require businesses and labour to endorse a shared vision to accomplish
the 5% economic growth target per annum.

50
There is a growing consensus that inequality must be reduced, poverty must be
eliminated and the creation of decent jobs is needed, which can be done through a
new growth path founded on the restructuring of the South African economy. This
will create more effective labour absorption and improvements in performance
through higher economic growth, which is in line with the vision of the NDP (National
Planning Commission, 2013).
The basic objectives of the NGP are:
A comprehensive drive to enhance both social equity and competitiveness;
Systematic changes to mobilise domestic investment around activities that
can create sustainable employment; and
Strong social dialogue to focus all stakeholders on encouraging growth in
employment-creating activities.
As a first step towards economic reform the government will address the following
key sectors:
Infrastructure
the agricultural value chain
the mining value chain
the green economy
manufacturing sectors, which are included in IPAP2, and
tourism and certain high-level services.
These key sectors will be the drivers of economic growth and labour absorption and
will be developed in line with the NDP and IPAP documents. These key objectives
are also supported by the macroeconomic and microeconomic packages, which
ensure the containment of inflationary pressure and the enhancement of
competitiveness, as well as social equity and regional development.
3.4 Employment division in South Africa
South Africa continues to struggle with its high unemployment rate of 25%, which
may be due to structural problems such as; high real wages, rigid labour laws, high
levels of unionized labour force and the lack of the appropriate work skills. Even
though the South African economy has seen some upside in economic growth since

51
the 2009 recession, the growth failed to absorb the needed labour force. The South
African labour force is growing approximately between 500 000 and 700 000 job
seekers annually, as reported by Statistics South Africa, where the economy was
only able to create about 460 000 annually. In 2013 the employment outlook started
to look more positive as employment increased by 141 000, primarily because of the
increases of employment in the informal sector (123 000) and the formal sector (64
000) (Statistics South Africa, 2013). Figure 3.8 illustrates the employment division
within the agricultural, industry and services industries of South Africa, as a
percentage of total employment between 2004 and 2011.
Figure 3.8 Employment division of South Africa (% of total employment) 2004-
2011
(World Bank, 2014)
The highest percentage of total employment has remained within the services
industry since 2004, at a rate above 60%. This is double the combined employment
within agriculture and industry, with agriculture at 5% and industry at 25% of total
employment. Thus the services industry has contributed to the highest amount of
employment in South Africa. In 2014, the manufacturing industry indicated a 0.3%
(3000 employees) decline from December 2013 This was primarily because of the
0 10 20 30 40 50 60 70 80
2004
2005
2006
2007
2008
2009
2010
2011
Services
Industry
Agriculture

52
decline in sectors such as manufacturing of furniture, chemical products, dairy
products and plastic products. Within the services industry, sectors such as the
construction (5000 employees or 1.2%), financial intermediation, insurance, real
estate, business services (collectively 7000 employees or 0.4%) and community,
social and personal services (50 000 employees or 2.1%) saw employment growth
from December 2013 to March 2014 (Statistics South Africa, 2014). The following
section will discuss the relationship between the services industry and exports in
South Africa.
3.5 The relationship between employment and services exports in South Africa
The previous section discussed the ongoing challenge of unemployment within the
South African economy, which included the specific plans and policies used to
stimulate sustainable economic growth, job creation and export promotion.
Furthermore, the section also discussed the current employment division, as well as
the unemployment situation within the South African context. This section will focus
specifically on South African studies conducted to identify the effects of export
expansion within the domestic economy.
The European Union (EU) and China remain South Africa’s main trading partners.
South African agricultural exports have grown between 1997 and 2008. The exports
which did not stem from labour-intensive agricultural products indicated a decline in
low-skilled agricultural employment. It was concluded that there could be a negative
correlation between agricultural export expansion and low skilled employment
(Mbatha, 2011). Rankin and Schoër (2013) conducted a study on the relationship
between exports and wages at a worker level in South Africa. The results indicated
that firms that export to SADC countries’ wages are lower than firms producing for
the domestic market. Furthermore, the study concluded that firms exporting to
international markets pay increasing premiums for education, thus focusing on
educated and skilled labour (Rankin & Schoër, 2013).
Kucera et al. (2012), conducted a study on the effect of trade contraction and
employment in India and South Africa. The most prominent conclusion made was
that India and South Africa experience substantial employment declines as trade
contracts, specifically with the United States and the EU. The majority of these
declines occurred within the non-tradable sectors and were a result of income-

53
induced effects (Kucera et al., 2012). A study done by Naude and Rossouw (2011),
discusses the relationship between export diversification and economic performance
for Brazil, China, India and South Africa, or the BRICs. The study concluded that
GDP per capita changes are a driving force for export diversification. Furthermore,
the study found that the South African economy indicated a positive relationship
between export diversification and economic development.
The study conducted by Rangasamy (2009), evaluated the economic policy for
South Africa regarding export production as a growth indicator. The paper also
measured whether the emphasis on specific export production is justifiable. The
study concluded that deliberate policy measures which stimulated export production
contribute to the growth prospects of the South African economy (Rangasamy,
2009). Altman (2006) conducted a study which explored two different economic
scenarios for employment creation for South Africa, with specific focus on the
services industry. In the first scenario, current economic conditions remained
constant and the study concluded that unemployment remained the same. In the
second scenario, which included substantial improvement of economic policies,
specifically the promotion of trade in services, unemployment was reduced by 20%.
Therefore one can conclude that wages will increase as the skills and education of
labour increases. Furthermore, the studies indicate that trade stimulation fuels
economic growth and job creation. This raises the question whether an increase in
exports of services will lead to a significant increase in employment, and in which
specific services sectors the largest increase would be found. The answer to this
question could provide useful insights for policymakers as well as firms wishing to
make strategic decisions regarding export expansion. The following chapter will
discuss the methodology used in this study in an attempt to provide answers to this
question.
3.6 Conclusion
This chapter discussed the role that services has within the South African economy,
as well as the role the exporting of these services. Furthermore, the chapter also
discussed the specific policies used in South Africa to create sustainable economic
growth, job creation and export promotion, and the specific focus points of these
54
policies. Finally, it discussed the linkages that services sectors have with other
sectors within the economy.
The economy has struggled to create the needed growth for sustainable job creation,
with high labour unrest and industrial disputes, while the South African currency has
weakened. The increased amount of industrial unrest represents a significant
downside for economic growth, where wage concessions would heighten inflationary
risk, which has increased as investors continue to abandon the rand, as part of the
general retreat from emerging markets. This weakening of the rand has increased
the competitiveness of South African exports, which increased by 16% in the first
half of 2013. However, imports have grown also just as fast as exports, where a
favourable shift within the income balance has been offset by a widening of the
transfers deficit. The current account deficit moved to $35.6 billion, which could
increase even further if strikes continue throughout the economy. The most
prominent sectoral performers for 2013 were finance, real estate and business
services which expanded from R598 billion in 2012 to R652 billion in 2013, which
represents a 21.5% of value added. The general government services industry also
indicated good expansion from R466 billion in 2012 to R518 billion in 2013, which
represented a 17.1% value adding in 2013. The wholesale, retail and motor trade
sector expanded from R455 billion in 2012 to R502 billion in 2013.
The exports of services have grown consistently since the year 2004, where a minor
decline occurred between 2008 and 2009. After 2009, services exports started
increasing again, with low volatility and a minor decrease in 2013. The US export of
services totalled a record of 682 billion dollars in 2013, which is a 32.6 billion dollar
increase from 2012. The South African government has focused its policies
predominantly towards the manufacturing and agricultural industries, with little focus
towards the services industry. Multiple countries, which were agriculturally based
economies, have started to transition into more services based economies. The
services industry has proven to indicate high stability, as well as stable job creation.
The chapter also reviewed multiple studies regarding the role of exports within the
South African economy. Multiple studies indicated a positive role between export
expansion and job creation. Some of the studies also found that export expansion
has a negative relationship with low-skilled employment. Furthermore, export and

55
trade expansion for the services industry indicated a reduction in unemployment
within the South African economy.
The following chapter will describe the methodology that will be used for the SAM
Multiplier analysis, followed by a description of the development of the labour
multiplier for the empirical analysis of the services industry. The chapter will also
provide an overview of the Social Accounting Matrix (SAM) Multiplier model and
more specific explanations regarding the employment side of the model.
Furthermore, the chapter will also discuss the SAM Multiplier decompositions, and
the data used for the analysis will be described. Finally, the chapter will also discuss
the process used in the empirical analysis, and provide the steps taken to process
and analyse the data.
56
Chapter 4: Methodology of the empirical analysis
4.1 Introduction
The previous chapter discussed the on-going problem of unemployment in South
Africa, as well as the government’s plans to create jobs through economic policy and
export expansion. It also discussed the influence of the services industry and its
exports on the South African economy. The objective of this chapter is to describe
the methodology that will be used for the SAM multiplier analysis, followed by a
description of the development of the labour multiplier for the empirical analysis of
the services industry. Section 4.2 will provide an overview of the Social Accounting
Matrix (SAM) multiplier model and more specific explanations regarding the
employment side of the model. Section 4.3 will discuss the SAM multiplier
decompositions. In Section 4.4 the data used for the analysis will be described.
Section 4.5 will discuss the process used in the empirical analysis, and provide the
steps taken to process and analyse the data.
4.2 The Social Accounting Matrix (SAM) Multiplier Model
The SAM model explains through a general table of a region or nation, by listing the
regional or national economy accounting data within a square table. The SAM itself
is a tool used to study the interdependence of the economy accounts and industry
structures (Provide, 2003). Within the SAM model, two main methods are found. The
first method is the multiplier decomposition which reveals the multitude of the global
effect in the endogenous account. The second method is the structural path analysis
which indicates the mechanism and operations path of external injections.
4.2.1 Describing the Social Accounting Matrix (SAM)
A SAM contains information about the flow of resources associated with all
transactions in a specific period of time between specific economic agents (Provide,
2003). The initial theoretical development was done by Sir Richard Stone which
addressed the matter of integrating disintegrated production accounts. Thus the
main goal was to form a comprehensive economic-wide database, which included
information about all the productive activities in the economy, as well as
incorporating unproductive institutions and markets, such as capital markets, factor
markets, government, households and the rest of the world (Provide, 2003). Firstly, it

57
organises the information for the social and economic structure of the economy, and
secondly provides a statistical basis for plausible economic models (King, 1985).
Thus the acceptable definition for SAM is “a comprehensive economy-wide
framework presented in the form of a square matrix” (Lofgren, et al., 2002).
The objective of the SAM model is firstly to, organise the data when agents are
involved in transactions with one another and financial resources exchange hands
(Provide, 2003). Furthermore, SAM captures the transactions in the relevant
accounts, which indicates the direction of flow of resources. Thus, SAM forms the
complete database for all transactions that take place in a certain period of time, and
gives a static image for the economy for that period in time (Provide, 2003). The
comprehensive breakdown for SAM includes producers, governments, households,
all economic agents and the rest of the world. This is broken down even further into
capital, factor and commodity markets. SAM can be seen as intermediate clearing
accounts; the transactions recorded in the model are not limited to the purchase and
selling of goods and services, but rather include all transactions. Thus the model will
also include the purchasing of intermediate goods, hiring factors, current account
transactions for government, enterprises and households, such as inter-institutional
transfers, payment of taxes and consumption expenditure. As stated by Reinert, and
Roland-Holst (1997: 95), “Economic accounting is based on fundamental principle of
economics. For every income or receipt there is a corresponding expenditure or
outlay. This principle underlies the double-entry accounting procedure that makes up
the macroeconomic accounts of any country.”
The SAM reveals links between economic accounts, by integrating all kinds of
economic flows. Figure 4.1 below indicates the relationships in the SAM model
through a flow diagram of the economy. Figure 4.1 indicates transfers and real
transactions between institutions and sectors. The productive activities purchase
capital inputs, labour and land from factor markets and the intermediate inputs from
the commodities market, which are all used to produce goods and services. These
inputs are supplemented by an import (I), which is then sold through the commodity
markets to households (H), the government (G), investors (X) and foreigners (F).
Each institution’s expenditure becomes another institution’s income, as indicated in
the flow diagram. To use an example, the government and household purchases of
the commodities provides the income that producers need in the production process.

58
Furthermore the inter-institutional transfers, such as savings and taxes, ensure that
the circular flow of income is closed, thus ensuring that all expenditure flows are
accounted for. The SAM model has the following advantages: it links macro-
economic indicators, gives an overall summarised perspective of an economy,
enables multiple factoring and multiple sectoring, enhances the reliability of statistics,
contributes to increased relevance and reliability in national accounts and it pinpoints
gas in available datasets (Statistics South Africa, 2005).
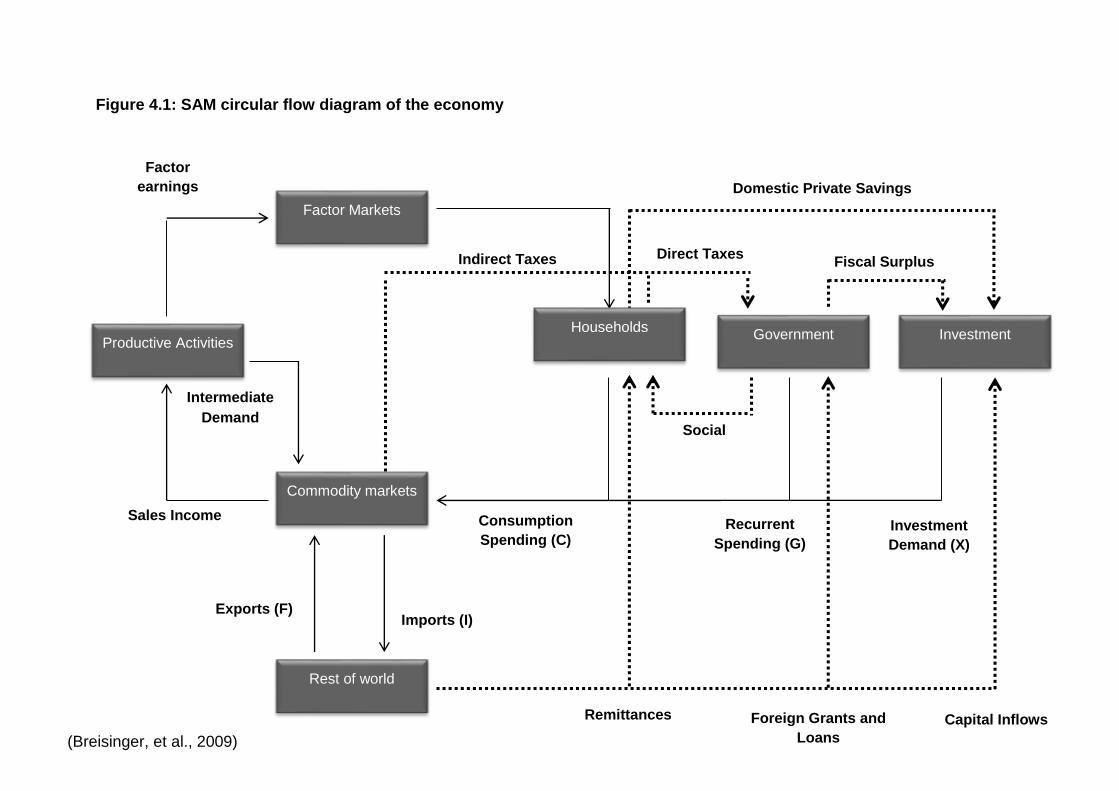
59
Factor Markets
Government Investment
Commodity markets
Rest of world
Productive Activities
Factor
earnings
Indirect Taxes Direct Taxes Fiscal Surplus
Remittances Capital Inflows Foreign Grants and
Loans
Imports (I) Exports (F)
Recurrent
Spending (G)
Investment
Demand (X)
Intermediate
Demand
Domestic Private Savings
Figure 4.1: SAM circular flow diagram of the economy
Households
Social
Transfers
Sales Income Consumption
Spending (C)
(Breisinger, et al., 2009)

60
The following section will provide an overview on the specific assumptions used in
the SAM model. This is followed by descriptions of the formulas used and the
structure of the model.
4.2.2 Social Accounting Matrix (SAM) equations, assumptions and structure.
The SAM model indicates in a quantitative manner the interdependence of all agents
and economic activities over a specific time frame in a specific economic area. Thus
the SAM model captures income and household consumption linkages, which then
captures the full effects of changes in the economy (Breisinger et al., 2009). In the
SAM model, total output equals demand as indicated by:
z = Bz + x
In the above equation z indicates or is equal to total output, and Bz equals the sum
of endogenous demands, and x exogenous demands. In this equation the
endogenous production, value-added, and household expenditure as shares of total
expenditures is represented by B. The exogenous account includes the capital
account, government account, as well as domestic and foreign trade. Thus the
above equation can be used to determine the impact of change in exogenous
demand on the total output, which includes all changes in endogenous demand
resulting from the exogenous change. The changes in the formula can be illustrated
as follows:
z = (I-B)-1x = Mx,
Where M = (I-B)-1
So that ∆z = M∆x
As indicated above, the matrix represented by M captures the impact that exogenous
change (shock) in demand has on endogenous production, value-added, and
household expenditures (Boshoff & Plessis, 2009). Thus the model reflects that the
increase in demand for specific sectors creates demand for intermediate goods
produced by other firms. The impact then is that these firms pay their employees
additional wages to produce the extra goods, and the workers, as consumers in the
market, spend their additional income on goods and services in the economy. Thus
in the equilibrium, the vector which is indicated by ∆z summarises for all factors,

61
firms and households in the specific economy the direct effects and indirect effects in
the form of household expenditures, new wage payments and producer supply
feedbacks.
It can then be concluded that, each sectoral multiplier represents the induced flow of
income to one account for services performed for another account, the result of one
unit change in exogenous expenditure placed in another sector. If the exogenous
change in demand is for goods, the multiplier is a production multiplier. If the
exogenous flow is directed towards households, then the multiplier is an income
transfer multiplier. This study will specifically be focussing on the change in
employment (employment multiplier), indicated by the change created in
employment by the increase in output of a specific sector.
The general application for the SAM model can be weakened, through its underlying
assumptions. Firstly, income elasticity is assumed to be equal to 1. The implication
of this is then that the SAM multiplier model understates the increase in household
income, for the demand in luxury goods, and then on the contrary over states the
impact on demand for necessities (Breisinger et al., 2009). Secondly, fixed prices in
the model imply that that only quantities adjust to clear markets. Finally, the SAM
model is demand driven, implying that the supply response is perfectly elastic,
meaning that downstream industries are able to maintain the flow of intermediate
goods and that there are always under-utilised resources to meet the increases in
demand. The SAM model also implies that employment gains and losses are
permanent and instantaneous (Provide, 2003). These assumptions are, however,
relatively harmless when a small shock is applied. In the long run, the small shocks
are too small to have a significant effect on prices. They also do not result in supply
shortages, and given that it is small changes in consumption triggered by the small
simulated shocks, the marginal consumption propensities will not vary greatly from
average propensities (Wobst, 1998).
4.2.3 Components of Macro-SAM and Micro-SAM
The SAM can be separated into either a macro-SAM or a micro-SAM. A macro-SAM
will provide the main macroeconomic characteristics of the economy, and will set the
basic data framework for the further development of a Micro-SAM (Wobst, 1998). In
the Macro-SAM each activity will produce one or more commodity using factor

62
services and intermediates. Also commodities are supplied by activities and imports,
through demand for exports and domestic final and intermediate use. In a Macro-
SAM the factor services is produced by capital, labour, land and then other natural
resources. It also includes entities that own factors, which consumes and invests,
also receives or pays taxes and transfers.
A Micro-SAM partitions certain accounts into more detailed classifications. It includes
the disaggregation of accounts for commodities, activities, households and factors.
Micro-SAM more specifically shows how different household groups earn and spend
their incomes. For the purposes of this study, the Macro level SAM will be used.
4.2.4 Division of sectors by the Social Accounting Matrix (SAM)
The SAM model for South Africa is comprised of 48 sectors (activities), which
includes the services industry with 12 main services sectors namely (StatsSA, 2012):
1. Electricity: Electricity, gas, steam and hot water supply
2. Water: Collection, purification and distribution of water
3. Building and Construction: Building, specialists trade contractors, building
installation, building completion. Site preparation; construction of civil
engineering structures and construction of other structures; renting of
construction/ demolition equipment with operators
4. Trade: Wholesale trade, commission trade (except of motor vehicles and
motor cycles), retail trade; repair of personal and household goods, sale,
maintenance and repair of motor vehicles and motor cycles and retail trade in
automotive fuel
5. Accommodation: Hotels, camping sites, other provision of short stay
accommodation; restaurants, bars, canteens
6. Transport: Transport, supporting and help activities related to transport
7. Communication: Post, courier activities and telecommunications
8. Finance and Insurance: Financial intermediation, insurance and pension
funding
9. Real Estate: Real estate activities
10. Business Services: Other business activities
11. General Government Services: Other individual and collective general
government

63
12. Community, Social and Personal Services: Human health, veterinary and
social work activities. Education, other services and other activities n.e.c.
The above-mentioned sectors will be used within the empirical analysis.
4.3 Multiplier decompositions
In the development of a simple multiplier model, the first step is to decide which
accounts should be exogenous and which should be endogenous. Normally, the
transactions in the government account, the capital account, and the rest of the
world account are regarded as exogenous. This is because of the fact that
government is determined by policy, and the external sector is outside domestic
control. Furthermore, because the model has no dynamic features, investments is
exogenously determined (King, 1985). The corporate enterprises are treated as
either endogenous or exogenous determinants. In the simple multiplier model, the
endogenous accounts are all production activities, all factors of production, and
households and private institutions. By defining the endogenous transactions, two
sets of agents (production activities and households) interacting in two markets
(factors and commodities) are identified.
In Table 4.1 below the simplified Social Accounting Matrix (SAM) is illustrated. As
stated above, it is necessary to divide accounts into endogenous and exogenous
accounts before any quantitative analysis can be done. In the simplified SAM as
illustrated in Table 4.1, endogenous accounts include three activities, factors and
institutions (US Department of Commerce, 1997). The activities account illustrates
the integration of all production activities. The factor account will include the
production factors such as capital, land and labour. Finally, the institutions account
includes households and enterprises, where households are partitioned as residence
and income level. The exogenous accounts are indicated by capital, government and
the rest of the country (US Department of Commerce, 1997)
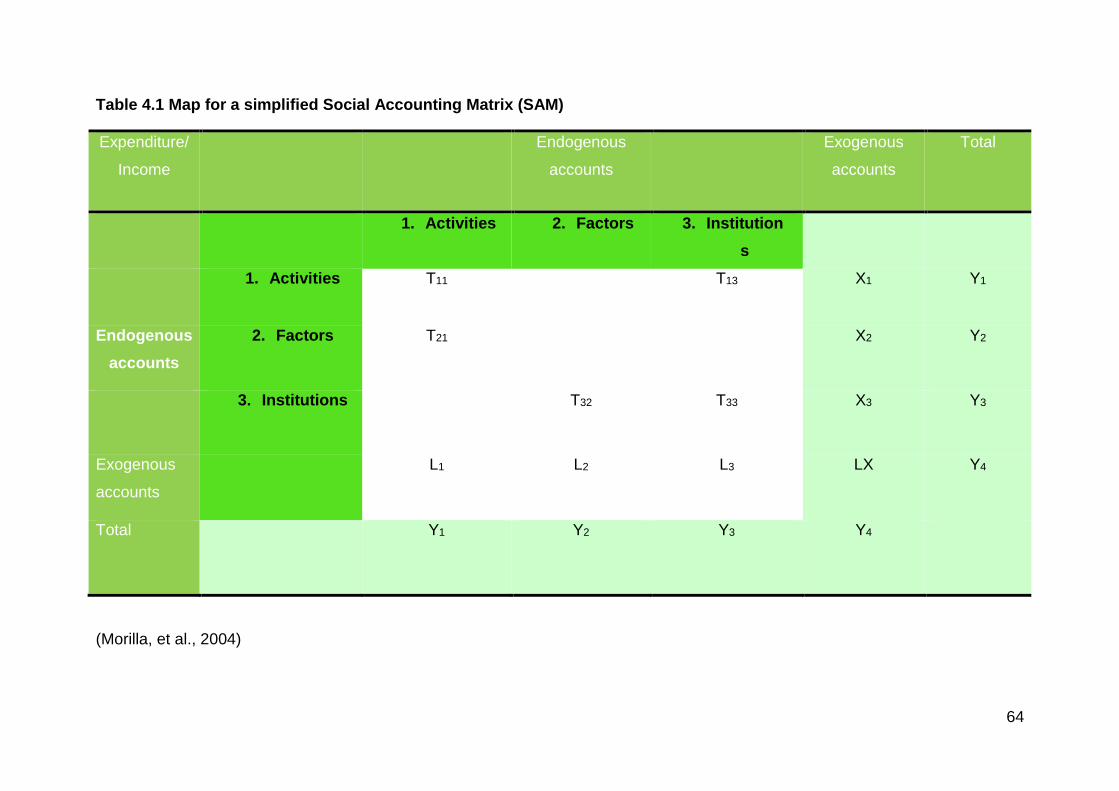
64
Table 4.1 Map for a simplified Social Accounting Matrix (SAM)
Expenditure/
Income
Endogenous
accounts
Exogenous
accounts
Total
1. Activities 2. Factors 3. Institution
s
1. Activities T11 T13 X1 Y1
Endogenous
accounts
2. Factors T21 X2 Y2
3. Institutions T32 T33 X3 Y3
Exogenous
accounts
L1 L2 L3 LX Y4
Total Y1 Y2 Y3 Y4
(Morilla, et al., 2004)

65
In block T11 the demand for intermediate inputs among production activities are
captured, which is the flow of the input-output table. Then in block T13 the
expenditure mode on products of various institutions are captured. Then in block T21
the value-added created by the production activities among all factors is captured.
Then in block T32 the distribution of factor income different enterprises and
households is captured. Then in block T33 income transferred within institutions,
among enterprises and various groups of households is captured (Breisinger, et al.,
2009).
The SAM model can be used as the basis for a simple modelling, under assumptions
such as fixed prices, demand orientation and linear relationships among all the
economic accounts (Jones, 2010). In order to get the numerical value of each
required element, the corresponding element of the SAM must be divided by the total
of the column which contains the element. By using the An to denote the matrix
average expenditure and then according to the pattern of 3 x 3 endogenous
accounts block An in the simplified SAM, it is found that (Wobst, 1998):
A11 0 A13
An = A21 0 0
0 A32 A33
The totals of column and the corresponding row are equal in the SAM model, and
the total income of endogenous accounts is indicated by the following (Breisinger et
al., 2009):
yn = An yn + x
If the equation is transformed, then the relationship between the endogenous
incomes yn and the endogenous injections are indicated by x.
yn = (I-An)-1 x = Max
In the matrix Ma, which is called the accounting multiplier matrix, it reflects the basic
interflow of data flows of the SAM model. This specific matrix forms part of the core
within the SAM framework. The Ma matrix also reflects all the global effects of the
exogenous injections (xi) on endogenous accounts (yj). When we decompose the Ma
66
matrix, we can also understand the effects caused by exogenous injections
(Statistics South Africa, 2005).
4.4 Description of the data used in the South African Social Accounting Matrix
(SAM) model
The previous section discussed the decomposition of the SAM model in general,
which gives the description for constructing a Social Accounting Matrix model. The
following section will discuss the data composition used in the construction of the
South African SAM.
4.5 South African Social Accounting Matrix (SAM)
The previous section discussed the data composition used in the construction of the
SAM model. This section will discuss the development of the South African SAM
model. This will be comprised of firstly the SAM model on the national level,
secondly the specific model design for labour demand in the services sectors, and
finally the effects of export expansion on the labour multiplier developed.
4.4.1 SAM model on a national level
The South African SAM model includes 26 different household and sectoral surveys
for the year 2000, which includes expenditure and income as well as labour surveys.
The labour factors are broken into educational attainment, which is a proxy for skill
level, as well as gender, to generate four different labour factor groups. Further, the
households are divided into urban and rural areas, residence type which is formal
and informal housing, race which includes African, Coloured, Asian and White, and
finally income level which is divided into ultra-poor for the below 25 percentile, poor
between 25-50 percentile, and non-poor for the above 50 percentile. This ultimately
generates 20 household types. The South African SAM model also identifies the
specific flows of income towards the different types of households. This is indicated
through the income distribution matrix, which also indicates income flow across both
gender and skill levels (Kijong, 2011).
There are also three additional accounts added into the South African SAM model;
firstly, unskilled male and female labour and secondly, an EPWP sector which
employs this unskilled labour, and thirdly, the inputs used to produce the EPWP
67
output. With the inclusion of these additional accounts, some assumptions and
procedures are also added. The first assumption would be that the sector does not
have any leakages, such as capital accumulation, taxes and trade. This assumption
then keeps the process simplified by keeping the reformulation within the
endogenous accounts. In addition to this, the data for the leakages are not available.
The second assumption is that the sector does not hire economy-wide unskilled
labour, but instead hires the unskilled labour from poor and ultra-poor households.
Then the skilled labour is employed on an economy-wide basis. The second
assumption is necessary for incorporating employment targeting for the poor and
ultra-poor households as mandate. The earned income from the EPWP sector is set
as a tiny fraction of the total earned income. In order to derive the multipliers for the
income effect of the EPWP, the shares by household type is used to the
corresponding column sums (Davies & Thurlow, 2013).
The third assumption deals with the spending of the earnings in the EPWP. It is
assumed that households spend all their income, which is a small fraction of
originally earned income, on purchasing services. This assumption is necessary to
keep the original household expenditure data used in order to avoid rebalancing of
the South African SAM. Total expenditure by households, which is the column sum,
remains equal to total income by the household type, which is the sum of the row.
The average expenditure is a fraction when compared to the total consumption by
the household type. This assumption will allow the researcher to balance the
household expenditure account and keep the equilibrium in the market. The fourth
assumption deals with the input-output accounts, which is that the monetary value of
services and goods in the sector used in the production process matches sector-by-
sector with the monetary value of output used as inputs by other sectors. In this
assumption the original input-output matrix remains the same; given the fact that the
prior input-output model had a lack of data, the assumption is necessary for
balancing the entire system without estimations. The average expenditure and
associated multipliers are extremely small. These small values ensure that the
hypothetical input-output section is excluded in the multiplier analysis process
(McDonald, et al., 1997). The following section will explain how the South African
SAM can be used for the purposes of this study, which includes the application of the
productivity, GDP and labour multipliers.

68
4.4.2 Model design for productivity, GDP and labour within the services sector
For the purpose of this study, the South African SAM model will include specific
focus towards labour multipliers for the services sectors in South Africa. The aim of
this study is to determine the most employment-intensive services sectors and its
linkages with other sectors within the South African economy, in order to determine
recommendations for policy makers towards sustainable economic growth and job
creation. This can be done by using the SAM and applying a “shock” to the data to
determine the spill-over effects between services and the other sectors in the
economy. These spill-over effects can be measured in terms of spill-over to
productivity, GDP and labour. Therefore all three spill-overs will be measured and
discussed in this study.
In the simplest form of the labour multiplier, it is assumed that there is a direct
relationship between services sector output and the demand for labour in that
specific sector. Fundamentally, the labour multiplier makes use of the correlation
between services sector output and demand for labour in this sector. If a fixed labour
multiplier is assigned to a specific work trade as services sector output, then
subsequent labour demand can be determined (Persad, et al., 1995). The use of this
model is deemed as reasonably reliable (Proverbs, et al., 1999). Even if this
approach is straightforward, the application of the model requires detailed analysis
parameters such as service sector output. The following equation describes the
labour multiplier used in the model:
Mi = Di/Ci
Mi = labour multiplier of the sector i
Di = labour used for sector i
Ci = expenditure for sector i
The labour demand for service sector is indicated by the following equation:
Di = MiEj
Di = projected labour demand for sector i
Ej = projected expenditure for service sector

69
This labour multiplier approach assumes that the demand for labour is a function of
output. Using the collected data in the SAM model, the labour multipliers for each
sector are divided by the labour deployment with sector expenditure of each sector.
The final economic base labour multiplier is illustrated by the following equation:
T = B + N
T = Total Employment
B = Basic employment in the specific sector
N = Non-basic employment in the specific sector
M1 = T/B
M1 = Total employment generated per basic employment
Thus the equation illustrates the employment created for a specific sector in the
service industry. This formula will indicate the amount of change in employment for a
specific service sector. In this equation we assume that a profit maximising firm will
employ labour where it is at the same level as marginal revenue product of labour
(Greenaway, et al., 1998).
4.4.2.1 Formulation of the multipliers
The input-output table is the subset of the SAM made of the activity and commodity
accounts only. In order to simplify the model, activities and commodities have been
aggregated. Input-output tables are used to assess the impact of final demand of a
given sector. The theory used for this model is based on the Leontief model. This
section will discuss the process and formulation of the production, GDP and labour
multipliers for the input-output model used in the empirical analysis of this study
(Blancas, 2006).
The aim of the model is that the amount of sectors i’s output required for the
production of sectors j’s output Xij is assumed to be proportional to sector j’s output
Xj. Therefore, if aij is such an input-output coefficient, then:
Xij = aijXj, i, = 1,…,n.
The equilibrium for total demand and total supply for each sector is written as:
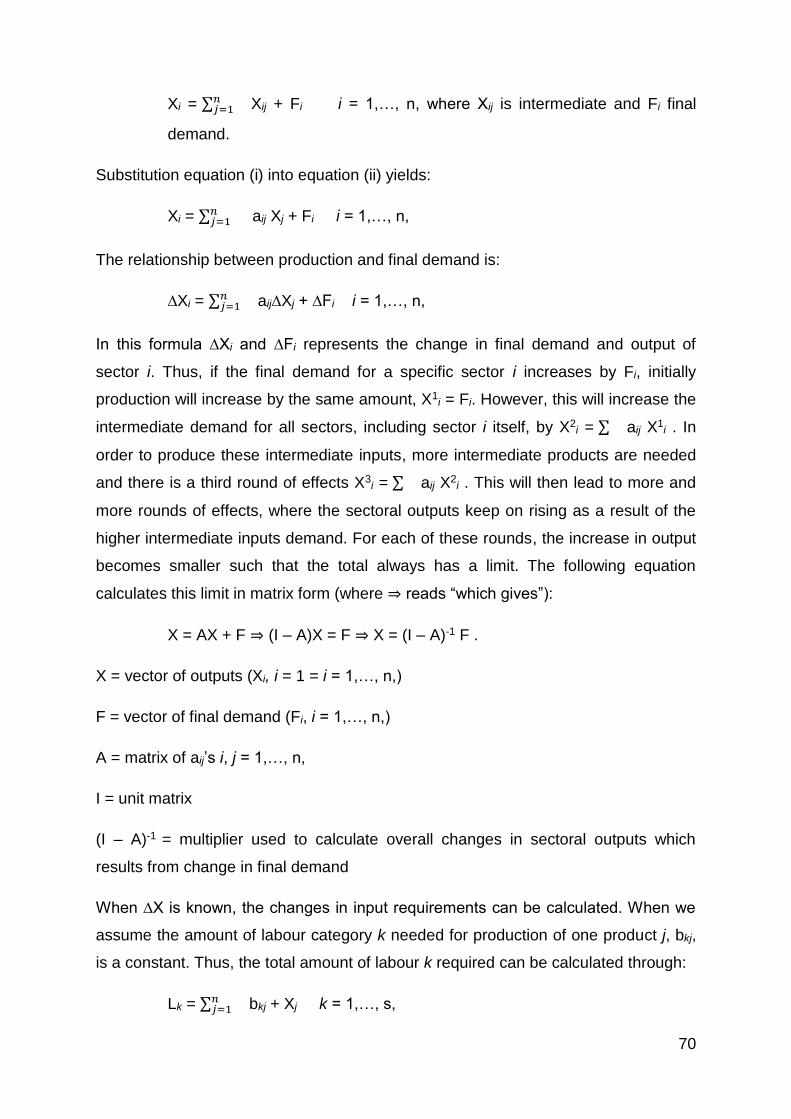
70
Xi = ∑𝑛𝑗=1 Xij + Fi i = 1,…, n, where Xij is intermediate and Fi final
demand.
Substitution equation (i) into equation (ii) yields:
Xi = ∑𝑛𝑗=1 aij Xj + Fi i = 1,…, n,
The relationship between production and final demand is:
∆Xi = ∑𝑛𝑗=1 aij∆Xj + ∆Fi i = 1,…, n,
In this formula ∆Xi and ∆Fi represents the change in final demand and output of
sector i. Thus, if the final demand for a specific sector i increases by Fi, initially
production will increase by the same amount, X1i = Fi. However, this will increase the
intermediate demand for all sectors, including sector i itself, by X2i = ∑ aij X1
i . In
order to produce these intermediate inputs, more intermediate products are needed
and there is a third round of effects X3i = ∑ aij X2
i . This will then lead to more and
more rounds of effects, where the sectoral outputs keep on rising as a result of the
higher intermediate inputs demand. For each of these rounds, the increase in output
becomes smaller such that the total always has a limit. The following equation
calculates this limit in matrix form (where ⇒ reads “which gives”):
X = AX + F ⇒ (I – A)X = F ⇒ X = (I – A)-1 F .
X = vector of outputs (Xi, i = 1 = i = 1,…, n,)
F = vector of final demand (Fi, i = 1,…, n,)
A = matrix of aij’s i, j = 1,…, n,
I = unit matrix
(I – A)-1 = multiplier used to calculate overall changes in sectoral outputs which
results from change in final demand
When ∆X is known, the changes in input requirements can be calculated. When we
assume the amount of labour category k needed for production of one product j, bkj,
is a constant. Thus, the total amount of labour k required can be calculated through:
Lk = ∑𝑛𝑗=1 bkj + Xj k = 1,…, s,

71
This equation can also be written in matrix form:
L = BX
L = vector of labour requirements (Lk, k = 1,…, s,)
B = matrix of bkj’s, k = 1,…, s,; j = 1,…, s,)
An input-output model is assumed to have a dual price system, which is a set of cost
prices in a linear framework. The output prices are then calculated by taking the
factor prices and tax as given, under the assumption that the returns to the fixed
factors are also proportional to supply X, that is πj = rj Xj, and indirect taxes are
proportional to the market value of the supply, which is Tj = tjpjXj. The following
equations represent the cost-price that equality of receipts and payments in each
sector implies.
pj Xj = ∑𝑛𝑖=1 piXij + ∑𝑠
𝑘=1 wkLkj + πj + Tj, j = 1,…, n.
When dividing both sides of equation (viii) with Xj, we have
pj = ∑𝑛𝑖=1 piaij + ∑𝑠
𝑘=1 wkbkj + rj + pjtj, j = 1,…, n.
Then equation (ix) can be written in matrix form as:
p = A’p + B’w + r + tp ⇒ p = (I – t – A’)-1 (B’w + r)
Where p, w, and r represent the vectors of output, labour and fixed-factor prices,
respectively, and the t is a matrix is tj, j = 1,…,n, on its diagonal. Thereafter, the
prime (‘) after A and B represents the transposed of these matrices.

72
To summarise the matrix model formulas:
Endogenous
Accounts (n)
Sum of exogenous
accounts (I)
Total
Endogenous
Accounts (n)
MX F X
Exogenous
accounts (m)
BX L
Total X
The matrix of multipliers = (I – M)-1
The vector of shocks = ∆F
The vector of impacts = ∆X = (I – M)-1 ∆F
The leakages = ∆L = B ∆X
When an injection or “shock” is applied, it is given by the change in elements of the
exogenous accounts. In this model the multipliers, like their input-output analogues,
are completely demand driven. The exogenous accounts located in the rows of the
model provide the “leakages”. The leakages mentioned are, for example the induced
savings and induced government spending (McDonald, et al., 1997).
The multiplier analysis includes direct, indirect and induced effects which can be
summarised as follows (Plumstead, 2012):
If the mining industry can be used as an example, the direct impact would be
the expenditures used to construct and operate a mine, such as labour,
materials and capital.
The indirect effects would then be the suppliers of the mine, expanding
production and purchasing goods and services in order to meet the expanded
demand.
The induced effect is a result of the employees of the mine purchasing goods
and services on a household level.
The above model can thus be used to determine the link between a specific sector’s
expansion and the labour intensity of that sector. Furthermore, the model is not only
73
limited to measure labour intensity, but can also measure the specific GDP and
production spill-over effects for a specific sector within the economy. The following
chapter will illustrate the implementation of the above SAM model specifically to
measure the effect of an increase in exports on the services sector in South Africa.
This will include the analysis of the results for the labour, GDP and production
multiplier effects throughout the South African economy.
4.6 Conclusion
This section will provide a summary of this chapter, in order to provide a compressed
expression for the chapter. A SAM contains information about the flow of resources
associated with all transactions in a specific period of time in between specific
economic agents. Thus this study will specifically focus on the economic flow
described by the South African SAM.
The objective of the SAM model is firstly to organise the data when agents are
involved in transactions with one another and financial resources exchange hands.
Furthermore, SAM captures the transactions in the relevant accounts, which
indicates the direction of flow of resources. Thus, the SAM forms the complete
database for all transactions that take place in a certain period of time, and gives a
static image for the economy for that period in time. The comprehensive breakdown
for the SAM includes producers, governments, households, all economic agents and
the rest of the world. This is broken down even further into capital, factor and
commodity markets.
A SAM can be split up into either macro-SAM or micro-SAM. A Macro-SAM will
provide the main macroeconomic characteristics of the economy, and will set the
basic data framework for the further development of a Micro-SAM. In the Macro-
SAM, each activity will produce one or more commodity using factor services and
intermediates. A Micro-SAM partitions certain accounts into more detailed
classifications. It includes the disaggregation of accounts for commodities, activities,
households and factors. A Micro-SAM shows more specifically how different
household groups earn and spend their incomes.
Thus the SAM model can be used with a combination of multipliers such as;
production, GDP and labour multipliers to measure the forward and backward

74
linkages within the South African economy. The results provide the direct, indirect
and induced effects for each “shock” or stimulus applied within a specific sector.
Thus, this “shock” can be focused towards a specific services sector, and the results
can be tracked and measured throughout the South African economy. This will
provide the needed information to identify the most labour-intensive services sectors
in the South African economy.
Chapter 5 will illustrate the results and analysis for the SAM model and the
multipliers used within the empirical analysis. The chapter will specifically focus on
the impact of service sectors in the South African economy. Firstly, the chapter will
discuss exportable services sectors, where-after the empirical results, regarding the
labour, GDP and production multiplier will be analysed and discussed.

75
Chapter 5: Empirical Analysis and Results
5.1 Introduction
In the previous chapter, the methodology for the Social Accounting Matrix and
multipliers used within the empirical analysis for this study was explained. The goal
of the Social Accounting Matrix analysis is to measure the overall effect that the
expansion of one sector can have on all the other sectors and these sectors
combined, through production multipliers, GDP multipliers and labour multipliers.
This model will specifically focus on the impact of the services sectors on the South
African economy, and more specifically what an increase in the exports of services
would mean for the economy. The results of this empirical study could provide some
insight for policy makers, in terms of employment stimulation in the services sector.
Thus this analysis will specifically identify the services sectors most prominent to
create the highest employment rates within the South African economy.
The first step in the empirical analysis is to identify exportable services sectors,
which will be discussed in Section 5.2. In Section 5.3, the empirical results for the
services industry, regarding the production multiplier, GDP multiplier and the labour
multipliers will be discussed. Finally, in Section 5.4 a conclusion will be drawn for this
chapter.
5.2 Selecting exportable services sectors for analysis
This section will provide the relevant background, as well as information on the
classification of services sectors within the SAM model. Thus, the services sectors
summarised in the SAM will be discussed, and the relevant exportable services
sectors will be discussed.
5.2.1 Social Accounting Matrix (SAM) services sectors which are exportable
In Chapter 1, the various methods of classifying services were explained. The most
commonly used method is the WTO classification. In order to determine if the
services sectors as defined in the SAM model are internationally tradeable, it is
necessary to compare the definition of SAM sectors with services internationally
traded as defined by the WTO, in order to determine which services sectors within
the SAM model are exportable.

76
The Electricity and Water sectors as defined by the SAM model (See Section 4.2.4)
are not included in the WTO tradable services sectors. It can be argued that these
sectors are most prominently traded within the domestic economy - in South Africa
these services are provided by the government. Therefore we will not be evaluating
this sector as part of this study.
The following sectors in the SAM are not internationally trade-able according to the
WTO defined services:
Electricity and Water
General Government Services
The following SAM services sectors are more tradable/ exportable than the others in
commercial terms, and thus they will be used in the analysis of this study (see
Section 4.2.4 for a description of each sector):
Building and Construction
Trade
Accommodation
Communication
Finance and Insurance
Real Estate
Business Services
Community, Social and Personal Services
5.3 Empirical results and analysis for the services industry
Each sector as defined by the Social Accounting Matrix sub-sectors was included as
a primary market stimulus, in order to calculate the direct, indirect and induced
multiplier effects in terms of production, GDP and labour. Each of the multipliers
calculated was described in the previous chapter, and in order to calculate the
multiplier effects, a 1000 million increase or shock (see Section 4.4.2) was applied to
each services sector. This amount was chosen to ensure that the shock is
substantial enough to indicate prominent linkages throughout the economy. The data
used in the services industry analysis was comprised from the 2006 SAM data
survey (StatsSA, 2014). This is the latest SAM data that was available in the duration

77
of this study. Even though the data was collected pre-2008 economic crisis, and may
be viewed as old data, the goal of the analysis was to find the inter-linkages within
the matrix model, and not to attain precise output figures. The assumption for the
SAM model is that the representation of the structure of the economy, does not
change that dramatically in a short period of time. Therefore the use of a newer
version of the SAM data will very likely provide similar results. The complete
empirical analysis for the services industry is presented by Table 5.4 through to
Table 5.30 in the annexures. The tables in the annexures show the multiplier results
for the Production, GDP and Labour multipliers, in terms of direct, indirect and
induced effects. The following section will provide a summary of the empirical
results.
5.3.1 Analysis for the Production Multiplier
The results in this section are illustrated in millions of South African Rand, and
summarised as direct, indirect and induced production multiplier results for each
sector, as defined by the SAM model. This section will specifically focus on the
results for the production multiplier (see Section 4.4.2.1) after the shock was applied
to each services sector as defined by the SAM model (see Section 4.2.4).
The following figure illustrates the total production multiplier effect of a R1 billion
increase in each services sector throughout the South African economy in terms of
the direct, indirect and induced multiplier effects (see Section 4.4.2.1). The figures
give an indication of which sectors have the highest total production effect
throughout the economy when exports are increased in each sector, and the inter-
linkages with other services sectors. Table 5.1 ranks the economy-wide total for
each sector and multiplier.

78
Table 5.1 Total effect for the production multiplier for each services sector in
Millions of Rand
Activities Direct Rank Indirect Rank Induced Ran
k
Direct + Indirect
+ Induce
d
Rank
Building and Construction
1 195.72 1.00 1 159.17 1.00 1 231.71 3.00 3 586.61 1.00
Trade 600.45 9.00 409.94 8.00 652.21 9.00 1 662.61 9.00
Accommodation 1 164.82 3.00 895.84 4.00 1 265.03 1.00 3 325.70 3.00
Transport 1 061.97 5.00 820.57 5.00 1 087.03 8.00 2 969.57 5.00
Communication 1 079.12 4.00 904.42 3.00 1 124.93 5.00 3 108.47 4.00
Finance and Insurance
987.19 7.00 469.99 7.00 1 114.49 7.00 2 571.67 7.00
Real Estate 1 165.06 2.00 909.32 2.00 1 258.88 2.00 3 333.26 2.00
Business Services 977.14 8.00 225.96 9.00 1 122.17 6.00 2 325.28 8.00
Community, Social and Personal Services
1 007.09 6.00 554.32 6.00 1 204.78 4.00 2 766.19 6.00
(Source: Author’s own calculations based on the South African SAM 2006)
The different effects, direct, indirect and induced, indicated in Table 5.1 above, will
be discussed separately in the sections to follow. The multiplier analysis includes
direct, indirect and induced effects which can be summarised as follows:
If the mining industry can be used as an example, the direct impact would be
the expenditures used to construct and operate a mine, such as labour,
materials and capital.
The indirect effects would then be the suppliers of the mine, expanding
production and purchasing goods and services in order to meet the expanded
demand.
The induced effect is a result of the employees of the mine purchasing goods
and services on a household level.
5.3.1.1 Direct effect of the Production Multiplier analysis
As illustrated by Table 5.1 the services sector with the highest total direct production
multiplier effect throughout the total South African economy is Building and
Construction. After Building and Construction, Real Estate exhibited the second

79
largest direct production multiplier effect. The third largest direct production multiplier
effect throughout the South African economy was from Accommodation.
Firstly, by analysing the results illustrated in Annexure A, the results illustrated the
production multiplier effects throughout the South African economy for Building and
Construction stimulation. The most prominent direct production multiplier linkages
were found within the services industry itself, thus from one services sector to other
services sectors. This includes services sectors such as Building and Construction
(R567.38 million) and Business Services (R105.66 million). The results also
indicated the most prominent direct production multiplier linkages within the
manufacturing industry including sectors such as Chemicals and Chemical Products
(R72.34 million) and Non-Metallic Mineral Products (R58.01 million).
Secondly, analysis of the results from the Real Estate result table (see Annexure A)
illustrated the direct production multiplier effects for Real Estate. The results
indicated that the most prominent direct production multiplier linkages occurred
within the services industry, including the Real Estate (R526.90 million) sector itself
as well as, Finance and Insurance (R163.64 million), Business Services (R97.45
million) and Community, Social and Personal Services (R104.78 million). The results
also indicated a prominent linkage within the manufacturing industry namely the
Chemicals and Chemical Products (R48.21 million) sector.
Finally, the results in Annexures A, which illustrate the production multiplier results
for Accommodation, were analysed. The most prominent linkages were found within
the services industry which included Accommodation (R511.35 million) itself and
Business Services (R227.75). The results also indicated prominent linkages within
the manufacturing industry namely Beverages and Tobacco Products (R30.06
million) and Chemicals and Chemical Products (R40.82 million).
5.3.1.2 Indirect effect of the Production Multiplier analysis
As illustrated by Table 5.1 above, the services sector with the highest total indirect
production multiplier effect throughout the total South African economy is Building
and Construction, followed by Real Estate and then finally Communication sector.
When analysing the indirect production multiplier results from the Building and
Construction table of results (see Annexure A), the results indicated the most

80
prominent indirect production multiplier effects were found within the services
industry, namely Building and Construction (R689.53 million) and Trade (R31.89
million). The results also indicated prominent linkages within the manufacturing
industry, namely, Chemicals and Chemical Products (R71 million), Non-Metallic
Mineral Products (R49.21 million), Basic Metal Products (R39.13 million) and
Structural Metal Products (R23.62 million).
The results for Real Estate (see Annexure A) were analysed to illustrate the results
for the production multiplier stimulus for Real Estate. The most prominent indirect
production multiplier linkages were found within the services industry within Real
Estate (R515.03 million) itself as well as, Finance and Insurance (R68.41 million)
and Community, Social and Personal Services (R52.51 million). The results also
indicated prominent indirect production multiplier linkages within the manufacturing
industry, namely, Chemicals and Chemical Products (R47.32 million).
Finally, the production multiplier results illustrated for a stimulus in the
Communication sector was analysed. The results indicated the most prominent
indirect production multiplier effects within the services industry, namely,
Communication (R576.40 million), Accommodation (R28.88 million) and Transport
(R35.27 million). The results also indicated prominent linkages within the
manufacturing industry, namely, Chemicals and Chemical Products (R49.11 million)
and Communication, Medical and Other Electronic Equipment (R30.12 million).
5.3.1.3 Induced effect of the Production Multiplier analysis
As illustrated by Table 5.1, the services sector with the highest total induced
production multiplier effect throughout the total South African economy is
Accommodation. After Accommodation, the results indicated Real Estate as the
second largest induced production multiplier effect. Finally, the results indicated the
third largest induced production multiplier effect throughout the South African
economy as the Building and Construction sector.
Firstly, the results for the production multiplier of Accommodation were analysed
(see Annexure A). The results indicated the most prominent linkages within the
services industry, namely, Accommodation (R553.86 million), Electricity (R45.43
million), Business Services (R263.74 million) and Community, Social and Personal

81
Services (R40.83 million). The results also indicated prominent linkages within the
manufacturing industry, namely, Beverages and Tobacco Products (R32.28 million)
and Chemicals and Chemical Products (R37.45 million).
Secondly, analysis of the results from Real Estate, which illustrates the results of the
production multiplier for a stimulus in the Real Estate sector, indicated the most
prominent induced production multiplier effect within the services industry, namely,
Real Estate (R557.09 million), Finance and Insurance (R185.93 million), Business
Services (R112.85 million) and Community, Social and Personal Services (R130.52
million). The results also indicated prominent linkages within the manufacturing
industry, namely, Chemicals and Chemical Products (R44.23 million). Finally,
analysis of results for Building and Construction (see Annexure A), which illustrates
the results of the production multiplier stimulus in the Building and Construction
sector, the most prominent linkages within the services industry were in Building and
Construction (R572.86 million), Trade (R52.47 million) and Transport (R37.95
million). prominent linkages within the manufacturing industry namely Chemicals and
Chemical Products (R66.37 million) and Non-Metallic Mineral Products (R60.84
million).
5.3.1.4 Combined Direct, indirect and induced effect of the Production Multiplier
analysis
The combined total impact of the direct, indirect and induced production multiplier
effect provides the sector with the greatest effect for direct, indirect and induced. As
illustrated by Table 5.1, the services sector with the highest total production multiplier
effect throughout the total South African economy is Building and Construction. This
is followed by Real Estate with the second largest total production multiplier effect,
and Accommodation with the third largest total production multiplier effect throughout
the South African economy.

82
Figure 5.1 Total Production Multiplier spill-over effect throughout the primary,
manufacturing and services industry for Building and Construction in Millions
of Rand
The services sector with the highest combined production multiplier effect, which
includes direct, indirect and induced effects, was for Building and Construction. As
illustrated in Figure 5.1, the results indicated that the most prominent spill-over
effects were found within the services industry (72.93%). With more than double the
total production multipliers than the manufacturing industry (23.87%) and the primary
industry (3.2%). Thus, this would indicate that a strong stimulus of a services sector
could result in the stimulus of other services sectors within the industry. After
analysing the results from Annexures A which includes the production multiplier
effects for Building and Construction, the most prominent linkages in the services
industry were found in Building and Construction (R1 829.77 million), Trade
(R128.78 million), Transport (R105.19 million), Communication (R75.32 million),
Business Services (R246 million) and Community, Social and Personal Services
(R81 million).
Secondly, the results from Real Estate (see Annexure A), which illustrates the
production multiplier effects for an increase in exports in the Real Estate sector, were
analysed. This includes the most prominent total production multiplier linkages which
includes direct, indirect and induced effects within the services industry. The results
3,20%
23,87%
72,93%
Total Primary
Total Manufacturing
Total Services
83
indicated services sectors such as Real Estate (R1 599.02 million), Building and
Construction (R126.86 million), Communication (R77.78 million), Finance and
Insurance (R417.98 million), Business Services (R226.88 million) and Community,
Social and Personal Services (287.82 million). This indicates that 86.79% of the total
production multiplier linkages are within the services industry. A prominent total
production multiplier linkage was found within the manufacturing industry, namely,
Chemicals and Chemical Products (R139.77 million). The manufacturing industry
only indicated 12.19% of the total production multiplier linkages including direct,
indirect and induced effects. Furthermore, results indicated a small linkage within the
primary industry, with only 1,02% of the total production multiplier effects.
Finally, the results from Accommodation (see Annexure A), which illustrate the
production multiplier effects an increase in exports in the Accommodation sector,
were analysed. The most prominent total production multiplier effects within the
services industry include sectors such as Accommodation (R1 567.39 million),
Electricity (R117.23 million), Transport (R71.94 million), Communication (R82.37
million), Finance and Insurance (R86.61 million), Business Services (R530.25
million) and Community, Social and Personal Services (R90.03 million). This
includes direct, indirect and induced effects, which indicated an 80.83% of the
linkages were within the services industry. The results also indicated prominent
production multiplier linkages within the manufacturing industry which includes
sectors such as Beverages and Tobacco products (R85.81 million) and Chemicals
and Chemical Products (R118.35 million). The manufacturing industry only indicated
16.89% of the total production multiplier linkages, which includes direct, indirect and
induced effects. The results indicated that the primary industry only indicated 2.28%
of the total production multiplier linkages.
From the above analysis, it is clear that when exports are increased, the services
sectors with the highest total direct production multiplier effect throughout the total
South African economy are Building and Construction, Real Estate and
Accommodation. Furthermore, the services sectors with the highest total indirect
production multiplier effect throughout the total South African economy are the
Building and Construction, Real Estate and the Communication sector. Finally, the
services sectors with the highest total induced production multiplier effect throughout

84
the total South African economy are the Accommodation, Real Estate and Building
and Construction sectors.
5.3.2 Analysis for the GDP multiplier
The results in this section are illustrated in millions of South African Rand, and are
summarised as indirect, direct and induced GDP multiplier results for each sector, as
defined by the SAM model. This section will specifically focus on the results for the
GDP multiplier (see Section 4.4.2.2) after the shock applied to each services sector
as defined by the SAM model (see Section 4.2.4).
Table 5.2 illustrates the total GDP multiplier effect that a R1 billion increase in
exports for each services sector has throughout the South African economy in terms
of the direct, indirect and induced multiplier effects. This thus gives an indication of
which sectors have the highest total GDP effect throughout the economy and the
inter-linkages with other sectors.
Table 5.2 Total effect for the GDP multiplier for each services sector in Millions
of Rand
Activities Direct Rank Indirect Rank Induced Rank
Direct + Indirect + Induced
Rank
Building and Construction 424.24 8.00 495.15 1.00 613.19 3.00 1 532.58 3.00
Trade 315.08 9.00 191.84 8.00 325.13 9.00 832.05 9.00
Accommodation 528.95 5.00 459.98 3.00 630.69 1.00 1 619.63 2.00
Transport 465.07 6.00 370.04 5.00 541.70 8.00 1 376.81 8.00
Communication 463.55 7.00 402.18 4.00 560.39 6.00 1 426.11 7.00
Finance and Insurance 666.63 2.00 243.54 7.00 556.53 7.00 1 466.70 6.00
Real Estate 531.35 4.00 465.33 2.00 628.16 2.00 1 624.85 1.00
Business Services 821.00 1.00 113.51 9.00 560.46 5.00 1 494.97 4.00
Community, Social and Personal Services
605.10 3.00 277.03 6.00 601.46 4.00 1 483.59 5.00
(Source: Author’s own calculations based on the South African SAM 2006)
As illustrated by Table 5.2, the services sector with the highest total direct GDP
multiplier effect throughout the total South African economy is Business Services.
The results indicated the second largest direct GDP multiplier effect to be Finance
and Insurance. Finally, the results indicated the third largest direct GDP multiplier
85
effect throughout the South African economy to be the Community, Social and
Personal Services sector. The different effects, direct, indirect and induced, indicated
in table 5.2 above, will be discussed separately in the sections to follow.
5.3.2.1 Direct effect of the GDP Multiplier analysis
The results from Business Services (see Annexure B) which illustrates the GDP
multiplier effects for a stimulus in the Business Services sector were analysed. The
most prominent direct GDP multiplier linkage within the services industry was
Business Services (R778.62 million). Business Services indicated a low GDP spill-
over effect throughout the manufacturing and primary industry.
Secondly, analysis of the results for Finance and Insurance (see Annexure B), which
illustrates the results for a stimulus in the Finance and Insurance sector, indicated
that the most prominent direct GDP multiplier linkages within the services industry
were in Finance and Insurance (R535.19 million) itself, Real Estate (R12.58 million),
Business Services (R46.57 million) and Community, Social and Personal Services
(R40.86 million). Again, the direct GDP multiplier spill-over effect was limited and did
not show prominence within the manufacturing and primary industries.
Finally, the results for Community, Social and Personal Services (see Annexure B),
which illustrate the GDP multiplier effects for a stimulus in the Community, Social
and Personal Services sector, indicated the most prominent direct GDP multiplier
effects within the services industry, namely, Community, Social and Personal
Services (R501.79 million) itself and Business Services (R45.20 million). Again, the
results indicated small prominence in terms of the manufacturing and primary
industry.
5.3.2.2 Indirect effect of the GDP Multiplier analysis
As illustrated by Table 5.2, the services sector with the highest total indirect GDP
multiplier effect throughout the total South African economy is Building and
Construction. The second largest indirect GDP multiplier effect was found within the
Real Estate sector. Finally, the results indicated the third largest indirect GDP
multiplier effect throughout the South African economy to be the Accommodation
sector.
86
Firstly, the results from Building and Construction (see Annexure B), which illustrate
the GDP multiplier effects for a stimulus in the Building and Construction sector,
were analysed. The results indicated the most prominent indirect GDP multiplier
linkages within the services industry, namely, Building and Construction (R282.01
million) and Trade (R16 Million). The results indicated prominent indirect GDP
multiplier linkages within the manufacturing industry, in sectors such as Chemical
and Chemical Products (R30.94 million), Non-Metallic Mineral Products (R22.50
Million) and Basic Metal Products (R17 million). The results also indicated a
prominent indirect GDP multiplier linkage within the primary industry, namely, Other
Mining (R11.04).
Secondly, analysis of the results from Real Estate (see Annexure B), which illustrate
the GDP multiplier effects for a stimulus in the Real Estate sector, indicated that the
most prominent indirect GDP multiplier linkages within the services industry are in
Real Estate (R280.81 million), Building and Construction (R19.55 million), Finance
and Insurance (R36.62 million) and Community, Social and Personal Services
(R27.58 million). The results also indicated a prominent indirect GDP multiplier
linkage within the manufacturing industry, namely, Chemicals and Chemical
Products (R20.62 million).
Finally, after analysing the results for Accommodation (see Annexure B), which
illustrates the GDP multiplier effects for a stimulus in the Accommodation sector, the
results indicated the most prominent indirect GDP multiplier linkages within the
services industry, including sectors such as Accommodation (R276.64 million),
Electricity (R15.02 million) and Business Services (R20.35 million). The results also
indicated prominent indirect GDP multiplier linkages within the manufacturing
industry, namely, Beverages and Tobacco Products (R11.40 million) and Chemicals
and Chemical Products (R17.46 million).
5.3.2.3 Induced effect of the GDP Multiplier analysis
As illustrated by Table 5.2, the services sector with the highest total induced GDP
multiplier effect throughout the South African economy is Accommodation. The
second largest induced GDP multiplier effect was found within the Real Estate
sector. Finally, the third largest induced GDP multiplier effect was within the Building
and Construction sector.

87
Firstly, the results from Accommodation (see Annexure B), which illustrate the GDP
multiplier effects for a stimulus in the Accommodation sector, were analysed. The
results indicated that the most prominent induced GDP multiplier effects were within
the services industry, namely, Accommodation (R276.03 million) itself as well as
other services sectors including, Electricity (R22.62 million), Finance and Insurance
(R19.24 million), Business Services (R131.75 million) and Community, Social and
Personal Services (R20.39 million). The results indicated the most prominent
induced GDP multiplier linkages within the manufacturing industry as Beverages and
Tobacco Products (R16.08 million) and Chemicals and Chemical Products (R18.65
million).
Secondly, analysis of the results from Real Estate (see Annexure B), which illustrate
the GDP multiplier effects for a stimulus in the Real Estate sector indicated the most
prominent induced GDP multiplier linkages within the services industry, namely, Real
Estate (R278.09 million), Building and Construction (R19.75 million), Finance and
Insurance (R92.87 million), Business Services (R56.37 million) and Community,
Social and Personal Services (R65.18 million). A prominent induced GDP multiplier
linkage was also found within the manufacturing industry namely Chemical and
Chemical Products (R22.02 million).
Finally, analysis of the results from Building and Construction (see Annexure B)
which illustrate the GDP multiplier effects for a stimulus in the Building and
Construction sector, indicated the most prominent induced GDP multiplier linkages
within the services industry, including sectors such as Building and Construction
(R284.85 million), Trade (R26.13 million), Transport (R18.90 million), Business
Services (R61.12 million) and Community, Social and Personal Services (R18.34
million). The results also indicated prominent induced GDP multiplier linkages within
the manufacturing industry, namely, Chemicals and Chemical Products (R33.04
million), Non-Metallic Mineral Products (R30.30 million) and Basic Metal Products
(R15.52 million).
5.3.2.4 Combined Direct, indirect and induced effect of the GDP Multiplier analysis
This section describes the combined total impact of the direct, indirect and induced
GDP multiplier effect. As illustrated by Table 5.2, the services sector with the highest
total GDP multiplier effect throughout the total South African economy is Real Estate.

88
After Real Estate, the second largest total GDP multiplier effect was
Accommodation. Finally, the results indicated the third largest total GDP multiplier
effect throughout the South African economy to be the Building and Construction
sector.
Figure 5.2 Total GDP Multiplier spill-over effect throughout the primary,
manufacturing and services industry for Real Estate in Millions of Rand
The results indicated that the services sector with the highest combined GDP
multiplier effect, including direct, indirect and induced effects, was Real Estate. The
most prominent spill-over effects were within the services industry (88.84%). This is
eight times larger than the manufacturing industry (10.13%) and the primary industry
(1.04%) combined. Furthermore, the results from Real Estate (see Annexure B),
which illustrate the GDP multiplier effects for a stimulus in the Real Estate sector,
indicate the most prominent total GDP multiplier effects within the services industry,
including sectors such as Real Estate (R727.08 million), Finance and Insurance
(R247.42 million), Business Services (R151.23 million) and Community, Social and
Personal Services (R159.34 million).
Secondly, analysis of the results for Accommodation (see Annexure B) which
illustrate the GDP multiplier effects for a stimulus in the Accommodation sector,
indicates the most prominent total GDP multiplier linkages within the services
industry, including sectors such as Accommodation (R702.22 million) and Business
1,04%10,13%
88,84%
Total Primary
Total Manufacturing
Total Services

89
Services (R353.45 million). Furthermore, a small total GDP multiplier linkages were
found within the manufacturing (14.38%) and primary industry (2.29%).
Finally, analysis of the results for Building and Construction (see Annexures B),
which illustrate the GDP multiplier effects for a stimulus in the Building and
Construction sector, indicate the most prominent total GDP multiplier linkages within
the services industry, namely Building and Construction (R695.26 million), Trade
(R65.42 million) and Business Services (R163.97 million). Thus, the services
industry accounted for 73.64% of total GDP multiplier linkages. Furthermore,
Building and Construction indicated higher GDP multiplier linkages within the
manufacturing sector (22.74%), than Real Estate (10.13%) and Accommodation
(14.38%). This includes linkages with sectors such as Chemicals and Chemical
Products (R82.43 million) and Non-Metallic Mineral Products (R76.11 million). The
primary industry only indicated 3.62% of the total GDP multiplier share, significantly
lower than the services and manufacturing industry.
The above analysis clearly demonstrates that the services sectors with the highest
total direct GDP multiplier effect throughout the total South African economy are the
Business Services, Finance and Insurance and Community, Social and Personal
Services sectors. Furthermore, the services sectors with the highest total indirect
GDP multiplier effect throughout the total South African economy are the Building
and Construction, Real Estate and the Accommodation sectors. Finally, the services
sectors with the highest total induced GDP multiplier effect throughout the South
African economy are the Accommodation, Real Estate and Building and
Construction sectors.
5.3.3 Analysis for the Labour Multiplier
The results in this section are illustrated in units of labour, which are summarised as
indirect, direct and induced labour multiplier results for each sector, as defined by the
SAM model. This section will specifically focus on the results for the labour multiplier
(see Section 4.4.2.3) after the shock applied to each service sector, as defined by
the SAM model (see Section 4.2.4).
Table 5.3 illustrates the total labour multiplier effect that a R1 billion increase in each
services sector has throughout the South African economy in terms of the direct,

90
indirect and induced multiplier effects. This gives an indication of which sectors have
the highest total labour effect throughout the economy and the inter-linkages with
other sectors.
Table 5.3 Total effect for the labour multiplier for each services sector per unit
of jobs created
Activities Direct Rank
Indirect Rank Induced Rank
Direct + Indirect + Induced
Rank
Building and Construction 3 893.99 4.00 3 694.59 1.00 4 512.86 3.00 12 101.44 4.00
Trade 2 393.73 8.00 1 386.64 8.00 2 387.85 9.00 6 168.23 9.00
Accommodation 6 261.00 3.00 3 663.37 2.00 4 630.86 1.00 14 555.23 2.00
Transport 2 814.41 6.00 2 699.42 4.00 3 981.60 8.00 9 495.42 6.00
Communication 1 952.80 9.00 2 621.21 5.00 4 120.19 5.00 8 694.20 7.00
Finance and Insurance 2 583.18 7.00 1 939.93 7.00 4 076.18 7.00 8 599.29 8.00
Real Estate 2 824.88 5.00 3 437.67 3.00 4 607.63 2.00 10 870.18 5.00
Business Services 8 973.44 1.00 915.64 9.00 4 102.06 6.00 13 991.13 3.00
Community, Social and Personal Services
7 942.30 2.00 2 612.29 6.00 4 419.99 4.00 14 974.58 1.00
(Source: Author’s own calculations based on the South African SAM 2006)
As illustrated in Table 5.3, the services sector with the highest total direct Labour
multiplier effect throughout the South African economy is Business Services. The
second largest direct labour multiplier effect was found within the Community, Social
and Personal Services sector. Finally, the third largest direct labour multiplier effect
throughout the South African economy was within the Accommodation sector. The
different effects, direct, indirect and induced, indicated in Table 5.3 above, will be
discussed separately in the sections to follow.
5.3.3.1 Direct effect of the Labour Multiplier analysis
Analysis of the results from Business Services (see Annexure C), which illustrate the
labour multiplier effects for a stimulus in the Business Services sector, indicates the
most prominent direct labour multiplier linkages within the services industry, namely
Business Services (8 664 jobs) and Community, Social and Personal Services (176
jobs). The results indicate significantly smaller direct labour multiplier effects
throughout the manufacturing and primary industry.

91
Secondly, the results from Community, Social and Personal Services (see Annexure
C), which illustrate the labour multiplier effects for a stimulus in the Community,
Social and Personal Services sector, were analysed. The results indicate the most
prominent direct labour multiplier linkages within the services industry, namely
Community, Social and Personal Services (7 7942 jobs) and Business Services (503
jobs). The results also indicate some direct labour multiplier linkages within the
manufacturing industry including sectors such as Textiles, Clothing, Leather
Products and Footwear (18 jobs) and Chemicals and Chemical Products (19 jobs).
Finally, analysis of the results from Accommodation (see Annexure C), which
illustrate the labour multiplier effects for a stimulus in this sector, indicates the most
prominent direct labour multiplier linkages within the services industry, including
sectors such as Accommodation (3 049 jobs), Business Services (2 240.47 jobs) and
Community, Social and Personal Services (298 jobs). The results also indicate
prominent direct labour multiplier linkages within the manufacturing industry, namely,
Beverages and Tobacco Products (48 jobs) and Chemicals and Chemical Products
(28 jobs). The results also indicate prominent direct labour multiplier linkages within
the primary industry including sectors such as Poultry Farming (36 jobs) and Other
Agriculture (29 jobs).
5.3.3.2 Indirect effect of the Labour Multiplier analysis
As illustrated by Table 5.3, the services sector with the highest total indirect Labour
multiplier effect throughout the South African economy is Building and Construction.
The second largest indirect labour multiplier effect was found within the
Accommodation sector. Finally, the third largest indirect labour multiplier effect was
found within the Real Estate sector.
Firstly, analysis of the results from Building and Construction (see Annexure C),
which illustrate the labour multiplier effects for a stimulus in the Building and
Construction sector, indicates the most prominent indirect labour multiplier effects
within the services industry, including sectors such as Building and Construction
(2 196 jobs), Trade (114 Jobs), Transport (100 jobs), Communication (61 jobs),
Business Services (78 jobs) and Community, Social and Personal Services (79
jobs). The results also indicate prominent indirect labour multiplier linkages within the
manufacturing industry, namely, Chemicals and Chemical Products (199 jobs), Non-

92
Metallic Mineral Products (159 jobs), Basic Metal Products (94 jobs), Machinery and
Equipment (66 jobs) and Electrical Machinery and Apparatus (72 jobs). The results
also indicate a prominent indirect labour multiplier linkage within the primary sector,
namely, Other Mining (71 jobs). Secondly, analysis of the results from
Accommodation (see Annexure C), which illustrate the labour multiplier effects for a
stimulus in the Accommodation sector, indicates the most prominent linkages within
the services industry, namely, Accommodation (2 276 jobs), Electricity (82 jobs),
Trade (52 jobs), Transport (68 jobs), Communication (66 jobs), Finance and
Insurance (61 jobs), Business Services (169 jobs) and Community, Social and
Personal Services (88 jobs). The results also indicate prominent linkages within the
manufacturing industry, including sectors such as Dairy Products (69 jobs),
Beverages and Tobacco Products (99 jobs) and Chemicals and Chemical Products
(112 jobs). Finally, analysis of the results for Real Estate (see Annexure C) which
illustrate the labour multiplier effects for a stimulus in the Real Estate sector,
indicates the most prominent indirect labour multiplier linkages within the services
industry, which includes sectors such as Real Estate (2 006 jobs), Building and
Construction (152 jobs), Communication (63 jobs), Finance and Insurance (294
jobs), Business Services (72 jobs) and Community, Social and Personal Services
(282 jobs). The results also indicate a prominent indirect labour multiplier linkage
within the manufacturing industry, namely, Chemicals and Chemical Products (132
jobs).
5.3.3.3 Induced effect of the Labour Multiplier analysis
As illustrated in Table 5.3, the services sector with the highest total induced labour
multiplier effect throughout the South African economy is Accommodation. The
second largest induced labour multiplier effect was found within the Real Estate
sector. Finally, the third largest induced labour multiplier effect throughout the South
African economy was found within the Building and Construction sector.
Firstly, analysis of the results for Accommodation (see Annexure C), which illustrates
the labour multiplier effects for a stimulus in the Accommodation sector, indicates the
most prominent induced labour multiplier linkages within the services industry,
including sectors such as Accommodation (2 028 jobs), Electricity (166 jobs), Trade
(89 jobs), Transport (95 jobs), Communication (108 jobs), Finance and Insurance

93
(141 jobs), Business Services (964 jobs) and Community, Social and Personal
Services (150 jobs). The results also indicate prominent induced labour multiplier
linkages within the manufacturing industry, including sectors such as Beverages and
Tobacco Products (118 jobs) and Chemicals and Chemical Products (137 jobs).
Secondly, analysis of the results for Real Estate (see Annexure C), which illustrates
the labour multiplier effects for a stimulus in the Real Estate sector, indicates the
most prominent induced labour multiplier linkages within the services industry,
namely, Real Estate (2 038 jobs), Building and Construction (146 jobs), Trade (73
jobs), Transport (71 jobs), Communication (102 jobs), Finance and Insurance (680
jobs), Business Services (412 jobs) and Community, Social and Personal Services
(479 jobs). The results also indicate prominent induced labour multiplier linkages
within the manufacturing industry, namely, Furniture (61 jobs) and Chemicals and
Chemical Products (162 jobs).
Finally, the results for Building and Construction (see Annexure C), which illustrate
labour multiplier effects for a stimulus in the Building and Construction sector, were
analysed. The results indicate the most prominent induced labour multiplier linkages
within the services industry, namely, Building and Construction (2 100 jobs), Trade
(192 jobs), Transport (139 jobs), Communication (99 jobs), Finance and Insurance
(91 jobs), Business Services (447 jobs) and Community, Social and Personal
Services (135 jobs). The results indicate prominent induced labour multiplier linkages
within the manufacturing industry, including sectors such as Chemicals and
Chemical Products (243 jobs), Non-Metallic Mineral Products (223 jobs), Basic Metal
Products (114 jobs), Structural Metal Products (83 jobs), Machinery and Equipment
(73 jobs) and Electrical Machinery and Apparatus (85 jobs). Furthermore, the results
also indicate a prominent induced labour multiplier effect within the primary industry,
namely, Other Mining (125 jobs).
5.3.3.4 Combined Direct, indirect and induced effect of the Labour Multiplier analysis
This section will illustrate the combined total impact of the direct, indirect and
induced labour multiplier effect. As illustrated in Table 5.3, the services sector with
the highest total direct labour multiplier effect throughout the South African economy
is Community, Social and Personal Services. The second largest direct labour
multiplier effect was found within the Accommodation sector. Finally, the third largest

94
direct labour multiplier effect throughout the South African economy was found within
the Business Services sector.
Figure 5.3 Total GDP multiplier spill-over effect throughout the primary,
manufacturing and services industry Community, Social and Personal
Services in Millions of Rand
The services sector with the highest combined labour multiplier effect, including
direct, indirect and induced effects, were Community, Social and Personal Services.
The most prominent spill-over effects occurred in the services industry (94.68%). In
contrast, the manufacturing industry (4.92%) and primary industry (0.4%) only had a
combined labour multiplier spill-over effect of 5.32%.
Firstly, analysis of the results for Community, Social and Personal Services (see
Annexure C), which illustrate the labour multiplier effects for a stimulus in the
Community, Social and Personal Services sector, indicated that the most prominent
linkages within the services industry were Community, Social and Personal Services
(12 916 jobs), Trade (86 jobs), Transport (104 jobs), Communication (94 jobs),
Business Services (757 jobs). Furthermore, prominent linkages were found within
the manufacturing industry, in Furniture (79 jobs), Chemicals and Chemical Products
(185 jobs) and Manufacturing of Transport Equipment (94 jobs).
Secondly, analysis of the results from Accommodation (see Annexure C), which
illustrate the labour multiplier effects for a stimulus in the Accommodation sector,
indicates the most prominent total labour multiplier effects within the services
0,40%4,92%
94,68%
Total Primary
Total Manufacturing
Total Services

95
industry, including sectors such as Accommodation (7 353 jobs), Electricity (290
jobs), Building and Construction (121 jobs), Trade (220 jobs), Transport (206 jobs),
Communication (196 jobs), Finance and Insurance (262 jobs), Real Estate (100
jobs), Business Services (3 373 jobs) and Community, Social and Personal Services
(536 jobs). This represents 87.07% of the total labour multiplier spill-over effects
throughout the analysis. The results also indicate prominent total labour multiplier
linkages within the manufacturing industry, including sectors such as Dairy Products
(131 jobs), Grain Mill, Bakery and Animal Feed Products (103 jobs), Other Food
Products (101 jobs), Beverages and Tobacco Products (264 jobs), Furniture (103
jobs) and Chemicals and Chemical Products (277 jobs). The manufacturing industry
(10.81%) and primary industry (2.12%) shared less than 13% of the total labour
multiplier effects.
Finally, analysis of the results from Business Services (see Annexure C), which
illustrate the labour multiplier effects for a stimulus in the Business Services sector,
indicates the most prominent total labour multiplier linkages within the services
industry, namely, Business Services (13 045 jobs), Transport (73 jobs) and
Community, Social and Personal Services (316 jobs). Furthermore, small total labour
multiplier linkages were found within the manufacturing industry (1.93%) and primary
industry (0.23%), compared to the services industry (97.84%).
From the above analysis, it is clear that the services sectors with the highest total
direct labour multiplier effect throughout the South African economy are the Business
Services, Community, Social and Personal Services and the Accommodation
sectors.
5.4 Conclusion
After reviewing the relevant literature regarding tradable and exportable services
sectors, the following SAM services sectors were identified as tradable/exportable
and thus they were used within the analysis of this study: Building and Construction;
Trade; Accommodation; Communication; Finance and Insurance; Real Estate;
Business Services; and Community, Social and Personal Services.
The analysis indicated that the services sectors with the highest total direct
production multiplier effects throughout the total South African economy are

96
Accommodation, Real Estate and Building and Construction. Furthermore, the
services sectors with the highest total indirect production multiplier effects throughout
the total South African economy are Building and Construction, Real Estate and the
Communication sector. Finally, the services sectors with the highest total induced
production multiplier effects throughout the total South African economy are
Accommodation, Real Estate as well as the Building and Construction sector.
In terms of the GDP multiplier analysis, the services sectors with the highest total
direct GDP multiplier effects throughout the total South African economy are the
Business Services, Finance and Insurance and Community, Social and Personal
Services sectors. Furthermore, the services sectors with the highest total indirect
GDP multiplier effects throughout the total South African economy are the Building
and Construction, Real Estate and the Accommodation sectors. Finally, the services
sectors with the highest total induced GDP multiplier effects throughout the South
African economy are the Accommodation, Real Estate and Building and
Construction sectors.
In terms of the labour multiplier analysis, the service sectors with the highest total
direct labour multiplier effects throughout the South African economy are the
Business Services, Community, Social and Personal Services and Accommodation
sectors. Furthermore, the services sectors with the highest total indirect labour
multiplier effects throughout the South African economy are the Building and
Construction, Accommodation and Real Estate sectors. Finally, the services sectors
with the highest total induced labour multiplier effects throughout the South African
economy are the Accommodation, Real Estate and Building and Construction
sectors.
The aim of this study was to determine the most employment-intensive services
sectors and their linkages with other sectors within the South African economy, in
order to make recommendations for policy makers towards sustainable economic
growth and job creation in the services sector. To this end, it was found that an
increase in the exports of services in South Africa has a definite impact on
employment in the following sectors:
97
Production
o Building and Construction, Real Estate and Accommodation
GDP
o Real Estate, Accommodation, and Building and Construction
Labour
o Community, Social and Personal Services, Accommodation, and
Business Services
Thus these results can contribute greatly to policy decisions on provincial and
national level. The following chapter will discuss the conclusions made for the study,
as well as recommendations.

98
Chapter 6: Conclusion and Recommendations
6.1 Introduction
In the previous chapter the SAM model was applied, in terms of the production, GDP
and labour multipliers. The goal of the Social Accounting Matrix analysis is to
measure the overall effect that the expansion of one sector can have on all the other
sectors combined, through production multipliers, GDP multipliers and labour
multipliers. This model was applied in this study with a specific focus on the impact
of the services sectors in the South African economy, and more specifically what an
increase in the exports of services would mean for the economy. The first step in the
empirical analysis was to identify exportable services sectors. Thereafter, the
empirical results for the services industry, regarding the production multiplier, GDP
multiplier and the labour multipliers, were discussed.
The study will be summarised in Section 6.2. Thereafter, relevant policy
recommendations will be made in Section 6.3, based on the results from the
empirical analysis. Finally, in Section 6.4, future research will be discussed.
6.2 Summary
The objective of this study was to determine the most employment-intensive services
sectors and their linkages within the South African economy, in order to determine
recommendations for policy makers towards sustainable economic growth and job
creation. This, together with the identification of linkages in other sectors, can
support more focused policy making. To this effect, a literature study was done
within the first part of the study.
Chapter 2 provided the theoretical background for the study, which includes why
countries trade, the relationship between export expansion and employment
creation, as well as the forward and backward linkages in economies. The objective
of Section 2.2 was to motivate theoretically the reasons for international trade and
discuss the economic benefits thereof. Some countries have the population (labour)
to support large industrial complexes, others do not. Other countries are home to a
large pool of workers (labour) with the ability to run modern machinery, other have
scientists and engineers specialising in research-laden products. Other countries
have the specific skill of entrepreneurs whom are more capable and knowledgeable

99
than others (Francois & Hoekman, 2010). Firstly, products need specific productive
factors in different relative proportions. For example, producing agricultural goods
requires relatively more labour per capital than manufactured goods, which require
more capital per worker than most primary goods. Thus, the factor endowment
theory assumes that some products are more capital intensive than others produced
in the economy. Secondly, countries have different factors of endowment. For
example, a developed country like the United States has large amounts of capital per
unit of labour, and is thus defined as a capital-abundant country. Other countries, like
Egypt, India and Colombia, have less capital and more units of labour, defining them
as labour-abundant countries. Thus, in general, developed countries are more
capital-abundant and developing countries are more labour-abundant in their
individual economies (Todaro & Smith, 2011).
It is nearly impossible for an individual or a country to be completely self-sustaining
in its demand of the simplest lifestyle (Todaro & Smith, 2011). Thus it would be more
profitable to engage in the specific activities to which they are most suited or in which
they have a comparative advantage in terms of their natural abilities (skills) or
resource endowment. This creates the ability to trade in the specific product or
service that the individual or country is the most effective in producing. Thus
specialization is created based on when comparative advantage arises, even in the
most primitive economies. When countries specialize in production and export of
specific goods and services, they have a comparative advantage over other
countries.
Firstly, the studies found that the expansion of trade into a global market may not
have the traditionally expected benefits, but rather can create countries that benefit
and other countries that may not. Secondly, the studies further argue the emphasis
of spill-over of production methods between countries and the transfer of technology.
Thirdly, the studies linked the increasing returns to scale to Post Keynesian
economics, which emphasises the effects of increasing returns to scale in
international trade. Gomory and Baumol (2000) also linked the level of productivity to
market size, which states that an increase in market size will have the effect of
higher productivity. Fourthly, the studies argue for strategic trade policy in order to
create greater returns from international trade. Finally, the studies analysed
microeconomic theory, which is the basis of conventional trade theory. Thus, their
100
analysis is done on conventional trade theory’s terms and strengthens the results on
the effects of trade deficits on investment and employment (Thomas, 2008).
Section 2.4 discussed the relationship between export expansion and employment
creation, firstly on a macro-level, and thereafter on a micro-level. The benefits of
exports can be summarised as “gains from trade”, which includes higher
competitiveness, knowledge transfer and allocative efficiency (Harcourt, 2000). On
the macro-level, the study’s analyses predominantly indicated that the expansion of
goods and services exports has a positive effect on economic growth and
employment. In traditional neo-classical trade theory, the gains from international
trade are the source of economic growth, which is maximized through adjustment.
This is achieved through the means of economic liberalisation of the uneven factor
and resource reallocation maintained through import substitution and export
expansion.
When a firm meets a specific output for a specific price of demand, it may produce a
different amount of output and employ a different amount of employees. Then the
question arises of what amount of labour will be effective for the production of the
specific firm (Andrew, et al., 2008). This is indicated in the Figure 2.1. The effective
labour demand curve indicates what amount of labour is needed for a specific
amount of output, with productivity, capital stock and effort held in a constant
(Andrew, et al., 2008). In this study they were unable to find any empirical support for
the theoretical link for the impact of trade on labour markets, but in most cases the
hypothesis of a positive relationship between trade openness and demand elasticity
could not be ignored.
In Section 2.5, the forward and backward linkages within specific economies were
discussed. This section included the results of studies and reports given the inter-
linkages which specific services sectors have with other sectors within the economy.
One of the most prominent dimensions of interconnectedness of industries is the
nature of buyers and suppliers linkage. From all the studies discussed on a micro
level, one can conclude that services are playing a prominent role in the value
adding process for the manufacturing industry, and these services sectors are also
prominently linked within the economy. Furthermore, the above macro- and micro-
101
studies found prominent linkages between export expansion and an increase in
employment levels, as well as economic growth.
The objective of Chapter 3 was to address the ongoing problem of unemployment in
South Africa, as well as the government’s plans to create jobs through economic
policy and export expansion. The influence of the services industry and its exports
on the South African economy were also discussed. Unemployment remains a great
problem in South Africa, but the services sector has been growing in recent years
and could provide a possible means of creating more jobs. In Section 3.2 the
relevant data was analysed to establish the role of the services industry in South
Africa. In 2013, the most prominent value adder for South African GDP was the
services industry (R2 327 795 million), with 77% of the value added portion (Figure
3.2). The largest contributors to economic growth in 2013 were: Finance, Real Estate
and Business Services (2.4% growth); Wholesale, Retail and Motor Trade (2.2%
growth); Mining and Quarrying (3.1% growth) and finally Transport, Storage and
Communication (1.9% growth) as well as General Government Services (1.5%
growth).
The exports of services have grown consistently since 2004, with a minor decline
occurring between 2008 and 2009. After 2009, services exports started increasing
again, with low volatility and a minor decrease in 2013 (see Figure 3.5). The largest
exporter within the services industry is the travel sector, with substantial exports
which peaked at 9 billion dollars. Analysis of the remaining services sectors within
the South African economy indicates that there can be a greater deal of growth in
exports, with the majority of services sectors exporting less than 1 billion dollars.
The South African unemployment rate of 25% has indicated to be a problem for
policy makers. Even though the South African economy has seen some upside in
economic growth since the 2009 recession, the growth rate has failed to absorb the
growing South African labour force. South Africa has seen its labour force grow by
approximately 500 000 to 700 000 job seekers annually, as reported by Statistics
South Africa, whereas the economy has only been able to create about 460 000 jobs
annually.
The Industrial Policy Action Plan (IPAP) is framed by and constituted as a key pillar
of the programmatic perspective set out in the NGP (see Section 3.3.3). Reality is
102
constantly changing, therefore the programme set in IPAP 2014 reflects the constant
readjustment and response to shifting opportunities and demands, which is needed
to keep this mandate alive. The main goal of IPAP is to use the set of solutions for
major fault-lines in South Africa’s economic structure, to create a policy shift
emphasis towards the productive sectors of the economy. The IPAP document’s
most prominent focus is towards the manufacturing industry, because of specific
reasons. The document states that these reasons include the fact that the
manufacturing industry has the highest employment and economic multipliers. They
also motivate that the manufacturing industry has high backward linkages toward the
primary industry, services industry and the entire value chain.
The NEDP specifically focuses on small micro and medium enterprises, drawn from
previously disadvantaged individuals, as well as the larger potential and established
exporters. The NEDP is in line with the South African policy environment, which
includes the NGP (see Section 3.3.3) and takes into account the global environment.
The NEDP supplies support services such as a national information network
including and export call centre, integrated export website, different levels of training,
mentoring arrangements and assisting with export promotion (Gouws & Moore,
2013).
The National Development Plan (NDP) is South Africa’s long term vision of an
equitable society. The NDP aims to reduce inequality and eliminate poverty by 2030.
The NDP also states that in order to create economic transformation, the rate of
economic growth must surpass 5% per annum. There is a growing consensus that
inequality must be reduced, poverty must be eliminated and there is a need to create
decent jobs, which can be done through a new growth path founded on the
restructuring of the South African economy. This will create more effective labour
absorption and improvements in performance through higher economic growth,
which is in line with the vision of the NDP (National Planning Commission, 2013).
The basic objectives of the NGP are: a comprehensive drive to enhance both social
equity and competitiveness; systemic changes to mobilise domestic investment
around activities that can create sustainable employment; and strong social dialogue
to focus all stakeholders on encouraging growth in employment-creating activities.

103
The highest percentage of total employment has remained within the services
industry since 2004, at a rate above 60%. This is double the combined employment
within agriculture and industry, with agriculture at 5% and industry at 25% of total
employment. It was concluded that there could be a negative correlation between
agricultural export expansion and low skilled employment (Section 3.4) (Mbatha,
2011). The most prominent conclusion made was that India and South Africa
experience substantial employment declines as trade contracts (Kucera, et al.,
2012). Furthermore, if substantial improvements were made to economic policies,
specifically the promotion of trade in services, unemployment could be reduced by
20%.
The objective of Chapter 4 was to describe the methodology that was used for the
SAM multiplier analysis, followed by a description of the development of the labour
multiplier for the empirical analysis of the services industry. Section 4.2 provided an
overview of the Social Accounting Matrix (SAM) multiplier model and more
specifically the explanations regarding the employment side of the model. A SAM
contains information about the flow of resources associated with all transactions in a
specific period of time in between specific economic agents (Provide, 2003). The
objective of the SAM model is, firstly, to organise the data when agents are involved
in transactions with one other and when financial resources exchange hands. SAM
reveals links between economic accounts, by integrating all kinds of economic flows
(see Figure 4.1). The SAM model indicates in a quantitative manner the
interdependence of all agents and economic activities over a specific time in a
specific economic area.
The SAM can be separated into either a macro-SAM or a micro-SAM. A macro-SAM
will provide the main macroeconomic characteristics of the economy, and will set the
basic data framework for the further development of a micro-SAM (Wobst, 1998). In
the macro-SAM, each activity will produce one or more commodity using factor
services and intermediates, as well as the factor services produced by capital,
labour, land and other natural resources. A Micro-SAM partitions certain accounts
into more detailed classifications.
Section 4.3 discussed the SAM multiplier decompositions. In Table 4.1 the simplified
Social Accounting Matrix (SAM) is illustrated. As stated above, it is necessary to
104
divide accounts into endogenous and exogenous accounts before any quantitative
analysis can be done. In Section 4.4, the data used for the analysis was described.
The South African SAM model includes 26 different household and sectoral surveys
for the year 2000, which includes expenditure and income and labour surveys. There
are also three additional accounts added into the South African SAM model,
including, unskilled male and female labour, an EPWP sector which employs this
unskilled labour, and the inputs used to produce the EPWP output.
Through the application of an export “shock” to the data, the spill-over effects
between services and the other sectors in the economy can be determined. These
spill-over effects can be measured in terms of spill-over to productivity, GDP as well
as labour. When an injection or “shock” is applied, it is given by the change in
elements of the exogenous accounts. In this model, the multipliers, like their input-
output analogues, are completely demand driven. The exogenous accounts located
in the rows of the model provide the “leakages”. The leakages mentioned are, for
example, the induced savings and induced government spending (McDonald, et al.,
1997).
The multiplier analysis includes direct, indirect and induced effects which can be
summarised as follows (Plumstead, 2012):
In the mining industry, for example, the direct impact would be the
expenditures used to construct and operate a mine, such as labour, materials
and capital.
The indirect effects would then be the suppliers of the mine, expanding
production and purchasing goods and services in order to meet the expanded
demand.
The induced effect is the result of the mine employees purchasing goods and
services on a household level.
The goal of the Social Accounting Matrix analysis is to measure the overall effect
that the expansion of one sector can have on all the other sectors and these sectors
combined, through production multipliers, GDP multipliers and labour multipliers.
This study, using the SAM model, specifically focused on the impact of the services
sectors in the South African economy, and more specifically what an increase in the
exports of services would mean for the economy.

105
The following SAM services sectors are more tradable/exportable than the others in
commercial terms, and thus they were used in the analysis of this study (see Section
4.2.4):
Building and Construction
Trade
Accommodation
Communication
Finance and Insurance
Real Estate
Business Services
Community, Social and Personal Services
In Section 5.3, the empirical results for the services industry regarding the production
multiplier, GDP multiplier and the labour multipliers were discussed. Each sector, as
defined by the Social Accounting Matrix sub-sectors, were included as a primary
market stimulus, in order to calculate the direct, indirect and induced multiplier
effects in terms of production, GDP and labour. Each of the multipliers calculated
was described in Chapter 4, and in order to calculate the multiplier effects, a 1000
million increase or shock (see Section 4.4.2) was applied to each selected services
sector.
The analysis indicated that the services sectors with the highest total direct
production multiplier effect throughout the total South African economy are Building
and Construction, Real Estate and Accommodation. Furthermore, the services
sectors with the highest total indirect production multiplier effects throughout the total
South African economy are the Building and Construction, Real Estate and the
Communication sectors. Finally, the services sectors with the highest total induced
production multiplier effects throughout the total South African economy are
Accommodation, Real Estate as well as the Building and Construction sector.
In terms of the GDP multiplier analysis, it was found that the services sectors with
the highest total direct GDP multiplier effects throughout the total South African
economy are the Business Services, Finance and Insurance and Community, Social
and Personal Services sectors. Furthermore, the services sectors with the highest

106
total indirect GDP multiplier effects throughout the total South African economy are
the Building and Construction, Real Estate and Accommodation sectors. Finally, the
services sectors with the highest total induced GDP multiplier effects throughout the
South African economy are the Accommodation, Real Estate and Building and
Construction sectors.
In terms of the labour multiplier analysis, the services sectors with the highest total
direct labour multiplier effects throughout the South African economy are the
Business Services, Community, Social and Personal Services and Accommodation
sectors. Furthermore, the services sectors with the highest total indirect Labour
multiplier effects throughout the South African economy are the Building and
Construction, Accommodation and Real Estate sectors. Finally, the services sectors
with the highest total induced labour multiplier effects throughout the South African
economy are the Accommodation, Real Estate and Building and Construction
sectors.
The aim of this study was to determine the most employment-intensive services
sectors and their linkages with other sectors within the South African economy, in
order to make recommendations for policy makers towards sustainable economic
growth and job creation in the services sector. To this end, it was found that an
increase in the exports of services in South Africa has a definite impact on
employment in the following sectors:
Production
o Building and Construction, Real Estate and Accommodation
GDP
o Real Estate, Accommodation, and Building and Construction
Labour
o Community, Social and Personal Services, Accommodation, and
Business Services
These results can contribute greatly to policy decisions on provincial and national
level. The section that follows will provide recommendations on how the results of
this study can be applied to policy.

107
6.3 Policy recommendations
The overall direction of the Industrial Policy Action Plan (IPAP) is focused more
towards the manufacturing industry. The NEDP focuses its efforts to promote and
improve exports for South African exporters, whereas the NDP and NGP focus
towards the improvement of infrastructure, the agricultural value chain, the mining
value chain, the green economy, manufacturing sectors, which are included in
IPAP2, tourism and certain high-level services. Thus, the focus is not towards
specific services sectors, and this study has given some indication to which sectors
the government can move its focus towards the services industry.
The first policy recommendation is to establish a unit within the government to
specifically focus on the export promotion of services. The focus of the unit can firstly
be drawn towards export expansion methods, as well as export methods within the
services industry. The unit should not limit its focus towards services export
promotion, but also focus towards services import substitution, where South African
services sectors could be the preferred value added input for manufacturing,
agriculture and other services sectors. This could provide the needed backward-and
forward market linkages within the South African economy, where export expansion
can be maximised in terms of GDP, production and employment growth.
Furthermore, the efforts should focus on specific identified services sectors, and
these sectors should be promoted through market information, trade fairs, South
African services global promotion and stimulative trade agreements on plans.
Thus, it would be highly efficient to create a services sector action plan which places
specific focus towards the identified sectors Accommodation, Real Estate and
Building and Construction, Community, Social and Personal Services, and Business
Services including export opportunity and export facilitation services. This will
provide maximum contribution towards GDP, production, and employment growth
within services exports. This can furthermore also include incentive schemes for
current and potential exporters, in order to provide the support to make export
expansion possible. This will provide an economic environment for the services
sectors which provides stimulation, growth and prosperity.

108
6.4 Limitations
In the process of conducting the study some limitations were identified. The study
was limited to the 2006 SAM data, which includes data from pre-2008 economic
crisis. This specific data was used because it was the most recent data available in
its context. Furthermore, the specific model does not include the sub-division of
sectors, which calculates linkages and leakages on a more macro-level. Thus, the
analysis limits sub-sectoral specific results, but it still provides insights on a macro-
economic level intended for this study.
6.5 Future research
The results given by this study indicate possible avenues for future research. The
first recommendation is to compare the results from the 2006 SAM with a more
recent SAM survey on its release. This could provide insight on sectoral forward-
and-backward linkages changes, if any have occurred. This could provide further
motivation for the stimulus and export expansion of specific services sectors as
established by this study.
The second research recommendation is to investigate the results from this study on
a more sector-specific level. This would include the spill-over effects of sub-sectors
within the services sectors identified in Section 5.3. This would also provide further
insight on specific sub-sectors and their potential to be catalysts for employment
creation in South Africa. Furthermore, this will provide the needed insight on sub-
sectors which could provide more sub-sectoral specific policy recommendations.
The third recommendation is to determine specific services sub-sector trading
partners for the services sectors identified within the study. This could provide insight
in more specific policy making focused towards the export promotion of these
services sub-sectors. This would provide a more effective strategy for export
promotion and expansion for South African services sectors.
The fourth recommendation is to combine the most efficient modes of supply for the
identified services sectors in this study. This could be focused towards specific
export supply methods for the most prominent South African trading partners.
Furthermore, this could provide insight for specific services sectors on more efficient
export expansion and growth.

109
6.6 Conclusion
The objective of this study was to determining the most employment-intensive
services sectors and their linkages within the South African economy, in order to
determine recommendations for policy makers towards sustainable economic growth
and job creation. This, together with the identification of linkages in other sectors,
can support more focused policy making.
It would be beneficial for the DTI in South Africa to focus on the promotion and
stimulation of specific services sectors. This DTI unit could further address specific
limitations and challenges experienced in the export and trade of services in South
Africa. The results from the SAM model provide a basis for policy decision making
and strategy within the unit.

110
ANNEXURES
Annexure A
Production multiplier results for each services sector
Table A1-Production Multiplier (Building and Construction)
Activities Direct Indirect Direct + Indirect
Induced Direct + Indirect + Induced
Citrus Fruit Farming 0.01 0.00 0.01 0.01 0.02
Deciduous Fruit Farming 0.01 0.01 0.01 0.01 0.02
Subtropical Fruit Farming 0.00 0.00 0.00 0.00 0.00
Vegetable Farming 0.03 0.02 0.06 0.03 0.09
Livestock Farming 0.04 0.04 0.08 0.04 0.12
Game Farming 0.00 0.00 0.01 0.00 0.01
Dairy Farming (milk only) 0.01 0.01 0.03 0.02 0.05
Forestry 3.21 2.22 5.42 3.43 8.86
Fishing 0.01 0.01 0.02 0.01 0.03
Cereal and Crop Farming 0.08 0.09 0.17 0.08 0.25
Poultry Farming 0.11 0.09 0.20 0.12 0.31
Other Agriculture 0.17 0.12 0.29 0.18 0.47
Gold 0.00 0.00 0.00 0.00 0.01
Coal and lignite 5.18 2.46 7.64 5.99 13.63
Other Mining 31.16 25.69 56.85 33.96 90.81
Meat, Fish, Fruit, Vegetables, Oils and Fat Products 0.24 0.33 0.57 0.23 0.80
Dairy products 0.39 0.42 0.81 0.40 1.21
Grain Mill, Bakery and Animal Feed Products 0.30 0.35 0.65 0.31 0.95
Other food products 0.36 0.31 0.67 0.38 1.05
Beverages and tobacco products 0.81 0.64 1.45 0.88 2.33
Textiles, Clothing, Leather Products and Footwear 7.99 6.41 14.40 6.48 20.88

111
Wood and Wood Products 13.31 12.33 25.64 13.97 39.61
Furniture 11.09 9.95 21.04 11.02 32.06
Paper and Paper Products 6.98 7.25 14.23 6.50 20.73
Publishing and Printing 3.30 2.22 5.51 3.54 9.05
Chemicals & Chemical Products (incl Plastic Products) 72.34 71.00 143.34 66.37 209.71
Rubber Products 1.52 1.36 2.88 1.35 4.23
Non-Metallic Mineral Products 58.01 49.21 107.22 60.84 168.06
Basic Metal Products 33.27 39.13 72.40 31.20 103.60
Structural Metal Products 23.54 23.62 47.16 22.79 69.95
Other Fabricated Metal Products 4.54 4.66 9.20 4.11 13.31
Machinery & Equipment 22.14 22.98 45.11 19.86 64.97
Electrical Machinery & Apparatus 24.50 24.16 48.66 23.25 71.91
Communication, Medical and other Electronic Equipment 1.85 1.56 3.41 1.59 5.00
Manufacturing of Transport Equipment 5.23 5.71 10.93 3.71 14.65
Other Manufacturing & Recycling 0.77 0.45 1.22 0.84 2.06
Electricity 10.16 7.98 18.14 11.48 29.61
Water 0.44 0.44 0.88 0.44 1.32
Building & Construction 567.38 689.53 1 256.91 572.86 1 829.77
Trade 44.43 31.89 76.32 52.47 128.78
Accommodation 6.24 6.13 12.38 6.76 19.14
Transport 37.49 29.75 67.25 37.95 105.19
Communication 25.61 22.67 48.28 27.04 75.32
Finance & Insurance 22.02 9.21 31.23 25.02 56.25
Real Estate 14.31 13.99 28.30 15.13 43.43
Business Services 105.66 17.98 123.64 122.36 246.00
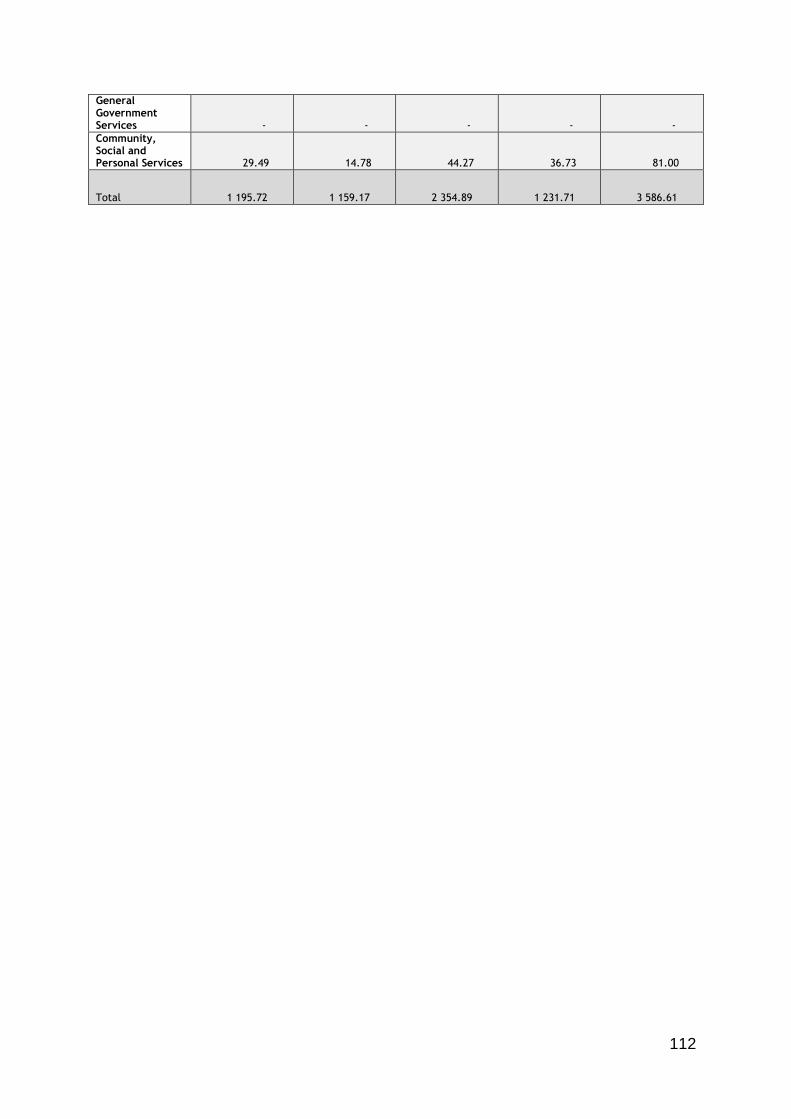
112
General Government Services - - - - -
Community, Social and Personal Services 29.49 14.78 44.27 36.73 81.00
Total 1 195.72 1 159.17 2 354.89 1 231.71 3 586.61

113
Table A2-Production Multiplier (Trade)
Activities Direct Indirect Direct + Indirect
Induced Direct + Indirect + Induced
Citrus Fruit Farming 0.01 0.01 0.02 0.01 0.03
Deciduous Fruit Farming 0.02 0.01 0.03 0.02 0.04
Subtropical Fruit Farming 0.00 0.00 0.00 0.00 0.01
Vegetable Farming 0.06 0.05 0.11 0.06 0.17
Livestock Farming 0.08 0.07 0.14 0.08 0.22
Game Farming 0.01 0.01 0.01 0.01 0.02
Dairy Farming (milk only) 0.03 0.03 0.05 0.03 0.08
Forestry 1.58 1.09 2.67 1.69 4.36
Fishing 0.02 0.02 0.04 0.02 0.06
Cereal and Crop Farming 0.16 0.17 0.32 0.14 0.46
Poultry Farming 0.20 0.16 0.37 0.22 0.58
Other Agriculture 0.24 0.17 0.41 0.25 0.65
Gold 0.00 0.00 0.01 0.00 0.01
Coal and lignite 2.51 1.19 3.71 2.91 6.61
Other Mining 5.31 4.37 9.68 5.78 15.46
Meat, Fish, Fruit, Vegetables, Oils and Fat Products 0.39 0.54 0.94 0.37 1.31
Dairy products 0.63 0.69 1.32 0.66 1.97
Grain Mill, Bakery and Animal Feed Products 0.48 0.57 1.05 0.50 1.55
Other food products 0.60 0.50 1.10 0.62 1.72
Beverages and tobacco products 1.41 1.10 2.51 1.51 4.02
Textiles, Clothing, Leather Products and Footwear 5.31 4.26 9.58 4.31 13.89
Wood and Wood Products 2.65 2.45 5.10 2.78 7.88
Furniture 15.08 13.53 28.62 14.98 43.60
Paper and Paper Products 12.70 13.18 25.88 11.82 37.70

114
Publishing and Printing 4.91 3.30 8.21 5.27 13.49
Chemicals & Chemical Products (incl Plastic Products) 46.58 45.72 92.29 42.73 135.02
Rubber Products 2.15 1.92 4.06 1.91 5.98
Non-Metallic Mineral Products 2.94 2.50 5.44 3.09 8.53
Basic Metal Products 6.70 7.88 14.58 6.28 20.85
Structural Metal Products 0.90 0.91 1.81 0.88 2.69
Other Fabricated Metal Products 3.11 3.20 6.31 2.82 9.12
Machinery & Equipment 10.30 10.69 20.99 9.24 30.23
Electrical Machinery & Apparatus 2.31 2.28 4.59 2.19 6.79
Communication, Medical and other Electronic Equipment 2.94 2.47 5.42 2.53 7.95
Manufacturing of Transport Equipment 7.05 7.70 14.75 5.01 19.76
Other Manufacturing & Recycling 1.04 0.62 1.66 1.15 2.81
Electricity 9.21 7.24 16.45 10.41 26.86
Water 0.44 0.44 0.88 0.44 1.33
Building & Construction 12.86 15.62 28.48 12.98 41.46
Trade 135.51 97.25 232.75 160.02 392.77
Accommodation 12.05 11.83 23.88 13.05 36.93
Transport 44.05 34.96 79.01 44.59 123.60
Communication 49.41 43.75 93.16 52.17 145.33
Finance & Insurance 36.89 15.42 52.32 41.92 94.23
Real Estate 19.54 19.10 38.64 20.66 59.30
Business Services 118.53 20.17 138.70 137.26 275.97
General Government Services - - - - -
Community, Social and Personal Services 21.55 10.80 32.35 26.85 59.20
Total 600.45 409.94 1 010.40 652.21 1 662.61
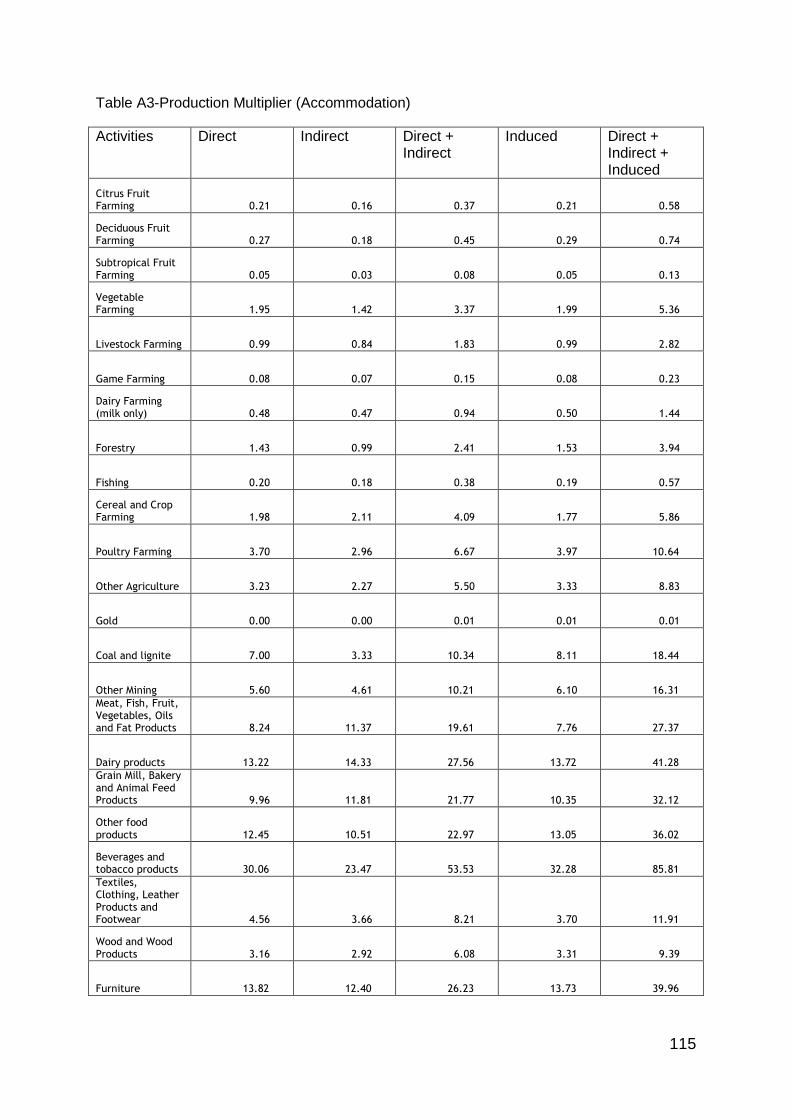
115
Table A3-Production Multiplier (Accommodation)
Activities Direct Indirect Direct + Indirect
Induced Direct + Indirect + Induced
Citrus Fruit Farming 0.21 0.16 0.37 0.21 0.58
Deciduous Fruit Farming 0.27 0.18 0.45 0.29 0.74
Subtropical Fruit Farming 0.05 0.03 0.08 0.05 0.13
Vegetable Farming 1.95 1.42 3.37 1.99 5.36
Livestock Farming 0.99 0.84 1.83 0.99 2.82
Game Farming 0.08 0.07 0.15 0.08 0.23
Dairy Farming (milk only) 0.48 0.47 0.94 0.50 1.44
Forestry 1.43 0.99 2.41 1.53 3.94
Fishing 0.20 0.18 0.38 0.19 0.57
Cereal and Crop Farming 1.98 2.11 4.09 1.77 5.86
Poultry Farming 3.70 2.96 6.67 3.97 10.64
Other Agriculture 3.23 2.27 5.50 3.33 8.83
Gold 0.00 0.00 0.01 0.01 0.01
Coal and lignite 7.00 3.33 10.34 8.11 18.44
Other Mining 5.60 4.61 10.21 6.10 16.31
Meat, Fish, Fruit, Vegetables, Oils and Fat Products 8.24 11.37 19.61 7.76 27.37
Dairy products 13.22 14.33 27.56 13.72 41.28
Grain Mill, Bakery and Animal Feed Products 9.96 11.81 21.77 10.35 32.12
Other food products 12.45 10.51 22.97 13.05 36.02
Beverages and tobacco products 30.06 23.47 53.53 32.28 85.81
Textiles, Clothing, Leather Products and Footwear 4.56 3.66 8.21 3.70 11.91
Wood and Wood Products 3.16 2.92 6.08 3.31 9.39
Furniture 13.82 12.40 26.23 13.73 39.96

116
Paper and Paper Products 9.35 9.70 19.05 8.70 27.75
Publishing and Printing 3.47 2.33 5.80 3.73 9.53
Chemicals & Chemical Products (incl Plastic Products) 40.82 40.07 80.89 37.45 118.35
Rubber Products 1.32 1.18 2.49 1.17 3.67
Non-Metallic Mineral Products 6.97 5.91 12.88 7.31 20.19
Basic Metal Products 7.03 8.27 15.31 6.59 21.90
Structural Metal Products 0.72 0.72 1.44 0.70 2.13
Other Fabricated Metal Products 5.15 5.29 10.44 4.66 15.11
Machinery & Equipment 10.07 10.46 20.53 9.04 29.57
Electrical Machinery & Apparatus 3.32 3.27 6.59 3.15 9.73
Communication, Medical and other Electronic Equipment 1.71 1.44 3.15 1.47 4.62
Manufacturing of Transport Equipment 4.07 4.44 8.51 2.89 11.40
Other Manufacturing & Recycling 1.41 0.83 2.24 1.55 3.80
Electricity 40.21 31.59 71.80 45.43 117.23
Water 2.52 2.55 5.07 2.55 7.62
Building & Construction 11.43 13.89 25.32 11.54 36.86
Trade 20.51 14.72 35.23 24.22 59.45
Accommodation 511.35 502.18 1 013.53 553.86 1 567.39
Transport 25.64 20.35 45.99 25.95 71.94
Communication 28.01 24.80 52.80 29.57 82.37
Finance & Insurance 33.91 14.17 48.08 38.53 86.61
Real Estate 12.66 12.38 25.04 13.39 38.43
Business Services 227.75 38.76 266.51 263.74 530.25
General Government Services - - - - -
Community, Social and Personal Services 32.78 16.43 49.20 40.83 90.03
Total 1 164.82 895.84 2 060.66 1 265.03 3 325.70

117
Table A4-Production Multiplier (Transport)
Activities Direct Indirect Direct + Indirect
Induced Direct + Indirect + Induced
Citrus Fruit Farming 0.01 0.01 0.01 0.01 0.02
Deciduous Fruit Farming 0.01 0.01 0.01 0.01 0.02
Subtropical Fruit Farming 0.00 0.00 0.00 0.00 0.00
Vegetable Farming 0.03 0.02 0.06 0.03 0.09
Livestock Farming 0.04 0.04 0.08 0.04 0.12
Game Farming 0.00 0.00 0.01 0.00 0.01
Dairy Farming (milk only) 0.02 0.01 0.03 0.02 0.05
Forestry 1.42 0.98 2.41 1.52 3.93
Fishing 0.01 0.01 0.02 0.01 0.03
Cereal and Crop Farming 0.08 0.09 0.17 0.07 0.25
Poultry Farming 0.11 0.09 0.20 0.12 0.32
Other Agriculture 0.21 0.15 0.36 0.22 0.57
Gold 0.01 0.01 0.02 0.01 0.03
Coal and lignite 4.70 2.24 6.94 5.44 12.38
Other Mining 11.87 9.78 21.65 12.93 34.58
Meat, Fish, Fruit, Vegetables, Oils and Fat Products 0.29 0.40 0.69 0.27 0.97
Dairy products 0.47 0.51 0.98 0.49 1.46
Grain Mill, Bakery and Animal Feed Products 0.35 0.41 0.76 0.36 1.13
Other food products 0.44 0.37 0.81 0.46 1.27
Beverages and tobacco products 1.04 0.81 1.85 1.11 2.96
Textiles, Clothing, Leather Products and Footwear 9.71 7.80 17.51 7.88 25.39
Wood and Wood Products 2.97 2.75 5.71 3.11 8.83
Furniture 10.03 9.00 19.02 9.96 28.98

118
Paper and Paper Products 9.92 10.30 20.22 9.23 29.45
Publishing and Printing 3.09 2.08 5.17 3.32 8.48
Chemicals & Chemical Products (incl Plastic Products) 134.47 131.99 266.45 123.37 389.82
Rubber Products 8.50 7.60 16.11 7.58 23.69
Non-Metallic Mineral Products 4.71 3.99 8.70 4.94 13.64
Basic Metal Products 10.32 12.13 22.45 9.67 32.12
Structural Metal Products 0.71 0.71 1.42 0.69 2.11
Other Fabricated Metal Products 6.47 6.66 13.13 5.86 18.99
Machinery & Equipment 11.69 12.14 23.83 10.49 34.33
Electrical Machinery & Apparatus 5.21 5.14 10.36 4.95 15.30
Communication, Medical and other Electronic Equipment 1.83 1.54 3.37 1.57 4.94
Manufacturing of Transport Equipment 25.86 28.22 54.08 18.35 72.43
Other Manufacturing & Recycling 3.17 1.88 5.06 3.50 8.55
Electricity 14.30 11.24 25.53 16.15 41.69
Water 0.73 0.74 1.46 0.73 2.20
Building & Construction 11.26 13.68 24.94 11.37 36.31
Trade 18.59 13.34 31.92 21.95 53.87
Accommodation 5.86 5.76 11.62 6.35 17.98
Transport 520.48 413.05 933.53 526.82 1 460.35
Communication 24.05 21.30 45.35 25.40 70.74
Finance & Insurance 25.02 10.46 35.48 28.43 63.92
Real Estate 25.29 24.72 50.00 26.73 76.74
Business Services 81.74 13.91 95.65 94.65 190.30
General Government Services - - - - -
Community, Social and Personal Services 64.89 32.52 97.41 80.83 178.23
Total 1 061.97 820.57 1 882.54 1 087.03 2 969.57
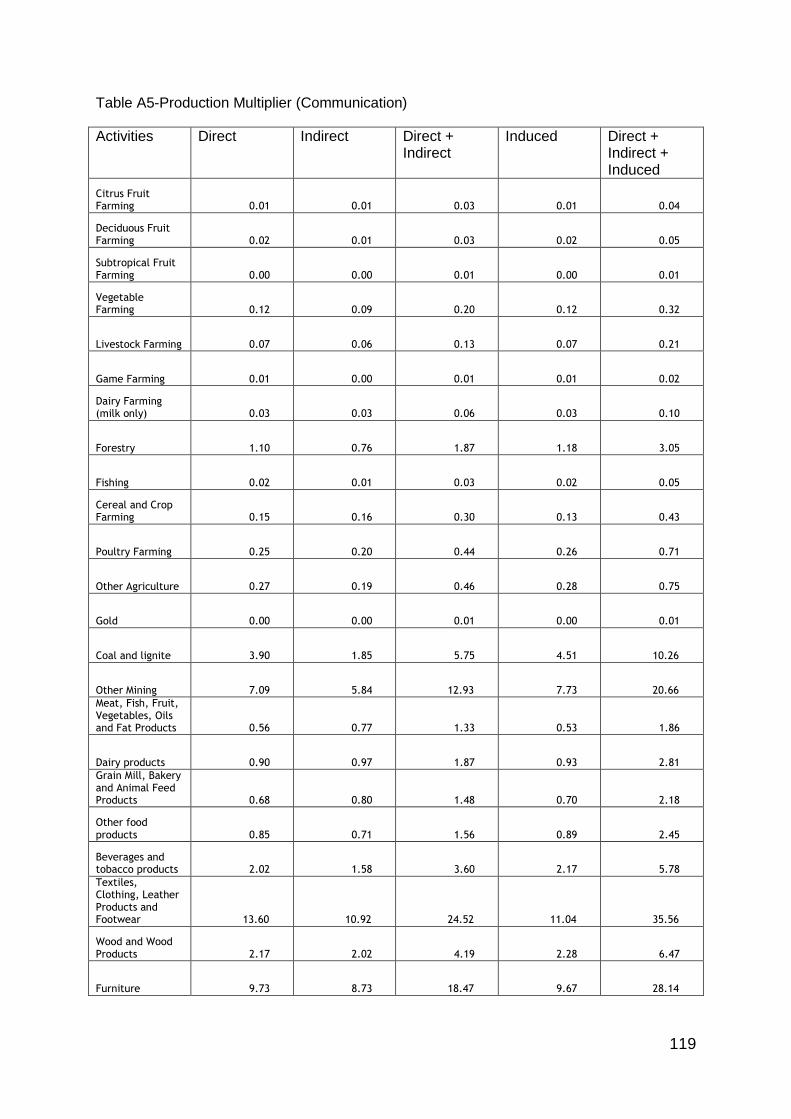
119
Table A5-Production Multiplier (Communication)
Activities Direct Indirect Direct + Indirect
Induced Direct + Indirect + Induced
Citrus Fruit Farming 0.01 0.01 0.03 0.01 0.04
Deciduous Fruit Farming 0.02 0.01 0.03 0.02 0.05
Subtropical Fruit Farming 0.00 0.00 0.01 0.00 0.01
Vegetable Farming 0.12 0.09 0.20 0.12 0.32
Livestock Farming 0.07 0.06 0.13 0.07 0.21
Game Farming 0.01 0.00 0.01 0.01 0.02
Dairy Farming (milk only) 0.03 0.03 0.06 0.03 0.10
Forestry 1.10 0.76 1.87 1.18 3.05
Fishing 0.02 0.01 0.03 0.02 0.05
Cereal and Crop Farming 0.15 0.16 0.30 0.13 0.43
Poultry Farming 0.25 0.20 0.44 0.26 0.71
Other Agriculture 0.27 0.19 0.46 0.28 0.75
Gold 0.00 0.00 0.01 0.00 0.01
Coal and lignite 3.90 1.85 5.75 4.51 10.26
Other Mining 7.09 5.84 12.93 7.73 20.66
Meat, Fish, Fruit, Vegetables, Oils and Fat Products 0.56 0.77 1.33 0.53 1.86
Dairy products 0.90 0.97 1.87 0.93 2.81
Grain Mill, Bakery and Animal Feed Products 0.68 0.80 1.48 0.70 2.18
Other food products 0.85 0.71 1.56 0.89 2.45
Beverages and tobacco products 2.02 1.58 3.60 2.17 5.78
Textiles, Clothing, Leather Products and Footwear 13.60 10.92 24.52 11.04 35.56
Wood and Wood Products 2.17 2.02 4.19 2.28 6.47
Furniture 9.73 8.73 18.47 9.67 28.14

120
Paper and Paper Products 7.94 8.25 16.19 7.39 23.59
Publishing and Printing 9.62 6.47 16.09 10.33 26.43
Chemicals & Chemical Products (incl Plastic Products) 50.04 49.11 99.15 45.91 145.05
Rubber Products 2.23 2.00 4.23 1.99 6.22
Non-Metallic Mineral Products 2.53 2.15 4.67 2.65 7.33
Basic Metal Products 19.16 22.54 41.70 17.97 59.66
Structural Metal Products 0.35 0.35 0.70 0.34 1.04
Other Fabricated Metal Products 4.09 4.20 8.29 3.70 11.99
Machinery & Equipment 22.60 23.46 46.06 20.27 66.33
Electrical Machinery & Apparatus 4.74 4.68 9.42 4.50 13.92
Communication, Medical and other Electronic Equipment 35.84 30.12 65.97 30.79 96.76
Manufacturing of Transport Equipment 6.91 7.54 14.45 4.90 19.35
Other Manufacturing & Recycling 1.09 0.65 1.73 1.20 2.93
Electricity 14.62 11.49 26.11 16.52 42.63
Water 0.58 0.58 1.16 0.58 1.74
Building & Construction 4.17 5.06 9.23 4.21 13.44
Trade 20.77 14.90 35.67 24.52 60.19
Accommodation 29.41 28.88 58.30 31.86 90.15
Transport 44.44 35.27 79.71 44.98 124.69
Communication 651.01 576.40 1 227.42 687.37 1 914.78
Finance & Insurance 21.05 8.80 29.85 23.92 53.76
Real Estate 6.64 6.49 13.13 7.02 20.15
Business Services 56.41 9.60 66.01 65.32 131.33
General Government Services - - - - -
Community, Social and Personal Services 19.33 9.69 29.02 24.08 53.10
Total 1 079.12 904.42 1 983.54 1 124.93 3 108.47

121
Table A6-Production Multiplier (Finance and Insurance)
Activities Direct Indirect Direct + Indirect
Induced Direct + Indirect + Induced
Citrus Fruit Farming 0.00 0.00 0.00 0.00 0.01
Deciduous Fruit Farming 0.00 0.00 0.00 0.00 0.01
Subtropical Fruit Farming 0.00 0.00 0.00 0.00 0.00
Vegetable Farming 0.01 0.01 0.02 0.01 0.03
Livestock Farming 0.01 0.01 0.02 0.01 0.04
Game Farming 0.00 0.00 0.00 0.00 0.00
Dairy Farming (milk only) 0.01 0.00 0.01 0.01 0.02
Forestry 0.72 0.50 1.22 0.77 1.99
Fishing 0.00 0.00 0.01 0.00 0.01
Cereal and Crop Farming 0.03 0.03 0.05 0.02 0.08
Poultry Farming 0.04 0.03 0.07 0.04 0.11
Other Agriculture 0.05 0.03 0.08 0.05 0.14
Gold 0.00 0.00 0.01 0.00 0.01
Coal and lignite 0.89 0.42 1.32 1.03 2.35
Other Mining 1.79 1.47 3.26 1.95 5.21
Meat, Fish, Fruit, Vegetables, Oils and Fat Products 0.08 0.11 0.19 0.08 0.27
Dairy products 0.13 0.14 0.27 0.13 0.40
Grain Mill, Bakery and Animal Feed Products 0.10 0.12 0.21 0.10 0.31
Other food products 0.12 0.10 0.22 0.13 0.35
Beverages and tobacco products 0.28 0.22 0.50 0.30 0.80
Textiles, Clothing, Leather Products and Footwear 1.60 1.28 2.88 1.30 4.18
Wood and Wood Products 1.12 1.04 2.16 1.18 3.34
Furniture 9.04 8.11 17.16 8.98 26.14
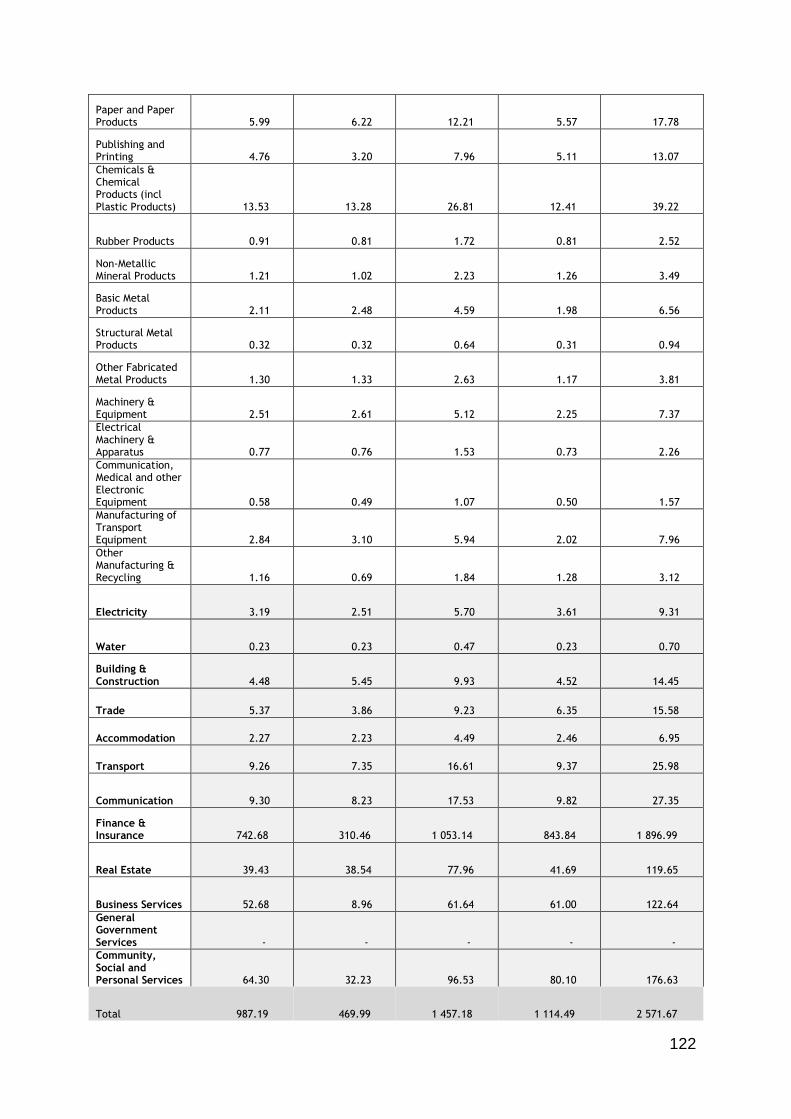
122
Paper and Paper Products 5.99 6.22 12.21 5.57 17.78
Publishing and Printing 4.76 3.20 7.96 5.11 13.07
Chemicals & Chemical Products (incl Plastic Products) 13.53 13.28 26.81 12.41 39.22
Rubber Products 0.91 0.81 1.72 0.81 2.52
Non-Metallic Mineral Products 1.21 1.02 2.23 1.26 3.49
Basic Metal Products 2.11 2.48 4.59 1.98 6.56
Structural Metal Products 0.32 0.32 0.64 0.31 0.94
Other Fabricated Metal Products 1.30 1.33 2.63 1.17 3.81
Machinery & Equipment 2.51 2.61 5.12 2.25 7.37
Electrical Machinery & Apparatus 0.77 0.76 1.53 0.73 2.26
Communication, Medical and other Electronic Equipment 0.58 0.49 1.07 0.50 1.57
Manufacturing of Transport Equipment 2.84 3.10 5.94 2.02 7.96
Other Manufacturing & Recycling 1.16 0.69 1.84 1.28 3.12
Electricity 3.19 2.51 5.70 3.61 9.31
Water 0.23 0.23 0.47 0.23 0.70
Building & Construction 4.48 5.45 9.93 4.52 14.45
Trade 5.37 3.86 9.23 6.35 15.58
Accommodation 2.27 2.23 4.49 2.46 6.95
Transport 9.26 7.35 16.61 9.37 25.98
Communication 9.30 8.23 17.53 9.82 27.35
Finance & Insurance 742.68 310.46 1 053.14 843.84 1 896.99
Real Estate 39.43 38.54 77.96 41.69 119.65
Business Services 52.68 8.96 61.64 61.00 122.64
General Government Services - - - - -
Community, Social and Personal Services 64.30 32.23 96.53 80.10 176.63
Total 987.19 469.99 1 457.18 1 114.49 2 571.67

123
Table A7-Production Multiplier (Real Estate)
Activities Direct Indirect Direct + Indirect
Induced Direct + Indirect + Induced
Citrus Fruit Farming 0.01 0.00 0.01 0.01 0.02
Deciduous Fruit Farming 0.01 0.01 0.01 0.01 0.02
Subtropical Fruit Farming 0.00 0.00 0.00 0.00 0.00
Vegetable Farming 0.03 0.03 0.06 0.04 0.10
Livestock Farming 0.04 0.03 0.07 0.04 0.10
Game Farming 0.00 0.00 0.01 0.00 0.01
Dairy Farming (milk only) 0.01 0.01 0.03 0.01 0.04
Forestry 1.57 1.08 2.65 1.67 4.32
Fishing 0.01 0.01 0.02 0.01 0.03
Cereal and Crop Farming 0.07 0.08 0.15 0.07 0.22
Poultry Farming 0.10 0.08 0.19 0.11 0.30
Other Agriculture 0.14 0.10 0.24 0.15 0.39
Gold 0.01 0.00 0.01 0.01 0.02
Coal and lignite 3.20 1.52 4.73 3.71 8.43
Other Mining 6.88 5.67 12.54 7.49 20.04
Meat, Fish, Fruit, Vegetables, Oils and Fat Products 0.24 0.33 0.57 0.22 0.79
Dairy products 0.38 0.41 0.80 0.40 1.19
Grain Mill, Bakery and Animal Feed Products 0.29 0.34 0.63 0.30 0.93
Other food products 0.36 0.30 0.66 0.38 1.04
Beverages and tobacco products 0.84 0.65 1.49 0.90 2.39
Textiles, Clothing, Leather Products and Footwear 5.48 4.40 9.87 4.44 14.32
Wood and Wood Products 4.83 4.47 9.30 5.07 14.36
Furniture 16.77 15.05 31.82 16.66 48.47
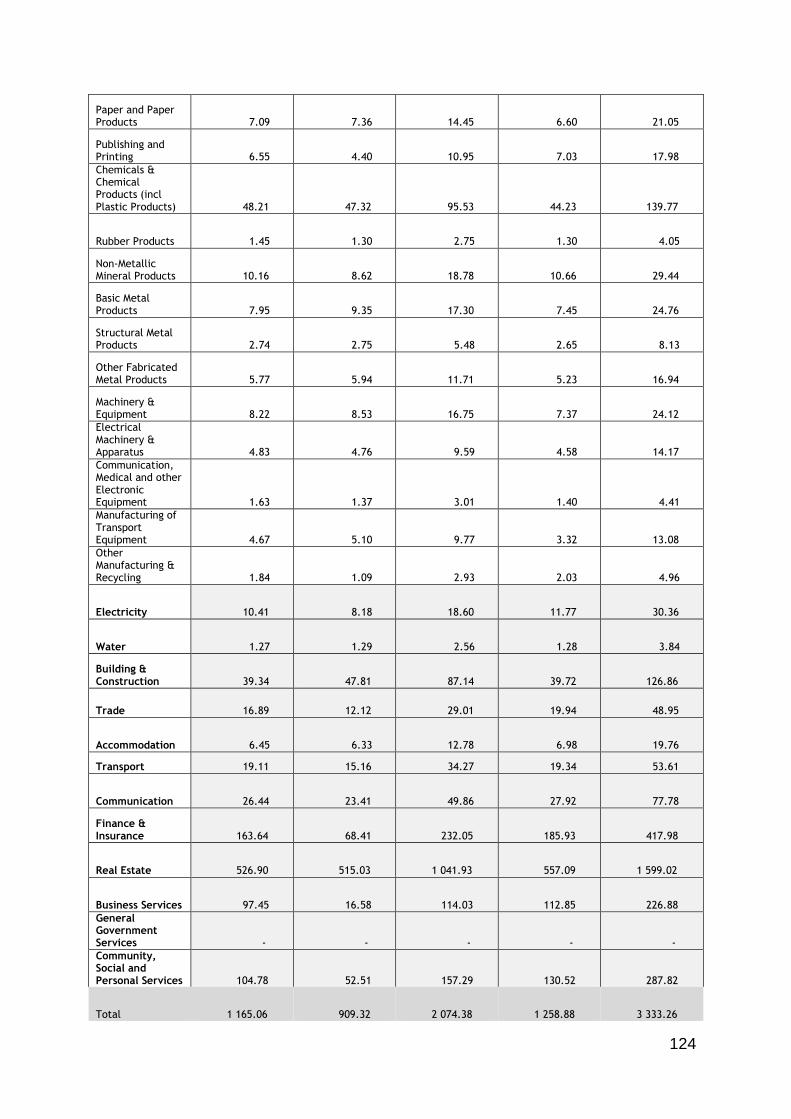
124
Paper and Paper Products 7.09 7.36 14.45 6.60 21.05
Publishing and Printing 6.55 4.40 10.95 7.03 17.98
Chemicals & Chemical Products (incl Plastic Products) 48.21 47.32 95.53 44.23 139.77
Rubber Products 1.45 1.30 2.75 1.30 4.05
Non-Metallic Mineral Products 10.16 8.62 18.78 10.66 29.44
Basic Metal Products 7.95 9.35 17.30 7.45 24.76
Structural Metal Products 2.74 2.75 5.48 2.65 8.13
Other Fabricated Metal Products 5.77 5.94 11.71 5.23 16.94
Machinery & Equipment 8.22 8.53 16.75 7.37 24.12
Electrical Machinery & Apparatus 4.83 4.76 9.59 4.58 14.17
Communication, Medical and other Electronic Equipment 1.63 1.37 3.01 1.40 4.41
Manufacturing of Transport Equipment 4.67 5.10 9.77 3.32 13.08
Other Manufacturing & Recycling 1.84 1.09 2.93 2.03 4.96
Electricity 10.41 8.18 18.60 11.77 30.36
Water 1.27 1.29 2.56 1.28 3.84
Building & Construction 39.34 47.81 87.14 39.72 126.86
Trade 16.89 12.12 29.01 19.94 48.95
Accommodation 6.45 6.33 12.78 6.98 19.76
Transport 19.11 15.16 34.27 19.34 53.61
Communication 26.44 23.41 49.86 27.92 77.78
Finance & Insurance 163.64 68.41 232.05 185.93 417.98
Real Estate 526.90 515.03 1 041.93 557.09 1 599.02
Business Services 97.45 16.58 114.03 112.85 226.88
General Government Services - - - - -
Community, Social and Personal Services 104.78 52.51 157.29 130.52 287.82
Total 1 165.06 909.32 2 074.38 1 258.88 3 333.26

125
Table A8-Production Multiplier (Business Services)
Activities Direct Indirect Direct + Indirect
Induced Direct + Indirect + Induced
Citrus Fruit Farming 0.00 0.00 0.01 0.00 0.01
Deciduous Fruit Farming 0.01 0.01 0.01 0.01 0.02
Subtropical Fruit Farming 0.00 0.00 0.00 0.00 0.00
Vegetable Farming 0.02 0.02 0.04 0.02 0.06
Livestock Farming 0.05 0.04 0.09 0.05 0.14
Game Farming 0.00 0.00 0.01 0.00 0.01
Dairy Farming (milk only) 0.02 0.02 0.03 0.02 0.05
Forestry 0.50 0.35 0.85 0.54 1.39
Fishing 0.02 0.02 0.03 0.02 0.05
Cereal and Crop Farming 0.10 0.11 0.21 0.09 0.30
Poultry Farming 0.11 0.09 0.20 0.12 0.32
Other Agriculture 0.12 0.08 0.20 0.12 0.33
Gold 0.00 0.00 0.01 0.00 0.01
Coal and lignite 0.56 0.27 0.82 0.65 1.47
Other Mining 1.67 1.37 3.04 1.82 4.86
Meat, Fish, Fruit, Vegetables, Oils and Fat Products 0.14 0.19 0.34 0.13 0.47
Dairy products 0.23 0.24 0.47 0.23 0.70
Grain Mill, Bakery and Animal Feed Products 0.18 0.21 0.39 0.18 0.57
Other food products 0.21 0.18 0.39 0.22 0.62
Beverages and tobacco products 0.50 0.39 0.89 0.54 1.43
Textiles, Clothing, Leather Products and Footwear 1.17 0.94 2.12 0.95 3.07
Wood and Wood Products 0.71 0.66 1.37 0.74 2.11
Furniture 5.35 4.80 10.15 5.31 15.46

126
Paper and Paper Products 3.78 3.92 7.69 3.51 11.21
Publishing and Printing 1.90 1.28 3.17 2.04 5.21
Chemicals & Chemical Products (incl Plastic Products) 9.72 9.54 19.26 8.92 28.17
Rubber Products 0.43 0.38 0.81 0.38 1.19
Non-Metallic Mineral Products 0.92 0.78 1.71 0.97 2.68
Basic Metal Products 1.89 2.23 4.12 1.78 5.90
Structural Metal Products 0.29 0.29 0.59 0.28 0.87
Other Fabricated Metal Products 0.90 0.93 1.83 0.82 2.65
Machinery & Equipment 2.23 2.32 4.55 2.00 6.55
Electrical Machinery & Apparatus 0.59 0.58 1.18 0.56 1.74
Communication, Medical and other Electronic Equipment 0.64 0.54 1.18 0.55 1.73
Manufacturing of Transport Equipment 1.87 2.04 3.90 1.32 5.23
Other Manufacturing & Recycling 1.30 0.77 2.07 1.44 3.51
Electricity 1.39 1.09 2.48 1.57 4.05
Water 0.07 0.07 0.15 0.07 0.22
Building & Construction 2.03 2.47 4.49 2.05 6.54
Trade 3.68 2.64 6.32 4.34 10.66
Accommodation 2.40 2.36 4.76 2.60 7.36
Transport 9.02 7.16 16.17 9.13 25.30
Communication 9.85 8.72 18.56 10.40 28.96
Finance & Insurance 7.09 2.96 10.05 8.05 18.11
Real Estate 3.43 3.36 6.79 3.63 10.42
Business Services 880.74 149.88 1 030.62 1 019.93 2 050.55
General Government Services - - - - -
Community, Social and Personal Services 19.31 9.68 28.99 24.06 53.05
Total 977.14 225.96 1 203.10 1 122.17 2 325.28
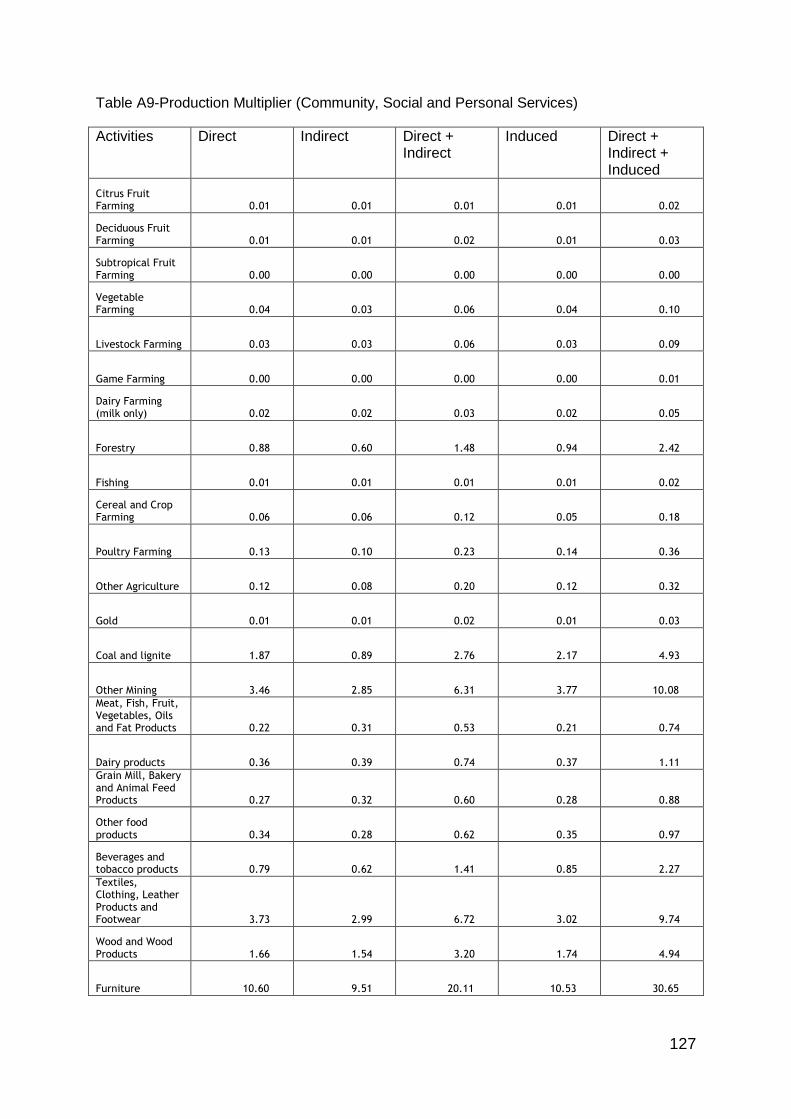
127
Table A9-Production Multiplier (Community, Social and Personal Services)
Activities Direct Indirect Direct + Indirect
Induced Direct + Indirect + Induced
Citrus Fruit Farming 0.01 0.01 0.01 0.01 0.02
Deciduous Fruit Farming 0.01 0.01 0.02 0.01 0.03
Subtropical Fruit Farming 0.00 0.00 0.00 0.00 0.00
Vegetable Farming 0.04 0.03 0.06 0.04 0.10
Livestock Farming 0.03 0.03 0.06 0.03 0.09
Game Farming 0.00 0.00 0.00 0.00 0.01
Dairy Farming (milk only) 0.02 0.02 0.03 0.02 0.05
Forestry 0.88 0.60 1.48 0.94 2.42
Fishing 0.01 0.01 0.01 0.01 0.02
Cereal and Crop Farming 0.06 0.06 0.12 0.05 0.18
Poultry Farming 0.13 0.10 0.23 0.14 0.36
Other Agriculture 0.12 0.08 0.20 0.12 0.32
Gold 0.01 0.01 0.02 0.01 0.03
Coal and lignite 1.87 0.89 2.76 2.17 4.93
Other Mining 3.46 2.85 6.31 3.77 10.08
Meat, Fish, Fruit, Vegetables, Oils and Fat Products 0.22 0.31 0.53 0.21 0.74
Dairy products 0.36 0.39 0.74 0.37 1.11
Grain Mill, Bakery and Animal Feed Products 0.27 0.32 0.60 0.28 0.88
Other food products 0.34 0.28 0.62 0.35 0.97
Beverages and tobacco products 0.79 0.62 1.41 0.85 2.27
Textiles, Clothing, Leather Products and Footwear 3.73 2.99 6.72 3.02 9.74
Wood and Wood Products 1.66 1.54 3.20 1.74 4.94
Furniture 10.60 9.51 20.11 10.53 30.65

128
Paper and Paper Products 6.59 6.84 13.43 6.13 19.56
Publishing and Printing 3.30 2.22 5.52 3.55 9.07
Chemicals & Chemical Products (incl Plastic Products) 27.23 26.73 53.96 24.98 78.95
Rubber Products 6.14 5.49 11.64 5.48 17.12
Non-Metallic Mineral Products 1.46 1.24 2.70 1.53 4.23
Basic Metal Products 5.28 6.21 11.49 4.95 16.44
Structural Metal Products 0.28 0.28 0.57 0.27 0.84
Other Fabricated Metal Products 3.79 3.90 7.69 3.43 11.12
Machinery & Equipment 6.48 6.73 13.21 5.82 19.03
Electrical Machinery & Apparatus 1.09 1.08 2.17 1.03 3.20
Communication, Medical and other Electronic Equipment 1.10 0.92 2.02 0.94 2.96
Manufacturing of Transport Equipment 16.65 18.17 34.82 11.82 46.64
Other Manufacturing & Recycling 3.03 1.80 4.83 3.34 8.17
Electricity 4.99 3.92 8.91 5.64 14.56
Water 0.29 0.30 0.59 0.30 0.89
Building & Construction 3.42 4.15 7.57 3.45 11.02
Trade 8.00 5.74 13.74 9.45 23.19
Accommodation 3.30 3.24 6.54 3.57 10.11
Transport 12.91 10.25 23.16 13.07 36.23
Communication 13.53 11.98 25.50 14.28 39.78
Finance & Insurance 8.00 3.34 11.34 9.09 20.43
Real Estate 4.75 4.65 9.40 5.03 14.43
Business Services 51.12 8.70 59.82 59.20 119.02
General Government Services - - - - -
Community, Social and Personal Services 789.74 395.79 1 185.52 983.74 2 169.27
Total 1 007.09 554.32 1 561.41 1 204.78 2 766.19

129
Annexure B
GDP multiplier results for each services sector
Table B1-GDP Multiplier (Building and Construction)
Activities Direct Indirect Direct + Indirect
Induced Direct + Indirect + Induced
Citrus Fruit Farming 0.00 0.00 0.00 0.00 0.01
Deciduous Fruit Farming 0.00 0.00 0.01 0.00 0.01
Subtropical Fruit Farming 0.00 0.00 0.00 0.00 0.00
Vegetable Farming 0.02 0.01 0.03 0.02 0.04
Livestock Farming 0.02 0.02 0.03 0.02 0.05
Game Farming 0.00 0.00 0.00 0.00 0.00
Dairy Farming (milk only) 0.01 0.01 0.01 0.01 0.02
Forestry 1.68 1.04 2.72 1.70 4.42
Fishing 0.00 0.00 0.01 0.01 0.01
Cereal and Crop Farming 0.02 0.04 0.06 0.04 0.10
Poultry Farming 0.06 0.04 0.09 0.06 0.15
Other Agriculture 0.08 0.05 0.14 0.09 0.23
Gold 0.00 0.00 0.00 0.00 0.00
Coal and lignite 3.55 1.04 4.59 2.97 7.57
Other Mining 14.93 11.04 25.98 16.87 42.84
Meat, Fish, Fruit, Vegetables, Oils and Fat Products 0.02 0.15 0.17 0.11 0.29
Dairy products 0.09 0.21 0.31 0.20 0.51
Grain Mill, Bakery and Animal Feed Products 0.06 0.17 0.24 0.15 0.39
Other food products 0.16 0.13 0.29 0.19 0.48
Beverages and tobacco products 0.35 0.31 0.66 0.44 1.10
Textiles, Clothing, Leather Products and Footwear 1.99 2.91 4.90 3.23 8.13
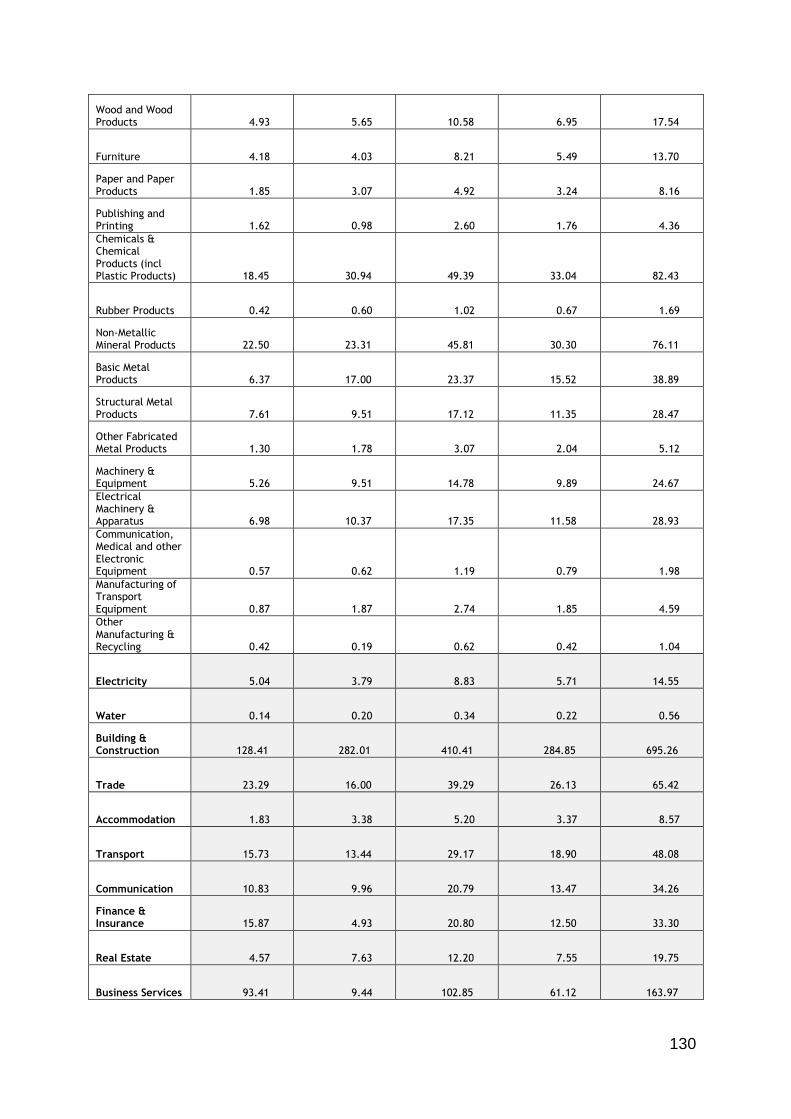
130
Wood and Wood Products 4.93 5.65 10.58 6.95 17.54
Furniture 4.18 4.03 8.21 5.49 13.70
Paper and Paper Products 1.85 3.07 4.92 3.24 8.16
Publishing and Printing 1.62 0.98 2.60 1.76 4.36
Chemicals & Chemical Products (incl Plastic Products) 18.45 30.94 49.39 33.04 82.43
Rubber Products 0.42 0.60 1.02 0.67 1.69
Non-Metallic Mineral Products 22.50 23.31 45.81 30.30 76.11
Basic Metal Products 6.37 17.00 23.37 15.52 38.89
Structural Metal Products 7.61 9.51 17.12 11.35 28.47
Other Fabricated Metal Products 1.30 1.78 3.07 2.04 5.12
Machinery & Equipment 5.26 9.51 14.78 9.89 24.67
Electrical Machinery & Apparatus 6.98 10.37 17.35 11.58 28.93
Communication, Medical and other Electronic Equipment 0.57 0.62 1.19 0.79 1.98
Manufacturing of Transport Equipment 0.87 1.87 2.74 1.85 4.59
Other Manufacturing & Recycling 0.42 0.19 0.62 0.42 1.04
Electricity 5.04 3.79 8.83 5.71 14.55
Water 0.14 0.20 0.34 0.22 0.56
Building & Construction 128.41 282.01 410.41 284.85 695.26
Trade 23.29 16.00 39.29 26.13 65.42
Accommodation 1.83 3.38 5.20 3.37 8.57
Transport 15.73 13.44 29.17 18.90 48.08
Communication 10.83 9.96 20.79 13.47 34.26
Finance & Insurance 15.87 4.93 20.80 12.50 33.30
Real Estate 4.57 7.63 12.20 7.55 19.75
Business Services 93.41 9.44 102.85 61.12 163.97

131
General Government Services - - - - -
Community, Social and Personal Services 18.74 7.76 26.50 18.34 44.84
Total 424.24 495.15 919.39 613.19 1 532.58

132
Table B2-GDP Multiplier (Trade)
Activities Direct Indirect Direct + Indirect
Induced Direct + Indirect + Induced
Citrus Fruit Farming 0.00 0.00 0.01 0.00 0.01
Deciduous Fruit Farming 0.01 0.00 0.01 0.01 0.02
Subtropical Fruit Farming 0.00 0.00 0.00 0.00 0.00
Vegetable Farming 0.03 0.02 0.05 0.03 0.08
Livestock Farming 0.03 0.03 0.06 0.04 0.10
Game Farming 0.00 0.00 0.01 0.00 0.01
Dairy Farming (milk only) 0.01 0.01 0.02 0.01 0.04
Forestry 0.83 0.51 1.34 0.84 2.17
Fishing 0.01 0.01 0.02 0.01 0.03
Cereal and Crop Farming 0.03 0.07 0.11 0.07 0.18
Poultry Farming 0.11 0.07 0.17 0.11 0.28
Other Agriculture 0.12 0.08 0.19 0.12 0.32
Gold 0.00 0.00 0.00 0.00 0.00
Coal and lignite 1.72 0.50 2.23 1.44 3.67
Other Mining 2.54 1.88 4.42 2.87 7.29
Meat, Fish, Fruit, Vegetables, Oils and Fat Products 0.04 0.25 0.29 0.19 0.47
Dairy products 0.15 0.35 0.50 0.33 0.83
Grain Mill, Bakery and Animal Feed Products 0.11 0.28 0.38 0.25 0.63
Other food products 0.25 0.22 0.47 0.31 0.78
Beverages and tobacco products 0.61 0.53 1.14 0.75 1.89
Textiles, Clothing, Leather Products and Footwear 1.32 1.94 3.26 2.15 5.40
Wood and Wood Products 0.98 1.12 2.10 1.38 3.49
Furniture 5.69 5.48 11.17 7.46 18.63

133
Paper and Paper Products 3.37 5.58 8.95 5.89 14.83
Publishing and Printing 2.41 1.46 3.87 2.63 6.50
Chemicals & Chemical Products (incl Plastic Products) 11.88 19.92 31.80 21.27 53.07
Rubber Products 0.59 0.85 1.44 0.95 2.39
Non-Metallic Mineral Products 1.14 1.18 2.33 1.54 3.86
Basic Metal Products 1.28 3.42 4.70 3.12 7.83
Structural Metal Products 0.29 0.37 0.66 0.44 1.09
Other Fabricated Metal Products 0.89 1.22 2.11 1.40 3.51
Machinery & Equipment 2.45 4.43 6.88 4.60 11.48
Electrical Machinery & Apparatus 0.66 0.98 1.64 1.09 2.73
Communication, Medical and other Electronic Equipment 0.90 0.99 1.89 1.26 3.15
Manufacturing of Transport Equipment 1.17 2.53 3.70 2.49 6.19
Other Manufacturing & Recycling 0.58 0.26 0.84 0.57 1.41
Electricity 4.57 3.44 8.01 5.18 13.19
Water 0.14 0.20 0.34 0.22 0.56
Building & Construction 2.91 6.39 9.30 6.45 15.75
Trade 71.03 48.80 119.82 79.71 199.53
Accommodation 3.52 6.52 10.04 6.50 16.55
Transport 18.48 15.80 34.28 22.21 56.49
Communication 20.90 19.22 40.12 25.98 66.11
Finance & Insurance 26.59 8.26 34.84 20.94 55.78
Real Estate 6.24 10.41 16.65 10.31 26.96
Business Services 104.79 10.59 115.38 68.57 183.95
General Government Services - - - - -
Community, Social and Personal Services 13.69 5.67 19.37 13.41 32.77
Total 315.08 191.84 506.91 325.13 832.05

134
Table B3-GDP Multiplier (Accommodation)
Activities Direct Indirect Direct + Indirect
Induced Direct + Indirect + Induced
Citrus Fruit Farming 0.09 0.07 0.16 0.10 0.27
Deciduous Fruit Farming 0.15 0.08 0.23 0.14 0.37
Subtropical Fruit Farming 0.03 0.01 0.04 0.03 0.07
Vegetable Farming 0.93 0.64 1.56 0.99 2.55
Livestock Farming 0.39 0.38 0.78 0.49 1.27
Game Farming 0.03 0.03 0.06 0.04 0.11
Dairy Farming (milk only) 0.17 0.22 0.39 0.25 0.64
Forestry 0.75 0.46 1.21 0.76 1.97
Fishing 0.07 0.08 0.15 0.10 0.25
Cereal and Crop Farming 0.42 0.94 1.36 0.88 2.24
Poultry Farming 1.96 1.22 3.18 1.97 5.15
Other Agriculture 1.59 1.03 2.63 1.65 4.28
Gold 0.00 0.00 0.00 0.00 0.01
Coal and lignite 4.81 1.41 6.22 4.02 10.24
Other Mining 2.68 1.98 4.67 3.03 7.70
Meat, Fish, Fruit, Vegetables, Oils and Fat Products 0.79 5.19 5.98 3.87 9.84
Dairy products 3.19 7.26 10.46 6.84 17.30
Grain Mill, Bakery and Animal Feed Products 2.19 5.79 7.99 5.16 13.14
Other food products 5.30 4.53 9.83 6.50 16.33
Beverages and tobacco products 12.94 11.40 24.34 16.08 40.43
Textiles, Clothing, Leather Products and Footwear 1.13 1.66 2.79 1.84 4.64
Wood and Wood Products 1.17 1.34 2.51 1.65 4.16

135
Furniture 5.21 5.02 10.23 6.84 17.07
Paper and Paper Products 2.48 4.11 6.59 4.33 10.92
Publishing and Printing 1.70 1.03 2.73 1.86 4.59
Chemicals & Chemical Products (incl Plastic Products) 10.41 17.46 27.87 18.65 46.52
Rubber Products 0.36 0.52 0.88 0.58 1.47
Non-Metallic Mineral Products 2.70 2.80 5.50 3.64 9.14
Basic Metal Products 1.35 3.59 4.94 3.28 8.22
Structural Metal Products 0.23 0.29 0.52 0.35 0.87
Other Fabricated Metal Products 1.47 2.02 3.49 2.32 5.81
Machinery & Equipment 2.39 4.33 6.72 4.50 11.23
Electrical Machinery & Apparatus 0.95 1.40 2.35 1.57 3.92
Communication, Medical and other Electronic Equipment 0.52 0.58 1.10 0.73 1.83
Manufacturing of Transport Equipment 0.68 1.46 2.14 1.44 3.57
Other Manufacturing & Recycling 0.78 0.36 1.14 0.77 1.91
Electricity 19.95 15.02 34.97 22.62 57.59
Water 0.82 1.15 1.97 1.27 3.24
Building & Construction 2.59 5.68 8.27 5.74 14.01
Trade 10.75 7.39 18.14 12.06 30.20
Accommodation 149.55 276.64 426.19 276.03 702.22
Transport 10.76 9.19 19.95 12.93 32.88
Communication 11.85 10.89 22.74 14.73 37.47
Finance & Insurance 24.44 7.59 32.02 19.24 51.27
Real Estate 4.04 6.75 10.79 6.68 17.47
Business Services 201.34 20.35 221.69 131.75 353.45
General Government Services - - - - -
Community, Social and Personal Services 20.83 8.63 29.45 20.39 49.84
Total 528.95 459.98 988.93 630.69 1 619.63

136
Table B4-GDP Multiplier (Transport)
Activities Direct Indirect Direct + Indirect
Induced Direct + Indirect + Induced
Citrus Fruit Farming 0.00 0.00 0.01 0.00 0.01
Deciduous Fruit Farming 0.00 0.00 0.01 0.00 0.01
Subtropical Fruit Farming 0.00 0.00 0.00 0.00 0.00
Vegetable Farming 0.02 0.01 0.03 0.02 0.04
Livestock Farming 0.02 0.02 0.03 0.02 0.05
Game Farming 0.00 0.00 0.00 0.00 0.00
Dairy Farming (milk only) 0.01 0.01 0.01 0.01 0.02
Forestry 0.75 0.46 1.21 0.76 1.96
Fishing 0.00 0.00 0.01 0.00 0.01
Cereal and Crop Farming 0.02 0.04 0.06 0.04 0.09
Poultry Farming 0.06 0.04 0.09 0.06 0.15
Other Agriculture 0.10 0.07 0.17 0.11 0.28
Gold 0.01 0.00 0.01 0.01 0.01
Coal and lignite 3.23 0.94 4.17 2.70 6.87
Other Mining 5.69 4.21 9.89 6.42 16.31
Meat, Fish, Fruit, Vegetables, Oils and Fat Products 0.03 0.18 0.21 0.14 0.35
Dairy products 0.11 0.26 0.37 0.24 0.61
Grain Mill, Bakery and Animal Feed Products 0.08 0.20 0.28 0.18 0.46
Other food products 0.19 0.16 0.35 0.23 0.58
Beverages and tobacco products 0.45 0.39 0.84 0.56 1.40
Textiles, Clothing, Leather Products and Footwear 2.41 3.54 5.95 3.93 9.88
Wood and Wood Products 1.10 1.26 2.36 1.55 3.91
Furniture 3.78 3.64 7.42 4.96 12.38

137
Paper and Paper Products 2.63 4.36 6.99 4.60 11.59
Publishing and Printing 1.52 0.92 2.43 1.65 4.09
Chemicals & Chemical Products (incl Plastic Products) 34.30 57.51 91.81 61.42 153.22
Rubber Products 2.35 3.36 5.71 3.78 9.49
Non-Metallic Mineral Products 1.83 1.89 3.72 2.46 6.18
Basic Metal Products 1.97 5.27 7.25 4.81 12.06
Structural Metal Products 0.23 0.29 0.52 0.34 0.86
Other Fabricated Metal Products 1.85 2.53 4.39 2.92 7.31
Machinery & Equipment 2.78 5.03 7.81 5.22 13.03
Electrical Machinery & Apparatus 1.49 2.21 3.69 2.46 6.16
Communication, Medical and other Electronic Equipment 0.56 0.62 1.18 0.78 1.96
Manufacturing of Transport Equipment 4.30 9.26 13.56 9.14 22.70
Other Manufacturing & Recycling 1.76 0.80 2.56 1.74 4.30
Electricity 7.10 5.34 12.44 8.04 20.48
Water 0.24 0.33 0.57 0.37 0.93
Building & Construction 2.55 5.60 8.14 5.65 13.80
Trade 9.74 6.69 16.43 10.93 27.37
Accommodation 1.72 3.17 4.89 3.17 8.05
Transport 218.35 186.62 404.97 262.44 667.41
Communication 10.18 9.36 19.53 12.65 32.18
Finance & Insurance 18.03 5.60 23.63 14.20 37.83
Real Estate 8.07 13.48 21.55 13.35 34.89
Business Services 72.26 7.30 79.56 47.28 126.85
General Government Services - - - - -
Community, Social and Personal Services 41.23 17.08 58.30 40.37 98.67
Total 465.07 370.04 835.11 541.70 1 376.81
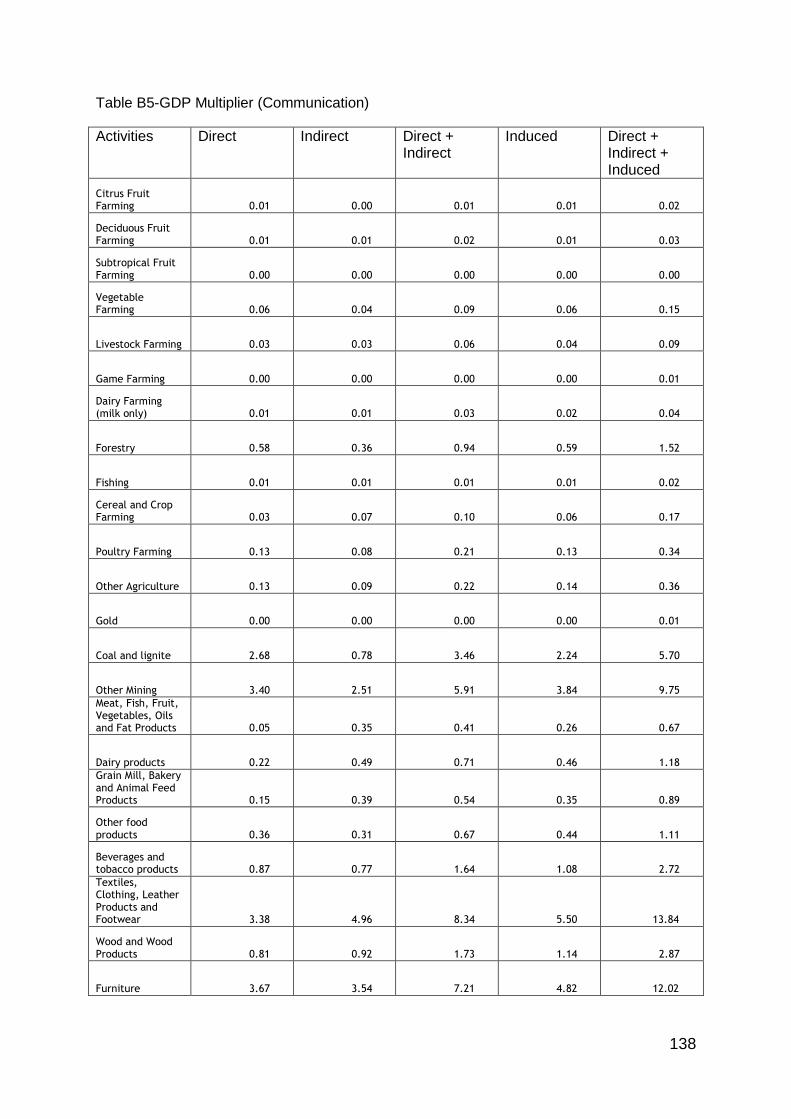
138
Table B5-GDP Multiplier (Communication)
Activities Direct Indirect Direct + Indirect
Induced Direct + Indirect + Induced
Citrus Fruit Farming 0.01 0.00 0.01 0.01 0.02
Deciduous Fruit Farming 0.01 0.01 0.02 0.01 0.03
Subtropical Fruit Farming 0.00 0.00 0.00 0.00 0.00
Vegetable Farming 0.06 0.04 0.09 0.06 0.15
Livestock Farming 0.03 0.03 0.06 0.04 0.09
Game Farming 0.00 0.00 0.00 0.00 0.01
Dairy Farming (milk only) 0.01 0.01 0.03 0.02 0.04
Forestry 0.58 0.36 0.94 0.59 1.52
Fishing 0.01 0.01 0.01 0.01 0.02
Cereal and Crop Farming 0.03 0.07 0.10 0.06 0.17
Poultry Farming 0.13 0.08 0.21 0.13 0.34
Other Agriculture 0.13 0.09 0.22 0.14 0.36
Gold 0.00 0.00 0.00 0.00 0.01
Coal and lignite 2.68 0.78 3.46 2.24 5.70
Other Mining 3.40 2.51 5.91 3.84 9.75
Meat, Fish, Fruit, Vegetables, Oils and Fat Products 0.05 0.35 0.41 0.26 0.67
Dairy products 0.22 0.49 0.71 0.46 1.18
Grain Mill, Bakery and Animal Feed Products 0.15 0.39 0.54 0.35 0.89
Other food products 0.36 0.31 0.67 0.44 1.11
Beverages and tobacco products 0.87 0.77 1.64 1.08 2.72
Textiles, Clothing, Leather Products and Footwear 3.38 4.96 8.34 5.50 13.84
Wood and Wood Products 0.81 0.92 1.73 1.14 2.87
Furniture 3.67 3.54 7.21 4.82 12.02

139
Paper and Paper Products 2.11 3.49 5.60 3.68 9.28
Publishing and Printing 4.72 2.86 7.58 5.15 12.73
Chemicals & Chemical Products (incl Plastic Products) 12.76 21.40 34.16 22.85 57.01
Rubber Products 0.62 0.88 1.50 0.99 2.49
Non-Metallic Mineral Products 0.98 1.02 2.00 1.32 3.32
Basic Metal Products 3.67 9.79 13.46 8.94 22.40
Structural Metal Products 0.11 0.14 0.25 0.17 0.42
Other Fabricated Metal Products 1.17 1.60 2.77 1.84 4.61
Machinery & Equipment 5.37 9.71 15.09 10.10 25.18
Electrical Machinery & Apparatus 1.35 2.01 3.36 2.24 5.60
Communication, Medical and other Electronic Equipment 10.97 12.09 23.06 15.34 38.40
Manufacturing of Transport Equipment 1.15 2.47 3.62 2.44 6.07
Other Manufacturing & Recycling 0.60 0.27 0.88 0.60 1.47
Electricity 7.26 5.46 12.72 8.22 20.94
Water 0.19 0.26 0.45 0.29 0.74
Building & Construction 0.94 2.07 3.01 2.09 5.11
Trade 10.89 7.48 18.36 12.22 30.58
Accommodation 8.60 15.91 24.51 15.88 40.39
Transport 18.64 15.93 34.58 22.41 56.99
Communication 275.42 253.22 528.64 342.32 870.96
Finance & Insurance 15.17 4.71 19.88 11.95 31.82
Real Estate 2.12 3.54 5.66 3.50 9.16
Business Services 49.87 5.04 54.91 32.63 87.54
General Government Services - - - - -
Community, Social and Personal Services 12.28 5.09 17.37 12.03 29.40
Total 463.55 402.18 865.73 560.39 1 426.11

140
Table B6-GDP Multiplier (Finance and Insurance)
Activities Direct Indirect Direct + Indirect
Induced Direct + Indirect + Induced
Citrus Fruit Farming 0.00 0.00 0.00 0.00 0.00
Deciduous Fruit Farming 0.00 0.00 0.00 0.00 0.00
Subtropical Fruit Farming 0.00 0.00 0.00 0.00 0.00
Vegetable Farming 0.01 0.00 0.01 0.01 0.02
Livestock Farming 0.01 0.00 0.01 0.01 0.02
Game Farming 0.00 0.00 0.00 0.00 0.00
Dairy Farming (milk only) 0.00 0.00 0.00 0.00 0.01
Forestry 0.38 0.23 0.61 0.38 0.99
Fishing 0.00 0.00 0.00 0.00 0.00
Cereal and Crop Farming 0.01 0.01 0.02 0.01 0.03
Poultry Farming 0.02 0.01 0.03 0.02 0.05
Other Agriculture 0.02 0.02 0.04 0.03 0.07
Gold 0.00 0.00 0.00 0.00 0.01
Coal and lignite 0.61 0.18 0.79 0.51 1.30
Other Mining 0.86 0.63 1.49 0.97 2.46
Meat, Fish, Fruit, Vegetables, Oils and Fat Products 0.01 0.05 0.06 0.04 0.10
Dairy products 0.03 0.07 0.10 0.07 0.17
Grain Mill, Bakery and Animal Feed Products 0.02 0.06 0.08 0.05 0.13
Other food products 0.05 0.04 0.10 0.06 0.16
Beverages and tobacco products 0.12 0.11 0.23 0.15 0.38
Textiles, Clothing, Leather Products and Footwear 0.40 0.58 0.98 0.65 1.63
Wood and Wood Products 0.42 0.48 0.89 0.59 1.48
Furniture 3.41 3.28 6.69 4.47 11.17

141
Paper and Paper Products 1.59 2.63 4.22 2.78 7.00
Publishing and Printing 2.34 1.42 3.75 2.54 6.30
Chemicals & Chemical Products (incl Plastic Products) 3.45 5.79 9.24 6.18 15.42
Rubber Products 0.25 0.36 0.61 0.40 1.01
Non-Metallic Mineral Products 0.47 0.48 0.95 0.63 1.58
Basic Metal Products 0.40 1.08 1.48 0.98 2.46
Structural Metal Products 0.10 0.13 0.23 0.15 0.38
Other Fabricated Metal Products 0.37 0.51 0.88 0.58 1.46
Machinery & Equipment 0.60 1.08 1.68 1.12 2.80
Electrical Machinery & Apparatus 0.22 0.33 0.55 0.36 0.91
Communication, Medical and other Electronic Equipment 0.18 0.20 0.37 0.25 0.62
Manufacturing of Transport Equipment 0.47 1.02 1.49 1.00 2.50
Other Manufacturing & Recycling 0.64 0.29 0.93 0.63 1.57
Electricity 1.58 1.19 2.78 1.80 4.57
Water 0.08 0.11 0.18 0.12 0.30
Building & Construction 1.01 2.23 3.24 2.25 5.49
Trade 2.82 1.94 4.75 3.16 7.91
Accommodation 0.66 1.23 1.89 1.22 3.11
Transport 3.88 3.32 7.20 4.67 11.87
Communication 3.93 3.62 7.55 4.89 12.44
Finance & Insurance 535.19 166.21 701.40 421.50 1 122.90
Real Estate 12.58 21.01 33.60 20.81 54.40
Business Services 46.57 4.71 51.28 30.47 81.75
General Government Services - - - - -
Community, Social and Personal Services 40.86 16.92 57.78 40.00 97.78
Total 666.63 243.54 910.17 556.53 1 466.70
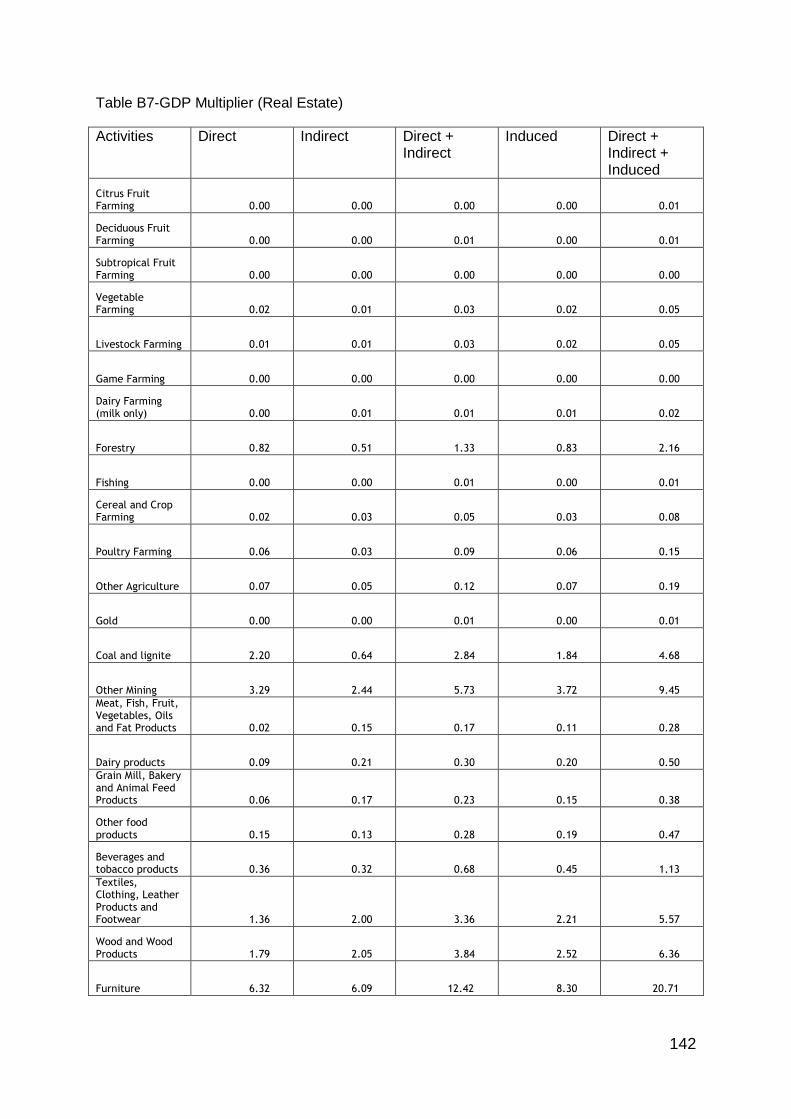
142
Table B7-GDP Multiplier (Real Estate)
Activities Direct Indirect Direct + Indirect
Induced Direct + Indirect + Induced
Citrus Fruit Farming 0.00 0.00 0.00 0.00 0.01
Deciduous Fruit Farming 0.00 0.00 0.01 0.00 0.01
Subtropical Fruit Farming 0.00 0.00 0.00 0.00 0.00
Vegetable Farming 0.02 0.01 0.03 0.02 0.05
Livestock Farming 0.01 0.01 0.03 0.02 0.05
Game Farming 0.00 0.00 0.00 0.00 0.00
Dairy Farming (milk only) 0.00 0.01 0.01 0.01 0.02
Forestry 0.82 0.51 1.33 0.83 2.16
Fishing 0.00 0.00 0.01 0.00 0.01
Cereal and Crop Farming 0.02 0.03 0.05 0.03 0.08
Poultry Farming 0.06 0.03 0.09 0.06 0.15
Other Agriculture 0.07 0.05 0.12 0.07 0.19
Gold 0.00 0.00 0.01 0.00 0.01
Coal and lignite 2.20 0.64 2.84 1.84 4.68
Other Mining 3.29 2.44 5.73 3.72 9.45
Meat, Fish, Fruit, Vegetables, Oils and Fat Products 0.02 0.15 0.17 0.11 0.28
Dairy products 0.09 0.21 0.30 0.20 0.50
Grain Mill, Bakery and Animal Feed Products 0.06 0.17 0.23 0.15 0.38
Other food products 0.15 0.13 0.28 0.19 0.47
Beverages and tobacco products 0.36 0.32 0.68 0.45 1.13
Textiles, Clothing, Leather Products and Footwear 1.36 2.00 3.36 2.21 5.57
Wood and Wood Products 1.79 2.05 3.84 2.52 6.36
Furniture 6.32 6.09 12.42 8.30 20.71

143
Paper and Paper Products 1.88 3.12 5.00 3.29 8.28
Publishing and Printing 3.21 1.95 5.16 3.50 8.66
Chemicals & Chemical Products (incl Plastic Products) 12.30 20.62 32.92 22.02 54.94
Rubber Products 0.40 0.57 0.98 0.65 1.62
Non-Metallic Mineral Products 3.94 4.08 8.02 5.31 13.33
Basic Metal Products 1.52 4.06 5.58 3.71 9.29
Structural Metal Products 0.89 1.10 1.99 1.32 3.31
Other Fabricated Metal Products 1.65 2.26 3.91 2.60 6.51
Machinery & Equipment 1.95 3.53 5.49 3.67 9.16
Electrical Machinery & Apparatus 1.38 2.04 3.42 2.28 5.70
Communication, Medical and other Electronic Equipment 0.50 0.55 1.05 0.70 1.75
Manufacturing of Transport Equipment 0.78 1.67 2.45 1.65 4.10
Other Manufacturing & Recycling 1.02 0.46 1.48 1.01 2.49
Electricity 5.17 3.89 9.06 5.86 14.91
Water 0.41 0.58 1.00 0.64 1.63
Building & Construction 8.90 19.55 28.45 19.75 48.20
Trade 8.85 6.08 14.93 9.93 24.87
Accommodation 1.89 3.49 5.37 3.48 8.85
Transport 8.02 6.85 14.87 9.63 24.50
Communication 11.19 10.29 21.47 13.90 35.38
Finance & Insurance 117.93 36.62 154.55 92.87 247.42
Real Estate 168.18 280.81 449.00 278.09 727.08
Business Services 86.15 8.71 94.86 56.37 151.23
General Government Services - - - - -
Community, Social and Personal Services 66.58 27.58 94.15 65.18 159.34
Total 531.35 465.33 996.69 628.16 1 624.85

144
Table B8-GDP Multiplier (Business Services)
Activities Direct Indirect Direct + Indirect
Induced Direct + Indirect + Induced
Citrus Fruit Farming 0.00 0.00 0.00 0.00 0.01
Deciduous Fruit Farming 0.00 0.00 0.01 0.00 0.01
Subtropical Fruit Farming 0.00 0.00 0.00 0.00 0.00
Vegetable Farming 0.01 0.01 0.02 0.01 0.03
Livestock Farming 0.02 0.02 0.04 0.03 0.06
Game Farming 0.00 0.00 0.00 0.00 0.01
Dairy Farming (milk only) 0.01 0.01 0.01 0.01 0.02
Forestry 0.26 0.16 0.43 0.27 0.69
Fishing 0.01 0.01 0.01 0.01 0.02
Cereal and Crop Farming 0.02 0.05 0.07 0.04 0.11
Poultry Farming 0.06 0.04 0.10 0.06 0.15
Other Agriculture 0.06 0.04 0.10 0.06 0.16
Gold 0.00 0.00 0.00 0.00 0.01
Coal and lignite 0.38 0.11 0.49 0.32 0.82
Other Mining 0.80 0.59 1.39 0.90 2.29
Meat, Fish, Fruit, Vegetables, Oils and Fat Products 0.01 0.09 0.10 0.07 0.17
Dairy products 0.05 0.12 0.18 0.12 0.30
Grain Mill, Bakery and Animal Feed Products 0.04 0.10 0.14 0.09 0.23
Other food products 0.09 0.08 0.17 0.11 0.28
Beverages and tobacco products 0.22 0.19 0.41 0.27 0.68
Textiles, Clothing, Leather Products and Footwear 0.29 0.43 0.72 0.47 1.19
Wood and Wood Products 0.26 0.30 0.56 0.37 0.93
Furniture 2.02 1.94 3.96 2.65 6.61

145
Paper and Paper Products 1.00 1.66 2.66 1.75 4.41
Publishing and Printing 0.93 0.56 1.50 1.01 2.51
Chemicals & Chemical Products (incl Plastic Products) 2.48 4.16 6.63 4.44 11.07
Rubber Products 0.12 0.17 0.29 0.19 0.47
Non-Metallic Mineral Products 0.36 0.37 0.73 0.48 1.21
Basic Metal Products 0.36 0.97 1.33 0.88 2.21
Structural Metal Products 0.09 0.12 0.21 0.14 0.35
Other Fabricated Metal Products 0.26 0.35 0.61 0.41 1.02
Machinery & Equipment 0.53 0.96 1.49 1.00 2.49
Electrical Machinery & Apparatus 0.17 0.25 0.42 0.28 0.70
Communication, Medical and other Electronic Equipment 0.20 0.22 0.41 0.27 0.68
Manufacturing of Transport Equipment 0.31 0.67 0.98 0.66 1.64
Other Manufacturing & Recycling 0.72 0.33 1.05 0.71 1.76
Electricity 0.69 0.52 1.21 0.78 1.99
Water 0.02 0.03 0.06 0.04 0.09
Building & Construction 0.46 1.01 1.47 1.02 2.49
Trade 1.93 1.32 3.25 2.16 5.42
Accommodation 0.70 1.30 2.00 1.30 3.30
Transport 3.78 3.23 7.02 4.55 11.56
Communication 4.17 3.83 7.99 5.18 13.17
Finance & Insurance 5.11 1.59 6.70 4.02 10.72
Real Estate 1.10 1.83 2.93 1.81 4.74
Business Services 778.62 78.69 857.31 509.50 1 366.81
General Government Services - - - - -
Community, Social and Personal Services 12.27 5.08 17.35 12.01 29.37
Total 821.00 113.51 934.51 560.46 1 494.97

146
Table B9-GDP Multiplier (Community, Social and Personal Services)
Activities Direct Indirect Direct + Indirect
Induced Direct + Indirect + Induced
Citrus Fruit Farming 0.00 0.00 0.01 0.00 0.01
Deciduous Fruit Farming 0.00 0.00 0.01 0.00 0.01
Subtropical Fruit Farming 0.00 0.00 0.00 0.00 0.00
Vegetable Farming 0.02 0.01 0.03 0.02 0.05
Livestock Farming 0.01 0.01 0.02 0.02 0.04
Game Farming 0.00 0.00 0.00 0.00 0.00
Dairy Farming (milk only) 0.01 0.01 0.01 0.01 0.02
Forestry 0.46 0.28 0.74 0.47 1.21
Fishing 0.00 0.00 0.01 0.00 0.01
Cereal and Crop Farming 0.01 0.03 0.04 0.03 0.07
Poultry Farming 0.07 0.04 0.11 0.07 0.18
Other Agriculture 0.06 0.04 0.10 0.06 0.16
Gold 0.01 0.00 0.01 0.01 0.01
Coal and lignite 1.29 0.38 1.66 1.07 2.74
Other Mining 1.66 1.23 2.88 1.87 4.76
Meat, Fish, Fruit, Vegetables, Oils and Fat Products 0.02 0.14 0.16 0.10 0.27
Dairy products 0.09 0.20 0.28 0.18 0.47
Grain Mill, Bakery and Animal Feed Products 0.06 0.16 0.22 0.14 0.36
Other food products 0.14 0.12 0.27 0.18 0.44
Beverages and tobacco products 0.34 0.30 0.64 0.42 1.07
Textiles, Clothing, Leather Products and Footwear 0.93 1.36 2.29 1.51 3.79
Wood and Wood Products 0.61 0.70 1.32 0.87 2.19
Furniture 4.00 3.85 7.85 5.25 13.09

147
Paper and Paper Products 1.75 2.90 4.64 3.05 7.70
Publishing and Printing 1.62 0.98 2.60 1.77 4.37
Chemicals & Chemical Products (incl Plastic Products) 6.95 11.65 18.59 12.44 31.03
Rubber Products 1.70 2.43 4.13 2.73 6.86
Non-Metallic Mineral Products 0.57 0.59 1.15 0.76 1.92
Basic Metal Products 1.01 2.70 3.71 2.46 6.17
Structural Metal Products 0.09 0.11 0.21 0.14 0.34
Other Fabricated Metal Products 1.08 1.48 2.57 1.71 4.28
Machinery & Equipment 1.54 2.79 4.33 2.90 7.22
Electrical Machinery & Apparatus 0.31 0.46 0.77 0.52 1.29
Communication, Medical and other Electronic Equipment 0.34 0.37 0.70 0.47 1.17
Manufacturing of Transport Equipment 2.77 5.96 8.73 5.88 14.62
Other Manufacturing & Recycling 1.68 0.76 2.44 1.66 4.11
Electricity 2.48 1.86 4.34 2.81 7.15
Water 0.10 0.13 0.23 0.15 0.38
Building & Construction 0.77 1.70 2.47 1.72 4.19
Trade 4.19 2.88 7.07 4.71 11.78
Accommodation 0.96 1.78 2.75 1.78 4.53
Transport 5.42 4.63 10.05 6.51 16.56
Communication 5.72 5.26 10.98 7.11 18.10
Finance & Insurance 5.76 1.79 7.55 4.54 12.09
Real Estate 1.52 2.53 4.05 2.51 6.56
Business Services 45.20 4.57 49.76 29.57 79.34
General Government Services - - - - -
Community, Social and Personal Services 501.79 207.83 709.62 491.29 1 200.91
Total 605.10 277.03 882.13 601.46 1 483.59

148
Annexure C
Labour multiplier results for each services sector
Table C1-Labour Multiplier (Building and Construction)
Activities Direct Indirect Direct + Indirect
Induced Direct + Indirect + Induced
Citrus Fruit Farming 0.05 0.02 0.06 0.02 0.08
Deciduous Fruit Farming 0.08 0.02 0.10 0.03 0.14
Subtropical Fruit Farming 0.02 0.00 0.02 0.01 0.03
Vegetable Farming 0.28 0.09 0.38 0.12 0.50
Livestock Farming 0.30 0.15 0.45 0.16 0.60
Game Farming 0.03 0.01 0.04 0.01 0.05
Dairy Farming (milk only) 0.09 0.06 0.16 0.06 0.21
Forestry 28.14 9.47 37.61 12.57 50.18
Fishing 0.04 0.04 0.07 0.04 0.11
Cereal and Crop Farming 0.32 0.33 0.66 0.28 0.93
Poultry Farming 1.05 0.26 1.30 0.43 1.73
Other Agriculture 1.52 0.46 1.98 0.64 2.62
Gold 0.01 0.01 0.02 0.01 0.03
Coal and lignite 7.50 6.93 14.43 22.02 36.45
Other Mining 51.31 71.44 122.75 124.74 247.50
Meat, Fish, Fruit, Vegetables, Oils and Fat Products 0.08 1.40 1.49 0.83 2.32
Dairy products 0.34 2.02 2.37 1.47 3.84
Grain Mill, Bakery and Animal Feed Products 0.24 1.69 1.93 1.12 3.05
Other food products 0.57 0.98 1.55 1.40 2.95
Beverages and tobacco products 1.29 2.67 3.97 3.20 7.17
Textiles, Clothing, Leather Products and Footwear 39.15 25.74 64.89 23.73 88.62

149
Wood and Wood Products 34.04 56.90 90.94 51.15 142.09
Furniture 14.40 28.05 42.45 40.33 82.79
Paper and Paper Products 12.77 26.21 38.98 23.79 62.77
Publishing and Printing 11.16 8.24 19.40 12.96 32.36
Chemicals & Chemical Products (incl Plastic Products) 49.74 198.70 248.44 243.11 491.55
Rubber Products 1.13 4.28 5.41 4.96 10.37
Non-Metallic Mineral Products 134.96 159.27 294.23 222.81 517.04
Basic Metal Products 30.50 94.35 124.85 114.34 239.18
Structural Metal Products 36.47 56.89 93.35 83.44 176.79
Other Fabricated Metal Products 6.21 10.92 17.13 15.04 32.17
Machinery & Equipment 25.20 66.43 91.63 72.72 164.35
Electrical Machinery & Apparatus 50.65 72.29 122.94 85.13 208.07
Communication, Medical and other Electronic Equipment 2.95 4.08 7.04 5.83 12.86
Manufacturing of Transport Equipment 4.28 11.55 15.83 13.59 29.43
Other Manufacturing & Recycling 1.46 1.19 2.65 3.09 5.74
Electricity 10.53 20.77 31.30 42.05 73.35
Water 0.24 1.02 1.25 1.61 2.87
Building & Construction 1 695.52 2 196.05 3 891.58 2 100.15 5 991.73
Trade 171.08 113.72 284.80 192.22 477.02
Accommodation 37.24 27.79 65.03 24.76 89.79
Transport 62.80 99.70 162.50 139.02 301.51
Communication 19.17 60.63 79.80 99.05 178.85
Finance & Insurance 38.85 39.51 78.37 91.47 169.84
Real Estate 2.79 54.49 57.28 55.36 112.64
Business Services 1 039.43 78.33 1 117.76 447.17 1 564.94

150
General Government Services - - - - -
Community, Social and Personal Services 267.99 79.44 347.42 134.83 482.25
Total 3 893.99 3 694.59 7 588.58 4 512.86 12 101.44

151
Table C2-Labour Multiplier (Trade)
Activities Direct Indirect Direct + Indirect
Induced Direct + Indirect + Induced
Citrus Fruit Farming 0.08 0.03 0.11 0.04 0.14
Deciduous Fruit Farming 0.15 0.04 0.19 0.06 0.25
Subtropical Fruit Farming 0.03 0.01 0.04 0.01 0.05
Vegetable Farming 0.54 0.18 0.72 0.24 0.96
Livestock Farming 0.56 0.27 0.83 0.29 1.12
Game Farming 0.05 0.02 0.07 0.02 0.09
Dairy Farming (milk only) 0.18 0.12 0.29 0.11 0.40
Forestry 13.84 4.66 18.50 6.18 24.68
Fishing 0.07 0.08 0.15 0.08 0.23
Cereal and Crop Farming 0.60 0.62 1.22 0.51 1.73
Poultry Farming 1.95 0.48 2.42 0.80 3.22
Other Agriculture 2.13 0.64 2.78 0.90 3.68
Gold 0.01 0.01 0.02 0.01 0.04
Coal and lignite 3.64 3.36 7.00 10.68 17.68
Other Mining 8.74 12.16 20.90 21.24 42.14
Meat, Fish, Fruit, Vegetables, Oils and Fat Products 0.14 2.29 2.43 1.36 3.79
Dairy products 0.56 3.31 3.87 2.40 6.28
Grain Mill, Bakery and Animal Feed Products 0.39 2.74 3.13 1.83 4.96
Other food products 0.94 1.60 2.53 2.29 4.82
Beverages and tobacco products 2.23 4.62 6.85 5.53 12.38
Textiles, Clothing, Leather Products and Footwear 26.03 17.12 43.15 15.78 58.93
Wood and Wood Products 6.77 11.31 18.08 10.17 28.25
Furniture 19.59 38.15 57.74 54.86 112.60

152
Paper and Paper Products 23.23 47.66 70.89 43.26 114.16
Publishing and Printing 16.63 12.28 28.90 19.31 48.22
Chemicals & Chemical Products (incl Plastic Products) 32.02 127.93 159.96 156.53 316.49
Rubber Products 1.60 6.04 7.64 7.00 14.64
Non-Metallic Mineral Products 6.85 8.08 14.94 11.31 26.24
Basic Metal Products 6.14 18.99 25.13 23.02 48.15
Structural Metal Products 1.40 2.18 3.59 3.20 6.79
Other Fabricated Metal Products 4.26 7.49 11.75 10.31 22.06
Machinery & Equipment 11.73 30.91 42.63 33.84 76.47
Electrical Machinery & Apparatus 4.78 6.82 11.60 8.03 19.64
Communication, Medical and other Electronic Equipment 4.69 6.49 11.18 9.26 20.44
Manufacturing of Transport Equipment 5.78 15.58 21.36 18.33 39.69
Other Manufacturing & Recycling 1.99 1.62 3.61 4.22 7.83
Electricity 9.55 18.84 28.38 38.13 66.52
Water 0.24 1.02 1.26 1.62 2.88
Building & Construction 38.42 49.76 88.17 47.58 135.76
Trade 521.77 346.84 868.60 586.24 1 454.84
Accommodation 71.85 53.63 125.47 47.78 173.25
Transport 73.79 117.15 190.93 163.34 354.27
Communication 36.99 116.99 153.98 191.11 345.10
Finance & Insurance 65.09 66.20 131.29 153.24 284.53
Real Estate 3.80 74.40 78.20 75.59 153.79
Business Services 1 166.04 87.88 1 253.92 501.64 1 755.56
General Government Services - - - - -
Community, Social and Personal Services 195.88 58.06 253.94 98.55 352.48
Total 2 393.73 1 386.64 3 780.38 2 387.85 6 168.23

153
Table C3-Labour Multiplier (Accommodation)
Activities Direct Indirect Direct + Indirect
Induced Direct + Indirect + Induced
Citrus Fruit Farming 1.61 0.62 2.23 0.76 2.99
Deciduous Fruit Farming 2.65 0.73 3.38 1.06 4.44
Subtropical Fruit Farming 0.53 0.11 0.64 0.20 0.84
Vegetable Farming 16.77 5.43 22.20 7.27 29.47
Livestock Farming 7.11 3.42 10.53 3.64 14.17
Game Farming 0.61 0.27 0.88 0.30 1.18
Dairy Farming (milk only) 3.01 2.00 5.01 1.83 6.84
Forestry 12.52 4.21 16.74 5.59 22.33
Fishing 0.63 0.70 1.33 0.70 2.03
Cereal and Crop Farming 7.60 7.80 15.41 6.50 21.91
Poultry Farming 35.51 8.70 44.22 14.55 58.76
Other Agriculture 28.86 8.71 37.57 12.20 49.77
Gold 0.02 0.01 0.03 0.02 0.05
Coal and lignite 10.15 9.38 19.53 29.80 49.32
Other Mining 9.22 12.83 22.05 22.41 44.46
Meat, Fish, Fruit, Vegetables, Oils and Fat Products 2.90 47.94 50.84 28.43 79.26
Dairy products 11.78 69.21 80.99 50.24 131.23
Grain Mill, Bakery and Animal Feed Products 8.09 56.90 64.99 37.90 102.89
Other food products 19.55 33.38 52.92 47.77 100.69
Beverages and tobacco products 47.72 98.60 146.32 118.16 264.49
Textiles, Clothing, Leather Products and Footwear 22.33 14.68 37.01 13.53 50.54
Wood and Wood Products 8.07 13.49 21.57 12.13 33.69
Furniture 17.95 34.97 52.92 50.28 103.19
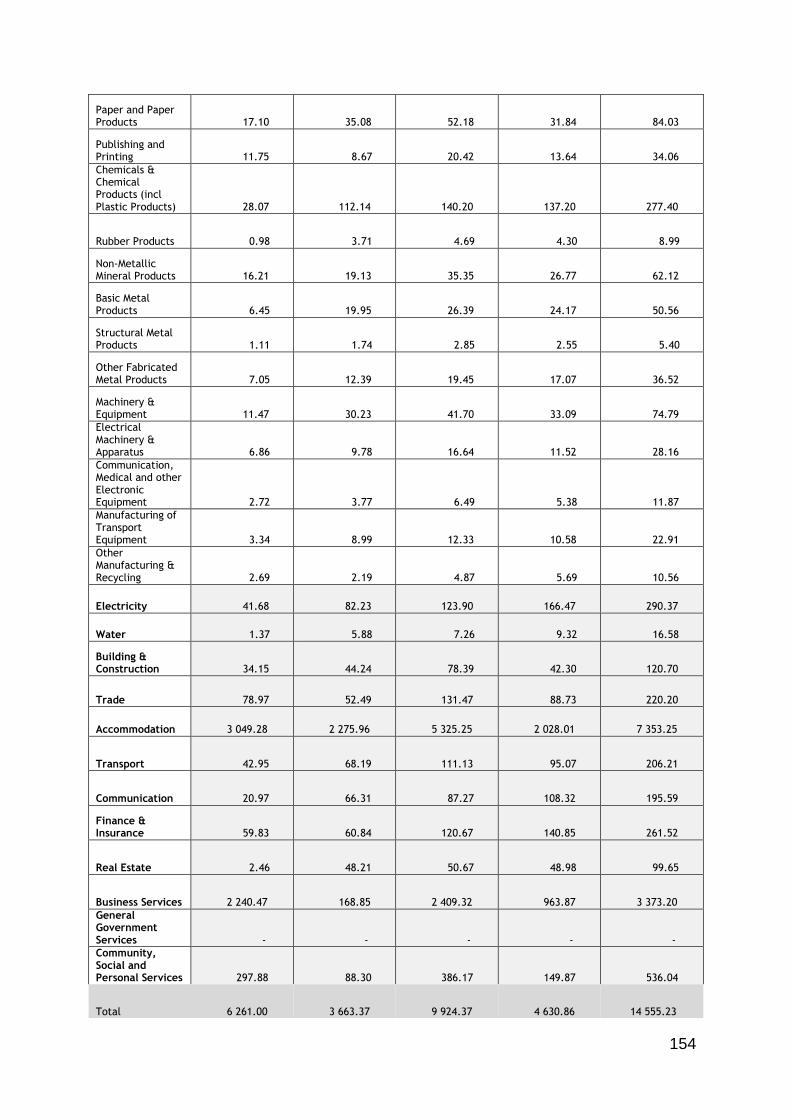
154
Paper and Paper Products 17.10 35.08 52.18 31.84 84.03
Publishing and Printing 11.75 8.67 20.42 13.64 34.06
Chemicals & Chemical Products (incl Plastic Products) 28.07 112.14 140.20 137.20 277.40
Rubber Products 0.98 3.71 4.69 4.30 8.99
Non-Metallic Mineral Products 16.21 19.13 35.35 26.77 62.12
Basic Metal Products 6.45 19.95 26.39 24.17 50.56
Structural Metal Products 1.11 1.74 2.85 2.55 5.40
Other Fabricated Metal Products 7.05 12.39 19.45 17.07 36.52
Machinery & Equipment 11.47 30.23 41.70 33.09 74.79
Electrical Machinery & Apparatus 6.86 9.78 16.64 11.52 28.16
Communication, Medical and other Electronic Equipment 2.72 3.77 6.49 5.38 11.87
Manufacturing of Transport Equipment 3.34 8.99 12.33 10.58 22.91
Other Manufacturing & Recycling 2.69 2.19 4.87 5.69 10.56
Electricity 41.68 82.23 123.90 166.47 290.37
Water 1.37 5.88 7.26 9.32 16.58
Building & Construction 34.15 44.24 78.39 42.30 120.70
Trade 78.97 52.49 131.47 88.73 220.20
Accommodation 3 049.28 2 275.96 5 325.25 2 028.01 7 353.25
Transport 42.95 68.19 111.13 95.07 206.21
Communication 20.97 66.31 87.27 108.32 195.59
Finance & Insurance 59.83 60.84 120.67 140.85 261.52
Real Estate 2.46 48.21 50.67 48.98 99.65
Business Services 2 240.47 168.85 2 409.32 963.87 3 373.20
General Government Services - - - - -
Community, Social and Personal Services 297.88 88.30 386.17 149.87 536.04
Total 6 261.00 3 663.37 9 924.37 4 630.86 14 555.23
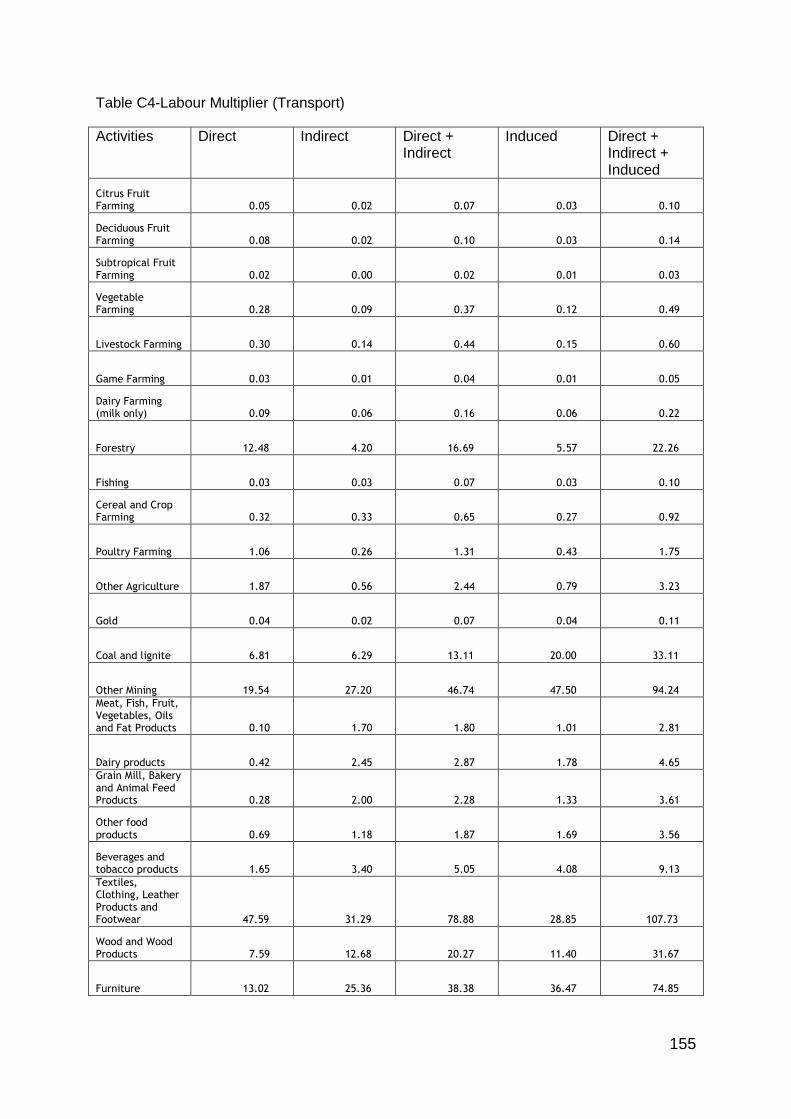
155
Table C4-Labour Multiplier (Transport)
Activities Direct Indirect Direct + Indirect
Induced Direct + Indirect + Induced
Citrus Fruit Farming 0.05 0.02 0.07 0.03 0.10
Deciduous Fruit Farming 0.08 0.02 0.10 0.03 0.14
Subtropical Fruit Farming 0.02 0.00 0.02 0.01 0.03
Vegetable Farming 0.28 0.09 0.37 0.12 0.49
Livestock Farming 0.30 0.14 0.44 0.15 0.60
Game Farming 0.03 0.01 0.04 0.01 0.05
Dairy Farming (milk only) 0.09 0.06 0.16 0.06 0.22
Forestry 12.48 4.20 16.69 5.57 22.26
Fishing 0.03 0.03 0.07 0.03 0.10
Cereal and Crop Farming 0.32 0.33 0.65 0.27 0.92
Poultry Farming 1.06 0.26 1.31 0.43 1.75
Other Agriculture 1.87 0.56 2.44 0.79 3.23
Gold 0.04 0.02 0.07 0.04 0.11
Coal and lignite 6.81 6.29 13.11 20.00 33.11
Other Mining 19.54 27.20 46.74 47.50 94.24
Meat, Fish, Fruit, Vegetables, Oils and Fat Products 0.10 1.70 1.80 1.01 2.81
Dairy products 0.42 2.45 2.87 1.78 4.65
Grain Mill, Bakery and Animal Feed Products 0.28 2.00 2.28 1.33 3.61
Other food products 0.69 1.18 1.87 1.69 3.56
Beverages and tobacco products 1.65 3.40 5.05 4.08 9.13
Textiles, Clothing, Leather Products and Footwear 47.59 31.29 78.88 28.85 107.73
Wood and Wood Products 7.59 12.68 20.27 11.40 31.67
Furniture 13.02 25.36 38.38 36.47 74.85
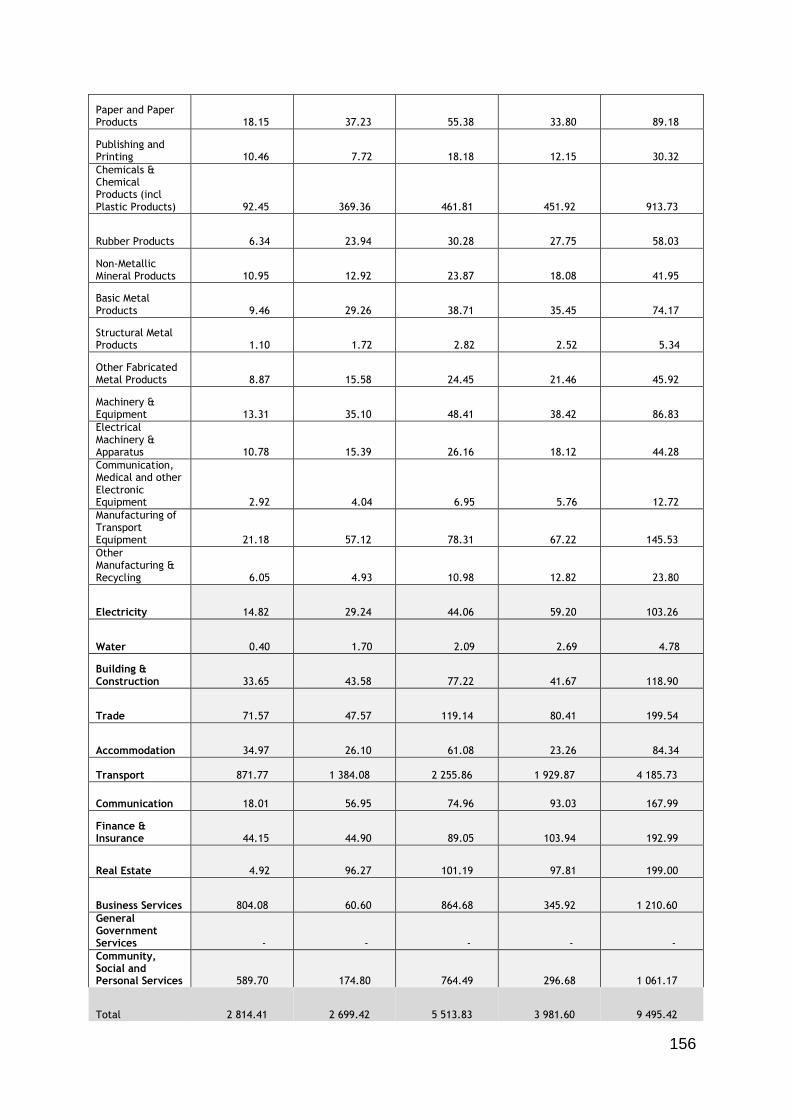
156
Paper and Paper Products 18.15 37.23 55.38 33.80 89.18
Publishing and Printing 10.46 7.72 18.18 12.15 30.32
Chemicals & Chemical Products (incl Plastic Products) 92.45 369.36 461.81 451.92 913.73
Rubber Products 6.34 23.94 30.28 27.75 58.03
Non-Metallic Mineral Products 10.95 12.92 23.87 18.08 41.95
Basic Metal Products 9.46 29.26 38.71 35.45 74.17
Structural Metal Products 1.10 1.72 2.82 2.52 5.34
Other Fabricated Metal Products 8.87 15.58 24.45 21.46 45.92
Machinery & Equipment 13.31 35.10 48.41 38.42 86.83
Electrical Machinery & Apparatus 10.78 15.39 26.16 18.12 44.28
Communication, Medical and other Electronic Equipment 2.92 4.04 6.95 5.76 12.72
Manufacturing of Transport Equipment 21.18 57.12 78.31 67.22 145.53
Other Manufacturing & Recycling 6.05 4.93 10.98 12.82 23.80
Electricity 14.82 29.24 44.06 59.20 103.26
Water 0.40 1.70 2.09 2.69 4.78
Building & Construction 33.65 43.58 77.22 41.67 118.90
Trade 71.57 47.57 119.14 80.41 199.54
Accommodation 34.97 26.10 61.08 23.26 84.34
Transport 871.77 1 384.08 2 255.86 1 929.87 4 185.73
Communication 18.01 56.95 74.96 93.03 167.99
Finance & Insurance 44.15 44.90 89.05 103.94 192.99
Real Estate 4.92 96.27 101.19 97.81 199.00
Business Services 804.08 60.60 864.68 345.92 1 210.60
General Government Services - - - - -
Community, Social and Personal Services 589.70 174.80 764.49 296.68 1 061.17
Total 2 814.41 2 699.42 5 513.83 3 981.60 9 495.42

157
Table C5-Labour Multiplier (Communication)
Activities Direct Indirect Direct + Indirect
Induced Direct + Indirect + Induced
Citrus Fruit Farming 0.11 0.04 0.15 0.05 0.20
Deciduous Fruit Farming 0.18 0.05 0.23 0.07 0.30
Subtropical Fruit Farming 0.04 0.01 0.04 0.01 0.06
Vegetable Farming 1.01 0.33 1.33 0.44 1.77
Livestock Farming 0.52 0.25 0.77 0.27 1.04
Game Farming 0.04 0.02 0.06 0.02 0.09
Dairy Farming (milk only) 0.20 0.14 0.34 0.12 0.46
Forestry 9.68 3.26 12.94 4.32 17.27
Fishing 0.05 0.06 0.11 0.06 0.16
Cereal and Crop Farming 0.56 0.57 1.13 0.48 1.61
Poultry Farming 2.37 0.58 2.95 0.97 3.92
Other Agriculture 2.44 0.74 3.18 1.03 4.21
Gold 0.02 0.01 0.02 0.01 0.04
Coal and lignite 5.65 5.22 10.86 16.58 27.44
Other Mining 11.67 16.25 27.93 28.38 56.31
Meat, Fish, Fruit, Vegetables, Oils and Fat Products 0.20 3.26 3.46 1.93 5.39
Dairy products 0.80 4.70 5.51 3.42 8.92
Grain Mill, Bakery and Animal Feed Products 0.55 3.86 4.41 2.57 6.99
Other food products 1.33 2.27 3.60 3.25 6.84
Beverages and tobacco products 3.21 6.64 9.85 7.95 17.81
Textiles, Clothing, Leather Products and Footwear 66.66 43.83 110.48 40.41 150.89
Wood and Wood Products 5.56 9.30 14.86 8.36 23.22
Furniture 12.64 24.62 37.26 35.40 72.66

158
Paper and Paper Products 14.53 29.82 44.36 27.07 71.42
Publishing and Printing 32.58 24.05 56.63 37.84 94.47
Chemicals & Chemical Products (incl Plastic Products) 34.40 137.44 171.84 168.16 340.00
Rubber Products 1.67 6.28 7.95 7.28 15.23
Non-Metallic Mineral Products 5.88 6.94 12.83 9.71 22.54
Basic Metal Products 17.57 54.34 71.90 65.85 137.75
Structural Metal Products 0.54 0.84 1.39 1.24 2.63
Other Fabricated Metal Products 5.60 9.84 15.44 13.55 28.99
Machinery & Equipment 25.73 67.82 93.55 74.25 167.80
Electrical Machinery & Apparatus 9.81 14.00 23.81 16.48 40.29
Communication, Medical and other Electronic Equipment 57.13 78.97 136.10 112.74 248.84
Manufacturing of Transport Equipment 5.66 15.26 20.92 17.96 38.88
Other Manufacturing & Recycling 2.08 1.69 3.77 4.40 8.16
Electricity 15.15 29.90 45.05 60.53 105.59
Water 0.31 1.34 1.66 2.13 3.79
Building & Construction 12.45 16.13 28.58 15.42 44.00
Trade 79.96 53.15 133.12 89.84 222.96
Accommodation 175.38 130.91 306.29 116.64 422.93
Transport 74.43 118.18 192.61 164.78 357.39
Communication 487.41 1 541.36 2 028.77 2 517.97 4 546.74
Finance & Insurance 37.14 37.77 74.90 87.43 162.33
Real Estate 1.29 25.28 26.57 25.68 52.25
Business Services 554.91 41.82 596.73 238.73 835.46
General Government Services - - - - -
Community, Social and Personal Services 175.69 52.08 227.77 88.39 316.16
Total 1 952.80 2 621.21 4 574.01 4 120.19 8 694.20
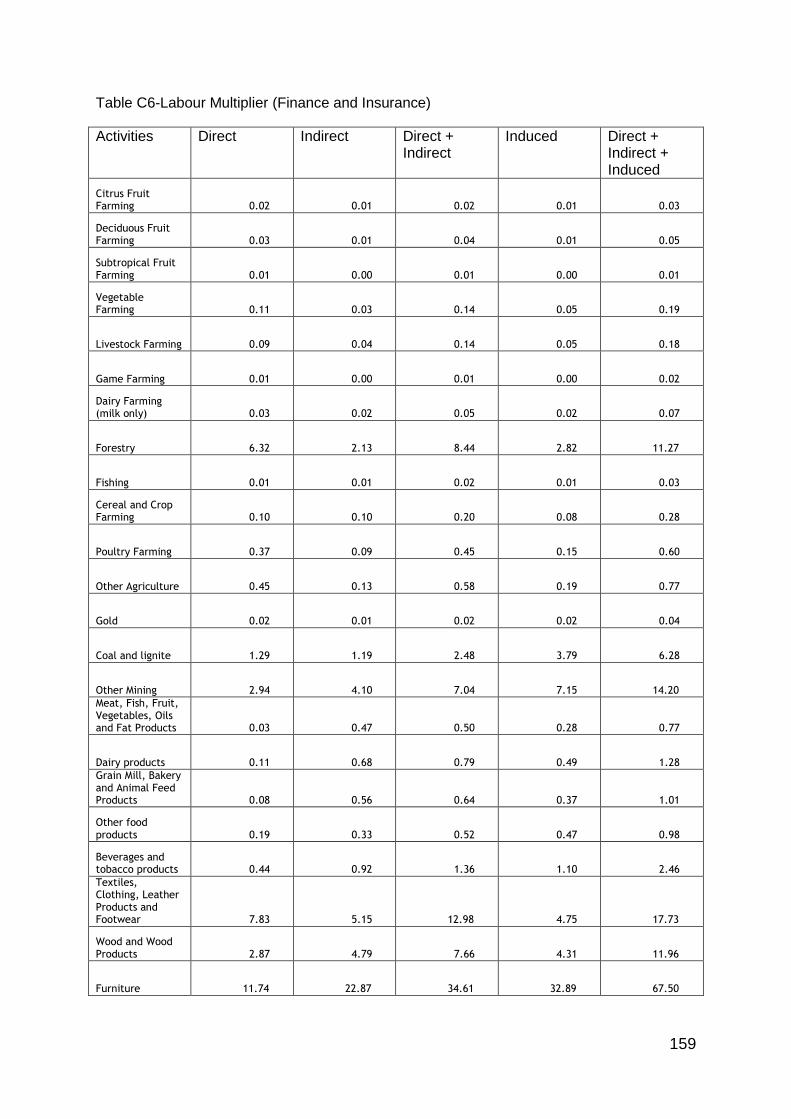
159
Table C6-Labour Multiplier (Finance and Insurance)
Activities Direct Indirect Direct + Indirect
Induced Direct + Indirect + Induced
Citrus Fruit Farming 0.02 0.01 0.02 0.01 0.03
Deciduous Fruit Farming 0.03 0.01 0.04 0.01 0.05
Subtropical Fruit Farming 0.01 0.00 0.01 0.00 0.01
Vegetable Farming 0.11 0.03 0.14 0.05 0.19
Livestock Farming 0.09 0.04 0.14 0.05 0.18
Game Farming 0.01 0.00 0.01 0.00 0.02
Dairy Farming (milk only) 0.03 0.02 0.05 0.02 0.07
Forestry 6.32 2.13 8.44 2.82 11.27
Fishing 0.01 0.01 0.02 0.01 0.03
Cereal and Crop Farming 0.10 0.10 0.20 0.08 0.28
Poultry Farming 0.37 0.09 0.45 0.15 0.60
Other Agriculture 0.45 0.13 0.58 0.19 0.77
Gold 0.02 0.01 0.02 0.02 0.04
Coal and lignite 1.29 1.19 2.48 3.79 6.28
Other Mining 2.94 4.10 7.04 7.15 14.20
Meat, Fish, Fruit, Vegetables, Oils and Fat Products 0.03 0.47 0.50 0.28 0.77
Dairy products 0.11 0.68 0.79 0.49 1.28
Grain Mill, Bakery and Animal Feed Products 0.08 0.56 0.64 0.37 1.01
Other food products 0.19 0.33 0.52 0.47 0.98
Beverages and tobacco products 0.44 0.92 1.36 1.10 2.46
Textiles, Clothing, Leather Products and Footwear 7.83 5.15 12.98 4.75 17.73
Wood and Wood Products 2.87 4.79 7.66 4.31 11.96
Furniture 11.74 22.87 34.61 32.89 67.50

160
Paper and Paper Products 10.96 22.48 33.44 20.41 53.85
Publishing and Printing 16.11 11.89 28.01 18.71 46.72
Chemicals & Chemical Products (incl Plastic Products) 9.30 37.16 46.46 45.46 91.93
Rubber Products 0.68 2.55 3.23 2.96 6.18
Non-Metallic Mineral Products 2.81 3.31 6.12 4.63 10.75
Basic Metal Products 1.93 5.98 7.91 7.24 15.15
Structural Metal Products 0.49 0.77 1.26 1.13 2.39
Other Fabricated Metal Products 1.78 3.12 4.90 4.30 9.20
Machinery & Equipment 2.86 7.53 10.39 8.25 18.64
Electrical Machinery & Apparatus 1.59 2.27 3.86 2.67 6.54
Communication, Medical and other Electronic Equipment 0.93 1.28 2.21 1.83 4.03
Manufacturing of Transport Equipment 2.33 6.28 8.61 7.39 16.00
Other Manufacturing & Recycling 2.21 1.80 4.01 4.68 8.68
Electricity 3.31 6.53 9.84 13.22 23.05
Water 0.13 0.54 0.67 0.86 1.53
Building & Construction 13.39 17.34 30.73 16.59 47.32
Trade 20.69 13.76 34.45 23.25 57.70
Accommodation 13.52 10.09 23.61 8.99 32.60
Transport 15.51 24.62 40.13 34.33 74.46
Communication 6.96 22.01 28.98 35.96 64.94
Finance & Insurance 1 310.35 1 332.59 2 642.94 3 084.87 5 727.81
Real Estate 7.67 150.11 157.79 152.50 310.29
Business Services 518.21 39.05 557.26 222.94 780.20
General Government Services - - - - -
Community, Social and Personal Services 584.39 173.22 757.62 294.01 1 051.63
Total 2 583.18 1 939.93 4 523.11 4 076.18 8 599.29

161
Table C7-Labour Multiplier (Real Estate)
Activities Direct Indirect Direct + Indirect
Induced Direct + Indirect + Induced
Citrus Fruit Farming 0.05 0.02 0.07 0.02 0.09
Deciduous Fruit Farming 0.08 0.02 0.10 0.03 0.13
Subtropical Fruit Farming 0.02 0.00 0.02 0.01 0.02
Vegetable Farming 0.30 0.10 0.39 0.13 0.52
Livestock Farming 0.26 0.13 0.39 0.14 0.53
Game Farming 0.02 0.01 0.03 0.01 0.04
Dairy Farming (milk only) 0.09 0.06 0.15 0.05 0.20
Forestry 13.73 4.62 18.35 6.13 24.48
Fishing 0.03 0.03 0.06 0.03 0.09
Cereal and Crop Farming 0.28 0.29 0.57 0.24 0.82
Poultry Farming 1.00 0.25 1.25 0.41 1.66
Other Agriculture 1.28 0.39 1.67 0.54 2.21
Gold 0.03 0.01 0.04 0.03 0.06
Coal and lignite 4.64 4.29 8.93 13.63 22.56
Other Mining 11.32 15.76 27.08 27.52 54.60
Meat, Fish, Fruit, Vegetables, Oils and Fat Products 0.08 1.39 1.47 0.82 2.29
Dairy products 0.34 2.00 2.34 1.45 3.79
Grain Mill, Bakery and Animal Feed Products 0.23 1.64 1.88 1.10 2.97
Other food products 0.57 0.96 1.53 1.38 2.91
Beverages and tobacco products 1.33 2.75 4.08 3.30 7.38
Textiles, Clothing, Leather Products and Footwear 26.85 17.65 44.50 16.27 60.77
Wood and Wood Products 12.34 20.63 32.97 18.55 51.52
Furniture 21.78 42.42 64.19 60.99 125.18

162
Paper and Paper Products 12.97 26.62 39.59 24.16 63.76
Publishing and Printing 22.17 16.36 38.53 25.74 64.27
Chemicals & Chemical Products (incl Plastic Products) 33.15 132.43 165.58 162.03 327.61
Rubber Products 1.08 4.09 5.18 4.74 9.92
Non-Metallic Mineral Products 23.64 27.90 51.54 39.03 90.56
Basic Metal Products 7.29 22.55 29.84 27.32 57.16
Structural Metal Products 4.24 6.61 10.85 9.70 20.55
Other Fabricated Metal Products 7.91 13.90 21.81 19.14 40.95
Machinery & Equipment 9.35 24.66 34.01 27.00 61.01
Electrical Machinery & Apparatus 9.98 14.24 24.22 16.77 40.99
Communication, Medical and other Electronic Equipment 2.60 3.60 6.20 5.14 11.34
Manufacturing of Transport Equipment 3.83 10.32 14.15 12.14 26.29
Other Manufacturing & Recycling 3.51 2.85 6.36 7.43 13.79
Electricity 10.79 21.30 32.09 43.11 75.21
Water 0.69 2.97 3.66 4.70 8.37
Building & Construction 117.56 152.26 269.81 145.61 415.42
Trade 65.03 43.23 108.26 73.07 181.33
Accommodation 38.45 28.70 67.15 25.57 92.72
Transport 32.00 50.81 82.81 70.84 153.65
Communication 19.80 62.61 82.41 102.28 184.68
Finance & Insurance 288.72 293.62 582.35 679.72 1 262.07
Real Estate 102.57 2 006.12 2 108.69 2 038.09 4 146.78
Business Services 958.64 72.25 1 030.89 412.42 1 443.30
General Government Services - - - - -
Community, Social and Personal Services 952.26 282.27 1 234.53 479.09 1 713.62
Total 2 824.88 3 437.67 6 262.56 4 607.63 10 870.18

163
Table C8-Labour Multiplier (Business Services)
Activities Direct Indirect Direct + Indirect
Induced Direct + Indirect + Induced
Citrus Fruit Farming 0.03 0.01 0.04 0.01 0.06
Deciduous Fruit Farming 0.09 0.02 0.11 0.03 0.14
Subtropical Fruit Farming 0.02 0.00 0.02 0.01 0.03
Vegetable Farming 0.18 0.06 0.24 0.08 0.32
Livestock Farming 0.36 0.17 0.53 0.18 0.72
Game Farming 0.03 0.01 0.04 0.02 0.06
Dairy Farming (milk only) 0.10 0.07 0.16 0.06 0.22
Forestry 4.41 1.48 5.89 1.97 7.86
Fishing 0.05 0.06 0.11 0.06 0.17
Cereal and Crop Farming 0.38 0.39 0.78 0.33 1.11
Poultry Farming 1.06 0.26 1.32 0.44 1.76
Other Agriculture 1.07 0.32 1.39 0.45 1.84
Gold 0.02 0.01 0.03 0.02 0.05
Coal and lignite 0.81 0.75 1.55 2.37 3.93
Other Mining 2.75 3.82 6.57 6.67 13.24
Meat, Fish, Fruit, Vegetables, Oils and Fat Products 0.05 0.82 0.87 0.49 1.35
Dairy products 0.20 1.18 1.38 0.86 2.24
Grain Mill, Bakery and Animal Feed Products 0.14 1.01 1.15 0.67 1.82
Other food products 0.33 0.57 0.90 0.82 1.72
Beverages and tobacco products 0.80 1.65 2.45 1.98 4.42
Textiles, Clothing, Leather Products and Footwear 5.75 3.78 9.53 3.49 13.02
Wood and Wood Products 1.81 3.03 4.85 2.73 7.57
Furniture 6.94 13.53 20.47 19.45 39.92

164
Paper and Paper Products 6.91 14.17 21.08 12.86 33.94
Publishing and Printing 6.42 4.74 11.16 7.46 18.62
Chemicals & Chemical Products (incl Plastic Products) 6.68 26.69 33.37 32.66 66.03
Rubber Products 0.32 1.20 1.52 1.39 2.90
Non-Metallic Mineral Products 2.15 2.54 4.69 3.55 8.24
Basic Metal Products 1.74 5.37 7.11 6.51 13.61
Structural Metal Products 0.45 0.71 1.16 1.04 2.20
Other Fabricated Metal Products 1.24 2.18 3.41 3.00 6.41
Machinery & Equipment 2.54 6.70 9.24 7.33 16.58
Electrical Machinery & Apparatus 1.23 1.75 2.97 2.06 5.03
Communication, Medical and other Electronic Equipment 1.02 1.41 2.43 2.01 4.44
Manufacturing of Transport Equipment 1.53 4.12 5.65 4.85 10.50
Other Manufacturing & Recycling 2.48 2.02 4.51 5.26 9.77
Electricity 1.44 2.84 4.28 5.75 10.02
Water 0.04 0.17 0.21 0.27 0.48
Building & Construction 6.06 7.85 13.91 7.51 21.42
Trade 14.16 9.41 23.57 15.91 39.48
Accommodation 14.32 10.69 25.00 9.52 34.52
Transport 15.10 23.98 39.08 33.43 72.51
Communication 7.37 23.31 30.68 38.08 68.76
Finance & Insurance 12.51 12.72 25.23 29.45 54.67
Real Estate 0.67 13.08 13.75 13.29 27.03
Business Services 8 664.17 652.96 9 317.13 3 727.41 13 044.54
General Government Services - - - - -
Community, Social and Personal Services 175.51 52.02 227.53 88.30 315.83
Total 8 973.44 915.64 9 889.08 4 102.06 13 991.13

165
Table C9-Labour Multiplier (Community, Social and Personal Services)
Activities Direct Indirect Direct + Indirect
Induced Direct + Indirect + Induced
Citrus Fruit Farming 0.05 0.02 0.07 0.02 0.09
Deciduous Fruit Farming 0.09 0.02 0.11 0.04 0.15
Subtropical Fruit Farming 0.02 0.00 0.02 0.01 0.03
Vegetable Farming 0.31 0.10 0.41 0.14 0.55
Livestock Farming 0.22 0.10 0.32 0.11 0.43
Game Farming 0.02 0.01 0.03 0.01 0.04
Dairy Farming (milk only) 0.10 0.07 0.17 0.06 0.23
Forestry 7.68 2.59 10.27 3.43 13.70
Fishing 0.02 0.02 0.05 0.02 0.07
Cereal and Crop Farming 0.23 0.24 0.47 0.20 0.67
Poultry Farming 1.21 0.30 1.51 0.50 2.01
Other Agriculture 1.06 0.32 1.38 0.45 1.83
Gold 0.04 0.02 0.06 0.04 0.11
Coal and lignite 2.71 2.51 5.22 7.97 13.18
Other Mining 5.70 7.93 13.63 13.85 27.48
Meat, Fish, Fruit, Vegetables, Oils and Fat Products 0.08 1.29 1.37 0.77 2.14
Dairy products 0.32 1.87 2.18 1.36 3.54
Grain Mill, Bakery and Animal Feed Products 0.22 1.56 1.78 1.04 2.81
Other food products 0.53 0.90 1.43 1.29 2.72
Beverages and tobacco products 1.26 2.60 3.87 3.12 6.99
Textiles, Clothing, Leather Products and Footwear 18.27 12.01 30.28 11.07 41.35
Wood and Wood Products 4.24 7.09 11.33 6.37 17.71
Furniture 13.77 26.82 40.59 38.56 79.15

166
Paper and Paper Products 12.05 24.73 36.79 22.45 59.24
Publishing and Printing 11.18 8.25 19.44 12.99 32.42
Chemicals & Chemical Products (incl Plastic Products) 18.72 74.80 93.52 91.52 185.04
Rubber Products 4.58 17.30 21.88 20.05 41.94
Non-Metallic Mineral Products 3.40 4.01 7.41 5.61 13.01
Basic Metal Products 4.84 14.97 19.81 18.14 37.96
Structural Metal Products 0.44 0.68 1.12 1.00 2.13
Other Fabricated Metal Products 5.19 9.12 14.32 12.57 26.88
Machinery & Equipment 7.38 19.46 26.84 21.30 48.14
Electrical Machinery & Apparatus 2.25 3.22 5.47 3.79 9.26
Communication, Medical and other Electronic Equipment 1.75 2.41 4.16 3.44 7.60
Manufacturing of Transport Equipment 13.64 36.79 50.43 43.29 93.72
Other Manufacturing & Recycling 5.78 4.71 10.49 12.24 22.73
Electricity 5.17 10.21 15.38 20.67 36.05
Water 0.16 0.69 0.85 1.09 1.93
Building & Construction 10.21 13.23 23.44 12.65 36.09
Trade 30.81 20.48 51.28 34.61 85.90
Accommodation 19.67 14.68 34.35 13.08 47.43
Transport 21.63 34.34 55.97 47.88 103.86
Communication 10.13 32.02 42.15 52.32 94.47
Finance & Insurance 14.11 14.35 28.47 33.23 61.69
Real Estate 0.93 18.10 19.03 18.39 37.41
Business Services 502.91 37.90 540.81 216.36 757.17
General Government Services - - - - -
Community, Social and Personal Services 7 177.20 2 127.43 9 304.63 3 610.91 12 915.54
Total 7 942.30 2 612.29 10 554.59 4 419.99 14 974.58

167
List of References
Altman, M., 2006. Identifying employment-creating sectors in South Africa: the role of
services industries. Development Southern Africa, 23(5), pp. 627-647.
Andrew, B., Croushore, B. & Barnanke, D., 2008. Macroeconomics. 6th ed. Boston:
Greg Tobin.
Blancas, A., 2006. Interinstitutional Linkage Analysis: a Social Accounting Matrix
Multiplier Approach for the Mexican Economy. Economic Systems Research, 28(1),
pp. 29-59.
Boshoff, C. & Du Plessis, F., 2009. Service Marketing: A Contemporary Approach.
1st ed. Cape Town: Author.
Breisinger, C., Thomas, M. & Thurlow, J., 2009. Social accounting Matrices and
Multiplier Analysis: An Introduction with Exercises. 1st ed. Washington: Author.
Chang, P., Karsenty, G., Mattoo, A. & Richering, J., 1998. GATS: The Modes of
Supply and Statistics on Trade in Services. [Online]
Available at:
http://tradeinservices.mofcom.gov.cn/upload/2008/08/14/1218701801547_177757.p
df
[Accessed 20 July 2013].
Conti, G., Turco, A. L. & Maggioni, D., 2014. Spillovers through backward linkages
and the export performance of business services. Evidence from a sample of Italian
firms. International Business Review, 23(3), pp. 552-565.
Cui, Y. & Shen, F., 2011. Relationship of International Trade in Financial Services
and Economic Growth: The Case of China. Asian Social Science, 12(9), pp. 220-
225.
Davies, R. & Thurlow, J., 2013. A 2009 Social Accounting Matrix (SAM) for South
Africa, Pretoria: International Food Policy Research Institute.
Den Bakker, G. P., De Gijt, J. & Keuning, S. J., 1994. An Historical Social
Accounting Matrix for the Netherlands (1938). Review of Income and Wealth, June,
40(2), pp. 175-190.
168
Department of Trade and Industry, 2010. Industrial Policy Action Plan (IPAP)
2013/13 - 2014/15, Pretoria: Author.
Erramilli, M. K., 1990. Entry mode choice in service industry. International marketing
review, 12(5), pp. 50-62.
Evangelia, S., Katsikea, M. T., Morgan, R. E. & Papavassiliou, N., 2005. Export
Market Expansion Strategies of Direct-Selling Small and Medium-Sized Firms:
Implications for Export Sales Management Activities. Journal of International
Marketing, 13(2), pp. 57-92.
Francois, J., 1990. Trade in producer services and returns due to specialization
under monopolistic competition. Canadian journal of economics, 23(1), pp. 109-124.
Francois, J. & Hoekman, B., 2010. Services trade and policy. Journal of economic
literature, 3(48), pp. 642-692.
Freier, R. & Steiner, V., 2010. Marginal employment and the demand for
heterogeneous labour-elasticity estimates from a multi-factor labour demand model
for Germany. Applied Economics Letters, 17(12), p. 1177.1182.
Gouws, A. & Moore, A., 2013. National Exporter Development Programme, s.l.:
Author.
Greenaway, D., Hine, R. C. & Wright, P., 1998. An Empirical Assessment of the
Impact of Trade on Employment in the United Kingdom, Nottingham: University of
Nottingham.
Hao, W., Qiang, F. & Shibin, L., 2012. Impact pf Services Trade on Service Sector
Labour-Demand Elasticities: Empirical Evidence from China. Advances In
Management, 5(11), pp. 61-69.
Harcourt, T., 2000. Why Australia Needs Exports: The Economic Case for Exporting,
Sydney: Author.
Hauknes, J. & Knell, M., 2009. Embodied knowledge and sectoral linkages: An input-
output approach to the interaction of high- and low-tech industries. Research Policy,
38(3), pp. 459-469.
169
Hewings, G., 1982. The empirical identification of key sectors in an economy: a
regional perspective. Developing Economics, 20(2), pp. 173-195.
IHS Global Inc., 2014. Country Reports - South Africa, s.l.: Author.
International Trade Administration, 2014. U.S. export fact sheet, s.l.: Author.
Jones, S., 2010. The economic contribution of tourism in Mozambique: Insights from
a Social Accounting Matrix. Development Southern Africa, 27(5), pp. 679-696.
Kay, D. L., Pratt, J. E. & Warner, M. E., 2007. Role of Services in Regional Economy
Growth. Growth and Change, 37(3), pp. 419-442.
Kijong, K., 2011. Ex-ante evaluation of a targeted job program: Hypothetical
integration in a social accounting matrix of South Africa. Economic Modeling, 28(6),
pp. 2683-2690.
King, B., 1985. In Social Accounting Matrices: A Basis for Planning. 1st ed.
Washington: The World Bank.
Kiyota, K., 2011. Exports and Jobs:The Case of Japan, 1975-2006. Contemporary
Economic Policy, 30(4), pp. 566-583.
Konchyn, V., 2008. Evolution of Ukrainian Economy: New Trade Theory Evidence.
ICFAI Journal of Applied Economics, 7(2), pp. 80-110.
Krishna, P., Mitra, D. & Chinoy, S., 2001. Trade liberalization and labour demand
elasticities: evidence from Turkey. Journal of International Economics, 45(2), pp.
391-409.
Krugman, P., 1979. Increasing Returns, Monopolistic Competition, and International
Trade. Journal of International Economics, 9(4), pp. 469-479.
Kucera, D., Roncolato, L. & Von Uexkull, E., 2012. Trade Contraction and
Employment in India and South Africa during the Global Crisis. World Development,
40(6), p. 1122–1134.
Leclair, M. S., 2002. Export Composition and Manufacturing Employment in the US
during the Economic Downturn of 1991-92. Economic Systems Research, 14(2), pp.
147-156.

170
Lei, W., 2011. Application of Gravity Model: Measurement of International
Competitiveness of Trade Services. Studies in Sociology of Science, 2(2), pp. 50-56.
Lesher, M. & Nordas, H., 2006. Business serivces, trade and costs, s.l.: Author.
Lofgren, H., Harris, R. L. & Robinson, S., 2002. A Standard Computable General
Equilibrium (CGE) Model. 1st ed. Washington: Author.
Mattoo, A., 1998. Financial services and the WTO: liberalization in the developing
and transition economies. [Online]
Available at: http://www.wto.org/english/res_e/reser_e/ptis9803.pdf
[Accessed 20 July 2013].
Maurizio, C. & Claudio, S., 2007. Bi-regional SAM linkages: a modified backward
and forward dispersion approach. RURDS, 18(3), pp. 233-254.
Mbatha, C., 2011. The Relevance of European Union-South Africa Trade and The
TDCA from a Perspective of South Africa's Agricultural Exports Between 1997 and
2008. Agrekon, 50(4), pp. 75-100.
McDonald, S., Kirsten, J. & van Zyl, J., 1997. A Social Accounting Matrix for
Modelling Agricultural Policy Reform in South Africa. Agrekon, 36(4), pp. 513-532.
Mclachlan, R., Clark, C. & Monday, I., 2002. Australian service sector: a study in
diversity. [Online]
Available at: http://www.pc.gov.au/__data/assets/pdf_file/0008/8477/assasid.pdf
[Accessed 04 May 2014].
Midmore, P., Munday, M. & Roberts, A., 2006. Assessing Industry Linkages Using
Regional Input-OUtput Tables. Regional Studies Association, 40(3), pp. 329-343.
Mitra, A., 2010. Trade in services: Impact on employment in India. The Social
Science Journal, 38(1), pp. 72-93.
Montgomery, D. & Tuladhar, S. D., 2013. Macroeconomic Impacts of LNG Exports
from the United States, s.l.: AGI Energia.

171
Morilla, C. R., Diaz-Salazar, G. L. & Cardenete, A. M., 2004. Economic and
Environmental Efficiency Using a Social Accounting Matrix, Pablo de Olavide:
Author.
National Planning Commission, 2013. National Development Plan 2030 Our Future-
make it work, Pretoria: Author.
Naude, W. & Rossouw, R., 2011. Export diversification and economic performance:
evidence from Brazil, China, India and South Africa. Econ Change Restruct, 44(1),
pp. 99-134.
Palley, T., 2003. International Trade, Macroeconomics, and Exchange Rates: Re-
examining the Foundations of Trade Policy. Paper presented at a conference on
Globalization and the Myths of Free Trade held at the New School for Social
Research, 18 April.
Persad, K., O'Connor, J. & Varghese, K., 1995. Forecasting engineering manpower
requirements for highway preconstruction activities. J. Manage, 3(11), pp. 41-47.
Plumstead, J., 2012. 2012 Americas School of Mines, s.l.: Author.
Pratt, S., 2010. Economic Linkages and Impacts Across The TALC. Annals of
Tourism Research, 38(2), pp. 630-650.
Proverbs, D., Holt, G. & Olomolaiye, P., 1999. A method for estimating labour
requirements and costs for international construction projects at inception. Build
Environ, 1(34), pp. 43-48.
Provide, 2003. Social Accounting Matrices and Economic Modelling, Elsenburg:
Author.
Rameezdeen, R. & Ramachandra, T., 2008. Construction linkages in a developing
economy: the case of Sri Lanka. Construction Management and Economics, 26(5),
pp. 499-506.
Rangasamy, L., 2009. Export and Economic Growth: The Case of South Africa.
Journal of International Development, 11(5), pp. 603-617.
172
Rankin, N. & Schoër, V., 2013. Export Destination, Product Quality and Wages in a
Middle-Income Country. The Case of South Africa. Review of Development
Economics, 27(1), pp. 64-73.
Reinert, K. & Roland-Holst, D., 1997. Chapter 4: Social accounting matrices. In: C.
U. Press, ed. Applied methods for trade policy analysis. Cambridge: Author, p. 95.
Robert, P. S. & Daniel, R. L., 2005. Microeconomics. 6th ed. Upper Saddle River:
Pearson Education.
Ruiz-Napoles, P., 2004. Exports, growth, and employment in Mexico, 1978–2000.
Journal of Post Keynesian Economics, 27(1), pp. 105-124.
Shankarmahesh, M. N., Olsen, H. W. & Honeycutt, E. D., 2005. A dominant product-
dominant country framework of industrial export segmentation. Industrial marketing
management, 34(3), pp. 203-210.
Shepherd, B., 2013. Export and FDI premia among services firms in the developing
world. Applied Economics Letters, 21(3), pp. 176-179.
Shiozawa, Y., 2007. A New Construction of Ricardian Trade Theory—A Many-
country, Many-commodity Case with Intermediate Goods and Choice of Production
Techniques. Evolutionary and Institutional Economics Review, 3(2), pp. 141-187.
Sing, C.-p., Love, P. E. & C.M., T., 2012. Multiplier Model for Forecasting Manpower
Demand. Journal of Construction Engineering and Management, 138(10), pp. 1161-
1168.
Slaughter, M. J., 1999. International Trade and Labor-Demand Elasticities, Hanover:
Author.
Statistics South Africa, 2005. Constructing a social accounting matrix: Comparisons
across eleven countries, Pretoria: Author.
Statistics South Africa, 2013. Gross domestic products, Pretoria: Author.
Stutz, F. P. & Warf, B., 2007. The World Economy. 5th ed. Upper Saddle River:
Geoscinces.
173
Thomas, P. I., 2008. Institutionalism and New Trade Theory: Rethinking
Comparative Advantage and Trade Policy. Journal of Economic Issues, 42(1), pp.
195-208.
Todaro, M. & Smith, S., 2011. Economic Development. 11th ed. Harlow: Pearson
Education Limited.
UNCTAD, 2013. Trade and Development Report, New York and Geneva: Author.
Uri, N. D. & Mixon, W., 1981. The effect of exports and imports on the stability of
employment in manufacturing industries in the Lfnited States. Applied Economics,
8(2), pp. 193-203.
US Department of Commerce, 1997. Regional Multipliers: A User Handbook for the
Regoinal Input-Output Modeling System (RIMS II), Washington DC: Author.
Van Marrewijk, C., 2007. International Economics. 1st ed. New York: Oxfard
university Press.
Wobst, P., 1998. A 1992 Social accounting Matrix (SAM) for Tanzania, Washington:
Author.
World Trade Organization, 2010. Measuring Trade in Services, s.l.: Author.
World Trade Organization, 2012. Trade and public policies: A closer look at non-tariff
measures in the 21st century, s.l.: Author.
World Trade Organization, 2014. International Trade Statistics 2014, s.l.: Author.