identifying dominant characteristics of students’ …performance using k-means clustering of...
TRANSCRIPT

Received: October 6, 2019. Revised: November 11, 2019. 167
International Journal of Intelligent Engineering and Systems, Vol.13, No.1, 2020 DOI: 10.22266/ijies2020.0229.16
Identifying Dominant Characteristics of Students’ Cognitive Domain on
Clustering-based Classification
Yuni Yamasari1,2* Supeno M. S. Nugroho1,3 Kayo Yoshimoto4
Hideya Takahashi4 Mauridhi H. Purnomo1,3
1Department of Electrical Engineering, Institut Teknologi Sepuluh Nopember, Surabaya, Indonesia
2Department of Informatics, Universitas Negeri Surabaya, Surabaya, Indonesia 3Department of Computer Engineering, Institut Teknologi Sepuluh Nopember, Surabaya, Indonesia
4Department of Electrical and Information Engineering, Osaka City University, Sumiyoshi-ku, Osaka, Japan
* Corresponding author’s Email: [email protected]; [email protected]
Abstract: The rapid growth of information and communications technology-based educational tools generates a
large volume of student data with many features (characteristics). However, the mining process in the clustering task
of student data is not often done optimally, so the performance of the system decreases. To overcome this problem,
we propose a discretization method on logistic regression to determine the most optimal number of clusters.
Additionally, we introduce a technique that combines the features selection using a filter- and wrapper-based
procedures (HFS) to identify the dominant features of the students' cognitive domains. Furthermore, we evaluate the
identification result by three clustering methods, namely: K-means, EM, and Farthest first. Finally, we propose the
clustering-based classification so the results can be measured by using the classification metrics. Here, we apply two
evaluation techniques, namely: cross-validation and percentage split. The experimental results indicate that our
approach describes predominance, in terms of classification metrics over conventional methods. Our approach is
around 10,847-11,134 percent higher in terms of accuracy average than the original features on both the assessment
techniques. Also, this approach significantly reduces the time taken to create a prototype between 0.0167-0.027
seconds. This gives the impact on a significant reduction in the model created to the number of unsuitable students
on classes based on the cognitive domain, namely: 3-12 students.
Keywords: Classification, Clustering, Student, Features selection, Cognitive domain.
1. Introduction
Recently, almost all processes in education rely
on information and communications technology to
make it better concerning the quality [1]. This
dependency generates a large volume of educational
data and triggers research in Educational Data
Mining (EDM). EDM itself is defined as a new data
mining grounds-based discipline, for example,
method, task, and algorithm. It is to investigate
those data to discover a descriptive pattern and
predictions that characterize behaviors, assessments,
educational functionalities, achievements, domain
knowledge content and applications of learners [2].
Besides, EDM is done using statistical, data mining
and machine learning algorithms [3].
One of the educational data is student data
consisting of features that describe the
characteristics of students [4-6]. The most popular
task in educational data mining for those student
data is classification. The previous research does in
mining various student data for the prediction, such
as psychomotor [7], academic performance [8, 9],
and the learning result [10]. Other research classifies
the data to predict the early failure of the student’s
academic on a specific subject [11] and to predict a
persuasive message to change the student’s attitude
[12]. Then, the classification is carried out to
analyze the student's behavior on online learning

Received: October 6, 2019. Revised: November 11, 2019. 168
International Journal of Intelligent Engineering and Systems, Vol.13, No.1, 2020 DOI: 10.22266/ijies2020.0229.16
[13] and to study the performance of undergraduate
students [14]. However, in the previous work,
almost all research still considers the whole features
or characteristics in the mining process. Meanwhile,
data sets often contain irrelevant features causing
the performance of the system to decrease or not
optimal [15]. Moreover, the data processing
consumes expensive computational time [16]
because this process involves all features.
Another favorite task in EDM is clustering. The
previous research does the clustering task for
analyzing the student's performance [17], for
identifying student’s typologies [18] and for
predicting the student's academic performance [19].
In other research, the clustering task is applied to
modeling the student career [20]. Overall, the
previous studies implement the clustering method
whose cluster number is determined by the user.
This is a crucial step because an incorrect number of
clusters drop the performance of the process.
To improve the performance of the system,
methods are explored, for example, feature
extraction, features selection, etc. In the research [21,
22] researchers do the extraction of features relating
to student's achievements. Meanwhile, the other
research applies features selection on student's
psychomotor domain [23], on student’s academic
performance [24, 25]. Here, the previous studies
have not yet made a combination of feature selection
Table 1. The previous works in the student clustering
Authors Feature
Discretization
Feature
Selection/
extraction
The evaluation
technique
Description
Cerezo et
al.[4]
Singh et
al.[17]
Najdi et
al.[18]
Li et al.[19]
Fan et al.[20]
Yamasari et
al.[21]
Yamasari et
al.[23]
Shankar et
al.[31]
Rosa et
al.[33]
Campagni et
al.[34]
Harwati et
al.[35]
Park et
al.[36]
No
No
No
No
No
No
No
No
No
No
No
No
No
No
No
No
No
the
category-
based
feature
extraction
Yes, the
random
selection
No
No
No
No
No
The statistical analysis
The silhouette score
The clustering result
focuses on the analysis of
cluster members
The clustering process is
a step in a system
The accuracy level and
the clustering time. No
discussion of this level.
The accuracy level
around 69%
The silhouette index
The silhouette index
Statistical analysis:
- Univariate Anova
- Spearman correlation
- Crosstabulation
Pearson’s correlation
The outcomes of the
clustering depend on the
group members ' study
The clustering result
depends on the group
members ' study
Clustering of students’ interaction patterns
on LMS using EM and K-means
Clustering of students’ academic
performance using K-means
Clustering of students’ typologies using K-
means
Clustering of student academic
performance using Fuzzy-C-Means (FCM)
for a predictive model
Clustering of college student using K-
means algorithm improved by the value of
the density threshold to remove outliers
Clustering of students’ achievement using
Fuzzy-C-Means. The research focus to
enhance the clustering performance using
the feature extraction based on category
Clustering of students’ psychomotor
domain using K-means. The initial of
cluster center point using K-means++ to
improve the cluster validity.
Clustering of students’ attributes with
respect to their country for analyzing of
their performance with K-means
The clustering of national and school
examinations-based high schools using
FCM
The students’ clustering for recognizing
strategies to improve the scheduling of
exams and the performance of students
using K-means
The mapping of students’ performance
using K-means
The clustering of students’ online behavior
using Latent Class Analysis (LCA)

Received: October 6, 2019. Revised: November 11, 2019. 169
International Journal of Intelligent Engineering and Systems, Vol.13, No.1, 2020 DOI: 10.22266/ijies2020.0229.16
methods to take advantage of these methods so that
the mining process has not been optimized.
In the context of a students' cognitive domain,
the low performance of the system generates invalid
information which leads the decision-maker to take
the wrong action. For example, a student is mapped
to an incorrect cluster (a good student is clustered as
a poor student). As a result, the student is treated
incorrectly. Moreover, accurate information is
critical for a teacher to determine the appropriate
teaching method to enhance the capability of the
students.
Nevertheless, some previous research is not
much which focuses on the discretization method
and feature selection to improve the performance
level of student clustering. Though, in terms of
accuracy, the performance still lows namely: 69%
measured by supervised evaluation. Furthermore,
almost all of the evaluation of the clustering result is
done by the unsupervised evaluation for examples:
silhouette index, analysis statistics, etc. (see Table 1).
Therefore, in this paper, we intend to work on
those problems by enhancing the performance of the
mining process. For this purpose, we extend the
previous work [26] to determine an optimal number
of clusters. Then, we propose a hybrid method that
combines feature selection methods, namely: a
filter-based and a wrapper-based approach, to
eliminate irrelevant features and to improve the
accuracy level. Also, we apply three clustering
methods: K-means, Expectation Maximum and
Farthest first. It is predicted that relevant features
are the dominant characteristics of a student based
on the cognitive domain. Furthermore, we propose
clustering-based classification such that the cluster
evaluation can be measured with the performance
metrics of the classifier. Finally, the dominant
characteristics identified to support a teacher to map
the students’ cognitive domain simpler and faster. It
is because the mining process only considers a few
features.
The remaining of this paper is managed in the
following way. Section 2 describes the related work.
Section 3 presents the proposed methods. Section 4
represents the results of the experiment and the
comparison of the clustering methods. Finally, the
conclusion is provided in the last section.
2. Related work
In this section, we discuss related work about
feature selection and the clustering evaluation.
2.1 Feature selection
There are two categories of feature selection
methods, namely: wrapper-based and filter-based
approaches [27]. Wrapper-based subset selection
(WBSE) is built by a classifier to estimate the worth
of each feature subset. Alternatively, Filter-based
subset evaluation (FBSE) was submitted to solve the
issue of the redundant feature [28]. FBSE evaluates
the whole subset with a multivariate way, eliminates
irrelevant features and explores the relationship
degree between them. FBSE is the method based on
a heuristic that exploits statistical measures and
probabilities to look for and evaluate the utility of
all features that have been known.
Furthermore, there is another method called
WBSE. It usually has better predictive accuracy than
FBSE [29]. This is because each feature subset is
evaluated by a particular classification algorithm. So,
a feature selection approach is more optimal.
However, this WBSE needs the most time to
evaluate each set of features by a classification
algorithm causing WBSE to be the more expensive
to be executed. Moreover, wrappers are more
difficult to shift from one classifier to another since
the selection process requires re-initiation.
Additionally, they are associated with the classifier's
algorithms. Dissimilar with wrappers, FBSE
explores distance measures and correlation functions
to select criteria of filters [15].
Relating to feature selection in the education
area, many researchers explore this method for
better performance of tasks in data mining. Deepika
et al. [30] propose feature selection method blending
Relief-F and Budget Tree-Random Forest to
improve the performance of student academic
Performance Prediction. W. Punlumjeak et al. [27]
explore feature selection methods consisting of
FBSE (information gain, genetic algorithms, and
minimum redundancy and maximum relevance-
MRMR) and WBSE (SVM). To evaluate these
methods, they apply four classifiers: naïve bays,
decision tree, k-nearest neighbor (k-NN) and neural
network. The highest performance is achieved by
combination MRMR and k-NN. Then, research [24]
propose FBSE method consisting of CfsSubsetEval,
ChiSquaredAttributeEval and is evaluated by 14
classifiers. After, they have compared each other. It
is found that the combination of random forest and
principal components is the best accuracy. These
researches [28] also employ FBSE method for
selecting features, namely: Chi-Square, to improve
the analysis sentiment on teaching evaluation. The
Received: October 6, 2019. Revised: November 11, 2019. 170
International Journal of Intelligent Engineering and Systems, Vol.13, No.1, 2020 DOI: 10.22266/ijies2020.0229.16
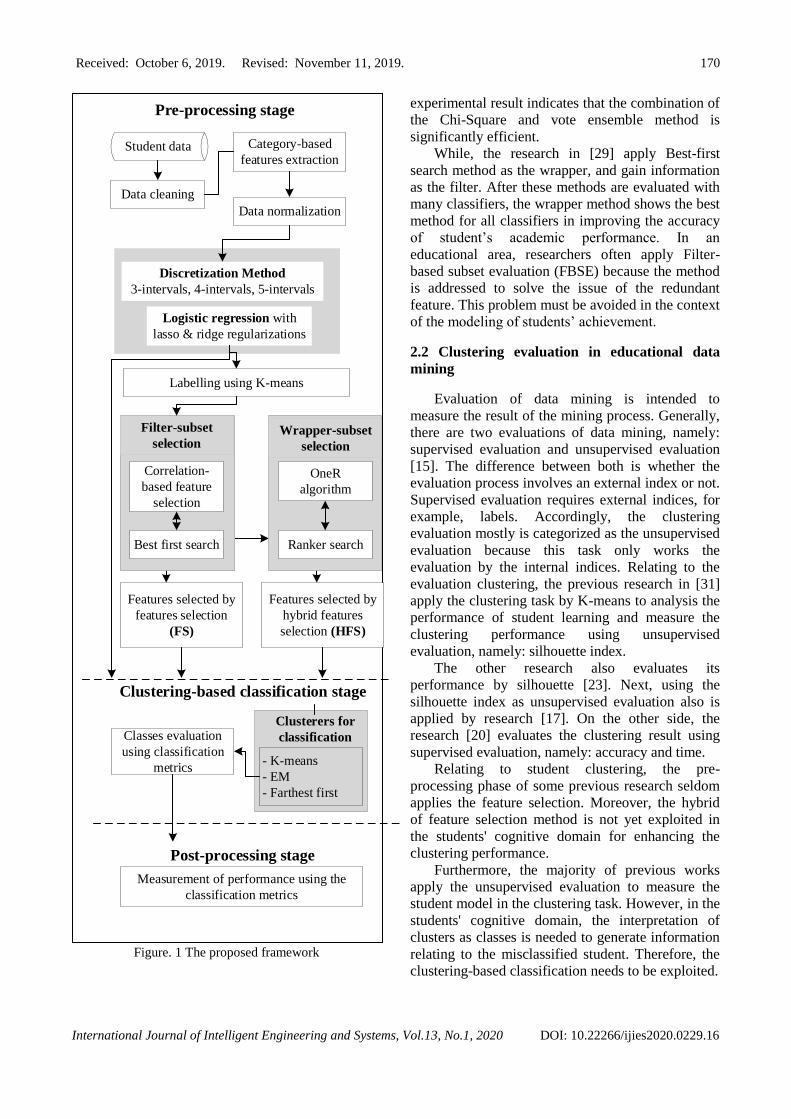
Figure. 1 The proposed framework
experimental result indicates that the combination of
the Chi-Square and vote ensemble method is
significantly efficient.
While, the research in [29] apply Best-first
search method as the wrapper, and gain information
as the filter. After these methods are evaluated with
many classifiers, the wrapper method shows the best
method for all classifiers in improving the accuracy
of student’s academic performance. In an
educational area, researchers often apply Filter-
based subset evaluation (FBSE) because the method
is addressed to solve the issue of the redundant
feature. This problem must be avoided in the context
of the modeling of students’ achievement.
2.2 Clustering evaluation in educational data
mining
Evaluation of data mining is intended to
measure the result of the mining process. Generally,
there are two evaluations of data mining, namely:
supervised evaluation and unsupervised evaluation
[15]. The difference between both is whether the
evaluation process involves an external index or not.
Supervised evaluation requires external indices, for
example, labels. Accordingly, the clustering
evaluation mostly is categorized as the unsupervised
evaluation because this task only works the
evaluation by the internal indices. Relating to the
evaluation clustering, the previous research in [31]
apply the clustering task by K-means to analysis the
performance of student learning and measure the
clustering performance using unsupervised
evaluation, namely: silhouette index.
The other research also evaluates its
performance by silhouette [23]. Next, using the
silhouette index as unsupervised evaluation also is
applied by research [17]. On the other side, the
research [20] evaluates the clustering result using
supervised evaluation, namely: accuracy and time.
Relating to student clustering, the pre-
processing phase of some previous research seldom
applies the feature selection. Moreover, the hybrid
of feature selection method is not yet exploited in
the students' cognitive domain for enhancing the
clustering performance.
Furthermore, the majority of previous works
apply the unsupervised evaluation to measure the
student model in the clustering task. However, in the
students' cognitive domain, the interpretation of
clusters as classes is needed to generate information
relating to the misclassified student. Therefore, the
clustering-based classification needs to be exploited.
Pre-processing stage
Student data
Data cleaning
Category-based
features extraction
Data normalization
Features selected by
features selection
(FS)
Features selected by
hybrid features
selection (HFS)
Clusterers for
classification
Clustering-based classification stage
Post-processing stage
Measurement of performance using the
classification metrics
- K-means
- EM
- Farthest first
Classes evaluation
using classification
metrics
Discretization Method
3-intervals, 4-intervals, 5-intervals
Logistic regression with
lasso & ridge regularizations
Correlation-
based feature
selection
Best first search
Filter-subset
selection
OneR
algorithm
Ranker search
Wrapper-subset
selection
Labelling using K-means
Received: October 6, 2019. Revised: November 11, 2019. 171
International Journal of Intelligent Engineering and Systems, Vol.13, No.1, 2020 DOI: 10.22266/ijies2020.0229.16
3. Methodology
In this research, our dominant characteristics
identification approach consists of three stages: pre-
processing, clustering-based classification and post-
processing. In detail, we explain our proposing
about the discretization method and feature selection
method in the pre-processing stage and clustering-
based classification as meta-algorithm in the mining
process stage. Fig. 1 illustrates the proposed
framework in identifying the dominant
characteristics of students.
3.1 Pre-processing stage
In this section, before we employ the
discretization method and features selection, we do
many steps, namely: data cleaning, category-based
features extraction, and data normalization.
In the research, the first step is data cleaning to
produce student data not containing the duplicate
record, etc. [16]. Here, a record is eliminated
because it contains null variables. Then, we do
category-based feature extraction as our previous
work to improve clustering performance [21]. In
data normalization step, features are normalized to
achieve the normal distribution by formula as
follows:
'x
x
−= (1)
Where x, µ and are respectively original
feature vector, mean of the feature vector and
standard deviation. In the next step, we propose the
discretization method on logistic regression before
the feature selection is done. This step is very
important because we apply the cluster algorithms
that the determination of the cluster number is set by
the user, namely: K-means, EM, and Farthest-first.
This method is carried out to know the fit
number of clusters to generate an optimal model.
Here, we adopt an equal width-based discretization
method to optimize this process. Equal width is
categorized as an unsupervised binning method to
transform numerical variables into categorical. This
algorithm splits the data into k intervals having an
equal size. The formula of intervals width and
interval boundaries are as follows:
max min( ) /W V V k= − (2)
, 2 ,..., ( 1)min min minV W V W V k W+ + + − (3)
Where, W, Vmin and Vmax are the interval width,
the maximum and minimum values respectively.
Furthermore, we propose to apply this method to
three-interval, four-interval, and five-interval. We
decide at these intervals because the previous
research generally divides student data from three to
five groups. For examples: three groups [32], [33],
[34], [35], [5], four groups [36], [20], [4], and five
groups.
We combine the discretization method and
logistic regression to find the best interval with two
regularizations, namely: lasso and ridge.
Additionally, we set the evaluation technique with
the percentage split. The evaluation result of all
intervals is measured by the correlation value and
average accuracy level on all splits. The
discretization result is very important to decide the
number of groups in the labeling step. Here, we
apply the K-means to generate label our student data.
This step also supports to evaluate the clustering
using the classification metrics.
Then, we also propose feature selection methods.
In this step, we propose the combination of both the
filter and wrapper approaches to enhance the
accuracy level. In the first step, we build a filter-
based approach called FS (Features Selection). Here,
we generate a new set N of reduced features by
doing the process on the original features M, where
N M.
We propose the Correlation Feature Selection
(CFS) having robustness in deleting irrelevant and
redundant features. CFS can do it because of the
relationship between features evaluated by Eq. (4).
This formula defines the function of merit,
which is used to pick a subset S consisting of k
number of characteristics. Determining both
unnecessary and redundant characteristics is
achieved by 𝑟𝑐𝑓 providing that element’s
relationship means to its unit. In the meanwhile,
𝑟𝑓𝑓 is the relationship mean among features.
(4)
CFS is a filter-based algorithm evaluating subsets of
features based on a heuristic evaluation function
with the hypothesis "A good feature subset is one
that contains features highly correlated with the
class, yet uncorrelated with each other" [37]. So, we
apply a heuristic search, namely: Best first as a
search function. Best first use greedy hill-climbing
augmented with a backtracking facility to search the
space of feature subsets.
( 1)
krcfMS
k k k rff=
+ −
Received: October 6, 2019. Revised: November 11, 2019. 172
International Journal of Intelligent Engineering and Systems, Vol.13, No.1, 2020 DOI: 10.22266/ijies2020.0229.16
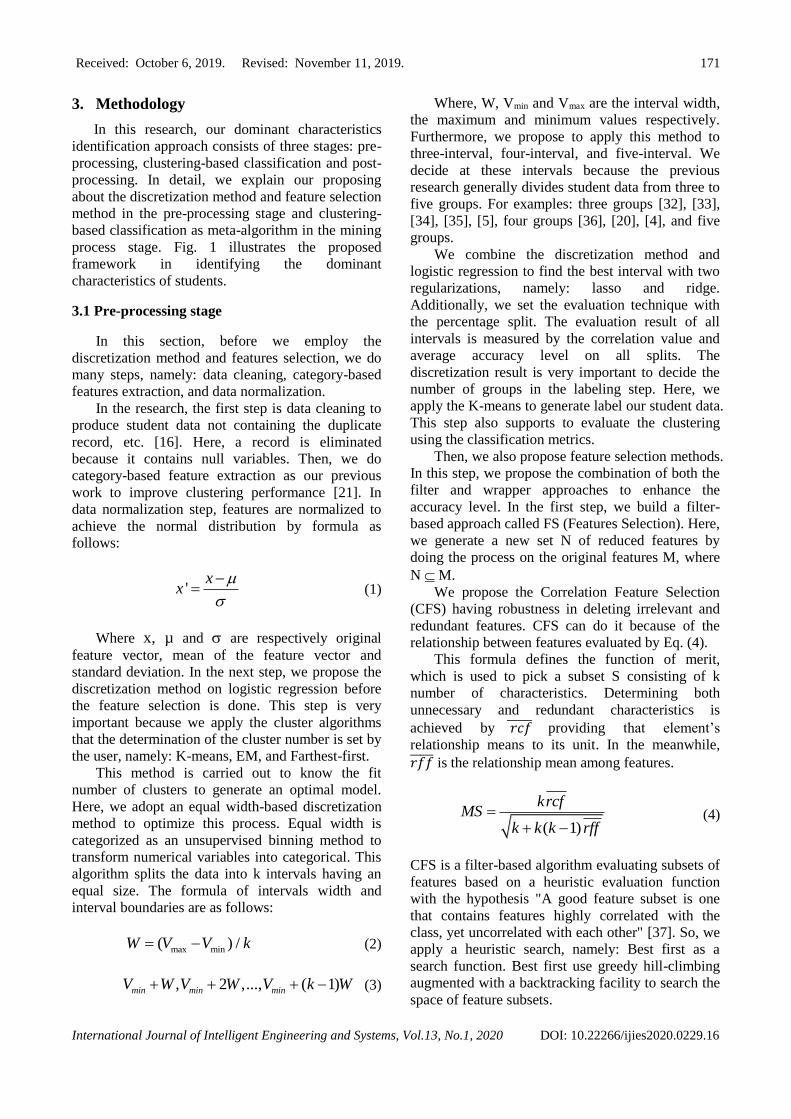
Figure. 2 The collection process of student data
In the second step, we combine the filter-based
approach (FBSE) with wrapper-based an approach
(WBSE) called HFS (Hybrid Feature Selection).
Here, we want to reduce feature set L accumulated
from both of them to produce features O, where O
N M.
For WBSE, classification algorithms or
classifiers can be employed to build a wrapper-
based approach (WBSE) to evaluate each set of
features [38]. Therefore, in this research, we exploit
classifiers, namely: one Rule (oneR) algorithm, to
build this approach. This algorithm is simple and yet
can achieve high accuracy [39]. one Rule evaluates
the attribute worth method and then it ranks
attributes by their evaluations. Besides, it does
prediction using the minimum-error attribute.
3.2 Clustering-based classification
Generally, clustering is categorized as
unsupervised learning, and it usually generates
clusters evaluated by the unsupervised evaluation.
Where the evaluation does not involve external
information for example: label. In this case,
especially on the clustering of the students' cognitive
domain, we want to interpret clusters as classes. So,
we can measure the performance of clustering by
using classification metrics although our student
data does not have a label (unlabeled data).
Therefore, we propose a clustering-based
classification. Here, we adopt a simple meta-
classifier that uses cluster algorithms as classifiers
called clusterers. In this research, we apply cluster
algorithms that use a fixed number of clusters,
namely: K-means, EM, and Farthest-first. The code
of a simple meta-classifier is based on the 'clusters
to classes' functionality [40]. Generally, this method
consists of 2 steps, namely: clustering for
classification and measuring the resulted clusters
using the classifier performance.
3.3 Post-processing stage
In this stage, we evaluate our proposed
framework using two evaluation techniques,
namely: the cross-validation and the percentage split.
The evaluation results are measured by many
metrics of classification, namely: Precision, Recall,
F-Measure, MAE and Accuracy.
TPPrecision
TP FP=
+ (5)
TPRecall
TP FN=
+ (6)
2
2
TPF Measure
TP FP FN− =
+ + (7)
TP TNAccuracy
TP TN FP FN
+=
+ + + (8)
Where,
TP = True Positives is the number of positive
predicted instances which are actually positive
FP = False Positives is the number of positive
predicted instances which are actually negative
TN = True Negatives is the number of negative
predicted instances which are actually negative
FN = False Negatives is the number of negative
predicted instances that are actually positive.
Then, we do the results visualization and
analyze the misclassified student on all methods.
Finally, we also record the time taken to build
student modeling. So, we can analyze how long our
Study program of Information
Technology Education
Study program of
Information System
Study program of Informatics
Student data
Report
Teacher

Received: October 6, 2019. Revised: November 11, 2019. 173
International Journal of Intelligent Engineering and Systems, Vol.13, No.1, 2020 DOI: 10.22266/ijies2020.0229.16
proposed approach takes a faster time than the
others.
4. Result and discussion
In this section, we describee the student data
used for evaluation, the experimental result and
metrics adopted to measure the performance of our
proposed framework.
4.1 Student data description
Student data in this research are collected from
the higher education in Surabaya, Indonesia,
namely: Universitas Negeri Surabaya.
There are 98 students in the first semester of the
Informatics department involved in this research.
They come from 3 study programs, namely:
Informatics, Information System and Technology
Information Education. They interact with the
evaluation system called the TESTment system.
There are 10 the main questions and 30 the
scaffolding questions (the guide questions to solve
the main questions) entered by the teacher to the
Table 2. Features selection for Student data that its
features extracted based on category
Feature
Selection
Sum of
Features Feature Selection
Original
Features 10
MID, MID%True,
Time_MID,
Score_MID, GID,
GID%True,
Time_GID, Hint_GID,
Score_GID,
Score_Total
Features
Selection (FS) 2 MID, GID%True
Hybrid Features
Selection (HFS) 1 MID
system. Also, each main question contains three
scaffolding questions. In this test, each scaffolding
question provides hints which assist the student in
solving the test item. All activities of the student are
logged, and the processing time of each item is
recorded. Therefore, there are 153 raw features
stored in the database: MID1,…, MID10,
MID%True, Time_MID1, …, Time_MID10,
Score_MID1,…, Score_MID10, GID1.1,…, GID1.3,
GID2.1,…, GID2.3,…, GID3.1,…, GID3.3,
GID4.1,…, GID4.3, …, GID10.1,…, GID10.3,
GID%True, Time_GID1.1,…Time_GID10.3,
Figure. 5 Comparison of accuracy level average on all
intervals using logistic regression
72.31
68.33
62.44
73.22
70.93
65.73
three-interval
four-interval
five-interval
The average of accuracy level (%)Inte
rval
s o
f d
iscr
etiz
atio
n m
eth
od
ridge lasso
Figure. 3 Discretization-three interval-lasso
Figure. 4 Discretization-three interval-ridge

Received: October 6, 2019. Revised: November 11, 2019. 174
International Journal of Intelligent Engineering and Systems, Vol.13, No.1, 2020 DOI: 10.22266/ijies2020.0229.16
Hint_GID1.1, …, Hint_GID10.3, Score_GID1.1, …,
Score_GID10.3, Score_Total. These features are
characteristics' student called as a student data.
Generally, student data is exploited to generate
the students' achievement report. Further, our
research explores the student data for building an
effective model of students' cognitive domain.
Generally, the process of data collecting is described
in Fig. 2. Features of student data are extracted
based on the category, as in the previous research
[21] to improve the performance. This extraction is
carried out by merging some features and
calculating its average value with these formulas as
follows, for n = the number of the main items, m =
the number of scaffolding items.
1
n
i
i
MID
MIDn
==
(9)
1
( )
%
n
i
MID True
MID Truen
=
=
=
(10)
1
_
_
n
i
i
Time MID
Time MIDn
==
(11)
1
_
_
n
i
i
Score MID
Score MIDn
==
(12)
,
1 1
.
n m
i j
i j
GID
GIDn m
= ==
(13)
,
1 1
( )
%.
n m
i j
i j
GID True
GID Truen m
= =
=
=
(14)
,
1 1
_
_.
n m
i j
i j
Time GID
Time GIDn m
= ==
(15)
Table 3. Performance of clustering-based classification on 4 metrics
Cross-validation technique (Average) Percentage split technique (Average)
Method Precision Recall F-Measure MAE Precision Recall F-Measure MAE
Ori_Kmeans 0.5875 0.7143 0.6311 0.1911 0.5833 0.7305 0.638 0.1797
FS_Kmeans 0.7079 0.692 0.6915 0.2054 0.6709 0.7962 0.7241 0.1394
HFS_Kmeans 0.7932 0.7729 0.7786 0.1514 0.7276 0.8452 0.7786 0.1032
Ori_EM 0.5959 0.7299 0.6449 0.1801 0.6003 0.7217 0.6057 0.1855
FS_EM 0.8091 0.7775 0.785 0.1485 0.8086 0.8342 0.8118 0.1105
HFS_EM 0.8469 0.768 0.7949 0.1546 0.6 0.7733 0.6753 0.1511
Ori_FarthestFirst 0.5218 0.6561 0.6042 0.2587 0.5506 0.6593 0.5667 0.227
FS_FarthestFirst 0.765 0.7813 0.762 0.1959 0.695 0.7221 0.67 0.1852
HFS_FarthestFirst 0.7933 0.7911 0.7779 0.1392 0.7549 0.7856 0.7383 0.143
Figure. 6 Comparison of accuracy level average on
cross-validation technique
Figure. 7 Comparison of accuracy level average on
percentage split technique

Received: October 6, 2019. Revised: November 11, 2019. 175
International Journal of Intelligent Engineering and Systems, Vol.13, No.1, 2020 DOI: 10.22266/ijies2020.0229.16
,
1 1
_
_.
n m
i j
i j
Hint GID
Hint GIDn m
= ==
(16)
,
1 1
_
_.
n m
i j
i j
Score GID
Score GIDn m
= ==
(17)
_Score Total MID GID= + (18)
From this step, we obtain 10 new features as
Original Features (see Table 2.) which represent the
raw 153 features. This method has significantly
reduced the number of execution time and enhanced
the accuracy level.
4.2 Identifying the dominant characteristics
In the pre-processing phase, there are two
methods proposed. They are the discretization
method on the logistic regression and the
combination of features selection methods.
Firstly, we apply the discretization method on
the logistic regression to support in labeling step.
Figure. 10 The best mapping result on percentage split
technique (HFS feature and K-means on split 73)
Figure. 11 The worst mapping result on percentage split
technique (FS features and Farthest first on split 70)
Figure. 8 The best mapping result on cross-validation
technique (HFS features and Farthest first on fold 10)
Figure. 9 The worst mapping result on cross-validation
technique (Original features and Farthest first on fold 6)

Received: October 6, 2019. Revised: November 11, 2019. 176
International Journal of Intelligent Engineering and Systems, Vol.13, No.1, 2020 DOI: 10.22266/ijies2020.0229.16
Furthermore, this method is explored to decide the
number of clusters to obtain the optimal clustering
process. Here, we adopt the discretization method
which is called equal-width to discretize the
continuous data on student data extracted based on
category. Additionally, we do the discretization for
three-interval, four-interval, and five-interval as
extended to the previous work [26]. For evaluating,
we build the logistic regression with two
regularizations: lasso, ridge.
Additionally, we explore percentage split as the
evaluation technique with training size: 10%, 20%,
30%, 40%, 50% and 60% on train/test repeating: 2
and 3. Metrics adopted for evaluation of the
discretization method is the correlation and average
accuracy level. For correlation metric (r-value),
three-interval combined by logistic regression
achieves the highest value on both regularization
lasso and ridge.
Here, the XY-axis is divided into three intervals,
namely: ≥0.351936, -0.923146 – 0.351936, <-
0.923146. The experimental result shows that lasso
and ridge are r = -0.33 and r =-0.42, respectively,
described in Figs. 3-4. Four-interval on lasso and
ridge are r =-0.22 and r = -0.42. Lastly, on five-
interval, lasso and ridge are r = 0.25 and r = 0.19,
respectively.
Further, we compare the average accuracy level
on all intervals and regularizations as shown in Fig.
5. The experimental result indicates that three-
interval achieves the highest value for all
regularizations, namely: ridge = 72.31% and lasso =
73.22%. This means that the most optimal number
cluster is three clusters.
Secondly, we exploit features selection methods
to find relevant features which are dominant
characteristics of the students’ cognitive domain.
Here, we propose Hybrid Features Selection (HFS)
which is a combination of both the filter-based and
wrapper-based approach. The result of this step is
depicted in Table 2. It is found that FS and HFS
eliminate 8 and 9 irrelevant features of 10 original
features.
4.2 Evaluating the clustering-based classification
performance
To evaluate what these features are dominant
characteristics of a students' cognitive domain, we
propose the clustering-based classification model to
measure the result with the more metrics. Besides,
our proposed approach can generate information
relating to the sum of misclassified students. Here,
we employ two evaluation techniques, namely:
cross-validation and percentage split. We do the
cross-validation on fold 3-12 and the percentage
split on split 66%, 70%, 73%, 75%, 78%, 80%, 83%,
85%, 88% and 90%. The evaluation results on both
techniques are presented on four metrics, namely:
precision, recall, F-measure and MAE, described in
Table 3. HFS feature achieves the highest level on
almost three metrics, namely: precision, recall and
F-Measure. Additionally, the lowest level of MAE
metric illustrating the prediction error level also is
reached by the HFS feature. It means that the HFS
feature is a dominant characteristic.
Additionally, we also measure the performance
by the accuracy level. In general, the accuracy level
of both techniques fluctuates. In detail, it is found
that the highest accuracy level on the cross-
validation technique is achieved by the combination
of HFS features and Farthest first on fold 10 about
86.5979%. On the contrary, the lowest accuracy
level is reached by the combination of original
features and farthest first on fold 6 about 55.6701 %.
In another technique, the highest accuracy level
is reached by the combination of HFS features and
K-means about 96.1538%. Inversely, the lowest
accuracy level is achieved by the combination of FS
features and Farthest first about 37.931%. It is found
that the HFS feature is the dominant characteristic of
students' cognitive indicated by the HFS feature
achieves the highest accuracy level on all evaluation
techniques.
In addition, we also count the accuracy level
average on all folds and all splits for every method.
The experiment results describe that the HFS feature
outperforms higher value than the others on two
clustering methods of three clustering methods
applied on both evaluation techniques as shown in
Figs. 6 and 7. On the cross-validation technique
depicted in Fig. 6, the HFS feature achieves the
highest accuracy level average compared by the
others when it is combined by Farthest first and K-
means about 78.247% and 76.495%, respectively.
Especially, on the EM method, the HFS feature
achieves a lower accuracy level average than FS
features. On the contrary, original features have the
lowest position in terms of the accuracy level
average on Farthest first and EM about 67.113% and
72.990%.
So, the HFS feature can improve the model
performance of students' cognitive domain optimally,
in terms of the accuracy level average, when it is
combined by Farthest first and K-means. On K-
means, the HFS feature can improve the higher
accuracy level average than original features and FS
features about 5.1546 % and 8.6598%, respectively.
While, on Farthest first, the HFS feature can
improve the higher accuracy level average than FS
Received: October 6, 2019. Revised: November 11, 2019. 177
International Journal of Intelligent Engineering and Systems, Vol.13, No.1, 2020 DOI: 10.22266/ijies2020.0229.16
features and original features around 0.92785% and
11.13402%.
The percentage split describes the same result
with the cross-validation. The HFS feature also
reaches the highest of accuracy level average when
this feature is combined by Farthest first and K-
means, namely: about 78.247% and 76.495%,
respectively. On the contrary, the HFS feature only
achieves a lower accuracy level average than FS
features on the EM method. Conversely, the lowest
accuracy level average is achieved by original
features on all clustering methods, namely: Farthest
first, EM and K-means about 65.942%, 72.182%,
and 73.049%, respectively.
This means that the HFS feature can improve the
model performance of students' cognitive domain
significantly, in terms of the accuracy level average,
when this feature is combined by Farthest first and
K-means. Also, on K-means, the HFS feature can
improve the performance, in terms of accuracy level
average than original features and FS features about
10.609 % and 9.724%, respectively. The
combination of HFS feature and Farthest first can
improve the higher accuracy level average than FS
features and original features around 8.541% and
10.847%. Inversely, the performance of students'
cognitive domain reaches the lower of accuracy
level average than the HFS feature when original
features are combined by all clustering methods,
namely: Farthest first about 10.847%, EM about
5.148% and K-means 10.609%. This indicates that
the HFS feature is the dominant characteristic of
students' cognitive domain.
Furthermore, we visualize the best result and the
worst result of a students’ cognitive domain
clustering based on the accuracy level depicted in
Figs. 8-11. We also analyze the sum of misclassified
Table 4. Comparison of the sum average of inappropriate
students’ cognitive domain
The sum average of the
misclassified students
Method Cross-
validation
Percentage
split
Ori_Kmeans 28 6
FS_Kmeans 29 3
HFS_Kmeans 22 3
Ori_EM 26 6
FS_EM 22 4
HFS_EM 23 5
Ori_FarthestFirst 32 8
FS_FarthestFirst 21 6
HFS_FarthestFirst 20 5
students. The visualization is done on the cross-
validation technique and the percentage split
depicted in Figs. 8 and 9 and on Figs. 10 and 11,
respectively.
The best mapping of students' cognitive domain
on the cross-validation is generated by the
combination of the HFS feature and the Farthest first
on fold 10 described in Fig. 8. The clusters'
composition is as follows; cluster 1: 89 students,
cluster 2: 3 students, cluster 3: 5 students. The sum
of the misclassified student is 13 students. On the
contrary, the worst mapping of students' cognitive
domain on the cross-validation is obtained by the
combination of the original features and the Farthest
first on fold 6 illustrated in Fig. 9. The composition
of cluster 1, cluster 2, and cluster 3 are 57, 39 and 1
student, respectively. In addition, this model
produces the sum of the misclassified student,
namely: 43 students.
On the percentage split, the best mapping of
students’ cognitive domain is generated by the
combination of the HFS feature and K-means on
split 73 illustrated in Fig. 10. The composition of all
clusters is as follows; cluster 1: 22 students, cluster
2: 0 students, cluster 3: 4 students. Additionally, the
sum of the misclassified student is only 1 student.
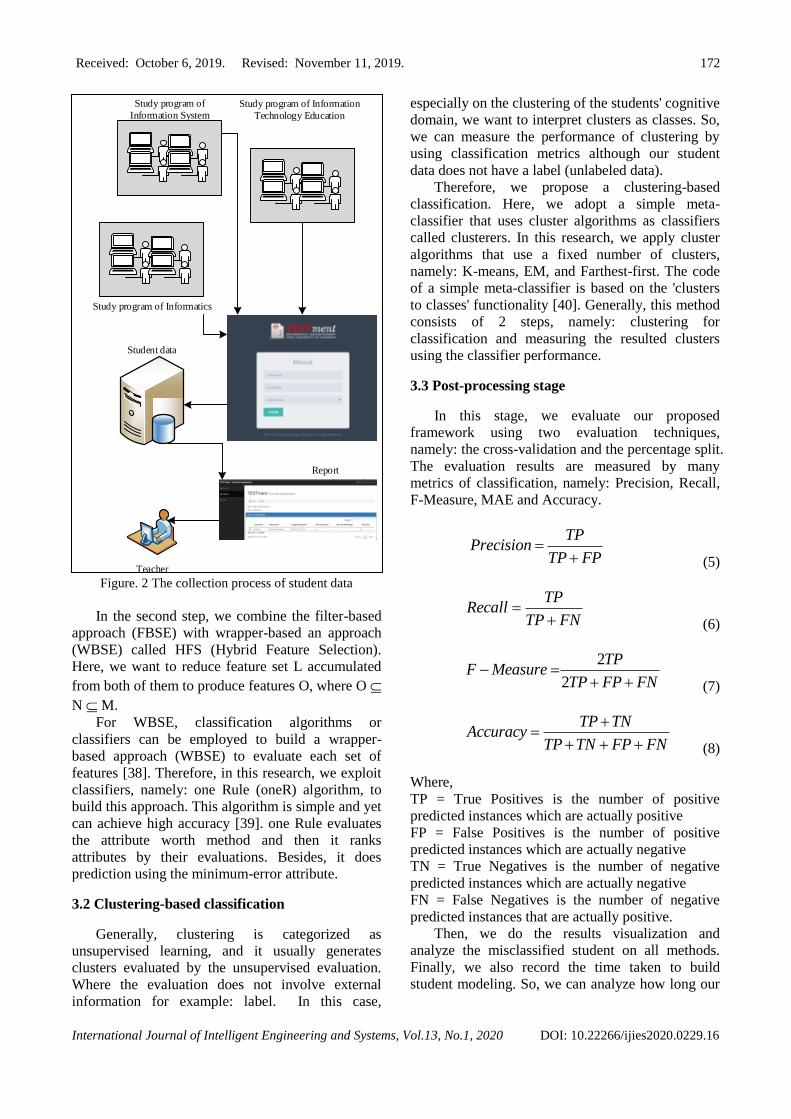
Figure. 12 Comparison of time taken to build a model
on cross-validation technique
Figure. 13 Comparison of time taken to build a model
on percentage split technique
Received: October 6, 2019. Revised: November 11, 2019. 178
International Journal of Intelligent Engineering and Systems, Vol.13, No.1, 2020 DOI: 10.22266/ijies2020.0229.16
On the contrary, the worst mapping of students'
cognitive domain is obtained by the combination of
the FS features and Farthest first on the percentage
split 70 depicted in Fig. 11. The composition of
cluster 1, cluster 2, and cluster 3 are 7, 0 and 20
students, respectively. In addition, this model
produces the sum of the misclassified students,
namely: 18 students. Here, the fewest sums of
misclassified students on both evaluation techniques
are generated by the HFS feature.
Overall, the HFS feature has the lowest sum
average of misclassified students as shown in Table
4. Here, we can infer that the HFS feature can
decrease the misclassified students significantly on
K-means and Farthest first. On the cross-validation,
the reduction sums of the misclassified student are 6
students from 28 to 22 for the combination of HFS
and K-means. Next, the combination of HFS and
Farthest first can decrease12 misclassified students
from 32 to 20. On the split percentage, the reduction
sums of the misclassified student are 3 students from
6 to 3 on K-means and form 8 to 5 on Farthest first.
This indicates that the HFS feature is the dominant
characteristic because this feature can improve the
mapping of students' cognitive domain.
Finally, we also record the time needed to build
the student modeling for all methods on both
evaluation techniques as depicted in Figs. 12 and 13.
Here, almost all the combination of FS features and
clustering methods achieve the lowest time taken to
build the model on both evaluation techniques. On
the contrary, the highest time taken is reached by the
combination of original features and all clustering
methods on all evaluation techniques. Furthermore,
the lowest time taken is achieved by FS features
combined by clustering methods: K-means about
0.003 seconds and EM about 0.008 seconds using
the cross-validation technique described in Fig. 12.
The same results also occur on the FS features
exploited using the percentage split. FS features
reach the lowest time taken to build the model when
they are combined by K-means around 0.003
seconds and EM around 0.0133 seconds depicted in
Fig. 13. Inversely, original features combined by all
clustering methods achieve the highest time taken
on all evaluation techniques as shown in Figs. 12
and 13. Here, the longest duration occurs on the
model built by the combination of original features
and EM for both evaluation techniques, namely: on
the cross-validation around 0.047 seconds and the
percentage split around 0.0422 seconds.
In addition, the HFS only achieves the lowest
time taken to build the model on Farthest first using
the cross-validation and percentage split about 0
seconds. This happened because the time taken
needed in milliseconds, while our system records in
seconds form. On the other methods, FS features
still achieve the lower time taken than the HFS
feature. This means that FS features can reduce
optimally the time taken on all combinations.
However, in the experimental results, the HFS
feature combined by all methods reaches the lower
time taken than the original features combined by all
methods in all cases. This is indicated by the HFS
feature on cross-validation that can reduce the time
taken to build the model on Farthest first about
0.006 seconds, on EM about 0.027 seconds and on
K-means about 0.011 seconds. Additionally, on the
percentage split, the HFS feature also decreases the
time taken on EM around 0.0167 and K-means
around 0.0010 seconds.
This indicates that the HFS feature is faster than
Original features for building the student modeling
relating to mapping the students' cognitive domain.
From the aforementioned results, we conclude
that our proposed approach provides excellent
identification of dominant characteristics indicated
by the optimal value on all metrics of the classifiers.
5. Conclusions
This research demonstrates that our proposed
approach successfully identifies relevant features as
dominant characteristics. In terms of classifier
metrics, our method can improve the performance of
clustering-based classification significantly. On the
cross-validation for Farthest first on both the
evaluation techniques, our method is about 11.134
percent higher in terms of accuracy average level
than the original features. Then, our method can also
enhance this metric about 10.847 percent than the
original features on the percentage split. So, this
model generated can decrease the sum of
inappropriate students based on the cognitive
domain significantly. On the cross-validation, the
reduction sums of the misclassified student are 6
from 28 to 22 students for the combination of HFS
and K-means. Next, the combination of HFS and
Farthest first can decrease by about 12 from 32 to 20
students. On the split percentage, the reduction sums
of the misclassified student are 3 students from 6 to
3 on K-means and from 8 to 5 on Farthest first.
Furthermore, this method reduces drastically the
time taken to build a model based on the cross-
validation and percentage split when HFS is
combined on EM around 0.027 and 0.0167 seconds,
respectively. Finally, the teacher can map this
domain simpler and faster than that of using all
features.
Received: October 6, 2019. Revised: November 11, 2019. 179
International Journal of Intelligent Engineering and Systems, Vol.13, No.1, 2020 DOI: 10.22266/ijies2020.0229.16
Acknowledgments
The authors would like to thank Indonesia
Endowment Fund BUDI-DN/LPDP for Education
for their support through the Indonesian education
scholarship program, and also the Ministry of
Research, Technology, and Higher Education
through the scholarship of Enhancing International
Publication Program (PKPI / sandwich-like) 2018.
References
[1] M. W. Rodrigues, L. E. Zárate, and S. Isotani,
“Educational Data Mining: A review of
evaluation process in the e-learning”, Telemat.
Informatics, 2018.
[2] A. Pena-Ayala, Educational data mining:
Applications and trends. 2014.
[3] P. Dillenbourg, “The Evolution of Research on
Digital Education”, Int. J. Artif. Intell. Educ.,
Vol. 26, No. 2, pp. 544–560, 2016.
[4] R. Cerezo, M. Sánchez-Santillán, M. P. Paule-
Ruiz, and J. C. Núnez, “Students’ LMS
interaction patterns and their relationship with
achievement: A case study in higher education”,
Comput. Educ., Vol. 96, pp. 42–54, 2016.
[5] S. Natek and M. Zwilling, “Student data mining
solution–knowledge management system
related to higher education institutions”, Expert
Syst. Appl., Vol. 41, No. 14, pp. 6400–6407,
2014.
[6] C. Troussas, M. Virvou, and S. Mesaretzidis,
“Comparative Analysis of algorithms for
student characteristics classification using a
Methodological Framework”, In: Proc. of the
6th International Conference on Information,
Intelligence, Systems and Applications (IISA),
2015.
[7] R. Harimurti, Y. Yamasari, Ekohariadi, Munoto,
and B. I. G. P. Asto, “Predicting student’s
psychomotor domain on the vocational senior
high school using linear regression”, In: Proc.
of 2018 International Conference on
Information and Communications Technology
(ICOIACT), pp. 448–453, 2018.
[8] F. Ahmad, N. H. Ismail, and A. A. Aziz, “The
prediction of students’ academic performance
using classification data mining techniques”,
Appl. Math. Sci., Vol. 9, pp. 6415–6426, 2015.
[9] B. Guo, R. Zhang, G. Xu, C. Shi, and L. Yang,
“Predicting students performance in
educational data mining”, In: Proc. of
International Symposium on Educational
Technology, ISET 2015, 2016.
[10] M. Wati, W. Indrawan, J. A. Widians, and N.
Puspitasari, “Data mining for predicting
students’ learning result”, In: Proc. of 2017 4th
International Conference on Computer
Applications and Information Processing
Technology (CAIPT), 2017, pp. 1–4.
[11] E. B. Costa, B. Fonseca, M. A. Santana, F. F.
de Araújo, and J. Rego, “Evaluating the
effectiveness of educational data mining
techniques for early prediction of students’
academic failure in introductory programming
courses”, Comput. Human Behav., Vol. 73, pp.
247–256, 2017.
[12] Y. Promdee, S. Kasemvilas, N. Phangsuk, and
R. Yodthasarn, “Predicting Persuasive Message
for Changing Student’s Attitude Using Data
Mining”, In: Proc. of 2017 International
Conference on Platform Technology and
Service (PlatCon), pp. 1–5, 2017.
[13] W. Xing, R. Guo, E. Petakovic, and S. Goggins,
“Participation-based student final performance
prediction model through interpretable Genetic
Programming: Integrating learning analytics,
educational data mining and theory-ARM”,
Comput. Human Behav., Vol. 47, pp. 168–181,
2015.
[14] R. Asif, A. Merceron, S. A. Ali, and N. G.
Haider, “Analyzing undergraduate students’
performance using educational data mining”,
Comput. Educ., Vol. 113, pp. 177–194, 2017.
[15] N. T. Pang, M. Steinbach, and V. Kumar,
Introduction to Data mining. 2006.
[16] J. Han, M. Kamber, and J. Pei, Data Mining
Concepts and Techniques. USA: Elsevier, 2012.
[17] I. Singh, A. S. Sabitha, and A. Bansal, “Student
performance analysis using clustering
algorithm”, In: Proc. of 2016 6th International
Conference - Cloud System and Big Data
Engineering (Confluence), pp. 294–299, 2016.
[18] L. Najdi and B. Er-Raha, “Implementing cluster
analysis tool for the identification of students
typologies”, In: Proc. of 2016 4th IEEE
International Colloquium on Information
Science and Technology (CiSt), pp. 575–580,
2016.
[19] Z. Li, C. Shang, and Q. Shen, “Fuzzy-clustering
embedded regression for predicting student
academic performance”, In: Proc. of 2016
IEEE International Conference on Fuzzy
Systems (FUZZ-IEEE), pp. 344–351, 2016.
[20] Z. Fan and Y. Sun, “Clustering of College
Students Based on Improved K-Means
Algorithm”, In: Proc. of 2016 International
Computer Symposium (ICS), pp. 676–679, 2016.
[21] Y. Yamasari, S. M. S. Nugroho, I. N. Sukajaya,
and M. H. Purnomo, “Features extraction to
improve performance of clustering process on

Received: October 6, 2019. Revised: November 11, 2019. 180
International Journal of Intelligent Engineering and Systems, Vol.13, No.1, 2020 DOI: 10.22266/ijies2020.0229.16
student achievement”, In: Proc. of 2016
International Computer Science and
Engineering Conference (ICSEC), pp. 1–5,
2016.
[22] M. Singh, J. Singh, and A. Rawal, “Feature
Extraction Model to Identify At -- Risk Level
of Students in Academia”, In: Proc. of 2014
International Conference on Information
Technology, pp. 221–227, 2014.
[23] Y. Yamasari, S. M. S. Nugroho, R. Harimurti,
and M. H. Purnomo, “Improving the cluster
validity on student’s psychomotor domain
using feature selection”, In: Proc. of 2018
International Conference on Information and
Communications Technology (ICOIACT), pp.
460–465, 2018.
[24] M. Zaffar, M. A. Hashmani, and K. S. Savita,
“Performance analysis of feature selection
algorithm for educational data mining”, In:
Proc. of 2017 IEEE Conference on Big Data
and Analytics (ICBDA), pp. 7–12, 2017.
[25] A. Pradeep, S. Das, and J. J. Kizhekkethottam,
“Students dropout factor prediction using EDM
techniques”, In: Proc. of the IEEE International
Conference on Soft-Computing and Network
Security, ICSNS 2015, 2015.
[26] Y. Yamasari, P. W. Rusimamto, N.
Rochmawati, D. F. Suyatno, S. C. Wibawa, S.
M. S. Nugroho, and M.H. Purnomo,
“Discretization method to optimize logistic
regression on classification of student’s
cognitive domain”, MATEC Web Conf., Vol.
197, p. 3006, 2018.
[27] W. Punlumjeak and N. Rachburee, “A
comparative study of feature selection
techniques for classify student performance”,
In: Proc. of 2015 7th International Conference
on Information Technology and Electrical
Engineering (ICITEE), pp. 425–429, 2015.
[28] C. Pong-Inwong and K. Kaewmak, “Improved
sentiment analysis for teaching evaluation using
feature selection and voting ensemble learning
integration”, In: Proc. of 2016 2nd IEEE
International Conference on Computer and
Communications (ICCC), pp. 1222–1225, 2016.
[29] L. Rahman, N. A. Setiawan, and A. E.
Permanasari, “Feature selection methods in
improving accuracy of classifying students’
academic performance”, In: Proc. of 2017 2nd
International conferences on Information
Technology, Information Systems and
Electrical Engineering (ICITISEE), pp. 267–
271, 2017.
[30] K. Deepika and N. Sathyanarayana, “Relief-F
and Budget Tree Random Forest Based Feature
Selection for Student Academic Performance
Prediction”, International Journal of Intelligent
Engineering and Systems, Vol. 12, No. 1, pp.
30–39, 2019.
[31] S. Shankar, B. D. Sarkar, S. Sabitha, and D.
Mehrotra, “Performance analysis of student
learning metric using K-mean clustering
approach K-mean cluster”, In: Proc. of 2016
6th International Conference - Cloud System
and Big Data Engineering (Confluence), pp.
341–345, 2016.
[32] I. N. Sukajaya, I. K. E. Purnama, and M. H.
Purnomo, “Intelligent classification of learner’s
cognitive domain using bayes net, naive bayes,
and j48 utilizing bloom’s taxonomy-based
serious game”, Int. J. Emerg. Technol. Learn.,
Vol. 10, No. 2, pp. 46–52, 2015.
[33] P. H. P. Rosa and R. Gunawan, “The Clustering
of High Schools Based on National and School
Examinations”, In: Proc. of International
Conference on Data and Software Engineering,
pp. 231–236, 2015.
[34] R. Campagni, D. Merlini, R. Sprugnoli, and M.
C. Verri, “Data mining models for student
careers”, Expert Syst. Appl., Vol. 42, No. 13, pp.
5508–5521, 2015.
[35] H. Harwati, A. P. Alfiani, and F. A. Wulandari,
“Mapping Student â€TM s Performance Based
on Data Mining Approach ( A Case Study )”,
Procedia - Social and Behavioral Sciences, Vol.
38, No. 1, pp. 173–177, 2015.
[36] Y. Park, J. H. Yu, and I.-H. Jo, “Clustering
blended learning courses by online behavior
data: A case study in a Korean higher education
institute”, Internet High. Educ., Vol. 29, pp. 1–
11, 2016.
[37] M. A. Hall, “Correlation-based feature
selection for machine learning”, Ph.D. Thesis,
The University of Waikato, 1999.
[38] M. H. Kamarudin, C. Maple, T. Watson, and N.
S. Safa, “A LogitBoost-Based Algorithm for
Detecting Known and Unknown Web Attacks”,
IEEE Access, Vol. 5, pp. 26190–26200, 2017.
[39] R. C. Holte, “Very Simple Classification Rules
Perform Well on Most Commonly Used
Datasets”, Machine Learning, Vol. 11, pp. 63-
90, 1993.
[40] I. H. Witten, E. Frank, and M. a. Hall, Data
Mining: Practical Machine Learning Tools and
Techniques, Third Edition, Vol. 54, No. 2. 2011.
[41] H. Park, S. Lee, M. Lee, M. Chang, and H.
Kwak, “Computers in Human Behavior Using
eye movement data to infer human behavioral
intentions”, Comput. Human Behav., Vol. 63,
pp. 796–804, 2016.