identifying and understanding inequalities in child
TRANSCRIPT

Identifying and Understanding Inequalities in Child Welfare
Intervention Rates: Comparative studies in four UK
countries.
Single country quantitative study report: Wales
Martin Elliott and Jonathan Scourfield
February 2017

This study: Identifying and understanding inequalities in child welfare interventions: comparative studies in four UK countries was
funded by The Nuffield Foundation. For more information please visit www.coventry.ac.uk/cwip.
2
Contents Summary of key findings.................................................................................................... 4
Note to readers .................................................................................................................... 6
1. Introduction ..................................................................................................................... 7
1.1 Research methods ........................................................................................................................ 7
Table 1.1 - Sample as percentage of the population ...................................................................... 8
1.2 Demographic profile of the Welsh child population ..................................................................... 9
Figure 1.2 - Distribution of Welsh child population (0-17 years) by Welsh Index of Multiple
Deprivation (WIMD) decile, Mid-Year population estimate 2014 .................................................. 9
Figure 1.3 - Distribution of the Welsh child population by ethnic group and deprivation quintile
...................................................................................................................................................... 10
Figure 1.4 - Distribution of Welsh child population, by age group and deprivation quintile ....... 11
2. Area-Level Deprivation ................................................................................................. 12
Figure 2.1 – Child protection and looked-after children rates (adjusted) by deprivation decile,
Welsh Index of Multiple Deprivation, 2014 .................................................................................. 12
3. Gender ........................................................................................................................... 14
Figure 3.1 Child protection registration rates (per 10,000) by gender and deprivation decile,
Welsh Index of Multiple Deprivation, 2014 .................................................................................. 14
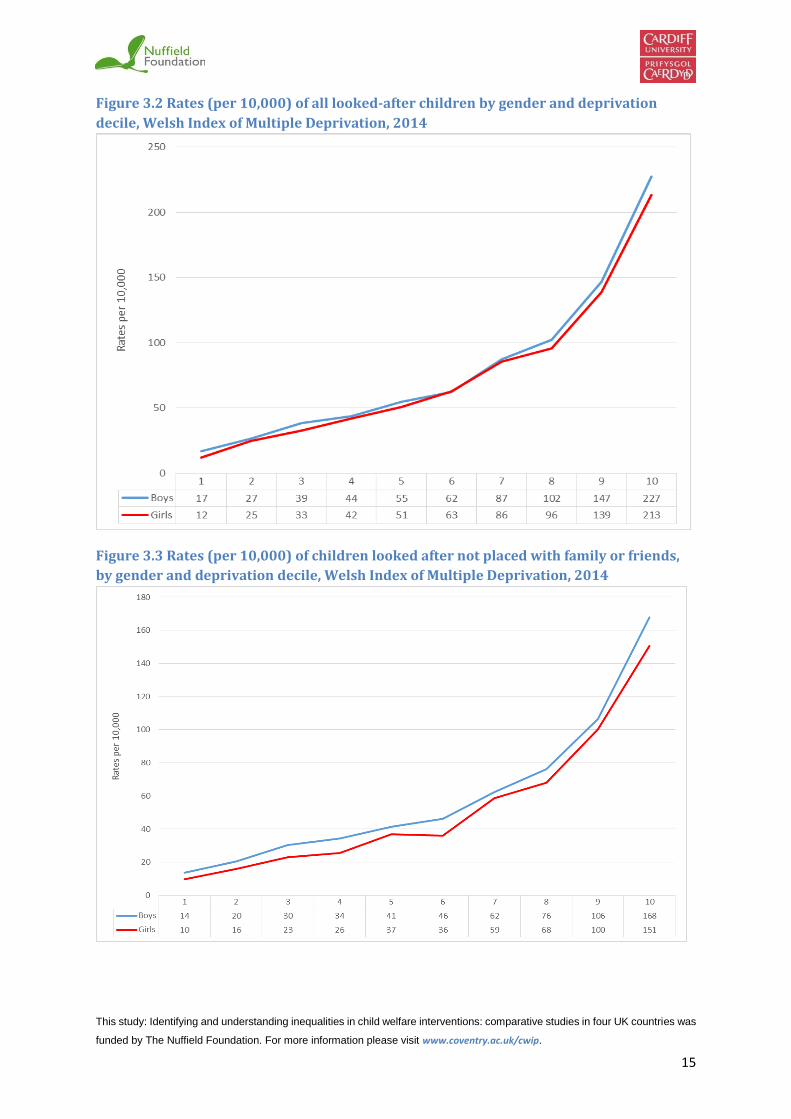
Figure 3.2 Rates (per 10,000) of all looked-after children by gender and deprivation decile,
Welsh Index of Multiple Deprivation, 2014 .................................................................................. 15
Figure 3.3 Rates (per 10,000) of children looked after not placed with family or friends, by
gender and deprivation decile, Welsh Index of Multiple Deprivation, 2014 ................................ 15
4. Age ................................................................................................................................. 16
Figure 4.1 Child protection registrations by age group and deprivation quintile, Welsh Index of
Multiple Deprivation, 2014 ........................................................................................................... 16
Figure 4.2 all children looked after by age group and deprivation quintile, Welsh Index of
Multiple Deprivation, 2014 ........................................................................................................... 17
Figure 4.3 Children looked after not placed with parents, relatives or friends, by age group and
deprivation quintile, Welsh Index of Multiple Deprivation, 2014 ................................................ 18
5. Ethnicity ......................................................................................................................... 19
Table 5.1 Ethnic category by deprivation level for child protection ............................................. 19
Table 5.2 Ethnic category by deprivation level for all children looked after ................................ 19

This study: Identifying and understanding inequalities in child welfare interventions: comparative studies in four UK countries was
funded by The Nuffield Foundation. For more information please visit www.coventry.ac.uk/cwip.
3
6. Reason for being on the child protection register ...................................................... 21
Figure 6.1 Abuse category by deprivation quintile for child protection registration, Welsh Index
of Deprivation, 2014 ..................................................................................................................... 21
7. Legal Status of Children in Care .................................................................................. 23
Figure 7.1 – Legal status for all children looked-after, by deprivation quintile, Welsh Index of
Multiple Deprivation 2014 ............................................................................................................ 23
Figure 7.2 – Legal status for children looked after, excluding those placed with parents, relatives
and friends by deprivation quintile, Welsh Index of Multiple Deprivation, 2014 ........................ 24
8. Inverse Intervention Law .............................................................................................. 25
Figure 8.1 –Child Protection rates in local authorities divided into three deprivation bands (high,
medium, low) by deprivation decile. ............................................................................................ 25
Figure 8.2 – Rates of children looked after in local authorities divided into three deprivation
bands (high, medium, low) by deprivation decile......................................................................... 26
9. Spend ............................................................................................................................. 27
Figure 9.1 Total spend per child on Children’s Services in Wales, by local authority deprivation
level, comparing 2010-11 with 2014-15 ....................................................................................... 27
Figure 9.2 Total spend per child on Children’s Services in England, by local authority deprivation
level, comparing 2010-11 with 2014-15 ....................................................................................... 28
10. Discussion and conclusion ........................................................................................ 29
References ........................................................................................................................ 31

This study: Identifying and understanding inequalities in child welfare interventions: comparative studies in four UK countries was
funded by The Nuffield Foundation. For more information please visit www.coventry.ac.uk/cwip.
4
Summary of key findings
This report is about the connection between social inequality and child welfare interventions.
We analysed routine administrative data from Welsh local authorities on the children on child
protection registers and in care (looked after) on 31 March 2015. These are the key findings:
There is a clear social gradient whereby for every level of deprivation the rates of children
on child protection registers and looked-after by local authorities increase. This gradient is
steeper in Wales than in the other three UK nations.
There is no statistically significant difference between boys and girls in terms of child
protection registration rates at each level of deprivation. Boys are slightly more likely than
girls to be looked after and not placed with family or friends, across all levels of deprivation.
When comparing age groups, we see the opposite pattern for child protection registration
and looked-after children. The youngest age group (0-4) are the biggest proportion on child
protection registers at every level of deprivation and the proportion then decreases with
increasing age. For looked-after children, the age group most strongly represented are 16-
17-year-olds and there is a decreasing proportion with decreasing age.
When differences in child population between ethnic groups are taken into account, for
those children whose ethnicity is recorded, the highest rate of both child protection and
looked-after children is in mixed ethnicity children. Rates of Black and White children are
similar for child protection, but Black rates are higher for looked-after children. Asian
children have clearly the lowest rates for both child protection and looked-after children.
There is no clear social gradient for Black children in care, with a higher rate in the least
deprived 20% of areas than in the least deprived 20%.
When we consider reason for being on the child protection register, there is a clear social
gradient for neglect, physical abuse and emotional abuse. For sexual abuse the pattern is
less straightforward, but there are still far more children registered for this category of
abuse in the most deprived neighbourhoods than in the least deprived neighbourhoods.
The legal status of children in care was considered. There was a clear social gradient for
all the categories of child protection measures, preparation for adoption, voluntary
accommodation and youth justice.
We wanted to establish whether there was any evidence of an inverse intervention law in
Wales, as has been found in England. This is where at any given level of deprivation we
see more intervention in local authorities which are less deprived overall. In Wales there
is no statistical evidence of an inverse intervention effect.

This study: Identifying and understanding inequalities in child welfare interventions: comparative studies in four UK countries was
funded by The Nuffield Foundation. For more information please visit www.coventry.ac.uk/cwip.
5
Although in England we see a clear reduction in spending per child on Children’s Services
between 2010-11 and 2014-15, in Wales there was an increase over this same period. As
expected, local authorities which are more deprived overall spent more on Children’s
Services.

This study: Identifying and understanding inequalities in child welfare interventions: comparative studies in four UK countries was
funded by The Nuffield Foundation. For more information please visit www.coventry.ac.uk/cwip.
6
Note to readers
Although this report is structured in the same way as those we have produced for Northern
Ireland, Scotland and England, most of the data the reports contain cannot be directly
compared, because the bulk of each report is based on the Index of Multiple Deprivation for
the country in question. These Indices are not identical and the distribution of children across
neighbourhoods with different levels of deprivation varies between countries. For example, no
child in Northern Ireland lives in a neighbourhood amongst the least deprived 10% in the UK.
So each report should be viewed for the information it contains about children’s services within
each country not between the countries. One exception in this report is the statement which
compares the social gradient in Wales with other countries. This statement is made on the
basis of a UK-wide Deprivation Index.

This study: Identifying and understanding inequalities in child welfare interventions: comparative studies in four UK countries was
funded by The Nuffield Foundation. For more information please visit www.coventry.ac.uk/cwip.
7
1. Introduction
Children’s services across the UK face crises of demand and confidence. A substantial growth
in the numbers of children ‘looked-after’ in Wales (rising from 4635 in March 2008 to 5615 in
March 2015) has come as austerity policies have posed a serious challenge for local authority
budgets and placed sustained pressure on family finances. Successive scandals affecting
current and historical cases of systemic abuse have added to demands on services. Such
headlines deflect attention from another major issue: very large inequalities in a child’s
chances of being on a child protection plan or being ‘looked after’ in state care between and
within local authorities, between ethnic groups, and across the four UK countries. Child welfare
inequalities occur when children and/or their parents face unequal chances, experiences or
outcomes of involvement with child welfare services that are systematically associated with
structural social dis/advantage and are unjust and avoidable.
The Child Welfare Inequalities Project (CWIP) set out to study the relationship between area-
based inequalities and child welfare intervention rates. By ‘rates’ we mean how many children
are in care or on child protection plans per 10,000 child population. This work has been
undertaken across the four nations of the UK because an initial pilot study (Bywaters, Brady,
Sparks and Bos, 2016) found a strong association between area-based deprivation and child
welfare intervention rates in local authorities in the English Midlands. Those authors noted that
whereas considerable attention has been paid to inequalities in the health and education
fields, in the field of children’s social care, social inequality has become taken for granted.
What follows is a report specifically about Wales, using the Welsh Index of Multiple
Deprivation. The report covers patterns of child welfare intervention by gender, age, ethnicity,
reason for intervention and legal status, all analysed by levels of deprivation. It also includes
consideration of the inverse intervention law identified in the Midlands by Bywaters et al. and
some findings on variation by local authority.
1.1 Research methods
The data used for the study were drawn from two sources, the Children in Need census data
on children on the child protection register and the SSDA903 dataset, which is the annual
return to Government in relation to children and young people looked after by local authorities.
The SSDA903 data were provided by the Data Unit within Welsh Government and the child
protection data were supplied by each of the 22 Welsh local authorities individually. All data

This study: Identifying and understanding inequalities in child welfare interventions: comparative studies in four UK countries was
funded by The Nuffield Foundation. For more information please visit www.coventry.ac.uk/cwip.
8
relate to children that were ‘looked-after’ or on the child protection register on the census date,
31st March 2015.
The data on child protection registrations cover all 22 Welsh local authorities, whilst for
‘looked-after’ children the analysis only used data from 20 local authorities as there was too
much missing postcode data from two local authorities (Ceredigion - 80% missing; Vale of
Glamorgan - 47% missing) for them to be included. As a result, the child protection analyses
include local authorities accounting for all 1909 Lower Super Output Areas (LSOA) in Wales,
whilst the ‘looked-after’ children analyses represents a sample of 1784 LSOA.
As outlined in Table 1.1 below, the sample of children and young people included in the child
protection analysis represented 97% of all children on the child protection register in Wales
on 31st March 2015. The sample of ‘looked-after’ children included in the analysis represent
88% of all children in care in Wales on the census day and 93% of all the cases within the 20
local authorities included in the analysis.
Table 1.1 - Sample as percentage of the population
In this report we present results for two categories of children looked after. Firstly, all children
looked after by the local authority and secondly all children looked after except for those placed
with parents, relatives or friends.
As at 31st March 2015 Population 0-17 yrs.
Child Protection
Looked after children
Wales – Published Data 629609 2936 5615
Sample – Published Data
629609 (CP) 590036 (LAC)
2936 5350
Sample – Cleaned Data 2847 4965
Sample as a % of Wales - Published
100% (CP) 94% (LAC)
100% 95%
Sample as a % of Wales – Cleaned
97% 88%
Cleaned data as a % of published
Adjustment Factor 97% 93%

This study: Identifying and understanding inequalities in child welfare interventions: comparative studies in four UK countries was
funded by The Nuffield Foundation. For more information please visit www.coventry.ac.uk/cwip.
9
1.2 Demographic profile of the Welsh child population
To contextualise our analysis of child welfare interventions by deprivation level, it is important
to consider the demographic break-down for all children living in Wales.
Figure 1.2 - Distribution of Welsh child population (0-17 years) by Welsh Index of
Multiple Deprivation (WIMD) decile, Mid-Year population estimate 2014
Figure 1.2 illustrates the distribution of the child population in Wales (0-17 years) by
deprivation decile of the Welsh Index of Multiple Deprivation (WIMD). It would be reasonable
to assume that 10% of the child population would live in each deprivation decile, however,
Table 1.2 illustrates that this is not the case. The child population in Wales is under-
represented in the least deprived deciles (1 – 6), but are over-represented in the most deprived
deciles. This would fit with the findings of previous research (Townsend, 1979) that has
highlighted that households with children are more likely to be living in poverty or on the edge
of poverty.

This study: Identifying and understanding inequalities in child welfare interventions: comparative studies in four UK countries was
funded by The Nuffield Foundation. For more information please visit www.coventry.ac.uk/cwip.
10
Figure 1.3 - Distribution of the Welsh child population by ethnic group and deprivation
quintile
Figure 1.3 shows the distribution of children and young people within the Welsh child
population based on four broad ethnicity groups. The data are drawn from the 2011 population
Census. The table shows that broadly, White children are relatively evenly distributed
between the five deprivation quintiles in Wales. In contrast, mixed background, Asian and
Black children and young people are disproportionately represented in the 20% most deprived
LSOA in Wales. This is particularly pronounced in relation to Black children, where over half
live in neighbourhoods within the 20% most deprived in Wales

This study: Identifying and understanding inequalities in child welfare interventions: comparative studies in four UK countries was
funded by The Nuffield Foundation. For more information please visit www.coventry.ac.uk/cwip.
11
Figure 1.4 - Distribution of Welsh child population, by age group and deprivation quintile
Figure 1.4 shows the distribution of the child population across deprivation quintiles by age
group. The table shows that whilst in the middle quintiles (quintile 2, 3 and 4) the child
population is broadly equally divided between the age groups, this is not the case in the least
and most deprived quintiles. In the least deprived quintile (quintile 1) there are fewer young
children, whilst in the most deprived quintile the opposite is true. The table shows that a
quarter of young children (0-4 years) are living in neighbourhoods in the 20% most deprived
in Wales

This study: Identifying and understanding inequalities in child welfare interventions: comparative studies in four UK countries was
funded by The Nuffield Foundation. For more information please visit www.coventry.ac.uk/cwip.
12
2. Area-Level Deprivation
Figure 2.1 – Child protection and looked-after children rates (adjusted) by deprivation
decile, Welsh Index of Multiple Deprivation, 2014
Figure 2.1 illustrates the overall rates per 10,000 for both children looked after and those on
the child protection register (as at 31st March 2015) at the deprivation decile level. The graph
clearly shows a ‘social gradient’ in terms of rates. Building on research on the social
determinants of health, this term relates to the observable increase in rates per 10,000 for
each increase in neighbourhood level deprivation. The steepest gradient is that for child
protection registrations, where there is a 24-fold increase in rates between the least deprived
decile (decile 1) and the most deprived (decile 10). The rates for all looked after children are
almost 16 times higher in the most deprived neighbourhoods than in the least deprived. A
similar gradient is observed for all looked after children other than those placed with parents,
relatives or friends. There is a 13-fold increase in the rates of children looked after and living
away from family and friends between the least deprived decile and the most deprived. The
graph clearly illustrates the relationship between living in a poor neighbourhood and the
likelihood of being the subject of local authority intervention, either by being subject to child
protection procedures or becoming looked after.

This study: Identifying and understanding inequalities in child welfare interventions: comparative studies in four UK countries was
funded by The Nuffield Foundation. For more information please visit www.coventry.ac.uk/cwip.
13
Further analysis by the research team of data on all four UK nations, using a comparable
measure of deprivation (Payne and Abel, 2012) shows that for both children looked after and
for child protection, the social gradient in Wales is steepest of all four nations. That is, in Wales
there are proportionally more children on child protection registers or taken into care in more
deprived areas, and fewer in less deprived areas, than in the other nations. These results are
not presented in the current report.
Spearman’s rank correlations were performed to assess the relationship between deprivation
and different child welfare interventions. There is a strong statistically significant positive
correlation between deprivation and child protection registrations [rs=1.0, p=<.001], overall
rates of children looked after [rs= 1.0, p=<.001] and rates of looked after children excluding
those placed with family and friends [rs= 1.0, p=<.001].

This study: Identifying and understanding inequalities in child welfare interventions: comparative studies in four UK countries was
funded by The Nuffield Foundation. For more information please visit www.coventry.ac.uk/cwip.
14
3. Gender
Figures 3.1, 3.2 and 3.3 show the rates per 10,000 by deprivation decile for boys and girls.
For child protection registrations and all looked after children, rates for boys and girls are
broadly similar. Although the rates by gender are also similar for children looked after who
are not living with family and friends (Fig. 3.3), there are slightly more boys at all levels of
deprivation and the difference is statistically significant. There was a significant main effect of
deprivation decile on rates (F(1,16) = 675.49, p < .001), which were slightly higher in boys
than girls (F(1,16) = 10.74, p = .005). The non-significant interaction term (F(1,16) = 2.27, p =
.151) shows that this effect remained consistent across all deciles. The overall rates by gender
in looked after children’s placements, excluding those placed with friends and family are 65
per 10,000 for boys and 57 per 10,000 for boys. The overall rates for child protection
registrations (44 for boys, 46 for girls) and for all looked after children (87 for boys and 83 for
girls) are much closer and vary more between deciles.
Figure 3.1 Child protection registration rates (per 10,000) by gender and deprivation
decile, Welsh Index of Multiple Deprivation, 2014
This study: Identifying and understanding inequalities in child welfare interventions: comparative studies in four UK countries was
funded by The Nuffield Foundation. For more information please visit www.coventry.ac.uk/cwip.
15
Figure 3.2 Rates (per 10,000) of all looked-after children by gender and deprivation
decile, Welsh Index of Multiple Deprivation, 2014
Figure 3.3 Rates (per 10,000) of children looked after not placed with family or friends,
by gender and deprivation decile, Welsh Index of Multiple Deprivation, 2014

This study: Identifying and understanding inequalities in child welfare interventions: comparative studies in four UK countries was
funded by The Nuffield Foundation. For more information please visit www.coventry.ac.uk/cwip.
16
4. Age
The following tables show children on the protection register or looked after on the 31st March
2015 by age group (0-4 years, 5-11 years, 12-15 years and 16-17 years) and deprivation
quintile.
Figure 4.1 Child protection registrations by age group and deprivation quintile, Welsh
Index of Multiple Deprivation, 2014
Figure 4.1 shows the rates for those children on the child protection register on the census
day. The bar chart shows that at all deprivation quintiles the youngest age-group of children,
i.e. those aged from birth to 4 years of age (the analysis does not include pre-birth
registrations), are placed on the child protection register at higher rates than their older peers.
Broadly the chart also shows that as age increases the rates of children being placed on the
child protection register reduces, regardless of the level of neighbourhood deprivation.
Figure 4.2 shows the rates of children looked after by age group. The bar chart shows rates
increasing as age increases across all deprivation levels. This finding would appear to not
reflect the findings of other studies on the age profile of looked-after children e.g. Martin
Elliott’s PhD research on Wales 2008-2014, which show higher rates of younger children,
particularly those under 4 years of age. This would appear to be as a result of the data being

This study: Identifying and understanding inequalities in child welfare interventions: comparative studies in four UK countries was
funded by The Nuffield Foundation. For more information please visit www.coventry.ac.uk/cwip.
17
‘snapshot’ data relating only to the children in care on a particular day, rather than longitudinal
data such as that used in other studies. There are more children aged 0-4 coming into care
than shown in Figure 4.2 but many of these are only looked after for brief periods.
Figure 4.2 all children looked after by age group and deprivation quintile, Welsh Index of
Multiple Deprivation, 2014

This study: Identifying and understanding inequalities in child welfare interventions: comparative studies in four UK countries was
funded by The Nuffield Foundation. For more information please visit www.coventry.ac.uk/cwip.
18
Figure 4.3 Children looked after not placed with parents, relatives or friends, by age
group and deprivation quintile, Welsh Index of Multiple Deprivation, 2014
The age profiles of all children looked after on 31 March and those not placed with family or
friends are similar, with the largest proportion at each level of deprivation being 16-17 year
olds and the proportions by age group rising with increasing age. It is interesting to note the
very different age distributions of child protection registrations and children looked-after.
This study: Identifying and understanding inequalities in child welfare interventions: comparative studies in four UK countries was
funded by The Nuffield Foundation. For more information please visit www.coventry.ac.uk/cwip.
19
5. Ethnicity
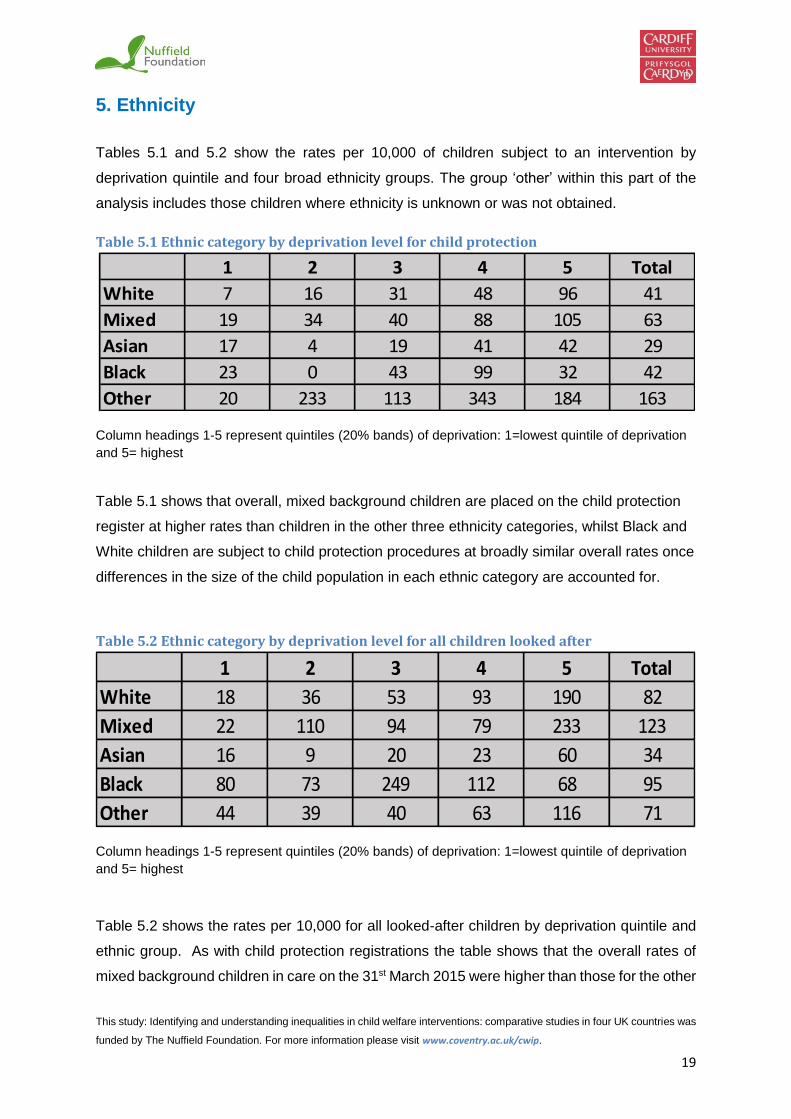
Tables 5.1 and 5.2 show the rates per 10,000 of children subject to an intervention by
deprivation quintile and four broad ethnicity groups. The group ‘other’ within this part of the
analysis includes those children where ethnicity is unknown or was not obtained.
Table 5.1 Ethnic category by deprivation level for child protection
Column headings 1-5 represent quintiles (20% bands) of deprivation: 1=lowest quintile of deprivation
and 5= highest
Table 5.1 shows that overall, mixed background children are placed on the child protection
register at higher rates than children in the other three ethnicity categories, whilst Black and
White children are subject to child protection procedures at broadly similar overall rates once
differences in the size of the child population in each ethnic category are accounted for.
Table 5.2 Ethnic category by deprivation level for all children looked after
Column headings 1-5 represent quintiles (20% bands) of deprivation: 1=lowest quintile of deprivation
and 5= highest
Table 5.2 shows the rates per 10,000 for all looked-after children by deprivation quintile and
ethnic group. As with child protection registrations the table shows that the overall rates of
mixed background children in care on the 31st March 2015 were higher than those for the other
1 2 3 4 5 Total
White 7 16 31 48 96 41
Mixed 19 34 40 88 105 63
Asian 17 4 19 41 42 29
Black 23 0 43 99 32 42
Other 20 233 113 343 184 163
1 2 3 4 5 Total
White 18 36 53 93 190 82
Mixed 22 110 94 79 233 123
Asian 16 9 20 23 60 34
Black 80 73 249 112 68 95
Other 44 39 40 63 116 71

This study: Identifying and understanding inequalities in child welfare interventions: comparative studies in four UK countries was
funded by The Nuffield Foundation. For more information please visit www.coventry.ac.uk/cwip.
20
three ethnic categories. Whilst for child protection registrations the rates for White and Black
children were almost the same (41 and 42 per 10,000 respectively), in terms of being looked
after, Black children are represented at higher rates than White children. It is also interesting
to note that the highest rates of Black children in care are not from the most deprived
neighbourhoods, as suggested by the overall figures illustrated in Figure 2.1, but are instead
from the middle quintile (quintile 3). Black children also enter care at a higher rate from the
least deprived quintile than they did from the most deprived, which is the reverse of all the
other ethnicity categories used. Asian children are consistently less likely to be in care than
children in the other ethnic categories, across all levels of deprivation.

This study: Identifying and understanding inequalities in child welfare interventions: comparative studies in four UK countries was
funded by The Nuffield Foundation. For more information please visit www.coventry.ac.uk/cwip.
21
6. Reason for being on the child protection register
This section of the report will look at the registration category of children on the child protection
register. The analysis focuses of the four main abuse categories: Neglect, Physical Abuse,
Sexual Abuse and Emotional Abuse. Figure 6.1 shows the percentage of children registered
under these four categories broken down by deprivation quintile.
Figure 6.1 Abuse category by deprivation quintile for child protection registration, Welsh
Index of Deprivation, 2014
For the registration categories of Neglect, Physical Abuse and Emotional Abuse a clear ‘social
gradient’ is visible in Figure 6.1. For each quintile increase in deprivation there is a
corresponding increase in the percentage of children being placed on the child protection
register under that category. The one category where the social gradient is less
straightforward is sexual abuse, where there is a higher proportion of cases in quintile 3 than
quintile 4. For sexual abuse, there is nonetheless a striking difference between the percentage
of children being placed on the register in the most and least deprived areas. For children
registered under this category there is a twenty five fold increase between the 20% most
deprived neighbourhoods and the 20% least deprived, the largest variation in any of the abuse

This study: Identifying and understanding inequalities in child welfare interventions: comparative studies in four UK countries was
funded by The Nuffield Foundation. For more information please visit www.coventry.ac.uk/cwip.
22
categories. Whilst those from the most deprived 20% of neighbourhoods (quintile 5) make up
over half of those children registered under the categories of Neglect or Physical Abuse in the
case of Emotional Abuse this is less, with higher percentages in some of the other quintiles
than for other categories of maltreatment.

This study: Identifying and understanding inequalities in child welfare interventions: comparative studies in four UK countries was
funded by The Nuffield Foundation. For more information please visit www.coventry.ac.uk/cwip.
23
7. Legal Status of Children in Care
Figure 7.1 shows the legal basis under which children were in care on the 31st March 2015 by
deprivation quintile. The legal status codes included in the SSDA903 return have been
grouped into four categories. The four groupings used are:
Child protection measures (Interim Care Order, Full Care Order, Police Protection,
Emergency Protection Order, Child Assessment Order)
Adoption (Freeing Order, Placement Order)
Voluntary accommodation
Youth justice (Remanded to the local authority, detained by the local authority under
PACE, CYPA 1969 supervision order).
Due to small numbers, data on youth justice are not included in Figure 7.1 or Figure 7.2.
Figure 7.1 – Legal status for all children looked-after, by deprivation quintile, Welsh Index
of Multiple Deprivation 2014
As highlighted when considering the overall rates, there is an observable ‘social gradient’ in
the rates of children looked after on the basis of all the groups of legal status used. As

This study: Identifying and understanding inequalities in child welfare interventions: comparative studies in four UK countries was
funded by The Nuffield Foundation. For more information please visit www.coventry.ac.uk/cwip.
24
neighbourhood level deprivation increases, so does the percentage of children in care under
each legal category.
Young people who are in care on the basis of involvement with the Youth Justice system are
drawn from the two most deprived quintiles only.
In terms of those whose legal status is that they are on an adoption Placement Order (or in a
small number of historical cases on a Freeing Order) over 60% of these children lived in
neighbourhoods in the 20% most deprived in Wales before entering care
Figure 7.2 – Legal status for children looked after, excluding those placed with parents,
relatives and friends by deprivation quintile, Welsh Index of Multiple Deprivation, 2014
Figure 7.2 shows the percentage of children looked after by legal status and deprivation
quintile for all children looked after excluding those placed with parents, friends or relatives.
The legal status groupings are those used for outlined for Figure 7.1. Comparison of these
two figures suggests that exclusion of these placement types makes no observable difference
to the overall composition of each legal grouping at the quintile level.

This study: Identifying and understanding inequalities in child welfare interventions: comparative studies in four UK countries was
funded by The Nuffield Foundation. For more information please visit www.coventry.ac.uk/cwip.
25
8. Inverse Intervention Law
For these analyses the local authorities included in each sample were divided in to three
comparison groups based on their overall deprivation score. The aim was to replicate the
analysis by Bywaters et al. (2016), which found that although overall local authority rates of
child welfare interventions were correlated with deprivation at an LA level, where LSOAs were
compared between LAs, at each decile of deprivation intervention rates were higher in LAs
that were less deprived after all. They labelled this the ‘inverse intervention law’, echoing
Tudor-Hart’s (1971) inverse care law in health care.
Figure 8.1 –Child Protection rates in local authorities divided into three deprivation
bands (high, medium, low) by deprivation decile.
Figure 8.1 shows a comparison by deprivation decile of the rates per 10,000 within each of
the three comparison groups of local authorities. What the graph shows at the 8th decile is an
example of the Inverse Intervention Law (IIL). Whilst we showed in Section 2 that the largest
proportion of children who experience contact with child protection are drawn from the most
deprived neighbourhoods at this decile, it is the group of local authorities with the lowest levels
of overall deprivation that have intervened at a higher rate. At all other deciles, although there
are some variations in rates in the groups of low and mid-level deprivation authorities, it is
those authorities with the highest levels of deprivation that intervene more.

This study: Identifying and understanding inequalities in child welfare interventions: comparative studies in four UK countries was
funded by The Nuffield Foundation. For more information please visit www.coventry.ac.uk/cwip.
26
In comparison to the child protection rates in Figure 8.1, Figure 8.2 which illustrates the same
analysis for all looked after children, shows a number of examples of the Inverse Intervention
Law at deciles 5, 6, 8 and 10. Decile 10, the 10% most deprived neighbourhoods in Wales
can be used to discuss what the data are showing. Overall, local authorities in the group of
local authorities with the lowest levels of deprivation (Low) would have the fewest of these
neighbourhoods, whilst those with the highest levels of deprivation (High) would have the
most. However, if a rate is calculated only using the child population living in the
neighbourhoods that fall within that decile in each of the comparison groups, it is the less
deprived group of local authorities which intervene at a higher rate. Unlike in Bywaters et al.’s
analysis of English data, however, the pattern is not consistent in Wales and the differences
between the rates for the three comparison groups of LAs at any given level of deprivation are
not statistically significant. We therefore conclude this analysis does not show any evidence
of an overall inverse intervention effect in Wales, for either child protection or children looked
after.
Figure 8.2 – Rates of children looked after in local authorities divided into three
deprivation bands (high, medium, low) by deprivation decile.

This study: Identifying and understanding inequalities in child welfare interventions: comparative studies in four UK countries was
funded by The Nuffield Foundation. For more information please visit www.coventry.ac.uk/cwip.
27
9. Spend
Using publicly-available information from Stats Wales on spending on Children’s Services in
Wales (all Children’s Services), we calculated the difference in spend per head of child
population between the 2010-11 financial year and 2014-15, to assess the difference that
austerity policies may have made. This was done for each of three groups of local authorities,
low deprivation, medium deprivation and high deprivation, based on population-adjusted local
authority level deprivations scores from the Welsh Index of Multiple Deprivation. This
calculation revealed that spending increased with increasing levels of deprivation. This would
be expected, as the Index of Multiple Deprivation informs Welsh Government decisions about
the allocation of budgets to local authorities. The calculation also showed that spending per
head of child population had in fact increased between 2010-11 and 2014-15 (see Figure 9.1),
whereas in England the opposite is true (Figure 9.2). Part of the reason for this is that the child
population in Wales decreased between these two time points whereas it increased in
England. Another reason would be political commitment to maintain spending on social care.
Figure 9.1 Total spend per child on Children’s Services in Wales, by local authority
deprivation level, comparing 2010-11 with 2014-15

This study: Identifying and understanding inequalities in child welfare interventions: comparative studies in four UK countries was
funded by The Nuffield Foundation. For more information please visit www.coventry.ac.uk/cwip.
28
Figure 9.2 Total spend per child on Children’s Services in England, by local authority
deprivation level, comparing 2010-11 with 2014-15
The average percentages of total net revenue spend on Children’s Services that was allocated
to looked after children services was 42.3% in 2010/11 and 44.8% in 2014/15, showing a small
increased percentage, in the context of increasing overall spend.

This study: Identifying and understanding inequalities in child welfare interventions: comparative studies in four UK countries was
funded by The Nuffield Foundation. For more information please visit www.coventry.ac.uk/cwip.
29
10. Discussion and conclusion
Overall, the results show a very strong relationship between rates of child protection / children
in care in Wales and deprivation in local areas. Similar patterns are seen across levels of
deprivation for different age groups, for boys and girls, for legal status and for the reasons
given for child protection registration. There are also inequalities between ethnic groups, with
mixed-race children most likely to come into care and Asian children least likely.
Here are some of the policy and practice implications:
Child welfare inequalities should be a political priority
Although we often hear about the need to tackle inequalities in health and education, and the
Welsh Government is working hard in these areas, child welfare inequalities are rarely
considered. Given the disparity in intervention rates between more deprived and more affluent
areas and the variation by ethnic category, child welfare inequalities need to be a similarly
high priority.
Putting child protection on the child poverty agenda
In policy and practice, child protection and reducing child poverty tend to be separate domains.
There are some understandable reasons for this – it is important to avoid any suggestion that
all children in poor families are at risk of abuse. However, poverty is a crucial part of the context
in which much child abuse and neglect takes place and large-scale prevention of harm to
children is unlikely to be successful without attention to poverty.
Putting poverty on the adverse childhood experiences agenda
Adverse childhood experiences (ACEs) have recently become a policy focus in Wales. This is
to be welcomed, given their strong association with poor health outcomes in adulthood. The
evidence base shows that ACEs have an effect over and above the experience of poverty.
However, the social problems which cause ACEs are heavily concentrated in the most
deprived areas. Poverty therefore needs to be on the ACE agenda in Wales and not separate
from it.
Linking up poverty reduction and social services
It has become rather taken for granted that the work of children’s social services takes place
largely in the poorest communities. The evidence presented in this report tells us that poverty
reduction needs to be at the heart of social work intervention and not at the margins. In many

This study: Identifying and understanding inequalities in child welfare interventions: comparative studies in four UK countries was
funded by The Nuffield Foundation. For more information please visit www.coventry.ac.uk/cwip.
30
families with deep-rooted problems, improving family incomes may not be sufficient to remove
risk to children. However, it should be part of the help provided. Regional partnership boards
need to consider how social services can contribute to poverty reduction.
Better data, more research
We also need better data and more research. We need to know more from routine
administrative data about the circumstances of individual families, including their socio-
economic status. We also need postcode data routinely included in the children in need
census so that researchers can continue to monitor child welfare inequalities at an area level.
Most importantly, we need to know more about outcomes for children following state
interventions and whether putting children in care improves their life chances.

This study: Identifying and understanding inequalities in child welfare interventions: comparative studies in four UK countries was
funded by The Nuffield Foundation. For more information please visit www.coventry.ac.uk/cwip.
31
References
Bywaters, P., Brady, G., Sparks, T., and Bos, E. 2016. Child welfare inequalities: new
evidence, further questions. Child & Family Social Work, 21: 369–380. doi: 10.1111/cfs.12154.
Payne, R.A. and Abel, G.A. 2012. UK indices of multiple deprivation – a way to make
comparisons across constituent countries easier. Health Statistics Quarterly. 53. pp.1-16
Townsend, P. 1979. Poverty in the United Kingdom: A survey of household resources and
standards of living. Berkeley: University of California Press
Tudor Hart, J. 1971. The inverse care law. The Lancet. Saturday 2th February 1971. pp.405 -
412