identifying and overcoming noise in data acquisition
TRANSCRIPT

Identifying and Overcoming Noise in Data Acquisition William Chen Product Manager

2 Copyright © Yokogawa Meters & Instruments Corporation
Kristina Neahr Marketing Specialist Yokogawa Corporation of America Newnan, GA [email protected] 1-800-888-6400 ext. 2611 tmi.yokogawa.com
Host & Panelist

3 Copyright © Yokogawa Meters & Instruments Corporation
PC’s Speakers - Audio Broadcast To hear the audio through your PC, select the Communicate Tab and Join the Audio Broadcast.
Recorded Presentation A recording of this presentation will be posted under our technical library of our web page. Chat: Select and send all questions to “Panelist” during the Webinar presentation.
Yokogawa Webinar – Housekeeping Issues

4 Copyright © Yokogawa Meters & Instruments Corporation
William Chen Product Manager Yokogawa Corporation of America Newnan, GA [email protected] 1-800-888-6400 Ext 2537 tmi.yokogawa.com
Presenter
5 Copyright © Yokogawa Meters & Instruments Corporation
If you have any questions for one of these Webinar Topics, please send them to the below e-mail. I will try to answer them during the Webinar or directly afterwards.
Questions

6 Copyright © Yokogawa Meters & Instruments Corporation
■ Data Acquisition Overview • Applications By Speed and Signal Types
- Low speed monitoring and recording, High speed single shot, Repetitive waveform monitoring, Memory blocks (Sequential store), High Speed continuous monitoring.
■ Quantization noise • Vertical resolution, LSB, Gain
■ Internal A/D noise • What do accuracy specifications mean and how do they reflect the noise
characteristics of the DAQ hardware? ■ Power line noise
• Filtering, Integrating A/D
Overview

7 Copyright © Yokogawa Meters & Instruments Corporation
Overview
■ Time skew • Inter channel skew, and simultaneous sampling
■ Aliasing noise • Nyquist theory, Sampling rate/interval and frequency spectrum, AAF
■ Common mode noise • Ground loops, common mode, isolation
■ Radiated noise (EMI) • Crosstalk, DAQ product shielding, cable shielding
■ Application Example • Fuel Cell Impedance measurements

8 Copyright © Yokogawa Meters & Instruments Corporation
DAQ Applications
DC-1kHz Temperature, pressure, Static load, displacement Production monitoring Power line monitoring
1kHz-100kHz Mechanical Electronics Sound and Vibration Automotive, Aerospace
100kHz-20MHz Electrical performance Digital, timing, pattern I/O Consumer electronics
20MHz-1GHz + Component design RF, Microwave
PC-based Internal (most PC-centric) Pro: low cost, multi-function, bus speed Con: little/no signal conditioning, almost always multiplexed, poor noise immunity Benchtop (least PC-centric, DL850E)
Pro: separate/isolated power, portable, Better quality measuring hardware Con: less channel density, higher cost, large footprint, slower for automation
PC-based External (SL1000, MX100, GM10) Pro: most scalable, better quality measurement HW, fast performance for PC automation, lower cost, high bus speed, high channel density

9 Copyright © Yokogawa Meters & Instruments Corporation
DAQ Signal Types
■ Analog Input • DC/AC Voltages • “Special” sensors
- Accelerometer, ICP Microphone - Strain Gage, Load Cell - RTD, Thermistor, Resistance ■ Analog Output
• DC, Function Generation, Arbitrary, Sweeping
■ Digital Input / Output • TTL/CMOS, Static & Buffered
■ Timing Measurements • Event Counting, Delay, Period,
Frequency, Tachometer, Encoder, Time Stamps

10 Copyright © Yokogawa Meters & Instruments Corporation
Analog Input Applications ■ Low Speed Monitoring and Recording
• Machine monitoring • Process monitoring • Certification testing • Reliability testing
■ High Speed Single Shot • Startup/shutdown monitoring • Electrical response • Device characterization • Sweep testing • Destructive/explosion testing

11 Copyright © Yokogawa Meters & Instruments Corporation
Analog Input Applications
■ Repetitive Waveform Monitoring • Vibration • Test stands/cells • Engine or combustion monitoring • Glitch measurements
■ Memory Blocks (Sequential store) • Low re-arm time • Continuity/glitch testing • Engine R&D

12 Copyright © Yokogawa Meters & Instruments Corporation
Analog Input Applications
■ High Speed Continuous Monitoring • Also called: Free-Run, Streaming to PC, Circular buffered acquisition, FIFO buffer • In-vehicle/flight DAQ, high energy physics, real-time monitoring of multi-hour tests
13 Copyright © Yokogawa Meters & Instruments Corporation
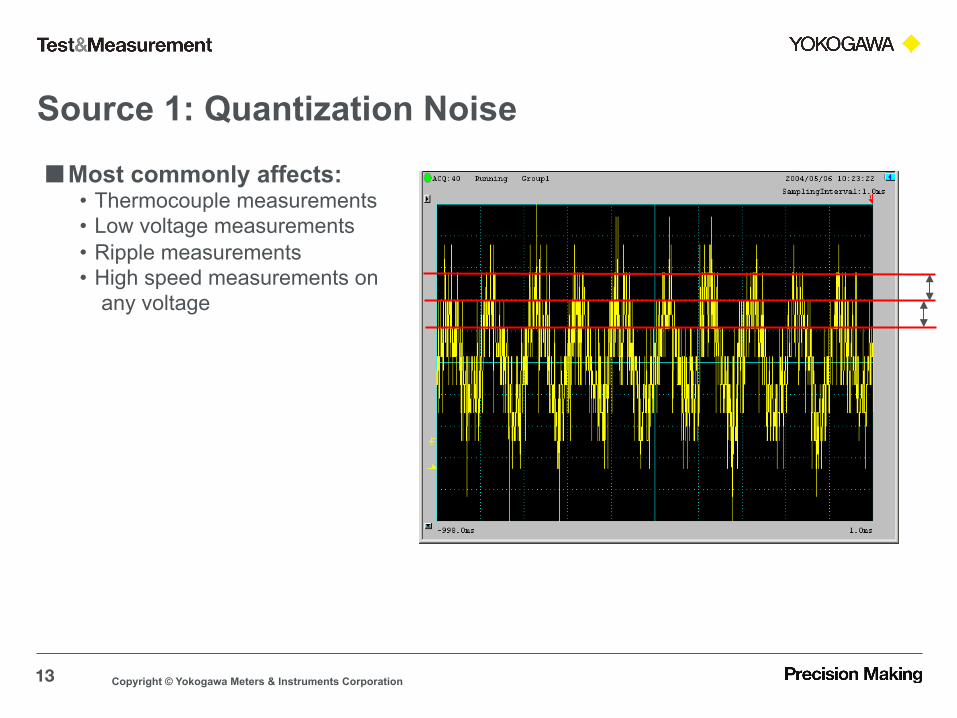
Source 1: Quantization Noise
■ Most commonly affects: • Thermocouple measurements • Low voltage measurements • Ripple measurements • High speed measurements on
any voltage

14 Copyright © Yokogawa Meters & Instruments Corporation
Principle of Quantization Noise
■ Decimal System (Base 10) • Used by humans • Number of Digits • 1 digit = 0-9 [10 counts] • 2 digits = 00-99 [100 counts] • 3 digits = 000-999 [1000 counts] • counts = 10(Number of Digits)
■ Binary System (Base 2) • Used by Analog-Digital converters • Number of Bits • 1 bit = 02-12 [2 counts] • 2 bits = 002-112 [4 counts] • 3 bits = 0002-1112 [8 counts] • counts = 2(Number of Bits)
8 bit A/D = 28 counts = 256 10 bit A/D = 210 counts = 1024 12 bit A/D = 212 counts = 4096 14 bit A/D = 214 counts = 16384 16 bit A/D = 216 counts = 65536
Binary (8 bits)
Decimal (raw)
Voltage (scaled)
00000000 0 -10V
00000001 1 -9.921875
00000010 2 -9.84375
00000011 3 -9.765625
00000100 4 -9.6875
00000101 5 -9.609375
… … …
11111111 255 +10V
15 Copyright © Yokogawa Meters & Instruments Corporation
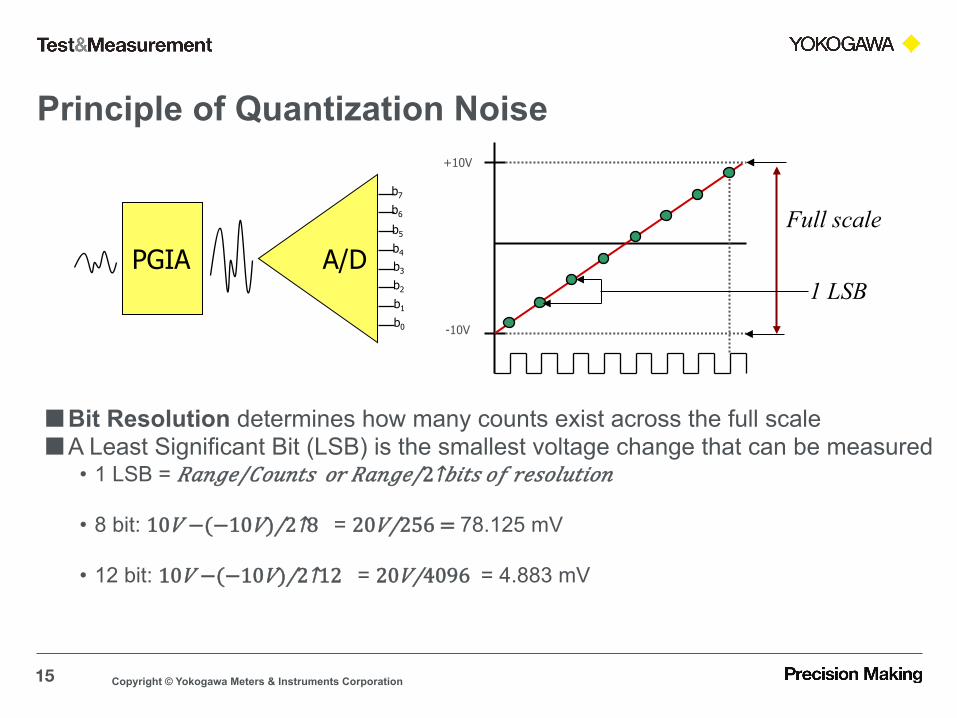
Principle of Quantization Noise
■ Bit Resolution determines how many counts exist across the full scale ■ A Least Significant Bit (LSB) is the smallest voltage change that can be measured
• 1 LSB = 𝑅𝑎𝑛𝑔𝑒/𝐶𝑜𝑢𝑛𝑡𝑠 𝑜𝑟 𝑅𝑎𝑛𝑔𝑒/2↑𝑏𝑖𝑡𝑠 𝑜𝑓 𝑟𝑒𝑠𝑜𝑙𝑢𝑡𝑖𝑜𝑛
• 8 bit: 10𝑉 −(−10𝑉)/2↑8 = 20𝑉/256 = 78.125 mV
• 12 bit: 10𝑉 −(−10𝑉)/2↑12 = 20𝑉/4096 = 4.883 mV
+10V
-10V b0
b1
b2
b3
b4
b5
b6
b7
A/D PGIA
Full scale
1 LSB

16 Copyright © Yokogawa Meters & Instruments Corporation
Quantization Noise Solution
■ Typical result achieved with digital software filter (poor) ■ SW Filter used: Sharp, Lowpass, fcutoff=2%*fsample, 88th order

17 Copyright © Yokogawa Meters & Instruments Corporation
Quantization Noise Solution
■ Hardware solution: Decrease (match) the range, or increase the bit resolution (1 LSB = [range / counts]) ■ Quantization noise exists even if it is not visually present ■ Improving this will improve analysis accuracy

18 Copyright © Yokogawa Meters & Instruments Corporation
AC Coupling
■ AC coupling will dramatically reduce quantization noise when: • You are interested in analyzing the AC content of a waveform • A DC offset is present
Must Use ±2V Range Due to DC Offset
Enable AC/DC Coupling Circuit, allowing use of a lower Range (±50mV)

19 Copyright © Yokogawa Meters & Instruments Corporation
Source 2: A/D Internal Noise
■ Noise described by printed specifications (accuracy) ■ Main factors contributing to internal noise
• Nonlinearity of the A/D converter itself (differential & integral nonlinearity)
• PGIA & A/D block – gain and offset • Thermal effects and thermal stability of the
entire digitizer ■ Accuracy specifications are highly
inconsistent in literature across vendors

20 Copyright © Yokogawa Meters & Instruments Corporation
Source 2: A/D Internal Noise
■ Various methods of reporting A/D internal noise • Accuracy (gain and offset) • Absolute Accuracy • Signal to Noise Ratio (SNR) • Effective Number of Bits (ENOB) • Noise Floor (dB) • Spurious Free Dynamic Range (SFDR)
■ Improving A/D internal noise: • Choose a higher precision digitizer • Maintain a stable environmental temperature • Reduce the Bandwidth used

21 Copyright © Yokogawa Meters & Instruments Corporation
Source 3: Power Line Noise
■ Power Line Noise also called “Pick Up” or “Hum” ■ Can be conducted (through DAQ device or power supply) or radiated
(through EMI), internal or external source ■ Noise frequency always occurs at the power line frequency (50/60/400Hz)
Clean Signal
Signal with power line noise
22 Copyright © Yokogawa Meters & Instruments Corporation
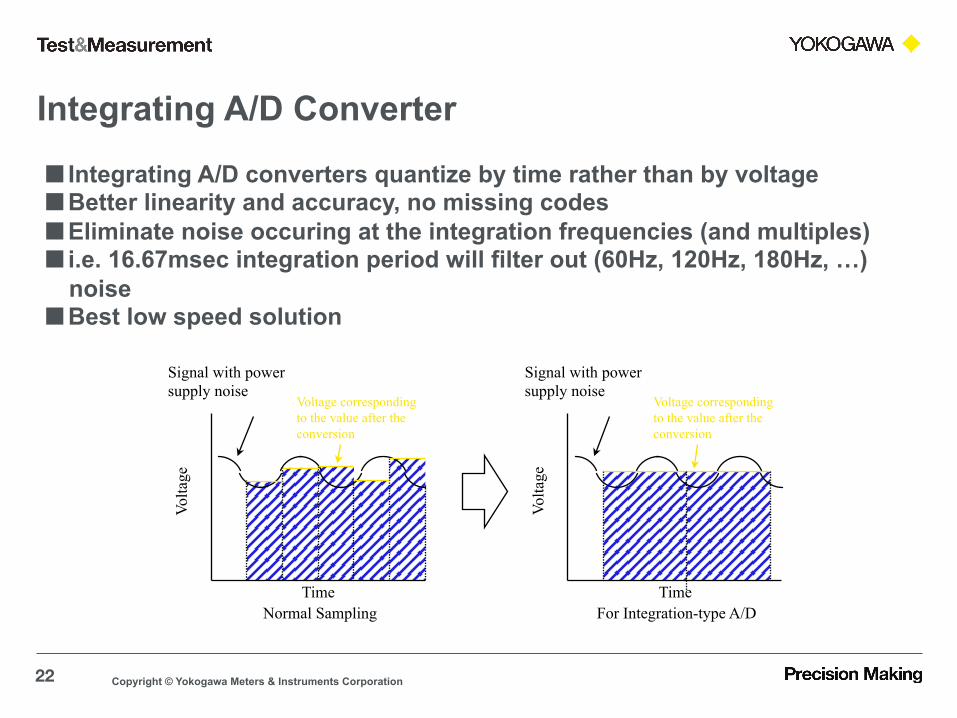
Integrating A/D Converter
■ Integrating A/D converters quantize by time rather than by voltage ■ Better linearity and accuracy, no missing codes ■ Eliminate noise occuring at the integration frequencies (and multiples) ■ i.e. 16.67msec integration period will filter out (60Hz, 120Hz, 180Hz, …)
noise ■ Best low speed solution
Normal Sampling Time
Volta
ge
Signal with power supply noise
Voltage corresponding to the value after the conversion
For Integration-type A/D Time
Volta
ge
Signal with power supply noise
Voltage corresponding to the value after the conversion

23 Copyright © Yokogawa Meters & Instruments Corporation
Other Power Line Noise
■ For Slow speed signals measurements: A “Moving Average” software filter is nearly as effective as an integrating A/D converter ■ Power Line Filters to remove high frequency RF noise from power ■ Isolated Input to Data Acquisition hardware

24 Copyright © Yokogawa Meters & Instruments Corporation
Source 4: Time Skew
■ Many Data Acquisition systems do not measure time aligned data ■ Differential measurements can have time skew between + and – terminals
(pseudo-differential)
Actual Signal Measured Signal

25 Copyright © Yokogawa Meters & Instruments Corporation
Principle of Time Skew
■ Multiplexing Sampling channel clock [inter-channel skew]
scan clock
Ch1 Ch2 Ch3 Ch4 …
■ Simultaneous Sampling
Ch1 Ch2 Ch3 Ch4 …

26 Copyright © Yokogawa Meters & Instruments Corporation
Source 5: Aliasing Noise
■ Aliasing or Fold-Over Distortion ■ Occurs when higher frequency content exists beyond the sampling
bandwidth
27 Copyright © Yokogawa Meters & Instruments Corporation
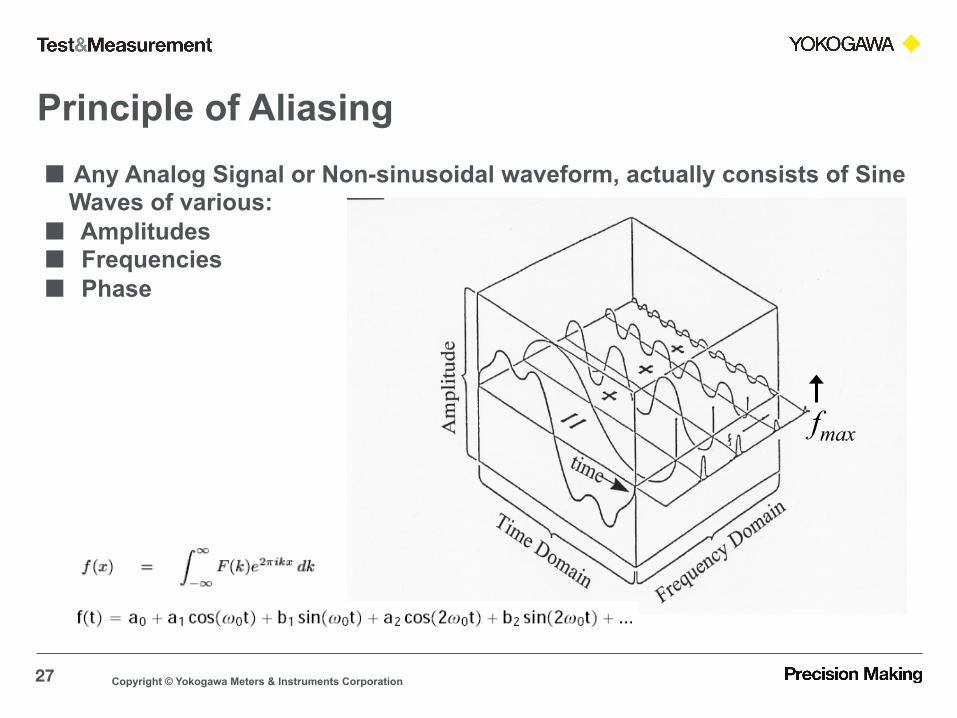
Principle of Aliasing
■ Any Analog Signal or Non-sinusoidal waveform, actually consists of Sine Waves of various: ■ Amplitudes ■ Frequencies ■ Phase
fmax

28 Copyright © Yokogawa Meters & Instruments Corporation
Principle of Aliasing
■ Red trace is actual signal, Green dots are measured values
■ Original waveform with 20 samples per period (fs = 20 f0)
■ Original waveform with 5 samples per period (fs = 5 f0)
■ Original waveform with 2 samples per period (fs = 2 f0)

29 Copyright © Yokogawa Meters & Instruments Corporation
Principle of Aliasing
■ Simple Example • fs = 16 samples/sec
■ Adequately Sampled • f0 = 1 Hz
■ Near “Nyquist frequency” or sampling bandwidth • fN = ½ fs = 8 Hz • f0 = 7 Hz
■ Near “Nyquist frequency” or sampling bandwidth
• fN = ½ fs = 8 Hz • f0 = 7 HzUnder sampled • f0 = 11Hz • In this case we should see a flat line (since
the signal is above our measurement bandwidth)
• The incorrect signal introduces a type of distortion into the measurement.

30 Copyright © Yokogawa Meters & Instruments Corporation
Principle of Aliasing ■ More realistic example ■ Original Signal
• 3 Hz content, 1Vpp • 50 Hz content, 0.2Vpp
■ Aliased noise at 5 Hz
■ Sampled at 55 Hz ■ (fN = ½ fs = 27.5 Hz) ■ 27.5 – [50 - 27.5] = 5

31 Copyright © Yokogawa Meters & Instruments Corporation
Effect of Aliasing
■ Some Signals (i.e. a sawtooth wave) have infinite harmonics
■ If the fundamental frequency of the sawtooth wave is f0, and we sample at 20*f0, what happens?
Result = increased noise floor

32 Copyright © Yokogawa Meters & Instruments Corporation
Aliasing Solution ■ A Hardware filter (low pass) eliminates fold-over distortion ■ Set the filter frequency close to Nyquist frequency (½ fs) ■ The filter must reside in Hardware – Software filters are ineffective ■ Especially important for sound and vibration testing ■ External HW filter is an option, newest technology uses SW-selectable, built into
instrument

33 Copyright © Yokogawa Meters & Instruments Corporation
Reconstructing the Signal ■ In theory, the reconstructed waveform must not possess any frequency
content >= sampling frequency ■ To perfectly reconstruct, bandwidth limit the re-creation/output
• (apply an ideal low pass filter with (cutoff frequency = Nyquist frequency)) ■ You can also use curve fitting to approximately reconstruct the signal
• Linear interpolation, Sinusoidal interpolation, Spline
■ In practice, most engineers do not reconstruct waveforms prior to analysis! ■ Therefore, apply a Practical over-sampling criteria fsample > 4x fmax

34 Copyright © Yokogawa Meters & Instruments Corporation
Source 6: Common Mode Noise
■ Original signal with no common mode
■ Signal with Common mode input to a pseudo-differential device
■ Signal with Common mode measured by isolated digitizer
* Noise depends on CMRR
■ Signal with Common mode noise greater than digitizer specification

35 Copyright © Yokogawa Meters & Instruments Corporation
Principle of Common Mode
■ Voltage difference between sensor “ground” and instrument ground ■ Can cause permanent damage to measurement hardware
5V
0+Vcm
Vcm+5

36 Copyright © Yokogawa Meters & Instruments Corporation
Common Mode Noise ■ Typical causes of common mode voltages include:
• Thermocouple measurements of powered devices • Battery or fuel cell testing • External sensor power supply • “Floating” sensors in noisy EMI environment

37 Copyright © Yokogawa Meters & Instruments Corporation
Common Mode and Normal Mode
Common Mode Noise Noise
Normal/Differential Mode Noise Actual signal and noise

38 Copyright © Yokogawa Meters & Instruments Corporation
Ground Loops
■ Return paths for current referred to as “ground” ■ Occurs when more than one ground connection path exists between
devices
DAQ
DUT or sensor
Ground path through shield or negative terminal of SE measurement
Ground path through building or earth ground

39 Copyright © Yokogawa Meters & Instruments Corporation
Ground Loops
■ Three ways ground loops cause equipment problems • Low currents circulating in the grounds generate voltages that can cause data
errors such as 60 Hz humming or high-frequency oscillations • High-energy transients will clear through circuit ground instead of earth ground
causing inrush or switching currents to damage equipment • Ground loops can cause common-mode noise between phase, neutral and
ground in a power distribution system. Noise injected into the power supplies will pass on to the electronic components.

40 Copyright © Yokogawa Meters & Instruments Corporation
Common Mode Solution
■ Isolation Barriers • Prevents ground loops and negates common mode voltage
■ Safety: keeps high voltage/current away from people and equipment ■ Integrity: rejects unwanted voltages from affecting measurement accuracy

41 Copyright © Yokogawa Meters & Instruments Corporation
Common mode solution
■ Built-in Isolation Systems ■ Four isolation specifications to consider
• [V1] Channel-to-ground isolation • [V2] Module-to-module isolation
(in a modular system) • [V3] Channel-to-channel isolation • [V4] Transient overvoltage protection
(or maximum withstand voltage)

42 Copyright © Yokogawa Meters & Instruments Corporation
Channel to Earth Isolation
[V1] Channel-to-ground isolation ■ Accessible parts of instrument is safe ■ Prevents ground loops and common mode noise
Isolation Barrier
Analog Module A
Analog Module B
Analog Module C
Backplane

43 Copyright © Yokogawa Meters & Instruments Corporation
Module to Module Isolation
■ [V2] Channel-to-Channel isolation ■ Each module is isolated from each other ■ Provides noise immunity and overvoltage
protection

44 Copyright © Yokogawa Meters & Instruments Corporation
Channel to Channel Isolation
[V3] Channel-to-Channel isolation Provides channel to channel protection from: Crosstalk High energy transients

45 Copyright © Yokogawa Meters & Instruments Corporation
Source 7: Radiated noise (EMI) ■ Certain environments are especially prone to noise:
• Industrial or manufacturing facilities • Power engineering labs (supplies, UPS, etc.) • Motor or drive companies • High Energy Physics Laboratories
■ Emission sources • Fluorescent lighting (120 Hz sinusoidal) • Bipolar Power supplies • Internal components of desktop PC • Crosstalk (other sensors, particularly
active sensors) ■ Manifest as Common mode and
Normal mode Voltage

46 Copyright © Yokogawa Meters & Instruments Corporation
Reducing EMI noise effects ■ Faraday Cage principle – Electric field within a closed surface
is zero ■ Shield Cabling
• Use standard shielded cable types (coaxial/BNC, twisted pair) • Use an external cable shield around each sensor-to-digitizer cable • Tie the cable shield to ground on only one side • Consider optical connections when feasible
■ Shield the Digitizer Module (vendor) ■ Shield the Station or Chassis (vendor) ■ Shield the Rack

47 Copyright © Yokogawa Meters & Instruments Corporation
Reducing EMI noise effects ■ More about Cabling ■ Avoid ribbon cables and unshielded terminal blocks at all
costs ■ Plug-in boards use high density connector, require terminal
block or external screw terminal ■ Many digitizer instruments have direct connections (clamp
terminals, NDIS, BNC) ■ Use true differential hardware with isolation to reject EMI
radiated as common mode voltage ■ For low speed/industrial applications, use current to transmit
signals (4-20mA)

48 Copyright © Yokogawa Meters & Instruments Corporation
Elements of a Noise Minimizing Digitizer ■ High Resolution A/D Converter (quantization noise) ■ Isolation barrier (common mode noise) ■ Low pass or AA filter (power line, aliasing noise) ■ Programmable gain (quantization noise) ■ BNC input (radiated noise) ■ Simultaneous sampling, independent channel hardware (time skew) ■ Attenuation ■ Mechanically shielded and enclosed hardware (EMI) ■ Acquisition Memory

49 Copyright © Yokogawa Meters & Instruments Corporation
Application Example: Fuel Cell Impedance Testing
When a cell is used for a long time, its impedance will increase. This causes a degradation or inefficiency.
By measuring the fuel cell impedance, we can verify the electrical nature of the internal configuration of the fuel cell.
Current Density (Output current from Cell)
Conductor Resistance of electrode
Reaction Resistance at Anode side
Reaction Resistance at Cathode side
Electrolyte Resistance
Out
put V
olta
ge fr
om C
ell
1.03V (Theoretical)
Anode side Cathode side Reaction Resistance
Electric Bilayer Capacitance
Solution Resistance
Fuel Cell Equivalent Circuit

50 Copyright © Yokogawa Meters & Instruments Corporation
Application Example: Fuel Cell Impedance Testing
■ Key requirements: • Isolated output • Isolated input • High resolution, 16 bit • AC/DC coupling • Programmable gain • Hardware Filtering • Simultaneous Sampling
Hydrogen flow
Hydrogen outlet
Air(Oxygen) flow
Water and air outlet
Electric Load DC component
Electric Load AC component
DC Voltage(cell voltage) AC Voltage(ripple)
(optional) switch box
Measured load current

51 Copyright © Yokogawa Meters & Instruments Corporation
Isolated DAQ Instruments
Copyright © Yokogawa Electric Corporation
ScopeCorder DL850E Series 1000 Vrms isolation 100 MS/s high-speed sampling 12-bit A/D resolution Complete built-in isolation system

52 Copyright © Yokogawa Meters & Instruments Corporation
Isolated DAQ Instruments
Copyright © Yokogawa Electric Corporation

53 Copyright © Yokogawa Meters & Instruments Corporation
High-Speed PC Based SL1000 Series 12 types of input modules for
measuring: Voltage Strain Temperature Acceleration Frequency
1000 Vrms isolation 100 MS/s high-speed sampling
Isolated DAQ Instruments
Copyright © Yokogawa Electric Corporation

54 Copyright © Yokogawa Meters & Instruments Corporation
Summary – What We Hope We Did ■ Data Acquisition Overview
• Applications By Speed and Signal Types - Low speed monitoring and recording, High speed single shot, Repetitive waveform monitoring,
Memory blocks (Sequential store), High Speed continuous monitoring. ■ Quantization noise • Vertical resolution, LSB, Gain ■ Internal A/D noise • What do accuracy specifications mean and how do they reflect the noise
characteristics of the DAQ hardware? ■ Power line noise • Filtering, Integrating A/D ■ Time skew • Inter channel skew, and simultaneous sampling ■ Aliasing noise • Nyquist theory, Sampling rate/interval and frequency spectrum, AAF ■ Common mode noise • Ground loops, common mode, isolation ■ Radiated noise (EMI) • Crosstalk, DAQ product shielding, cable shielding ■ Application Example • Fuel Cell Impedance measurements

55 Copyright © Yokogawa Meters & Instruments Corporation
Questions?
Copyright © Yokogawa Electric Corporation

56 Copyright © Yokogawa Meters & Instruments Corporation
Thank You for Attending
Copyright © Yokogawa Electric Corporation