identification of the size and location of … · artificial intelligence frequency analysis, mode...
TRANSCRIPT

IDENTIFICATION OF THE SIZE AND LOCATION OF A CRACK, USING STATICAL DEFORMATIONS OF A
MARINE ROTOR SHAFT WITH A PROPELLER AT THE OVERHANGING END
Ridwan Hossain Graduate Student
Memorial University of Newfoundland
E-mail: [email protected]
1
Ridwan B. HOSSAIN, Rangaswamy SESHADRI & Arisi S.J. SWAMIDAS

Contents • Crack in Marine Propeller Shaft
• Current crack detection methods
• Proposal made in this paper
• Description of the Analysis
• Advantages (What’s New?)
• Limitations & Further Extension
2

Marine Propeller
3
Propeller
Intermediate
Support
Fixed
Support
Courtesy: www.lytewatermarine.com

Cracks in marine propeller shaft
• Mainly caused due to the
alternating stress.
• Can be caused anywhere
along the shaft
• Catastrophic failure can
occur if not detected.

Crack Detection Method
Crack Detection Method
Dynamic Method
Static Method
Artificial Intelligence
Frequency Analysis,
Mode Shapes
Frequency Response Function
Displacement, Strain
measurement
Neural Network, Genetic
Algorithm

Static Analysis
• Easy to execute.
• Provides specific set of useful data.
• Requires less theoretical underpinning
• Requires less probes and sensors than dynamic
analysis

Current Statical Methods
• Static Response due to the reduction of flexural
stiffness (Buda and Caddemi, 2007 )
• Fredholm Integral in terms of bending moment (Di Paola and Bilello, 2004 )
• Induced Damage principle (Caddemi and Morassi, 2007 )
• Using static deflection profile as input signal of
wavelet analysis (Umesha et al, 2009)

Proposal of this paper
• Using a strain-displacement combination to identify damage.
• Strain & Displacements have been identified by FEM for a number of damaged models
• Based on the responses a general crack detection method has been proposed

Propeller
Fig: Propeller used in
the analysis
Fig: Preparing the CAD model from point
cloud
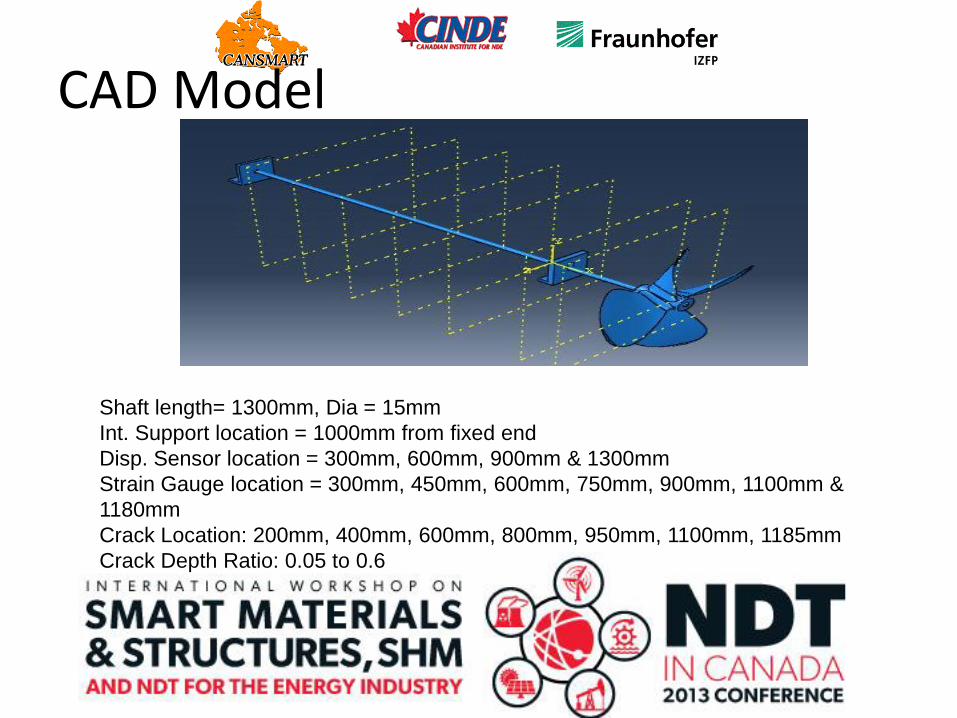
CAD Model
Shaft length= 1300mm, Dia = 15mm
Int. Support location = 1000mm from fixed end
Disp. Sensor location = 300mm, 600mm, 900mm & 1300mm
Strain Gauge location = 300mm, 450mm, 600mm, 750mm, 900mm, 1100mm &
1180mm
Crack Location: 200mm, 400mm, 600mm, 800mm, 950mm, 1100mm, 1185mm
Crack Depth Ratio: 0.05 to 0.6

Meshed Model
Element Type = Quadratic Tetrahedral elements (C3D10)
Shape Function = Quadratic
Family = 3D Stress
No. Of Elements = 31000 (approx.)

Defining Crack
• Crack was defined as ‘seam’ crack.
• Allows separation after load applied
• Physical properties changes based on depth & Location

Results
0 0.1 0.2 0.3 0.4 0.5 0.6 0.70
2
4
6
8
10
12
14
16
18
Crack Depth Ratio, a/h
Perc
enta
ge o
f D
iffe
rence
Figure: Percentage change in displacement against crack depth ratio for displacement
sensor located at 1300mm from the fixed end
Displacement
change is about
18% for 0.6 crack
depth ratio, which
is much higher
than frequency
change (6%)
[Tlaisi et al (2012)]

Results (contd.) (a), (b), (c)
represents
displacement
sensors
located in
300mm,
600mm and
900mm from
fixed end
respectively.

Results (Contd.)
Figure 7: Percentage of Difference in strain vs. the crack depth ratio for
strain gauges located at (a) 300mm; (b) 450mm

Results (Contd.)
0 0.1 0.2 0.3 0.4 0.5 0.6 0.70
50
100
150
200
250
300
350
400
Crack Depth ratio, a/h
Perc
enta
ge o
f D
iffe
rence
0 0.1 0.2 0.3 0.4 0.5 0.6 0.7 0.8 0.9 1-8
-6
-4
-2
0
2
4x 10
-5
Pri
ncip
le S
train
, E
11
Normalized Beam length
Figure: Percentage of Difference in Strain
against crack depth ratio for strain gauge
located at 1100mm
Figure: Variation of principle strain along the
length of the beam for uncracked condition

Crack Detection Method
0 0.1 0.2 0.3 0.4 0.5 0.6 0.70
2
4
6
8
10
12
14
16
18
Crack depth Ratio, a/h
Perc
enta
ge o
f change in d
eflection
0 0.1 0.2 0.3 0.4 0.5 0.6 0.70
5
10
15
20
25
30
35
40
Crack Depth ratio, a/h
Perc
enta
ge o
f C
hange in S
train
Figure: Curve fitted data for
displacement measured at 1300mm
Figure: Curve fitted data for strain
measured at 300mm

Crack Detection Method (contd.)
Figure: Fitted Displacement Data Figure: Fitted Strain Data

Crack Detection Method (contd.)
Figure: Input values for displacement Figure: Output values for displacement

Crack Detection Method (contd.)
Figure: Input values for strain Figure: Output values for strain

Crack Detection Method (contd.)
Figure: Intersection of both outputs give the crack location and depth
200 300 400 500 600 700 800 900 1000 1100 1200
0.2
0.25
0.3
0.35
0.4
0.45
0.5
Crack Location, L
Cra
ck D
epth
Ratio,
a/h
Displacement
Strain

Advantages
• Strain provides much higher response (37.5%) than displacement (17.5%)
• Micro level strain measurement is possible
• Combination of strain-displacement measurement can detect crack along the whole beam
• Only two sensors are needed to detect the crack location and size

Limitation & Further Extensions
• Measurement of displacement still poses the problem
• Detailed modelling might affect the result (bearing, contact behaviour)
• Torsional effect was not included and it might have some effect on the results
• Multiple cracks have not been included.

Thank You!!
Questions?