identification of factors for selecting modes and …
TRANSCRIPT

FINAL REPORT
US. Department of Transportation Research and Special Programs Administration John A. Volpe National Transportation Systems Center
IDENTIFICATION OF FACTORS FOR SELECTING MODES AND ROUTES
FOR SHIPPING HIGH-LEVEL RADIOACTIVE WASTE AND SPENT
NUCLEAR FUEL
April 1998
Prepared By
Environmental Engineering Division John A. Volpe National Transportation Systems Center
Research and Special Programs Administration U.S. Department of Transportation
Cambridge, Massachusetts ,,*
Prepared For
OfJice of Hazardous Materials Safety Research and Special Programs Administration
U.S. Department of Transportation Washington, DC

PREFACE
This report was prepared in response to the requirements of Section 15 of the Hazardous Materials Transportation Uniform Safety Act of 1990 (HMTUSA) (49 U. S . C. 85 lO5(d) (1994)). The report identifies and evaluates the primary factors that should be considered by shippers and carriers in selecting the modes and routes for the transport of high-level radioactive waste and spent nuclear fuel in order to enhance overall public safety.
The report was prepared by the U.S. Department of Transportation (DOT), Research and Special Programs Administration (RSPA), Volpe National Transportation Systems Center (Volpe Center). The report drew upon work performed under contract by the Battelle Cambridge Office, Cambridge, MA; Abkowitz and Associates, Inc., Nashville, TN; and Technology and Management Systems, Inc., Burlington, MA.
This report was prepared for the Office of Hazardous Materials Safety, RSPA, DOT.
iii

Page intentionally left blank.

EXECUTIVE SUMMARY
Section 15 of the Hazardous Materials Transportation Uniform Safety Act of 1990 (see 49 U.S.C. Section 5 lO5(d)(l994)) requires the U.S. Department of Transportation (DOT) to conduct a study:
"To decide which safety factors, if any, shippers and carriers should consider when selecting routes and modes that would enhance overall public safety related to the transportation of high-level radioactive waste and spent nuclear fuel."
The Act also requires that DOT evaluate the degree to which each factor affects overall public safety in the transport of these materials. This report documents the results of the study.
APPROACH. To identify and evaluate the safety factors requiring consideration, the study examined the risks associated with: 1) incident-flee radiological exposure--the exposure to low levels of radiation that normally occur as a result of the transport of radioactive materials, 2) accident-related radiological exposure--the radiation exposure attributable to accidents that result in releases of radioactive materials, and 3) non-radiological consequences of accidents-- the fatalities, property damage, and other non-radiological consequences that result from accidents involving the transport of nuclear materials.
Two distinct methodologies were used to identify the mode and route factors: (1) hierarchical analysis and (2) mathematical modeling of risk. The hierarchical analysis, drawing upon expertise of a 14-member technical advisory group, identified primary mode and route factors by first developing and ranking a comprehensive set of 82 safety factors. These factors were then screened to yield a set of eight primary factors. The mathematical modeling of risk allowed the identification of primary factors by establishing the relationships that affect nuclear transportation risk. The primary factors dominating the risk models were a subset of the primary mode/route selection factors found by the hierarchical analysis. A case study analysis was used to evaluate the variability of the primary mode and route factors identified by these two methodologies.
The final set of eight primary safety factors were general population exposed, occupational population exposed, sensitive environment exposed, trip length, shipment duration, accident rate, emergency response, and quantity of material shipped. These primary factors were evaluated for five transportation options: 1) truck transport, 2) regular freight trains, 3) dedicated trains, 4) water transport, and 5) water-rail intermodal movements. The study considered the risk to the general public near loading and unloading facilities and along transportation routes, and to transportation personnel who handle radioactive materials or operate the equipment used to transport the materials.
KEY FINDINGS. Radiation Risk Is Low. In the case study analysis, risks were estimated for 65 modelroute combinations between 8 generic originldestination pairs. For each of the 65 trips, the projected amount of radiation risk, both to workers and the general public, was very low. In terms of non-incident radiation, risk for a complete trip ranged from about 0.04

millirems to 172 millirems for any one individual crew member, the population category generally at highest risk. These exposure levels are well below current regulatory limits for occupational exposure of 5,000 millirems for an individual in any twelve month period, as well as below the guideline currently recommended by the International Atomic Energy Agency (IAEA) of 2,000 millirems in any twelve month period. Non-incident radiation risks to the general public were similarly low, with amounts for the 65 case study trips ranging from 2 to 218 millirems for total public exposure. On average, no single individual received more than a fraction of a millirem on any given trip, and those levels are well within the presently contemplated Federal guidance of 100 millirems per year for any one member of the general public.
In terms of accident-related radiation, the total per-trip risks ranged from less than 0.1 % to 35 % as large as non-incident radiation exposure levels, due to the extremely low probability of a release. Within this range, the average accident-related radiation level for the 65 trips was only 3 % as large as the non-incident radiation.
Most Primary Safety Factor Values Vary Si@icantly. For most of the primary safety factors, including general and occupational population exposure, accident rates and shipment duration, the values varied considerably among the available mode and route options. For other primary factors, the values varied much less from option to option or could not be explicitly quantified. The sizeable variation in most primary safety factor values, however, indicates that shippers and carriers can affect shipment risks through selection of mode and route.
Shipment Duration Is The Most Significant Safety Factor. Among all the safety factors, the most important in determining the risk for a given shipment option was shipment duration. The total time it takes to move a shipment from origin to destination affects non-incident radiation exposure levels, and the group most affected by this safety factor is transport personnel.
Amount to Be Shipped May Affect Mode Choice, Number of Trips, and Total Risk. The much larger capacity of casks that can be carried by rail and barge and the potential for multi- cask shipments in a single railroad or barge movement mean that a shipment campaign by rail or barge will typically require fewer trips than the same campaign by truck. While multiple trips by motor vehicle may in some instances result in lower risk than a rail movement, fewer trips usually reduce total risk by reducing the risks associated with incident-free radiation, accident-related radiation, and non-radiation accident consequences.

OVERVIEW
As directed by Congress in Section 15 of the Hazardous Materials Transportation Uniform Safety Act of 1990 (HMTUSA) (now codified as 49 U.S.C. §5105(d)), the U.S. Department of Transportation (DOT) has conducted a study of mode and route selection factors for shipments of high-level radioactive waste and spent nuclear fuel.
HMTUSA required DOT "To decide which safety factors, if any, shippers and carriers should consider when selecting routes and modes that would enhance overall public safety related to the transportation of high-level radioactive waste and spent fuel." Furthermore, the Act required that the study assess the degree to which each factor affects the overall public safety of this transportation.
This report documents the results of that study.
SCOPE, FOCUS, AND APPROACH
Scope. The scope of the study was established by defining "public safety" to encompass the risk associated with
Incident-free radiological exposure--Exposure of the general population and transportation workers that occurs as a normal result of the transportation of radioactive materials.
Accident-induced radiological exposure--Exposure of the general population and transportation workers that occurs as a result of an accidental release of radioactive material. A vehicle, rail car, or vessel accident would be the presumed cause, but a handling incident is also possible.
Non-radiological conseauences of accidents--Accident-related consequences (e.g., injuries, deaths, property damage, etc.) that are not attributable to exposure to radiation.
These three categories of risk were considered in the study for the purpose of identifying and evaluating mode and route selection factors. All affected populations, including people near the route and transportation and related workers, were considered. [Section 1.31
Focus. The focus of the Mode and Route study was on safety and on the selection factors that should be considered by shippers and carriers. Economic considerations were not explicitly considered in the analysis, nor were factors that were more appropriately the purview of state and local governments. [Section 1.11
Approach. The mode and route selection factors that would enhance overall public safety of the transport of spent nuclear fuel were identified by (1) defining the problem (see Chapter I), (2) examining current mode/route selection practices relative to the transport of all
vii

commodities and of hazardous materials, including spent nuclear fuel (see Chapter 2), (3) developing a comprehensive list of candidate factors (see Chapter 3), (4) determining primary factors via hierarchical analysis of the candidate factors (see Chapter 4), (5) using risk modeling as an alternative method for identifying the primary factors (see Chapter 3, and (6) using case study analysis to extend the risk modeling effort in order to evaluate the relationships between primary factors and public safety (see Chapter 6) . An overall assessment of the identified primary mode and route selection factors concludes the analysis (see Chapter 7). [Section 1.21
= SUMMARY OF FINDINGS
Assessment of the primary factors concluded that the most significant findings of the study were
The values for most primary factors vary considerably across the mode and route options available to shippers and carriers. [Section 7.11
Incident-free radiological risk is expected to be much more important than accident related risks. [Section 7.1)
The amount of spent nuclear fuel to be shipped can affect the number of trips and thereby impact the total risk. [Section 7.1)
Additional findings included
Mode and route selection factors are not generally separable. With very few exceptions-- amount of material to be shipped being the most notable--they must be considered together. [Section 7.11
Trip duration is the major factor affecting incident-free radiological risk. [Section 7.11
The ability to measure and the ease of gathering the necessary data for most of the eight primary factors are very good. [Sections 7.2 and 7.3; also, see Section 4.3)
= CURRENT PRACTICES
To provide necessary information and perspective on the transport of spent nuclear fuel, the study examined (1) the current and expected future levels of spent nuclear fuel transported and (2) current industry practices for selecting modes and routes. [Chapters 1 and 21
Spent Nuclear Fuel Transported. Currently, relatively few shipments of spent nuclear fuel are moved annually in the U.S. Some shipments are intra-utility transfers from one generating plant to another, while other movements are to away-from-reactor storage facilities. On average, approximately 100 shipments of various sizes were made per year between 1979 and 1995, inclusive. Federal efforts to establish storage facilities for spent nuclear fuel should
viii

eventually increase the number of shipments several fold, with the annual number of spent fuel shipments increasing to over 400 per year. [Section 1.41
Current Industry Practices. Because many overlaps exist, practices relating to general commodities and to hazardous materials (including spent nuclear fuel) were both considered. [Chapter 21
For general commodities and most hazardous materials, mode choice decisions are usually made by the shipper. These decisions tend to focus on price and on service attributes, such as convenience and availability. Once mode choice has been made, the choice of routes is limited to those that are available to that mode, and the selection is generally made by the carrier to coincide with the routes it most heavily travels. Except where precluded by law or regulation, the carriers make their routing decisions on the basis of operational efficiency. [Sections 2.1, 2.2, and 2.31
For the transport of spent nuclear fuel, safety is an extremely important consideration. Accordingly, the transportation casks used for the movement of commercial spent nuclear fuel are, by law, designed to the most stringent packaging standards in transport use today. The cask design helps reduce much of the risk associated with the transport of the material. To further reduce risks and ensure safety, mode and route choice is made as a group decision involving, shippers, carriers, and government officials.
= IDENTIFICATION OF MODE AND ROUTE SELECTION FACTORS
A comprehensive list of mode and route selection factors was compiled through literature research, review of existing laws and regulations, and from the judgements of a Technical Advisory Group (TAG). This TAG was composed of representatives from carriers, shippers, government organizations, and public interest groups. [Section 3.11
The literature consulted in compiling the comprehensive list of factors included routing guideline documents developed previously by DOT for use by state and local governments, the Canadian route screening guidelines for dangerous goods by truck [Section 3.21, as well as a wide variety of modal studies, routing studies/evaluations, risk assessments, environmental assessments, and general hazardous materials transportation studies. [Section 3.4 and Appendix C] The laws consulted in the search for mode and route selection factors included Sections 4 and 15 of HMTUSA. [Section 3.31
A comprehensive list of 82 candidate mode and route selection factors was compiled. These factors, which were considered to be directly or indirectly related to transportation safety, fell into eight general categories: (1) Population and Environment, (2) Transportation Infrastructure and Utilization, (3) Operating Procedures, (4) Emergency Response, (5) Quality Control, (6) WeatherIClimate TerrainIConditions, (7) Shipment Characteristics, and (8) Regulation and Other Restrictions. [Section 3.5 and Exhibit 61

= QUALITATIVE EVALUATION OF FACTORS
The 82 candidate mode and route selection factors were screened and evaluated to identify those factors that are the primary determinants of transport risks. [Chapter 41
Initial screenings of the candidate factors were performed by the project team and by the TAG convened for this study. These screenings included consideration of (1) the candidates' relationship to the project's definition of public safety, (2) their impact on mode or route choice, (3) their interdependencies, and (4) their ability to be measured and applied. During the screenings, it was noted that three candidate factors were exclusively related to mode: (1) mode accessibility, (2) cask availability, and (3) amount of material to be shipped. All of the rest were related to mode and route in combination. There were no factors that were exclusively related to route. [Section 4.11
After the initial screenings were completed, a hierarchical analysis was performed in which the candidate factors were characterized and ranked, and those factors subsumed by others were identified.
In performing the hierarchical analysis, primary factors were identified separately for (1) incident-free radiological exposure, (2) accident-induced radiological exposure, and (3) non- radiological impact. These were then combined to create the full set of primary factors [Section 4.21, which, along with illustrative units of measure, is presented in the following table.
Primary Mode and/or Route Selection Factors
Prirnarv Factor Illustrative Unit of Measure
General population exposed Occupational population exposed Sensitive environment exposed Shipment duration Accident rate Trip length Emergency response Amount of material to be shipped
Nearby persons per unit area Number of crew, others Number of sensitive areas, etc. Overall time including stops Accidentslunit distance Distance T i e or distance to qualified responders Cask shipments required
Further review of these primary factors found that the ability to measure most of them is good. Widely accepted analytical measures for sensitive environment exposed and emergency response do not currently exist, making these factors somewhat more difficult to use in a quantitative risk assessment than the other factors. [Section 4.31

= MODELING THE RISK
In addition to hierarchical analysis, a risk modeling approach was developed to independently identify primary mode and route factors. Three mode-specific risk models were derived: (1) an incident-free radiological risk model, (2) an accident-induced radiological risk model, and (3) a non-radiological risk model. Because of the way these models were specified, the set of possible independent variables that could be used in the models did not include some of the primary factors found by the hierarchical analysis. [Sections 5.1, 5.2, and 5.31
The results of the risk modeling exercise corresponded quite well with the results of the hierarchical analysis. The risk models identified (1) general population, (2) occupational population, (3) accident rate, (4) trip length (distance travelled), and (5) shipment duration as primary risk factors, all of which were identified by the hierarchical analysis. [Section 5.31
= CASE STUDY ANALYSIS
A case study exercise was conducted to examine the risks of transporting radioactive material between representative originldestination (OID) pairs by various modes over realistic routes. This exercise explored the variability of the identified primary selection factors and of the risks across modes and routes. If factor values and risks vary substantially, then that is an indication that risks can indeed be moderated through the choice of mode andlor route. [Chapter 61
The case study considered transport between eight generic OID pairs. The modes of transportation considered were highway, rail (using both regular and dedicated trains), water, and intermodal (waterlrail). In all, risks were estimated for 65 modelroute combinations between the OID pairs, using primary factors to characterize the safety of these transport alternatives. The modelroute combinations included short, medium, and long distance shipments. The shorter distance shipments were included to represent intra- and inter-utility shipments, while the longer distance shipments were included to represent movements to interim or long-term storage facilities. HazTransl, a routing and risk management computer program, was used to derive the primary factor values and non-radiological risks for the case study exercise. The Radtran 4 model2, a computer program that evaluates the radiological consequences of incident-free transportation and the radiological risks caused by vehicular accidents occurring during transportation, was used to calculate the radiological risks based on HazTrans inputs. [Section 6.11
Case study estimates for all three elements of risk (incident-free radiological risk, accident- induced radiological risk, and non-radiological risk) were found to vary substantially across modes, routes, and OIDs, indicating that the selection of mode and route can moderate risk. [Section 6.21
'HazTrans is a registered trademark of Abkowitz & Associates, Inc., Nashville, Tennessee.
'Radtran 4 was developed by Sandia National Laboratory for the U.S. Department of Energy.

The case study inputs and outputs were used to estimate values for the coefficients for the risk models developed for this study. [Section 6.31 A sensitivity analysis was conducted to determine the influence of each of the primary factors on radiological risks for each mode. Trip duration--the total time that a shipment took from start to finish--was found to have the largest effect on incident-free radiological risk. Accident rate, trip length, and general population exposure (number of people exposed) were the dominant factors when considering accident-induced radiological risk for highway and rail. [Section 6.41
The case study estimates of risks per shipment were adjusted for modal cask capacity in order to examine the influence that the amount of material to be shipped can have on transport choices for a shippin? campaign, that is, for multiple shipments from one site. It was found that the total amount of material to be shipped in a campaign was a primary determinant of the mode with the lowest risk. This is because with a shipping campaign, using larger raillbarge casks, if practicable, rather than truck casks, can reduce the number of shipments that must be made, and, consequently, lower the overall risk of the transport. [Section 6.61
xii

TABLE OF CONTENTS
Section
Preface . . . . . . . . . . . . . . . . . . . . . . . . . . . . . . . . . . . . . . . . . . . . . . . . . .
Executive Summary . . . . . . . . . . . . . . . . . . . . . . . . . . . . . . . . . . . . . . . . . I . . . . . . . . . . . . . . . . . . . . . . . . . . . . . . . . . . . . . . . . . . . . . . . . Overview
, List of Exhibits . . . . . . . . . . . . . . . . . . . . . . . . . . . . . . . . . . . . . . . . . . . .
Acronyms . . . . . . . . . . . . . . . . . . . . . . . . . . . . . . . . . . . . . . . . . . . . . . .
I 1 . Introduction . . . . . . . . . . . . . . . . . . . . . . . . . . . . . . . . . . . . . . . . . . .
1.1 Purpose and Role of This Study . . . . . . . . . . . . . . . . . . . . . . . . . 1.2 Study Approach . . . . . . . . . . . . . . . . . . . . . . . . . . . . . . . . . . . . 1.3 Definition of Overall Public Safety . . . . . . . . . . . . . . . . . . . . . . . 1.4 Spent Nuclear Fuel Transport . . . . . . . . . . . . . . . . . . . . . . . . . . .
I . I 2 Overview of Mode and Route Selection Practices . . . . . . . . . . . . . . . . . . .
~ 2.1 General Mode and Route Selection Practices for All Commodities . . .
2.1.1 General Mode Selection Practices . . . . . . . . . . . . . . . . . 2; 1.2 General Route Selection Practices . . . . . . . . . . . . . . . . .
1 2.2 Overview of Mode and Route Selection for Hazardous Materials . . . .
vii
xvii
xix
2.2.1 Mode Selection for Hazardous Materials . . . . . . . . . . . . . 2-5 2.2.2 Route Selection for Hazardous Materials . . . . . . . . . . . . . 2-5
2.3 Overview of Regulations Affecting Mode and Route Selection . . . . . . 2-7
2.3.1 Regulation of Mode and Route Selection for Non-Hazardous Materials . . . . . . . . . . . . . . . . . . . . . . . 2-7
2.3.2 Regulation of Mode and Route Selection for Hazardous Materials . . . . . . . . . . . . . . . . . . . . . . . . . . 2-8
3 . Identification of Candidate Mode and Route Factors . . . . . . . . . . . . . . . . . 3-1
3.1 Enumeration of Factors . . . . . . . . . . . . . . . . . . . . . . . . . . . . . . . 3-1 3.2 Guidelines for Routing Hazardous Materials . . . . . . . . . . . . . . . . . 3-1
xiii

TABLE OF CONTENTS (CONTINUED)
Section
3.2.1 DOT Hazardous Materials Routing Guidelines . . . . . . . . . 3.2.2 DOT Routing Guidelines for Highway Route Controlled
. . . . . . . . . . Quantity Shipments of Radioactive Materials 3.2.3 Canadian Route Screening Guidelines for
. . . . . . . . . . . . . . . . . . . . . Dangerous Goods by Truck
3.3 Candidate Mode and Route Factors Identified in HMTUSA . . . . . . . . 3.4 Candidate Mode and Route Factors Identified in the Literature . . . . . . 3.5 Comprehensive List of Candidate Factors . . . . . . . . . . . . . . . . . . .
4 . Qualitative Evaluation of Candidate Factors and Selection of Primary Mode and Route Factors . . . . . . . . . . . . . . . . . . . . . . . . . . . . . . . . . .
4.1 Screening of Comprehensive List of Factors . . . . . . . . . . . . . . . . .
4.1.1 Technical Advisory Group . . . . . . . . . . . . . . . . . . . . . . 4.1.2 TAG Meeting and Review of Factors . . . . . . . . . . . . . . . 4.1.3 Distinction Between Mode and Route Factors . . . . . . . . . .
4.2 Development of Factor Hierarchy . . . . . . . . . . . . . . . . . . . . . . . .
4.2.1 Hierarchical Approach to Mode and Route Factors . . . . . . 4.2.2 Hierarchy for Incident-Free Radiological Exposure . . . . . . 4.2.3 Hierarchy for Accident-Induced Radiological Exposure . . . 4.2.4 Hierarchy for Non-Radiological Impact . . . . . . . . . . . . . .
4.3 Identification of Primary Factors . . . . . . . . . . . . . . . . . . . . . . . . . 4.4 Representative Units of Measure for the Primary Factors . . . . . . . . .
5 . Identification of Primary Mode and Route Factors by Modeling Risk of Transporting Radioactive Materials . . . . . . . . . . . . . . . . . . . . . .
5.1 Elements of Risk . . . . . . . . . . . . . . . . . . . . . . . . . . . . . . . . . . . 5.2 Model Development . . . . . . . . . . . . . . . . . . . . . . . . . . . . . . . . .
5.2.1 Incident-Free Radiological Risk Model . . . . . . . . . . . . . . 5.2.2 Accident-Induced Radiological Risk Model . . . . . . . . . . . 5.2.3 Non-Radiological Risk Model . . . . . . . . . . . . . . . . . . . .
5.3 Relationship of Risk Modeling to ModeIRoute Factors . . . . . . . . . . .
Page
3-2
3-3
3-5
3-6 3-7 3-9
4-1
4-1
4-1 4-2 4-4
4-5
4-5 4-6 4-8 4-10
4-11 4-13
5-1
5-1 5-1
5-2 5-5 5-6
5-6
xiv

TABLE OF CONTENTS (CONTINUED)
Section
6 . Case Study and Analysis of Factors . . . . . . . . . . . . . . . . . . . . . . . . . . .
6.1 Development of Analysis Framework . . . . . . . . . . . . . . . . . . . . . .
6.1.1 Selection of Sample Routes . . . . . . . . . . . . . . . . . . . . . 6.1.2 Data Collection . . . . . . . . . . . . . . . . . . . . . . . . . . . . . 6.1.3 Development of Primary Factor Values . . . . . . . . . . . . . . 6.1.4 Development of Risk Values Using Radtran 4 . . . . . . . . .
6.2 Case Study Results . . . . . . . . . . . . . . . . . . . . . . . . . . . . . . . . . .
6.2.1 Estimates of Non-Radiological Risk . . . . . . . . . . . . . . . . 6.2.2 Estimates of Radiological Risk . . . . . . . . . . . . . . . . . . .
6.3 Variability of Primary ModeIRoute Factors and Risk Values . . . . . . . . . . . . . . . . . . . . . . . . . . . . . . . . . . . .
6.3.1 Variation in Primary Factor Values . . . . . . . . . . . . . . . . 6.3.2 Variation in Risk Values . . . . . . . . . . . . . . . . . . . . . . .
6.4 Radiological Risk Model Estimation . . . . . . . . . . . . . . . . . . . . . . . 6.5 Sensitivity Analysis . . . . . . . . . . . . . . . . . . . . . . . . . . . . . . . . . 6.6 Emergency Response . . . . . . . . . . . . . . . . . . . . . . . . . . . . . . . . 6.7 Shipping Campaigns . . . . . . . . . . . . . . . . . . . . . . . . . . . . . . . . . 6.8 Case Study Analysis Summary . . . . . . . . . . . . . . . . . . . . . . . . . .
6.8.1 Ease of Developing Primary Factor and Risk Values . . . . . 6.8.2 Variations in Primary Factor Values and Risk Estimates . . . 6.8.3 Interaction of Primary Factors and Risks . . . . . . . . . . . . .
7 . Overall Assessment of Primary ModeIRoute Selection Factors . . . . . . . . . .
7.1 Summary of Identification and Selection of Primary ModeIRoute Factors . . . . . . . . . . . . . . . . . . . . . . . . . . .
7.2 Evaluation of Primary ModeIRoute Factors . . . . . . . . . . . . . . . . . .
7.2.1 General Population Exposed . . . . . . . . . . . . . . . . . . . . . 7.2.2 Occupational Population Exposed . . . . . . . . . . . . . . . . . 7.2.3 Shipment Duration . . . . . . . . . . . . . . . . . . . . . . . . . . . 7.2.4 Accident Rate . . . . . . . . . . . . . . . . . . . . . . . . . . . . . . 7.2.5 Trip Length . . . . . . . . . . . . . . . . . . . . . . . . . . . . . . .

Section
TABLE OF CONTENTS (CONTINUED)
Page
7.2.6 Environment . . . . . . . . . . . . . . . . . . . . . . . . . . . . . . . 7-9 7.2.7 Emergency Response . . . . . . . . . . . . . . . . . . . . . . . . . 7-10 7.2.8 Amount of Material . . . . . . . . . . . . . . . . . . . . . . . . . . 7-12
7.3 Summary Assessment of Primary ModeIRoute Factors . . . . . . . . . . . 7-12
8 . References . . . . . . . . . . . . . . . . . . . . . . . . . . . . . . . . . . . . . . . . . . . 8-1
Appendix A . Definitions . . . . . . . . . . . . . . . . . . . . . . . . . . . . . . . . . . . . . A- 1
Appendix B . Invitees to and Attendees at ModeIRoute Technical Advisory Group Meeting . . . . . . . . . . . . . . . . . . . . . B- 1
Appendix C . Bibliography . . . . . . . . . . . . . . . . . . . . . . . . . . . . . . . . . . . . C- 1
Appendix D . HazTrans Model Description . . . . . . . . . . . . . . . . . . . . . . . . . . D-1
Appendix E . Radtran 4 Model Description . . . . . . . . . . . . . . . . . . . . . . . . . . E- 1
Appendix F . Derivation of Transport Radiation Risk Models . . . . . . . . . . . . . . F- 1
Appendix G . Development of Case Study Input and Output . . . . . . . . . . . . . . . G- 1
Appendix H . Model Estimation Using Case Study Analysis Results . . . . . . . . . . H- 1
Appendix I . DOT Response to Comments on the December 1993 Draft Report . . I- 1
xvi

LIST OF EXHIBITS
Exhibit
Overall Approach to Mode and Route Study . . . . . . . . . . . . . . . . . . . . . Factors in Routing Guidelines Developed for Use by State and Local Governments . . . . . . . . . . . . . . . . . . . . . . . . . . . . . . . . . . Potential Mode and Route Selection Factors Identified in HMTUSA . . . . . List of Factors Identified During Literature Review That Have Been Evaluated or Proposed as Key Issues for Mode and/or Route Selection . . . . Comprehensive List of Candidate Factors . . . . . . . . . . . . . . . . . . . . . . Factor Hierarchy for Incident-Free Radiological Exposure . . . . . . . . . . . . Factor Hierarchy for Radiological Accident Exposure . . . . . . . . . . . . . . Factor Hierarchy for Non-Radiological Impact . . . . . . . . . . . . . . . . . . . Recommended Primary Mode and Route Factors . . . . . . . . . . . . . . . . . . Representative Units of Measure for Primary Mode and Route Factors . . . . Relationship of Risk Modeling to Primary ModeIRoute Factors . . . . . . . . Summary of Routes Used for Case Study . . . . . . . . . . . . . . . . . . . . . . . Estimated Number of Fatalities (Per Single Cask Shipment) . . . . . . . . . . . Range of Estimated Component and Overall Radiological Risks (Per Single Cask Shipment) . . . . . . . . . . . . . . . . . . . . . . . . . . . . . . . Variation of Primary Factor Values by O/D . . . . . . . . . . . . . . . . . . . . . Variation of Incident-Free Risk Values (Person-Rems) by OID . . . . . . . . . Variation of Accident-Induced Radiological Risk Values (Person-Rems) by OID Variation of Non-Radiological Accident Risk Values (Fatalities) by O/D . . Sensitivity Analysis . . . . . . . . . . . . . . . . . . . . . . . . . . . . . . . . . . . . Relative Modal Risk for a Single Cask Movement vs . a Shipping Campaign Overall Assessment of Primary Factors . . . . . . . . . . . . . . . . . . . . . . . .
xvii

Page Intentionally left blank.
xviii

ACRONYMS
AAR AASHTO AEC ALARA CFR CHP DOD DOE DOT EPA ER ERDA FHWA FR FRA GIs Hazmat HLW HMTA HMTUSA HRCQ IAEA ICC INEL LLW MRS NRC O/D PIH PWR RAM ROW RSPA
SNF SNL TAG TMI TRIS UP USCG VNTSC
Association of American Railroads American Association of State Highway and Transportation Officials Atomic Energy Commission As low as reasonably achievable Code of Federal Regulations California Highway Patrol U. S . Department of Defense U.S. Department of Energy U .S . Department of Transportation U. S . Environmental Protection Agency Emergency response Energy Research and Development Administration Federal Highway Administration Federal Register Federal Railroad Administration Geographic information system Hazardous materials High-level waste Hazardous Materials Transportation Act Hazardous Materials Transportation Uniform Safety Act Highway route controlled quantity International Atomic Energy Agency Interstate Commerce Commission Idaho National Engineering Laboratory Low-level waste Monitored Retrievable Storage Nuclear Regulatory Commission Origiddestination Poisonous by inhalation Pressurized Water Reactor Radioactive material Right-of-way Research and Special Programs Administration, U.S. Department of Transportation Spent nuclear fuel Sandia National Lab Technical Advisory Group Three Mile Island Transportation Research Information Service Union Pacific Railroad U.S. Coast Guard Volpe National Transportation Systems Center (Volpe Center)
xix

Page intentionally left blank.

1. INTRODUCTION
Section 15 of the Hazardous Materials Transportation Uniform Safety Act of 1990 (HMTUSA) (49 U.S.C. 85 lO5(b) (1994)) directs the U.S. Department of Transportation (DOT) to conduct a study to identify and evaluate factors that should be considered in selecting the modes and routes for transporting high-level radioactive waste and spent nuclear fuel. This report describes the approach and findings of study activities performed in response to this requirement.
1.1 PURPOSE AND ROLE OF THIS STUDY
This study is intended to meet the requirements of Section 15 of HMTUSA as it relates to shipments of high-level radioactive waste and spent nuclear fuel. The two principal require- ments of this section are (1) to determine which factors, if any, should be taken into consid- eration by shippers and carriers in selecting routes and modes that, in combination, would enhance overall public safety and (2) to assess the degree to which the various factors affect the overall public safety of such shipments.
Several points concerning the direction given by Section 15 of HMTUSA are worth noting:
The emphasis is on identifiing factors related to public safety. This study, therefore, does not provide a mode or route selection methodology, nor is it a set of selection guidelines. The study focuses on identifying mode and route factors and evaluating their relationship to overall public safety. As such, it may serve as a precursor to developing selection strategies.
Economic considerations are excluded from the process of identifying and evaluating fact- ors. The benchmark to be used is "overall public safety. "
Selection factors to be identified in this study are those that should be considered by shippers and carriers. There may be other factors, principally those that affect public perceptions of safety and related concerns, that are more appropriately the purview of state and local governments and interest groups.
This study has an important, albeit limited, role in the overall process of choosing modes and routes for shipping high-level radioactive materials. It provides guidance to shippers and carriers regarding what they should consider when sorting through the options available to them. It does not require that certain factors be considered; however, a duly promulgated regulation would be necessary to establish such requirements. This study does not address the need for such regulation nor make any recommendation in that regard. Also, the selection factors that shippers and carriers should consider are only a part of the overall decision- making process. It is presumed that these parties would make an initial assessment to identify the better mode and route options among the array available, typically using data that is, of

necessity, more generic than detailed in nature. Then, shippers and carriers would consult with state and local governments and interest groups to ensure that the ultimate choice reflects also the detailed knowledge and particular concerns of the affected parties.
1.2 STUDY APPROACH
The sequence of activities undertaken to complete this study (i.e., the approach) is illustrated in Exhibit 1; the organization of this report follows those same steps.
Define Public Safety (Chapter 1). The first step was to define "overall public safety" for the purposes of this study. This step was considered crucial because the definition would serve as the basis for the remainder of the study and subsequently guide the evaluation process.
Review Mode and Route Selection Practices (Chapter 2). The second step was to provide background for the general topic of mode and route selection in transportation. Industry practice with regard to mode and route selection for general commodities, as well as for hazardous and nuclear materials, was reviewed.
Identify Candidate Mode and Route Factors (Chapter 3). The next step was to develop a comprehensive list of candidate mode and route selection factors. A list was created using the four major sources that were reviewed: existing regulations and routing guidelines, legislation (primarily HMTUSA), relevant transportation and nuclear literature, and suggestions from an expert group assembled for this study. The only criterion used to create the list was that an intuitive relationship should exist between each factor and public safety.
Conduct Qualitative Evaluation of Candidate Factors and Select Primary Factors (Chap- ter 4). Each factor from the comprehensive list was systematically evaluated on the basis of its impact on public safety. A hierarchical framework was used to develop interrelationships among the many candidate factors and to identify a set of primary factors that arguably affects the modelroute choice in the most direct way.
Identify Mode and Route Factors by Modeling the Risk of Transporting Radioactive Materials (Chapter 5). Models representing the three components of transportation risk were developed from the fundamental relationships between the key factors that affect the component risks. These factors were then compared to the factors selected from the qualitative analysis.
Develop Case Study and Perform Analysis of Primary Factors (Chapter 6). For the primary factors that were readily quantifiable and for which data were readily available, a case study was developed and implemented using existing routing and risk assessment models. Values for these primary factors were derived for representative origin and destination (OID) pairs and the variability of the selected factors was measured as modes and routes changed. In addition, the relative impact of these factors on public safety was evaluated.

Exhibit 1. Overall Approach to Mode and Route Study
Section 15 HMTUSA:
I ldentify factors for mode and route selection to enhance overall public safety Assess degree to which factors affect overall public safety
I
Define "overall public safety"
I Review industry mode and route selection practices I
ldentify all candidate mode and route factors Criteria:
Affects overall public safety Affects mode or route decision
Sources: Regulations/guidelines LegislationlHMTUSA factors Prior studies and analyses Expert group
-
Screen and select primary mode and route factors Screen candidate Develop factor hierarchy Select primary factors
I Develop risk models for transporting radioactive materials Develop models for incident-free risk, radiological I accident risk, and non-radiological accident risk Analyze relationship of each primary factor with each risk component
Develop case study and perform statistical analysis of primary mode and route factors
Case Study: Select representative originsldestinations ldentify candidate modes and routes Quantify risk for each option and compare
Analysis: Measure variability among factors Evaluate impact of each factor on risk by estimating coefficient of risk models using case study results
V Perform overall qualitative assessment of primary mode and route factors
Criteria: Degree of impact on overall public safety Variability from mode to mode and route to route Ability to measure Feasibility of implementation

Conduct Overall Assessment of Primary Mode and Route Factors (Chapter 7). An overall assessment of each primary factor was conducted using the results of the qualitative evaluation as well as the results of the risk modeling and case study analysis. The criteria were (1) degree of impact on public safety, (2) variability from mode to mode and route to route, (3) ability to measure, and (4) feasibility of implementation.
1.3 DEFINITION OF OVERALL PUBLIC SAFETY
The definition of overall public safety was the benchmark used for this study. Overall public safety is a difficult concept to define because of the many different aspects of safety that can be considered in this context. In absolute terms, overall public safety can be viewed as freedom from danger, injury, or damage. Complete freedom from harm is impossible to achieve and, because the mandate of this study is to identify factors that enhance overall public safety, an appropriate working definition had to be placed in a comparative context. With this in mind, the enhancement of overall public safety was defined as:
Minimizing exposure of the public and the environment to spent nuclear fuel and high-level radioactive waste during transportation. This includes minimizing incident-free radiological exposure of both the public and transportation workers and minimizing the potential exposure caused by a radiological release into the environment as a result of an incident during transportation.
Minimizing the impact of accidents during transportation when no radiological release occurs (non-radiological efects) .
Based on this definition, three categories of impact on public safety were considered for the purpose of identifying and evaluating mode and route factors:
1. Incident-free radiological exposure (exposure of both the general public and transportation workers that results from normal transportation of radioactive materials);
2. Potential accident-induced radiological exposure (exposure of people and the environment that results from factors affecting both the likelihood and consequence of an accident); the effect of emergency response in minimizing the impact of such potential exposure is expli- citly included as a factor that affects the consequences of an accident;
3. Potential non-radiological impacts on public safety (effects of accidents that include traffic fatalities and injuries unrelated to the nature of the cargo).
Incident-free radiological exposure occurs every time radioactive materials are transported. This exposure is generally very small because of regulations that limit the maximum amount of radiation that can be measured outside the shipping container. The related risk is associated with long-term health effects, usually expressed in terms of latent cancer fatalities.

Accident-induced radiological exposure is a probabilistic event and is considered a rare occurrence. Such exposure results from an incident during transportation that causes a release of radioactive material. If such a release occurred, the resulting consequences could be greater than those for incident-free exposure, but would still result in health and environmental effects that might require some time to fully manifest themselves.
Non-radiological impacts are expected to occur much more frequently than radiological exposure. The most acute health effects of non-radiological impacts occur at or very near the time of an accident. The health effects of non-radiological impacts include injuries or fatalities.
1.4 SPENT NUCLEAR FUEL TRANSPORT
Spent nuclear fuel has been transported in the U.S. for over 40 years. Currently, the number of spent nuclear fuel shipments averages around 100 per year from all sources, including utilities; academic institutions; industrial facilities; foreign imports, exports, and material in transit; and military sources. Some of these shipments are intra-utility transfers; other shipments are to away-from-reactor facilities.
To move spent nuclear fuel, either highway or rail transport is used. Currently, the majority of spent nuclear fuel shipments move by highway. Between 1979 and 1995, 89 percent of the shipments under the regulatory purview of the U.S. Nuclear Regulatory Commission (NRC) moved by highway, while only 11 percent moved by rail. The majority of the tonnage of spent nuclear fuel that is transported, however, moves by rail. Between 1979 and 1995, over 73 percent of the tonnage of spent fuel shipped under the purview of the NRC moved by rail, while less than 27 percent moved by truck. For the shipments under the purview of the NRC, the average size of a highway shipment between 1979 and 1995 was about 300 kilograms of spent fuel. The average size of a rail shipment was about 7100 kilograms of spent fuel. '
Once away-from-reactor facilities for the interim or permanent storage of spent nuclear fuel become available, the number of spent nuclear fuel shipments is expected to increase. It is estimated by DOT that there could be over 400 spent nuclear fuel shipments per year, on average, from all sources. The quantity of spent nuclear fuel moved will probably exceed 3000 metric tons per year.
'See U.S. Nuclear Regulatory Commission, Public Information Circular for Shipments of Irradiated Reactor Fuel, NUREG-0725, Rev. 11, Washington, DC, July 1996.

Page intentionally left blank.
2. OVERVIEW OF MODE AND ROUTE SELECTION PRACTICES
Shippers and carriers have been selecting modes and routes for general commodities for many years. Their choices are made for a variety of reasons, some of which have changed significantly over the last decade in response to deregulation of transportation modes and general economic conditions.
Shippers also have been making mode and route choices for spent nuclear fuel and other high- level radioactive waste for several decades. Influences on these choices include regulatory requirements and traditional industry practices. The factors that have been considered or pro- posed in making mode and route choices for both general commodities and hazardous mate- rials (of which radioactive material, or RAM, is a subset) are identified in this chapter.
2.1 GENERAL MODE AND ROUTE SELECTION PRACTICES FOR ALL COMMODITIES
Modal choice and route selection are often directly related. A change of mode will require a change in route (because modes generally do not share rights-of-way), and conversely, a change in route may require a change in mode. At the same time, some origins or destinations are not served by certain modes. This obviously limits modal choice and routing options.
With regard to transportation in general, modal choices have historically been made by shippers (the companies sending the products), and routing choices have been made by carriers (the companies moving the products), but this distinction has begun to blur. In the past, reg- ulation kept carriers from providing services in more than one mode. In recent years, deregulation of the transportation industry has allowed carriers to expand into other modes or to develop cooperative arrangements with carriers in other modes. Presumably, carriers are more able to influence-although still not decide-which mode will be used. At the same time, shippers' concerns about service attributes and liability have caused them to seek partici- pation in certain carrier internal activities, such as routing decisions. Additionally, shippers who have a vested interest in a particular mode-perhaps because they own a short railroad, a fleet of trucks, or a fleet of barges-will often choose to use that mode without regard for optimizing modal choice over the short run. Finally, since railroads operate over route structures that they own and control, and some shippers have a choice of several railroads, a shipper's choice of carrier in some cases will essentially determine the route that will be used.
2.1.1 General Mode Selection Practices
Discussions with carriers, shippers, and other persons knowledgeable about these transportation issues and who have worked with hazardous and non-hazardous shipments by highway, rail, and water, revealed that modal choices are made for a variety of reasons.

First and foremost, shippers can make modal choices only from among those modes that are physically available to them and their customers. Although almost all businesses are now accessible by highway, fewer have rail service available, and fewer still have waterways avail- able. Furthermore, to complete a shipment, the chosen mode should be available at both the origin and destination. In the case of rail and waterways, this often limits the modal choices available to shippers. This constraint has been somewhat mitigated in recent years by the development of intermodal operations. In intermodal shipments, the product is interchanged one or more times between modes while moving from the shipper to the customer. This allows access to modes that would otherwise be unavailable, although it frequently limits the size and type of equipment that can be used and requires the commodity and its container to be handled (i.e., unloadedlloaded) away from the origin or destination.
Second, shippers choose modes based on various service attributes. Shippers want to maxi- ' mize the value of their products by getting them to their customers quickly, without damage, at the lowest possible cost, and in lot sizes convenient to the shipper or the customer. Each of the modes has a different ability to provide speed of transport, frequency of service, and avoidance of damage and to offer low prices, while making a profit for the carrier. Shippers, who have different levels of interest in each of these characteristics based on the nature of their businesses, choose the mode that provides the best combination of service attributes.
Third, shippers sometimes choose modes to ensure continued availability of a mode or to pro- vide competition among carriers. For example, a shipper may choose to use highways because of service attributes, but also occasionally makes a rail shipment just to keep a rail line active for possible future use.
Safety is not usually given as the reason for choosing a particular mode. Some observers in the shipping ~ommunity have noted that all modes are considered safe and that no mode holds a clear advantage, especially for non-hazardous shipments.
These reasons for modal choice are generally supported by the results of a survey of Canadian shippers in the mid-1980s [Wilson, Bisson, and Kobia 19861. That study found that shippers choose a particular mode primarily to minimize transit time and generally favor highways for shorter hauls and rail for longer hauls. The study also found that shippers make modal choices based on availability of pickup and delivery services (favoring highway), cooperation between carrier and shipper personnel (favoring highway), and shipment tracing capability (favoring rail). The study further found that in-transit damage (which can be indicative of poor safety performance) is not significant in influencing the choice of any mode.
An earlier survey asked U.S. shippers why they chose a particular mode and carrier within that mode [Stock and LaLonde 19771. The study found that, in general, shippers choose modes based on pickup and delivery services and overall cost. Other selection criteria, in decreasing order of importance, were (1) line haul (ability to serve origin and destination without changing mode or carrier), (2) tracing and expediting, (3) loss and damage, (4) special service and equipment, and (5) sales staff support. This survey was conducted before the transportation modes were deregulated, when carriers' abilities to tailor their services to their
customers were restricted. In assessing this survey in the mid-1980s, one of the original authors stated that consistency of service had become "the most important single criterion for evaluating alternatives" [Stock and Larnbert 19871.
2.1.2 General Route Selection Practices
Analysis, including discussions with carriers, shippers, and other knowledgeable persons, revealed that routing choices are made for a variety of reasons.
Like shippers, carriers can only choose routes physically available to them. Truck companies and barge operators use highways and waterways that are publicly owned, or, in the case of tollroads and tollbridges, are at least available to the public. Since any company's trucks can use any highway, and since almost all shippers and customers have access to highways, all truck companies are physically able to serve almost all shippers. Similarly, although few shippers and customers have access to waterways, those that have the appropriate facilities can be physically served by all barge companies. There are, of course, regulatory restrictions on locations that some truck companies and barge operators can serve, and some truck companies and barge operators may choose not to serve certain areas.
In contrast, railroad lines are privately owned (with the exception of certain Amtrak routes and state or locally owned rail lines); service over those lines is controlled by the owning railroad company. Trackage rights agreements are a means of extending a railroad's service area whereby it pays the owning railroad for the right to operate its trains over the other's tracks. When the originating railroad cannot provide service all the way to the shipment destination, the cars are interchanged-handed off to another railroad at a common junction for further transportation to (or toward) the destination. Revenue is divided among the railroads that handle the shipment.
Trackage rights agreements take place in a competitive environment in which each railroad attempts to optimize its own interests. Sometimes those interests result in the owning railroad refusing access to the other railroad. When that occurs, routing options are affected. Occa- sionally, railroads may be ordered by federal regulators or the courts to allow access to other railroads to preserve local competition or as a condition of merger or abandonment proceedings. The rate structures established by railroads can also impact routing options, since those structures can give preference to one route over another, and can determine (and thereby limit) interchange points.
Routing is more complex for rail shipments, and the options are more constrained. Few shippers have direct access to more than one railroad, which significantly limits routing options. Also, the originating railroad (via its rate structure), and not the shipper, usually determines how a shipment is to be routed. If the originating railroad serves the destination, routing will be a function of the routes and schedules of the trains it runs and the location of its yards. If other railroads are needed to reach the destination, competitive forces will also affect routing. Railroads generally divide revenues for a shipment based roughly on the proportion of the distance that each railroad hauls the shipment. Each railroad has some

incentive, then, to haul the shipment as far as possible before interchanging it with another railroad, even if a shorter haul would result in overall lower costs or shorter time in transit. The railroad that originates the shipment traditionally controls where it is interchanged and gets as long a haul as practical. In contrast to the practice for general commodities, some shipments of hazardous materials appear to receive expedited handling when a railroad believes that revenues fail to cover the greater risks and costs involved. In any event, deregulation and increased competition from other modes have caused railroads to begin to focus more in recent years on customer service. Shippers can and sometimes do specify the preferred routing for a shipment, including the junction point(s) at which the shipment is to be interchanged from one railroad to another. Routing of RAM shipments is usually specified by the shipper in conjunction with the carrier(s) involved.
Finally, one additional option of routing is available only to railroads-the temporary ability to embargo their own routes. In essence, a railroad embargoes a route by placing it out of ser- vice to all trains, to those over a certain length or weight, or to those carrying a particular commodity. Embargoes are generally based on temporary conditions (such as the flood damage that occurred in the Midwest in the early 1990s), but can become permanent under special circumstances. A recent example is the March 19, 1993, embargo of all hazardous materials shipments on the Long Island Railroad. This embargo was unusual in that it was applied by the Association of American Railroads (an industry group) to an entire railroad, rather than applied by a railroad to a single route. Attempts by railroads to embargo the transportation of RAM or hazardous materials were consistently disallowed by the Interstate Commerce Commission (see, for instance, Class@cation Ratings of Chemicals, Conrail, April 30, 1986, I&S Docket No. 9265, 3 I.C.C. 2d 33 1, December 19, 1986). The Surface Transportation Board would generally be expected to resist allowing long-term or permanent embargoes by railroads in order to prevent such embargoes from becoming de facto abandonments .
Truck, railroad, and barge companies tend to make routing decisions, including those embodied in their rate structures, for the same reason: operational efficiency. Carriers in each mode seek to make best use of their equipment and fixed facilities. For truck companies, this means avoiding long routes, toll roads, states with high fuel taxes, and congested or unreliable routes (perhaps due to weather). For railroads, this means avoiding long routes and congested classification facilities. Railroads also manage their train movements to concentrate traffic on main lines, to accommodate single-track routes, and to utilize efficient schedules and train consists (i.e., the specific engines and cars that make up a train). Barge operators, as mentioned earlier, have very few routing options but, when they do, they try to avoid long routes, congested locks, and, to a smaller degree, routes affected by seasonal weather.
'The ICC was terminated (per the ICC Termination Act) on December 29, 1995. Remaining authority with respect to rail went to the newly created Surface Transportation Board, an independent board within the U.S. Department of Transportation.

2.2 OVERVIEW OF MODE AND ROUTE SELECTION FOR HAZARDOUS MATERIALS
2.2.1 Mode Selection for Hazardous Materials
There appears to be little difference between the modal choices made by shippers of most hazardous materials and the modal choices made by those shipping non-hazardous materials. In fact, most shippers of hazardous materials also transport a large volume of non-hazardous materials and follow the same practices in doing so. Generally speaking, from the shippers' perspective, all modes are considered safe, and modal choices are made for reasons other than safety, such as cost and convenience. Exceptions include the Department of Defense (DOD) and certain chemical companies that review carrier safety records before making carrier choices. Recently, the concept of exercising "responsible care" in handling and transporting hazardous materials has caused chemical companies to take an increased interest in selecting modes and carriers based on safety records.
Shipments of spent nuclear fuel (SNF) are an exception to general practice; they are jointly planned by shippers, carriers, and government officials. Modal choice is based primarily on two factors-physical availability of a mode and the amount of material to be shipped. For shipments of a single fuel element, highway will almost always be the mode of choice, even if rail or. barge access is available. Given the much larger capacity of raillbarge casks, however, one of these will be the mode of choice for multi-element SNF shipments if the origin and destination points are accessible and can handle the heavier casks.
2.2.2 Route Selection for Hazardous Materials
Carriers' routing choices in all modes are affected to varying degrees by federal, state, Indian tribe, and local regulations. On their own, most carriers make routing adjustments only for a limited number of hazardous materials. In general, hazardous materials are not differentiated from non-hazardous materials when making routing decisions.
For railroads, however, there has been a modest movement toward changing routing or oper- ating practices in recognition of certain hazardous materials. Industry inquiries during this study found these examples:
The Association of American Railroads (AAR) suggests that its member railroads follow its Circular No. OT-55-B [AAR 19931, which contains operating practices that apply to many hazardous materials. One of its recommendations is industry-wide use of key trains and designation of key routes.
Key trains are trains with 5 or more loaded tank cars containing poisons with an inhalation hazard, or 20 or more carloads or intermodal portable tankloads of a combination of poisons with inhalation hazards, flammable gases, certain explosives, and environmentally sensitive chemicals. Key trains are restricted to a maximum speed of 50 mph, hold the mainline when passing other trains (unless the siding meets Federal Railroad
Administration [FRA] Class 2 standards), and may not contain any cars with friction bearings. When a key train is stopped by emergency brake application or unknown cause, the train must be inspected for derailed or defective cars. If a defective axle journal is reported by a trackside detector but has no visible defect, the train must be limited to 30 mph until it has successfully passed the next detector. Failure to pass the second detector requires that the car be set out from the train.
Key routes are tracks with yearly traffic that includes 10,000 or more carloads or intermodal portable tankloads of hazardous materials or a combined total of 4,000 or more carloads of hazardous materials that are poisonous by inhalation, flammable gases, certain explosives, or environmentally sensitive chemicals. Key routes.must have defective wheel bearing detectors no more than 40 miles apart and must be inspected by track geometry inspection cars (or equivalent) at least twice each year. Sidings on key routes must be similarly inspected at least once each year. All track where key trains are met or passed must be FRA Class 2 or better.
The key route concept does not stipulate how hazardous materials should be routed, but highlights high-volume routes while ensuring a minimum level of safety detection and inspection equipment [AAR 19931.
The AAR recommends that trains moving spent fuel (and certain other forms of radioactive materials) be moved only in special trains. AAR's policy states that "[slhipments of casks containing irradiated spent fuel cores or empty casks previously loaded with such material should be moved in special trains containing no other freight, at speeds not faster than 35 mph. When a train handling these shipments meets, passes, or is passed by another train, one train should stand while the other moves past not faster than 35 mph" [AAR 19751.
The Union Pacific railroad system follows the AAR recommendation that key trains be identified and key routes be designated. The Union Pacific has designated routes that carry high volumes of hazardous materials as key routes. Two to five permanently designated key trains have operated daily over these routes in recent years.
Hazardous materials shipments are usually routed no differently than non-hazardous ones. One exception, which predates the key route concept, is that the Union Pacific routes hazardous materials shipments around St. Louis because an equivalent quality parallel mainline is available 100 miles to the east.3 In a survey several years ago, the railroad said that it prefers not to route hazardous materials around population centers because doing so often requires using lower quality track [Midwest Research Institute 19901.
The Union Pacific's current practice is to move RAM shipments via dedicated trains. The railroad's position is that "dedicated trains are essential for the movement of these
3Leo Tierney, Union Pacific Railroad, telephone conversation with Gary Watros, Volpe Center, December 3, 1993.

radioactive materials in order to satisfy all the operational and safety considerations surrounding these shipments. Dedicated train service is also necessary to accommodate the 35 mph operating restriction that is imposed by DOEIDOD for the transportation of these radioactive materials, including the movements of empty casks. " 4 Shipments of debris from Three Mile Island were handled in dedicated trains restricted to 50 mph (based on negotiations with the DOE and other interested parties).'
The Norfolk Southern follows the AAR's key train recommendations for certain hazardous materials and the AAR's special train recommendations for spent fuel c a s k 6
Conrail follows AAR key train recommendations for hazardous materials and AAR special train recommendations for spent fuel casks. Conrail also prefers to route trains carrying spent fuel on main lines whenever possible.'
2.3 OVERVIEW OF REGULATIONS AFFECTING MODE AND ROUTE SELECTION
Various federal, state, Indian tribe, and local governmental agencies have limited authority to regulate transportation. Sometimes state, Indian tribe, and local agency regulations are overridden by federal regulations. Sometimes federal, state, Indian tribes, and local agencies choose not to exercise the authority that they have been given.
2.3.1 Regulation of Mode and Route Selection for Non-Hazardous Materials
Mode Selection. A detailed review of federal, state, Indian tribe, and local regulations found none that require the use of a particular mode for non-hazardous materials.
Route Selection. Routing restrictions vary widely by jurisdiction.
Federal. The study found no federal regulations that address the routing of non-hazardous materials. The U.S. Coast Guard does have authority to suspend navigation on a particular waterway due to seasonal conditions or emergencies. This could cause a rerout- ing or change of mode; but, because of the limited route options available to barge
4 Comments to the docket on "Draft Report, Identification of Factors for Selecting Modes and Routes for Shipping High-Level Radioactive Waste and Spent Nuclear Fuel," from Union Pacific Railroad Company, undated.
%ee note 2 above.
6Paul Henson, Director of Safety and Hazardous Materials, Norfolk Southern Railroad, telephone conversation with Gary Watros, Volpe Center, December 3, 1993.
'Allan C. Fisher, Director of Operating Rules, Conrail, telephone conversation with Gary Watros, Volpe Center, December 3, 1993.

companies, these closings are more likely to cause a delay or change of mode than a change in route.
States, Indian tribes, and local jurisdictions. There are a variety of approaches to regulating, or at least influencing, routing of highway shipments. Some jurisdictions routinely restrict trucks from operating on certain highways by imposing weight and clearance limits. These limits reflect the design or condition of the infrastructure and are intended to prevent damage or excess wear to the surfaces and structures. Truck routes are also designated through many cities to keep trucks on highways considered more suitable to that type of vehicle or to avoid residential neighborhoods and other selected locations. The criteria for designating these truck routes vary from jurisdiction to juris- diction and, in some cases, are extended to exclude trucks from parkways and other auto- only roadways.
Some jurisdictions impose curfews on hours of truck operation on certain roads or in certain areas of a city. Those curfews are either for noise abatement or to alleviate congestion. Waivers and exceptions to all these restrictions are granted with varying degrees of regularity.
2.3.2 Reelation of Mode and Route Selection for Hazardous Materials
Mode Selection. A detailed review of federal, state, Indian tribe, and local regulations found none that require the use of a particular mode for hazardous materials. Some regulations, however, prohibit or restrict carrying specific materials by certain modes. One example is air transport of certain shipments of radioactive material (10 CFR 71.88 and 73.24).
Route Selection. Generally speaking, the commodity being shipped does not affect the routing choice made by the carriers in any of the modes. Exceptions include explosives; combustibles; certain other hazardous materials that are prohibited from some tunnels, bridges, and highways by state or local regulation; and highway route controlled quantities (HRCQ) of radioactive materials. The governmental routing regulations frequently apply only to hazardous materials passing through a locality; pickups and deliveries are routinely exempted from the restrictions.
Various federal, state, Indian tribe, and local agencies have jurisdiction over aspects of hazard- ous materials routing on highways. Authority over hazardous materials routing is complicated by overlapping jurisdictions and issues of interstate commerce.
The Hazardous Materials Transportation Act (HMTA) provides DOT with the authority to regulate the routing of hazardous materials shipments. For many years, the Federal Highway Administration (FHWA) had the only regulation that prescribed routing restrictions for hazardous materials. The Federal Motor Carrier Safety Regulations (49 CFR 397.67) state that unless there is no practicable alternative, a motor vehicle which contains hazardous materials must be operated over routes which do not go through or near heavily populated

areas, places where crowds assemble, tunnels, narrow streets or alleys, but give no specific definitions for when these restricted conditions exist.
In 1980, the DOT published a set of routing guidelines for general hazardous materials (not RAM) to be used by state and local agencies. These guidelines were most recently updated in 1989 as "Guidelines for Applying Criteria to Designate Routes for Transporting Hazardous Materials " (DOTIRSPAIOHMT-89-02, July 1989). The guidelines are not mandatory but have been used by many agencies. The FHWA was delegated the authority and responsibility for highway routing of hazardous materials (56 FR 31343, July 10, 1991) and promulgated new hazardous materials routing regulations pursuant to HMTUSA (see 57 FR 44129, Sept. 24, 1992; and 59 FR 51824, Oct. 12 1994).
DOT also issued regulations in 1982 (see 46 FR 5298, Jan. 19, 1981) that prescribe highway routing requirements for certain quantities of radioactive materials (49 CFR 173.22 and 177.825). These regulations require that carriers follow "preferred routes," which are Interstate highways, andlor any other route designated by a state routing agency. Carriers are instructed to choose a preferred route to reduce travel time and to use urban bypasses where available. DOT also has published a set of guidelines to assist state agencies and Indian tribes in designating routes that satisfy DOT Regulations (57 FR 44129, Sept. 24, 1992).
There are no comparable DOT regulations or guidelines for rail or water shipments. The reasons that routing regulation has been limited to highway were expressed in the Notice of Proposed Rulemaking for HM-164 (45 FR 7140, January 3 1, 1980), as follows: "Rail operations.. .differ significantly from highway operations.. . . Also, the routing choices available in rail operations with regard to populated or congested areas are considerably more limited than in highway transportation. "
The Nuclear Regulatory Commission (NRC) also has authority to regulate highway routing of certain types of radioactive materials to ensure adequate security. A Memorandum of Under- standing between DOT and the NRC stipulates that each agency will coordinate any radioactive materials transportation regulations developed by the other.
States and Indian tribes. A survey by the American Association of State Highway and Transportation Officials (AASHTO) found that 22 of 46 responding states have some form of routing authority over hazardous materials shipments [Midwest Research Institute 19901. The presence of routing authority does not necessarily mean that the states are exercising that authority. Several states are considering expanding or implementing routing authority over hazardous materials shipments. In general, states regulate hazard- ous materials routing by prohibiting the use of certain routes rather than designating acceptable routes [Midwest Research Institute 19901. Indian tribes can invoke authority over routing of shipments through their jurisdictions in the same manner as states.
California is one of the few states that regulates explosives routing. The state has designated a network of approved routes with enforcement by the California Highway

Patrol (CHP). California has also established a network of routes for hazardous materials that are poisonous by inhalation.
Because the federal government has promulgated highway routing requirements for radioactive materials, states and Indian tribes have often focused instead on ancillary transportation regulations, such as notification requirements, inspection, and escorts. Some of the truck and cask combinations used to transport spent nuclear fuel and high- level nuclear waste exceed state and Indian tribe highway weight limits. As such, they usually require special permits and are restricted to using certain highways. These restrictions are due to the total weight of the loaded truck, rather than the nature of the commodity being transported.
Several states have taken advantage of the provisions within HM-164 and have designated alternative routes for spent nuclear fuel shipments. The routes are in place of, or in addition to, the base HM-164 network of Interstate highways and urban bypasses.
Local jurisdictions. The AASHTO survey found that local agencies exercise hazardous materials routing authority in 19 of 46 states. In 7 of the 19 states, the local agencies exercise routing authority over all roadways, including state highways. The authority in each state, and the degree to which that authority is exercised, varies widely. In Washington, for example, local agencies have complete authority to prohibit hazardous materials on all roadways under their jurisdiction. In California, local agencies can regulate hazardous materials routing, subject to review by the CHP [Midwest Research Institute 19901. In that state, a routing restriction must
1. Apply only to highways appreciably less safe than alternatives
2. Not be preempted by federal regulation
3. Not eliminate access to pickup and delivery points or necessary service
4. Preserve at least one legal alternative route.
Columbus, Ohio, has implemented a type of routing restriction that is gaining popularity in the Midwest. The city requires that all through shipments of hazardous materials must use an outer-belt Interstate highway around the city, even if total mileage and time is increased. "Hazardous Cargo" routes are posted and exceptions require permits from the Fire Chief [Columbus City Code, Chapter 25511. The restriction was prompted by the overturn of a truck carrying hydrogen peroxide at the downtown interchange of the two main Interstate highways in the late 1980s.
Local agencies are generally not involved in routing radioactive materials, although they have, on several occasions, attempted to impose routing regulations that were later over- turned or pre-empted. The most notable case was New York City's attempt to prevent SNF shipments from moving off Long Island through the city. New York City's attempts

to block these shipments raised the question of how to involve state and local jurisdictions in radioactive material shipments and resulted in the promulgation of HM-164 [Mullen, Welch and Welles 19861. Another example is the proclamation by certain municipalities that they are "Nuclear Free Zones" in which no radioactive materials can be handled, pro- cessed, stored, or transported. More than 100 cities have declared themselves Nuclear Free Zones, including Takoma Park, Maryland; Chicago, Illinois; and Oakland, California. Court cases have decided that these declarations do not have the force of law. The designations, however, indicate a community's opposition to nuclear transportation and could, in certain cases, influence routing decisions.
There are no known local routing requirements for radioactive materials shipments by rail or waterway.
'New York Times, 9/20/87 and 4/28/90; UP1 Wire, 2/17/86, 3/12/86, and 8/12/86; Philadelphia Inquirer, 4/28/90.

Page intentionally left blank.

3. IDENTIFICATION OF CANDIDATE MODE AND ROUTE FACTORS
As seen in Chapter 2, mode and route decisions have traditionally been based on considerations other than safety, though shippers of hazardous materials have begun using safety as a criterion in choosing carriers in recent years. The purpose of this chapter is to focus on selection criteria related to "overall public safety," as defined in Chapter 1.
The first step in the effort to identify the most important safety factors for mode and route selection was to develop a comprehensive list of candidate factors. These factors were then carefully screened and evaluated and ultimately narrowed down to a set of primary mode and route selection factors for more detailed assessment. Chapter 3 describes the process for identifying mode and route factors. Chapter 4 then describes the manner in which the candidate factors were evaluated and prioritized.
3.1 ENUMERATION OF FACTORS
A comprehensive list of candidate mode and route factors was compiled using the project defi- nition of overall public safety as a guide. Few constraints were imposed in developing the list, other than a factor's intuitive relationship to public safety. In the initial compilation, no effort was made to organize the factors or to group them in any way.
The factors were collected from several sources including (1) current regulations and routing guidelines, (2) HMTUSA, (3) a literature review, (4) a ModeIRoute Technical Advisory Group (TAG) convened for this study, and (5) project team expertise. All identifiable factors contained in current regulations and published documents were added to the list without refer- ence to the route selection procedure or risk assessment technique. This was considered important because shippers and carriers are generally familiar with current routing guidelines and operate with these factors and procedures in mind.
The TAG was convened specifically to act as an expert panel for this study. The group repre- sented broad interests including carriers; shippers; local, state, and federal governments; public interest groups; and regional energy groups (see Appendix B). The members were provided with a list of factors prior to the meeting and at the meeting were asked to provide input on additions or changes to the initial comprehensive list, as well as guidance on repre- sentative units of measure and ability to measure the factors.
3.2 GUIDELINES FOR ROUTING HAZARDOUS MATERIALS
Federal regulations governing the routing of hazardous and radioactive material were men- tioned in Section 2.3. It was noted that the U.S. DOT has prepared guidelines for states and other jurisdictions to use when designating routes for both general hazardous materials and for highway route controlled quantities of radioactive materials. Similarly, Transport Canada has

developed a set of hazardous materials routing guidelines for shipments in Canada [Transport Canada 19871. Routing guidelines are an important source of candidate mode and route fact- ors, though it is recognized that these guidelines were prepared for use by goveinmental routing officials and not for use by shippers and carriers, who are the focus of this report. Because of the importance of routing guidelines, it is worthwhile to provide some background on the methodology and criteria they employed.
3.2.1 DOT Hazardous Materials Routinp Guidelines
DOT'S hazardous materials (hazmat) routing guidelines are based on the concept of relative risk. That is, only those factors that are potentially different between alternate routes are considered in the risk assessment that forms the basis for the route decision. Risk is measured using two primary factors:
1. The expected, per-mile population exposure to a release (population risk).
2. The expected, per-mile property value exposure (property risk). (The estimation of prop- erty risk is considered optional in the route selection process.)
These two primary factors are computed for each route but are not combined in any way. Population risk is estimated using accident rate and population density information. Property risk is also estimated using accident rate information but considers property values instead of population density.
The DOT guidelines suggest that accident rate information be obtained from the best possible information source. The DOT suggests that, when available, the analyst should use accident rates that are based on the most severe accidents (such as fatal accidents). This is in recognition of the fact that many accidents are not severe enough to cause a release of hazardous materials from containers. A simple regression model, based on the average daily traffic volume of each Interstate route segment, is also provided for estimating accident probabilities.
Population density information along each route is necessary to estimate the number of people who would be at risk during an accidental release. The approach recommended in the guide- lines is to use census tract data to estimate the fraction of the population along a route within the release impact zone. The choice of width for the impact zone along each route is based on the suggested evacuation distance of the nine classes of hazardous materials.
Property value is estimated by measuring lineal frontage and its value along each route. The release impact zones that are important in the population risk assessment process are not used in the property risk assessment process.
Route selection is based on the primary risk factors (population and property risk) and on sub- jective factors. If the primary risk factors for multiple routes are so close that a definitive

decision cannot be made, the secondary subjective factors are employed. Decision makers use the secondary subjective factors to differentiate close calls.
Four types of secondary subjective factors are considered in the guidelines:
1. Special populations located in facilities that are difficult to evacuate (nursing homes, schools, hospitals, and prisons)
2. Special properties (utilities, transportation bottlenecks, and difficult-to-reach facilities)
3. Emergency response capability
4. Other subjective factors of special interest to a community.
The evaluation process requires listing the types and quantities of these secondary factors for each route. There is no attempt to analytically combine these factors.
The primary and subjective factors from the DOT hazardous materials guidelines are shown in Exhibit 2. Each of these factors is broken down into more specific factors in the second column of the exhibit and into measurable components in the third column.
3.2.2 DOT Routing Guidelines for Hi~hwav Route Controlled Quantitv Shiuments of Radioactive Materials
These DOT routing guidelines provide a methodology for states and other jurisdictions to use when determining the lowest risk route for the transport of highway route controlled quantity (HRCQ) radioactive materials. "Highway route controlled quantity" is a term specifically defined in the Federal Hazardous Materials Regulations (see 49 CFR 173.403).
The methodology used in the guidelines is to develop a "figure of merit" for each route consid- ered. This figure represents the comparative risk between routes; it is not a measure of abso- lute risk. Each figure of merit is developed based upon three primary risk factors: normal radiation exposure, public health risk from accidents, and economic risk from accidents (see Exhibit 2).
Normal radiation exposure refers to the amount of radiation emitted during normal, or incident-free, transportation operations. An equation is used to calculate the normal radiation exposure factor. This equation includes the following components: average population density, length of route, vehicle speed, and average traffic count.
Public health risk from accidents refers to the potential number of people exposed if a trans- portation accident were severe enough to lead to a release of the radioactive materials from the transport container. Risk from accidental release of radioactive materials depends on two factors:

Exhibit 2. Factors in Routing Guidelines Developed for Use by State and Local Governments
Generic Factors Specific Factors Measurable Components
U.S. DOT Hazmat Guidelines
Primary Factors: Relative Population Accident probability Accident rate
Risk
Population potentially at risk Population within "impact" zone (depends on hazard class)
Relative Property Risk Accident probability Accident rate
Property potentially at risk Property value of lineal frontage
Subjective Factors: Special Populations Type of special populations Number along route
(schools, hospitals, etc.) Special Properties Type of special properties Number along route
(utilities, structures, etc.) Emergency Response Emergency response facilities Proximity to route segments
Other As identified by the community doing the analysis
U.S. DOT HRCQ Guidelines
Primary Factors: Normal Radiation Population potentially exposed Population with 0-5 mile band; Transport - Exposure workers (drivers, handlers, etc.);
Passengers in other vehicles; People at stops
Travel time Shipment distance; Vehicle speed Public Health Risk Accident release consequence Population within 0-5 mile band; from Accidents Population within 5-10 mile band
Accident release frequency Economic Risks from Accident release consequence Accidents
Accident rate
Types of property within 0-5 mile band; Types of property within 5-10 mile band
Accident release frequency Accident rate
Secondary Factors: Emergency Response Response time; equipment availability; None-Subjective scaling
training; manpower availability; type of land use
Evacuation Population density; egress availability; None-Subjective scaling manpower/equipment; evacuation time; evacuation impacts; land use type
Special Facilities Dose response; accident evacuation; None-Subjective scaling economics; type of facility
Traffic Fatalities and Fatalities and injuries Accident rate Injuries
Canadian Route Screening for Dangerous Goods by Highway
Population Risk Population potentially exposed Population within impact area
Accident probability Accident rate Property Risk Property potentially exposed Property within impact area
Accident probability Accident rate Environmental Risk Sensitive environments potentially Sensitive environments within impact area
exposed
Accident probability Accident rate
Emergency Response Emergency response capability Number of units within 10 minutes

1. The frequency of accidents that could result in release
2. The consequence from such accidents, in terms of the number of people that could be exposed to radioactive materials if a release occurs.
Accident release frequencies are calculated by multiplying the accident rate by the route or route segment length. Packages containing HRCQ radioactive materials are required by DOT and NRC regulations to retain their contents even in very severe accidents. Consequently, the guidelines suggest the use of accident rates that represent the most severe accidents involving the types of vehicles expected to carry HRCQ. The most appropriate would be the fatality rate for drivers of vehicles containing hazardous materials. Since this level of specificity in accident rates is usually not available, DOT provides a rank preference list for the types of accident rates that could best represent accident release frequencies.
Accident release consequences depend on a number of factors, many of which (such as atmo- spheric conditions and type of material transported) would be similar for two alternate routes. This greatly simplifies the calculation of consequences to a consideration of the differing levels of population along the route or route segment.
Economic risk from accidents refers to the potential contamination of property near the road- way that could result if a transportation accident were to occur. The cost of removing contaminated property would vary widely based on the type of property adjacent to the roadway. To determine the risk, the type of property along the route segment is classified as rural, residential, commercial/industrial, park, or public area.
If an analysis of the primary factors does not indicate a clear choice for the lowest risk route, secondary factors may be considered. These include emergency response, evacuation potential, special facilities, and traffic fatalities and injuries.
A summary of the primary and secondary factors for the HRCQ guidelines is presented in the middle portion of Exhibit 2. Again, these factors are further broken down into more specific elements and measurable components for each of these elements.
3.2.3 Canadian Route Screening Guidelines for Danperous Goods bv Truck
The Canadian route screening guidelines provide the Canadian national approach for routing hazardous materials (dangerous goods). This methodology is similar to the current U.S. DOT hazardous materials routing guidelines, but it puts greater emphasis on emergency response and environmental impacts to make the final routing decision. Overall, four major factors are identified to help select routes: population risk, property risk, environmental risk, and emergency response. This is shown in the lower portion of Exhibit 2.
The routing method relies on three major inputs: (1) accident probability, (2) accident conse- quences, and (3) emergency response capabilities. Accident consequences are further subdi- vided into population, property, and environmental exposure.

Accident probabilities are composed of accident rate data and length of route segments. Con- sequences are estimated assuming a hazard exposure corridor two kilometers in width (other corridor widths can be used). Reference data are provided to help quantify population, property, and environmental exposure. Emergency response capability is defined as the number of qualified response units that could respond to the accident within 10 minutes divided by the length of the relevant route segment.
Routes are screened using the lowest level of analytical detail to eliminate those routes that are clearly not suitable. This screening includes consideration of physical and legal constraints to hazardous material transport. Once the number of potential routes has been reduced to a manageable size, a more detailed analysis is performed. The final selection of a route is made in either of two ways. In one method, each route receives a single risk number that translates various risk assessment elements into one number (the route with the highest number is preferred). The other method is to stop short of this final translation, present the major assessment attributes in a tabular form, and allow the decision makers to apply subjective judg- ment.
3.3 CANDIDATE MODE AND ROUTE FACTORS IDENTIFIED IN HMTUSA
HMTUSA contains several provisions that relate directly to modehoute selection criteria. First, as discussed in Chapter 1, Section 15 of HMTUSA requires conducting a mode and route study. Section 15 also identifies a number of specific factors that are to be considered in
I
that study (see Exhibit 3). Second, Section 4 of HMTUSA directs DOT to establish federal
I Exhibit 3. Potential Mode and Route Selection Factors Identified in HMTUSA ~
I Section 4-Hiehwav R o u t i ~ a u i r e m e n &
Population density Type of highways Type and quantities of hazardous materials Emergency response capabilities Results of consultations with affected parties Exposure and other risk factors Terrain considerations Continuity of routes Alternative routes Effects on commerce Delays in transportation
I Section 15--Mode and Route Studv ReauiremenQ
Population density Types and conditions of modal infrastructures (such as highways, railbeds, and waterways)
Quantities of high-level waste and spent nuclear fuel Emergency response capabilities Exposure and other risk factors Terrain considerations Continuity of routes Available alternative routes Environmental impact factors

standards for the states and Indian tribes to use to designate routes. (The FHWA has promulgated this rule, as previously mentioned.) Congress also includes a list of factors that DOT is to consider for this rulemaking. These factors are also shown in Exhibit 3 and were included in the comprehensive list of factors developed for consideration in this study.
3.4 CANDIDATE MODE AND ROUTE FACTORS IDENTIFIED IN THE LITERATURE
An extensive literature review was conducted to identify factors that carriers, shippers, and other interested parties have identified as being particularly important in selecting a mode and route to improve safety. Over 200 documents were reviewed. Documents were chosen by consulting with DOT staff, other federal and state agencies, the TAG established for this study, and carriers and shippers, as well as by searching the Transportation Research Information Service (TRIS). A bibliography of pertinent documents reviewed by the project team is given in Appendix C.
The documents reviewed for this project can be categorized as follows:
Modal studies Routing studieslevaluations Risk assessments Environmental assessments General hazardous material transportation studies.
Obviously, there is considerable overlap of some documents across these categories.
Exhibit 4 presents a comprehensive list of every potential factor identified from the review of past studies and documents as important for route andlor mode selection. Only minor editing has been done to the initial raw list of factors drawn from the literature review. Some of the factors appeared in many documents, while others appeared in only one or a few documents. No attempt was made to weight their importance by the number or type of documents in which the factor was considered. No importance is implied by the order of presentation in Exhibit 4.
The project team was careful not to prejudge the validity of the factors during the literature review. The factors were included in the comprehensive list regardless of their source. Many of the source documents were technical studies in which few mode or route factors were evaluated in great detail. Other documents treated factors in a more summary fashion. A number of documents reviewed were actually reports on the results of public meetings or were reports that incorporated public input. As such, the list represents a broad cross section of viewpoints.

Exhibit 4. List of Factors Identified During Literature Review That Have Been Evaluated or Proposed as Key Issues for Mode and/or Route Selection -
- Population at risk Length of shipment Community "safety index" Classification of highway, railway, or waterway Grade of highway or railway Separation of traffic Accident likelihood Tradeoff between risk and travel time Population density Number of crossings or intersections High accident locations ("hot spots") Local viewpoints Worker population at risk Cask design and fabrication Emergency response Tradeoff between population centers and circuitous routes Train stops per trip Stop times Train speed between terminals Posted speed limits by routelmode System elasticitylrecoverability Train crew exposure Track profile Exposures during train stops to crew and surrounding population Track or road curvature Run-through (dedicated) vs. classification trains Shipment duration Amount of other hazmat traffic along modelroute Wayside detectors along rail routes Exposure to escorts and responders - Movement control, signalization, etc. by mode Carrier communicationltracking capability Hiring practices and training by camerlmode Substance abuse programs (vary by modelcamer) Sabotage and vandalism (vary by mode) Quantity of material to be shipped and cask capacity (causes number of shipments by mode to vary) - Population brought into contact Non-occupation exposure to persons beside the right-of-way (off- link dose)
Exposures during highway stops (truck stops, etc.) Low probabilityhigh consequence accident potential Time of day for shipment Distance of crew from packagings Distance of population from shipments Configuration of shipment (dedicated vs. regular train, single vs. truck convoy, etc.) Escort requirements by mode Percent of travel in population zones (urban, suburban, rural) Non-radiological impacts such as regular accidents Radiological impacts from accidents
* Number of waste shipments Vehicle speed Quality control by camer Human error potential Equipment exchanges en route Number of inspections (may vary by mode and route) Exposure to others sharing same route (on-link exposure) Stop timeldelays at origin and destination rail terminals Originldestination Need to pick up or drop off cars en route Work ruleslunion procedures (vary by camerlmode) Proximity of emergency responders Communication capability of responders Equipment availabilitylreplacement for emergency response Ability to restore to normal after response to accident Total number of stops en route Number of handling railroads Incidence of classification Level of enforcement (varies by route or mode) State licensing requirements
* Camer shipment monitoring capability Weatherlwind conditions (differ by route location) Visibility conditions en route Cask size limitations (weight, height) Degree of cooperation with jurisdiction along route Person exposure

3.5 COMPREHENSIVE LIST OF CANDIDATE FACTORS
The factors identified from routing guidelines, legislation, and the literature review were con- solidated into a comprehensive list of potential mode and route factors. Before this could be done, the raw lists had to be edited to eliminate redundancies and anomalies. First, there was some duplication of the factors in the lists (see Exhibits 2, 3, and 4). For example, "population density" is listed as a factor in Exhibits 3 and 4. Second, a number of factors could be combined into one representative factor. For example, "population at risk," "exposure," "population density," and "population brought into contact" all relate to population subject to exposure. "Population" was used as the representative factor for all of these in the comprehensive list and was then broken up into its various components (residen- tial, occupational, etc.).
Finally, several "factors" in Exhibit 4 were either so general in nature or combined several discrete factors in such a way that they had to be broken up into constituent factors that could be measured and compared with other factors. Examples include:
Tradeoffs between population centers and circuitous routes Low-probabilitylhigh-consequence accident potential Run-through vs . classification trains Configuration of shipments Stop timeldelays at origin and destination terminals.
The net result of the editing process was a single comprehensive list of 82 potential mode and route factors. The factors were organized into eight general categories to facilitate the initial evaluation by the TAG (see Chapter 4 for more on this group). These factors and categories are shown in Exhibit 5 along with an example to further illustrate each factor.

Exhibit 5. Comprehensive List of Candidate Factors
Safety Factor Example
Ponulation and Environment
Occupational: on-board
Occupational: support
Public: residential
Public: non-residential
Public: shared-facility users
Public: special populations
Sensitive environments
Transnortation Infrastructure and Utilization
Functional classification
Opposing traffic separation
Grade
Curvature
Crossings
"Hot Spots"
Accident likelihood
Posted speed
Route length
Clearancelweight limitations
Traffic density
Maintenance
Accident rate and severity
System elasticity
Travel timesldelays
Structural impediments
Hazmat traffic density
Wayside detectors
- Available detours
Qneratinv Procedures
Time of day
Operating speed
Crew on vehicle
Handling, security, interchange
People at home
People at work, tourists
Other traftic on route, at stops
Hospitals, schools, arenas, prisons
Wetlands, refuges, reservoirs, tribal sacred grounds
Arterial, collector, local or class 1, class 2
Median or two tracks
Uphill or downhill
Curve in alignment
Intersections, rail crossings, river confluences
Known problem areas
Number of accidents per mile along route or by mode
Speed limit
Distance for mode
Bridge clearances, channel depth
Vehicles per length per lane
Upkeep of roads or rails or channels
National or local accident statistics
Ability to resume normal conditions after an incident
Congestion
Light poles or guardrails
Density of other hazmat vehicles
Hotbox, dragging equipment
s y s t e m r m - r - - --
Rush hour conditions
Controlled speed
Number of stops Rests or sidings for other traffic to pass, refueling, locks and dams

Exhibit 5. Comprehensive List of Candidate Factors (Continued)
Safety Factor Example
Ooeratin~ Procedures (Continued)
Stop times
Crew distance from cask(s)
Configuration
Escorts
Interchanges
Classifications
Handlings
Equipment changes en route
Inspections
Originldestination
Pick upldrop off en route
Work rules
Available alternatives
Emer~encv Resoonse (ER)
Proximity/accessibility
Capability
Evacuation potential
Communication
Equipment replacement
Restoration to normal operations
Medical care
Response times
Training
Available manpower
Oualitv Control
Movement control
Communication
Training
Hiring practices
Enforcement
Dispatching
Average time of stops
Locating crew on vehicle
Dedicated vs. regular trains, convoys, other hazmat involved
Chase vehicles, ER, armed guards, medical
Changing rail carriers
Rail yard classification
Casks are loaded/unloaded on vehicle
Changing locomotives
Checking equipment at stops
Beginning and ending of route
Adding vehicles from sidings
Hours for driver operation
Other routes or modes available to serve O/D
Location of ER with respect to route
Ability to respond to nuclear waste accident
Can surrounding population be evacuated
Remote computer, fax links
Availability of equipment (rail cars, tractor trailers)
Time for normal activity to resume
Type of care for radiation exposure
Time to provide effective response
Quality and amount of training for ER
Number of available responses
Signalization
Procedure for contacting vehicle
Driving, emergency, handling
Driver experience, previous driving record
Company procedures
Hours of operation
Vehicle maintenancelinspection Company procedures

Exhibit 5. Comprehensive List of Candidate Factors (Continued)
Safety Factor Example
(Continued)
Licensing
System monitoring
Substance abuse enforcement
Sabotage and vandalism
WeatherIClimate TerrainICondition~
Seasonal road conditions
Terrain
Wind speed, direction, stability
Visibility
Shinment Characteristie
Waste type and level of radioactivity
Number of waste shipments
Quantity per shipment
Cask capacity
Release rates
Cask availability
Cask size limitations
Re~ulation and Other Restrictions
Cask design and fabrications
Legal restrictions
Time of day restrictions
Jurisdictional cooperation
Continuity of routes
Effects on commerce
Consultations with affected parties
Communitv Safetv Index
State procedures
Ability to track vehicle
Monitoring for substance abuse
Obstructions on right of way (ROW), destruction of signs and signals
Snow or sleet, hot or cold
Mountainous, hilly, flat
Wind conditions for dispersal
Fog, dust, fires
Age and type of nuclear waste
Number of shipments per time
Size of shipment
Size of cask
Non-accident material release
Type and size of cask
Physical constraints (weight, length, etc.)
Type of cask
Existing legal restrictions due to overweight, oversize, or hazmat
City blackouts (no-travel times)
State-Federal cooperation
Continuous route for carrier
Increased transit times
Discussions with surrounding communities
Subjective rating of local conditions

4. QUALITATIVE EVALUATION OF CANDIDATE FACTORS AND SELECTION OF PRIMARY MODE AND ROUTE FACTORS
Screening and evaluating the comprehensive list of candidate mode and route factors led to the identification of a set of primary factors. This chapter reviews the screening process and the results of the evaluation of candidate factors.
4.1 SCREENING OF COMPREHENSIVE LIST OF FACTORS
The purpose of the screening process was to begin to narrow down the number of candidate . mode and route factors so that, ultimately, the most important factors could be identified.
Key considerations in the screening process included (1) a factor's relationship to the project definition of public safety, (2) the extent to which a factor could affect mode or route choice, (3) interdependencies among factors, and (4) the extent to which candidate factors can be mea- sured and applied. A factor may be closely related to safety, yet its importance is diminished if it cannot be effectively measured or if it would be difficult or impractical to use it in the decision-making process. These criteria were applied to each factor within every functional group on the comprehensive list.
4.1.1 Technical Advisorv Group
A ModeIRoute Technical Advisory Group (TAG) was convened for this study to assist in reviewing and screening the comprehensive list of factors. The group consisted of represen- tatives from most sectors that have an interest in the selection of mode and route factors for transporting high-level radioactive waste and spent nuclear fuel. Representatives were invited from the following sectors:
Highway carriers Rail carriers Water carriers Nuclear shippers State and local governments Tribal governments Regional state groups Regional energy groups Public interest groups Federal agencies
Federal agencies that were invited to participate included the DOT (including the Research and Special Programs Administration, FHWA, FRA, and the U.S. Coast Guard), the Nuclear Regulatory Commission, the Nuclear Waste Technical Review Board, and the U.S. Depart-

ment of Energy (DOE). The individuals and organizations participating in the TAG are identified in Appendix B.
The purpose of convening the TAG was to gather viewpoints from as broad a spectrum as pos- sible. A consensus on selection of mode and route factors was not envisioned, given the wide difference of backgrounds and positions of the members. The goal was for the TAG to assist in the screening process by reviewing the comprehensive list of candidate factors and making recommendations on each factor.
4.1.2 TAG Meeting and Review of Factors
The TAG met for one day in Chicago, Illinois, on May 18, 1993. Prior to the meeting, the group was provided with the initial comprehensive list of factors for review. The group was divided into three workshops, each facilitated by a study team member. The factors on the comprehensive list were reviewed and discussed in the workshops. TAG members were asked their opinions on the validity of the initial list, the relative importance of each factor, the manner in which the factors should be organized, the possibility of measuring the factors, and the feasibility of implementing the factors.
The individual workshops proved to be very useful for generating detailed discussions of some of the potential modelroute factors on the comprehensive list. There was a common recognition that substantial interrelationships existed among many of the factors and that the list could be better organized to reflect the relationships. Several categories of factors generated the most interest. These included emergency response and environmental factors. Most of the TAG members were familiar and comfortable with factors relating to population, accident rates, and shipment duration as mode and route selection factors. Environmental and emergency response factors were recognized as important safety considerations by all TAG members, but there was disagreement on whether these were modelroute discriminators. Some TAG members were strongly in support of both factors, while others completely disagreed that they had any relationship to modelroute selection.
During the course of the workshops, a number of important issues surfaced that were related to this study. Some of the issues could be addressed, and the study approach was adjusted accordingly. Other issues could not be addressed because their resolution would go beyond the scope and resources of the project.
One issue was the context and timeframe for which this study was to apply. The specific con- cern raised was that the context for this study should be the commercial radioactive waste pro- gram and, therefore, the timeframe should be for the next 10 to 20 years. The argument was that almost all of the future shipments of high-level radioactive waste and spent nuclear fuel would be the movement of commercial reactor waste from utilities to a repository. Thus, the consideration of modelroute factors should be designed primarily to address the specific issues and the long planning horizon related to the commercial repository program. Others disagreed that this study should be tailored to that program, however important it will be in the future. A significant number of shipments could commence earlier (1998-2000) if DOE is successful

in siting and building a Monitored Retrievable Storage (MRS) facility, if Congress authorizes commercial SNF storage at DOE facilities, or if private entities fund the development of an independent storage facility. Subsequently, DOT decided to keep this study generic s6 that its findings would be useful for planning both ongoing and relatively near-term shipments as well as NWPA shipments further in the future. For the latter, guidance provided by this study may facilitate both the establishment of modelroute selection policies for DOE and agreement among DOE, carriers, and representatives of the public interest regarding specific routes to the MRS and repository.
Another issue of concern was whether the project definition of public safety should include perceived risk. Almost everyone agreed on the importance of risk perception in public acceptance of radioactive material transportation. It was also agreed that perceived risk directly impacts some decisions about transporting these materials. The question was how to reconcile perception and reality in a study such as this. It was noted that addressing perceived risk is not something that can actually enhance safety in the same manner as addressing actual risk, such as incident-fiee exposure and accident risks. It was pointed out that perceived risks can actually be addressed, at least in part, by doing a better job of addressing the actual risk factors.
The TAG'S discussion of perceived risk was reviewed in light of the objectives of this study and other considerations to determine what role, if any, it should play in this study. The study team acknowledged that perceived risks may have a legitimate role in modelroute selection. Such concerns, however, are usually local in nature, difficult to treat quantitatively, and vary a great deal from case to case. It would, therefore, be unrealistic to expect shippers and carriers to anticipate what those concerns may be for a given shipping campaign, much less to be effective advocates for such issues. Rather, it is appropriate for state and local governments and other entities representing public interests to identify and advance such concerns. In a joint decision-making process (among shippers, carriers, and representatives of public interests), perceived risks would be considered when arriving at a final choice among a set of viable options identified by shippers and carriers using the selection factors recommended by this report. Consequently, it was decided not to include perceived risk within the project definition of public safety.
Another issue addressed by the TAG was intermodal shipments. To scope the range of modal and intermodal options to be addressed by this study, the project team proposed to the TAG members that not all intermodal combinations need to be addressed in detail by this study because of the significant exposure resulting from intermodal transfer of the casks. Previous studies have shown that this exposure greatly increases the total exposure and overall risk of shipments. There was general acknowledgment that the intermodal transfer exposure is a very significant factor that tends to favor single-mode transport. Some members, however, felt very strongly that intermodal combinations should be considered for at least two options. First, for the present transportation infrastructure, a highway link between rail and the poten- tial commercial repository site in Nevada would be required. Second, because barge transport is being considered, a barge-rail route would be the most feasible option since cask size

limitation for trucks would make barge-highway of limited practicality. These recommendations were adopted in the study approach.
The issue of weighting radiological and non-radiological risk was also brought up by some TAG members. This has always been a major area of concern in conducting risk assessments for transporting radioactive materials. The issue is whether these components of risk should be given equal weight. Some argued strongly that non-radiological risk should not be included as a primary routing criterion with the same level of importance or weight as radiological risk because it does not address the risk from the nature of the cargo. If non-radiological risk is included on the same level as radiological, then the overall risk of transport is dominated by the non-radiological accident impacts, since non-radiological accidents occur far more frequently than accidents involving a radiological release. Thus, the risk analysis would always find that the mode/route combinations with the lowest general accident rate would be the safest route. Others argued that non-radiological impacts are, in fact, legitimate impacts from shipping radioactive materials and that it would be inappropriate to exclude them. This issue involves significant policy considerations and was not resolved as a part of this study. It was decided by the project team that non-radiological impacts should be included as a component of the project definition of public safety, since it is traditionally included in risk assessment studies. Also, since it is not an objective of this study to assign weights to model route factors, this issue did not have to be resolved to complete the study.
4.1.3 Distinction Between Mode and Route Factors
As the evaluation process developed, only a few factors could be identified that affect mode selection exclusively. For most factors, it was difficult to separate mode from route considerations. Three factors were found to be mode-only selection factors: (1) mode accessibility, (2) cask availability, and (3) amount of material to be shipped. The first two factors are obvious practical constraints in mode selection. Circumstances will dictate the mode to be used if either (1) the waterway or rail system is not accessible from a given location, (2) the facility lacks the capability to handle the heavy raillbarge casks, or (3) a cask needed for a mode is unavailable. These constraints, however, are not necessarily insurmountable; in most cases, they can be overcome if there is sufficient incentive to use a given mode and enough time or funding.
The amount of material to be shipped is the single most important factor that could affect the choice of mode exclusively, because of the substantial difference in payload between truck and rail casks. A rail cask (which is also used for barge transport) has from four to seven times the payload of a truck cask. This ratio may actually increase in future generations of casks (unless an overweight truck cask is developed). This differential has an obvious impact on the number of shipments required for a given amount of material. The number of shipments, in turn, has a direct impact on the overall safety of a shipping campaign.
The rest of the factors on the comprehensive list did not affect either mode or route exclu- sively. The factors had to be considered within the context of the mode and route combination (including intermodal). For example, when comparing the safety of highway and rail between

common origin and destination points, more than one route will usually be possible by either mode (especially for longer shipments). In addition, intermodal combinations with different routing and interchange points are possible. The risk for one rail route may be lower than the risk of a highway route, yet the corresponding risk for another rail route may be higher. Thus, it cannot be concluded that one mode is safer than another without considering the specific route.
Except for amount of material, mode accessibility, and cask availability, all other factors are considered a homogenous group of mode/route selection factors, not mode or route factors separately. The distinction between the mode-only factors (primarily the amount of material) and all of the other modelroute factors will be addressed later in this report.
4.2 DEVELOPMENT OF FACTOR HIERARCHY
Based on the findings of the initial screening of factors and the results of the TAG review pro- cess, a hierarchical matrix was developed with the goal of organizing the enumerated list of factors into different levels for each of the three public safety categories defined in Section 1.3. The rationale for this approach is presented below.
4.2.1 Hierarchical A ~ ~ r o a c h to Mode and Route Factors
During the screening process, any initially identified factor that did not affect public safety was deleted. It became very difficult to eliminate many factors, no matter how inconsequential the factors seemed to be, however, because the applicability of each potential factor depends on the level of analysis to be conducted. For example, excessive curvature along a route cannot be categorically excluded as unrelated to safety. It depends on how detailed the shipper, carrier, or public official intends the routing analysis to be (e.g., local, regional, or national in scope).
To evaluate a route at the local level (e.g., comparing two modelroute alternatives over a dis- tance of 40 miles), decision makers may want to consider such microscopic factors as high- accident locations ("hot spots"), grades, or structures along the route of travel. On the other hand, if the shipment is cross-country for 1,500 miles, the level of analysis needs to be more general. The analyst would not, and probably could not, be able to account for the myriad of microscopic factors. Taken together, however, all three of the microscopic factors mentioned above are components of the infrastructure along the route, which, in turn, is a prime deter- minant of the accident rate. Accident rate, therefore, represents a higher level factor that can be used for regional and national analyses to help select modes/routes. This higher level factor implicitly accounts for the factors below it in the hierarchy, if the accident rate for a given route is derived from data for that route or otherwise reflects the characteristics of that route (i.e., if a national average or other generic rate is not used).
The hierarchical approach to selecting modelroute factors allows adjustment of the level of analysis to the shipment situation. Many of the microscopic factors that have been identified

in the past are valid for very short distances. The details, however, become unmanageable for regional and national shipments. The hierarchy shows that the analysis can be simplified by using factors at the upper end of the hierarchy, since they are fewer and more feasible to mea- sure, and data are more readily available for them. Furthermore, these higher level factors are legitimately representative of the lower level factors, as shown by the hierarchical relationships.
The three categories of impact from the definition of overall public safety (incident-free radiological exposure, potential accident-induced radiological exposure, and potential non- radiological impact) were considered separately in establishing the hierarchical factor matrix. Each factor from the comprehensive list was evaluated to identify which category or categories it affected and how it was related to other factors within that category. These relationships could be divided into two types: (1) factors that were subsets of other factors and (2) factors that could have a direct effect on another factor. An example of the first type would be people in hospitals as a subset of special populations, which is a subset of total population. An example of the second type would be road conditions that could affect the speed of the vehicle, which, in turn, would affect the overall shipment duration, which then affects the amount of incident-free radiological exposure.
4.2.2 Hierarchv for Incident-Free Radiolo~ical Exmsure (Exhibit 6)
The comprehensive list of factors was carefully reviewed to determine which factors affect incident-free radiological exposure during transportation. These factors were then evaluated for interrelationships. The major factors influencing normal dose from radioactive material transportation were the number of people potentially exposed and the amount of exposure time. The rest of the factors are lower-level, but nonetheless important, elements that contribute to and are subsets of these two primary factors.
For people exposed, the major dichotomy is the exposure of the general population versus the occupational population. These are treated as two separate modelroute factors because of their fundamentally different impacts (involuntary, short-term, and distant exposure versus voluntary, longer-term, and close proximity exposure).
Four primary factors were identified that affect modelroute choices because of their influence on incident-free exposure. These are (1) general population exposure, (2) occupational expo- sure, (3) shipment duration, and (4) amount of material. Each of these comprises a number of components or subfactors, which are arranged in a hierarchy and presented in Exhibit 6 .
General population exposure can be segmented into several major subfactors: residential, non-residential, and "special." Residential population represents census population. Non-resi- dential population can be broken down into employment population (which recognizes that time-of-day population varies considerably as people go from home to work and back), tour-

Exhibit 6. Factor Hierarchy for Incident-Free Radiological Exposure
General Ponulation Shinment Duration
Residential Non-Residential
People at work Tourists Pedestrians Shared-facility users in other vehicles at stops Shared-facility users on route
Special Populations Hospitals Schools Prisons Events
Occunational Ponulatioq
On-boardlnearby Crew Escorts
Support Handlers Security Inspectors
Emergency Responders to non-radiological incident
Amount of Material
Number of shipments Packages per shipment Size of cask
Cask availability Waste typeAevel of radioactivity Cask size limitation
Length of route Originldestination distance
Vehicle speed Normal operation
functional classification posted speed operating speed traffic density traffic mix maintenance time of day work rules movement control enforcement time of day restrictions
Delays communication seasonal road conditions hot spots incidentlaccident rate available detours right-of-way maintenance weatherlclimate visibilityllighting conditions
Stops Number of stops
interchanges classifications handlings inspections equipment changes pick-upldrop-off route union vs. non-union rules delays idout of originldestination priority passing locks and dams sabotage
stop times-
ists, people in other vehicles along the right-of-way, and people at stops (see Exhibit 6) . An important related issue for this factor is the distance from the right-of-way to affected populations. Special populations are those people believed to be more sensitive to the effects of radiation (e.g., children) and/or those located in large facilities that would be difficult to evacuate, such as hospitals, schools, prisons and stadiums.
Occ~p~onalpopulat ion exposure consists primarily of two subgroups: (1) on-board crew and nearby escorts and (2) support workers (such as handlers) at the shipment origin, destination, and transfer points, as well as inspectors and security staff. This would also include emergency response and service personnel at the scene of a non-radiological traffic accident or other incident involving a vehicle carrying radioactive material.
Shipment duration, or time of exposure, is the other primary factor for incident-free exposure. Many factors in the comprehensive list could affect shipment duration. These can be categorized into three major subfactors: (1) route length, (2) vehicle speed, and (3) stops

en route. Route length is simply the distance between the origin and destination. Vehicle speed can be influenced by many factors, including both normal operations and delay condi- tions. Some of these include the speed limits, type of transport link, traffic deniity, and time of day. Stops en route include the number of stops and stop times. These can be affected by the number of interchanges, inspections, classifications, breakbulk operations, equipment changes, union rules, fuel stops, and other factors.
It should be noted that several members of the TAG argued that there is an incident-free radiological exposure risk for the environment. This potential impact, however, has never been measured and others in the TAG believed that such an impact, if it exists, is inconsequential. It is not included as a factor in this study.
Amount of material is not a selection factor that affects incident-free radiological exposure on a per shipment basis. Regulatory requirements limit the permissible amount of surface radiation, which does not vary with the size of the package or the mode. The amount of material, however, can become a factor for mode selection, if multiple shipments are necessary. If the amount of material to be shipped exceeds the capacity of a single truck cask, then the shipper may choose to use the larger raillbarge cask which would reduce the number of shipments needed. That, in turn, affects the total incident-free exposure from an entire shipping campaign.
4.2.3 Hierarchv for Accident-Induced Radioloskal Exposure (Exhibit 7)
Seven primary factors affect modelroute choices because of their influence on accident-induced radiological exposure. Two affect the statistical likelihood of accidents: (1) accident rate and (2) trip length. Four affect accident consequences: (1) general population exposure, (2) occupational exposure, (3) sensitive environments, and (4) emergency response. Amount of material is included because it could affect cask payload and the number of shipments required. Exhibit 7 lists the primary factors for accident-induced radiological exposure in which associated subfactors are arranged in a hierarchy.
Using the same procedure as for incident-free radiological exposure, the comprehensive list was scanned to identify factors that could conceivably affect accident-induced radiological exposure. This category of public safety is more complex than the incident-free category, however. First, two major subcategories of factors influence potential accidents that are severe enough to cause a release of material: (1) accident likelihood (probability) and (2) accident consequences. Each of these is composed of a number of other factors. Second, two major types of impact could result from a release: (1) impact on people and (2) impact on the environment. Impact on property is a third type of impact from a release. Finally, emergency response capability must be considered, since it can have a significant effect on the magnitude of consequences following an accidental release.
Accident Likelihood. All factors that could affect the likelihood of an accident during transportation, particularly one that could cause the release of RAM, were identified. A number of these fall under the category of infrastructure. These include the classification of

Exhibit 7. Factor Hierarchy for Radiological Accident Exposure
Accident Rate Infrastructure
Functional classification Opposing traffic separation Grade Curvature Crossings Hot spots Posted speed Clearance Maintenance Structural impediments Wayside detectors
Operating procedures Time of day Work rules
Quality control Training Movement control Hiring practices Enforcement Vehicle maintenance/inspection Licensing Substance abuse enforcement Sabotage and vandalism Human error Weather/climate Seasonal road conditions Visibilityllighting conditions
b g t h of Trip Distance Weather conditions Route restrictions
General Pooulation Residential Non-residential
People at work Tourists Pedestrians Shared-facility users in other vehicles
at stops Shared-facility users in other vehicles
on route Special populations
Hospitals Schools Prisons Events
Bcuoational Pooulation On-boardhearby
Crew Escorts
Support Handlers Security Inspectors
Responders
Sensitive Environment Water supply
Reservoirs Sensitive areas
Wetlands Refuges Sacred tribal grounds
Emereencv Resoonse Preparedness
Training Equipment
Response Proximity Accessibility Capability Communication Time to medical care
Evacuation
emount of Material Number of shipments Size of cask
Cask availability Waste typellevel of radioactivity Cask size limitations
Fire, police, etc.
the right-of-way, grade and elevation, geometry and curvature, structures and clearances along the right-of-way, bottlenecks, and even maintenance practices of the authority responsible for the quality of the right-of-way. Two other subfactors that could contribute to accident likelihood are the operating practices of carriers and quality control. Although these would not normally be considered routing-related factors, they could have an influence on accident potential because they address the issue of quality of carrier. Carrier operating practices, although subject to minimum regulatory rules (such as driver service hours), can be substantially different from one mode to another and from one carrier to another. Quality control can affect accident likelihood and includes internal company procedures and degree of oversight to ensure quality performance. Quality control factors include training, maintenance policy, hiring policy, and drug and alcohol enforcement.
Each of these three factors-(1) infrastructure, (2) operating practices, and (3) quality con- trol-is a major contributor to the accident 1ikeliRood along a given modelroute combination. Thus, accident rate is considered a primary factor. Length of trip is also considered a primary factor, since it is traditionally used in conjunction with the number of accidents to calculate the accident rate (see Exhibit 7).
The amount of material to be shipped affects mode choice and so indirectly affects accident likelihood in two ways. First, accident rate varies with mode. Second, cask capacity affects

the overall number of shipments and, therefore, the likelihood of an accident during the campaign.
Accident Consequences. As intimated above, three major factors relate to this category: (1) general population, (2) occupational population, and (3) environment. Obviously, the population within the proximity of an accidental release of radioactive materials is the major component of accident consequences. The subfactors of general population exposure and occupational exposure were discussed in the previous section. A third major factor under acci- dent consequences is sensitive environments, because of the growing concern about long-term public health effects of contamination of sensitive environmental areas as a result of transportation spills. The lack of a universally accepted definition for "sensitive environments" and the difficulties inherent in determining what can reasonably be avoided during long-distance shipments, however, make this factor difficult to measure. The two principal environmental subfactors initially identified are water supply areas (such as reser- voirs) and sensitive areas (such as wetlands, refuges, and sacred tribal grounds).
A fourth component of accident consequences, emergency response, was identified separately as a primary factor. The emergency response along potential modes and routes of travel can be significant in limiting the consequences of an accident. Several key subfactors determine the level of efficiency of emergency response. Emergency preparedness (training, plans, and equipment) and actual emergency response operations (capability including number of personnel, proximity, and accessibility) are the key factors.
Finally, amount of material to be shipped is also a major determinant of accident consequences, albeit indirectly. As discussed in the last section, the amount of material could affect the size of the cask used and, in turn, the potential amount of material that could be released in an accident.
4.2.4 Hierarchv for Non-Radiolo~ical Im~act (Exhibit 8)
Three primary factors were identified that affect the modelroute choice because of their influence on non-radiological impacts: (1) accident rate, (2) length of trip, and (3) amount of material. Exhibit 8 lists these primary factors for non-radiological impact, arranging associated subfactors in a hierarchy.
The non-radiological impact was handled differently than the first two categories, because its impacts are related to injuries or deaths resulting from vehicular accidents and are unrelated to the radioactive nature of the cargo. It is included as a public safety impact because shipping spent nuclear fuel may necessitate additional trips on the transportation infrastructure, introducing an additional non-radiological traffic impact that otherwise would not exist. This would certainly be true for highway, dedicated train, and probably barge shipments, although probably not for regular train shipments.
The two major factors in this category are (1) accident rate and (2) trip length. Accident rate is represented by a number of other lower-level factors, as discussed earlier. The major sub-

Exhibit 8. Factor Hierarchy for Non-Radiological Impact
Accident Rate Infrastructure
Functional classification Opposing traffic separation Grade Curvature Crossings Hot spots Posted speed Route length Clearance Traflic density Maintenance Structural impediments Wayside detectors
Operating procedures Time of day Work rules
Amount of Material Quality control Number of shipments
Training Movement control Hiring practices Enforcement Vehicle rnaintenance/inspection Licensing Substance abuse enforcement Sabotage and vandalism Human error Weatherlclimate Seasonal road conditions Visibilitynighting conditions
LenHh of Trio Distance Weather conditions Route resbictions
factors include infrastructure, carrier operating procedures, and quality control. Amount of material is also included as a primary factor because it affects both accident rate through mode choice and the number of shipments required.
4.3 IDENTIFICATION OF PRIMARY FACTORS
Exhibit 9 presents the list of primary modelroute factors identified for the three categories of impacts on overall public safety (incident-free radiological, accident-induced radiological, and non-radiological). These factors are primary because they are at the top of the factor hierarchy previously discussed and are representative of a number of subfactors positioned lower in the hierarchy.
The eight primary factors are listed in the first column of Exhibit 9. The applicability of these factors to each of the three components of public safety are given in the next three columns. For example, "general population exposed" includes all of the population along the route of travel for incident-free radiological exposure and the population within an affected area for accident-induced radiological exposure. Population exposed is not considered a primary factor related to non-radiological impact. The other primary factors are treated in a similar manner.
It is apparent from Exhibit 9 that, although eight primary factors are identified, they do not affect all components of public safety. Some of these factors affect two components of public safety, while others affect only one component. To be identified as a primary factor, at least one component of public safety must be significantly affected.

Exhibit 9. Primary Mode and Route Factors
Incident-Free Accident-Induced Non-Radiological Primary Factor Radiological Exposure Radiological Exposure Impact
General population exposed People along route People in area affected by Not a primary factor accident
Occupational population People moving and handling People moving material and Not a primary factor exposed material responders
Environment exposed Not a factor Environment in area affected Not a factor by accident
Shipment duration Length of time material is Not a factor transported
Not a primary factor
Accident rate Not a factor Likelihood of accident Likelihood of traffic releasing material accident with injury1
fatality
Trip length Not a primary factor Distance material moves Distance material moves
Emergency response Not a factor Length of time for trained Not a primary factor responders
Amount of material* Number of shipments required Number of shipments required Number of shipments
* Amount of material is the only primary factor identified that could dictate &by itself. This is because of its impact on the number of shipments required, given the cask payloads of highway vs. rail transport modes.
Furthermore, each of the primary factors may be measured differently from one component of public safety to another. An example is measuring accident rate. For accident-induced radiological exposure, the likelihood of a release-causing accident would be an appropriate measure, while for non-radiological impacts, the likelihood of an injury or fatality-related traffic accident (without considering release) would be a more relevant measure.
Finally, the amount of material is listed as a primary factor because of its effect on the number of shipments required, which is perhaps the key factor for mode selection. The number of shipments required is determined by the quantity of material to be shipped and the cask payload. A rail cask payload can be four to seven times that of a legal weight truck cask. Thus, roughly four to seven times as many truck shipments are required to move the same amount of material as moved by rail or barge. This difference must be taken into account when comparing the relative impact on public safety among the three modes.
It should be noted that it also is possible to include more than one cask per shipment for rail and barge shipments. If there is enough material to be moved at one time, it is theoretically possible to move ten, twenty, or more casks (if they were available) in a single rail or barge shipment. Shipments by rail or barge from different locations could be consolidated to obtain multiple casks per shipment.
To facilitate the comparison of mode and route factors on a shipment-by-shipment basis with- out the complications of considering the effects of multiple casks per shipment, this study addresses mode and route factors only on a single cask per shipment basis. When the specific circumstances of a particular shipping campaign are known, the effect of multiple casks per

shipment by rail or barge should be the subject of systems analyses and trade-off studies. Based on the results of such studies, the shipper should then consider the effect of multiple casks per shipment in the selection of the mode and route.
4.4 REPRESENTATIVE UNITS OF MEASURE FOR THE PRIMARY FACTORS -
The primary factors listed in Exhibit 9 are presented on a "generic" level. As stated earlier, even the best modehoute factor is really of little use in selecting mode/routes if it cannot be measured. To conduct an actual modelroute comparative analysis, it is necessary to identify the precise item that is to be compared. The project team has identified the most representative unit of measure for each primary factor. These are presented in Exhibit 10. These units of measure will serve as the basis of the case study analysis presented later in this. report.
Exhibit 10. Representative Units of Measure for Primary Mode and Route Factors
Primary Factor Representative Units of Measure
General Population Exposed Census population within designated bandwidth along route in milesikilorneters Occupational Population Exposed Number of drivers and other transport workers involved during shipment
Environment Exposed Number of environmentally sensitive areas within designated bandwidth along route
Shipment Duration Transit time in hours (including stops)
Accident Rate Number of fatalities based upon fatal accident rate and route length (fatal accident rate) Trip Length Trip distance in miles
Emergency Response Average time to respond for qualified units in minuteshours Amount of Material Number of shipments required based upon cask payload

Page intentionally left blank.

5. IDENTIFICATION OF PRIMARY MODE AND ROUTE FACTORS BY MODELING RISK OF TRANSPORTING RADIOACTIVE
MATERIALS
Chapters 3 and 4 describe the development of a comprehensive list of modelroute factors that represent diverse interests identified through an exhaustive review of work and literature in the field. A qualitative evaluation of these factors resulted in the development of a factor hierarchy for each component of public safety, from which a set of primary modelroute factors was identified. This chapter presents a modeling approach to identify primary mode and route factors. Modeling the relationship between various factors that contribute to nuclear transportation risk serves two purposes: (1) it allows a comparison of factors developed in this way with the factors developed using the hierarchical approach described in Chapters 3 and 4, and (2) it helps establish the nature and type of relationship between each primary factor and the three components of risk that make up the project definition of public safety.
5.1 ELEMENTS OF RISK
As noted previously, risk is composed of incident-free radiological exposure, accident-induced radiological exposure, and non-radiological impact. These three components of risk can impact different population groups, which can be categorized as follows:
Off-link population - people residing, working, or otherwise congregating in areas within the zone of radiation impact along the route of a spent nuclear fuel shipment
On-link population - people in other vehicles along the route
Crew - transport crew, on-board security and emergency response personnel, and inspectors (within the immediate vicinity of the cask)
Population at stops - other transportation workers, including emergency responders during an accident and people near the stops (away from the immediate vicinity of the cask)
Handling personnel - workers at an intermodal transfer facility.
5.2 MODEL DEVELOPMENT
The models described below are derived with the following simplifying assumptions:
The applicable models are mode-specific; separate coefficient values are generated for each mode, resulting in a unique model for each respective mode.

The width of incident-free radiation effect zones is a constant for each mode.
An individual shipment contains a single cask; multiple cask shipments are considered.
Only risks to handlers at intermodal transfer facilities are considered.
Detailed derivations of the model equations and nomenclature presented in this section appear in Appendix F.
5.2.1 Incident-Free Radiolo~ical Risk Model
The total incident-free radiological risk from a single shipment on a specified mode between origin and destination consists of the sum of the component risks to each population group:
R,:=R, + R , + R , + R , + R ,
where:
RIFE = total risk (in p.erson-rems) due to incident-free exposure R, = risk to off-link population R, = risk to on-link population R3 = risk to crew & = risk to population at stops R, = risk to handlers
Model formulations for each of the component risks are as follows.
Off-Link Population. Off-link population risk is a function of the duration of exposure of each person along the route and is expressed by
R, = a, x number of persons average duration of over the route exposure of each individual 1 (2)
That is:
where:
= the coefficient for off-link population risk = mean population density over the route within the exposure range of significant
radiation = overall shipment duration from origin to destination, excluding stop times

On-Link Population. The on-link population risk value, R,, is also a function of the duration of exposure of each individual and is represented by
of people average duration of % = a 2 x exposed on route exposure of each individual 1 (4)
with:
number of number of on-link average number people = vehicles passing a x of people aboard
exposed point per hour on -link vehicle
average distance on the passing or same average duration - - lane with simcant radiation effects
of exposure mean relative velocity between cask vehicle and other vehicles
The above equations reduce to
% = 82 T t:/~
where:
a, = coefficient for on-link population risk T = on-link traffic density (vehiclesthr) L = route length t, = overall shipment duration from origin to destination, excluding stop times
Crew Risk. Crew risk is a function of the duration over which each crew member is exposed to radiation from the cask and is represented by
number of crew % = % . [ and inspectors x exposure of each individual 1 average duration of (8)
Crew risk is then given by
% = a3 *am" t,
where:
a, = coefficient for crew risk N,,, = average number of persons on-board the vehicle t, = overall shipment duration from origin to destination, excluding stop times
The value of a, will vary with mode because the distance between the crew and the cask will be different.

Risk to Populadion ad Stops. The total risk at various stops can be represented by
number of avg. number of avg. duration stops over x persons exposed x
route length of exposure per stop
It is assumed that the number of stops is directly proportional to the distance t ra~eled ,~ and that at each stop only a certain number of persons is exposed (based on an average population at stops and a constant radiation affected area by mode). Hence
where:
a, = coefficient for stop risk L = route length
Handling Risk. Handling risk is assumed to arise only in the case of intermodal transfers when casks have to be handled by transportation personnel. Both the number of handlers and- the average duration of handling are assumed to be constant. Hence, the risk itself is considered to be a constant, irrespective of the distance of transportation. This is represented by
where:
a, = coefficient for handling risk H, = Boolean variable (1 for intermodal shipments;
0 otherwise)
Overall Incident-Free Radiological Risk. By summing the component risks, overall incident- free radiological risk can be specified as
The terms are measured in different units and are, therefore, not dimensionally consistent. The product of each coefficient and the parameters in that term have units of radiation dosage expressed in person-rems, however.
aThe assumption of number of stops being proportional to distance may not apply for very short distances.

The simplified equation for overall incident-free radiological risk (equation 13) contains the same factors previously identified in Exhibit 9 as primary factors affecting incident-free exposure. These factors include general population (p and T), occupational population (N,,, and H,), and shipment duration (t,). Route length (L) is not listed in Exhibit 9 as a primary factor, but it is obviously an important component of shipment duration. Furthermore, the equation mathematically shows the type of relationship that each variable (factor) has with overall incident-free radiological risk.
5.2.2 Accident-Induced Radiolo~ical Risk Model
The risk associated with radiation exposure from releases of radioactive material in transpor- tation accidents can be represented as follows:
RM = probability of an consequence of release accident release (in person -rerns)
(14)
Using the above equation and assuming that the principal radiation exposure pathway to the population is by dispersing radioactive material (radionuclides), risk can be expressed as
where:
b = coefficient for accident-induced radiological risk
p = mean density of population potentially exposed to the effects of the dispersing radioactive cloud (including occupational population)
S, = mean traffic accident rate over the entire route (probability of an accident per unit distance in a given shipment)
L = route length
In deriving equation 15, the probability of release of radioactive material given that an acci- dent occurs is assumed to be a constant within each mode.
Equation 15 contains three of the factors that were presented in Exhibit 9 as primary factors affecting accident-induced radiological risk. These are the accident rate (S,), the route length (L), and the population at risk (p). Again, the type of relationship between these factors and the manner in which each contributes to overall risk is illustrated by the model.
5.2.3 Non-Radiological Risk Model
The risk to the population from vehicle accidents that do not involve the nature of the cargo is represented as
RNR = probabfir of a x length of route serious accident
Using the above equation and assuming that the measure of non-radiological exposure is fatalities, the risk can be expressed as
where:
S,, = mean traffic fatal accident rate over the entire route (probability of an accident resulting in at least one fatality per unit distance for a given shipment)
L = route length
The resulting risk is expressed as expected number of fatal accidents.
Equation 16 above relates directly to Exhibit 9, which identified fatal accident rate and trip length as primary factors contributing to non-radiological risk.
5.3 RELATIONSHIP OF RISK MODELING TO MODEIROUTE FACTORS
The relationships described in this chapter present a method for evaluating the risk of ship- ping spent nuclear fuel for different modes through association with key mode and route factors. Their development was based on the physical relationships between key factors that affect component risks. The values of the model coefficients in the preceding equations can be estimated using appropriate statistical estimation techniques.
Exhibit 11 provides a matrix that summarizes the relationship between key modelroute factors identified through development of the risk models presented in this chapter and the three types of risk. As noted, incident-free radiological risk is derived from consideration of general population, occupational population, trip (route) length, and shipment duration (excluding stop times). This comes from the need to consider these factors in various relationships that describe component risks related to off-link, on-link, crew, stop, and hand- ling exposures. Accident-induced radiological risk is directly related to general population, accident rate, and trip (route) length as primary factors. Non-radiological risk is derived from consideration of accident rate and trip length.

Exhibit 11. Relationship of Risk Modeling to Primary ModeIRoute Factors
- pp ppp
General Occu~ational Accident Trip Shipment Population Population Rate ~ e n & h Duration
Incident-Free Radiological Risk x x x x
stop (4
Handling (x)
Accident-Induced Radiological Risk
Non-Radiological Risk x x
Collectively, the fundamental relationships, as established, share five of the eight primary fac- tors identified in Chapter 4: general population exposed, occupational population exposed, shipment duration, accident rate, and trip length. Amount of material, emergency response, and environment exposed are the remaining factors potentially linked to public safety that are not explicitly represented in the model formulations. These effects can be incorporated into the process, however, using the following approaches.
Amount of material is implicitly represented in the prescribed approach as a single shipment of a single cask. Assuming linearity and using a post-processing activity once the relationship between primary factors and safety is established on a per shipment basis, this factor can be included in the risk models. The relative payload capacity becomes the determinant of the number of shipments required for comparative analysis.
Proximity to effective emergency response potentially lowers accident-induced radiological risk by reducing the number of people exposed and duration of exposure. This is not considered in the models, as presented. Knowledge of the location of qualified responders with respect to the route being evaluated, however, can provide a measure of this effect.
Environmentally sensitive areas, like population groups, can be exposed to radiation. Model development could be extended to environmental areas by measuring the size and character of the affected area and predicting the associated consequences. This development is dependent on obtaining information about these areas and subsequently establishing the fundamental relationships that would apply.
Each of these three factors, amount of material, emergency response, and environment exposed, will be addressed again later in the report.

Page intentionally left blank.

6. CASE STUDY AND ANALYSIS OF FACTORS
The case study was designed to accomplish three objectives: (1) demonstrate the feasibility of measuring and estimating the previously identified modelroute factors in a complex analysis environment, (2) evaluate the variability of modelroute factors across various modes and routes, and (3) evaluate in more detail the specific relationship of the modelroute factors with public safety. To address these objectives, transportation risk management models were used to measure primary factor values and then to calculate the risks of transporting a single shipment (truck or raillbarge cask) between selected origins and destinations by various modes. Case study results were also used to estimate values for the coefficients of the radiological risk equations presented in Chapter 5. These equations were then used to conduct a sensitivity analysis in which the relative effect of each of the primary factors on the risk estimates was examined.
6.1 DEVELOPMENT OF ANALYSIS FRAMEWORK
The analytical environment for achieving the case study objectives required selecting sample modes and routes thought to be representative of spent nuclear fuel shipments and subse- quently deriving and analyzing factor and risk values for each case. An integrated approach, combining two previously developed transportation risk assessment tools, was used to develop factor inputs and calculate risk measures across several mode and route combinations for each OID pair. Model coefficients were then estimated using the data for each case.
6.1.1 Selection of Sample Routes
To develop the case study, a series of possible shipment OIDs was selected that represents historical or anticipated campaigns. The selection criteria included actual spent fuel shipment origins and likely destinations with access to all three modes and intermodal shipments; differing route lengths, infrastructures, and populations; and travel in different parts of the country. An effort was made to include routes that passed through large urban areas, as well as routes that were predominantly rural. The shorter-distance routes were felt to be representative of those that would be used for intrdinter-utility shipments, while the longer- distance routes could be considered typical of those to be used for transport to either monitored retrievable storage or long-term storage facilities.
The following modes were considered in the case study: (1) highway, (2) regular (scheduled) trains, (3) dedicated trains, (4) waterway, and (5) intermodal. Regular and dedicated trains were considered separate modes because characteristics of both train configurations and operations are significantly different. All intermodal shipments were grouped together because they involved waterwaylrail combinations where the waterway movement and intermodal handling activities were common characteristics.

For each O/D pair, analyses were separated by mode; within each mode, analyses were per- formed for several routes. The criteria used to select prospective routes included identifying both economical routes (those that minimize travel time) and routes that offer a significant reduction in exposure by avoiding heavily populated areas. By using this approach, a wide range of candidate routes were represented, and the characteristics of direct and more circuitous routings could be examined. Routes were also selected on the basis of combined consideration of travel time and population exposure, as well as population exposure and acci- dent likelihood. Additionally, minimizing the number of interchanges was considered in rail route selection.
The ~ a z ~ r a n s " routing and risk management model was used in the selection of candidate routes on the basis of multiple criteria. Appendix D contains additional information on HazTrans. An optimization routine within HazTrans permits selection of preferred routes on the basis of minimizing trip distance, travel time, population exposure, accident likelihood, or weighted combinations involving two or more of these criteria. By applying this process, up to three basic routes were identified for each mode and O/D and up to two alternative variants were identified for each basic route. In cases where different criteria resulted in the selection of the same route, fewer routes were analyzed. Each identified route was carefully reviewed for transport feasibility prior to its inclusion in the analysis. Exhibit 12 summarizes the 65 unique mode and route combinations generated from this process. l 1
Each sample route required collecting primary factor values and calculating associated risks. This necessitated the development of a hybrid analysis environment using two assessment models. HazTrans was used to derive the primary factor values and non-radiological risks, while Radtran 4 was used to calculate the radiological risks based on inputs from HazTrans. Appendix E contains additional information on Radtran 4.
6.1.3 Develo-t of P r i m Factor Values
The primary factors for which quantifiable data were readily available included amount of material, emergency response, general population, occupational population, accident rate, trip length, and shipment duration. The development of quantitative measures for environmentally sensitive areas was not practicable, given the time and resource constraints on this project. Appendix G contains a detailed description of the measures and assumptions used to develop primary factor values.
10HazTrans is a registered trademark of Abkowitz & Associates, Inc., Nashville, Tennessee.
11 The 65 mode and route combinations developed for the case study are not a random sample. Consequently, the results derived from them are indicative, rather than demonstrative.

Exhibit 12. Summary of Routes Used for Case Study
Origin1 Total Number of Length Mode ~estination Pairs Routes
Short Water 2 2
Short Rail 2 4
Short Highway 2 6
Moderate Water 2 2
Moderate Watermail 2 4
Moderate Rail 4 14
Moderate Highway 4
Long Watermail 2
Long Rail 2
Long Highway 2
TOTAL 65

The HazTrans system was used to measure several primary factor values. HazTrans contains an intelligent mapping system'with truck, rail, barge, and intermodal analysis capability. These transportation networks are defined using geographic information system (GIs) coordinates, permitting direct association of the transportation system with the surrounding population and location of emergency response capability. Furthermore, characteristics of each individual route segment are stored within HazTrans and can be extracted to derive trip lengths, travel times, and accident rates. Since the version of HazTrans available to this project maintains only the principal highway, rail, and waterway networks, new links were defined to connect the transportation network to shipment origination or receiving points, as necessary.
6.1.4 Development of Risk Values Usin? Radtran 4
Radtran 4 is a risk assessment tool developed by DOE to calculate comprehensive radiological consequences from route-specific input. It was used in the case study to evaluate the radiological consequences of incident-free transportation, as well as the radiological risks from vehicular accidents during transportation. Radtran 4 contains mathematical models of radia- tion exposure in different transportation environments for several different radioactive materials. In this case study, default parametric values for spent nuclear fuel were used, as were standard cask sizes for each mode.
The five components of incident-free radiological risk are (1) crew risk, (2) handler risk (for intermodal only), (3) off-link (or surrounding) population risk, (4) on-link (or shared-facility user risk), and (5) stop risk (people exposed during stops). The four included components of accident-induced radiological risk are (1) groundshine (from external exposure to deposited particles), (2) inhalation (from breathing in particles), (3) resuspension (from inhalation of particles deposited and then resuspended), and (4) cloudshine (from external exposure to a passing cloud of radioactive particles). All risks are calculated in terms of person-rems.
Radtran 4 requires input data beyond mode- and route-specific parameters for the model to perform its function. These inputs were defined to maximize consistency in treating various modes and routes within the Radtran 4 analytical framework and were subsequently verified in discussions with selected shippers and carriers. Appendix G contains a detailed description of the input and assumptions used to perform these analyses using Radtran 4.
It might be noted that Radtran 4 has a built-in upper bound on radiological exposure. In Radtran 4, it is assumed that transportation workers and members of the public will receive no more than the maximum radiological dose rate permissible by regulation.
To perform the analyses, the Radtran 4 route-specific option was used, which allows the ana- lyst to include segment-specific information about length of segment, vehicle speed, population density, traffic density, accident rate, and land use for every segment along the specified route. A special interface protocol between HazTrans and Radtran 4 was developed for this study to accommodate the transfer of route-specific data from HazTrans into Radtran 4 input formats.

In this study, shipments were assumed to move by exclusive-use vehicles (e.g., trailer, railcar, barge) requiring no storage during transit. Also, because ingestion risk calculations have been disabled within the version of Radtran 4 used for the analysis, the associated risk could not be obtained.
Since Radtran 4 does not model non-radiological transport risks, these were derived outside of the Radtran 4 methodology using HazTrans and national accident statistics. Non-radiological risk was measured as expected fatalities resulting from the force of a vehicular accident. National statistics have been compiled for each mode from which fatal accident rates can be derived that are relevant for this study. The derivations are explained in Appendix G.
6.2 CASE STUDY RESULTS
For the case study, estimates of both non-radiological and radiological risk were derived. An overview of these results is presented in this section. Additional detail on the results can be found in Appendix G.
The case study results are subject to a couple of limitations. First, the dataset used was not a randomly chosen sample. Consequently, the results are directly applicable only to the 65 generic modelroute combinations for which they were calculated. Second, the results are only as good as the data and models used in their derivation. While every effort was made to ensure that the data and models used were appropriate and were appropriately applied, a complete and thorough validation of the results was not possible. As a consequence of these limitations, care should be exercised in the interpretation of the case study results.
6.2.1 Estimates of Non-Radiological Risk
The number of fatalities per shipment was the non-radiological risk measure that was estimated for the case study.
The estimated number of fatalities per shipment was calculated using HazTrans and fatal accident rates by mode that were taken from the literature. For the highway estimates, heavy truck fatal accident rates were used. For regular trains, fatal accidents for rail were used. These were adjusted, because only a portion of the fatal accidents per train would be attributable to the spent nuclear fuel shipment that the train was hauling. The adjustment assumed that a typical regular rail consist had 70 cars and that, when hauling a spent nuclear fuel shipment, 4 of those cars would be associated with that shipment. For dedicated trains, fatal accidents for rail were used. For waterway movements, fatal accident rates for barges were used. These rates were converted from ton-mile to barge-mile assuming that there are 15 barges in an average consist and that each barge carries 1,500 tons.
Exhibit 13 presents the estimates of the number of fatalities per shipment for each OID pair by mode. All of the estimates in Exhibit 13 are for single cask shipments. Truck casks are assumed to hold 2 PWR (pressurized water reactor assemblies), while raillbarge casks are

Exhibit 13. Estimated Number of Fatalities (Per Single Cask Shipment)
OrigidDestination Mode Pair
Highway* Dedicated Train* Regular Train* Waterway Intermodal
O/D Pair 1 5.32E-06 2.35E-04 1.29E-05 2.64E-05 --- 5.93E-06 7.05E-06
OID Pair 2 9.24E-06 3.63E-04 2.00E-05 2.61E-05 --- 1.21E-05 1.11E-05
O/D Pair 3 1.74E-05 8.12E-04 4.46E-05 1 SME-04 -- 1.90E-05
O/D Pair 4 2.92E-05 1.51E-03 8.30E-05 1.10E-04 -- 3.43E-05 1.97E-03 1.09E-04 3.27E-05
OID Pair 5 2.45E-05 1.24E-03 6.80E-05 --- 1.73E-04 2.54E-05 1.25E-03 6.89E-05 1.73E-04 2.68E-05
OID Pair 6 4.59E-05 2.76E-03 1 S2E-04 -- 3.42E-04 5.98E-05 3.14E-03 1.72E-04 3 A2E-04 4.92E-05
OID Pair 7 6.07E-05 2.94E-03 1.62E-04 -- 3.49E-04 7.42E-05 2.90E-03 1.60E-04 3.49E-04 6.28E-05 2.76E-03 1 S2E-04
O/D Pair 8 1.16E-04 5.07E-03 2.79E-04 -- 7.58E-04 1.42E-04 5.23E-03 2.88E-04 7.58E-04
*Multiple fatality values are shown for those OID pairs where multiple routes were identified.
assumed to hold 14 PWR. Where there was more than one route identified for a modal movement between a particular OID pair, Exhibit 13 presents separate estimates of the number of fatalities for each route. Where a particular OID pair has multiple routes for several different modes, the routes for each mode may be different.
As can bee seen in Exhibit 13, the lowest estimated number of fatalities was for movements of spent nuclear fuel by highway. The next lowest was the estimated number of fatalities resulting from movements by regular trains, followed by those resulting from movements by waterwaylintermodal. The highest estimated number of fatalities was for movements of spent nuclear fuel by dedicated train. Thus, for single cask movements, highway would appear to be the safest way to transport spent nuclear fuel, followed in descending order of safety by regular trains, waterway lintermodal movements, and dedicated trains.
6.2.2 Estimates of Radiological Risk
Component and overall radiological risks per shipment were estimated for incident-free exposure and accident-induced exposure. These estimates were derived using Radtran 4.
Exhibit 14 presents the ranges for the radiological risk estimates derived for the case study. All of the estimates in Exhibit 14 are for single cask shipments. As before, truck casks are assumed to hold 2 PWR, while raillbarge casks are assumed to hold 14 PWR.
As indicated by the figures in Exhibit 14, the radiological risks due to incident-free exposure tend to be significantly greater than those due to accident-induced exposure. The overall risk for incident-free exposure is estimated to range from 562 to 2 millirems, depending on mode and route, while the overall risk for accident-induced exposure is estimated to range from 11 millirems to well below 1 millirem.
The dominant component of incident-free risk appears to be crew exposure, which is estimated to range from 344'rnillirems to less than 1 millirem. The primary components of accident- induced radiological risk are groundshine and resuspension exposure.
The crew is the population category generally at highest risk during the movement of spent nuclear fuel. The projected amount of non-incident radiation exposure of an individual crew member for a complete trip can be estimated by dividing the total crew exposure estimates for each of the 65 modelroute combinations by the estimated number of crew required for each modelroute combination (for estimates of the total incident-free risk for the crew, see Exhibit G-5; for estimates of the total number of crew, see Exhibit G-4). The exposure estimates per crew member calculated in this fashion range from 0.04 millirem to 172 millirems. It might be noted that these levels are well below the current Federal guidance for occupational exposure, which is 5,000 millirems per individual per twelve month period.12 Furthermore,
- --
12 EPA, "Radiation Protection Guidance to Federal Agencies for Occupational Exposure, " January 1987.
6-7

Exhibit 14. Range of Estimated Component and Overall Radiological Risks (Per Single Cask Shipment)
Type of Risk Range of Risk Values
(person-*ems*)
Incident-Free Risks.
Component Risks
Crew 344
Handlings? 49
Off-Link 44
O n - L i
stop
Overall Risk
Component Risks
Groundshine
Inhalation
Accident-Induced Risks
Resuspension 3 * Cloudshine * rt
Overall Risk 11 *
*All values have been rounded to the nearest millirem.
thcident-free risk for handlings was calculated only for intermodal movements of spent nuclear fuel. No handlings were assumed to be required for highway, regular train, or dedicated train movements.
*Less than 0.5 millirems.

these levels are also well below the 2,000 millirems per individual per twelve month period guideline currently recommended by the International Atomic Energy Agency (IAEA). l3
As might be expected, the general population will experience a significantly lower risk than the crew during the movement of spent nuclear fuel. In total, the exposure for the general population, taken as a whole,-will be between 2 and 210 millirems per trip. While the impacted population will vary depending on the route, no single individual is expected to receive more than a fraction of a millirem for any given trip. This level of exposure is consistent with the 100 millirems per year for any single member of the public that is currently proposed by the EPA as new guidance for federal agencies.14
6.3 VARIABILITY OF PRIMARY MODEIROUTE FACTORS AND RISK VALUES
The process of selecting modes and routes to enhance public safety only makes sense if, in fact, transportation risks vary significantly among the choices available. Similarly, the use of the identified primary factors to pick preferred routes only makes sense if their values vary significantly from mode to mode, route to route for a given OID pair. This section describes the results of an assessment of the variability of both risk and primary factors across the modelroute alternatives examined in the case study.
6.3.1 Varlatlon Factor V a w . . .
This segment of the case study analysis focused on the extent to which values of primary factors vary by mode and route for a given origin and destination. If the variation is not significant, then the primary factor cannot be a discerning factor in determining preferred shipment alternatives. Exhibit 15 presents statistics associated with the values of each primary factor for each OID pair. The mean value and percentage variation about the mean are given for all modelroute options between a given origin and destination. Averages for all eight OID pairs are also presented.
In reviewing Exhibit 15 (and subsequent tables), it should be noted that "number of crew" is synonymous with occupational population. In addition, shipment duration has been reported as "average speed" for ease of presentation.
As indicated by the percentage variation about the mean, the values of primary factors fluctuate considerably across the case study sample for a given origin and destination. To illustrate from Exhibit 15, the mean of population density for OID pair #1 was 73.27 persons per square kilometer. The lowest population density for potential modelroute combinations
131A~A, "Regulations for the Safe Transport of Radioactive Material, 1996 Edition."
14~nvironmental Protection Agency, "Radiation Protection Guidance to Federal Agencies for Exposure of the General Public," Memorandum for the President, Draft, April 23, 1996.

Exhibit 15. Variation of Primary Factor Values by O/D
Origin/Destination All
Factor Pair 1 Pair 2 Pair 3 Pair 4 Pair 5 Pair 6 Pair 7 Pair 8 Pairs*
Length (km)
mean 194.34 305.75 645.43 11 17.30 955.82 min (% of mean) 88 62 87 72 83 max (% of mean) 1 17 128 118 142 132
Population Density (per/krn2)
mean 73.27 149.05 218.31 81.28 49.53 min (% of mean) 33 0 24 34 14 max (% of mean) 162 263 164 199 204
No. of Crew
mean 3.83 3.83 4.20 3.75 4.37 min (% of mean) 52 52 48 53 46 max (% of mean) 261 261 238 267 223
Avg Speed (kmlhr) (includes stop times)
mean 21.85 21.79 19.78 21.08 18.92 min (YO of mean) 11 14 18 28 29 max (% of mean) 179 179 201 188 213
Accident Rate (acclveh-km for highway and waterway; acclcar-km for rail)
mean 3.16E-06 7.68E-07 2.03E-06 1.69E-06 1.93E-06 min (% of mean) 21 40 18 22 19 max (% of mean) 303 149 324 448 462
Average Emergency Response Distance (km)
mean 882.46 330.87 331.89 557.58 387.64 min (% of mean) 96 97 88 80 96 max (% of mean) 102 109 106 109 101
No. of Cases: 6 6 5 8 9
* The statistics in this column were derived by treating each pair as a single observation. The mean, min., and max. values represent averages of the statistics presented in the first eight columns of this table. Where regular and dedicated route values are identical, only one was used in the caluclation of the mean.

between this OID pair was only 33.29 percent of the mean, or 24.39 persons per square kilometer. The highest population density was 162.42 percent of the mean, or 119.01 persons per square kilometer. This shows the substantial variation in population density between OID pair #1, depending upon the modelroute combination. It is evident from these results that primary factor values can change considerably by mode and route for the range of expected shipment distances, shipment purposes, and locations in the United States.
6.3.2 Variation in Risk Values
Exhibits 16 through 18 present the mean and percentage variations in case study values for components of incident-free and accident-induced radiological risks and non-radiological risks. The results presented in these exhibits indicate that the risk values can be expected to vary considerably by mode and route for a given shipment origin and destination. Incident-free radiological risk was found to vary an average of 23 % below and 176 % above the mean, for the eight pairs studied. Accident-induced radiological risk and non-radiological risk varied even more. Therefore, choice of mode and route does appear to have a powerful effect on the overall risks.
The tables also lend themselves to some meaningful conclusions concerning the relative magnitudes of risk associated with various shipment characteristics. For example, incident- free radiological risk tends to dominate the overall radiological risk associated with spent nuclear fuel shipments based on this case study. Also, although comparisons between radiological and non-radiological impacts are generally not advisable due to differences between acute and long-term health effects, it is apparent that non-radiological safety considerations are a significant aspect of overall operational safety involving the shipment of spent nuclear fuel.
6.4 RADIOLOGICAL RISK MODEL ESTIMATION
The previous discussion has demonstrated that there is reason to believe that both primary factor values and associated risks will fluctuate considerably by mode and route for each OID.
To further investigate the relationship between primary factors and radiological risks, the case study data was used to estimate coefficients for the fundamental risk equations, presented in Chapter 5, for each mode. This process had two basic objectives: (1) to test the statistical confidence with which each previously identified factor contributes to incident-free and radiological risk, respectively, and (2) to allow for subsequent conduct of sensitivity analyses to ascertain the relative importance of primary factors in determining these risks.
Details of both the derivation of the equation coefficients from case study data and the tests that determined the statistical significance of these numeric constants are given in Appendix H. Results of the statistical tests show a good overall fit between the model equations and the observed (case study) data, and the estimated coefficients are statistically significant, with rare

Exhibit 16. Variation of Incident-Free Risk Values (Person-Rems) by O/D
Origin/Destination Ail
Factor Pair 1 Pair 2 Pair 3 Pair 4 Pair 5 Pair 6 Pair 7 Pair 8 Pairs*
Crew
mean min (% of mean) rnax (% of mean)
Handlings
mean rnin (% of mean) rnax (% of mean)
Off-Link
mean min (% of mean) rnax (% of mean)
On-Link
mean min (% of mean) rnax (% of mean)
Stop
mean rnin (% of mean) rnax (% of mean)
Total
mean rnin (% of mean) rnax (% of mean)
No. of Cases:
0.00E+00 0.00E+OO O.OOE+OO nla d a nla nla d a nla
* The statistics in this column were derived by treating each pair as a single observation. The mean, rnin., and max. values represent averages of the statistics presented in the first eight columns of this table.

Exhibit 17. Variation of Accident-Induced Radiological Risk Values (Person-Rems) by O/D
Origin/Destination All . .
Factor Pair 1 Pair 2 Pair 3 Pair 4 Pair 5 Pair 6 Pair 7 Pair 8 Pairs* '
Ground
mean min (% of mean) max (% of mean)
Inhalation
mean min (% of mean) max (% of mean)
Resuspension
mean min (% of mean) max (% of mean)
Cloudshine
mean min (% of mean) max (% of mean)
Total
mean min (% of mean) max (% of mean)
No. of Cases:
* The statistics in this column were derived by treating each pair as a single observation. The mean, min., and max. values represent averages of the statistics presented in the first eight columns of this table. Where regular and dedicated route values are identical, only one was used in the calculation of the mean.

Exhibit 18. Variation of Non-Radiological Risk Values (Fatalities) by O/D
Factor All
Pair 1 Pair 2 Pair 3 Pair 4 Pair 5 Pair 6 Pair 7 Pair 8 Pairs*
Total
mean 4.88E-05 7.36E-05 1.99E-04 4.85E-04 3.39E-04 7.84E-04 9.08E-04 1.67E-03 5.63E-04 min (% of mean) 1 1 13 9 6 7 6 7 7 8 max (% of mean) 482 493 407 407 370 400 324 317 400
No. of Cases: 6 6 5 8 9 9 1 1 1 1 8
* The statistics in this column were derived by treating each pair as a single observation. The mean, min., and max. values represent averages of the statistics presented in the first eight columns of this table.
exceptions. Therefore, the equations developed in Chapter 5 do a relatively good job of representing the relationship between primary factors and risk estimates, at least for the case study data.
6.5 SENSITIVITY ANALYSIS
A sensitivity analysis was conducted to determine the relative influence of each of the primary factors on radiological risks for each of the modes. The model equations with the estimated coefficients were used to calculate both incident-free and accident-induced radiological risks for two values of each primary factor.15 The base value was that used in a given case study run (i.e., it was the unique combination of mode, route, and O/D pair for the case) and the second value was the base value increased by 10 percent. The factors were adjusted one at a time to determine their singular effects. Exhibit 19 presents the results of the sensitivity analysis. The last two columns show the percentage of increase in the risk caused by the 10 percent increase in the factor values.
Trip duration was shown to have the largest effect on the incident-free radiological risk of all the factors. This is probably a result of the fact that so many of the incident-free risk component terms include trip duration, such that it has multiple effects on overall incident-free risk. Average number of crew is another major factor for highway and regular trains.
15 The preferred analytic technique would be to vary the value of each primary factor, one at a time, and rerun the Radtran 4 assessment for each modelroute combination in the case study. Resource constraints, however, precluded this approach.

Exhibit 19. Sensitivity Analysis
Mode Variable Changed
% of Increase % of Increase % of Increase in in Variable in Incident- Accident-Induced
Free Risk Radiological Risk
Highway
Regular Trains
Dedicated Trains
Waterway
Intermodal
N,,, - Average number of crew t, - Average hip duration T - Average traffic density L - Average route length p - Average population density S, - Average mean accident rate
N,,, - Average number of crew t, - Average hip duration T - Average traffic density L - Average route length p - Average population density S, - Average mean accident rate
N - Average number of crew t, - Average trip duration T - Average traffic density L - Average route length p - Average population density S, - Average mean accident rate
N - Average number of crew t, - Average trip duration T - Average traffic density L - Average route length p - Average population density S, - Average mean accident rate
N,,, - Average number of crew t, - Average trip duration T - Average traffic density L - Average route length p - Average population density S, - Average mean accident rate

For the highway and rail modes, accident-induced radiological risks change at a disproportionately higher rate in comparison with changes in primary factor values. This suggests that emphasis should be placed on reducing accident rate, trip length, and general population exposure when shipping via highway and rail modes, a not altogether unexpected conclusion.
The results of the waterway and intermodal sensitivity analyses for both incident-free and accident-induced radiological risk are inconclusive. This may be due to the small sample sizes for these two transport categories.
6.6 EMERGENCY RESPONSE
A preliminary evaluation of emergency response coverage suggests that a slight inverse relationship may exist between qualified emergency response and accident-induced radiological risk.
6.7 SHIPPING CAMPAIGNS
The total amount of material to be shipped in a campaign was found to be a principal determinant of the mode with the lowest risk. The risk estimates in both the case studies and the risk model equations were for a single cask movement from origin to destination. Often, however, the amount of radioactive material to be moved from one place to another is great enough to require many shipments (i.e., a shipping campaign). In such circumstances, the number of shipments needed is a primary determinant of overall risk. The much larger capacity of raillbarge casks means that a rail or barge shipping campaign will require far fewer shipments than highway transport of the same material. To examine the effects of cask size on overall risks of a shipping campaign, risk estimates from the case study were adjusted to reflect the respective capacities of raillbarge and truck casks (to be conservative, a ratio of 5: 1 was used as representative). Results show that use of the raillbarge cask is warranted (if practicable), when the amount of material to be shipped in a campaign exceeds the capacity of one or two truck casks. For all three types of risk, use of regular trains for a campaign is safer than trucking, essentially the reverse of the case study findings for a single shipment (see Exhibit 20). Also, the risks for dedicated trains (and barges) compared to trucks are more favorable on a campaign basis than on a shipment basis.
6.8 CASE STUDY ANALYSIS SUMMARY
This case study was designed to (1) explore the ease with which primary factor values and risk estimates can be derived for modelroute combinations, (2) assess the variation in primary factor values and risk estimates for each modelroute, and (3) evaluate the interaction among primary factors and their statistical significance in determining the risks to different segments of the population.

Exhibit 20. Relative Modal Risk for a Single Cask Movement vs. a Shipping Campaign
Incident-Free Radiological Risk Per Cask Movement dedicated < regular - highway Per Campaign dedicated < regular < highway
Accident-Induced Radiological Risk Per Cask Movement highway < < regular = dedicated Per Campaign dedicated = regular < highway
Non-Radiological Risk Per Cask Movement highway < regular < < dedicated Per Campaign regular < highway < < dedicated
Note: "Per Campaign" risk reflects an adjusment in which the risk calculated per cask movement (i.e., shipment) in the case studies for highway was multiplied by a number representative of the ratio of millbarge to truck cask capacities. A value of 5 was used (range = 4-7). Accordingly, the relative rankings for a campaign reflect the need for five times more truck cask movements to transport a given amount of material, compared to rail or barge transport.
A < B means that A is less than B A - B means that A is approximately equal to B A < < B means that A is much less than B A = B means that A is equal to B
Findings related to these objectives are summarized below. These conclusions should be reviewed in the context of the analytical environment used in the case study. The extent to which factors inherent in HazTrans, Radtran 4, and the overall methodology affect generaliza- tion of these findings should be taken into consideration.
6.8.1 Ease of Deve lo~ in~ Primary Factor and Risk Values
The case study clearly demonstrates that information describing primary factors can be assembled and that quantifiable measures of these values can be developed. In some instances, the methods used to develop factor values must rely on surrogate measures that have established validity based on prior studies.
6.8.2 Variations in Primarv Factor Values and Risk Estimates
Variations in primary factor values and corresponding risk estimates are expected if primary factors are discerning factors in determining preferred routes. The case study results indicate that primary factor values fluctuate considerably across mode, route, and OID. Similar variations were experienced in corresponding radiological and non-radiological risk values. It is evident from these results that primary factor values can be expected to change considerably by mode and route for different shipment lengths, shipment types, and locations in the United States. This underscores the need to evaluate those mode and route factors that significantly impact public safety.
6.8.3 Interaction of Primarv Factors and Risks
Incident-free radiological risk tends to dominate the overall radiological risk associated with spent fuel shipments; in most instances, incident-free radiological risk is much larger than

accident-induced radiological risk. The significance of various factors in contributing to incident-free risk varies by OID. Groundshine and resuspension exposures, however, are consistently the primary components of accident-induced radiological risk. It is also apparent that non-radiological safety considerations are a significant aspect of spent fuel shipment safety.
Results of the sensitivity analysis indicate that accident-induced radiological risk is strongly influenced by population, exposure, trip length, and accident rate for highway and rail operations. Trip duration has the most profound effect on incident-free radiological risk, although the other primary factors are also significant contributors.
With respect to shipping campaigns, the amount of material to be shipped was found to be a principal determinant of the lowest risk mode. The use of regular trains for a shipping campaign is safer than trucking for all three risk categories. This is the reverse of the case study findings for a single shipment. Finally, compared to trucks, the risks for dedicated trains and barges are more favorable for a campaign than for a single shipment.

7. OVERALL ASSESSMENT OF PRIMARY MODEIROUTE SELECTION FACTORS
An overall assessment of the primary modelroute factors identified in this study is presented below. Following a brief overview of the background and approach used to select these primary factors, each primary factor is discussed in detail.
7.1 SUMMARY OF IDENTIFICATION AND SELECTION OF PRIMARY MODEIROUTE FACTORS
Generally, the selection of both mode and route by shippers and carriers has been based largely on operating efficiency, customer service needs, and economics. Increasingly, however, shippers of all hazardous materials, including high-level radioactive waste and spent nuclear fuel, have become more attuned to the need to carefully assess the relative safety of each mode before making a selection. Hazardous material carriers, especially for radioactive materials, have been subject to various federal and state requirements on routing for the last decade. Both shippers and carriers would benefit from the identification of a common set of - mode and route selection factors.
The first approach employed in this study was a hierarchical approach that was based on identifying the most important modelroute factors through a review of all factors that had previously been considered or proposed as important for selecting modes or routes. To ensure that all viewpoints would be considered, a comprehensive candidate list of factors was developed. Each factor was qualitatively evaluated in terms of criteria such as impact on safety, interrelationships among the factors, measurability, and feasibility of implementation. This qualitative evaluation resulted in several important findings:
Mode and route factors are difficult to evaluate separately. They must be considered together for a particular modelroute combination and then compared with mode and route factors for other modelroute combinations.
The only separable mode choice factors found were cask availability, mode accessibility, and amount of material to be shipped. Cask availability and mode accessibility could be eliminated as constraints on modal choice in most cases, given sufficient time and resources. Amount of material is perhaps the single most important factor in mode selection because it directly impacts the number of shipments required. If there is enough material to warrant use of the larger raillbarge cask, then the number of cask shipments can be significantly reduced which, in turn, cuts the overall risks. Moreover, if the amount of material makes multiple-cask shipments possible, risk can be reduced still further when rail or barge modes are used.
There are many legitimate modelroute factors. The validity and importance of each factor is ultimately dependent upon the level of analysis to be conducted.

A hierarchy of modelroute factors can serve as a decision-making tool to help shippers and carriers. The hierarchy allows the analyst to see the relationships and interdependencies among the many potential factors.
A hierarchy allows the analyst to adjust for the level of analysis to be conducted. The fac- tors at the highest end of the hierarchy are at a level of detail suitable for a national level of mode and route analysis. The lower end of the hierarchy is more suitable for a state or local level of analysis.
The hierarchical approach used by the project team led to the identification of eight primary modelroute selection factors. These factors are (1) general population exposure, (2) occu- pational population exposure, (3) environmental exposure, (4) accident rate, (5) shipment dura- tion, (6) trip length, (7) emergency response, and (8) amount of material. These eight factors are believed to be the most suitable as national-level modelroute selection factors.
The second approach used in this study was to develop models showing the relationships of various factors to the risks of transporting radioactive materials. These risk models were based on fundamental physical relationships. The factors developed in the risk modeling effort were shown to be quite consistent with the primary factors identified using the hierarchical approach.
A case study was developed with multiple origins and destinations and representative routes. The case study helped to examine the following important elements of modelroute selection: the variability of factors and corresponding risks from mode to mode and route to route, the feasibility of measuring and evaluating the primary factors, and the nature and type of relationship between each primary factor and the three risk components of the project definition of public safety.
7.2 EVALUATION OF PRIMARY MODEIROUTE FACTORS
The framework for conducting the overall evaluation of factors included the following criteria: (1) the nature and degree of impact on public safety, (2) the degree of variability from mode to mode and route to route, (3) the ability to measure, and (4) the feasibility of implementation. Ability to measure involves the degree of confidence in the representativeness of the factor, its degree of accuracy, and the difficulty of measuring it. Feasibility of implementation involves the relative difficulty of obtaining the required information and the related institutional and political considerations. The purpose of the overall evaluation of factors is to bring together the results of all the analyses conducted in this project relative to each primary factor.
7.2.1 General Population Exposed
This primary factor includes people along the route of travel who are at risk from the transportation of high-level radioactive waste and spent nuclear fuel. Population along the route has a direct effect on two components of the project definition of public safety: (1)

incident-free radiological exposure from normal transportation and (2) exposure to the release of radioactive material resulting from a severe accident. The relationship between population and these two measures of public safety is direct. The greater the population along the route of travel, the greater the potential for incident-free radiological exposure and the greater the potential for a radiological release to have human health consequences. All other things being equal, the mode or route that involves the lowest population would be the safest route. Of course, all other things are not usually equal, and population has to be considered in context with other factors.
Incident-free exposure of the general population depends on the total number of people poten- tially affected, the proximity of the people to the route of travel, and the time of exposure. Results from the case study indicate that the (on-link and off-link) incident-free radiological risk for the general population is much lower than occupational risk for all modes. In previous quantitative risk studies, incident-free exposure to the general public has also been estimated to be low. As the distance from the radioactive material increases, the potential health effects fall off dramatically. In most cases, people in the "general population" category are hundreds to thousands of feet from the right-of-way. Nevertheless, when selecting a mode or route of travel, it is important to take into consideration the population within a reasonable distance from the right-of-way.
The number of people near the right-of-way is also important in measuring accident-induced radiological risk. If there is an accident severe enough to cause a release of material, the population exposed would depend on the size of the release and the speed and direction of the wind. The location and specific population affected by such an accident would be very difficult to predict beforehand. From a mode and route comparison standpoint, the only variable that could be measured would be the population within a certain bandwidth of the right-of-way that could be subject to exposure from such an accident. If a release-causing accident did occur, the general population along the route would be likely to have a much greater potential exposure than occupational workers because of the greater number of people in this category potentially at risk.
There is little question that population should be included as a modelroute factor. The real question is how best to account for it. Ideally, the process would be to count all individuals within a certain bandwidth along a right-of-way for each route and then compare the results for all of the routes under consideration. The population count would include everyone in all three categories of general population identified in the incident-free hierarchy in Exhibit 5: residential, non-residential, and special. That is, the count would include all people who are at their residences within the bandwidth, as well as all the people at work, all of the pedestrians, all of those in other vehicles (shared-facility users), tourists, all those in facilities such as hospitals, schools, and prisons, and people at special events, such as concerts and sports events. All of these segments of the population should be included in the population count.
Obviously, such a count cannot actually be done for every potential route under consideration by a shipper or carrier. The next best approach would be to make general estimates for each

of the most important components of population, using surrogates where appropriate. In this case, shippers and carriers might make estimates of residential population, employed population, and traffic density (as a surrogate for people in other vehicles), and might count the number and ascertain the capacities of special facilities (as a surrogate for the actual number of people in these facilities). Most of this information is available or can be derived from other data available at the local level. This may be feasible for detailed route assessments for short distances. For longer distance shipments and for considering a variety of modes and routes, however, the only feasible measure is the census population count.
With the availability of the Census Bureau population data, the ability to measure residential population along any route is very good. This information is available in spatial (geocoded) form, and can be used to estimate the exposed population within a specified distance of the routes under consideration. Although Census Bureau population data are limited to residential population, the number of potentially exposed people obtained from this information can be considered representative of the entire population along the route in most cases, particularly at the primary factor level. Limitations to this approach include the under-representation of employment and tourist populations in urban and other areas and over-representation of residential populations in suburban areas during different times of the day, week, and year. Because these variations are dynamic and time-dependent, it is impractical to determine a more accurate estimate of potentially exposed population for a screening of candidate options, especially for longer O/D distances with a number of alternatives. Obtaining such information would be extremely time consuming and resource-intensive. Local and state entities, however, might provide information of this nature pertinent to the limited number of options that survive an initial screening by shippers and carriers. This would allow the final choice to reflect special circumstances, such as the presence of several large national or state parks along a route with a very low census (residential) population.
In the past, the ability to collect population information has been limited. Counting people along different routes, particularly the longer routes, has been cost prohibitive. The availability to shippers and carriers of off-the-shelf geographic information systems (GIS) that use census population data, either directly or indirectly, has increased, however. These systems can now be used to obtain population counts and exposures along all defmable modes/routes.
In addition to having a significant impact on public safety, population can be highly variable from mode to mode and route to route and, therefore, can be a clear mode or route discriminator. The case study results presented in Exhibit 15 illustrate the variability of most primary factors, including general population. The range of values of the population density (surrogate measure for the general population) is very broad for each O/D pair evaluated.
Although every potential modelroute alternative must be evaluated in detail, there are a few general observations that can be made across modes. The first observation is that there are always tradeoffs involved in selecting either mode or route to minimize population. Highway offers the most flexibility to avoid large population centers because of the large number of route alternatives, although the best highways are the Interstate system highways, which

usually connect urban centers. Selecting highway routes to avoid major cities could have other undesirable effects, such as increasing shipment duration and trip length (effects that will be discussed below). It is usually more difficult to follow a population avoidance strategy with rail because rail lines traditionally connect major cities and there are fewer alternative routes available than for highway. Barge shipments follow waterways, of course, and generally offer a low-population alternative, if they can be used.
In summary, the use of general population as a modelroute selection factor is highly desirable because of its direct and significant impact on public safety, variability between modelroute alternatives, and reasonable measurability using readily accessible census data.
7.2.2 Occupational Population Exposed
This factor includes workers who may be in proximity to a cask containing spent fuel or high- level radioactive waste at any time during the entire shipment cycle. This obviously includes transport workers, such as the crew and the cask handlers. It also includes other groups who could be subject to exposure by nature of their occupation, such as escort vehicle personnel, security guards, inspectors and other enforcement officials, and even emergency responders. The potential exposure to the occupational population is a major consideration for safety because of the close proximity of this group to the container. It has a major effect on both incident-free radiological risk and accident-induced radiologicd risk.
Most of the support groups (handlers, security, etc.) within the occupational population receive a one-time exposure for each shipment. Handling risk is especially important for the intermodal shipments, as demonstrated in the case study. The analysis showed that handling exposure can be a significant percentage of total intermodal incident-free risk and that the intermodal incident-free risk is higher than that for any other mode.
The vehicle crew receives exposure throughout the shipment cycle. Previous risk studies have found that incident-free radiological exposure to the crew is the single largest component of the overall risk of transporting high-level radioactive waste and spent nuclear fuel. The case study results from this report support this for highway, dedicated trains, and regular trains. Off-link population is the largest factor for waterway shipments and container handling for intermodal shipments, as noted earlier.
There are important differences in the components of occupational risk from mode to mode. The truck crew is much closer to the package than either the rail or barge crew for a typical shipment and, therefore, will receive a higher dose on a per-mile basis. The rail or barge movement, however, may require longer distances, which increases the exposure of those crews, relative to truck. Also, there are generally more and longer stops by rail and barge. Shipment by rail usually requires at least one interchange between rail carriers. Shipments by barge usually require a modal interchange to get the cask to and from the barge loading facility. Stop times can have a significant effect on incident-free radiological exposure.

The variability in occupational exposure is illustrated in Exhibit 15. The surrogate measure for occupational exposure was simply the number of crew. This does not usually vary within a mode. The fact that occupational exposure can vary by route can be illustrated by considering number of crew along with shipment duration (a combination of trip length and average speed from Exhibit 15). When the values for these two are taken together, the substantial variability in occupational population exposure from one modelroute alternative to another can be seen.
The ability to measure occupational population is excellent. The number and proximity of crew and the number and proximity of package handlers are known for each mode. The number and proximity of people at stops and the duration of stops are less certain, but can be reasonably estimated based on carrier experience. Because of the predominance of the vehicle crew exposure, the best single measure that is representative of incident-free dose to the occupational population is probably the number of crew involved in the shipment.
The practicality of implementing occupational exposure as a modelroute selection factor is considered excellent. Data collection would be simple and the cost of data collection would be nominal, since carriers and shippers are already familiar with crew and handler operations.
One major philosophical issue in using occupational exposure as a rnodelroute selection factor is risk acceptance. It can be said that transport workers voluntarily accept the risk of exposure. On the other hand, the general public does not voluntarily accept the risk of exposure from the transport of radioactive materials. It is argued that the objective of modelroute selection should be to minimize the involuntary risk to the general population as opposed to the voluntary risk to the occupational workers. The manner in which this issue is treated could have a significant impact on modelroute selection. Past studies have shown the incident-free dose to the vehicle crew to be much larger than the cumulative dose to the surrounding population for a typical shipment. The vehicle crew dose is dependent primarily on shipment duration. If both occupational and public exposure were included together, the best modelroute alternative would usually be the shortest and most direct one in order to minimize the time of exposure to the vehicle crew. This could result in a modelroute alternative that has a much higher surrounding population than if public exposure were considered separately. Because of the significant difference in the types of exposure between public and occupational groups, it was decided to treat each one separately in this study.
In summary, occupational population is highly desirable as a modelroute factor because it is a major contributor to the overall level of incident-free radiological exposure, it can be easily and accurately measured, and it can vary considerably by mode and route.
7.2.3 Shi~ment Duration
Shipment duration strongly affects the safety of radioactive material transportation because it has a direct relationship with incident-free radiological exposure. The longer the material is in transit, the longer the exposure of the crew and the general public. This is illustrated by the

incident-free risk model presented in Chapter 5 and by the results of the sensitivity analysis presented in Chapter 6 .
This factor is determined by the combination of many other factors, as shown in the Exhibit 6 hierarchy. The major considerations include the route length, vehicle speed, and the number and length of both delays and stops en route. Shipment duration is measured in units of time. In past studies, the surrogate used for shipment duration has usually been just the trip length. In some instances, this length has been combined with average vehicle speed to obtain expo- sure time. In others, the length has been used exclusively to compare miles of exposure or some equivalent measure. This approach has neglected the effect of stops and variations in vehicle speeds, which can vary substantially between different modes and their corresponding routes.
The ability to measure shipment duration is very good. Shippers and carriers know the esti- mated time required to ship material from one location to another for their own scheduling and billing purposes. This would include reasonable estimates for planned and unplanned stops. Unforeseen delays en route, such as those that might result from adverse or bad weather or road conditions, create some uncertainty in the ability to estimate shipment duration.
Shipment duration can vary significantly from mode to mode and from route to route and, thus, can be a good modelroute selection discriminator. As a general rule, highway offers the fastest movement among the three modes and waterway is the slowest. Rail movements usually involve more stops en route than highway, unless it is hy dedicated rail. The case study results in Exhibit 15 illustrate the variability of shipment duration when the results for trip length and average vehicle speed are combined.
7.2.4 Accident Rate
The greater the likelihood of an accident, the greater the potential for an injury to the crew and for the release of radioactive materials and corresponding exposure to the public. Thus, accident likelihood has an important impact on the safety of transporting radioactive materials. A measure of accident likelihood is a necessary component of estimating both accident-induced radiological risk and non-radiological risk. This is clearly illustrated by the risk models estimating both accident-induced radiological and non-radiological risks in Chapter 5. The accident rate, as a primary modelroute factor, represents many other factors that could have an influence on the likelihood of an accident. The quality, condition, and design of the highway, railway, or waterway infrastructure all have an impact on the potential for an accident. The operating procedures and quality control of the carrier also have an impact on the potential for an accident, and these can vary fiom mode to mode. Weather and seasonal conditions have an impact. All of these subfactors are listed in the hierarchy in Exhibit 6 . Over time, the interplay of all these various components is reflected in the accident experience for each right-of-way. The accident rate is considered the best available broad measure of all these factors.

The variability of accident rates can be significant for different modetroute combinations. This is illustrated by the high variation and minirnum/maximurn range for accident rates for the case study results shown in Exhibit 15. Much of the difference in accident rates by highway is reflected in the classification of the highway. The Interstate highways usually have lower accident rates than other highways because they are built to the highest design standards in terms of geometry, grade, roadway structures, guideway separation, access control, etc. The accident rates of various Interstate highway segments, however, can be significantly different, and some non-Interstate highways can have lower accident rates than the Interstates.
The ability to measure this factor is excellent at a gross level of analysis, but becomes more difficult for a more detailed level of analysis. Accident rates are available at different levels of specificity and quality. National averages are available for different highway classifications. Average waterway accident rates are available for specific water systems, such as the Mississippi River system. These national averages may be sufficient at the primary factor level. The use of national, or even regional, accident rates, however, may not be sufficient to differentiate between route or mode alternatives. The more specific the accident rate is to the road, rail, or water segment of interest, the better. Some segment-specific accident rates for highway and rail are available in some routing models today. The quality and uniformity of accident data can also vary from state to state. The analyst should be careful to use the best available and most consistent data.
Accident rates for specific rail links (accidentsltrain-mile or car-mile) are generally unavailable 'outside the owning railroad, because traffic volume over a given link is considered proprietary information. Usable accident rate information can be developed by using data on shipment origins, destinations, and interchange points (such as can be obtained from the Rail Waybill Sample) to generate traffic flow patterns for the rail network. From this, traffic density by rail link can be obtained and then combined with FRA accident data by nearest rail station to estimate link accident rates. Large databases have been developed by consulting organizations using this approach.
The type of accident rate employed is also important. Generally, the accident rate that reflects the most severe types of accidents is preferred, since only the most severe accidents could result in a release from the casks used to transport high-level radioactive waste and spent nuclear fuel. In most cases, this will be the fatal or injury-producing accident rates, as opposed to the overall vehicular accident rate. Also, the accident rate that most closely represents the type of operation of interest is preferred. For highway, this would be the high-level radioactive waste or spent nuclear fuel motor vehicle accident rate. Unfortunately, this level of specificity is not found in accident statistics. The best accident rate that is most often available is the general truck driver fatal accident rate.
The practicality of using accident rate as a modelroute selection factor depends on the level of analysis. If the analysis is national or regional, where national average accident rates can be used, then carriers and shippers will have little difficulty in implementing the criterion. As the level of analysis becomes more local in nature, the limited availability of existing data and the

relatively high cost of obtaining new data make implementing the criterion much more difficult.
In summary, the accident rate is a necessary modelroute selection factor. It is needed to pro- vide an estimate of the likelihood of an accident for both accident-induced radiological and non-radiological risk. It is broadly representative of other numerous factors that influence accident likelihood. It is also relatively easy to measure, since the accident histories of the mode or route under consideration are usually available, although one must exercise care in the type and quality of data to be used.
Trip length affects all three components of public safety: incident-free radiological risk, accident-induced radiological risk, and non-radiological risk. It affects incident-free risk because it is a major component of shipment duration. All other things equal, the shorter the trip the lower the incident-free radiological exposure and risk. Trip length affects both accident-induced radiological and non-radiological risk because it is a component of the accident rate.
The major tradeoff for trip length is, of course, population and sensitive environments. The most direct route often is the one through the highest population areas or the greatest number of environmentally sensitive areas.
The ability to measure trip length is simple and straightforward. Most of the highway, rail, and waterway distance references are now readily available. Trip length can vary substantially by mode and by route between almost all origins and destinations. This is shown in Exhibit 15 for the set of rautes selected for the case study.
7.2.6 Environment
This factor is related to public safety in that a radiological release resulting from an accident could have significant adverse impacts on sensitive environmental areas located close to the right-of-way. Contamination of sensitive environments, such as major drinking water reservoirs, could have direct public health consequences.
This is a factor that has not traditionally been considered in most previous routing and envi- ronmental studies relating to radioactive material transportation. A comprehensive treatment of all potential public safety impacts from mode and route selection, however, requires that sensitive environmental areas be included. The question to be addressed is what constitutes a "sensitive environmental area". Some would argue that every water source, including all streams, rivers, ponds, and lakes should be considered sensitive to radioactive material releases. Some argue that all agricultural lands should be considered sensitive since contamination would potentially enter the human food chain.

Although there are good arguments that contamination of such broad measures as bodies of water and agricultural land do relate to public safety, they would be of little use as mode or route discriminators, since virtually every mode and route crosses some body of water or travels through some agricultural area.
There was a wide difference of opinion among the TAG participants on the inclusion of environment as a modelroute factor. There did seem to be some agreement that if it were to be included as a factor, that it be limited to something that could reasonably be measured and that could actually vary among routes. The initial definition that was arrived at was a designated area that had been set aside by an official agency for some special reason, such as drinking water reservoirs, wetlands, or refuges. Sacred Indian tribal grounds were added as another possibility. It was agreed that the definition of "sensitive environments" for the purposes of differentiating modelroute alternatives needs to be assessed in greater detail.
Once the sensitive environment has been defined, another question is how to measure it. Should evaluation of the modelroute alternative be based on (1) the total number of areas crossed, (2) the average distance from sensitive areas, (3) the total square footage of the sensitive areas within a certain bandwidth, or (4) something else entirely? The answer to this question is currently uncertain. As with the definition of sensitive environments, the appropriate measures to be used for sensitive environments will need more study.
In summary, environment is believed to be an important modelroute selection factor because environmental contamination can impact public safety. Its usefulness as a modelroute discrim- inator, however, is somewhat questionable, because almost all routes go through or by areas that could be regarded in some sense as environmentally sensitive. A generally acceptable definition for this factor needs to be developed, and the appropriate measures for this factor, its variability, and its interrelationship with other modelroute factors all need to be more intensively studied.
7.2.7 Emer~encv Response
The relationship of emergency response to public safety is in the potential mitigation of the consequences of an accidental release of radioactive material in transit. The extent of mitigation is difficult, if not impossible, to predict or measure. Nevertheless, emergency preparedness and response is considered an integral component of the overall system for safe transport of radioactive materials, and it is desirable to be able to account for it in modelroute selection. Response to a radioactive material release is much more sophisticated than that for most other emergencies and requires specialized training. Consequently, the greater the proximity or availability of trained responders to a modelroute alternative, the more desirable it is.
Emergency response is another factor that has not been evaluated in much detail in terms of route or mode selection in the past. It is included as a secondary factor for the U.S. DOT routing guidelines for general hazardous materials. There are many facets to emergency response, and there was considerable discussion of this factor by the TAG. Two major facets

of emergency response relative to modelroute choice came out of the discussion: proximity and capability. The first important element is the location of responders relative to the route of travel. How long would it take for responders to arrive at the scene of a transportation accident involving a release of radioactive material? The second major consideration is the level of capability (e.g., training and equipment). The consensus of the TAG seemed to be that the measure for emergency response should be based on the response time required by specially trained emergency responders, not just first responders. "Specially trained" responders were equated with DOE radiological response teams and other qualified units. This is acceptable for generic analysis, but for specific campaigns other trained teams need to be considered.
Currently, the required response time for qualified responders can be determined using existing software packages that incorporate routing algorithms. The number of qualified responders are limited, and their capabilities and locations can be geocoded into these packages. First responders consist primarily of local fire departments and law enforcement agencies. The feasibility and cost of obtaining the necessary information to include first responders in the evaluation would be prohibitive. Therefore, the measure for this factor is recommended to be the maximum amount of time for a specially qualified responder to arrive at any point along the potential route of travel.
The ability to effectively measure emergency response is possible using the required response time for qualified responders as the metric. As mentioned, computerized routing routines can determine the maximum time from the location of a qualified responder to any point on a network. The locations of these responders are available from the appropriate federal and state agencies and from most potential shippers.
The variability of emergency response from one modelroute alternative to another is difficult to assess. This factor could also be relatively difficult to implement, since the cost of necessary data or software could be high. An attempt was made in the case study to evaluate the variability in this factor using average response distance from DOE response facilities as the measure (see Exhibit 15). l6 Differences using that measure for the emergency response factor among alternative routes were small compared to the other primary factors.
A special analysis was also conducted of the correlation between average response distance and route length and population density. Some degradation in emergency response capability (i.e., greater response distances) was noted for lower risk routes.17 Such routes tend to be longer, pass through more rural areas, and be farther from DOE response centers. This finding implies that the ability to provide adequate emergency response may be compromised when a supposedly "lower risk" route is chosen. This aspect should be addressed by shippers
16 Alternative measures could be distances to qualified (1) state and local units, but locational information is not as readily acquired, and (2) units maintained by the shipper and receiver. The data collection approach used is described in Appendix G.
17 Remember that the risk estimates in the case study did not consider the quality of emergency response.

or carriers, either by reassessing the routing decision or by identifying locations where improvements in response coverage are needed for an otherwise preferred route and undertaking to see that those improvements are made.
In summary, emergency response is believed to be an important consideration for modelroute selection, because it could reduce radiological accident consequences. Its value, however, would depend on agreement on a suitable unit of measure that is reasonably accessible and cost effective.
If feasible, rail or barge transport for a given shipping campaign could entail significantly lower risks than highway transport, assuming there was enough material to warrant use of the larger raillbarge casks. Since the payload of a raillbarge cask is four to seven times that of a highway cask, it would generally take that times as many shipments to move the same amount of material by highway. Consequently, truck transport of a given amount of RAM usually entails more radiological and non-radiological risk overall than the other modes. Furthermore, if there is sufficient RAM to be transported at one time, multiple-cask shipments by train or barge would reduce the risk even more.'' Nevertheless, the analyst should still conduct a careful evaluation of modal and routing alternatives to be sure of the relative safety of a particular mode, even considering the cask payload differential.
The variability of this factor is substantial-from amounts too little to warrant use of a single raillbarge cask to enough for a multiple-cask train or barge shipment, such as from an interim storage/consolidation facility to the repository. The ability to measure is obviously excellent, since the quantity to be shipped has to be known by the shipper; the difficulty of data collection is low.
7.3 SUMMARY ASSESSMENT OF PRIMARY MODEIROUTE FACTORS
Exhibit 21 identifies each of the primary modelroute factors and summarizes the results of the overall assessment of each factor. These factors are identified as the most important for consideration by shippers and carriers in selecting modes and routes for shipping high-level radioactive waste and spent nuclear fuel.
No attempt has been made to weight these factors or combine them into an easy-to-use form- ula. As stated in Chapter 1, the primary purpose of this study, as directed by Section 15 of
18 Non-radiological and incident-free radiological risks are both reduced. Non-radiological risk is reduced because the risk of operating the vehicle (railcar or barge) is distributed among more casks, reducing the risk per cask proportionately. Incident-free radiological risk is reduced because each cask shields a portion of other cask's radiation.

Exhibit 21. Overall Assessment of Primary Factors
Degree of Impact on Factor Types of Risk Affected Overall Public Safety Variability Ability to Measure Feasibility to Implement
General Population Exposed
Occupational Population Exposed
Shipment Duration
Accident Rate Y c. W
Trip Length
Environment
Emergency Response
Amount of Material
Incident-free radiological Accident-induced radiological
Incident-free radiological Accident-induced radiological
Incident-free radiological
Accident-induced radiological Non-radiological
All three types of risk
Accident-induced radiological
Accident-induced radiological
All three types of risk
Major factor for accident-induced radiological risk. Contributes to incident-free radiological risk, but much lower than occupational exposure. People at stops represent biggest risk from incident-free radiological exposure within general population.
Largest component of total incident- free radiological risk for all modes due to crew exposure.
Major impact on incident-free radiological risk; influences times of exposure for both general and occu- pational populations.
Major component of estimating probability of radiological and non- radiological accidents. Major impact on shipment duration, which affects incident-free radiological risk. Major component of accident rate, which affects radiological and non-radiological accident risk Long-term health effects from water and land contaminated by an accidental release.
Can reduce consequences of accidental releases
Major determinant of modal risk. Cask capacity affects number of
Can vary substantially by mode and route
Varies substantially by mode (no. of crew) and by route because of shipment duration Can vary substantially by mode and route
Can vary by mode and route
Can vary substantially by mode and route
Uncertain, not evaluated in case study
Difficult to estimate; average DOE response distance varies little Number of shipments for a campaign varies
Excellent for residential; poor to good for others
Excellent
Excellent
Fair to excellent, varies with geographic detail and route specificity Excellent
Difficult, but depends on unit of measure
Depends on unit of measure
Excellent
Data collection moderately difficult
Data collection easy; "risk acceptance" issue
Data collection easy; compliance easy
Data collection moderately difficult; quality of data can be a problem Data collection easy
Data collection dificult; com- pliance difficult; depends on definition of units Data collection difficult; com- pliance difficult
Data collection easy; cask handling capability, modal access
shipments needed. substanti&~by mode may dictate-mode

HMTUSA, was to identify important factors and to assess their degree of impact on public safety. Weights, which reflect the relative importance of each primary selection factor, could simplify the selection of modes and routes by focussing attention on the more important factors. They could also provide the basis for a "formula" that could produce a figure of merit for each modelroute combination. There are several very serious difficulties, however, that prevented an attempt to weight the primary factors. Weighting depends first and foremost on the importance (weight) assigned to the three main categories of risk (incident-free radiological risk, accident-induced radiological risk, and non-radiological risk), and that is really a policy matter, which is outside the scope of this study. An additional complication is that the influence each primary factor has on the types of risk varies from mode to mode, as was demonstrated in the sensitivity analysis conducted as part of this study.
Assigning weights is obviously a complicated process that requires extensive analysis, as well as public input and deliberation. That effort could not be undertaken, given the limited resources for this study. This report does, however, provide information on the manner in which these factors contribute to the risk of transporting radioactive materials. This can serve as a basis for the way that these factors are combined to make modelroute decisions.19
19 The December 1993 version of this report was provided to the general public for review and comment. The preceding document has incorporated the comments that were received, where appropriate. The DOT response to the comments on the December 1993 version of the report can be found in Appendix I.

8. REFERENCES
Association of American Railroads. 1975. "General Committee, Operating Transportation Division, Policy Statement. " July 25, 1975.
Association of American Railroads. 1993. "Recommended Railroad Operating Practices for Transportation of Hazardous Materials. " Circular No. OT-55-B, October 19, 1993.
Columbus City Code. Hazardous Materials Transportation. Chapter 255 1.
Federal Highway Administration. 1980. "Implementation Package: Guidelines for Applying Criteria to Designate Routes for Transporting Hazardous Materials," U.S. Department of Transportation, FHWA-IP-80- 15, November 1980.
Federal Highway Administration. 1992. "Transportation of Hazardous Materials: Highway Routing. " Notice of Proposed Rulemaking, Docket No. MC-92-6, 57 Federal Register 169, August 31, 1992.
Hazardous Materials Transportation Uniform Safety Act of 1990. Public Law 10 1-6 15, 104 Stat. 3244 (16 November 1990).
ICF, Inc. 1989. "Nuclear Waste: Is There a Need for Federal Interim Storage?" Monitored Retrievable Storage Review Committee. November 1989.
Midwest Research Institute. 1990. "Present Practices of Highway Transportation of Hazardous Materials. " Washington, DC: Federal Highway Administration.
Mullen, Saah, Miriam J. Welch, Bradford, W. Welles. 1986. "HM- 164: Radioactive Materials; Routing and Driver Training Requirements. " U.S. Department of Energy, SAND-85-7 160, January 1986.
Prowler, S. 1993. "Mixed Bag of Trouble Dashes Hope for Quick End to Northeast's Supply Pinch." Butane-Propane News (May 1993): 27-30.
Research and Special Programs Administration. 1981. "Highway Routing of Radioactive Materials." Final Rule, U.S. DOT, Docket No. HM-164, February 1, 1981.
Research and Special Programs Administration. 1989. "Guidelines for Applying Criteria to Designate Routes for Transporting Hazardous Materials. " U.S. Department of Transportation, DOTIRSPAIOHMT-89-02, July 1989. I
Research and Special Programs Administration. 1992. "Guidelines for Selecting Preferred Highway Routes for Highway Route Controlled Quantity Shipments of Radioactive Materials. " U. S. Department of Transportation, DOTlRSPAlHMSl92-02, August 1992.

Stock, J. R. and B. J. LaLonde. 1977. "The Transportation Mode Decision Revisited." Transportation Journal 17, No. 2: 51, 59, Winter 77.
Stock, 9. R. and D. M. Lambert. 1987. Strategic Logistics Management. Homewood, IL: Richard D. Irwin, Inc.
Transport Canada. 1987. "Dangerous Goods Truck Route Screening Method for Canadian Municipalities. "
U.S. Nuclear Regulatory Commission, Public Information Circular for Shipments of Irradiated Reactor Fuel, NUREG-0725, Rev. 1 1, Washington, DC, July 1996.
Wilson, F. R., B. G . Bisson, and K. B. Kobia. 1986. "Factors That Determine Modal Choice in the Transportation of General Freight. " Transportation Research Record 1061: 26-3 1. Washington, DC: Transportation Research Board.

Appendix A.
DEFINITIONS
DEDICATED TRAINS -
Dedicated trains are usually considered to be a subset of regular train service that is characterized by homogeneity of the cargo. This term includes both unit trains and scheduled high-speed trains, such as those hauling trailers and/or containers on flatcars (TOFCICOFC). As used in this study, the term "dedicated train" refers to a relatively short unit train operated exclusively for the transportation of high-level radioactive materials.
HAZARD
Hazard refers to a condition or circumstance that has the potential to cause an injurious accident or otherwise affect human health. "Hazard" is not the same as "risk" because the latter also incorporates the consequences of an accident should it occur.
HIGH-LEVEL RADIOACTIVE MATERIALS
High-Level Radioactive Materials include spent nuclear fuel (SNF, q.v.) from power plants plus high-level radioactive wastes (HLW) that result from the reprocessing of spent nuclear fuel, a step in the production of nuclear weapons, the program to recycle commercial spent fuel (now inactive), or the reprocessing of naval reactor fuel.
INCIDENT-FREE RISK
Incident-free risk refers to the radiological risk to people resulting from the radiation that is normally emitted from a cask during transportation. Even heavily shielded, radioactive materials emit small amounts of radiation. The levels of this radiation are regulated by cognizant federal agencies.
NON-RADIOLOGICAL RISK
Non-radiological risk refers to those risks associated with hazards of transportation that have nothing to do with exposure to radiation. Only accident-related risks of transport operations are addressed in this study; secondary effects, such as impacts on health from pollution generated by transport vehicles, are not addressed. Non-radiological risk is expressed in this study in terms of expected fatalities that might occur to vehicle crews, occupants of other

vehicles, pedestrians, security personnel, protesters, and casualties of evacuations and other emergency response operations.
OPERATIONAL RESTRICTIONS (RAIL)
For the purposes of this study, it is assumed that both dedicated and regular trains may be operated under restrictions derived from both the DODIDOE shipping instructions for naval reactor spent fuel shipments and current Association of American Railroad (AAR) guidelines. These restrictions are
Maximum speed is limited to 35 mph
One train is stopped (stands) during passes while the other moves past at no more than 35 mph (AAR only)
Cask car must be placed at the rear of the train (DOD only).
RADIOLOGICAL RISK
Radiological risk refers to the risk to people voluntarily (transport workers and emergency responders) and involuntarily (the public) exposed to radiation from sources contained within casks, as well as material released from them. Non-accident (incident-free) risk is that associ- ated with the radiation that always emanates from the loaded cask, sometimes called normal radiation. Accident risk is that associated with radioactive material released from a damaged cask, as well as exposure to radiation from a cask, perhaps heightened by damage, during response operations. Radiological risk is typically quantified in terms of person-rems, which is a combination of the number of people exposed and the health effects of individual exposure (i.e., type, intensity, and duration of radiation, and manner in which the individual is affected). In this report, risk is usually referred to on a per cask-mile basis, which is the risk associated with the transport of one cask one mile. A conversion factor of 2500 person-rems per expected fatality is used. Affected populations include crews and other personnel, on- board escorts and others accompanying a shipment, inspectors, the populace along the route of travel, and emergency responders. Radiological effects on plants and animals were not considered in this study.
REGULAR TRAIN
As used in this study, "regular train" refers to any of the types of trains, other than dedicated trains, that could be expected to handle a portion of the movement of a cask car from origin to destination. A regular train would typically be a lower priority, advertised freight service, or "manifest" train in general service containing a mixture of commodities that may include grain, automobiles, building materials, explosives, flammables, and other hazardous

materials. Operation would be in accordance with "operational restrictions" as defined above.
RISK
Risk typically refers to a combination of the likelihood that an injurious event or accident will occur and the consequences should it occur. Risk analysts define risk as the product of the probability and consequences of an accident, weighted equally. Implicit in this definition is the presumption that probability is as important as the consequences. In contrast, those responsible for public safety often discount the likelihood (probability) and focus on the potential consequences.
SAFETY
This study recognizes that safety is not absolute. Therefore, safety is regarded as the relative freedom from risk afforded by the available transport modes. Safety concerns acknowledged and addressed by this study include:
Radiological effects of normal incident-free transport Radiological effects of accidents during transport Non-radiological casualties of accidents during transport.
SPENT NUCLEAR FUEL
Spent nuclear fuel (SNF) is irradiated fuel discharged from a nuclear reactor.

Page intentionally left blank.

Appendix B.
INVITEES TO AND ATTENDEES AT MODEIROUTE TECHNICAL ADVISORY GROUP MEETING
StateILocal Governments
Representative Group
Carriers -Highway -Rail -Water
Shippers
Regional Organizations
Tribal Governments
Invitee Attendee
Jeffrey Cooney Yes Leo Tierney Yes Craig Philip No
John Vincent Yes Julie Jordan No Michael Kirkland Yes
Public Interest Groups
Affiliation
Tri-State Motor Transit Co. Union Pacific Railroad Ingram Barge Co.
GPU Nuclear Edison Electric Institute General Electric
Alan Turner Yes Rose Harnrnitt Yes Rick Bamsey Yes Robert Halstead Yes James Reed No
James Miemyk Yes
Colorado State Highway Patrol Illinois Department of Nuclear Safety Iowa Emergency Management Division Nevada Nuclear Waste Project Office
1 National Conference of State Legislatures I
1 western Interstate Energy Board
Mervin Tano No
Robert Tipple Yes Ted Glickman No
Council of Energy Resource Tribes
National Safety Council Resources for the Future
Nuclear Waste Technical Review Board
Nuclear Regulatory Commission
U.S. Department of Energy
U. S . Department of lkinsportation
- -
Sherwood Chu Yes
John Cook No
Michael Conroy Yes Susan Smith No
Joseph Nalevanko Yes
Claire Orth Yes E.P. Pfersich No Henry Sandhusen Yes Robert Walter Yes
Paul Zebe Yes
Gary Watros Yes
--
Nuclear Waste Technical Review Board
Nuclear Regulatory Commission .
Transportation Management Division Office of Civilian Radioactive Waste Management
Research and Special Programs Administration Federal Railroad Administration U.S. Coast Guard Federal Highway Administration Volpe National Transportation Systems Center Volpe National Transportation Systems Center Volpe National Transportation Systems Center

Representative Group
Contractor Support
Invitee Attendee
John Allen Yes David Kerr Yes Mark Abkowitz Yes Kitty Hancock Yes Emily Goodenough Yes Phani Raj Yes
Affiliation
Battelle Battelle Abkowitz and Associates, Inc. (AAI) Abkowitz and Associates, Inc. (AAI) Abkowitz and Associates, Inc. (AAI) Technology and Management Systems, Inc.

Appendix C.
BIBLIOGRAPHY
MODAL STUDIES
Allen, J. C., and S. Gupta. 1987. Overweight truck shipments to nuclear waste repositories. U . S . Department of Energy.
Association of American Railroads. 1989. Train handling study on the relative safety of spent nuclear fuel carrying cars: Dedicated train vs. a conventional freight train. Research and Test Department.
Basinger, K. L., P. L. Hoffman, and L. A. Smith. 1990. Comparative analysis of regular and dedicated train service for the transport of spent nuclear fuel: Costs and risks. U.S. Department of Energy.
Brentlinger, L. A., P. L. Hofrnan, and R. W. Peterson. 1988. Comparative analyses of spent nuclear fuel incidentfree transport modal options: Part I. Transport operations under existing site constraints. U . S. Department of Energy.
Brentlinger, L. A., P. L. Hofinan, and R. W. Peterson. 1989. Comparative analyses of spent nuclear fuel transport modal options: Transport options under existing site constraints. U . S . Department of Energy.
Daling, P. M., G. W. McNair, and W. B. Andrews. 1985. Considerations in the selection of transport modes for spent nuclear fuel shipments. U.S. Department of Energy.
Fischer, L. E., C. K. Chou, M. A. Gerhard, C. Y. Kimura, R. W. Martin, R. W. Mensing, M. E. Mount, and M. C. Witte. 1987. Shipping container response to severe highway and railway accident conditions. U . S . Nuclear Regulatory Commission.
Goodman, L. S., and R. M. Jefferson. 199 1. Review of the draft report circulated by Resources for the Future on April 1991 discussing the transportation of radioactive materials in dedicated trains.
Interstate Commerce Commission. 1977. Transportation of radioactive materials by rail.
Kassen, D. 1982. Transportation of radioactive material by rail: Special train issue. U . S. Department of Energy.

Maio, D. J. 1983. Truck transportation of hazardous materials--A national overview. US. Department of Transportation.
Starry, C., K. E. McCaleb, and W. A. Stock. 1992. "Truck transportation of hazardous chemicals. " Transportation Research Record 1333.
ROUTING STUDIES
Abkowitz, M. D. 1989. "Hazardous materials transportation routing and risk management." Presented at PATRAM '89, Washington, DC.
Abkowitz, M., and P. Cheng. 1988. "Developing a risk-cost framework for routing truck movements of hazardous materials. " Accident Analysis and Prevention, 20: 1, 39- 51.
Abkowitz, M., M. Lepofsky, and P. Cheng. 1992. "Selecting criteria for designating hazardous materials highway routes. " Transportation Research Record 1333.
Berkowitz, R. L., D. K. Shaver, and T. J. Rudd. 1982. Special routing of spentfuel shipments. U . S. Department of Transportation.
Chin, S. D., and P. D. Cheng. 1989. "Bicriterion routing scheme for nuclear spent fuel transportation. " Presented at the A M U ~ Meeting of the Transportation Research Board, Washington, DC.
Coakley, L. G. 1987. "Highway routing of commercial spent fuel shipments: Local input to the process. " In Waste Management '87 Proceedings, Tucson, AZ.
Glickman, T. S. 1983. "Rerouting railroad shipments of hazardous materials to avoid populated areas. " Accident Analysis and Prevention, 15, 329-335.
Glickman, T. S. 1989. Restricting hazardous materials routes on the nation's railroads: Some considerations for regulatory analysis. Washington, DC: Resources for the Future.
Harwood, D. W., et al. 1990. A truck accident rate model for hazardous materials routing. Transportation Research Board, National Research Council.
Hobeika, A. G., B. Jarnei, and I. B. Santoso. 1986. Selection of preferred highway routes for shipment of spent nuclear fuel between Surry & North Anna Power Stations in Virginia. Transportation Research Board, National Research Council.
Ivancie, F. J. 1984. Establishing routes for trucks hauling hazardous materials: The experience in Portland, Oregon. Office of Emergency Management, Portland, OR.

Joy, D. S., P. E. Johnson, and S. M. Gibson. 1983. HIGHWAY, A transportation routing model: Program description and revised users' manual. U .S . Department of Energy.
Kessler, D. 1985. Establishing hazardous materials truck routes for shipments through the Dallas-Fort Worth area. Transportation Research Board, National Research Council.
McClure, T. A., L. A. Brentlinger, V. J. Drago, and D. C. Kerr. 1988. Considerations in rail routing of radioactive materials, with emphasis on the relationship between track class and train accidents. U .S . Department of Energy.
Nornung , M. A., and A. L. Kornhauser. 1979. Population avoidance routing of hazardous material trafic on the U.S. railroad system. U.S. Department of Transpor- tation.
North Central Texas Council of Government. 1985. Hazardous materials routing study, Phase I: Establishing hazardous materials truck routes for shipments through the Dallas-Fort Worth Area. Arlington, TX.
North Central Texas Council of Government. 1985. Hazardous materials routing study, Phase 11, Executive Summary: Analysis of hazardous materials truck routes in proximity to the Dallas Central Business District. Arlington, TX.
Office of Civilian Radioactive Waste Management. 1987. Transportation routing issues related to the shipment of high-level nuclear waste. U.S. Department of Energy.
Office of Civilian Radioactive Waste Management. 1989. Nevada highway routing study. U.S. Department of Energy.
Office of Civilian Radioactive Waste Management. 1989. Rail route-related criteria for HL W shipments. U. S. Department of Energy.
Peterson, B. E. 1985. IhTERLINE, a railroad routing model: Program description users ' manual. U. S. Department of Energy.
Rhyne, W. R. 1990. "Evaluating routing alternatives for transporting hazardous materials using simplified risk indicators and complete probabilistic risk analyses." Transportation Research Record 1264.
Saccomanno, F. F., M. Van Aerde, and D. Queen. 1987. "Interactive selection of minimum-risk routes for dangerous goods shipments. " Transportation Research Record 1148.

Seiler, F. A. 1988. "Route selection for the transport of hazardous materials. " Journal of the Institute of Nuclear Materials Management 17.
Souleyrette, R. R., S. K. Sathisan, and R. diBartolo. 1991. Yucca Mountain transportation routes: Preliminary characterization and risk analysis. Nuclear Waste Project Office, Carson City, NV.
Southern States Energy Board. 1989. Southern States ' Routing Agency Report. U . S . Department of Energy.
Technology & Management System, Inc. 1989. HAZMAT rail routing survey of current activities and assessment of route selection methodologies. Volpe National Transportation Systems Center, U.S. Department of Transportation.
Transport of Dangerous Goods Directorate. 1987. Dangerous goods truck route screening method for Canadian municipalities. Transport Canada.
Turnquist, M. A. 1987. "Routes, schedules and risks in transporting hazardous materials." Strategic Planning in Energy and Natural Resources, eds. B. Lev, et al., 289-302.
Turnquist, M. A., and J. A. Werk. 1989. "Interactive modeling for multiobjective scheduling and routing of radioactive waste shipments. " Presented at PATRAM ' 89, Washington, DC.
U.S. Department of Transportation. 1989. Review of the selection of the rail route for shipping Three Mile Island debris.
Wentz, C. J. Lessons learned: State of New Mexico's experience in the WIPP highway route designation process. State of New Mexico, Energy, Minerals and Natural Resources Department.
Zografos, K. G. , and C. F. Davis. 1986. A multiobjective model for routing hazardous materials: A goal programming approach. Technology Transfer Center, University of Connecticut, Storrs, Connecticut.
Zografos, K. G. 1989. "Combined location-Routing model for hazardous waste transportation and disposal. " Presented at the 68th Annual Meeting of the Transporta- tion Research Board.
Zografos, K. G., and S. Warkov. 1990. "Hazardous materials siting and routing decisions: factors affecting preferences of fire chiefs. " Transportation Research Record 1264. Washington, DC: Transportation Research Board.

FUSK ANALYSIS STUDIES
Allen, J. C., and T. S. Glickman. 1988. Regulation and risk analysis of hazardous materials transportation routes. Washington, DC: Resources for the Future.
Andrews, W. B., R. E. Rhoades, A. L. Franklin, et al. 198 1. Hazardous material transportation risks in the Puget Sound Region, U.S. Department of Transportation.
Black, L. 1986. "Transportation of hazardous wastes risk assessment for local access routes in the vicinity of existing and planned disposal facilities." In Proceedings of HAZMACON '86.
Elder, H . K., et a1 . 198 1. An analysis of the risk of transporting spent nuclear fuel by train. U . S . Department of Energy.
Fenstermacher, T. E., et al. 1987. A Manual for peqorming transportation risk assessment. Washington, DC: Chemical Manufacturers Association.
Fullwood, R. R., E. A. Straker, D. Moffat, W. Aron, and P. Lobner. 1976. Preliminary risk analysis of the transportation of nuclear waste. U.S. Department of Energy.
Glickman, T. S. 1979. Network-related risk attributes in the rail transportation of haz- ardous materials. Volpe National Transportation Systems Center, U. S. Department of Transportation.
Glickman, T. S. 1986. "A methodology for estimating time-of-day variations in the size of a population exposed to risk. " Risk Analysis 6, 317-324.
Glickman, T. S. 1988. "Benchmark estimates of release accident rates in hazardous materials transportation by rail and truck. " TransportQtion Research Record 1 193.
Glickrnan, T. S., and D. B. Rosenfield. 1984. "Risks of catastrophic derailments involving the release of hazardous materials. " Management Science 30, 503-5 1 1.
Glickman, T. S., and E. D. Silverman. 1990. Gauging the degree of conjidence in choices between risky alternatives. Washington, DC: Resources for the Future.
Golding, D., and A. White. 1990. Guidelines on the scope, content, and use of comprehensive risk assessment in the management of high-level nuclear waste transportation. Nuclear Waste Project Office, Carson City, NV.
Hubert, P., J. Lombard, and P. Pages. 1986. Multicriteria analysis of protection actions in the case of transportation of radioactive materials: Regulating the transit of
C-5

Type A packages through the Mont Blanc Tunnel. Centre d'Etude sur 1'Evaluation de la Protection dam le Domaine Nucleaire, Fontenay-aux-Roses, France.
Kaplan, S. 1986. "On the use of data and judgment in probabilistic risk and safety analysis. " Nuclear Engineering Design, 93 : 2.
Lautkaski, R. and T . Mankamo . 1977. Chlorine transportation risk assessment. Valtion Teknillinen Tutkimuskeskus; Ydinvcimatekniikan Lab, Otaniemi, Finland.
Nayak, P. R., D. B. Rosenfield, and J. H. Hagopian. 1983. Eventprobabilities and impact zones for hazardous materials accidents on railroads. U . S . Department of Transportation.
Neuhauser, K. S., and P. C. Reardon. 1986. "A demonstration sensitivity analysis for RADTRAN 111. " Waste Management '87, 4 17-422.
Office of Civilian Radioactive Waste Management. 1991. The Nevada railroad system: Physical, operational, and accident characteristics. U .S . Department of Energy.
Pijawka, K. D., S. Foote, and A. Soesila. 1985. Risk assessment of transporting hazardous materials: Route analysis and hazard management. Transportation Research Board, National Research Council.
Raj, P. K. 1988. A risk assessment study on the transportation of hazardous materials over the U. S. railroads. U.S. Department of Transportation.
Raj , P. K., and T. S. Glickman. 1986. Generating hazardous material risk profiles on railroad routes. National Research Council.
Rao, R. K:, E. L. Wilmot, and R. E. Luna. 1982. Non-radiological impacts of transporting radioactive material. U . S. Department of Energy.
Rhoades, R. E., and A. L. Franklin. 1986. Evaluation of methods to compare consequences from hazardous materials transportation accidents. U . S . Department of Energy.
Saccomanno, F. F., and S. El-Hage. 1989. "Minimizing derailments of railcars carrying dangerous commodities through effective marshalling strategies. " Transportation Research Record 1245. Washington, DC: Transportation Research Board.
Saccomamo, J. H., J. H. Shortreed, M. Van Aerde, and J. Higgs. 1989. Comparison of risk measures for the transport of dangerous commodities by truck and rail. Institute for Risk Research, University of Waterloo, Canada.

Santa Barbara County Resource Management Department. 1989. Risk assessment for gas liquids transporntion from Santa Barbara County. Santa Barbara, CA .
Slovic, P. 1987. "Perception of risk. " Science, 236, 280-285.
Smith, D. R., and J. M. Taylor. 1978. Analysis of radiological risks of transporting spent fuel and radioactive wastes by truck and by ordinary and special trains. U.S. Department of Energy.
Tomachevsky , E. G., C. Ringot, P. Page, and P. Hubert. 1987. A validation study of the INTERZUN model for assessing risks of transportation accidents: Road transport of uranium hexafuoride. Transportation Research Board, National Research Council.
Transportation Research Board. 1983. Risk assessment processes for hazardous materials transportation. National Research Council.
Union Pacific Railroad. 1993. Simulation analysis in-train placement of nuclear cask cars.
U. S . Department of Energy. 1979. Relative consequences of transporting hazardous materials-Interim report.
U.S. Department of Transportation. 1973. Risk analysis in hazardous material transportation.
U. S . Environmental Protection Agency. 1975. Transportation accident risks in the nuclear power industry, 1975-2020.
Wilson, R., and E. A.C. Crough. 1987. "Risk assessment and comparisons: an introduction. " Science, 236:4799, 267-270.
REGULATORY GUIDELINES
Barber, E. J., and L. K. Hildebrand. 1980. Guidelines for applying criteria to designate routes for transporting hazardous materials. U . S . Department of Transpor- tation, Federal Highway Administration.
LaMortelWilliams Associates. 1987. Dangerous goods truck route screening method for Canadian municipalities. Transport of Dangerous Goods Directorate, Transport Canada.
Peat, Marwick, Mitchell, and Co. 1980. Development of criteria to designate routes for transporting hazardous materials--Final report. U . S . Department of Trans- portation, Federal Highway Administration.

Research and Special Programs Administration. 1992. Guidelines for selecting preferred highway routes for highway route controlled quantity shipments of radioactive materials. U. S. Department of Transportation.
ENVIRONMENTAL ASSESSMENT STUDIES
Hostick, C. J., J. C. Lavender, and B. H. Wakeman. 1992. Time and dose assessment of barge shipment and at-reactor handling of a CASTOR V/21 spentfuel storage cask. U . S . Department of Energy.
Schneider, K. J., W. A. Ross, and R. I. Smith. 1988. "Estimated effects on radiation doses from alternatives in a spent fuel transportation program." In Proceedings of the 29th Meeting of the Institute of Nuclear Materials Management.
Smith, R. I., P. M. Daling, and W. D. Faletti. 1992. Analysis of radiation doses from operation of postulated commercial spent fuel transportQtion systems. U . S . Department of Energy.
Unfone, A. J., A. A. Garcia, and R. Stuart. 1978. A generic assessment of barge transportation of spent nuclearfuel. Atomic Industrial Forum.
U. S. Nuclear Regulatory Commission. 1977. Final environmental statement on the transportation of radioactive material by air and other modes.
GENERAL STUDIES
Abkowitz, M. D., S. B. Abkowitz, and M. Lepofsky. 1989. Analysis of human factors effects on the safety of transporting radioactive waste materials. US. Department of Energy.
Abkowitz, M., P. Alford, A. Boghani, J. Cashwell, E. Radwan, and P. Rothberg. 1991. "State and local issues in transportation of hazardous materials: Toward a national strategy. " Transportation Research Record 13 13.
Abkowitz, M., P.D-M. Cheng, and M. Lepofsky . 1990. "Use of geographic information systems in managing hazardous materials shipments. " Transportation Research Record 1261.
Abkowitz, M., and G. List. 1987. "Hazardous materials transportation incident- accident information systems. " Transportation Research Record 1148.
The Aerospace Corporation. 1987. Case histories of West Valley spentfuel shipments. U. S . Nuclear Regulatory Commission.

Allen, J.C. 1991. Regulation of hazardous material routing and relationship to risk analysis. Air and Waste Management Association.
Andrews, W. B., B. M. Cole, R. I. Engel, and J. M. Oylear. 1982. Defense waste transportation cost and logistics studies. U.S . Department of Energy.
Batta, R., and S. S. Chiu. 1988. "Optimal obnoxious paths on a network: transportation of hazardous materials. " Operations Research 36: 1, 84-92.
Blum, P. 1985. Trends in shipping spent fuel. Nuclear Engineering International.
Brentlinger, L. A., S. Gupta, A. M. Plumrner, L. A. Smith, and S. Tzemos. 1989. MRS systems study, Task F: Transportation impacts of a monitored retrievable storage facility. U. S . Department of Energy.
Brentlinger, L. A., and P. L. Hofinan. 1988. Nuclear waste transport using overweight truck and hefty rail casks. U. S. Department of Energy.
Carlson, R. D., E. R. Koehl, L. H. Harmon, E. J. Habib, and T. A. Mignone. 1988. "Testing TRANSCOM--U.S. Department of Energy's RadMat tracking system. " In Proceedings of the 29th Meeting of the Institute of Nuclear Materials Management.
Cashwell, J . W., K. S. Neuhauser, P. C. Reardon, and G. W. McNair. 1986. Transportation impacts of the commercial radioactive waste management program. U.S. Department of Energy.
Cluett, C., and F. A. Morris. 1992. The transportation of radioactive materials through urban areas: Social impacts and policy implications. U.S. Department of Energy.
Conference of Radiation Control Program Directors, Inc. 1990. Directory of State agencies concerned with the transportation of radioactive material-- With notes on their statutory authority and regulations.
Cook, J. R., W. R. Lahs, and W. H. Lake. 1987. The modal study: The response of spent fuel packages to severe transportation accidents. U. S . Nuclear Regulatory Commission.
Durfee, R. C., P. E. Johnson, P. R. Coleman, and D. S. Joy. 1988. Calculation of population statistics associated with hazardous material transportation routes. U . S . Department of Energy.
Elder, H. K. 1983. Intermodal transportation of spentfuel. U.S. Department of Energy.

Electric Power Research Institute. 1986. Safety criteria for spent-fuel transport.
Federal Emergency Management Agency. 1983. Guidance for developing State and Local radiological emergency response plans and preparedness for transportation accidents.
Fisher, A. C., and C. P. Furber. 1992. Railroad infrastructure adequacy for safe transportation of spent nuclear fuel. American Nuclear Society.
General Accounting Office. 1987. NUCLEAR WASTE--Shipping damaged fuel from llhree Mile Island to Idaho. U.S. Congress.
Glickman, T. S. and D. Golding . 1991. For a few dollars more: Public trust and the case for transporting nuclear waste in dedicated trains. Washington, DC: Resources for the Future.
Goodman, L. 1992. Transporting nuclear waste: Securing the public trust. University of Nevada.
Goodman, L. S., and R. F. Garrison. 1990. Routing guidelines for rail transport of radioactive materials--Is consensus possible ? U.S. Department of Energy.
Gopalan, R., K. S. Kolluri, R. Batta, and M. H. Karwan. 1990. "Modeling equity of risk in the transportation of hazardous materials. " Operations Research, 38: 6 , 96 1-973.
Grella, A. W. 1989. "Reflection upon the nuclear transport regulations as they have emerged over the past several decades." Presented at PATRAM ' 89, Washington, DC.
Halstead, R. J., R. R. Souleyrette, and R. diBartolo. 199 1. Transportation access to Yucca Mountain: Critical issues. Nuclear Waste Project Office, Carson City, NV.
Harwood, D. W., and E. R. Russell. 1990. Present practices of highway transportation of hazardous materials. U.S. Department of Transportation, Federal Highway Administration.
Harwood, D. W., E. R. Russell, and J. G. Viner. 1989. Characteristics of accidents and incidents in highway transportation of hazardous materials. U.S. Department of Transportation, Federal Highway Administration.
Heimann, D. I. 1980. Potential causes of railroad hazardous materials accidents: A statistical analysis (Volume I--Analysis and discussion; Volume 2--Detailed calculations). U . S . Department of Transportation.
Hoess, J. A., and V. J. Drago. 1989. Study of minimum-weight highway transporters for spent nuclear fuel casks. U .S . Department of Energy.

Jones, L. S . 1983. Cargo security: A nuts and bolts approach. Woburn, MA: Butterworth Publishers.
Lahs , W. R. 1987. Transporting spent fuel--Protection provided against severe I
highway and railroad accidents. U . S . Nuclear Regulatory Commission.
i Loscutoff, W. V., E. S. Murphy, L. L. Clark, R. W. McKee, and R. J. Hall. 1977. A safety and economic study of special trains for shipment of spent @el. U S . Department of Energy.
Madsen, M. M., J. M. Taylor, R. M. Ostmeyer, and P. C. Reardon. 1986. RADTRAN III. U.S. Department of Energy.
National Conference of State Legislatures. 1985. Emergency response to radioactive materials transportation accidents. Denver, CO .
Office of Civilian Radioactive Waste Management. 1986. Transporting spent nuclear fuel: An overview. U . S . Department of Energy.
Office of Civilian Radioactive Waste Management. 1990. Preliminary Nevada transportation accident characterization study. U .S . Department of Energy.
Office of Transportation Systems Planning. 1988. Analysis of institutional issues and lessons learned from recent spent nuclear fie1 shipping campaigns (1 983-1 987). U. S . Department of Energy.
Pages, P., P. Hubert, P. Gilles, and E. Tomachevsky. 1987. Modijjing the regulation for small radioactive package transit through the Mont Blanc Tunnel--Assessment of the health and economic impact. U. S . Nuclear Regulatory Commission.
Price, D. L., J. W. Schmidt, and R. W. Kates. 1981. Multimodal hazardous materials transportation in Virginia. Virginia Department of Transportation Safety.
Puget Sound Council of Governments. 1980. Hazardous materials study for the Central Puget Sound Region. Seattle, WA.
Radwan, A. E., S. Singh, and K. D. Pijawka. 1990. "Projecting hazardous materials and wastes in transportation: Conceptual and methodological factors and applications. " Transport~tion Research Record 1264.
"Recommendations for .hazardous materials transportation research and development projects." 1983. Transportation Research Circular, No. 267.
Reno, H. W., R. C. Schmitt, and W. C. Lattin. 1989. "Transporting spent and damaged fuel in the United States: Recent experience and lessons learned related to the

evolving transportation policy of the U.S. Department of Energy." Presented at PATRAM ' 89, Washington, DC.
Research and Special Programs Administration. 198 1. A community model for handling hazardous material transportation emergencies. U . S . Department of Transportation.
Research and Special Programs Administration. 1990. 1990 emergency response guidebook, guidebook for first response to hazardous materials incidents. U. S . Department of Transportation.
Saccornanno, F. F., and J. H. Shortreed. 1991. "Final specification of corridor characteristics. " International Consensus Conference on the Risks of Transporting Dangerous Goods.
Shappert, L. W., C. R. Attaway , et al. 1988. Transportation operationsfunctions of the Federal waste management system. U . S . Department of Energy.
Southern States Energy Board. 1992. Spent fuel and high-level radioactive waste transportation report. U . S . Department of Energy.
S praggins , H . B . 1993. Rail operations and management: Perspectives. U. S . Department of Energy.
Starr, C., and C. Whipple. 1980. "Risks of risk decisions. " Science, 208, 11 14-1 119.
Stiegler, J. E., G. C. Allen, and J. W. Cashwell. 1988. Spentfuel transportation system limitations and opportunities. U. S . Department of Energy.
Tobin, R. L., N. K. Meshkov, and R. H. Jones. 1985. Preliminary assessment of costs and risks of transporting spent fuel by barge. U.S. Department of Energy.
U. S . Congress, Office of Technology Assessment. 1986. Transportation of hazardous materials.
U.S. Department of Energy. 1978. Everything you always wanted to know about shipping high-level nuclear wastes.
U.S. Department of Energy. 1986. Spent fuel transport~tion in the United States: Commercial spent fuel shipments through December 1984.
U. S . Department of Energy. 1986. Transuranic waste: Transportation assessment and guidance report."

U.S. Department of Energy. 1987. Monitored retrievable storage submission to Congress - Volume I , The proposal.
U. S . Department of Energy. 1988. Annual radioactive materials transportation legal developments report. Washington, DC .
U. S. Department of Energy. 199 1. Midwestern high-level radioactive waste transportation primer.
U . S. Nuclear Regulatory Commission. 1980. Survey of current State radiological emergency response capabilities for transportation related incidents.
Viebrock, J . M., and N. Mote. 1992. Near-site transportation infrastructure project' jinal report. U.S. Department of Energy.
Vincent, J. A. 1992. Issues concerning spent nuclear fuel transportation systems and shipping and receiving facilities interfaces. American Nuclear Society.
Wentz, C. J. 1992. Ensuring safe transport of nuclear waste: New Mexico's experience with WIPP. State of New Mexico, Sante Fe, NM.
Western Interstate Energy Board. 1991. Rail primer: Legal, technical and business aspects of rail transportation. Denver, CO .
Wooden, D. G. 1986. Railroad transportation of spent nuclear fuel. U.S. Department of Energy.

Page intentionally left blank.

Appendix D.
HAZTRANS* MODEL DESCRIPTION
MODEL OVERVIEW
This appendix provides a brief description of the current version and project use of HazTrans, a risk management product of Abkowitz and Associates, Inc. (AAI), of Nashville, Tennessee. HazTrans, used in this study to perform transportation route risk assessments, is a geographic information systems (GIs)-based application, which uses longitude and latitude coordinates to combine data that otherwise would be difficult or impossible to integrate.
HazTrans utilizes computerized highway, rail, and waterway transportation networks, derived from federal data maintained at Oak Ridge National Laboratory in Oak Ridge, Tennessee. The highway network contains all Interstate, U.S., and state highways, as well as some major local arterials. The rail network includes both mainline and branch track and contains information on railroad operating rights. The waterway network contains all navigable intracoastal and intercoastal waterways (including the Panama Canal), and includes the representation of all locks and dams.
AAI has augmented the network databases with additional attributes, such as travel time, accident likelihood, and neighboring population. These attributes have been formed using a variety of transportation and demographic information sources and the results of scientifically credible transportation research studies. For example, population statistics are calculated using the 1990 Census by overlaying the block-level data onto the transportation networks and counting the population that resides within proximity of each segment and transfer point. Similarly, highway truck accident statistics are derived from a recent Federal Highway Administration study focusing on truck transport of hazardous materials.
ROUTING CRITERIA
To perform a routing analysis in HazTrans, the user must specify the mode, the origin and destination, the criteria to be used to determine the route, and any restrictions that should be placed on the route. These features were used in the study to select candidate routes to include in the case study sample.
The criteria used to select a route can be based on a single or weighted combination of economic and safety measures. Selecting travel time, for example, as the sole criterion will result in the quickest route from the origin to the destination. Safety measures include release- causing accident likelihood (i.e., the likelihood that there will be an accident that will result in a release at some point along the route), population exposure along the route, and a composite
'HazTrans is a registered trademark of Abkowitz & Associates, Inc., Nashville, Tennessee.
D-1

risk measure. Designated routes can also be represented and evaluated in HazTrans using special function commands.
In addition to using differing criteria and weights to select and evaluate candidate routes, HazTrans provides the capability to specify various types of route restrictions. These restrictions fall into four categories: (1) specific nodes or links, (2) area-wide impacts, (3) link groups based on segment attributes, and (4) the location of mode-specific activities.
HazTrans output provides both segment and route-level statistics. These statistics can be used to supply input data to other risk models (e.g . , population, travel times, stop locations, etc., as inputs to Radtran 4) or to support HazTrans risk screening models directly.
APPENDIX D BIBLIOGRAPHY
Abkowitz, M. D., P.D.M. Cheng, and M. Lepofsky. 1990. "The use of geographic information systems (GIs) in managing hazardous materials shipments. " Transportation Research Record 126 1.
Bureau of the Census. 1980. Census of population and housing, 1980: Master area reference file (MARF) 2. U . S. Department of Commerce.
Federal Emergency Management Agency. 1989. Handbook of chemical hczzard analysis procedures. U . S . Department of Transportation, U. S. Environmental Protection Agency.
Harwood, D. W., J. G. Viner, and E. R. Russell. 1990. "Truck accident rate model for hazardous materials routing. " Transportation Research Record 1264.
Research and Special Programs Administration. 1990. Emergenq response guidebook. Report No. DOT-P-5800.5. U.S. Department of Transportation.
Research and Special Programs Administration. 1989. Guidelines for applying criteria to designate routes for hazardous materials. U.S . Department of Transportation.

Appendix E.
RADTRAN 4 MODEL DESCRIPTION
MODEL OVERVIEW
Radtran 4 is a sophisticated computer program developed to evaluate radiological conse- quences of incident-free transportation, as well as the radiological risks caused by vehicular accidents occurring during transportation. Radtran 4 was developed (and is maintained) by Sandia National Laboratory (SNL) under contract to the U.S. Department of Energy. The following description of Radtran 4 has been compiled from source documents prepared over time by Radtran developers.
SNL developed the original Radtran code in 1977 in conjunction with preparation of NUREG- 0170, "Final Environmental Statement on the Transportation of Radioactive Material by Air and Other Modes." The analytical capabilities of the code were expanded and refined in subsequent versions. Radtran 4 contains advances in handling route-related data and in treat- ing multiple-isotope materials.
The Radtran 4 code is designed to analyze the radiological impact of transporting radioactive material and combines meteorological, demographic, health physics, transportation, packaging, and material factors to evaluate both incident-free and accident-induced risks.
EVALUATION METHODOLOGY
Any evaluation of impacts on the public from transporting radioactive material requires some means of assessing health effects. Radtran uses a model based on the U.S. Nuclear Regulatory Commission's 1975 report entitled Calculation of Reactor Accident Consequences, which eval- uates early fatalities, early morbidities, genetic effects, and latent cancer fatalities.
Radionuclides being evaluated are first subdivided into two classes: (1) external (outside the human body) penetrating radiation hazards and (2) internal radiation hazards from inhaled or ingested radioactive material. External sources irradiate the total body, whereas the consequences of exposure to internal sources are dependent on the specific organs irradiated. External exposure can occur as a result of direct exposure to a localized source, from exposure to contaminated surfaces (groundshine), or from penetrating radiation from a passing cloud (cloudshine). Direct exposure can occur in either incident-free or accident-induced scenarios. Groundshine and cloudshine exposure only occur following accidents.
Despite requirements designed to minimize exposure, whenever radioactive material is trans- ported, members of the general population are exposed to extremely small doses of external penetrating radiation from x-rays, gamma rays, or exposure neutrons. In Radtran 4, the gen- eral population is divided into eight population subgroups: (1) crew, (2) passengers, (3) cargo
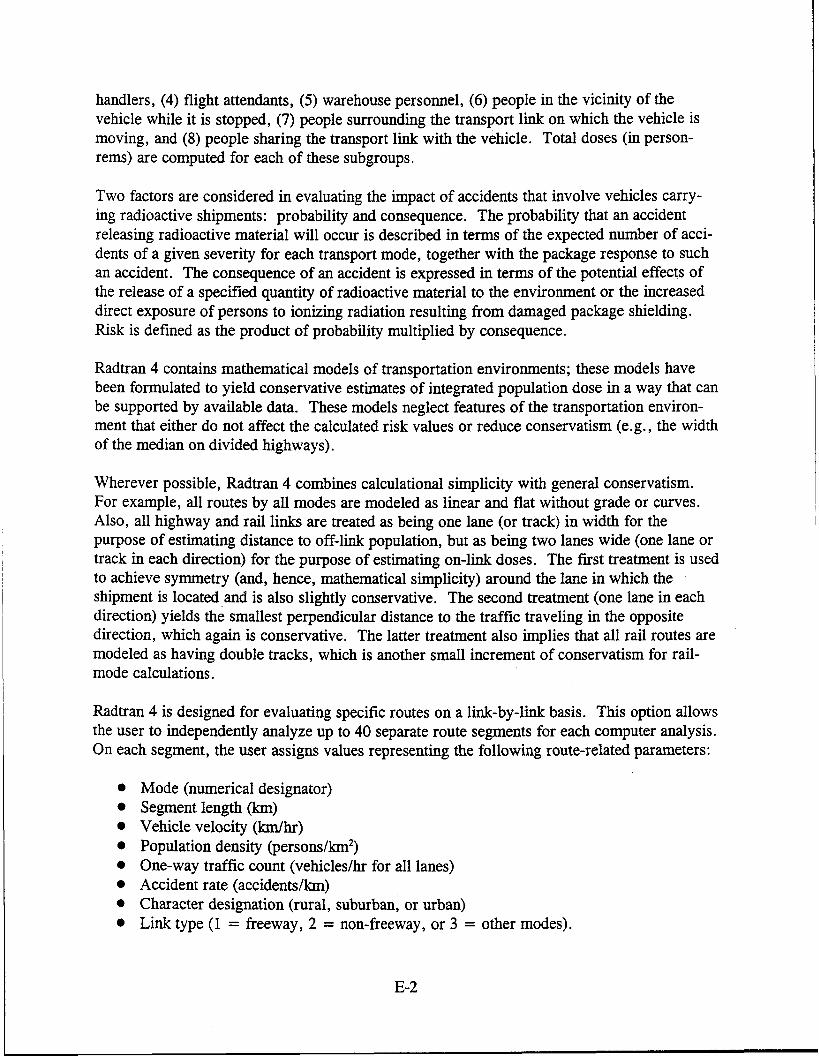
handlers, (4) flight attendants, (5) warehouse personnel, (6) people in the vicinity of the vehicle while it is stopped, (7) people surrounding the transport link on which the vehicle is moving, and (8) people sharing the transport link with the vehicle. Total doses (in person- rems) are computed for each of these subgroups.
Two factors are considered in evaluating the impact of accidents that involve vehicles carry- ing radioactive shipments: probability and consequence. The probability that an accident releasing radioactive material will occur is described in terms of the expected number of acci- dents of a given severity for each transport mode, together with the package response to such an accident. The consequence of an accident is expressed in terms of the potential effects of the release of a specified quantity of radioactive material to the environment or the increased direct exposure of persons to ionizing radiation resulting from damaged package shielding. Risk is defined as the product of probability multiplied by consequence.
Radtran 4 contains mathematical models of transportation environments; these models have been formulated to yield conservative estimates of integrated population dose in a way that can be supported by available data. These models neglect features of the transportation environ- ment that either do not affect the calculated risk values or reduce conservatism (e.g., the width of the median on divided highways).
Wherever possible, Radtran 4 combines calculational simplicity with general conservatism. For example, all routes by all modes are modeled as linear and flat without grade or curves. Also, all highway and rail links are treated as being one lane (or track) in width for the purpose of estimating distance to off-link population, but as being two lanes wide (one lane or track in each direction) for the purpose of estimating on-link doses. The first treatment is used to achieve symmetry (and, hence, mathematical simplicity) around the lane in which the shipment is located and is also slightly conservative. The second treatment (one lane in each direction) yields the smallest perpendicular distance to the traffic traveling in the opposite direction, which again is conservative. The latter treatment also implies that all rail routes are modeled as having double tracks, which is another small increment of conservatism for rail- mode calculations.
Radtran 4 is designed for evaluating specific routes on a link-by-link basis. This option allows the user to independently analyze up to 40 separate route segments for each computer analysis. On each segment, the user assigns values representing the following route-related parameters:
Mode (numerical designator) Segment length (km) Vehicle velocity ( W h r ) Population density @ersons/km2) One-way traffic count (vehicleslhr for all lanes) Accident rate (accidentslkm) Character designation (rural, suburban, or urban) Link type (1 = freeway, 2 = non-freeway, or 3 = other modes).

The ability to include link-specific information provides the capability to compare risks between modes and routes necessary for evaluating the significance of route factors and for comparing radiological risks among routing alternatives.
APPENDIX E BIBLIOGRAPHY
Fischer, L. E., et al. 1975. Shipping container response to severe highway and railway accident conditions. U. S. Nuclear Regulatory Commission, NUREGICR-4829, Vol. 1.
Madsen, M. M., J. M. Taylor, R. 0. Ostmeyer, and P. C. Reardon. 1986. Radtran III. SAND 84-0036. Sandia National Laboratories, Albuquerque, NM.
Neuhauser, K. S., and F. L. Kanipe. 1992. Radtran 4: Volume 3, User Guide. SAND 889- 2370, Sandia National Laboratories, Albuquerque, NM.
Taylor, J. M., and S . L. Daniel. 1977. Radtran: A computer code to analyze transportation of radioactive material. SAND 76-0243, Sandia National Laboratories, Albuquerque, NM.
Taylor, J. M., and S. L. Daniel. 1982. Radtran 11: A revised computer code to analyze transportation of radioactive material. SAND 80- 1943, Sandia National Laboratories, Albuquerque, NM. '
U . S . Nuclear Regulatory Commission. 1975. Calculations of Reactor Accident Consequences, Appendix VI to the Reactor Safety Study. WASH- 1400. Washington, DC .
U.S. Nuclear Regulatory Commission. 1977. Final environmental statement on the transpor- tation of radioactive material by air and other modes. NUREG-0170. Washington, DC.

Page intentionally left blank.

Appendix F.
DERIVATION OF TRANSPORT RADIATION RISK MODELS
BACKGROUND
The development of fundamental relationships for measuring radiation exposure was described in Chapter 5 of this report. In this appendix, derivations of the model formulations are presented in more detail.
SCOPE OF THE MODELS
Radiation risk comprises exposure of the following population groups:
Off-Link Population--people residing, working, or otherwise congregating in areas within the zone of radiation influence from the route of spent nuclear fuel shipment
On-Link Population-passengers in other vehicles encountered along the route
Crew-personnel within the immediate vicinity of the cask (e.g., primary crew, onboard security personnel, inspectors)
Population at Stops-transportation workers away from the immediate vicinity of the cask (and emergency responders in the case of accidents) and general population nearby
Handling Personnel-workers at an intermodal transfer terminal.
The risk evaluation models described in this appendix include considerations of the following types of risks:
Incident-free radiological exposure
Radiological exposure as a result of accident-induced release of nuclear materials into the environment.
MODEL DESCRIPTION
Assumptions
In the models presented below, the following assumptions are made:

The models are applicable to a single mode only; coefficient values are applicable to each specific mode.
The width of radiation effect zones for each mode is a constant.
An individual shipment contains a single cask; multiple cask shipments are not considered.
Risks to handlers arise only at intermodal transfer facilities.
Model symbols are defined in the nomenclature appearing at the end of this appendix.
Incident-Free Exposure Model
Consider the shipment of a single cask from an origin, 0, to a destination, D, as shown sche- matically in Exhibit F-1. The total risk from a single shipment is
where:
R,,= total risk from incident-free exposure (person-rems) R, = risk to off-link population R, = risk to on-link population R3 = risk to crew % = risk to population at stops R, = risk to handlers
Radiation effects are felt within this zone 2
Exhibit F-1. Schematic Representation of a Shipment Route Attributes
F-2

Each component risk is modeled below, consistent with fundamental physical considerations.
Off-Link Population Exposure. The risk to off-link population is given by
number of persons average duration of Rl = [ exposed over the route exposure of each individual 1
with
the number of people exposed = pLW (F-3)
The premise of this model is that the duration of exposure to an off-link individual is inversely proportional to the speed of the vehicle:
a,' average duration of off-link individual exposure = - u v
where a,' is a constant.
Note also that
Hence,
PLW R1 = a,' x - L
In this formulation, a,, which combines a,' and W (assumed constant), is also a constant. Therefore, the off-link risk is dependent only on the average population density and the duration of shipment.
On-Link Population Exposure. Exhibit F-2' represents a schematic of the on-link traffic situation (the highway mode is represented; however, the same schematic is assumed to be applicable to the other modes).
'In Exhibit F-2, subscript 1 represents the traffic moving in the same direction as the spent nuclear fuel shipment and subscript 2, the traffic moving in the opposite direction.
F-3

7 Zone of Radiation Effects
/ Cask Vehicle -
Exhibit F-2. Schematic Representation of the On-Link Traffic Vehicles Being Exposed to the Effects of Radiation from a Moving Spent Nuclear
The radiation exposure risk is given by the equation:
number of number of on-link duration = [ persons ] x [ vehicles exposed
per vehicle during the time t, each vehicle
Fuel Shipment
The initial development is for traffic moving in the same direction as the shipment. The results are then generalized and applied to traffic moving in the opposite direction.
Taking into consideration traffic in all lanes moving the same direction as the shipment, the mean separation distance between vehicles is
and

The relative velocity of "same-directionn vehicles with respect to the cask vehicle is
If the time duration for another - vehicle to pass the cask vehicle is c, then
1 Substituting the prior equations and simplifying:
Each on-link vehicle is assumed to be exposed to radiation when it is within + S/2 longitudinal distance of the cask vehicle. Hence, the duration of exposure for each vehicle becomes
where 2s represents the total length (parallel to the direction of motion of the spent nuclear fuel shipment) over which the radiation effects are significant.
Combining the previous equations, the on-link, same-direction travel exposure risk becomes
[%I SAME = a'2,1 Np TI WJl
where a', , is a constant of proportionality. If the on-link vehicle speed (U,) is assumed to be a fixed ratio to the cask vehicle speed and the number of passengers per vehicle is constant, then the above equation becomes
From this, the risk is not dependent on the relative speed between the traffic and cask vehicle. Therefore, whether a vehicle is moving with the cask vehicle or in the opposite direction, the form of equation is the same and the exposure risk to traffic in the opposite direction will be

Equations 17 and 19 can be combined to a single equation of the type
where T is the mean traffic density (vehicles/hour) on the route. The definition of T involves all lanes in the route segment; that is, the mean of the vehicle density crossing a point per hour in each direction.
Evaluation of Traffic Density for Multi-Lane Routes. The traffic density value to be used in equations 17, 19, and 20 is calculated as follows.
Let
T i = Traffic count in direction 1, traffic lane i
Yi = Distance of lane i from the lane in which the spent nuclear fuel shipment is moving (this is the distance measured normal to the direction of motion of the spent nuclear fuel shipment).
Case 1: Radiation Zone is Rectangular. The radiation zone is assumed to be rectangular along a transport distance of 2s and extends W distance on either side of the cask vehicle. In addition, all lanes of traffic on either side of the cask vehicle are assumed to be within a distance, W. Under these assumptions
and
where m and n represent, respectively, the total number of traffic lanes in directions 1 and 2.

The total traffic density, T , used in equation 20, is then
T = T + T 2
Case 2: Radiation Zone is Circular. If the radiation zone surrounding the spent nuclear fuel shipment is assumed to be circular with radius S and if all traffic lanes are intersected by this circle, then
and
The total traffic density T value is again given by equation 23.
On-Board Crew Exposure. Crew exposure is directly proportional to the average number of personnel and the duration of transit:
number of average duration of 5 = a3 [ crew, inspectors exposure of each individual 1
Population Exposure at Stops. The population exposure risk at w
number of stops avg. number of per- avg. duration] R4 = [ over length L sons exposed per stop of exposure
stops can be estimated by
The number of stops may be assumed (without significant loss of .generality) to be proportional to the total distance of travel. Furthermore, if both the average number of people exposed per stop and the average duration of exposure (stopped time) are assumed to be constant, then
where

a, = coefficient for stop risk L , = trip distance.
Risks to Intermodal Handling Personnel. The handling risk is assumed to occur only for intermodal transfers when the casks have to be handled by transportation personnel. Both the number of handlers and the average duration of handling are assumed to be constant. Hence, the risk itself is considered to be constant, irrespective of the distance of transportation:
where
a, = coefficient for handling exposure H, = Boolean variable (i.e., equal to 1 for intermodal and 0 for all other modes).
Total Incident-Free Radiological Risk. Total incident-free radiological risk is then expressed as
The different coefficients are considered constants and are not dimensionally consistent. The product of the coefficients and their respective parameter groups, however, have units of radiation dosage expressed in person-rems.
Accident-Induced Radiological Risk Model
The radiation risk from accident-induced release is calculated as follows.
R = probability of an X
consequence of release accident -induced release (in person -rems)
The probability of release per shipment on a route is expressed by
where
probability = [mean accident rate per P(r Act) of release unit length per vehicle 1
probability of release anywhere on the trip per shipment conditional probability of release, given that an accident has taken place travel length

The consequence calculation is somewhat more complicated. The potential dispersal of radioactive nuclei in the atmosphere and the associated area of hazard are schematically represented in Exhibit F-3. The relationship is
consequence = number of people average duration
exposed to the cloud of exposure or
where p' is population density, including both general and occupational population.
In equation 35, a measure of the duration of exposure is the average time of transit of radio- nuclides carried by wind across the hazard area. This windward length is estimated to be directly proportional to the square root of hazard area.
Note also that in equation 35 the hazard area, A, is a function of the quantity of radioactive materials released into the environment. This quantity depends on both the vehicle payload and the severity of the accident. However, if all possible conditional probabilities of release of different quantities (i.e., accident severity) are combined, then the term A in equation 35 can be interpreted as the area corresponding to a mean quantity released and P(r 1 Acc) in equation 33 will then correspond to the conditional probability of release of this mean quantity.
Combining equations 33 and 35, and noting that (1) mean conditional release probability is independent of the route chosen, (2) mean quantity released is constant over a given mode (hence, A is a constant over mode), and (3) wind and other atmospheric conditions are constant, the relationship becomes
where b is the radiological accident coefficient.
Note that accident release risk has a direct relationship to mean population density, length of travel, and mean accident rate. It does not depend on the duration of travel.
The accident-induced radiological risk calculations presented above are adequate for modeling. It should be recognized, however, that they do not fully address a number of variables related to modal differences associated with accidents, severities, and cask contents.

of hazard A
Exhibit F-3. Schematic of Radioactive Nuclide Dispersion and Hazard to Off-Link Population
NOMENCLATURE
a Coefficients of various risk terms
A Radiation dose hazard area (sq. km.)
b Coefficients of various risk terms
C Consequence of an accidental radiation release (person-rems)
H I Boolean with value 1 or 0
L Total length of the trip (or route length) for the cask vehicle (km)
m Number of traffic lanes in direction 1
n Number of traffic lanes in direction 2
NcZw Average number of crew per vehicle (personnel within 10 meters of the cask)

Average number of people per vehicle (assumed the same for both directions of traffic)
Total number of vehicles exposed to radiation effects during the transit of the cask vehicle (in time t 3
Probability that in a shipment an accident occurs resulting in the release of radionu- clides to the atmosphere
Conditional probability of release given that a traffic accident has occurred
Total radiation exposure risk per shipment (person-rems)
Non-accident exposure risk to off-link population (person-rems)
Non-accident exposure risk to on-link population (person-rems)
Crew exposure risk in non-accident transportation (person-rems)
Exposure risk at stops (person-rems)
Intermodal handling risk (person-rems)
Along-link distance over which the radiation effects are important either in the front or at the back of spent nuclear fuel cask (km)
Mean accident rate over the entire length per shipment. It is also the probability of realizing an accident over a unit distance in a single shipment (#/km)
Mean traffic fatal accident rate over the entire route
Mean duration of radiation exposure of each on-link vehicle (r)
Total duration of the trip for the cask vehicle (hr)
Mean time between vehicles crossing a specified point on the link (hr)
Mean traffic density on the mode over the duration of time that the cask vehicle is on the route (vehicleslhr)
Mean speed of cask vehicle = (Llt,) (kmlhr)
Mean speed of vehicles moving in the same direction of the cask vehicle (kmlhr)
Mean speed of vehicles moving in the opposite direction of the cask vehicle ( M h r )
F-11

W Total width of radiation effect zone along the route corridors (km)
Yi Cross longitude distance to traffic lane i from the lane in which the SNF cask vehicle is moving (center-to-center distance between lanes)
P Average density of population along the route lying entirely within semi-width Wl2 on either side of the route (numberlsq. km.)
P ' p based on consideration of both general and occupational population
4 Mean separation distance between vehicles moving in the same direction (km)
42 Mean separation distance between vehicles moving in the opposite direction (km)
Subscripts
1 Traffic moving in the direction of the spent nuclear fuel cask vehicle
2 Traffic moving in the opposite direction of the spent nuclear fuel cask vehicle

Appendix G.
DEVELOPMENT OF CASE STUDY INPUT AND OUTPUT
The purpose of this appendix is to provide a discussion of the information used to generate the case study inputs and outputs. The emphasis of this work was to support comparisons of safety impacts associated with different mode and route selections, which required several adjustments to the information provided to and received from the Radtran 4 analyses as described below (for more on Radtran 4, see Appendix E).
PRIMARY FACTORS
The primary factors that provide the basis for the case studies include amount of material, emergency response, general population, occupational population, accident rate, trip length, and shipment duration. As outlined below, values for these factors were obtained from HazTrans, except as noted, for each of the 65 routes used in the case study analysis (for more on HazTrans, see Appendix D).
Amount of Material
Amount of material is quantifiable in the context of this analysis if it is handled as a post- processing activity once the relationship between primary factors and safety is established on a per-shipment basis. The relative payload capacity, as a modal selection factor, becomes a consideration when the number of shipments is compared. To extend the interpretation of case study results to consider amount of material, the cask payloads used in this analysis were two pressurized water reactor (PWR) assemblies per truck and fourteen PWR assemblies per rail and barge shipment. One common way to establish equivalency is to assume linearity in the radiological impacts per shipment.
Emer~encv Response
DOE has developed regional emergency management field offices that can assemble and dis- patch qualified response teams to incidents involving nuclear material. The following ten regional field offices were identified and located:
Albuquerque, NM Oak Ridge, TN Argonne, IL Richland, WA Cincinnati, OH Oakland, CA Idaho Falls, ID Aiken, SC Las Vegas, NV Brookhaven, NY

Each office determines the appropriate response and the best method for transporting the response unit to the incident site. For this reason, actual response times are very difficult to predict.
As a surrogate measure, emergency response time was represented as the average of the direct distance from the nearest field office to each route segment for that route. Distance was calculated using curvilinear distance from the nearest field office to the ends of each route segment using latitude and longitude coordinates. The segment response distance was taken as the average of the response distances to each end of the segment. A weighted average of response distances by segment length was then calculated to derive an overall route response measure.
Inherent in the use of "as-the-crow-flies* distances is the possibility of misrepresenting driving distance, available access to rail and water modes, or the possibility that teams may fly to the incident site. Because the intended purpose in the case study was to establish a surrogate measure of the proximity of qualified response to different locations along prospective routes, it was felt that the methodology could achieve this purpose given these limitations. I
General Po~ulation
Exposure of residential population along transport routes was determined using HazTrans. HazTrans contains detailed 1990 Census residential population data by geographic location. This database was overlaid onto each case study route segment using common map referencing (latitude-longitude coordinates). The population within a half-mile band around the segment was counted for the purpose of establishing the population density of interest. Population den- sities on route segments with fewer than 6 persons/krn2 were defined as rural; greater than 6 and fewer than 719 persons/km2 were classified as suburban; locations over 719 persons/km2 were defined as urban. This grouping was formed to accommodate Radtran 4 default input requirements.
The traffic sharing each route was based on assumptions made in previous radiological transport studies and in consultation with shippers and carriers. Highway traffic densities were based on assuming partially congested use of each roadway and the roadway capacity according to its functional classification. The traffic density for rail was assumed to be 2 trainslhr on mainline tracks and 0.2 traindhr on all other lines. Traffic density on rivers and the intercoastal waterway was assumed to be one barge consist per hour; no traffic within significant exposure range was assumed for Great Lakes and off-shore locations.
Occu~ational Population
Occupational population was assumed to consist of on-board personnel (primarily crew and escorts) and inspectors at stops. The size of each group for each mode was obtained from telephone conversations with shippers and carriers directly involved in the movement of spent

nuclear fuel. At the time of the Radtran 4 analyses, barge shipments of spent nuclear fuel had yet to occur. Discussions with a barge company and a shipper considering the use of barge transport, however, established the number of crew members for possible barge shipments.
Accident Rate
Accident rates for each mode and route combination were generated using the HazTrans system. HazTrans labels each transport route segment as a particular type, based on its functional characteristics, and then assigns a hazardous materials vehicle accident rate appropriate for its type that is based on previous scientific studies. Although the accident rates are reported on a per-mile basis, they were subsequently converted to a per-kilometer measure to accommodate Radtran 4 input requirements.
Accident rates utilized in the study are provided below:
Highway rural two-lane rural multilane undivided rural multilane divided rural fieeway urban two-lane urban multilane undivided urban multilane divided urban one-way street urban fieeway
Rail mainline track yards sidings
Waterway coast MS/OH/TNlMO river systems open seas, Great Lakes
2.19 x per vehlmile 4.49 x loa per vewmile 2.15 x 10" per vewmile 0.64 x lo6 per vewmile 8.66 x per vewmile 13.92 x 10" per vehlmile 12.47 x per vewmile 9.70 x 10" per vewmile 2.18 x per veldmile
6.0 x lo-' per car-mile 2.04 x 10" per car-visit 2.40 x per car-visit
1.0 x per vewmile 1.5 x 10" per vewmile 0.005 x per veh/mile
Trip Leneh and Shipment Duration
Trip lengths were derived directly fiom HazTrans by summing the segment distances compos- ing each route. Shipment duration took into consideration varying operating speeds associated with each segment type, subject to mode-specific adjustments associated with stops and delays. Stop time and delay assumptions are discussed in the following sections.

RADTRAN 4 INPUT
Radtran 4 requires a substantial amount of information to perform a single analysis. Exhibit G-1 lists all of the variables used by Radtran 4 along with their corresponding descriptions. The variables can be divided into four categories: modeling, material, mode, and route. Modeling variables define the type of analyses to be performed and specify the amount and type of output to be provided by Radtran 4. Material variables determine the type of material being shipped and its properties. Mode variables specify the amount of material being shipped, the type of handling and shipment characteristics, and the severity and release information for possible accidents. Route variables specify the length, vehicle speed, population density, number and length of stops, traffic density, and type of transportation link. Exhibit G-1 includes a letter after the name of each variable to designate its type as follows: modeling (D), material (T), mode (M), and route (R) variables.
model in^ Assumptions
Modeling variables remained constant for all cases. Modeling assumptions included
Conduct of both incident-free and accident analyses
Use of eighteen user-supplied time-integrated concentration isopleths and areas repre- senting air dispersion as developed by SNL in their data set [4,1,3], available for public use via remote telephone access
Modeling of freight movements as exclusive-use shipments.
Material Assum~tions
Material variables remained constant for all cases. Material assumptions included
Spent nuclear fuel discharged from the reactor 5 years before transport
Effective dose rate of 13 millirem/hour, the highest value permitted in Radtran 4.

Exhibit G-1. Summary of Radtran 4 Variable Descriptions
TITLE D FORM D
DIMEN NISO D
NSEV D
NGROUP D
NRAD D
NAREAS D
P A M IRNKC D
IANA D IUOF'T D
ISEN D
IPSQSB D
POPDEN R
PACKAGE LABGRP(J) T PKGSZl T PKGSZ2 T
SHIPMENT LABISO(1) T
NORMAL NMODE M
FTZNR R FTZNS R FTZNU R VELR R VELS R VELU R CREWNO M ADSTCW M HANDNO M STOPTIM R MINST R
TiMZR R
FMINCL R PDSTM RST M DISTOR M PDSTOR M RSTOR M
PPV M
FRSHR R FCTST R FTLFWY R TCNTPR R TCNTPS R TCNTPU R RPD M
Alphanumeric title UNIT indites population dose calculation
Number of isotopes Number of accident-severity categories Number of physical-chaniial groups Number of radii areas used for nondispnal mident analysis Number of areas used in dispersion accident adysis
Flag for placing data on fdc 6 (Default = 1) Analysis flag (Default = 3: boh accident and incident-free) Shielding options tlag (Default = 2: p n o m in bldgs exposed at reduced level) Rinting flag (1: @idem-free and accident output tables) Dispasal lccidcnt flag (Default = 0: user-supplied time-integntcd concentrations)
Rural. suburban. and urban population densities (Default = 6,719,3861 peopleflrm?
Alphanumeric identifiers for physical-chemical groups F i t package-size thmhold (Default = 0.5 m) Second package-size threshold (Default = 1.0 m)
A l p h ~ ~ ~ l l e r i c isotope designators
Mode number (1 = mck. 2 = nil. 3 = barge) Fraction of m l in rural zone Fraclion of travel in suburban zane Fraction of travel in urban zone Velocity in rural zone Orm/hr) Velocity in suburban zone @'r~/hr)
Velocity in urban zone &nh)
Number of crew on a shipment Avenge d i i from ndiition source to crew during shipment (m) Number of handlings pn Stop rime for shipment (hr)
Minimum stop time pn trip for shipment (hr) D i i i n d e p n a e n t sop time per trip (kr) Minimum n u m b of nil inspections or classifzations; rail mode only Number of p e w r ~ exposed during slops Avenge exposure d i when sopped Storage time per shipment (hr)
Number of p n o n s exposed during slonge for shipment Avenge exposure d i i during m n g e (m) Number of persons per vehicle sharing thc vanspon lid Fraction of urban travel during rush hour Fraction of urban travd on city sveets Fraction of rural and suburban vavel on freeways by mode One-way a+ffi count in rural zones (vehk)
One-way vdffz count in suburban tones (vehb) One-way tnffz count in urban zones (vehhr) Ratio of pcdesvian density to urban residential population dcnsity (Default = 6)

Exhibit G-1. Summary of Radtran 4 Variable Descriptions (Continued)
TRANSFER GAMMA T NEUTRON T
ACCIDENT ARATMZ R
SEVFRC M
MATERIAL RPCVAL 7
INGVAL T
DEFINE ISONAMQ T
ACCDNT(i,k) T
RELEASE RFRAC M AERSOL M RESP M AREADA D
DFLEV D
PSPROB D
OTHER RADIST M BDF M XFARM R CULVL M
BRATE D
ITRAIN M
ECONOMIC
ISOTOPES NM M
Building shiildiig factor for rural zones (Default = 1.0) Building shielding factor for suburban zones (Default = 0.87) Building shielding factor for urban zones (Default = 0.018) Number of flight attendants for commercial passenger-air mode
Coeffcknu defining gamma component of ndiation dose Coeffcimu defining neutron component of radiation dose
Accident rates (accidentsihn) Fraciin of accidents for each spcitied accident severity
Factors that determine dose to 8 organs per unit of ndmactivity of isotope inhaled Factors that determetermke dose to 8 organs per unit of radioactivity of isotope ingested
Name of isotope Isotope s p c i f ~ data
Fraction of each physicalshemiial group released in accident of each severity Fraction of isotope of each dispersion category that is released in aerosol form Fraction of a e r o s o l i isotope of each dispenion category that is respirable Area of each isodose area (Defaults in Radvan 4 Uxrs Manual) (m') Ti-integrated concentration of ndiotmclide in aerosol in each isodose area (Defaults in Raduan 4 M a d )
Probability of occurrence of each of six Pasquill aunospheric stability categories (Only requhd if IPSQSB = 1)
Radii that defm the expome annuli used in mndiirsal accident model (m) Building dose factor Fraction of rural land under ~ltivation Cleanup level following an accident (JL!iim') Brearh'ig rate (m'ls) For rail: 1 = general freight, 2 = dedicated rail
not used for this evaluation
Mode (same as NMODE) Number of s h i i Number of packages per shipment Package d o x rate at l m (mmnlhr) Fraction of effstive dose rate that is gamma radiation Fraction of effstive dose nte chac is neutron radiation Material label Name of isotope; must be equivalent to name in LABISO atray Isotope-specifi curies per package for isotope Isotope-speeifi physicalchemical gmup for isotope; ~ l s t be identical to LABGRP Isowpe-specific diirsab'ility category for isotope Characterini package dimension for material (m) D i i (ion)

Exhibit G-1. Summary of Radtran 4 Variable Descriptions (Continued)
LINK LMODEQ) R LDISTQ) R
LSPEDQ) R LPOPDQ) R LVDENQ) R LARATQ) R LZONEQ) R LTYPEQ) R
Leeend: D . modeling variables T - material variables M -mode variables R .route variables
Mode (same as NMODE) Length of link @m)
Speed of vehicle on l i Oan/hr) Population density along link @eMns/hn-)
One-way vehicle density on link (vehhr) Accident rare on l i (accidenW) Zone rypc designator for I i i (R = rural. S = suburban, U = urban) Li type designator (1 = freeway. 2 = non-freeway. 3 = all orher)
Material that was modeled consisted of 15 major isotopes (Note: the isotopes listed do not represent the entire inventory present in spent nuclear fuel):
Cobalt-60 Cesium-137 Plutonium-240 Krypton-85 Cerium- 144 Plutonium-24 1 Strontium-90 Europium- 154 Americium-24 1 Ruthenium- 106 Plutonium-23 8 Americium-243 Cesium- 134 Plutonium-23 9 Curium-244
Mode Assumptions
As necessary, the mode variables were changed between highway, rail, and waterway transport. Where the mode variables also reflected material characteristics, such as CIPKG (isotope-specific curies per package), rail and waterway values were kept the same because the waterway analyses assumed the use of a rail cask. Mode assumptions included
Existing type and size casks used for both highway and rail shipments
Highway cask payload of 2 PWR assemblies; rail cask payload of 14 PWR assemblies (This provides a 1 to 7 ratio between highway and rail cask carrying capacity.)
Number of casks per shipment and the number of shipments per mode set to one each for all modes
Accident severities assumed to be different for each mode. Highway and rail severities were derived from work performed by Lawrence Livermore National Laboratory for the NRC; barge accident severities were adjusted from the rail severity distribution by

reducing the five higher severity fractions by a factor of five and increasing the lowest severity similarly (based on conversations with DOT contractor).
Normal modal variables defining incident-free exposure determined for each mode based on discussions with shippers and carriers; kept constant for all analyses within each mode. -
Route Assumptions
Route variables were changed as necessary between routes and included all of the arrays listed under LINK as well as the NORMAL variables relating to length and number of stops and rail interchanges/inspections. The XFARM value was not included in the analyses because the
'
ingestion risk under the accident risk results has been disabled within Radtran 4 by SNL. Note that all other variables indicated as route variables are overridden by the LINK inforrna- tion.
The stops and stop times used for each analysis varied by mode and route. For highway routes, the assumption was that one inspection occurred at each state line. This was reflected in the FMINCL variable. The Radtran 4 default value of 0.01 1 hrlkm was used to represent other stop times for this mode. The stop relationships for both dedicated and regular rail were obtained from discussions with DOT staff. The independent stop time (TIMZR) was incorporated into the dependent stop time (STOPTIM) and was calculated as follows:
Dedicated: (2 hrs + 8 hrs /classification & inspection)/ total route length Regular: (16 hrs + 16 hrs/classification & inspection)/ total route length
The resulting values were added into the dependent stop times, which were:
Dedicated: 0.0055 hrdmi for west of the Mississippi River and 0.0073 for east of the Mississippi River
Regular: 0.035 hrs/rni for west of the Mississippi River and 0.047 for east of the Mississippi River
An inspection was also included if the route went more than 1,000 miles without the occur- rence of a classification. The stop time for waterborne shipments was calculated as follows:
Water: (1.5 hrs/lock & dam) / total route length.
Exhibit G-2 presents the specific variables used for each mode or the source used to obtain those variables. In many cases, particularly for the material variables, the variable listed in the table represents an array of values for different properties or modal criteria. Standard data sets were used for these arrays as referenced in Exhibit G-2.
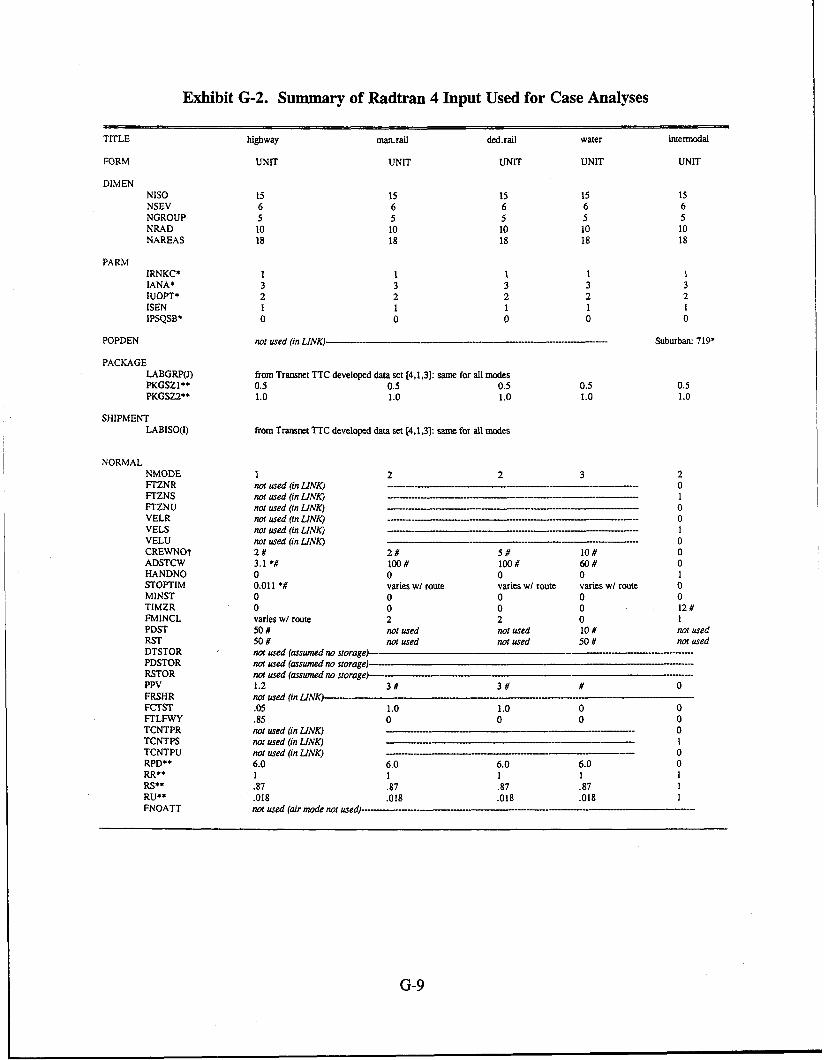
Exhibit 6-2. Summary of Radtran 4 Input Used for Case Analyses
TITLE
FORM
DIMEN NISO NSEV NGROUP NRAD NAREAS
PARM IRNKC* IANA* IUOPT* ISEN IPSQSB*
POPDEN
PACKAGE LABGRP(J) PKGSZI ** PKGSU*'
SHIPMENT LABISO(1)
NORMAL NMODE FTZNR FTZNS FTZNU VELR VELS VELU CREWNOt ADSTCW HANDNO STOPTIM MINST TlMZR FMINCL PDST RST DTSTOR PDSTOR RSTOR PPV FRSHR FCTST FTLFWY TCNTPR TCNTPS TCNTPU RPD** RR** RS** RU** FNOATT
highway manrail ded.rail water intermodal
UNIT UNIT UNIT UNIT UNIT
not used (in LINK)- ------------- Suburban: 719*
from Transnet TTC developed data set [4,1,3]: same for all modes 0.5 0.5 0.5 0.5 1.0 1.0 1.0 1.0
from Transnet TTC developed data set [4,1,3]: same for all modes
1 2 2 3 2 not used (in LINK) ------------------ 0 nor used (in LINK) ------------------ 1 not used (m LINK) ---- 0 not used (in LINK) - --- 0 not used (in LINK) ------------- 1 not used (in UNK) -------- 0 2 # 2 # 5 # 10 # 0 3.1 *# 100 # 100 # 60# 0 0 0 0 0 1 0.011 *# varies wl route varies wl route varies w l route 0 0 0 0 0 0 0 0 0 0 12 # varies wl route 2 2 0 1 50 # not used not used 10 # nor used 50 # nor used not used 50 # not used nor used (assumed no storage)- -- --- not used (assumed no storage) not used (assumed no storage) - - 1.2 3 # 3 # # 0 nos used (in LINK) .05 1.0 1 .O 0 0 .85 0 0 0 0 not used (in LINK) ----- 0 not used (in LINK) - ---- 1 not used (in LINK) --- - 0 6.0 6.0 6.0 6.0 0 1 1 1 1 1 .87 .87 .87 .87 1 .018 .018 .018 ,018 1 nor used (air mode nor used) -----

Exhibit 6-2. Summary of Radtran 4 Input Used for Case Analyses (Continued)
TRANSFER GAMMA** NEUTRON*.
as defined on p. 4-8 of Radtran 4 manual: same for all modes as defined on p. 4-8 of Radtran 4 manual: same for all modes
ACCIDENT ARATMZ SEVFRC
MATERIAL RPCVAL** INGVALS*
DEFINE ISONAM(k) ACCDNT(i,k)
RELEASE RFRAC AERSOL RESP AREADA** DFLEV** PSPROB
OTHER RADIST BDF** XFARM** CULVL** BRATE8* ITRAIN
ECONOMIC
ISOTOPES NM TABSPY(NM) PKGSHP(NM,m) TIPKG(NM,m) FRGAMA(m) FRNEUT(m) LABMAT(m)
LINK LMODEU) LDISTU) LSPEDU) LWPDU) LVDENU) LARATU) LZONE(i)* LTYPEU)
nor used (in LINK)------ --------------- from Modal Study: see section of table labeled ACCIDENT SEVERITY. . .
as defined in Radtran 4 data base: same for all modes as defined in Radtran 4 data base: same for all modes
not used (no new isotopes used for these analyses) not used (no new isotopes used for these analyses)
from Transnet TTC developed data set [4,1,3]: same for all modes from Transnet TTC developed data set [4,1,3]: same for all modes from Transnet TTC developed data set [4,1,3]: same for all modes as defined by Radtran 4: same for all modes as defined by Radtran 4: same for all modes not used (national averages used for user defined dispersion)
not used (dispersion model used for HLW and NSfl 8.68-3 8.6E-3 8.68-3 0.5 0.5 0.5 0.2 0.2 0.2 3.3E-4 3.3E-4 3.3E-4 0 1 2
not used for these evaluatioru
-1 -2 -2 -3 1 1 1 1 1.0 1.0 1 .o 1.0 13.0 13.0 13.0 13.0 1.0 1.0 1.0 1.0 0.0 0.0 0.0 0.0 SFUEL SFUEL SFUEL SFUEL See section of table labeled ISOTOPE ARRAYS for input values for the following 4 variable groups. as in Transnet TTC developed data set [4.1.3]: same for all modes data set (4.1.31 exa p. 5.28 Radmn 4 exa. p. 5.28 exa. p. 5.28 as in Transnet TTC developed data set [4,1,3]: same for all modes as in Transnet TTC developed data set [4,1,3]: same for all modes 5.2 5.2 5.2 5.2 not used (in UNK) --
1 2 from HazTrans from HazTrans from HazTrans (112 mile band width - 800 m) from HazTrans from HazTrans R, S, U based on LPOPDQ) r 6, 719, 3861 resp. l o r 2 3
-2 1 1 .o 13.0 1 .o 0.0 SFUEL
exa. p. 5.28
5.2
nor used not used nor used not used not used not used nor used not used

Exhibit G-2. Summary of Radtran 4 Input Used for Case Analyses (Continued)
Accident Severity Arrays for All Population Zones
Level MA&
Hiehwav Rail Water 1 9.948-01 9.948-01 9.99E-01 2 4.05EM 2.02E-03 8.10E-06 3 3.82E-03 2.72843 7.64E-04 4 1.80E-03 5.55E-04 3.60E-04 5 1.55E-05 6.14E-04 3.10E-06 6 9.84E-06 1.25E-04 1.97E-06
Fractional Release Arrays for Each Severity by IPCGRP
@OUD 1 Grouo 2 Grouo 3 Grow 4 G r o a
Isotope Arrays
LIBSAV ClPKG IPCGRP IDlSP m w a v Rail & W m
PKG 1 PKG2 PKG4 PKG5 PKG3 PKG3 PKG4 PKG4 PKG4 PKG4 PKG4 PKG4 PKG4 PKG4 PKG4
* Default values provided within Radtran 4 used. ** Value not explicitly included in input files but default values within Radtran 4 used. t 5 crew members assumed on train; only 2 assumed within exposure to cask. # Values obtained from shippers and/or carriers. *# Default values used by Radtran confirmed by shippers and/or carriers
Several "NORMAL" variables are hard-set within Radtran and cannot be changed. These variables are: PPH - persons per handling D, - distance from handlers to source T, - exposure time for handlings ri - distance from inspector to source Ti - exposure time for inspections SF, - shielding factor at rail stops

RADTRAN 4 OUTPUT
The output from a Radtran 4 analysis as designed for this study includes incident-free and accident-induced radiological risk values calculated in terms of person-rems. The five com- ponents of incident-free exposure include (1) crew risk, (2) handler risk, (3) off-link (or surrounding) population risk, (4) on-link (or shared facility user risk), and (5) stop risk (people exposed during stops). The four components of accident-induced radiological exposure are (1) groundshine (from external exposure to deposited particles), (2) inhalation (from breathing in particles), (3) resuspension (from inhalation of particles deposited and then resuspended), and (4) cloudshine (from external exposure to passing radioactive cloud).
As indicated previously, shipments were assumed to travel via exclusive-use vehicles requiring no storage during transit. This assumption eliminates the calculated risks to passengers (exclusive of crew and escorts) and storage personnel. Also, because the ingestion risk calcu- lations have been disabled by SNL within the current version,of Radtran 4, the associated risk could not be obtained. This risk is much smaller than the other risks and so would not affect the magnitude of the overall accident-induced radiological risk.
The current version of Radtran 4 limits route-specific analyses to 40 links. Very few of the routes analyzed in this case study contained fewer than 40 links. Therefore, each route was divided into sets of 40 links and the results from each set were added to compile the final risk values. Adjustments were made in cases where exposure was shipment- (and not segment-) based so as not to double-count those effects.
ADJUSTMENTS TO RADTRAN 4 RESULTS
Because of assumptions within Radtran 4, some modes do not include certain incident-free doses, and some doses are calculated differently. Exhibit G-3 addresses the manner in which these differences were addressed for the Radtran 4 case study analyses. Exhibit G-3 displays a matrix of the incident-free doses for the different modes being evaluated. The numbers within the matrix refer to descriptions provided following the matrix.
NON-RADIOLOGICAL RISKS
Since Radtran 4 does not model non-radiological transport risks, this measure was derived outside of the Radtran 4 methodology using HazTrans and national accident statistics. Non- radiological risk was measured as expected fatalities due to the forces of the vehicular accident. National statistics have been compiled for each mode from which fatal accident rates can be derived that are relevant for this study.

Exhibit 6-3. Adjustments to Radtran 4 Results
Highway
On-link: opposite direction 1 On-link: same direction 1 Off-link 1 Crew: on board 1 Crew: inspection 5 Stops 1
Rail - Water
1. Indicates that the dose calculation performed within Radtran 4 was used directly.
2. Indicates that Radtran 4 does not currently calculate a dose for this mode, and that not doing so is realistic because no dosage appears to generally occur here.
3. Incident-free radiological risk to crew and other on-board personnel is currently calculated only for the highway mode. Analysis was performed using the rail mode input file with all mode flags changed from 2 to 1 (rail to tractor-trailer). The resulting crew on-board dose was added to the original rail inspection dose to obtain a find crew dose.
4. Incident-free radiological risk to crew and other on-board personnel is currently calculated only for the highway mode. Analysis was performed using the barge input file with all mode flags changed from 3 to 1 (water to tractor-trailer). The resulting crew on-board dose was added to the original barge inspection dose to obtain a final crew dose.
5. The crew inspection risk is calculated only for the rail and water modes. Problems were identified within Radtran 4 for the rail inspection calculations. The number of inspections has two components, FMINCL (minimum number of inspections per shipment) and a constant times the shipment distance. FMINCL was included in every link, rather than once per shipment. The modification was to calculate the risk directly, replacing the two terms with the actual number of inspections for each route. The resulting inspection crew dose was added to the on-board crew dose to obtain a final crew dose.
6 . Radtran 4 results for the rail model stop-risk calculations were modified to account for the following two factors. First, a risk value was being calculated only for suburban links. The formulation of the stop risk calculation uses the suburban population density for rail yards. Because of this, the code only checks for suburban links in calculating the risk. Instead, all links should be considered even if the suburban population density is used in place of link-specific density. When this was corrected using a spreadsheet and the link- specific information, the stop risk was much higher than the other incident-free risks.
When the equation was re-evaluated, it appeared that the distance-independent stop-time was being summed over every link with the distance-dependent calculation. To account for this, the independent stop time was divided by the total length of the route and added to the dependent stop time during the input phase. The final rail stop risk calculations were performed in a spreadsheet independent of Radtran 4 by using a stop-risk value from the Radtran 4 analysis, dividing by the length and population density of the link and multiplying by the total length of the route and the suburban population density of 719 persons/km2.

Conversions to fatal accident rates per shipment-mile were made as follows. Highway heavy truck fatal accidents per vehicle-mile have been previously reported in the literature, as have train fatal accident rates per train-mile. Derivation of a fatal accident rate per rail cask shipment was made by assuming that the average regular train consist has 70 cars and the cask car block of 4 cars would assume 4/70 of the train accident rate. The rate for a (single) cask shipment via dedicated train was the full train accident rate. Published barge fatal accident rates are reported on a per ton-mile basis. Based on conversations with a barge carrier, it was concluded that the average dry cargo consist contains 15 barges, each carrying 1,500 tons. Conversion to a fatal accident rate per barge-mile was made using this information. All fatal accident rates were subsequently converted to a per-kilometer basis.
DISCUSSION OF RADTRAN 4 RESULTS
The aforementioned approach represents application of a hybrid tool to assist in forming tech- nical judgments. Consequently, its usefulness depends on the quality of data and relevance of assumptions.
Uncertainties are inherent in radiological risk prediction, especially for the low exposure levels associated with spent nuclear fuel transportation and potential accidents associated with its transport. Health effects (primarily related to cancer) from exposures to low doses of radiation do not appear for several years, and predictions are made using conservative estimates based on observed health effects resulting fiom exposures to much higher radiation doses at much higher rates. Using risk assessment models does not reduce these uncertainties since the output is dependent on the input data and assumptions.
Using models-that systematically represent the transport of spent nuclear fuel and activities associated with that operation, however, does provide a means for conducting a consistent comparison of the quantifiable factors and associated risks among different modes and routes for representative origin and destination pairs. Therefore, although the absolute effect of different factors on the levels of radiation doses and risks for a given mode or route may be subject to question, the case study represents a valid framework for examining dependencies and variabilities of the primary factors and their relative relationship to public safety.
Some of the key modeling assumptions contained within Radtran 4 that may significantly impact the results of these analyses are listed below. No attempt was made to change these assumptions because no basis exists for justifying such changes. They can be subjected to sensitivity analysis to gauge their importance to estimation of overall risk values.
Dedicated rail contains a Radtran 4 default exposure factor of 0.01; for regular rail this exposure factor is 0.16. This factor is used to represent the exposure time and distance for the inspection crew risk. Highway and water modes were assigned the regular rail factor (0.16) for inspection crew risk.

Stop dose is not calculated the same way for all modes. The rail model is based on the suburban population density (719 persons/km2) over a 400-meter radius area. The other modes use a specified number of people exposed at a specified average distance.
The rail stop model uses a shielding factor (0.1) while the other modes do not. This effectively reduces the rail stop risk by one order of magnitude.
The highway model includes pedestrian exposure for urban areas. Rail and water modes do not calculate any pedestrian exposure.
The water mode uses an exposure band from 200 meters to 1000 meters while rail and highway use an exposure band of 30 meters to 800 meters to measure surrounding population exposure.
As indicated above, Radtran 4 requires a large amount of information to perform a single analysis. The effect of variations of this data is difficult to determine without performing detailed sensitivity analyses on each variable.
Although Radtran 4 includes a sensitivity evaluation for the incident-free risk calculations, this evaluation is performed on a link basis for the route-specific option. No overall sensitivity is performed for the route. Therefore, use of this information for this study is limited.
A previous study, however, did assess the sensitivities of the Radtran model for a highway routing analysis. Ranked by importance, the parameters having the greatest influence on incident-free risk were (1) exposure distance at stops, (2) dose rate conversion factor (KO, which is a calculated factor based on the physical size of the container), (3) the transport index (TI), (4) number of packages per shipment, (5) number of shipments per year, and (6) trip length. Most of those factors, however, are constants in the case study analysis: exposure distance at stops was a constant for each mode; KO and TI were constant throughout; and number of packages per shipment and number of shipments per year were assumed to be one for all cases. The trip length was the only factor that varied with each modehoute combination. That study also assessed the sensitivity of accident-induced radiological risk calculations to changes in input parameter values for the following critical parameter groups: fractions of travel, accident rates, severity fractions, and release fractions. Parameters with large associated uncertainties were allowed to vary from the base case values by two orders of magnitude or more. Based on the results of that sensitivity study, it was concluded that no single parameter or parameter group dominates accident-induced radiological risk. Each of the parameter groups were determined to be significant contributors to overall accident-induced radiological risk. Increases in these parameters, however, produced disproportionately smaller increases in overall risk. It can be inferred, therefore, that the results of the Radtran 4 model are stable across wide ranges of input parameter values. Although the results of the sensitivity study cannot be applied directly to the primary factors being evaluated in the case analyses, they do give some indication of inherently stable tendencies within the Radtran 4 modeling environment.

PRESENTATION OF CASE STUDY FACTOR AND RISK VALUES
Exhibit G-4 presents summary case study values for both primary factors and radiological and non-radiological risks. This information is organized by origiddestination pair and mode. The inputs and calculations presented in this exhibit demonstrate that relevant information on primary factors can be collected by mode and route; these factors can be applied to a risk assessment methodology, and the overall impacts to safety can be quantitatively measured. They also show that the values of these primary factors vary considerably across the modelroute alternatives and, therefore, have meaningful roles in choosing an option to enhance safety.
The cases are organized by mode in Exhibit G-5, where component and overall risk values are presented for incident-free and accident-induced radiological risk, respectively. This infor- mation substantiates that risk values also vary considerably by O/D pair, mode, and route, due to variations in primary factor values. This exhibit also lends itself to some meaningful conclusions concerning the relative magnitudes of risk associated with various shipment characteristics. For example, incident-free risk tends to dominate the overall radiological risk associated with spent nuclear fuel shipments. In most instances, incident-fiee risk is much larger than accident-induced radiological risk.

Exhibit G-4. Summary Case Study Factor and Risk Values
O/D Mode Pair
Independent Variables
Length Population Avg. No. Average Accident Average (km) Density of Crew Speed Rate Response
(perkm2) (kmlhr) (acc./km) Dist. (km)
Non-Rad Risk
No. of Fatalities
Incident Free Risk
Total (Person-
! rem) I
3.14E-03 2.21E-02
I 2.07E-02 I 2.82E-02 I 1.53E-02 I 1.28E-01 I
2.42E-03 3.36E-02 5.08E-02
I 4.15E-02 4.81E-02 4.30E-01 I 3.08E-02 6.43E-02
I 6.11E-02 I 6.83E-02
6.22E-01
5.28E-03 9.74E-02 1.12E-01 1.1lE-01
I 3.82E-02 I 1.57E-01
4.39E-02 I 1.76E-01 I
6.57E-02 I 1.50E-01
8.08E-02 7.74E-02 9.88E-02
I 6.23E-02 I 7.01E-01 I 8.01E-02
9.24E-01
I 1.26E-01 I 3.85E-01 I 1.77E-01 I 1.93E-01 I 1.95E-01 I 8.52l32 I 9.25E-01
2.42E-01 I 1.35€+00 I
9.52E-02 3.22E-01
I 2.12E-01 2.33E-01
I 2.08E-01 I 1.06E-01 I 9.58E-01 I 1.17E-01 I l.23E+OO I 1.23E-01 I l.23E+OO I I
Rad. Accident
Risk I Total ( (person- ! rem) I
4.32E-04 I 1.05E-04 I 1.01E-04 I 1.49E-05 I 4.48E-04 I 4.48E-04 I
2.15E-07 I 9.83E-04
1.32E-04 2.03E-04
I 2.89E-03 2.89E-03 I
I 1.71E-03 6.27E-04
I 8.02E-05 4.14E-03 4.14E-03
1.44503 4.23E-04 1.83E-04 1.35E-04
I 4.95E-03 1 4.95E-03
4.49E-03 I 4.49E-03 I I 2.26E-03 I 2.M-03
1.22E-04 9.22E-05
I 6.81E-05 1.96E-03 1.96E-03 2.54E-03 2.54E-03 I
1 9.56E-03 I 9.56E-03
2.06E-04 I 3.28E-04
5.19E-05 3.23E-03 3.23E-03
I 1.09E-02 I 1.09E-02 I I 5.40E-03 I 540E-03 I 1.51E-03 I 3.27E-04 I 5.96E44 I 8.48E-03
8.48E-03 4.98E-03 4.98E-03 ' 6.64E-03 6.64E-03 I I

Pair
M D M D M
Exhibit E4. Summary Case Study Factor and Risk Values (Continued)
Independent Variables Non-Rad Incident Rad. Risk Free Risk Accident
Risk Length Population Avg. No. Average Accident Average No. of Total i Total (km) Density of Crew Speed Rate Response Fatalities I (person- (person-
(per/km2) (km/hr) (acclkm) Dist. (krn) ! rem) ! rem)
D - dedicated train (rail) M - manifest train (rail) H - highway W - waterway WD - intermodal - barge and dedicated train WM - intermodal - barge and manifest train

Exhibit G-5. Radtran 4 Component and Overall Risks
--
,": Mode
' ,. Incl&nt F m Risk (pno~m) Incldanl F r r RII
Crew Handllnps Off-Unk On-Unk I Total ''Op j (penon-rem)
Rad. Acci&nl Rbk (pnormm) , Risk
Grwnd Inhalation Resuspension Clwdrhine To(al'persw I rem)

trn Pair Mode
Exhibit G-5. Radtran 4 Component and Overall Risks (Continued)
Incident Fns lnslded Fns Rlsk (perrorrnm) Rlsk
Crew Handlings OffUnk Onllnk Stop I 1 (perno-m)
I I
6.78E-04 0.00E+00 6.78E-04 0.00E+00 1.78E-03 1 3.14E-03
6.69E-04 0.00E+00 1 .OlE-05 0.00EWO 1.74E-03 f 2.42E-03
1 A6E-03 0.00E+00 2.76E-02 0.00E+00 l.74E-03 1 3.08E-02
1.586-03 0.00E+00 1.85E-03 O.OOE+OO 1 B4E-03 1 528E-03
I
7.39E-03 4.86E-02 8.72E-04 1.43E-05 8.85E-03 1 6.57E-02
2.00E-02 4.86E-02 4.17E-02 6.22E-04 1.53E-02 1 126E-01 1.83E-02 4.86E-02 7.96E-03 9.58E-05 2.03E-02 I 9.52E-02
9.52E-02 4.86E-02 6.70E-03 1.10E-03 4.81842 1 2.00E-01
8.62E-02 4.86E-02 9.78E-04 2.03E-05 1.47E-02 f 1.50E-01
2.63E-01 4.86E-02 4.37E-02 7.38E-04 2.96E-02 1 3.85E-01
2.36E-01 4.86E-02 8.02E-03 7.67E-05 2.93E-02 1 3.22E-01 1.43E+00 4.86E-02 6.18E-03 7.338-04 8.28E-02 f 1.57E-0
Rad. Accident Rad. Accldent Rlsk (personram) Risk
I
Ground Inhallon Resuspension CloudrMm 1 'pcmon- nml
Leaend: D - dedicated train (rail)
M - manifest train (rail)
H -highway
W - waterway
WD - intennodal - barge and dedicated train
WM - intennodal - barge and manifest train

APPENDIX G BIBLIOGRAPHY
Federal Emergency Management Agency. 1989. Handbook of chemical hazard analysis procedures. U.S. DOT and U.S. EPA.
Fischer, E. E., et al. 1987. Shipping container response to severe highway and railway accident conditions. U . S. Nuclear Regulatory Commission, NUREGICR-4829, Val. 1.
Harwood, D. W., J. G. Viner, and E. R. Russell. 1990. "Truck accident Fate model for hazardous materials routing. " Transportation Research Record 1264, 12-23.
ICF, Inc. 1989. Nuclear waste: Is there a need for federal interim storage? Monitored Retrievable Storage Review Committee.
Neuhauser, K. S., and P. C. Reardon. 1986. A demonstration sensitivity analysis for Radtran 3. SAND 85- 100 1, Sandia National Laboratories.
Neuhauser, K. S., and F. L. Kanipe. 1992. Radtran 4: Volume 3, User Guide. SAND 89-2370, Sandia National Laboratories.
U.S. Department of Energy. 1992. Summary listing of EM facilities by field ofice and installation. Office of Environmental Restoration and Waste Management.
U . S . Department of Transportation. 1990. National Transportation Strategic Planning Study (h'TSPS) .
U. S . Nuclear Regulatory Commission. 1977. Final environmental statement on the transportation of radioactive material by air and other modes. NUREG-0170.

Page intentionally left blank.

Appendix H.
MODEL ESTIMATION USING CASE STUDY ANALYSIS RESULTS
This appendix describes the use of the results of the case study database to statistically estimate model (i.e., equation) coefficients for the radiological risk models presented in Chapter 5. Model (i.e., equation) estimation was performed in order to develop a more detailed look at the relationship of primary factors to the risk components of public safety and to examine the sensitivity of risk components to individual factors and factor coefficients.
MODELING APPROACH
The database comprised of the inputs and outputs of case,studies contains values for the independent variables (primary factors) and dependent variables (incident-free and accident- induced radiological risks, respectively). Multiple linear regression analysis was considered as the initial means of model estimation. A close examination of the terms contained in the incident-free model equations revealed, however, several terms with common factors (e.g., t,) or terms that intuitively would be highly correlated. A subsequent correlation analysis of independent and dependent variables by mode confirmed this observation. The appearance of correlation of terms and factors typically leads to coefficient estimation problems due to multi- colinearity, resulting in estimates lacking statistical confidence and often possessing improper signs.
To address this concern, model estimation was designed around the use of single variable linear regression, estimating the coefficient of each term independently, using the primary factors included in the term as the independent variables and the incident-free risk component as the dependent variable. This approach was also intuitively appealing since each term was derived independently to represent a specific incident-free risk component.
Evaluation of the quality of the regression analysis results was governed~by the following cri- teria: (1) the overall goodness of fit, as measured by the adjusted R2, (2) proper signs for the estimated coefficients, and (3) statistical confidence in each coefficient estimate, as measured by the t-statistic. A coefficient estimate was considered significant if the magnitude of the t- statistic exceeded the value corresponding to a 95 percent confidence that the coefficient value is significantly greater than zero. This value from the tdistribution varies by sample size and degrees of freedom, and therefore by mode in this case study. Corresponding t-values for each mode based on the case study sample size are:
Threshold Mode t-Value
Highway
RegularlDedicated Rail
Waterway
Intermodal

Separate models were estimated by mode. The model results and statistical measures are presented for incident-free risk by mode in Exhibits H-1 through H-5, respectively. The radiological accident risk model results and statistical measures for each mode appear in Exhibit H-6. These results are evaluated, in turn, in the following discussion.
MODEL COEFFICIENT DERIVATIONS
This section presents the results of the regression analysis performed to estimate incident-free and radiological accident risk model coefficients, respectively.
H i ~ h w a ~ Incident-Free Risk
The highway incident-free risk model estimation results appear in Exhibit H-1. Each coefficient, its corresponding value, t-statistic, and adjusted R2 are presented. In addition, the mean value of the independent variable associated with each coefficient (consisting of primary factor values) is presented along with the estimated intercept (constant) and the mean value of the dependent variable (incident-free risk component).
Exhibit H-1. Highway Incident-Free Risk Model
Mean Value of Mean Value Risk Coefficient Independent of Dependent
Coefficient Component Value +Statistic Adjusted R' Variable Constant t-Statistic Variable
a! off-link pop. 1.48 x lod 8.92 .781 912.29 @o 3.48 x 1W 1.73 .002 (R,)
a2 on-link pop. 1.26 x lo4 11.32 ,852 151.81 (T PLL) 7.76 x lo-' 0.36 .020 (R2)
a3 crew 1.73 x 10⁵ 54.41 ,993 58.09 (N-tJ 8.02 x 1W3 3.29 .I08 (R,)
a, pop. at stops 3.18 x 10" 872.14 .999 1379.27 (L) 1 . 1 1 x lo4 1.67 .044 (R,)
R,, (highway) = 1.48 x lo4 p t,+ 1.26 x lo4 T fL/L + 1.73 x 10⁵ N,, t, + 3.18 x lW5 L + 9.26 x 10''
All four coefficients in the highway incident-free risk model have the expected sign and are statistically significant. In addition, each coefficient and associated term is able to explain over 75 percent of the variation in its respective risk component. The component terms are grouped to present the overall derived expression for highway incident-free risk, RIFE (highway), at the bottom of Exhibit H-1.
In reviewing the mean values of the independent and dependent variables, a few items are notable. First, the independent variable associated with a, is large for highway (relative to other modes) because of the higher traffic densities of shared-facility users in highway operations. Similarly, the relatively low value for the a, associated term is due to smaller crew sizes for truck shipments. Finally, the overall contribution of a, and its term to highway incident-free risk is probably due to lower population densities along the interstates, where wider right-of-way is part of the facility design.

Re~ular Rail Incident-Free Risk
Exhibit H-2 presents the regular rail incident-free model estimates and statistical information. As in the case of highway, all coefficient estimates exhibit the expected signs, are statistically significant and have high adjusted R2. The resulting equation at the bottom of Exhibit H-2 is a composite representation of regular rail incident-free risks for spent nuclear fuel shipments.
Exhibit H-2. Regular Rail Incident-Free Risk Model
Mean Value of Mean Value Risk Coefficient Independent of Dependent
Coefficient Component Value t-Statistic AdjustedR1 Variable Constant t-Statistic Variable
a, off-link 5.95 x lod 15.26 .943 3128.24 (ptJ -3.58 x 1W -0.26 ,018 (RJ
a2 on-link 1.12 x 10" 12.97 .923 0.68 (T PLL) 7.93 x I@" 1.17 .001(R2)
a, crew 7.6) x 10" 8.06 .820 82.20 (N,~J 1.14 x 10" 1.26 ,074 (R,)
a, pop. at stops 2.49 x 10J 15.31 ,943 2010.00 (L) 1.32 x 10" 3.39 ,063 (R,)
R,, (regularrail) = 5.95 x 10⁴p t, + 1.12 x 10" T PL/L + 7.64 x lo4 N, t, + 2.49 x 10'' L + 2.43 x 1W2
One item of note is the relatively large value of the incident-free risk term associated with crew exposure in contrast to the dedicated rail model. This is due to the crew exposure factor of 0.16 used in Radtran 4 for regular rail in contrast to a factor of 0.01 for dedicated rail. Although the other modes used a similar exposure factor of 0.16, the number of inspections is generally much smaller relative to rail operations.
Dedicated Rail Incident-Free Risk
The dedicated rail incident-free risk model estimate and associated statistics appear in Exhibit H-3. Similar findings as reported previously apply here as well, in terns of model goodness of fit and coefficient signs and significance. The overall model as presented at the bottom of Exhibit H-3 represents the entire derivation for dedicated rail incident-free risk for spent nuclear fuel shipments.
Exhibit H-3. Dedicated Rail Incident-Free Risk Model
Mean Value of Mean Value Risk Coefficient Independent of Dependent
Coefficient Component Value t-Statistic Adjusted R2 Variable Constant t-Statistic Variable
a, off-link 4.75 x 10⁶ 28.15 .982 3965.50 @t,) -1.02 x lo4 -0.13 ,019 (R,)
% on-link 7.61 x lo4 25.27 .978 1.12 (T PL/L) 7.16 x 10" 1.77 .001 (R2)
crew 9.84 x lod 18.76 .962 210.87 (N-tJ 1.11 x 10" 8.45 .003 (R,)
a, pop. at stops 9.13 x 10⁴ 10.95 ,895 2010.00 (L) 5.51 x 10' 2.75 .024 (K)
R,, (dedicated rail) = 4.75 x lo4 p t, + 7.61 x lW T PL/L + 9.84 x 10⁶ N, t, + 9.13 x lo4 L + 6.59 x 10⁵

Waterwav Incident-Free Risk
Because of the nature of waterborne transport, this model specification did not hclude on-link population exposure on the Gulf, Great Lakes, and oceans. A Boolean variable (0 for waterway; 1 otherwise) was included in the final model to account for this feature, thus removing the a, term from the waterway model specification. Results of the waterway incident-free risk model estimation appear in Exhibit H-4. Model estimation statistics for off- link population risk are quite favorable, in contrast to an improper sign for the crew risk model coefficient and poor t-statistics for both crew risk and stop risk. The small sample size for waterway may be contributing to this effect. Fortunately, off-link population is the dominant independent variable in contributing toward the magnitude of waterway incident-fiee risk.
Exhibit H-4. Waterway Incident-Free Risk Model
Mean Value of Mean Value Risk Coefficient Independent of Dependent
Coeftrcient Component Value t-Statistic Adjusted R' Variable Constant t-Statistic Variable
a, off-link 1.15 x IOd 67.08 999 6701.16 @t,) -1.64 x lo4 -0.79 (RI)
a1 crew -2.59 x 10'" -0.23 -.458 489.26 k t , ) 4.05 x lo4 0.24 (R3)
a, pop. at stops 5.78 x 10d 0.65 -.240 487.38 (L) 1.75 x 10“ 34.43 ,002 (&)
R,, (waterway) = 1.15 x 10⁴p t+ 2.59 x 1@'O N, t, + 5.78 x 10" L + 1.99 x 10"
Interm' odal Incident-Free Risk
As noted in Exhibit H-5, all intermodal incident-free risk model coefficients have the expected sign; however, the a, and a, coefficient estimates are not statistically significant. This is of concern, given the relatively large contribution of a, and its associated term in the overall risk expression. The low value of the adjusted R, is a result of the fact that the on-link exposure only exists on the rail portions of the intermodal trip. Given the strong statistical strength of the other incident-free risk models and the a, (handling) term in the intermodal model, it may be preferable to model intermodal risks as the sum of the following three components: (1)
Exhibit H-5. Intermodal Incident-Free Risk Model
Mean Value of Mean Value Risk Coefficient Independent of Dependent
Coeftrcient Component Value t-Statistic Adjusted Ra Variable Constant t-Statistic Variable
a1 off-link 1.95 x lod 16.43 .975 8647.63 @t,) -2.35 x 10' -1.65 .015 (RJ
a2 on-link 2.86 x 10" 1.00 .001 13.59 (T t2,L) 3.68 x I@' 0.09 .0004 (R,)
a, crew 2.32 x lod 0.18 -.I60 1763.21 (N-t,) 8.28 x 10' 0.36 .012 (RJ
a, pop. at stops 1.29 x 10" 4.99 .773 2961.27 (L) -7.22 x 10⁵ -0.83 ,031 (RJ
4 handling 4.90 x 10⁵ d a d a 1.00 (HI) d a d a .049 ($)
R,, (intermodal) = 1.95 x lo4 p t + 2.86 x 10" T t2,2/L + 2.32 x 10⁴ N,, t + 1.29 x 10" L + 4.77 x 10"

originating mode, (2) intermodal transfer, using the a, handling term only, and (3) delivery mode.
Accident-Induced Radiolo~cal Risk Models
All the accident-induced radiological risk model estimation results are presented by mode in Exhibit H-6. In all cases, the b, coefficient estimates have the expected sign. Coefficient statistical significance and overall goodness of fit as measured by the adjusted R2 are also good, with the exception of the waterway radiological accident risk model. Fluctuations in population exposure as a function of width of the waterway and the small sample size are the likely causes of this problem. In general, however, the estimated equations appear to be useful predictors of radiological accident risk values for spent nuclear fuel shipments.
Exhibit H-6. Accident-Induced Radiological Risk Model
Mean Value of Mean Value of Independent Dependent
Mode Coefficient Coefficient Value t-Statistic Adjusted R' Variable Constant t-Statistic Variable
Highway b, 1.55 x 10.' 9.20 .792 .046 @LSJ -2.35 x lW -2.32 .0005
R,, (highway) = 1.55 x I@'@ L SJ - 2.35 x lo4
Regular Rail' b, 7.19 x 10" 11.41 ,902 .089 @LSJ -6.74 x lo4 -1.08 .OM
RAa(regularhain)=7.19x 1w2(pLSJ-6 .74~ l(r
Dedicated Rail' bl 7.19 x 10⁵ 11.41 .902 .089 (pLSJ -6.74 x 10' -1.08 .006
R,, (dedicated hain) = 7.19 x 10' (p L SJ - 6.74 x 10⁴
Waterway b~ 6.89 x lo4 1 S O .295 SO3 @LSJ 5.49 x l(r 1.33 ,001
R,, (waterway) = 6.89 x lo4 (p L SJ + 5.49 x lo4
Intermodal 'A 8.41 x lw3 4.40 ,724 ,474 @LSJ 1.46 x 1 w3 1.40 .005
RA,,(intermoda1)=8.41 x lw3@LSJ+ 1.46~10.'
'Equation estimated using overall national rail accident rate.

Page intentionally left blank.

Appendix I.
DOT RESPONSE TO COMMENTS ON THE DECEMBER 1993 DRAFT REPORT
INTRODUCTION
This appendix reviews and responds to the comments submitted by the public on the draft report "Identification of Factors for Selecting Modes and Routes for Shipping High-Level Radioactive Waste and Spent Nuclear Fuel," December 1993.
The U.S. Department of Transportation (DOT) was directed by Section 15 of HMTUSA to undertake a Mode and Route Study. The purpose of this study was " . . .to determine which factors, if any, should be taken into consideration by shippers and carriers in order to select routes and modes which, in combination, would enhance overall public safety related to the transportation of high-level radioactive waste and spent nuclear fuel." The Act also directed the U.S. Department of Transportation to "...include notice and opportunity for public comment. . . . "
The draft report, "Identification of Factors for Selecting Modes and Routes for Shipping High- Level Radioactive Waste and Spent Nuclear Fuel," December 1993, was made available by the DOT for public comment and was formally announced in the Federal Register, December 30, 1993, p. 69450.
Thirteen responses were received in the response docket (see Exhibit 1-1). The majority of the commentors were governmental organizations (or contractors acting on their behalf). Of the four cornmentors who were not governmental organizations, two were industry organizations (one representing the electric power industry and the other representing the railroads), one was a railroad, and one was a consultant acting on his own behalf.
The major issues raised in the comments are summarized below, organized by subject area. The response of the DOT, in italics, follows each issue.
STUDY OaTECTIVES
Focus on NWPA Shipments
Several commentors argued that the report should specifically address the upcoming mode and route decisions for Nuclear Waste Policy Act (NWPA) shipments, to both the national repository and the Monitored Retrievable Storage (MRS) facilities, directly and in detail.

Exhibit 1-1. Cornmentors on the December 1993 Draft Report
Association of American Railroads (AAR)
Board of Education, Ballston Spa (NY) Central School District
Clark County, Nevada, Department of Comprehensive Planning, Nuclear Waste Division
Edison Electric Institute (EEI), Nuclear Waste and Transportation Program
Intertech Services Corp. on behalf of White Pine County, Nevada, Board of White Pine Commissioners
Intertech Services Corp. on behalf of Lincoln County Commissioners and the Caliente City Council
Jefferson, Robert M., consultant
State of Nevada, Agency for Nuclear Projects, Nuclear Waste Project Office
State of New Mexico, Energy, Minerals and Natural Resources Department, Radioactive Waste Consultation Task Force
State of Tennessee, Department of Environment and Conservation, Division of Radiological Health
Union Pacific Railroad Company
United States Department of Energy, Office of Technology Development, Office of Special Programs, Transportation Management Division
Western Interstate Energy Board (WIEB), High-Level Radioactive Waste Committee

They alleged that the legislative history shows that this was Congress' focus and "explicit technical assistance.. .is sorely needed. " On the other hand, another commentor stated that the study should not focus on the repository shipments, because MRS and other shipping campaigns will occur well before those shipments commence.
DOT Response:
The DOT acknowledges the concern, especially among western states, about the modes and routes that the U.S. Department of Energy (DOE) would use to transport shipments to a repository location in Nevada. DOT has sought to keep this initial study generic so that the findings would be useful for planning ongoing shipments and intra/interutility transfer shipments in the near term, as well as NWPA shipments further in the future. For the latter, guidance provided by this study may facilitate both the establishment of mode/route selection policies for DOE, and agreement among DOE, carriers, and representatives of the public interest regarding specflc routes to the MRS and repository.
STUDY SCOPE
Environmental Protection as Part of the Definition of "Public Safetv"
One cornmentor stated that expanding "public safety" to include the environment is unnecessary because "the study assumes that accidents which impact the environment might eventually impact the safety of the public.. . . " Another commented that incorporating "environment" without a proper definition creates yet another roadblock to transporting radioactive material (RAM).
DOT Response:
Not all of the links between environmental contamination and human health are necessarily direct, known, or fully understood. Excluding environmental contamination, however, essentially limits the effects of a release to human exposure at the time of the accident. The goal of minimizing exposure of the environment was therefore included as part of the "overall public safety" objective to acknowledge potential indirect, long-term efSects on human health of a radioactive material release.
A working dejinition and unit@) of measure for environmental exposure/contamination would need to be developed if it is to be a selection factor. Although, the study recognizes the merits of this selection factor, resources were insuficient to recommend both a dejinition of sensitive environmental areas and a practical unit of measure. This is an area needing further research.

Perceived and Other Non-Calculable Risks
Several non-calculable factors, including perceived risk, drew much more attention than other defined issues. Some cornmentors alleged that the perceived risk and public confidence are significant factors in planning and implementing safe RAM transport and thus warranted greater discussion. It was also suggested that the study might recommend the development of ways to incorporate non-calculable risks into traditional risk models. Another commentor asserted that "regulatory policy should not be based on risk perception, but rather on objective and measurable criteria."
DOT Response:
The term "perceived risk" could refer to either a specijic aspect of safety or a general concern about the transportQtion of RAM. A perceived risk often refers to a specijic concern/hazard (e.g., a rail line through a high vandalism area or a highway route that passes near a large hospital) that affected parties believe has not received proper consideration, ofen because it cannot be readily addressed by traditional, quantitative risk assessment methods. This type of perceived risk is so case-speczjic that it is not suitable for use as a general selection factor. Perceived risk may also refer to general concerns about the safety of shipping RAM that are not specifically recognized or considered by conventional criteria. Where this concern is directed at completely prohibiting transporiation or exporting the risk to other jurisdictions, perceived risk cannot be a selection factor because the parties advancing such concern seek to avoid the selection of mode and route entirely. Where the need to transport over a given corridor is acknowledged, however, perceived risk could influence mode choice if one mode is believed to be safer than another. Even so, it cannot be a definitive selection factor, since there is no objective, measurable criterion on which to base a choice.
It is appropriate for state or local government and other entities representing public interests to identi& and advance such concerns about perceived risks. In a joint decision making process (among shippers, carriers, and representatives of public interests), perceived risks would be considered when arriving at a final choice among a set of viable options identijied by shippers and carriers using the selection factors recommended by this report.
Treatment of the Cask
If, as one commentor asserted, "safety is in the package" and thus "selection of mode and route will have little to do with enhancing safety," the study might be considered flawed because it overlooks the role of the cask in transport safety.
Another commentor noted that the report does not deal directly with cask integrity and the accidents and forces that can cause casks to fail. It only addresses the probability of an accident and the consequences of a release, not the likelihood of a release accident.

DOT Response:
The use of a certified cask and the level of safety it acfords was assumed by the Department of Transportation to be consistent for all modes and routes, given the uniform mechanical and thermal performance standards for all casks (10 CFR 71) and assuming that the accident environment is essentially the same for all modes. '
MODEIROUTE SELECTION FACTORS
Sifmificance of Anv Factors, Given the Safetv Afforded bv the Cask and Com~liance with Other Safetv Regulations
One commentor observed that "DOT's decision not to preclude use of any particular mode for SNF shipments reflects DOT's conclusion that an adequate level of public safety is afforded for shipments by any mode, provided that the shipper and carrier comply with applicable regulations. "
DOT Response:
The Hazardous Materials Transportation Uniform Safety Act (HMTUSA) is concerned about selection of modes and routes that "would enhance overall public safety" for, it is presumed, transportation in certified casks in compliance with existing regulations. DOT's position must be that truck, rail and barge modes do provide adequate safety i f regulations are complied with.2 "Adequate" safety, however, does not mean "equal" safety. This report was intended to identify primary factors that aflect the safety of transportation performed in compliance with all regulations.
Suggest Additional Mode and Route Selection Factors
Among the additional mode and route selection factors mentioned in the comments were aspects of modelroute combinations that would bring the cask near other hazards, such as hazardous materials on either the same train or other vehicles on the same route.
?he NRC report entitled "Shipping Container Response to Severe Highway and Railway Accident Conditions" (1987) evaluated the accident environment for each mode. It found that the percentage of accidents exceeding the 10 CFR 71 mechanical and thermal loading conditions (i.e., accidents that could "create a radiological hazard to the public") is 0.6% for both truck and for rail (adjusted for thermal performance). Severe loading, however, was determined to be more likely in rail accidents (0.012% of rail accidents vs. 0.001 % for truck). Nevertheless, when cask payloads and consequences were considered, risk per accident was comparable for both modes (results adjusted to yield a risk per fuel assembly basis). Given those fmdigs, it appears that the accident environment is fairly comparable for truck and rail and therefore is not a significant factor in mode choice. There is presently no similar analysis of the accident environment for barge transport.
'Air transport of certain shipments of radioactive material& prohibited or restricted by 10 CFR 71.88 and 73.24.

DOT Response:
The comparative safety of dedicated trains (only RAM shipments) and regular trains, which may contain hazardous materials, is the subject of an ongoing DOT study mandated by Congress. Congressional action on that subject may ultimately affect modal use.
Another additional mode and route factor mentioned in the comments was proximity to schools.
DOT Response:
Nearness of a route(s) to special facilities with large populations that may be dificult to evacuate would only be considered if the better routing alternatives were essentially equivalent with respect to the overall risks to the public. Note that proximity to special facilities was considered in this study to be a subset of general population exposure. (See also the DOT response on 'perceived risks" in Section 3.2).
Other mode and route factors mentioned were the characteristics of specific routes, including those of a temporary (e.g., construction) or seasonal nature, and specific locations where risk contributors occur (e.g., severe slope or dangerous crossing).
DOT Response:
The data on accident rates, a primary factor, would reflect substantial hazards associated with seasonal weather or particularly dangerous locations, i f the data are by route segment. If a more generic accident rate is used, however, a selected set of candidate routes might need to be examined for such hazards before making the_final selection. Temporary hazards would not be reflected in accident data and so would appropriately be considered for tactical changes to routing in certain circumstances.
Finally, some cornmentors mentioned, as additional mode and route factors, the effects of operational restrictions, such as speed limits and time-of-day transit of cities.
DOT Response:
The potential for altering the normal operation of a mode to @resumably) improve safety varies somewhat. Certainly, it is dificult or impossible to change the operation of a non-exclusive use, scheduled vehicle, such as a regular train; but for most mode/route choices, operational changes or restrictions are possible. Speed limits may reduce accident severity, but may increase accident likelihood at the same time, i f the vehicle disrupts the normal flow of traflc. The time of day that a vehicle transits a city (e.g., late night/early morning) may reduce accident likelihood and exposure of the general population, but also lengthens trip duration and consequently increases exposure of the crew and those people near stops. Since the net effect on public safety

cannot be predicted except for a particular time or one particular route, the ability to apply operational adjustments cannot be a primary mode/route selection factor.
Failure to Weight Factors to Reflect Relative Effect on Risk
A commentor observed that the Report starts off by saying it will "assess the degree to which the various factors affect overall public safety.. . . " The Report later states, however, that "No attempt has been made to weight these factors.. . . " Another commentor said that the "study must address the degree to which each factor, and various combinations of factors, contribute to the enhancement of overall public safety. "
DOT Response:
Weights, which reflect the relative importance of each primary selection factor, could simplz~ the selection of modes and routes by focusing attention on the (typically) more important factors. They could also provide the basis for a 'Iformula" that could pro- duce ajigure of merit for each mode/route combination. There are several very serious dificulties, however, that prevented an attempt to weight the primary factors.
A fundamental issue in assigning weights is the treatment of radiological risk versus non-radiological risk. In risk assessments, the non-radiological risk is typically found to be many times greater than radiological risk. Therefore, if radiological and non- radiological risks are treated as equally important (i.e., unweighted), the factors that aflect non-radiological risk would determine the modehoute selection @rimarily accident rate). This approach, however, seems to ignore concerns over radiological risk. To avoid this problem, non-radiological risk must either be treated as less important (i. e., weighted much less) than radiological risk or eliminated from consideration. If, on the other hand, overall radiological risk is the principal concern, then the factors that generally rule mode/route selection are those that drive incident- free radiological risk @rimarily trip duration), because it is usually much greater than that associated with accidents. But it is the consequences of an accident that are usually the focus of public concern. Consequently, most risk assessments treat radiological and non-radiological risk separately. Weighting of selection factors dependsjirst and foremost on the importance (weight) assigned to the three main categories of risk, and that is a deliberative policy matter and is not conducive to being simplified or generalized.
An additional complication is that the influence each primary factor has on the types of risk varies from mode to mode, as was demonstrated in the sensitivity analysis conduct- ed as part of this study. For example, length of the route has a widely varying eflect on incident-free radiological risk. It is a primary determinant for both dedicated and manifest train modes, has a modest egect for highway, and virtually none for waterway. Therefore, it is inappropriate to assign a single weight to a factor that would apply to all modes.

LOGISTICS OF A SHIPPING CAMPAIGN
Amount of Material to Be Shipped (As It Affects Mode Choice)
To one commentor, the amount of material to be shipped is "hardly worth mentioning", because cask availability and modal access often dictate mode choice regardless of the amount to be shipped, while another commentor states that mode choice is based primarily upon modal access and the amount of material to be shipped.
DOT Response:
Mode choice is limited to those modes that can actually access the shipment origin and/or destination. Highway access is universal. In most shipping situations, however, there would be at least one alternative to trucking. Recent DOE studies determined that over two-thirds of nuclear power plants assessed were sewed by rail and/or barge and that most could handle these heavier casks. In addition, cask availability is expected to be less of a constraint on mode choice in the future, when large numbers of both truck and rail/barge casks are produced. Consequently, there will often be a choice of modes for a shipping campaign and, in those cases, the amount of material to be shipped would be a very important consideration.
Single vs. Multiple Cask Shipments
One commentor faulted the study for not reaching "any conclusions about the impact on safety of multi-cask car shipments by rail versus single cask shipments by rail or truck. " The commentor stated that "the safety of a limited number of multi-cask car train shipments which are subject to special preparations (e.g., track inspection, escorts, on-board emergency response) [should be] compared to many general commerce train shipments without special preparations; and the safety of truck convoys versus single truck shipments" should be assessed. Also, another commentor said, "The decision to assume a single cask per shipment appears to be ill-conceived, contributing little to resolution of a critical issue in the current debate on modelroute selection (i.e., potential benefits associated with multiple cask shipments). "
DOT Response:
For simplicity's sake, a single cask shipment basis was used in the original case study presented in the December 1993 draft report. Another primary factor, amount of material to be shipped, has been added in the revised report to reflect the capability of
3A recent DOE review of modal access to power plants (see J.M. Viebrock and N. Mote , "Near-Site Transportation Infrastructure Project Final Report," Nuclear Assurance Corp. for US DOE, Norcross, GA, DOElCH/10441-1, February 1992) found that over two thirds of the sites assessed are rail andlor barge capable. A contemporary DOE study (Facility Interface Capability Assessment) showed that most facilities can handle the heavier railharge casks.

a single railbarge cask to accommodate more fuel assemblies than a truck cask. Results presented in the revised report show that reducing the number of shipments by using the larger cask cuts the overall risk dramatically. By implication,handling more than one cask per train or barge would reduce risks further. For example, adding a second cask to a dedicated train would cut the non-radiological risks per cask in half, since only one train would be operated to transport both casks. Furthermore, adding a cask to the train reduces incident-free radiological risk, as well. Exposure of onboard personnel is cut because each cask shields a portion of the other cask's radiation and the average distances between the casks and those people increases. 7;hese and other effects can be incorporated when and if multiple-cask shipments are considered for a specific shipping campaign.
CASE STUDIES
General Limitations of Probabilistic Risk Models
One commentor observed that "computer models have significant limitations in performing risk assessments. These models can assist in preliminary selection of routes. But, as a comprehensive tool they fall short on two points: the most complete model will never be complete enough to make it immune to some criticism on a technical basis and the addition or subtraction of risk factors will never be complete. The data requirements for extensive models will push costs higher as potential benefits remain static. These models also are incomplete because they will never be credible to people at risk without some involvement on their part." In turn, another commentor faulted the study for its "uncritical reliance upon probabilistic risk models. . . . "
DOT Response:
The limitations of risk models were apparent when this study was planned. Therefore, the study incorporated several alternative and complementary analytic techniques: ( I ) the hierarchical analysis of a comprehensive listing of candidate factors, (2) deliberations of the Technical Advisory Group, (3) the derivation of risk equations, and (4) case studies. Also, an overall qualitative assessment of the identified factors was conducted.
Risk models should be viewed as contributing to, but not dictating, the selection of modes and routes. There are many important qualitative considerations that they are not able to address.
Assumptions and Data Used in the Case Studv Analvsis
The case study analysis assumed that all trains hauling spent fuel operate at 35 mph.

DOT Response:
While one commentor contends that it is not a realistic assumption to state that all railroads follow the 35 mph guideline of the Association of American Railroads (MR), waybills for all DOD shipments specifi a speed limit of 35 mph and it appears that rail carriers uniformly comply with this requirement. Also, carriers generally follow the AAR guideline for other RtFM shipments. The principal exception is the Union Pacij?c, which limits shipments on its lines to 50 mph. Therefore, assuming a limit of 35 mph is not an unrealistic simplification.
National average accident rates, rather than route-specific rates were used in the case study analysis.
DOT Response:
Accident rate data for the specijic mode/route combinations being examined in the case studies would have been preferred. Much of this information is not readily available. Even i f had been available, using link-specijic data for the 65 mode/route combinations would have been a formidable undertaking. Consequently, accident rates typical of various types of highway, rail, and water links were used. This approach adequately served the purposes of the case studies. The use of route-specijic accident data is certainly more feasible and warranted for detailed mode/route studies for a given shipping campaign.
CONCLUSION
Section 15 of HMTUSA directed the DOT to include "notice and opportunity for public comment." This appendix has reviewed the major issues brought up by those who commented on the December 1993 draft report.
A majority of the 13 responses were from governmental organizations (or contractors acting on their behalf). The comments in these responses fell into five broad categories: study objectives, study scope, modelroute selection factors, the logistics of a shipping campaign, and the case studies. Each of these categories included one or more issues relating to the movement of high-level radioactive waste and spent nuclear fuel. Each of those issues has been addressed in this appendix.
All of the comments received were given due consideration in the preparation of the final Mode and Route Study report. Where appropriate and feasible, the revised report incorporates changes resulting from DOT'S review of the public comments on the December 1993 draft report.