identification criteria for residues determined by lc-ms ... · gain insight in actual variability...
TRANSCRIPT

Identification criteria for residues determined by LC-MS/MS:
are they fit-for-purpose?
EURL-Pesticides joint workshop Almeria, 23-25 October 2013

Content
Current criteria and their origin
Criteria elsewhere
Systematic assessment of experimental (R)RT and ion ratio deviationsvs EU criteria for LC-MS/MS (triple quadrupole)
Conclusions and impact on revision of AQC document
Outlook to other LC-MS, GC-MS techniques
Further justification/clarification of proposed changes in draft AQCand discussion during AQC session

Identification of pesticide residues in EU
SANCO/12495/2011
# 73 Use of selective detectors (ECD, FPD, NPD, DAD, Flu): Not suited for unambiguous identification Chromatography with mass spectrometry is required
# 75 Chromatographytr ≥ 2*t0
Criterion for relative retention time: GC ±0.5% LC: ±2.5%

Identification of pesticide residues in EU# 76-80 Mass spectrometry
Requirement with respect to # diagnostic ions

Identification of pesticide residues in EU# 76-80 Mass spectrometry
Requirement with respect to ion ratio

1997: pre-EURL era: initiative by A. Hill (UK), A. de Kok (NL), A. Anderson (S) to harmonise AQC for pesticide residue analysis in foodIdentification: qualitative description, emphasis on GC-MSEICs: similar RT, peak shape, response ratiosFS: intensity ratios of principle ions within 80-120% of standardSIM: ≥2 ions m/z >200 or ≥3 ions m/z >100
1999: FS: intensity ratios of principle ions should be within 70-130% of standard
2003: -
2006: Incorporation of RT and ion ratio criteria from CD 2002/657/EC RRT should be within ±0.5% for GC and ±2.5% for LCIon ratio:
Evolution of (LC-MS/MS) identification criteria
GC‐ECD/NPD/FPDGC‐MSD, ITDHPLC‐UV; Flu
QuEChERS
GC‐MSD, ITDLC‐MS/MS
S19, Luke, EtOAc+ LLE, GPC, SPE
GC‐MSD, ITDGC‐MS/MS
LC‐MS/MS(U)HPLC
QuEChERS

2007: -
2009: Revision of text on identificationDifferent types of MS specifically addressed
2011: -
Evolution of (LC-MS/MS) identification criteria
GC‐MSD/ITD/TOF; GCxGC‐TOFGC‐MS/MS
(U)HPLC‐MS/MSTOF, Orbitrap
QuEChERSmini‐luke, SweEt, dil& shoot
QuEChERSmini‐luke, SweEt, dilute&shoot
GC‐MSD/ITD/TOF, GC‐MS/MS, GCxGC‐TOF, GC‐QTOF, GC‐APCI‐MS
(U)HPLC‐MS/MSLC‐(Q)TOF, (Q)Orbitrap
FI‐MS, DMS, ion mobility

EU: SANCO/12495/2011 vs 2002/657/EC2002/657/EC (products of animal origin): Fixed legislative rule instead of guidance Identification point system
3 ID points required for vet. drugs and contaminants (incl. pest.)4 ID points required for anabolic and unauthorized substances
2002/657 ID points: 3 points 4 points 4 points

Developement in criteria vs methodsIdentification criteria for LC-MS/MS in EU: Fundament = 2002/657 (but discussed and created in late 1990’s)
.........did not change since.....
Meanwhile in pesticide residue analysis:MRLs from 0.05-0.1 => default 0.01 mg/kgLC-MS/MS main stream technique5 generations of instruments + new vendorsHPLC => UHPLCSample preparation: more generic extraction + little/no clean up => dirtier extractsScope from 20-50 pesticides to 200 (400 transitions) in 15 min.
Do the criteria still make sense? Are they still fit-for-purpose?

LC-MS/MS identification criteria elsewhereareas

Multi-lab assessment identification
Objectives: Gain insight in actual variability of ion ratios and retention times obtained
with today’s generic sample prep & instrumentation under routine conditions Systematic investigation of variability of retention times and ion ratios To verify whether there (still) is a rational for the current EU identification criteria To provide experimental evidence to underpin future guidance on identification
Parameters affecting qualitative performance the pesticide: ions chosen, # ions, absolute response, relative abundance concentration => absolute response matrix: solvent, commodity, sample preparation, matrix equivalent introduced analysis technique (GC or LC, ionization mode, single MS; MS/MS; QqQ, QTOF) instrument and acquisition parameters used acquisition: dwell time; # datapoints across the peak stability of response of the instrument co-elution with other compounds

Multi-lab assessment identificationToo many options to cover all..... Start with:
Technique: LC-MS/MS (triple) [preferred technique for majority of pesticides]
Matrix: Fruits & Vegetables
[most frequently analysed + high incidence of residues]
Scope: wide variety of pesticides in multi-method, different conc.
Cover multiple laboratories = LC-MS/MS instruments/conditions5 labs: UA, CVUA, FERA, NVWA, RIKILT

Wide variety of pesticides: classes, polarity, MW, sensitivity
abamectine chlorpropham etofenprox kresoxim‐methyl oxamyl pyrimethanilacephate chlorpyrifos famoxadone linuron paclobutrazole pyriproxyfenacetamiprid chlorpyrifos‐methyl fenamidone lufenuron parathion spinosyn Aaclonifen clofentezine fenamiphos malathion parathion‐methyl spinosyn Daldicarb cyanazine fenhexamid metaflumizone pencycuron spiromesifenaldicarbsulfon cyazofamid fenoxycarb metalaxyl pendimethalin spiroxaminealdicarbsulfoxide cypermethrin fenpropimorph methamidophos phorate tebuconazoleazoxystrobin deltamethrin fenpyroximate methidathion phosmet tebufenozidebifenazate desmedipham fenthion methiocarbsulfon phosphamidon tebufenpyradbifenthrin diazinon fenuron methomyl phoxim terbutrynbitertanol dichlorvos flonicamid methoxyfenozide pirimicarb thiabendazoleboscalid dicrotophos flucycloxuron metolcarb pirimiphos‐methyl thiaclopridbutylate diethofencarb flufenoxuron metoxuron prochloraz thiamethoxamcarbaryl difenoconazole fluquinconazole monocrotophos profenofos thiocyclamcarbendazim dimethoate fluroxypyr monolinuron propachlor triadimenolcarbofuran diuron flutriafol monuron propamocarb triazophoschlorfenvinphos dodemorph imazalil myclobutanil propham trichlorfonchlorfluazuron ethiofencarb imidacloprid nitenpyram propoxur trifloxystrobinchlorotoluron ethiofencarbsulfon indoxacarb omethoate propyzamide triflumizolechloroxuron ethiofencarbsulfoxide iprodione oxadixyl pyridaphenthion triforinediuron‐D6 (IS)
Set up of project

Set up of project Cover matrices relevant with respect to intake and varying complexity (21)
Samples collected by each lab, homogenisation according to lab procedure One sample preparation method (QuEChERS, CEN version no dSPE clean up) Blank + spiked extracts at 3 levels: 0.01 mg/kg, 0.05 mg/kg, 0.20 mg/kg LC-MS/MS analysis using routine conditions of the lab
2 transitions for each pesticide (same transitions for all labs)
Extract Column (mm) T Eluent (gradient)
MS/MS g/mL Vinj pg * L ID stationary phase µm (°C) water/ additives mL/min
Waters Premier XE 0.2 5 10 100 2.1 BEH C18 1.7 60 MeOH 5 mM NH4Fa 0.45
AB Sciex 4000 1.0 2 20 100 2.1 BEH C18 1.7 40 MeOH 10 mM NH4Fa 0.40
AB Sciex 5500 0.125 5 6.25 100 3 Atlantis T3 3 35 MeOH 5 mM NH4Ac/0.1% FA 0.40
Agilent 6490 0.125 5 6.25 150 2.1 Zorbax Rap.Res. HD Eclipse+ C18 1.8 50 MeOH 5 mM NH4Ac 0.50
Agilent 6490 0.10 10 10 150 4.6 Zorbax Eclipse XDB C8 5 amb ACN 0.1% FA 0.60* pg on-column for a sample containing 0.01 mg/kg

Set up of projectSequence: Solvent standards at beginning and end Spiked extracts, solvent standards randomized but same for all labs (120 inj.)
solvent 0 spinach 50 ppb broccoli blank solvent 50 onion blank apple 10 ppbsolvent 2.5 kiwi 50 ppb solvent 200 spinach 200 ppb leek 200 ppb solvent 10solvent 5 melon 10 ppb white cabbage 50 ppb apple 200 ppb paprika 50 ppb pear 10 ppbsolvent 10 solvent 200 potato 200 ppb rinse (acetonitrile) white cabbage blank tomato blanksolvent 25 apple 50 ppb green beans 50 ppb cucumber blank broccoli 200 ppb broccoli 10 ppbsolvent 50 strawberry 10 ppb pear 200 ppb kiwi 10 ppb tomato 50 ppb strawberry blanksolvent 100 solvent 10 solvent 50 green beans 200 ppb tomato 10 ppb cucumber 50 ppbsolvent 200 potato 50 ppb onion 10 ppb carrot 10 ppb lettuce 50 ppb lettuce blankgrapes 50 ppb solvent 200 lemon blank orange 10 ppb carrot blank lemon 50 ppbcauliflower 200 ppb spinach 10 ppb cucumber 10 ppb cauliflower 50 ppb solvent 50 leek 10 ppbbroccoli 50 ppb carrot 200 ppb potato blank solvent 50 leek blank cauliflower blankkiwi 200 ppb melon 50 ppb melon blank potato 10 ppb apple blank onion 50 ppbsolvent 10 cauliflower 10 ppb grapes 200 ppb melon 200 ppb lemon 200 ppb solvent 0lemon 10 ppb lettuce 10 ppb lettuce 200 ppb leek 50 ppb solvent 200 solvent 2.5geen beans 10 ppb carrot 50 ppb paprika 10 ppb tomato 200 ppb solvent 50 solvent 5green beans blank paprika 200 ppb white cabbage 10 ppb onion 200 ppb pear 50 ppb solvent 10strawberry 50 ppb solvent 200 strawberry 200 ppb rinse (acetonitrile) solvent 10 solvent 25kiwi blank cucumber 200 ppb rinse (acetonitrile) paprika blank orange blank solvent 50orange 200 ppb rinse (acetonitrile) spinach blank white cabbage 200 ppb pear blank solvent 100grapes 10 ppb grapes blank solvent 10 rinse (acetonitrile) orange 50 ppb solvent 200

Set up of projectData evaluation done in each lab: Manual verification of peak assignment/integration 21 matrices x (blank +3 levels) x 120 pesticides x 2 transitions = 21,600 EICs Exclude integrated noise, include any peak in blank within ±0.25 min of expected RT Export to Excel, send to RIKILT
Data analysis RIKILT: Total 100,800 RTs and areas At individual lab-basis: determine reference RT, RRT, ion ratio
=> average of all solvent standards after removal of artefacts (too low signals, saturation) Calculate deviations of RT, RRT, ion ratio for individual pesticides/samples/conc. Investigate relationships deviations vs reference (R)RT and ion ratio Compare experimental data from 5 labs/systems with current EU criteria
Ana LozanoAmadeo Fernadez-Alba
Anne WolheimMichelangelo Anastassiades
Monica Garcia LopezRichard Fussell
Jos ScholtenAndre de Kok
Paul Zomer

Example (relative) retention times observedR
eten
tion
time
in m
in →
Pyriproxyphen: RRT solv.std ave = 1.813 RRT matrix ave = 1.812RT solv.std ave = 10.297 min RT matrix ave = 10.298 min
↑RRT↓
+2.5%
- 2.5%
10.56
10.04
1.858
1.768IS = D6-diuron , RT =5.68 min

Example (relative) retention times observedR
eten
tion
time
in m
in →
Propamocarb: RRT solv.std ave = 0.211 RRT matrix ave = 0.207 RT solv.std ave = 1.174 min; RT matrix ave = 1.196 min
↑RRT↓
+2.5%
- 2.5%
IS = D6-diuron , RT =5.68 min

Stability of (relative) retention timesSD vs (relative) retention time for solvent standardsinterspersed in a sequence of 120 injections of sample extracts
absolute retention time (min) relative retention time (vs D6-diuron)
SD does not increase with RT (slightly with RRT?)
SD
→

Stability of (relative) retention times
absolute retention time (min) relative retention time (vs D6-diuron)R
SD
(%) →
RSD vs (relative) retention time for solvent standards interspersed in 120 inj.-sequence
No increase of SD with RT => RSD descreases with RT Slight increase of SD with RRT => RSD stable with RRT No improvement of RSDs by using RRT (multi-method)
(R)RT criterion ±2.5% => 1.20±0.03 min ........10.30±0.26 min Relative criterion for (R)RT does not make sense (gradient elution)

Observed absolute retention time deviations
Lab 1 Lab 2 Lab 3 Lab 4 Lab 5RT deviation (min)*0‐0.025 99.97 99.75 99.13 99.21 87.940.025‐0.05 0.03 0.25 0.13 0.44 8.480.05‐0.1 0.00 0.00 0.75 0.33 2.690.1‐0.15 0.00 0.00 0.00 0.02 0.340.15‐0.20 0.00 0.00 0.00 0.00 0.090.2‐0.25 0.00 0.00 0.00 0.00 0.21>0.25 0.00 0.00 0.00 0.00 0.26* deviation of pesticide in matrix from average RT of solvent standards
percentage of all pest/matrix/conc. combinations
0.9% for Lab 50.16% based on all lab results
Retention time deviation of 120 individual pesticides in 21 different matricesat 3 concentration levels relative to their solvent-standard RT reference
dominated by pirimicarbterbutryn, dicrotophos
Retention time deviations >0.10 min are exceptionsin today’s LC-MS analysis (gradient elution, using column oven)
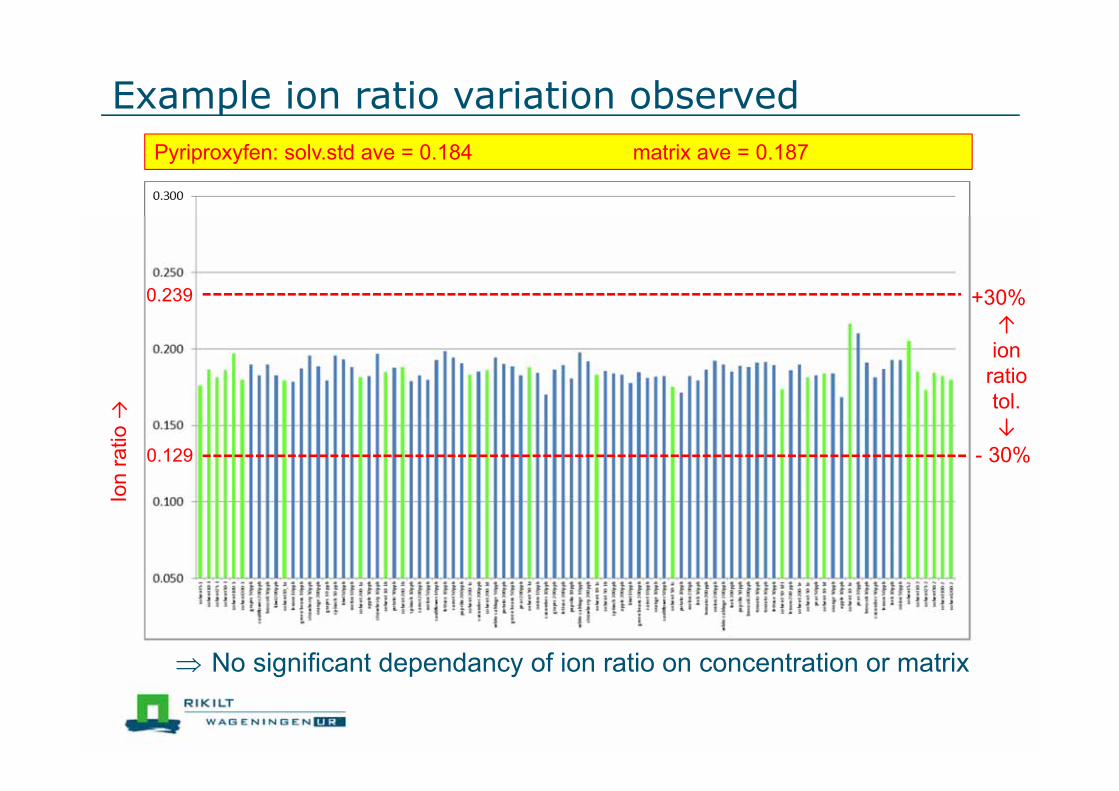
Example ion ratio variation observedIo
n ra
tio →
Pyriproxyfen: solv.std ave = 0.184 matrix ave = 0.187
↑ion
ratiotol.↓
+30%
- 30%
0.239
0.129
No significant dependancy of ion ratio on concentration or matrix

Ion ratioSolvent standards (=reference)
analyte Lab average RSD (%) N EU EU min EU max min max min maxpyriproxyfen 1 0.184 5 26 30 0.129 0.240 0.173 0.216 0.168 0.210pyriproxyfen 2 0.224 4 27 25 0.168 0.281 0.205 0.237 0.207 0.242pyriproxyfen 3 0.308 5 29 25 0.231 0.385 0.283 0.346 0.279 0.345pyriproxyfen 4 0.060 12 28 50 0.030 0.091 0.050 0.083 0.048 0.074pyriproxyfen 5 0.254 3 29 25 0.191 0.318 0.239 0.274 0.227 0.275
Samples
Partial snapshot of compilation made...General information on response and variability within the sequenceTransition‐1 Transition‐2RF (area/pg) solvent standards RF (area/pg) solvent standards slope 2/slope 1
analyte Lab average RSD (%) N RRF average RSD (%) N RRF ion‐1 ion‐2pyriproxyfen 1 2625 21 26 5.677 483 21 26 1.046 0.89 0.91pyriproxyfen 2 4529 13 27 1.793 20205 13 27 7.998 1.17 1.15pyriproxyfen 3 216876 9 29 5.780 66519 6 29 1.773 0.92 0.93pyriproxyfen 4 4529 10 29 4.301 275 13 28 0.261 0.84 0.69pyriproxyfen 5 16662 16 29 16.007 4235 17 29 4.069 1.22 1.31

Example ion ratio variation observedIo
n ra
tio →
Propamocarb: solv.std ave = 0.246 matrix ave = 0.239
↑ion
ratiottol.↓
+25%
- 25%
0.308
0.185
No significant dependancy of ion ratio on concentration or matrix

Example ion ratio variation observedIo
n ra
tio →
Kresoxim-methyl: solv.std ave = 0.724 matrix ave = 0.748
ion ratiotol.
+20%
- 20%
0.869
0.579
5 pp
bso
lv.s
td 10 p
pbso
lv.s
td
50 p
pbso
lv.s
td50 ppb grapes10 ppb lemon
10 ppb gr. beans10 ppb strawberry
10 ppb spinach
10 ppb cauliflower
50 ppb cabbage10 ppb paprika
10 ppb potato
10 ppb apple 50 ppblemon
Reference: average solv.std 0.724, RSD=12% (N=29); No signal in blankOutside EU criterion: 3x solv. std (5, 10, 50 ppb)
8x 10 ppb in matix; 3x 50 ppb in matrix

Assessment variation ion ratios (solv.stds)RSD ion ratio vs average ion ratio RSD ion ratio vs average ion ratio
AB Sciex 5500 Qtrap
RSD ion ratio vs RF 2nd (least intense) ion
Agilent 6490
RSD ion ratio vs RF 2nd (least intense) ion

% d
evia
tion
of io
n ra
tio
from
refe
renc
e=
aver
age
of s
olve
nt s
tand
ards
Ion ratio (least/most intense ion) →
Investigation ion-ratio deviation from reference value
Waters Premier XE
Ion ratio ≡ relative intensity

% d
evia
tion
of io
n ra
tio
from
refe
renc
e=
aver
age
of s
olve
nt s
tand
ards
Investigation ion-ratio deviation from reference value
area of least intense ion →
Waters Premier XE
malathion

% d
evia
tion
of io
n ra
tio
from
refe
renc
e =
aver
age
of s
olve
nt s
tand
ards
Ion ratio (least/most intense ion) →
Investigation ion-ratio deviation from reference valueAB Sciex 4000

% d
evia
tion
of io
n ra
tio
from
refe
renc
e =
aver
age
of s
olve
nt s
tand
ards
Investigation ion-ratio deviation from reference value
area of least intense ion →
AB Sciex 4000

% d
evia
tion
of io
n ra
tio
from
refe
renc
e=
aver
age
of s
olve
nt s
tand
ards
Ion ratio (least/most intense ion) →
Investigation ion-ratio deviation from reference valueAB Sciex 5500 Qtrap

% d
evia
tion
of io
n ra
tio
from
refe
renc
e=
aver
age
of s
olve
nt s
tand
ards
Investigation ion-ratio deviation from reference valueAB Sciex 5500 Qtrap
area of least intense ion →

% d
evia
tion
of io
n ra
tio
from
refe
renc
e=
aver
age
of s
olve
nt s
tand
ards
Ion ratio (least/most intense ion) →
Investigation ion-ratio deviation from reference valueAgilent 6490 (lab A)

% d
evia
tion
of io
n ra
tio
from
refe
renc
e=
aver
age
of s
olve
nt s
tand
ards
Investigation ion-ratio deviation from reference value
area of least intense ion →
Agilent 6490 (lab A)

% d
evia
tion
of io
n ra
tio
from
refe
renc
e=
aver
age
of s
olve
nt s
tand
ards
Ion ratio (least/most intense ion) →
Investigation ion-ratio deviation from reference valueAgilent 6490 (lab B)

% d
evia
tion
of io
n ra
tio
from
refe
renc
e=
aver
age
of s
olve
nt s
tand
ards
Investigation ion-ratio deviation from reference value
area of least intense ion →
Agilent 6490 (lab B)

% of pesticides not identified as function of ion ratio tolerance for different response (area) ranges
Ion ratio tolerance vs identification
Agilent 6490 (lab B)
‘S/N’ < 3
from 10 400 2000 6000 18000 54000 162000to 400 2000 6000 18000 54000 162000
393 1059 1017 1504 1545 1107 1659%dev<±15 52.9 23.8 13.9 10.6 8.2 8.6 8.4<±20 41.7 14.9 7.6 4.2 2.9 3.9 3.5<±25 34.4 10.0 5.1 2.2 1.2 1.4 1.1<±30 28.2 8.1 4.0 1.5 0.6 0.5 0.4<±50 14.8 3.6 1.3 0.4 0.3 0.2 0.1<±60 12.2 2.5 1.0 0.2 0.3 0.2 0.1<±70 10.2 2.4 1.0 0.1 0.3 0.2 0.0
area range of least intense ion
# data points for the range indicated above
% of pesticides not identified
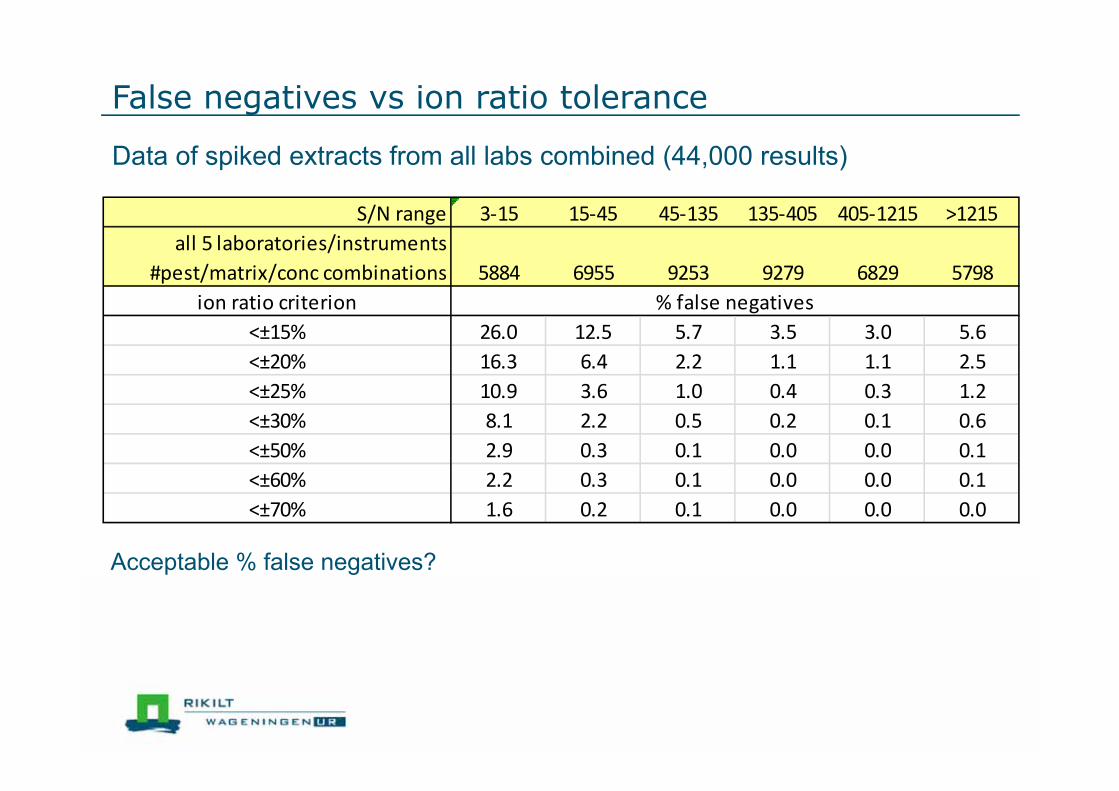
S/N range 3‐15 15‐45 45‐135 135‐405 405‐1215 >1215all 5 laboratories/instruments
#pest/matrix/conc combinations 5884 6955 9253 9279 6829 5798ion ratio criterion
<±15% 26.0 12.5 5.7 3.5 3.0 5.6<±20% 16.3 6.4 2.2 1.1 1.1 2.5<±25% 10.9 3.6 1.0 0.4 0.3 1.2<±30% 8.1 2.2 0.5 0.2 0.1 0.6<±50% 2.9 0.3 0.1 0.0 0.0 0.1<±60% 2.2 0.3 0.1 0.0 0.0 0.1<±70% 1.6 0.2 0.1 0.0 0.0 0.0
% false negatives
False negatives vs ion ratio tolerance
Data of spiked extracts from all labs combined (44,000 results)
Acceptable % false negatives?

RT criterion # transitions Ion ratio criterionDetected ≥ 0.002 mg/kg
Detected ≥ 0.010 mg/kg
≤ ± 0.1 min 1 ‐ 121 662 None 61 13
EU 40 12≤ ± 20% (rel) 36 10≤ ± 25% (rel) 39 11≤ ± 30% (rel) 44 12≤ ± 50% (rel) 46 12
All data blank extracts compiled (12,600 pesticide/matrix combinations)
(False) positives vs ion ratio tolerance
True positives

Conclusions multi-lab assessment identification LC-MS/MS
Retention time: Retention times are highly stable, mostly within 0.05 min of REF RT,
and virtually always within <0.10 min Retention time deviations are not related to the retention time,
so a relative criterion in % does not make sense There is no reason for not setting criteria for absolute RT instead of RRT
Ion ratio: No obvious relation between relative abundance of the two transitions
and the observed ion-ratio deviations The ion ratio deviation of an analyte in a sample from its reference value
is mainly determined by MS response (S/N)
It makes sense to adjust the criteria in line with these conclusions

Extrapolation to other types of MS ?

Outlook LC-single stage HRMS21 fruits/vegetablesQuEChERS (AOAC, no dSPE clean up)Blank + spikes at 0.01, 0.05, 0.20 mg/kg
5 µl inj. into LC-full scan hrMS (Exactive Orbitrap)Alternating scan events:1. Without fragmentation2. With ‘all ion fragmentation’ (HCD cell, 30 eV)RP = 50,000 (m/z 200, FWHM)
0.01mg/kg mefenpyr‐diethyl in orange
Mol HGJ, Zomer P, de Koning M, Anal Bioanal Chem (2012) 403:2891–2908
2 diagnostic ions: multiple options.... At least 1 fragment Various options for ratio determination:
Frag-2 / Frag-1Frag-1 / [M+H]+Frag-2 / [M+H]+.......

% d
evia
tion
of io
n ra
tio
from
refe
renc
e=
aver
age
of s
olve
nt s
tand
ards
Ion ratio (least/most intense ion) →
Investigation ion-ratio deviation from reference valueThermo Exactive
[M+H]+ or [M+NH4]+fragment (AIF, HCD)

% d
evia
tion
of io
n ra
tio
from
refe
renc
e=
aver
age
of s
olve
nt s
tand
ards
Investigation ion-ratio deviation from reference value
area of fragment →
Thermo Exactive

mg/kg # detected % detected # detected % detected # detected % detected0.01 1145 88% 898 69% 1120 86%0.05 1270 98% 1140 88% 1263 97%0.20 1296 100% 1197 92% 1285 99%
no criterion EU ion ratio criterion fixed ion ratio tol. ±50%
Ion ratio tolerance vs identification
LC-single stage HRMS62 pesticides in 21 matrices, 3 levels diagnostic ionsFragment-1 / [M+H]+ (both <5 ppm mass accuracy)
Fixed ion ratio tolerance: Investigated up to ±50% => no false positives (for the 62x 21 = 1302 pest/matrix combinations investigated)

Justification/outlook GC-MS(/MS)
Multi-lab evaluation for GC-EI-MS/MS foreseen in 2014
Also assess GC-EI-MS (SIM) ??

Thank you for your attention
Funding: Dutch Ministry Economic Affairs

Default criterion for absolute retention time
Reference RT is average of solvent standards (or matrix-standard if free of interference)
Criterion: ≤ ± 0.10 min for both LC and GC
Proposed changes identification: Retention time
Remarks:In LC use of column oven highly recommendedBe aware of analytes suseptable to RT shifts (pKa vs pH, HILIC, ....)Be aware of RT shifts due to heavy matrix loadingIn case of greater RT deviations: IL-IS or overspikes may help you out

Proposed changes identificationIon ratio deviations are mainly determined by S (S/N) not by the ratio of the two ions
In theory, a tolerance taking S/N into account would make senseIn practice not.........
One fixed tolerance: taking into account experimental data, experience, guidance in other areas: ±30% relative
Extrapolation to other techniques (LC-HRMS(n), GC-MS/MSBut not (yet) to GC-EI-single stage MS (GC-MSD)
Ion ratio(least/most intense ion)
Maximum tolerance (relative)for GC-EI-MS1
Maximum tolerance (relative)for LC-MSn, LC-MS, GC-MSn, GC-CI-MS
0.50-1.00 10 % 30 %0.20-0.50 15 % 30 %0.10-0.20 20 % 30 %<0.1 50 % 30 %
Table 5. Default recommended maximum permitted tolerances for relative ion intensities using a range of spectrometric techniques

Remarks: Reference = average of solvent standards measured in the same sequenceMatrix-standards only if demonstrated to be free of signal for diagnostic ions used
Remarks on proposed changes identification
Fixed retention time criterion: RT± 0.1 minall levels 0.01 mg/kg 0.05 mg/kg 0.20 mg/kg# IDs out of 37800 # IDs out of 12600 # IDs out of 12600 # IDs out of 12600
EU ± 30% EU ± 30% EU ± 30% EU ± 30%33284 33484 10506 10600 11296 11332 11482 1155288% 89% 83% 84% 90% 90% 91% 92%
Ion ratio criterion
Impact of change of default ion ratio criterion (LC-MS/MS ion ratio project):

Additional remarks
What if coinciding peaks for both transitions are present but ion ratio is incorrect?
If concentration calculated for both transitions > MRL => must do additional ID exp.
If concentration calculated for both transitions > RL => should do additional ID experiments; or: increase RL, report as suspect or ‘NA’
If concentration for one transition < RL => report as < RL
No rule will ever cover all pesticide/matrix/conc./instrument combinations, there will always be exceptions to be decided on a case-to-case basis with proper justification, depending on what’s at stake.


Rational behind the identification criteriaAim: avoiding false positives as much as possible (being <?.?%)
Scientific rational?
Other techniques: 2002/657/EC: expert judgement (≤ 2001)SANCO pesticides AQC: 2002/657/EC + further expert judgement 2009-2011
GC-MSD
Three ion rule
Interpretation as fixed legislative rule heavily debatedSelectivity of ions varies, instrument performance varies, etc etce.g. Lehotay et al, TrAC 27 (2008) 1070-1090
False positives are rare but do occur (how often?)False negatives occur more frequently at the lower levels (how often?)

Chromatography: General: RT ≥ 2*t0Retention time: ≤ ± 0.10 min for both LC and GC
MS/MS:≥ 2 transitionsavoid product ions formed by loss of H2O, NH3 or other common moietiesS/N of transitions ≥ 3chrom. peaks for both transitions must coincide and have same peak shape
Proposed changes identification
Ion ratio(least/most intense ion)
Maximum tolerance (relative)for GC-EI-MS1
Maximum tolerance (relative)for LC-MSn, LC-MS, GC-MSn, GC-CI-MS
0.50-1.00 10 % 30 %0.20-0.50 15 % 30 %0.10-0.20 20 % 30 %<0.1 50 % 30 %
Table 5. Default recommended maximum permitted tolerances for relative ion intensities using a range of spectrometric techniques

CD 2002/657/EC: identification point approach

CD 2002/657/EC: LC-MS/MS
LC criteria: General: IS shall be used, RT ≥ 2*t0Retention time: RRT ≤ ± 2.5%
MS/MS criteria: General: at least one ion ra o ≡ 2 transitions
S/N diagn. ions ≥ 3
Ion ratio (= lowest response/highest response): Relative intensity ion1/ion2
Max. permitted deviation
> 50% ± 20% (rel)
>20%-50% ± 25% (rel)
>10%-20% ± 30% (rel)
≤ 10% ± 50% (rel)
Example: reference ion ratio = 60%Ion ratio in sample must be 60%±20% = 60±12% = between 48%‐72%

SANCO/12495/2011
Applies to pesticides in food and feed (396/2005)Guidance document, must be followed by official labs but no formal legal statusBi‐annually updated (revision currently in progress)
http://ec.europa.eu/food/plant/protection/pesticides/docs/qualcontrol_en.pdf

SANCO/12495/2011LC criteria: General: RT ≥ 2*t0Retention time: RRT ≤ ± 2.5%
MS/MS criteria: General: ≥ 2 transitions
avoid product ions formed by loss of H2O, NH3S/N diagn. ions ≥ 3chromatographic peaks of diagn. ions must coincide
Ion ratio (= lowest response/highest response): Relative intensity ion1/ion2
Max. permitted deviation
> 50% ± 20% (rel)
>20%-50% ± 25% (rel)
>10%-20% ± 30% (rel)
≤ 10% ± 50% (rel)
Example: reference ion ratio = 10%Ion ratio in sample should be 10%±50% = 10±5% = between 5%‐15%

USA: FDA ORA-LAB.10
Applies to pesticides in food and feed Regularly updated
Identification point system similar (but not identical) to 2002/657/EC 4 ID points are requiredLC‐MS/MS = 4 points (1 point for RT, 1.5 points per transition)

USA: FDA ORA-LAB.10 LC criteria: General: ‐Retention time: within 5% or RT within experimental precision
MS/MS criteria: General: ≥ 2 transitions
avoid product ions formed by loss of H2O, NH3S/N diagn. ions: quantifier ≥10, qualifier ≥ 3not more than 2 diagn. ions from an isotopic cluster
Ion ratio (= lowest response/highest response): Relative intensity ion1/ion2
Max. permitted deviation
> 40% ± 20% (rel)
>10%-40% ± 25% (rel)
≤ 10% ± 50% (rel)
Example: reference ion ratio = 20%Ion ratio in sample must be 20%±25% = 20±5% = between 15%‐25%

USDA PDP Data and Instrumentation rev. 1
PDP = pesticides data program Applies to pesticides in food and feed

USDA PDP Data and Instrumentation rev. 1 LC criteria: General: ‐Retention time: RT ≤ ± 0.5 min
RRT ≤ ± 0.1 min
MS/MS criteria: General: ≥ 2 transitions
avoid product ions formed by loss of H2OS/N diagn. ions ≥ 3
Ion ratio (= lowest response/highest response): Relative intensity ion1/ion2
Max. permitted deviation
- ± 20% (abs)
Example: reference ion ratio = 60%Ion ratio in sample must be 60±20% = between 40%‐80%
reference ion ratio = 20%Ion ratio in sample must be 20±20% = between 0%‐40%

USA: FDA Guidance for Industry 118
Applies to: confirmation of identity of animal drug residues

USA: FDA Guidance for Industry 118LC criteria: General: ‐Retention time: RT ≤ ± 5%
MS/MS criteria: General: ≥ 2 transitions
S/N diagn. ions ≥ 3
Ion ratio (= lowest response/highest response): Number of transitions Max. permitted
deviation2 transitions (1 ratio) ± 10% (abs)
3 transitions (2 ratios) ± 20% (abs)
Example: 2 transitions, reference ion ratio = 60%Ion ratio in sample must be 60±10% = between 50%‐70%
2 transitions, reference ion ratio = 10%Ion ratio in sample must be 10±10% = between 0%‐20%

WADA TD2010IDCR
WADA = World Anti‐Doping AgencyApplies to sports doping

WADA TD2010IDCRLC criteria: General: k' preferably in range 3‐10Retention time: RT ≤ ± 2% or 0.1 min (whichever is smaller)
RRT: ±1% (0.1% in case of stable isotope IS)
MS/MS criteria: General: ≥ 2 transitions (1 if uniqueness has been demonstrated during validation)
S/N diagn. ions ≥ 3
Ion ratio (= lowest response/highest response): Relative intensity ion1/ion2
Max. permitted deviation
> 50% ± 10% (abs)
>25%-50% ± 20% (rel)
>5%-25% ± 5% (abs)
≤ 5% ± 50% (rel)
Example: reference ion ratio = 25.1% => ion ratio in sample must be 25.1%±20% = 25.1±5% = between 20%‐30%25.0% => ion ratio in sample must be 25±5% = between 20%‐30%

OtherSOFT / AAFS Forensic Laboratory Guidelines – 2006Applies to Forensic toxicology≥2 ions required, ratio ±25%‐30% (does not specifically address MS/MS.....)
Codex: no specific details
Any other: ???

Example 2: T2 in spices detailsQuantifier Qualifier REF = 0.958
Sample RT area RT area ion ratio %devsolvent N/A N/A N/A N/Asolvent "8 µg/kg" 5.56 70,364 5.55 64,616 0.918 ‐4solvent "20 µg/kg" 5.55 170,563 5.55 169,822 0.996 4solvent "80 µg/kg" 5.55 741,164 5.55 676,033 0.912 ‐5solvent "320 µg/kg" 5.55 2,679,724 5.55 2,528,706 0.944 ‐1cayenne N/A N/A N/A N/Acayenne + 20 µg/kg 5.56 119,348 5.56 110,017 0.922 ‐4cayenne + 80 µg/kg 5.56 493,675 5.55 461,725 0.935 ‐2cayenne + 320 µg/kg 5.55 1,836,478 5.55 1,729,649 0.942 ‐2black pepper 5.59 69,611 N/A N/Ablack pepper + 20 µg/kg 5.57 140,336 5.55 78,244 0.558 ‐42black pepper + 80 µg/kg 5.55 348,720 5.55 278,462 0.799 ‐17black pepper + 320 µg/kg 5.55 1,223,664 5.55 1,133,934 0.927 ‐3solvent N/A N/A N/A N/Asolvent "8 µg/kg" 5.56 66,897 5.55 67,409 1.008 5solvent "20 µg/kg" 5.56 179,583 5.55 169,374 0.943 ‐2solvent "80 µg/kg" 5.55 707,874 5.55 687,823 0.972 1solvent "320 µg/kg" 5.55 2,685,220 5.55 2,615,820 0.974 2
Pitfall when using ion ratio of matrix‐standard as reference:in case of interference ion ratio becomes concentration dependent

Example 3: aflatoxin in feed ingredients
Aflatoxin B1 in cereals and feed ingredientsStandard addition to extract (level ≡ 5 µg/kg)
Ion ratio
→ REFsolv
+20%
‐20%‐10% WADAFDA(VD)
+10% WADA
‐20% USDA
+20% USDA
+48%
+35%

Example 3: aflatoxin in feed ingredientsAflatoxin B1
m/z 313>285 m/z 313>128
black oats + std. add. AB1 (5 µg/kg)
black oats sample
solv. stnd. ≡ 5 µg/kg
white oats sample
white oats + std. add. AB1 (5 µg/kg)
Matrix‐matched ion ratio as reference: Oats ≠ Oats...... Not mee ng the criterion ≠ nega ve

Proposal for ID criteria LC-MS/MSChromatography:General: RT ≥ 2*t0Retention time: ≤ ± 0.05/0.10 min
MS/MS:≥ 2 transitionsavoid product ions formed by loss of H2O, NH3S/N of transitions ≥ 3chrom. peaks for both transitions must coincide and have same peak shapeIon ratio of the transitions should be ≤ ±20%/25%/30% Reference = average of solvent standards measured in the same sequence
Finally: No set of fixed rules will ever cover all myco/matrix/conc combinations, there will always be exceptions to be decided on a case‐to‐case basis with proper justification,depending on what’s at stake.

Further discussion

Non-fortified samplesTargeted:12 samples x 51 toxins
612
Quantifier detected:RT≤±0.05 min(Area>10000)
136
Coinciding qualifier:(Area >10000)
88 Ion ratio deviation > lowest spike level
58 ≤ ±20% 367 ≤ ±20-25% 63 ≤ ±25-30% 25 ≤ ±30-50% 115 > ±50% 1

(false)negatives vs (false) positives
Ion ratio deviation
Found in spiked samples(N=2351)
Found in non-spiked samples(N=612)
> lowest spike level
≤ ±20% 1869 (79.5%) 58 36≤ ±20-25% 213 (9.1%) 7 6≤ ±25-30% 131 (5.6%) 3 2≤ ±30-50% 95 (4.0%) 5 1> ±50% 43 (1.8%) 15 1

Qualitative aspects (SANCO/12495/2011)