identification and validation of candidate soluble ... · identification and validation of...
TRANSCRIPT

IDENTIFICATION AND VALIDATION OF
CANDIDATE SOLUBLE BIOMARKERS FOR
PSORIATIC ARTHRITIS USING QUANTITATIVE
PROTEOMICS
by
Daniela Cretu
A thesis submitted in conformity with the requirements for the degree of Doctor of Philosophy
Department of Laboratory Medicine and Pathobiology
University of Toronto
© Copyright by Daniela Cretu 2015

ii
Identification and Validation of Candidate Soluble Biomarkers for
Psoriatic Arthritis Using Quantitative Proteomics
Daniela Cretu
Doctor of Philosophy
Laboratory Medicine and Pathobiology
University of Toronto
2015
Abstract
There is a high prevalence of undiagnosed PsA in psoriasis patients; therefore identifying soluble
biomarkers for PsA will help in screening psoriasis patients for appropriate referral to a
rheumatologist. Potential PsA biomarkers likely originate in sites of inflammation, such as
inflamed joints and skin, and subsequently enter systemic circulation. Therefore, we aimed to
discover novel biomarkers, to facilitate PsA recognition in psoriasis patients. To achieve this
objective, quantitative proteomic analyses of synovial fluid (SF) samples and skin biopsies
obtained from PsA patients were performed. SF was obtained from swollen knee joints of 10
PsA patients, and age/sex matched early osteoarthritis (OA) controls. Likewise, skin biopsies
were obtained from involved and uninvolved skin of 10 PsA, and 10 age/sex matched psoriasis
patients without PsA (PsC). Using strong cation exchange chromatography, followed by tandem
mass spectrometry, we characterized the proteomes of pooled SF and pooled skin samples.
Extracted ion current intensities were used to calculate protein abundance ratios, and utilized to
classify upregulated proteins. Selected reaction monitoring assays were developed to quantify
these potential PsA markers in individual patient samples. Verified markers were subsequently
measured in serum samples from 100 PsA, 100 PsC patients, and 100 healthy controls, using

iii
commercially available or in-house developed enzyme-linked immunosorbent assays. We
quantified a total of 443 and 1922 proteins in SF and skin extracts, respectively, but only 17
proteins represented upregulated proteins in PsA SF, while 47 proteins were specifically elevated
in PsA-derived skin. SRM verification confirmed that 12 and 8 proteins were indeed elevated in
an independent set of PsA SF and involved PsA skin, respectively. Based on the fold change
between PsA and controls, the associated P-values, and the cellular localization, we ranked the
proteins, and selected the following putative markers for validation in the serum - M2BP, CD5L,
MMP3, CRP, MPO, and ITGB5. Increased levels of CRP, M2BP, MMP3, and ITGB5 were
independently associated with PsA, when compared to PsC. ROC analysis of this model showed
an AUC of 0.851 [95% CI (0.799, 0.904)]. Thus, serum CRP, M2BP, and ITGB5 are potential
biomarkers of PsA in patients with psoriasis.

iv
Acknowledgments
First and foremost, I would like to thank my supervisor, Dr. Eleftherios Diamandis who,
throughout the course of my studies, has shown nothing but patience, support, and
encouragement. Dr. Diamandis, I took the keys you provided, and I drove the car. Thank you for
your support!
I would also like to thank Dr. Vinod Chandran, my “unofficial co-supervisor”. I have, and will
always appreciate the guidance and support you have given me over the years. It is through you
that I discovered the field of PsA biomarker research, and your guidance is what contributed to
the successful completion of my research project.
I am grateful for Dr. Dafna Gladman and Dr. George Yousef, who have volunteered their time
and provided me with great advice over the years, as well as the remainder of my defense
committee Drs. Oliver FitzGerald, Laurence Rubin, and Ivan Blasutig.
The Diamandis laboratory, past and present members, will forever be a part of my life. Apart
from the help everybody has given me, I have also made life-lasting friendships. Specifically,
thank you Natasha, Felix, Yiannis, Ihor, Uros, and Antoninus; you made the lab life even more
enjoyable and I thank you all for that.
Above all, I would like to thank my family. Over the years, my parents, sister, and the
Krawczyk/Kmin family have given me overwhelming support, which has kept me motivated on
this journey. To my husband, Michal, I thank you for sticking by my side, loving me, and
supporting and motivating me over the past three years. I am indebted to you all.
Last, but not least, I’d like to specifically express my gratitude to my mother, Mihaela, to whom I
dedicate this thesis. Without your guidance, love, and support, I would not be who I am today.

v
Publications arising from this thesis
Articles
Cretu D, Diamandis EP, Chandran V. Delineating the synovial fluid proteome: Recent
advancements and ongoing challenges in biomarker research. Crit Rev Clin Lab Sci,2013;50:51-
63.
Cretu D, Prassas I, Saraon P, Batruch I, Gandhi R, Diamandis EP, Chandran V. Identification of
psoriatic arthritis mediators in synovial fluid by quantitative mass spectrometry. Clin
Proteomics.2014;11:27.
Cretu D, Liang K, Saraon P, Batruch I, Diamandis EP, Chandran V. Quantitative tandem mass-
spectrometry of skin tissue reveals putative psoriatic arthritis biomarkers. Clin
Proteomics.2015;12:1.
Poster Presentations
Cretu D, Liang K, Gladman D, Diamandis EP, Chandran V. Quantitative proteomic analysis of
synovial fluid and skin identifies putative psoriatic arthritis biomarkers. Arthritis Rheumatol.
2014;66:S701.
Chandran V, Cretu D, Batruch I, Ghandhi R, Diamandis EP. Identification of psoriatic arthritis
putative biomarkers in synovial fluid by quantitative mass spectrometry. J Rheumatol.
2014;41:1446-7.
Cretu D, Pellett F, Gandhi R, Diamandis E, Chandran V. Proteomic profiling of synovial fluid
for the identification of psoriatic arthritis soluble biomarkers. Arthritis Rheum. 2013;65:S142.
Chandran V, Cretu D, Saraon P, Batruch I, Ghandhi R, Pelett F, Gladman DD, Diamandis EP.
Quantitative proteomic analysis of synovial fluid identifies putative psoriatic arthritis
biomarkers. J Rheumatol. 2013;40:1018.
Cretu D, Batruch I, Saraon P, Gladman D, Pellett F, Diamandis E, Chandran V. Proteomic
Profiling of Synovial Fluid Reveals Candidate Psoriatic Arthritis Biomarkers. Arthritis Rheum
2012;64:S244.
Cretu D, Gladman DD, Pellett FJ, Diamandis E, Chandran V. Proteomic Profiling of Synovial
Fluid for the Identification of Psoriatic Arthritis Soluble Biomarkers. Arthritis Rheum
2011;63:S533.

vi
Contributions
Dr. Daniela Cretu prepared the thesis, and is responsible for the conceptualization and
experimental content.
Drs. Eleftherios Diamandis and Vinod Chandran provided supervision, guidance, and expertise,
and thus assisted in the successful completion of this work.
Dr. Ioannis Prassas assisted in helpful discussions, and drafting of Chapter 2.
Dr. Punit Saraon assisted in helpful discussions, and drafting of Chapters 2 and 3.
Ihor Batruch provided mass spectrometry expertise, and assisted with data analysis and SRM
development in Chapters 2 and 3.
Dr. Rajiv Gandhi provided early osteoarthritis synovial fluid samples in Chapter 2.
Dr. Kun Liang provided statistical expertise, and assisted with statistical analysis in Chapters 3
and 4.

vii
Table of Contents
Acknowledgments iv
Publications arising from this thesis v
Contributions vi
Table of Contents vii
List of Tables ix
List of Figures xi
List of Abbreviations xii
Chapter 1 1
1 Introduction 2
1.1 Psoriasis 2
1.1.1 Statistics and epidemiology 2
1.1.2 Aetiology 3
1.1.3 Clinical features 3
1.1.4 Diagnosis, measurement, and treatment 5
1.2 Psoriatic Arthritis 6
1.2.1 Statistics and epidemiology 6
1.2.2 Aetiology and pathogenesis 6
1.2.3 Clinical features 9
1.2.4 Relationship between the skin and joint 10
1.2.5 Diagnosis of PsA 10
1.2.6 Treatment 11
1.2.7 Identifying PsA early 12
1.3 Biomarker Discovery in rheumatology 13
1.3.1 Definition of biomarkers 13
1.3.2 Ideal PsA biomarkers 14
1.3.3 Advantages of protein markers 14
1.3.4 Serum biomarkers in PsA 15
1.3.5 Proteomics PsA in biomarkers discovery 18
1.4 Proteomic methods used in discovering putative
biomarkers in rheumatology 20
1.4.1 Basic components of a mass-spectrometer 20
1.4.2 Sample fractionation methods 22
1.4.3 Tandem mass spectrometry 23
1.4.4 Quantitative mass spectrometry methods 24
1.4.5 Biomarker development pipeline 26
1.4.6 Sources to mine for PsA biomarkers 27
1.5 Rationale and Aims of the Present Study 29
1.5.1 Rationale 29
1.5.2 Hypothesis 30
1.5.3 Specific aims 31
Chapter 2 32

viii
2 Quantitative proteomic analysis of psoriatic arthritis synovial fluid
33
2.1 Introduction 33
2.2 Methods 36
2.2.1 SF Proteomic analysis 36
2.2.2 Verification of identified proteins using SRM assays 40
2.3 Results 45
2.3.1 Delineating the PsA SF proteome 45
2.3.2 SRM Verification of putative markers in individual SF
samples 53
2.4 Discussion 58
Chapter 3 64
3 Quantitative proteomic analysis of psoriatic arthritis skin 65
3.1 Introduction 65
3.2 Methods 68
3.2.1 Skin proteomic analysis 68
3.2.2 Verification of identified proteins using SRM 72
3.2.3 Validation of verified proteins 74
3.3 Results 78
3.3.1 Delineating the PsA skin proteome 78
3.3.2 SRM verification of putative markers in individual skin
samples 81
3.3.3 Small-scale ELISA validation in serum 86
3.3.4 Correlation amongst markers 87
3.4 Discussion 88
Chapter 4 92
4 Validation of four candidate PsA biomarkers in serum 93
4.1 Introduction 93
4.2 Methods 95
4.2.1 Clinical samples 95
4.2.2 Measurement of CD5L, ITGB5, MPO, POSTN, MMP3,
CRP, and M2BP 97
4.2.3 Statistical analysis 99
4.3 Results 101
4.4 Discussion 106
Chapter 5 109
5 Summary and future directions 110
5.1 Summary of findings and implications 110
5.2 Limitations and considerations 111
5.2 Future directions 114
5.3 Conclusion 116
References 117

ix
List of Tables
1.1 The CASPAR criteria for classification of PsA
1.2 List of soluble biomarkers used in the diagnosis and treatment of joint diseases
2.1 Differentially expressed proteins between early OA and PsA groups identified by
LC-MS/MS
2.2 Summary of Ingenuity Pathway Analysis-generated functional pathways and
diseases associated with elevated proteins identified in PsA SF
2.3 Tissue expression of the top 20 elevated proteins identified from PsA SF
2.4 Fold change of 17 elevated and two housekeeping proteins in PsA SF and the
corresponding peptides
2.5 Summary of the fold change of candidate markers in SF set I and II
3.1 Fold change of 47 elevated proteins identified by LC-MS/MS in PsA skin
when compared to PsC skin
3.2 Summary of the fold change of candidate markers in skin set I and II
4.1 Demographics, disease characteristics, and serum biomarker levels in studied
cohorts
4.2 Fold change of serum biomarker levels when comparing PsA to PsC, and PsA to
controls

x
4.3 Polychotomous logistic regression analysis to identify biomarkers associated with
PsA and PsC
4.4 Logistic regression analysis comparing patients with PsA to PsC to identify
biomarkers associated with PsA in patents with PsC
4.5 Correlation between markers

xi
List of Figures
2.1 Summary of the biomarker discovery and verification experimental
workflow in SF
2.2 Cellular localization of the 44 upregulated proteins based on GO
annotation
2.3 Verification of elevated proteins in PsA SF (set I) by selected reaction
monitoring assays, normalized against housekeeping proteins
2.4 Verification of elevated proteins in PsA SF (set II) by selected reaction
monitoring assays, normalized against heavy-labeled peptides
3.1 Summary of the biomarker discovery, verification, and preliminary
validation experimental workflow in skin
3.2 Distribution of significant markers across the set I PsA and PsC skin
samples
3.3 Distribution of significant markers across the set II PsA and PsC skin
samples
3.4 Distribution of markers across PsA (n=33) and PsC (n=15) serum sets
3.5 Correlation between ITGB5 and POSTN across the PsA and PsC serum
sets
4.1 Distribution of markers across control (n=100), PsA (n=100), and PsC
(n=100) serum sets
4.2 ROC curve showing the AUC for the logistic regression model comparing
PsA to PsC patients

xii
List of Abbreviations
ACE: Angiotensin-converting enzyme
ACN: Acetonitrile
ACPA: Anti-citrullinated protein antibody
ACTB: Beta-actin
ACTH: Adrenocorticotropic hormone
ANA: Anti-nuclear antibody
APCS: Amyloid P component
APOC1: Apolipoprotein C1
APR: Acute phase reactants
AUC: Area under the curve
BSA: Body surface area
C1-2C: Collagen 2-3/4short
C16ORF62: Chromosome 16 open reading frame 62
C2C: Collagen 2-3/4Clongmono
C4BP: C4b-binding protein
CASPAR: Classification criteria for Psoriatic Arthritis
CD5L: CD5-like protein
CHI3L1: Chitinase-3-like protein 1
CI: Confidence interval
CPII: Procollagen 2 peptide
CPN2: Carboxypeptidase N: polypeptide 2
CRP: C-reactive protein
DEFA1: Neutrophil alpha defensin 1
DIP: Distal interphalangeal
DKK1: Dickkopf-1
ELISA: Enzyme-linked immunosorbent assay
ESI: Electrospray ionization
ESR: Erythrocyte sedimentation rate
FA: Formic Acid
FC: Fold change
FDR: False discovery rate
FHL1: Four and a half LIM domain1 1
FT-ICR: Fourier-transform ion-cyclotron resonance
GPS1: G-protein pathway suppressor 1
H2AFX: Histone 2A type I A
H4: Histone 4
HLA: Human leukocyte antigen
HPLC: High-performance liquid chromatography
IL: Interleukin

xiii
ITGA5: Integrin alpha 5
ITGB5: Integrin-beta 5
LC-MS/MS: Liquid chromatography and tandem mass spectrometry
LFQ: Label free quantification
LZIC: Leucine Zipper And CTNNBIP1 Domain-Containing Protein
M2BP: Galectin-3-binding protein
MALDI: Matrix-assisted laser desorption ionization
M-CSF: Macrophage colony stimulating factor
MHC: Major histocompatibility complex
MMP3: Matrix metalloproteinase 3 Stromelysin 1
MPO: Myeloperoxidase
MS/MS: Tandem mass spectrometry
MS: Mass spectrometry
MTX: Methotrexate
NSAID: Non-steroidal anti-inflammatory drugs
OA: Osteoarthritis
OPG: Osteoprotegerin
ORM1: Orosomucoid 1
PAFAH1B2: Platelet-activating factor acetylhydrolase 1b: catalytic subunit 2
PASI: Psoriasis Area and Severity index
PBS: Phosphate buffered saline
PFN1: Profilin 1
PIP: Proximal interphalangeal
POSTN: Periostin
PPP2R4: Protein phosphatase 2A activator: regulatory subunit 4
PsA L: Lesional Psoriatic Arthritis
PsA N: Non-lesional Psoriatic Arthritis
PsA: Psoriatic arthritis
PsC L: Lesional Psoriasis
PsC N: Non-lesional Psoriasis
PsC: Psoriasis
RA: Rheumatoid arthritis
RANKL: Receptor activator for nuclear factor κB ligand
RF: Rheumatoid factor
ROC: Receiver operating characteristic
RP: Reverse phase
S100A9: Protein S100A9
SAA1: Serum amyloid A1
SCX: Strong cation exchange
SD: Standard deviation

xiv
SF: Synovial fluid
SNCA: Alpha synuclein
SRM: Selected reaction monitoring
SRP14: Signal recognition particle 14kDa
SRPX: Sushi-repeat containing protein
TFA: Trifluoroacetic acid
TGF: Transforming growth factor
TMB: 3:3′:5:5′-Tetramethylbenzidine
TNF: Tumor necrosis factor
TNFSF14: TNF superfamily member 14
TOF: Time-of-flight
TUBB: Beta-tubulin
XIC: Extracted ion current

1
Chapter 1
Sections of this chapter have been published in Critical Reviews in Clinical Laboratory
Sciences:
Cretu D, Diamandis EP, Chandran V. Delineating the synovial fluid proteome: Recent
advancements and ongoing challenges in biomarker research. Crit Rev Clin Lab Sci,2013;50:51-
63.

2
Introduction
1.1 Psoriasis
1.1.1 Statistics and epidemiology
Psoriasis is an immune-mediated inflammatory skin disease, characterised by scaly, red and
well-demarcated skin plaques, resulting from keratinocyte hyperproliferation and altered
differentiation, the presence of an inflammatory cell infiltrate and neovascularisation (1). The
prevalence of psoriasis varies with race and geographical location, with an estimated prevalence
of 3% in North America (2, 3). The lowest prevalence has been reported in Asia, aboriginal
Australians, Native American Indians, and West Africans (0-0.3%) (2, 3). Based on age of
onset, two types of psoriasis have been described: Type I psoriasis, which has a peak onset
between age 20-30, and Type II psoriasis, which develops after the age of 40 (3, 4). Type I
psoriasis is the most common, as onset before the age of 40 occurs in up to 75% of patients, but
it also takes a more severe course when compared to Type II psoriasis, which tends to be more
mild (4, 5).
Severe psoriasis is associated with an increased risk of mortality, whereby male and female
patients appear to die 3.5, and 4.4 years earlier, respectively, when compared to age matched
controls (6). Psoriasis is also associated with increased mental health disease and suicidal
ideation in patients (5, 7). In a recent study, the adjusted hazard ratio of depression was higher in
patients with severe psoriasis compared to patients with mild psoriasis (8).

3
1.1.2 Aetiology
Psoriasis results from the interplay between genetic and environmental factors. Many population
and family studies have shown higher incidence of psoriasis in relatives. Evidence supporting
genetic predisposition was demonstrated by twin studies, which showed higher concordance
rates in monozygotic twins (65-72%), when compared to dizygotic twins (15-30%) (9). The
absence of 100% concordance in monozygotic twins, and the lack of a clear inheritance pattern
in families, indicates the presence of possible environmental triggers in those who are
genetically susceptible (9). As a result, much research has been conducted to understand the
genetic and environmental basis of psoriasis. Several loci and genes (PSORS1-10, HLA-
C*0602, IL12B, IL12R, TRAF3IP2) have been identified through linkage analysis, and by gene-
association studies (2, 10, 11). Additionally, environmental triggers identified include
streptococcal infection (12), physical trauma (13), medication (14), smoking (15), and alcohol
(16).
1.1.3 Clinical features
Psoriasis is identified by the presence of characteristic plaques (or lesions), which are well-
circumscribed red, raised, scaly skin lesions. The redness results from increased growth and
dilatation of superficial blood vessels (17, 18). The epidermis of a psoriatic lesion is thicker, and
the epidermal rete is elongated due to abnormal proliferation of keratinocytes, which is known
as psoriasiform hyperplasia (17, 18). The characteristic scales seen in psoriatic lesions are
formed by the rapid maturation and hyperproliferation of epidermal keratinocytes. Lesions are
also rich in activated T-lymphocytes which release pro-inflammatory cytokines, leading to the
characteristic inflammation seen in the disease (17, 18).

4
Psoriasis vulgaris occurs in 85-90% of cases, and represents the most common type of psoriasis.
It usually affects young adults with plaques involving the scalp, extensor aspect of the elbows,
knees, and back (5). Guttate psoriasis is characterized by the acute onset of many small psoriatic
lesions, (approximately 1-10mm in diameter). It typically occurs 1-2 weeks following a
streptococcal infection, and mainly affects children and young adults (9, 12). Inverse psoriasis is
distinct, since it does not exhibit the characteristic plaques, and it affects flexures, typically
armpits, groin, and under the breast. These lesions do not present with scales, and appear as red,
shiny, and well demarcated plaques. Erythrodermic psoriasis results in a scaling, itching,
inflammatory process involving most of the body surface. This may occur as a result of chronic
plaques which progress and become confluent, or it may result from unstable psoriasis due to
infection, drugs, and stress (5). Erythroderma occurs in 3% of psoriasis patients, and its
complications are highly life-threatening, since patients may develop severe infections,
pneumonia, and cardiac failure (5, 19). Pustular psoriasis is characterized by white, non-
infectious pustules, surrounded by red skin. There are two types of pustular psoriasis: von
Zumbusch, or generalized pustular psoriasis, and palmo-plantar pustulosis. The von Zumbusch
type is rare, and unstable, where flare-ups occur in repeated waves lasting days or weeks (5, 19).
Finally, psoriatic nail disease is seen in 40-45% of patients with cutaneous psoriasis (5). The
most common finding is pitting of the nails, resulting from psoriatic involvement of the nail bed.
The nail may also detach from the nail bed distally or laterally (known as onycholysis) (5).
Psoriatic nails tend to be deformed and thickened and also exhibit yellow-brown discoloration
(5). Psoriatic nail disease is particularly relevant to psoriatic arthritis, as will be discussed later
(20).

5
1.1.4 Diagnosis, measurement, and treatment
Psoriasis is most often diagnosed by history and physical examination, as no diagnostic
laboratory tests are available (21). The Psoriasis Area and Severity Index (PASI) and the Body
Surface Area (BSA) tools are used in assessing the severity of the disease. PASI combines
scoring the severity of the lesions, and the area affected into a single score, whereby 0 indicates
no disease, and 72 indicates maximal disease (22, 23). A PASI score greater than 10 indicates
severe psoriasis. BSA represents an estimate of the percent body surface that is affected by
psoriasis. A BSA score greater than 10% indicates severe psoriasis (22, 23). Treatment varies
based on the severity of the disease. Topical corticosteroids, tar, retinoids, and Vitamin D
derivatives are generally used for mild psoriasis. Severe disease is treated with phototherapy,
and systemic agents such as, methotrexate, cyclosporine, apremilast, or biologic agents, such as,
anti-TNF-α, anti-IL12/23 or anti-IL-17 agents (24-26).

6
1.2 Psoriatic Arthritis
1.2.1 Statistics and epidemiology
Psoriatic arthritis (PsA) is defined as a rheumatoid factor-negative inflammatory arthritis,
associated with psoriasis (27). Moll and Wright demonstrated a 19-fold increase in psoriasis
prevalence, amongst first-degree relatives with PsA, when compared to the general population
(28, 29). The most recent estimate of the prevalence of PsA in North America is 0.25% (6), and
the incidence of PsA in the general population ranges from 3-23.1 per 100,000 (30). PsA occurs
in around 30% of patients with psoriasis (2, 31-33). Most commonly, psoriasis precedes PsA,
but arthritis may also precede the psoriasis (32). Approximately 70% of the patients develop
psoriasis before arthritis, and psoriasis and PsA develop simultaneously in an additional 15%,
while 15% develop the arthritis before the detection of psoriasis (34). Males and females are
equally affected by both, psoriasis and PsA (33). The onset of PsA occurs between the ages of
30-55 years, and most studies report no relationship between the type or severity of skin disease,
and the joint manifestations as most patients with PsA have mild or moderate skin disease (35),
although patients with more severe psoriasis are at a higher risk of developing (6).
1.2.2 Aetiology and Pathogenesis
There are several factors such as genetic, immunological, and environmental that have been
proposed to be of importance for the aetiology and progression of PsA, and this section will
discuss the similarity and differences between psoriasis and PsA.
As in psoriasis, genetic factors contributing to the susceptibility for PsA have been analyzed by
linkage and association studies (9, 29, 35, 36). A number of familial studies have suggested

7
first-degree relatives to be at risk of developing PsA (9, 29, 34). A parental gender effect has
been demonstrated in both psoriasis and PsA, whereby more patients have an affected father,
rather than an affected mother. Several studies of the major histocompatibility complex region
on chromosome 6p, have found that HLA-C*06 are more prevalent among patients with
psoriasis and PsA, when compared to healthy controls, especially in patients with Type I
psoriasis (36-39). When comparing patients with PsA with those with psoriasis alone, HLA-
B*08, HLA-C*12, HLA-B*27, and HLA-B*38 alleles were found to indicate an increase in the
odds of developing PsA, while HLA-C*06 was found to decrease these odds (40-42).
Additionally, HLA-B*27 has been associated with axial involvement, while HLA-B*38 and
B*39 have been associated with peripheral disease (40-45); it has been demonstrated that HLA-
B*27 represents a strong genetic marker for PsA among psoriasis patients (41, 42). HLA-DQ3
has been suggested as a marker for disease progression (43), and an increased frequency of DR4
has been associated with disease severity, development of polyarticular symmetrical arthritis,
and with joint erosions (43, 46, 47).
Non-HLA genes that map close to the MHC region of chromosome 6p, such as MHC class I
chain-related gene A (MICA), is in linkage disequilibrium with HLA-B alleles and is reported to
have an increased frequency in psoriasis and PsA patients (48-51). Cytokine-related genes, such
as IL-23R, IL-12p40, IL23p19, IL-21, IL-4, IL-5, and IL-13, have all been associated with PsA
(36, 52).
In addition to genetic factors, immunological mediators have also been described in the
pathogenesis of both psoriasis and PsA. In psoriatic skin lesions, increased levels of CD4 T-
lymphocytes are found in the dermis (53), while in PsA CD8 T-lymphocyte population is

8
significantly increased in patients’ synovium (54). Synovial fluid (SF)-derived CD8 T-cells are
mature (expressing CD45RO), activated (expressing HLA-DR), and express low levels of CD25
(which represents the α chain of the IL-2 receptor) (55). Additionally, the cytokine profile in
PsA is characterized by the presence of Th1 cytokines such as interleukin (IL)-1β, IL-2,
interferon-λ, TNF-α, and IL-10 (56). More recently, a number of studies have demonstrated that
IL-17, IL-22 and IL-23 are increased in psoriatic skin lesions and the synovium of PsA patients,
and have a role in the pathophysiology of these diseases by inducing hyperproliferation of
keratinocytes and promotion of synovitis (57-59). These studies were further supported by the
fact that inhibition of these cytokines demonstrated clinical benefits of both PsA and psoriasis
alone (24, 60). Macrophages, and increased levels of metalloproteases have also been
documented in PsA (56, 61, 62). These are just a few factors which are known to play a role in
initiating and maintaining the inflammatory milieu observed in PsA and psoriasis patients; a
comprehensive description of the inflammatory mediators of PsA is given by Wittmann et al.
(26).
Environmental factors playing a role in the aetiology and progression of PsA have been difficult
to separate from the immunological factors (63). Initially, due to increased levels of antibodies
against bacterial cell wall peptidoglycan found in PsA patients, it was believed that bacterial
infections had a role in PsA pathogenesis (12, 54, 55, 64). However, the Th1 cytokine pattern
suggests that synovial inflammation is not only driven by an immune response to a bacterial
antigen (35, 56). A number of groups have shown that physical injury more often triggers PsA
than other arthritis diseases; this is known as the Koebner phenomenon (65-67). The underlying
reason for this is not known, but the idea that the release of neuropeptides which can stimulate
the synovial membrane and lead to hypervascularization, has been proposed (68). Lifting heavy

9
loads and smoking have also been associated with the occurrence of arthritis among psoriasis
patients, but no association has been found between PsA and alcohol consumption, vaccination,
stress, or female hormonal exposures in the most recent study (65).
1.2.3 Clinical Features
PsA has a heterogeneous pattern and patients can present with various symptoms such as mild
mono-oligo arthritis or very severe, erosive, and destructive polyarthritis (32, 69). The
frequently involved joints are, distal interphalangeal (DIP) and proximal interphalangeal (PIP)
joints, the wrists, the metatarsophalangeal joints, the joints of the lower extremities, the
sacroiliac joints, and the spinal column (32, 69).
Enthesitis is a characteristic feature of PsA, with inflammation at tendon or ligament attachment
sites. Interestingly, MRI detection of enthesitis in clinically uninvolved joints led to the
suggestion that enthesitis may be the primary lesion in PsA, which is also supported by the
observation that entheseal inflammation may extend as far as the synovial cavity (70, 71).
Dactylitis, or inflammation involving a complete digit, is also characteristic of PsA, occurring in
48% of the patients. Dactylitis has been associated with worse radiographic appearance (20, 72-
74). These extra-articular symptoms differ from patients with rheumatoid arthritis (RA), but do
occur among patients with other spondyloarthritides. Other manifestations in patients with PsA
include uveitis, distal extremity swelling, and discoloration of the skin over affected joints, and
inflammatory bowel disease (75-78). Radiological changes in PsA include: erosion of terminal
phalangeal tufts, whittling of bone ends, cupping of proximal ends of bones, severe destruction
of isolated small joints, sacroiliitis, or syndesmophytes (69, 75). During recent years it has

10
become apparent that PsA can be a very destructive disease, and approximately 20% of patients
develop severe, deforming arthritis (79).
1.2.4 Relationship between the skin and joint
Since in most patients psoriasis precedes PsA, the skin disease most often serves as a marker for
subjects at risk of developing PsA. As described previously, immune cells and the mediators
they secrete influence disease initiation and progression in psoriasis and PsA. In psoriasis,
trauma may lead to skin lesions, which is reflected by the lesion pattern seen in psoriasis (35);
areas repeatedly exposed to trauma or pressure, such as knees and elbows, often develop plaque
psoriasis (13, 67). Interestingly, in PsA, DIP joints are often involved with adjacent psoriatic
nail disease. Thus, it has been proposed that inflammation of the nail/skin, initiates
inflammation in the closest joint leading to arthritis or enthesitis, in patients that are susceptible.
Alternatively, it has also been suggested that with the extensor tendon enthesitis linking the joint
to the nail bed, the involvement of the nail bed may be due to extending inflammation from the
joint (35). It is still unclear, which of the two proposals are correct.
1.2.5 Diagnosis of PsA
The diagnosis of PsA is considered when inflammatory arthritis, spondylitis or enthesitis occurs
in patients with psoriasis. The criteria defined by Moll and Wright were used as ‘diagnostic
criteria’ over the last three decades (68). There were no universally agreed upon classification
criteria until the ClASsification of Psoriatic Arthritis (CASPAR) criteria were developed (27).
The CASPAR criteria have high sensitivity and specificity for PsA (91.4% and 98.7%,

11
respectively), but require a rheumatologist to determine whether a patient has inflammatory
musculoskeletal disease (80, 81) (Table 1.1).
Table 1.1 The CASPAR criteria for classification of PsA
1.2.6 Treatment
Non-steroidal anti-inflammatory drugs (NSAIDs) are the basic treatment for the pain, and
stiffness experienced in mild arthritis. In NSAIDs non-respondents, traditional ‘disease
modifying anti-rheumatic drugs (DMARDs)’ such as, sulfasalazine, methotrexate, leflunomide,
and cyclosporine, are used and often effective against arthritis, either as single treatments or in
combination (22, 82-84). Newer agents that include the phosphodiesterase inhibitor apremilast
and biological agents, such as anti-TNF-α and IL 12/23 agents, have improved signs and
symptoms of PsA and psoriasis (24, 26, 82, 85, 86).
Inflammatory articular disease (joint, spine, entheseal) with more than 3 points from the
following categories:
1. Current (2 points) or past (1 point) presence of skin psoriasis, or a family history of
psoriasis (1 point)
2. Psoriatic nail lesions (1 point)
3. Dactylitis (1 point)
4. Negative rheumatoid factor (1 point)
5. Radiographic evidence of juxta-articular new bone formation (1 point)

12
1.2.7 Identifying PsA Early
As mentioned previously, the presence of psoriasis indicates a high risk for the existence or
future development of PsA since 85% to 90% of patients with PsA have psoriasis at the onset of
PsA. Early diagnosis and management of PsA leads to better long-term outcomes (87-89). In a
recent survey conducted in Canada they found that although 18% of patients were diagnosed
with PsA the number who reported joint pain or stiffness was 51%, suggesting that a number of
patients may have had early or undiagnosed PsA (90). Additionally, other studies conducted in
dermatology clinics have also shown a high prevalence of undiagnosed PsA in patients with
psoriasis (72). Therefore dermatologists have the potential to play an important role in
preventing joint destruction in psoriasis patients, by screening for signs of PsA, initiating
treatment, and referring patients to a rheumatologist if needed (91). Unfortunately, for
dermatologists, identifying inflammatory musculoskeletal disease early in patients with psoriasis
is a very difficult task. Although there are clinical features that may help predict PsA, such as
nail, scalp and intergluteal/perianal psoriasis, and psoriasis severity, these symptoms are non-
specific (80, 92). Additionally, acute phase reactants may be normal, and there are no validated
biomarkers. Therefore much of the recent research in PsA, has focused on identifying, serum-
based biomarkers. These laboratory tests could be used to screen psoriasis patients, in order to
identify those that may have or develop PsA; patients that screen positive can then be referred to
a rheumatologist for appropriate investigation and treatment (10, 11, 93).

13
1.3 Biomarker discovery in rheumatology
1.3.1 Definition of biomarkers
The National Institutes of Health Biomarker Definition Working Group, defined a biomarker as
“a characteristic that is objectively measured and evaluated as an indicator of normal biologic
processes, pathogenic processes, or a pharmacologic response to a therapeutic intervention”
(94). As such, these biomarkers can be used in the clinic to diagnose, predict disease
progression, monitor activity of the disease, assess therapeutic response, or guide molecular
targeted therapy (94). Biomarkers for joint diseases may be clinical, histological or imaging
features, as well as genomic, proteomic, and transcriptomic markers (10, 11, 76, 93, 95). Table
1.2 outlines examples of commonly used serum-based markers for various joint diseases (96-
105). Apart from classical acute phase reactants, the limitations of which will be discussed later,
such a biomarker does not currently exist for PsA, and the current need lies in identifying a
prognostic serum-based marker (or markers), which can be used to screen psoriasis patients to
determine those that are at risk of having or developing PsA (10, 11, 93, 95).

14
Table 1.2 Examples of soluble biomarkers used in the diagnosis and treatment of joint
diseases
1.3.2 Ideal PsA biomarkers
Ideal PsA biomarkers should be produced by cells within involved tissues, such as synovial
fibroblasts in the inflamed joint, or keratinocytes in the psoriatic epidermis, and enter systemic
circulation where they can be detected. Thus, the ideal PsA biomarker should not already be
present in high concentration in the blood of healthy individuals, and in patients with psoriasis
without arthritis, since the biomarker contributions from PsA will be difficult to measure.
Finally, ideal markers should demonstrate high sensitivity and high specificity.
1.3.3 Advantages of protein biomarkers
The foremost advantage of studying proteins is that the actual functional molecules of a cell are
being investigated, elucidating a reliable picture of what is occurring in the tissue/joint. Proteins
are more diverse than nucleic acids, since alternative splicing and post-translational
modifications may result in multiple proteins from one gene (112, 113). Further, many
Marker Molecular Class Application
Creatinine Metabolite Drug toxicity (98)
CRP Protein Identify acute inflammation (99)
ANA Autoantibody Diagnostic for various joint diseases
(100)
RF Autoantibody Diagnostic for RA (101, 102)
ACPA Autoantibody Diagnostic and prognostic for RA (103,
104)
Anti-dsDNA Autoantibody Diagnostic for SLE (105)

15
physiologic changes are mediated post-transcriptionally, and therefore will not be reflected at
the nucleic acid level (112, 113). Proteins are also more dynamic, and more reflective of cellular
physiology (113). For example, a double stranded DNA break results in a cascade of protein
phosphorylation. Finally, and most importantly in the context of biomarkers, proteins are more
stable and easily measureable, compared to mRNA which can be rapidly degraded (114).
Therefore, protein biomarkers carry several advantages over genomic and transcriptomic
biomarkers.
1.3.4 Serum biomarkers in PsA
Serum protein biomarkers represent the most cost-effective, non-invasive, and objective way to
detect, stage, prognosticate, and monitor disease activity and response to treatment. A number of
putative PsA biomarkers have already been identified, but to date, none have been validated in a
clinical setting. The types of serum protein PsA biomarkers may be divided into acute phase
reactants, markers of cartilage repair and destruction, inflammatory markers, markers of bone
destruction and new bone formation, and markers of extracellular matrix destruction. As it will
become apparent, PsA is a highly heterogeneous disease, and it is unlikely that a single marker
will prove sufficient in serving as an ideal biomarker (10, 11, 93).
1.3.4.1 Acute phase reactants
Acute phase reactants (APR) represent serum proteins that increase or decrease in response to
inflammation. APRs such as C-reactive protein (CRP) and Erythrocyte Sedimentation Rate
(ESR) are only elevated in 50% of PsA, even in the presence of active disease. A highly-
sensitive CRP (hsCRP) assay has been developed, whereby CRP is measureable in levels

16
<5mg/l. This assay has shown a lot of promise, since it was demonstrated, in a pilot study, that
hsCRP levels in PsA are higher than those in psoriasis (10, 11, 93, 115, 116).
1.3.4.2 Markers of cartilage repair and destruction
Cartilage destruction and repair is characteristic of inflammatory arthritis, and the products of
synthesis and destruction are released in the serum where they can be measured (117). Cartilage
oligomeric matrix protein (COMP), a glycoprotein expressed in cartilage, tendons, synovial
membrane, and scarified skin, is also found to be elevated in PsA, and correlated strongly with
inflammatory parameters and number of inflamed joints (115). Unfortunately, COMP was also
elevated in psoriasis patients, and a difference between levels of COMP in PsA and psoriasis
was not observed (115, 118). Additionally, the articular cartilage is composed of Type II
collagen network complexed with aggrecan (115, 119). It is known that cleavage of type II
collagen in articular cartilage by collagenases generates neoepitopes Col2-3/4Clong mono (C2C)
and Col2-3/4Cshort (C1-2C) (115). As Type II collagen is degraded, chondrocytes respond by
upregulating production of procollagen (115). The procollagen peptide (CPII) is cleaved when
procollagen is secreted; therefore the rate of type II collagen synthesis is directly proportional to
the amount of CPII in the cartilage (115). While neither of the peptides are informative on their
own, the ratio of CPII to C2C (CPII:C2C) represents the balance between type II collagen
synthesis and degradation. In a small-scale study, increased levels of CPII:C2C were
independently associated with PsA, when compared to psoriasis alone
[OR(95%CI)=4.76(1.35,16,77)] (115). Additional validation studies are still underway.

17
1.3.4.3 Cytokines and chemokines
Inflammation is the hallmark of PsA, and several inflammatory markers have also been
proposed. Chandran et al. investigated the ability of IL-12p40 to distinguish between PsA and
psoriasis (115). Although the levels of IL-12p40 were higher in PsA, compared to controls, the
elevation was not significant (115). Cumulative evidence strongly supports the involvement of
IL-23/IL-17 axis in the pathogenesis of PsA, and a number of compounds that target
components of these pathways have been recently used in PsA clinical trials (24, 82, 120). IL-23
acts synergistically with IL-6 and TGF-β to promote rapid Th17 cell development and IL-17
release (121, 122), which in turn, plays a central role in sustaining chronic inflammation (121).
Serum IL-6 levels are elevated in PsA patients compared to psoriasis, and correlate well with
joint counts, ESR, CRP, and IL-2Rα (11, 93, 116). Additionally, in a recent study, IL-17
secretion was elevated in both PsA and psoriasis when compared to healthy controls, with no
significant difference between PsA and psoriasis, while IL-22 expression was 2-fold higher in
PsA when compared to psoriasis without arthritis (57). Additional studies are needed to show
reproducibility of IL-22 expression.
1.3.4.4 Markers of bone destruction and new bone formation
Bone resorption, mediated by osteoclasts, and new bone formation, mediated by osteoblasts, has
been increasingly investigated in the context of PsA. Osteoclast activity is modulated by
macrophage colony stimulating factor (M-CSF), the receptor activator for nuclear factor κB
ligand (RANKL) and osteoprotegerin (OPG). In turn, TNF superfamily member 14 (TNFSF14)
promotes RANKL-dependent osteoclastogenesis. In the same study by Chandran et al., OPG,
TNFSF14, and RANKL were measured in patients’ serum, but only elevated OPG was found to

18
have discriminatory ability between PsA and psoriasis [OR(95%CI)=1.01(1.00,1.02)] (115).
OPG is a cytokine that inhibits osteoclast differentiation and promotes new bone formation. It is
thus believed to be a marker of periostitis and new bone formation, the combination of which
represents a characteristic that differentiates PsA from other inflammatory arthritides (27).
Additionally, Dickkopf-1 (DKK-1), a regulatory molecule of the Wnt signalling pathway,
inhibits osteoblast function and is also a key regulator of joint remodelling (123). DKK-1 levels
are increased in PsA compared to psoriasis without arthritis (124). Its elevation has also been
demonstrated in patients with active rheumatoid arthritis (123), casting doubt on the role and
significance of circulating DKK1 in PsA; further studies are thus warranted.
1.3.4.5 Markers of extracellular matrix destruction
Matrix-metalloproteinase 3 (MMP3) is involved in the breakdown of extracellular matrix and
tissue remodelling in normal, as well as pathologic conditions. In PsA, as well as other
rheumatic conditions characterized by synovitis, MMP3 is involved in the destruction of
cartilage and bone. In a pilot study, serum MMP3 levels were increased in patients with PsA,
and could be used to discriminate between PsA and psoriasis without arthritis
[OR(95%CI)=1.28(1.02,1.60)] (115). These results are preliminary, and require validation in a
larger study.
1.3.5 Proteomics in biomarker discovery
Genomic and transcriptomic studies have been robust and led to the identification of a number
of susceptibility genes and expression profiles in PsA (10, 11, 93, 106). Proteomic studies to
identify serum protein biomarkers, represent a more recent approach to PsA biomarker
discovery, and has the potential to complement genomics-based approaches by bridging the gap

19
between what is encoded in the genome and what is occurring at the tissue/joint level (107). It is
well known that genomic and proteomic data sets have different sources of bias and variance, so
combining them may lead to a more precise view of the differential protein abundance (108,
109). The key benefit of the integration of proteomic and transcriptomic data in the field of
biomarker discovery is its potential for improving the selection of candidates to validate. If both
transcriptomic and proteomic platforms agree on a strong differential expression between the
groups of patients being compared, the attractiveness of a candidate is strengthened (110, 111).

20
1.4 Proteomic methods used in discovering putative biomarkers
in rheumatology
Mass-spectrometry (MS) is a technique that measures the mass-to-charge ratio of ions, to
identify and quantify molecules in simple and complex mixtures. MS has become an invaluable
tool across many fields and applications, including proteomics. The initial development of high-
throughput qualitative, and more recently quantitative proteomic methods, have expanded our
knowledge of protein structure, function, modification, and profiles in disease states.
1.4.1 Basic components of a mass-spectrometer
MS is performed on a mass-spectrometer, which consists of an ionization source, a mass
analyzer, and an ion detector. The specifics of these components, the type of data generated
(qualitative, quantitative, post-translational modifications, etc.), and the physical properties of
the samples that can be analyzed, vary across different instruments (125).
Following standard sample preparation procedures which typically includes protein
denaturation, reduction, alkylation, and peptide separation, samples are loaded into the mass-
spectrometer in liquid form, and the next step is to convert the sample into gas-phase ions using
the ionization source. Ionization sources can vary largely, but are typically classified as either
electrospray ionization (ESI), or matrix-assisted laser desorption ionization (MALDI) (125). In
ESI, ions are produced at atmospheric pressure by running the sample through a narrow
capillary tube in an electrostatic field. The resulting electric potential difference generates a fine
mist of charged droplets. The solvent is evaporated, typically using Nitrogen gas, and along with
Coulombic forces, nanometer-sized droplets are produced (125). Alternatively, MALDI ions

21
result from combining sample molecules with small organic molecules which are capable of
absorbing light when irradiated with a laser beam. The matrix absorbs light at the wavelength of
the laser, which leads to desorption and ionization of both, the matrix and sample. MALDI is
well-suited for analyzing samples containing analytes greater than 200kDa, while ESI allows
analysis of smaller analytes (less than 1KDa). Therefore, the choice of ionization depends
largely on the nature of the sample being analyzed (125).
The charge received from ionization allows the mass spectrometer to accelerate the ions through
the remainder of the instrument. The gas-phase ions enter the mass analyzer, where they
encounter electrical or magnetic fields, which deflect the paths of individual ions based on their
mass to charge ratio (m/z). Mass analyzers can also vary, and include quadrupole time-of-flight
(Q-TOF), triple quadrupole, orbitrap, quadrupole ion traps, TOF, and TOF/TOF, and Fourier-
transform ion-cyclotron resonance (FT-ICR) analyzers. Ion-trap mass analyzers utilize magnetic
and radio frequency to hold ions, while quadrupole ion-trap analyzers use an oscillating electric
field for ion storage and mass analysis (125). Using the electrode, the orbitrap mass analyzer
traps ions in an electrostatic field, causing the ions to move in a spiral pattern. The quadrupole
analyzer consists of four parallel metal rods, where each opposing rod pair is electrically
connected. Ions are separated based on their trajectory in the oscillating electric fields that are
applied to the rods (125). In a triple quadrupole (QQQ), the first quadrupole (Q), and the last
quadrupole act as mass analyzers, while the second quadrupole is used as a collision cell where
peptides are fragmented. The performance of a mass analyzer depends on the maximum
allowable mass that can be analyzed (mass range), the smallest amount of analyte that is
detected with high confidence (detection sensitivity), and its ability to separate two mass ions
(resolution) (125).

22
Ions successfully passing through the mass analyzers are then detected. The detectors are, most
often, electron multipliers or microchannel plates, which emit electron cascades when each ion
hits the detector plate. This results in the amplification of each ion, and improves sensitivity
(125). The detector measures the electric current in proportion with the number of ions striking
it, and generates a mass spectrum, which is analyzed using various pattern-matching algorithms.
1.4.2 Sample fractionation methods
The dynamic range in protein concentration in many biological fluids and tissues extends from
mg/mL for abundant structural and carrier proteins such as albumin and keratin, to pg/mL for
signaling molecules such as TNF-α. This is similar to plasma, where the concentration range is
approximately 12 orders of magnitude. The proteomic analytical methods currently available
have a concentration range within 2-5 orders of magnitude, leading to low detection of less
abundant proteins (126-129). A common way to overcome this problem and reduce protein
complexity is by implementing pre-fractionation methods and/or depleting the sample of the
most abundant proteins using depleting columns. Proteins bind directly to the column or
indirectly through secondary binding to immunoglobulins or albumin (or other high-abundant
proteins), Although all commercially available columns have been designed for serum and
plasma, they are also valuable for other biological fluids such as synovial fluid and ascetic fluid,
because most abundant proteins in these fluids correspond to those in serum/plasma (130). It is
important to note that, high-abundance proteins can physically mask less abundant proteins with
similar isoelectric points and molecular weights. Depletion columns may also bind proteins in a
non-specific manner (131, 132). Depletion should only be used when whole sample integrity is
not essential. According to a study by Chen et al., treatment of synovial fluid prior to

23
fractionation will decrease reproducibility and increase protein loss; therefore, it should also be
avoided (133). Instead, low molecular weight components of samples, which may represent
putative biomarkers, can be enriched by size exclusion liquid chromatography (LC), strong
cation/anion exchange (SCX/SAX) LC, or reverse phase (RP) LC. In size exclusion
chromatography, molecules are separated based on their size or molecular weight. This method
is generally good for separation of large molecules from small ones, but it can result in
approximately 50% total protein loss. SCX and SAX lead to the separation of analytes based on
their charge. These represent the most frequently used separation methods, as they have a high
resolving power, capacity, and simplicity. Finally, in RP-LC molecules are separated by
hydrophobicity, whereby proteins are eluted using a gradient of hydrophobic solvent. This
method is commonly used as a last separation step following sample preparation and prior to
MS analysis.
1.4.3 Tandem mass spectrometry
Tandem mass spectrometry (MS/MS) offers additional information about ions being analyzed.
In this instance, ions of interest are selected based on their m/z from the first round of MS
(MS1), and these are then fragmented, usually via collisions with inert gas atoms, as is the case
in collision-induced dissociation. The resulting fragments are then separated based on their
individual m/z in an additional round of MS (MS2) (125, 129). This process ultimately allows
the identification and characterization of proteins.

24
1.4.4 Quantitative Mass-Spectrometry Methods
Quantification of protein levels to achieve accurate differential protein profiling between
biological samples has been a major challenge in proteomics. These methods require chemical
labeling of the samples prior to MS analysis, or can be performed label-free, termed label-free
quantification (LFQ). More recently, targeted quantitative mass-spectrometry methods have
been developed, in the form of selected reaction monitoring (SRM) assays (134-136).
1.4.4.1 Label-free quantification
The label-free protocol is semi-quantitative, and is based on the peak intensity of the peptides in
the MS scan, or on the number of observed spectra per peptide across different samples (125). In
general, the advantage of label-free approaches over chemical labeling lies in the low cost and
the high number of samples that can be easily included in the experiment (136). Potential
disadvantages of label-free techniques include the lower reproducibility of results, which
compromises detection of smaller quantitative changes between samples (136). In terms of data
analysis, spectral counting is the simplest label-free method but is also the least reliable because
quantification accuracy drops when the number of spectra representing a protein becomes very
low, usually less than two (136). As a result, classifying smaller changes among the identified
low abundance proteins, which typically have low numbers of observed spectra, will be difficult
with this method. Alternatively, intensity-based quantification is, in theory, more capable of
obtaining accurate values for lower abundance proteins (137). Computer algorithms such as
MaxQuant are used to analyze the data, and require the identification of only one peptide in at
least one of the samples being analyzed to extract the peak intensity information and to quantify
the peptide in all the analyzed samples (138, 139).

25
1.4.4.2 Chemical labeling
As an alternative to label-free approaches, chemical labeling of peptides/proteins prior to
fractionation and MS analysis has also been used. There are a number of available labeling
strategies: tandem mass tags (TMT) (140), isobaric tags for relative quantification (iTRAQ)
(141), and isotope-coded affinity tags (ICAT) (142) are the most popular commercial
alternatives. In the case of iTRAQ (4-plex and 8-plex) and TMT (6-plex), free amines generated
from trypsin digestion and present in all the peptides are labeled and, therefore, theoretically no
information is lost (136). Reporter ions relating to the various samples being analyzed are
released from the peptides during MS/MS fragmentation and are thus used to represent the
sample from which specific proteins originate; no quantitative information is obtained from the
MS scan (140, 141). These methods are not without challenges, as utilizing these protocols in
complex samples may result in the partial suppression of the quantitative reporter ion signal
(143). Low-abundance proteins are more vulnerable to this effect, and unfortunately these are
also the proteins that represent potential biomarkers. ICAT only labels cysteine residues
therefore proteins that do not have peptides containing cysteine, will not be quantified. In
addition, the quantitative information from each protein with this method is sparse, and ICAT
only appears as duplex labels (143). Generally, chemical labeling protocols are rather lengthy
and involve many steps, resulting in compromised reproducibility.
1.4.4.3 Selected reaction monitoring
Recently, there has been a paradigm shift toward the use of targeted MS-based methods. SRM
assays exploit the capabilities of triple quadrupole or Q-Trap instruments (135). For reliable
quantification of a protein of interest, proteotypic peptides or peptides unique to a particular

26
protein of interest, are first selected. The corresponding predefined precursor masses of these
peptides are selected in the first quadrupole and fragmented in the second quadrupole, with
predefined fragmentation masses selected in the third quadrupole. This unique pair of precursor
and fragmentation mass is termed a transition. The SRM method can be applied simultaneously
to multiple proteins (MRM), a protocol that is further reviewed by Lange et al. (135). Stable
Isotope Dilution-SRM (SID-SRM) is based on the selection of three to five peptides resulting
from tryptic digestion from each protein to be quantified (144). Synthetic peptides containing
heavy lysine and arginine residues (which have incorporated 13C/15N atoms) are then added to
all samples. These peptides serve as internal standards providing relative quantitative ratios for
each proteotypic peptide corresponding to each protein of interest between all samples (144).
The nature of this approach allows for very high-molecular selectivity, and if interference is
present it can also be detected (144).
1.4.5 Biomarker development pipeline
Three different phases exist in the discovery of novel biomarkers: discovery, verification, and
validation (145). In the discovery phase, a small number of well-characterized, high-quality
samples are compared using fractionation and quantitative proteomics methods to generate an
extensive list of protein components. Subsequent phases in the biomarker development pipeline
replace the unbiased experimental design with target-driven quantitative strategies relying
mainly on target-driven analytical methods. During the verification phase, preliminary assays
are employed, such as enzyme-linked immune sorbent assays (ELISA) and selected reaction
monitoring assays, to measure the levels of selected proteins in relevant biological samples. To
advance the development, all biomarker candidates also require validation, which is undertaken

27
on only a subset of verified candidates and is performed in, ideally, thousands of samples (145).
This stage requires the development of robust immunoassays to measure the proteins accurately
in serum samples. Potential biomarkers showing good sensitivity and specificity are considered
for further clinical evaluation (145).
1.4.6 Sources to mine for PsA biomarkers
In the context of PsA, blood obtained by venipuncture is the most accessible, minimally
invasive, and the most practical human specimen that can be monitored over long periods of
time. Blood plasma contains proteins shed from all organs and tissues. However, performing
mass spectrometric analysis of plasma or serum analysis presents with several challenges. These
include high complexity in the number of proteins and protein isoforms, a concentration range
between high-abundance and lows-abundance proteins of 12 orders of magnitude, and changes
in protein concentration, structure, and function resulting from physiological and pathological
processes. Therefore, the discovery of biomarkers from serum by mass-spectrometry analysis
has proven to be a challenging task (126-128).
Fortunately in the case of PsA, the affected joint offers access to synovial fluid. SF is a potential
source of valuable markers. Synovial fluid is obtained from affected patients by arthrocentesis
(joint aspiration). Synovial fluid is secreted by the synovial membrane, and is in direct contact
with both the synovial membrane, and the articular cartilage (146). Consequently, SF contains
specific additions made from proximal joint tissue, including the synovial membrane and
cartilage, therefore changes in the cellular metabolism and structure of these tissues as they
occur in a disease state may be reflected by changes in SF composition (146). This particular
characteristic can be exploited when searching for biomarkers of any joint disease. In a study by

28
Mateos et al., SF was utilized to mine for RA biomarkers using MALDI-TOF, which resulted in
the identification of 136 differentially expressed possible RA biomarkers (147). The synovial
membrane also represents an excellent reservoir of possible PsA biomarkers. Obviously the
synovial membrane has an advantage over synovial fluid since it is the site of inflammation in
PsA, but these samples, as well as appropriate controls are hard to obtain. Another important
source to investigate for potential biomarkers is the skin, as it represents another PsA target
tissue. The premise is that certain proteins originating/elevated from this tissue during disease,
could subsequently enter the bloodstream. The inflammatory process, as it occurs in PsA, is
characterized by vascular changes, such as vasodilation, increased permeability and increased
blood flow (148). These processes may facilitate shedding or secretion of skin proteins into the
blood stream. In a 2011 study, tandem mass-spectrometric analysis of psoriatic skin tissue
showed differential expression of 146 proteins in lesional (affected) psoriatic skin, when
compared to nonlesional (unaffected and healthy skin (149). Although these markers were never
validated, this study provides evidence that proteomic signatures differ between lesional and
nonlesional skin.

29
1.5 Rationale and Aims of the Present Study
1.5.1 Rationale
The presence of cutaneous psoriasis is a high risk for developing PsA, but several studies that
have been conducted in dermatology clinics have shown a high prevalence of undiagnosed PsA
in psoriasis patients. This is due to the fact that identifying inflammatory musculoskeletal
disease early in patients is difficult since the symptoms are non-specific, and acute-phase
reactants are often normal. While there are clinical features that can be utilized to predict PsA,
such as nail, scalp, intergluteal/perianal psoriasis, and psoriasis severity, these are common
among patients with psoriasis. Identifying biomarkers that can recognize PsA in psoriasis
patients may help in early diagnosis and subsequent prevention of disability and improvement in
quality of life.
There is no doubt that genomic and transcriptomic methods are powerful, as they resulted in the
identification of a number of significant susceptibility genes and expression profiles in PsA.
But, proteins are more diverse and carry more information that nucleic acids. Post-translational
modification and alternative splicing may lead to numerous protein variants from the same gene.
Additionally, information provided by nucleic acids is limited, as they are unable to predict
downstream events, such as what protein, and in what quantities will be expressed in a particular
tissue or fluid in a pathologic state. Candidate PsA protein biomarkers have been selected for
validation based on their assumed importance in disease pathogenesis, and the availability of
assays, but to date, the need for discovery of soluble PsA biomarkers in psoriasis patients has
remained unmet. Classical acute phase reactants, such as ESR and CRP are the only laboratory
tests currently used in clinic, but these are non-specific markers of inflammation that have poor

30
sensitivity and specificity. Therefore, analyzing proteins can provide additional information, by
relating specific proteins to a disease such as PsA.
MS-based proteomic approaches are well-suited for the discovery of protein mediators of
disease. While early studies relied on qualitative analysis, more recently, semi-quantitative and
quantitative comparisons of protein abundance are the preferred methods for identifying
differentially expressed proteins in biological samples.
Blood obtained by venipuncture is the most practical human specimen that can be used to
monitor disease status over long periods of time. However, high throughput mass-spectrometry
analysis of serum or plasma has proven to be a difficult task. Due to its close proximity to the
diseased joint, synovial fluid represents an ideal source to mine for potential PsA biomarkers.
Additionally, since skin is the other important target tissue in PsA, proteins elevated in the skin
may also present candidate PsA biomarkers.
1.5.2 Hypothesis
Quantitative mass spectrometry-based proteomic analysis of synovial fluid and skin tissue from
PsA patients and appropriate controls, will generate a comprehensive list of proteins specific to
PsA, facilitating the identification of candidate PsA screening biomarkers.

31
1.5.3 Specific aims
1) To perform high-throughput label-free quantitative proteomics to identify upregulated
PsA-specific proteins in synovial fluid.
i) Develop sample preparation method best suited for label-free quantification analysis
of synovial fluid.
ii) Utilize bioinformatics tools to filter and select the most informative proteins.
iii) Develop selected reaction monitoring assays and verify candidate markers in
individual synovial fluid patient samples.
2) To perform high-throughput label-free quantitative proteomics to identify upregulated
PsA-specific proteins in skin.
i) Develop sample preparation method best suited for label-free quantification analysis
of skin.
ii) Utilize bioinformatics tools to filter and select the most informative proteins.
iii) Develop selected reaction monitoring assays and verify candidate markers in
individual skin patient samples.
3) To validate verified markers in PsA serum samples using enzyme-linked immunosorbent
assays.

32
Chapter 2
The data presented in this chapter has been published in Clinical Proteomics:
Cretu D, Prassas I, Saraon P, Batruch I, Gandhi R, Diamandis EP, Chandran V. Identification
of psoriatic arthritis mediators in synovial fluid by quantitative mass spectrometry. Clin
Proteomics.2014;11:27.

33
Quantitative proteomic analysis of psoriatic arthritis synovial
fluid
2.1 Introduction
Psoriatic arthritis is an inflammatory arthritis distinguished by bone resorption and periarticular
new bone formation, and bears its name from its association with the cutaneous disease,
psoriasis (150). PsA occurs in approximately 30% of psoriasis patients and in about 85% of
cases psoriasis precedes or occurs simultaneously with PsA (2, 6, 32). PsA has a predicted
prevalence of 0.16 to 0.25% in the general population, and is a complex, potentially disabling
musculoskeletal disorder often arising early in age. Patients with PsA are also at increased risk
of co-morbidities, such as obesity, metabolic syndrome, diabetes, and cardiovascular disease
(31, 32). The aetiology of psoriasis and PsA remains unclear, but studies indicate that
interaction between multiple genetic components and environmental factors are important in the
disease pathogenesis (2, 9, 65, 106, 151). It is proposed that environmental factors such as
infections by Streptococci or articular trauma (2, 41, 42, 65, 67, 152, 153) may trigger
immunological alterations in genetically predisposed individuals that play important roles in the
appearance of both skin and articular disease. From the immunological point of view, changes
are observed in both innate and adaptive immunity. Undoubtedly, the identification of key PsA
mediators will not only provide valuable information towards a deeper understanding of the
molecular basis of the disease, but it might also uncover important PsA biomarkers potentially
useful for clinical follow-up and response to treatment.
Mass spectrometry-based proteomic approaches are well-suited for the discovery of protein
mediators of disease. Early studies relied on qualitative (identity-based) analysis, and

34
performance was depended mainly on the sensitivity of the available MS platforms and sample
processing prior to MS-analysis (154, 155). More recently, semi-quantitative and quantitative
comparisons of protein relative abundance are the preferred methods for identifying
differentially expressed proteins (156). In many cases, chemical or metabolic labeling of
samples prior to analysis has been utilized for quantitation, but it has been associated with
technical challenges (136). Label-free quantification (LFQ) methods have also been recently
optimized, in which quantification is based on the differential peak intensity [extracted ion
current (XIC)] of the peptides in each MS scan (125, 157).
LFQ quantitative proteomics presents a robust means for obtaining proteome profiles of
virtually any biological material (125, 157). Human plasma represents a diverse proteome and is
an excellent source for protein mediators of disease, but proteins secreted by adjacent tissues are
diluted in blood, and are often undetectable by current MS methods (97). To circumvent this
issue, attention has been focused on proximal fluids, such as ascites (158), and seminal fluid
(159) to search for tissue-associated markers. For instance, in the case of PsA, as mentioned
previously, synovial fluid (SF) represents an interesting source of PsA-related proteins secreted
by the synovium, ligament, meniscus, articular cartilage, and joint capsule. Moreover, it is well
known, that there is an exchange of proteins between SF and the systemic circulation through
the synovial lymphatics and vasculature (129). In support of this, we have demonstrated that
proteins elevated in the SF of PsA patients, are likewise upregulated at the serum level (160).
We have therefore decided to focus on SF for the discovery of putative PsA biomarkers.
In the present study, we performed label-free MS quantitation of SF proteins from PsA and early
osteoarthritis (OA). Using a highly sensitive and specific MS-based approach, we confirmed the

35
elevation of specific elevated proteins in an independent set of samples from patients with PsA.
These observations may shed new light on the pathogenesis of PsA, offer insights into disease
progression, and might reveal potential PsA biomarkers.

36
2.2 Methods
2.2.1 SF Proteomic analysis
2.2.1.1 Human subjects and clinical samples
The study received institutional review board approval from the University Health Network, and
informed consent was obtained from all patients.
For the discovery phase, SF was obtained from 10 cases with PsA (6 males, 4 females; age
range 30-76 years), and 10 age- and sex-matched controls (early OA) (Set I). PsA patients had
psoriasis and satisfied the CASPAR classification criteria (27). Inclusion criteria included
symptom duration ranging from 1 to 10 years (to capture both relatively early and established
disease), and at least one inflamed and accessible large joint. The inflammatory nature of the SF,
and the absence of other causes of inflammation, such as infection and/or crystal disease, was
confirmed by laboratory investigations.
SF from joints with early OA was obtained during an arthroscopic procedure. Early OA was
defined as only a partial thickness cartilage defect in any compartment of the knee, and further
defined by a grade I or II lesion by the Outerbridge classification (161).
For the verification (quantification) phase, an independent set of SF samples (Set II) was
acquired from 10 PsA patients (7 males, 3 females; age range 21-66 years), and 10 age- and sex-
matched early OA controls. Inclusion and exclusion criteria were the same as described above.

37
2.2.1.2 Pre-analytical sample processing
Synovial fluid samples were stored at -80°C until use. Samples were centrifuged upon thawing
at 1800g for 10 minutes, to remove any debris, and the total protein was measured in each
sample using the Coomassie (Bradford) total protein assay (Pierce Biotechnology, IL). Equal
protein amounts of each SF sample were combined, to obtain two (1mg total) pools (PsA vs.
early OA), which were analyzed in triplicates. Proteins in each pool were denatured using heat
(95°C for 10 minutes), reduced with 5mM dithiothreitol at 60°C for 45 minutes, and alkylated
with 15mM iodoacetamide, in the dark at room temperature for 45 minutes. Sequencing grade
trypsin (Promega, WI) was added in a 1:50 (trypsin: protein) ratio, and allowed to digest for 18
hours at 37°C. The samples were subsequently acidified (pH 2) using 1uL of formic acid, to
inhibit trypsin activity. The resulting peptides were then subjected to high-performance liquid
chromatography (HPLC) using strong cation exchange (SCX) columns to reduce peptide
complexity.
2.2.1.3 HPLC-SCX
Digested samples were diluted 1:2 in mobile phase A SCX buffer (0.26M formic acid (FA),
10% acetonitrile (ACN); pH 2-3) and loaded directly onto a 500µL loop connected to a
PolySULFOETHYL A column (2.1 mm × 200 mm; 5 μ; 200 °A; The Nest Group Inc., MA),
containing a silica-based hydrophilic, anionic polymer (poly-2-sulfotheyl aspartamide). An
Agilent 1100 HPLC (Agilent Technologies, Germany) system was used for fractionation. A 60-
minute gradient was employed with a linear gradient starting at 30 minutes and consisting of
mobile phase A and mobile phase B (0.26M FA, 10% ACN, 1M ammonium formate; pH-4-5)

38
for elution of peptides (flow rate 200uL/min). The fractionation was monitored at a wavelength
of 280 nm, and performed in triplicate. Fractions were collected every two minutes from 20 to
55 minutes, and those with a low peak absorbance were pooled, resulting in a total of 10/15
fractions per sample (10 fractions for early OA replicates, and 15 fractions for PsA replicates).
This amounted to a total of 75 SCX fractions, which were then subjected to liquid
chromatographic and tandem mass spectrometric analysis (LC-MS/MS). SCX column and
system performance was ensured by running a quality control peptide mixture consisting of
1ug/uL Alpha Bag Cell peptide, 1ug/uL Fibrinogen fragment, 5ug/uL Human ACTH, and
5ug/uL ACE Inhibitor (American Protein Company, CA) after every sample.
2.2.1.4 LC-MS/MS
The SCX fractions were purified through C-18 OMIX Pipette Tips (Agilent Technologies,
Germany), to remove impurities and salts, and eluted in 5µL of 65% MS buffer B (90% ACN,
0.1% FA, 10% water, 0.02% Trifluoroacetc Acid (TFA)) and 35% MS buffer A (5% ACN,
0.1% FA, 95% water, 0.02% TFA). The samples were diluted to 85µL in MS buffer A, and
injected into a nano-LC system (Proxeon Biosystems, FL) connected online to an LTQ-Orbitrap
(Thermo Fisher Scientific, USA). A 90 minute linear gradient reversed phase chromatography
using MS buffer A and MS buffer B, was performed at a flow rate of 400nL/min to resolve
peptides on a C-18 column (75uM x 5 cm; Proxeon Biosystems, FL). The MS parameters were:
300 Da minimum mass, 4000 Da maximum mass, automatic precursor charge selection, 10
minimum peaks per MS/MS scan; and 1 minimum scan per group. XCalibur software v.2.0.7
(Thermo Fisher Scientific, USA) was used for data acquisition.

39
2.2.1.5 Protein identification and quantification
Raw files corresponding to early OA, and PsA data sets were uploaded into MaxQuant v. 1.2.2.2
(www.maxquant.org) (139) and searched with Andromeda (built into MaxQuant) (138) against
the nonredundant IPI.Human v.3.71 (86, 309 sequences; released March 2010) database, which
contains both forward and reverse protein sequences. Search parameters included a fixed
carbamidomethylation of cysteines, and variable modifications of methionine oxidation and N-
terminal acetylation. Data was initially searched against a “human first search” database with a
parent tolerance of 20 ppm and a fragment tolerance of 0.5 Da in order to calculate and adjust
the correct parent tolerance to 5 ppm for the search against the IPI.Human fasta file. During the
search, the IPI.Human fasta database was randomized and false detection rate was set to 1% at
the peptide and protein levels. Data was analyzed using “Label-free quantification” checked,
and the “Match between runs” interval was set to 2 min. Proteins were identified with a
minimum of one unique peptide. “LFQ Intensity” columns corresponding to the extracted ion
current (XIC) value of each protein in replicate early OA and PsA groups were averaged and
used to calculate PsA/early OA ratios (fold change; FC).
2.2.1.6 Bioinformatics analysis
To minimize false positives, we excluded from further analysis any protein with an individual
false detection rate >0.05. Proteins displaying an XIC value lower than 100,000 were regarded
as absent (noise). We also excluded proteins present in only one of the three technical replicates.
Averages of the technical replicate XIC values were calculated for each PsA and early OA
group, and ratios of PsA/early OA were used to identify deregulated proteins. Upregulated

40
proteins were denoted with a PsA/early OA ratio (FC) greater than 2, while downregulated
proteins had a PsA/early OA ratio (FC) less than 0.8. Housekeeping proteins were represented
with a PsA/early OA ratio (FC) of approximately 1.0. To determine the possible origin of
differentially expressed proteins at the tissue level, and identify the most probable mediators of
PsA, gene names were checked against gene [BioGPS (http://biogps.org/#goto=welcome) (162),
and protein [Human Protein Atlas (http://www.proteinatlas.org/) (163) databases, to identify
proteins with strong expression in PsA-associated tissues and cell types (skin, bone, immune
cells). The Plasma Proteome Database (http://www.plasmaproteomedatabase.org/) (126) was
employed to identify proteins present in high-abundance in the serum, which could represent
potential contaminants. Selected reaction monitoring (SRM) assays were developed for the top
upregulated proteins in the PsA group and housekeeping proteins, and relative protein
quantification was performed in individual SF samples to confirm their elevation in PsA SF.
2.2.1.7 Network analysis
The list of dysregulated proteins identified by LC-MS/MS was analyzed by pathway analysis
using the network-building tool, Ingenuity Pathways Analysis (IPA; Ingenuity Systems,
www.ingenuity.com) (164).
2.2.2 Verification of identified proteins using SRM assays
SRM methods were developed for verification of protein ratios in SF, following our in-house
protocols (165).

41
2.2.2.1 SRM assay development
PeptideAtlas (http://www.peptideatlas.org/) was utilized to select the most commonly observed
3-4 tryptic peptides for the proteins of interest. Their presence was confirmed using our LC-
MS/MS identification data. The uniqueness of peptides was verified using the Basic Local
Alignment Search Tool (BLAST; https://blast.ncbi.nlm.nih.gov/Blast.cgi). To identify peptide
fragments (transitions) to monitor, in silico peptide fragmentation was performed using Pinpoint
software (Thermo Fisher Scientific, USA) and 5-6 transitions were selected for each peptide.
For method optimization, digested pooled samples of SF used in our LC-MS/MS analysis, were
loaded onto a C-18 column (Proxeon Biosystems, FL) coupled to a triple quadrupole mass
spectrometer (TSQ Vantage; Thermo Fisher Scientific, USA), and approximately 350 transitions
were monitored in 6 subsequent runs. Three transitions of the most intense peptides (per
candidate protein) were used for subsequent quantification assays.
2.2.2.2 SF sample preparation
Fifty µg of total protein of each SF sample, were denatured by heat, reduced, alkylated, and
trypsin-digested as described previously. In the independent SF sample set (Set II), heavy-
labelled versions of the peptides of interest (JPT Peptide Technologies, Germany) ranging from
1 to 1000 fmol/µl of sample were also added, as internal standards. Heavy peptides had identical
sequences to the endogenous peptides, except the C-terminal lysine or arginine was labeled with
13C and 15N. The resulting peptides were purified through C-18 OMIX Pipette Tips (Agilent
Technologies, Germany), and eluted in 3µL of 65% MS buffer B (90% ACN, 0.1% FA, 10%
water, 0.02% TFA) and 35% MS buffer A (5% ACN, 0.1% FA, 95% water, 0.02% TFA).

42
Samples were diluted to 40µL of MS buffer A, randomized, and loaded onto a C-18 column
coupled to a triple quadrupole mass spectrometer.
2.2.2.3 SRM assays
SRM assays were developed on a triple-quadrupole mass spectrometer (TSQ Vantage; Thermo
Fisher Scientific, USA) using a nanoelectrospray ionization source (nano-ESI, Proxeon
Biosystems, FL), as previously described (165). Briefly, a 60-minute, three-step gradient was
used to load peptides onto the column via an EASY-nLC pump (Proxeon Biosystems, FL), and
peptides were analyzed by a multiplexed SRM method using the following parameters:
predicted CE values, 0.002 m/z scan width, 0.01 s scan time, 0.3 Q1, 0.7 Q3, 1.5 mTorr Q2
pressure and tuned tube lens values. Quantification, in SF set I, was executed after
normalization against a set of 4 peptides corresponding to 2 housekeeping proteins (LRG1,
CFI), to offset technical variations. Each sample was analyzed in duplicate, using a 60-minute
method, whereby 117 transitions were monitored. Quantification in SF set II was executed
following normalization against the added heavy-labelled peptides, as described earlier. Each
sample was analyzed in duplicate, using a 60-minute method, whereby 134 transitions were
monitored. Reproducibility of the SRM signal was confirmed by running a quality control
solution of 0.1 fmol/µL bovine serum albumin, every 10 runs.
2.2.2.4 SRM protein quantification
Raw files recorded for each sample were analyzed using Pinpoint software (Thermo Fisher
Scientific, USA) (166), and peptide XICs were extracted. Pinpoint was used for identification
and visualization of transitions, as well as manual verification of co-elution of heavy and

43
endogenous peptides. In the first SF set, in order to control for technical variation between the
samples, XIC corresponding to each endogenous peptide replicate were divided by the XIC
corresponding to the average of the two housekeeping proteins. This value was then averaged
amongst the two replicate runs, to obtain “XIC Average normalized to housekeeping proteins”.
In SF set II, in order to control for technical variation between the samples and obtain a more
robust quantitative value for our proteins of interest, the XIC value corresponding to each
endogenous peptide, was divided by the XIC value corresponding to each spiked-in heavy
peptide, in order to obtain a L:H (light:heavy) ratio. Since we added a known amount of each
heavy peptide to our samples prior to analysis, we used the L:H ratio to calculate the relative
concentration of each endogenous peptide corresponding to our proteins of interest.
2.2.2.5 Statistical analysis
Results were analyzed using nonparametric statistics with the Mann-Whitney U test. P-values
(P) less than 0.05 were considered statistically significant.
Figure 2.1 outlines the overall experimental workflow.

44
Figure 2.1 Summary of the biomarker discovery and verification experimental workflow
in SF

45
2.3 Results
2.3.1 Delineating the PsA SF proteome
Our LC-MS/MS analysis of SF identified and quantified 443 proteins, which were present in at
least two of the three technical replicates representative of each PsA and OA pool. Of these, 137
proteins were differentially regulated (2.0<XIC ratio<0.8) between the PsA and early OA SF, as
shown in Table 2.1. A total of 44 proteins were upregulated with a PsA/OA ratio greater than 2,
while 93 proteins were downregulated, with a ratio less than 0.8. The IPA software was used to
identify dysregulated functional pathways associated with both the upregulated and
downregulated proteins in the PsA SF proteome. The top five molecular and cellular functions
associated with upregulated proteins were, cell-to-cell signalling and interaction, cell movement,
antigen presentation, cell cycle, and cell morphology, some of which have been shown to be
attributes of PsA. The top canonical pathways associated with these proteins were acute-phase
response signalling, granulocyte adhesion and diapedesis, and production of nitric oxide and
reactive oxygen species in macrophages (Table 2.2). While some of the functions were similar,
the downregulated proteins were less associated with inflammatory processes. Since our
ultimate goal is to identify candidate biomarkers for PsA, we decided to focus on proteins that
were overexpressed in PsA SF.

46
Table 2.1 Differentially expressed proteins between early OA and PsA groups identified by
LC-MS/MS
Upregulated Proteins Downregulated Proteins
Protein Name PsA:OA FC Protein Name PsA:OA FC
S100A9 19.4 FN1 0.8
CRP 18.7 FN4 0.8
DEFA1 13.1 IGHK 0.8
SAA1 12.7 PLG 0.8
MMP3 10.6 HPX 0.8
H2AFX 9.7 SNC73 0.8
PFN1 9.1 IGHD 0.8
H4 8.6 Anti-RhD monoclonal T125 gamma1 heavy chain 0.7
BASP1 7.4 BDK 0.7
CDABP0047 6.7 F2 0.7
CTSG 6.7 IGFALS 0.7
APOC1 6.3 IGHK 0.7
MMP1 6.1 IGHM 0.7
C4B 4.4 ITIH2 0.7
SERPINB1 4.3 MIH 0.7
ACTA1 3.9 Putative Uncharacterized Protein cDNA FLJ78387 0.7
MPO 3.9 Putative Uncharacterized Protein DKFZp686C11235 0.7
PLS2 3.9 Putative Uncharacterized Protein DKFZp686G11190 0.7
M2BP 3.8 Putative Uncharacterized Protein DKFZp686K03196 0.7
C1QB 3.5 Putative Uncharacterized Protein DKFZp686K18196 0.7
ACTB 3.4 Putative Uncharacterized Protein DKFZp686O01196 0.7
FGG 3.3 SERPINA1 0.7
APC2 3.2 SERPINA8 0.7
CD5L 3.1 IGHD 0.7
ACTBL2 3.0 VH 0.7
C1R 2.9 Cold agglutinin FS-2 L-chain (Fragment) 0.7
CP 2.9 57 kDa protein 0.6
FGB 2.8 APOA4 0.6
A2M 2.6 BDK 0.6
PZP 2.6 BTD 0.6
IGCJ 2.5 F12 0.6
ORM1 2.5 GC 0.6
APCS 2.4 IGHG1 0.6
FGA 2.3 IGHG4 0.6
ACBP 2.3 Putative Uncharacterized Protein 56 kDa protein 0.6
APOB 2.2 Putative Uncharacterized Protein 59 kDa protein 0.6
APOBR 2.2 V<kappa>3 Chain 0.6

47
C4BP 2.2 VH3 0.6
CLEC3B 2.2 C2 0.6
IGHM 2.1 Putative Uncharacterized Protein DKFZp686P15220 0.6
ITIH3 2.1 ECM1 0.6
ITIH4 2.1 Putative Uncharacterized Protein DKFZp686F0970 0.6
VL4 2.1 IGHV 0.6
F5-20 0.6
IGK 0.6
Putative Uncharacterized Protein 26 kDa protein 0.6
Putative Uncharacterized Protein DKFZp686I04196 0.6
IGK 0.6
AMBP 0.6
Putative Uncharacterized Protein 26 kDa protein 0.6
AZGP1 0.6
CLU 0.6
FETUB 0.5
MMP2 0.5
GSN 0.5
IGKC 0.5
IGKC 0.5
SERPINA4 0.5
HBA1 0.4
Putative Uncharacterized Protein DKFZp686H17246 0.4
SERPINF2 0.4
MSF 0.4
VH4 0.4
SERPINA5 0.4
SEPP1 0.4
F13A 0.4
AFM 0.4
PLG 0.4
APOA1 0.4
IGHFv 0.4
IGHV 0.4
TSP4 0.4
IGH 0.4
SERPINF1 0.4
PCOLCE 0.3
IGL 0.3
EFEMP1 0.3
LDC 0.3
CRTAC1 0.3

48
FGFBP2 0.3
ACAN 0.2

49
According to gene ontology functional annotation, the majority of these proteins were
extracellular, plasma membrane-associated, or proteins with unknown localization (Figure 2.2),
consistent with the fact that SF is a proximal fluid, and most of the proteins are likely shed or
secreted by chondrocytes, synoviocytes, and inflammatory cells which come in direct contact
with this biological fluid. Since inflammation-driven cell death naturally occurs during PsA, this
could lead to the release of cytosolic proteins into the SF, therefore the cytosolic proteins we
identified also hold biological importance. We focused on proteins displaying strong expression
in skin, bone, and immune regulatory cells (Table 2.3), but excluded immunoglobulins from
further analysis. This reduced our list to 20 proteins, from which, high abundance serum
proteins, as identified using the Plasma Proteome Database, were excluded (SAA1, APCS,
APOC1), as we assumed that these were most likely serum contaminants from the joint
aspiration or arthroscopic procedure. This filtering yielded a final set of 17 proteins (Table 2.4),
which we deemed likely to be associated with PsA. The validity of our discovery approach was
further enhanced by the discovery of previously investigated PsA- associated proteins (CRP,
MMP3, S100A9) (115, 167, 168, 169).

50
Table 2.2 Summary of Ingenuity Pathway Analysis (IPA)-generated functional pathways
and diseases associated with elevated proteins identified from PsA SF
IPA
Number of
Components
Identified Proteins P-Value
Diseases and Disorders
Connective Tissue Disorders 8 ACTA1, DEFA1, IGHM, PLS2,
MMP1, MMP3, MPO, S100A9 1.21E-07
Inflammatory Disease 8 ACTA1, DEFA1, IGHM, PLS2,
MMP1, MMP3, MPO, S100A9 1.21E-07
Skeletal and Muscular Disorders 8 ACTA1, DEFA1, IGHM, PLS2,
MMP1, MMP3, MPO, S100A9 1.21E-07
Inflammatory Response 10
CTSG, FGA, PLS2, S100A9,
APCS, MPO, SAA1, DEFA1, ORM1,
MMP1
2.86E-06
Immunological Disease 5 ACTA1, DEFA1, PLS2, MPO,
S100A9 1.04E-04
Molecular and Cellular Functions
Cell-to-cell Signaling and Interaction 11
CTSG, FGA, PLS2, S100A9,
MPO, ORM1, DEFA1, APCS,
APOC1, SAA1, MMP1
2.86E-06
Cellular Movement 8 CTSG, DEFA1, SAA1, PLS2,
MMP1, MMP3, S100A9, PFN1 5.69E-05
Antigen Presentation 1 PLS2 2.11E-03
Cell Cycle 1 PFN1 2.11E-03
Cell Morphology 2 PLS2, PFN1 2.11E-03
Physiological System Development and Function
Hematological System Development and Function 10
CTSG, FGA, PLS2, S100A9,
MPO, ORM1, DEFA1, SAA1, APCS,
IGHM
2.86E-06
Immune Cell Trafficking 10
CTSG, FGA, PLS2, S100A9,
MPO, ORM1, DEFA1, SAA1, MMP1,
APCS
2.86E-06
Tissue Development 8 CTSG, FGA, PLS2, S100A9,
MPO, ORM1, SAA1, ACTA1 2.86E-06
Cell-mediated Immune Response 3 CTSG, DEFA1, PLS2 1.51E-03
Organismal Survival 2 ACTB, PLS2 3.33E-03

51
Top Canonical Pathways
LXR/RXR Activation 5 APOB, APOC1, FGA, ORM1,
SAA1 2.70E-06
Acute Phase Response Signaling 5 APCS, C4BP, FGA, ORM1,
SAA1 1.53E-05
Clathirin-mediated Endocytosis Signaling 5 ACTA1, ACTB, APOB, APOC1,
ORM1 2.61E-05
Granulocyte Adhesion and Diapedesis 4 ACTA1, ACTB, MMP1, MMP3 3.53E-04
Production of Nitric Oxide and Reactive Oxygen
Species in Macrophages 4 APOB, APOC1, MPO, ORM1 3.09E-04

52
Figure 2.2 Cellular localization of the 44 upregulated proteins based on GO annotation.
The numbers depicted represent the
number of proteins with the specified
cellular localization.
Table. 2.3 Tissue expression of the top 20 elevated proteins identified from SF
*BioGPS does not contain expression data for bone tissue
Human Protein Atlas BioGPS*
Protein Name Tissue Expression Tissue Expression
C4BP Immune Bone Skin Immune
APCS Skin Immune Immune
ORM1 Immune Bone Immune
CD5L Immune Skin Immune
M2BP Skin Bone Skin Immune
PLS2 Immune Immune
MPO Immune Immune
SERPINB1 Immune Immune
MMP1 Bone
APOC1 Skin Immune
CTSG Immune Immune
BASP1 Skin Immune Immune
H4 Skin Immune Bone Immune
PFN1 Skin Immune Skin Immune
H2AFX Skin Immune Bone Skin Immune
MMP3 Skin Immune Bone Skin Immune
SAA1 Skin
DEFA1 Immune Bone Immune
CRP Skin Immune Skin Immune
S100A9 Skin Immune
Extracellular, 30
Plasma-membrane, 6
Cytoplasmic or Nuclear, 6
Unknown, 2

53
Table 2.4 Fold change (FC) of seventeen elevated and two housekeeping* proteins in PsA
SF and the corresponding peptides
2.3.2 SRM Verification of putative markers in individual SF
samples
To verify the differences in protein expression between PsA and early OA SF samples, as
identified by LC-MS/MS, we developed multiplexed selected reaction monitoring assays.
Reactions were developed for 17 peptides representative of the 17 proteins with increased
expression in the SF of PsA patients, as well as 4 peptides representing the 2 housekeeping
proteins that had unchanged expression between PsA and OA SF (Table 2.4). Consistent with
Protein Description Gene Name PsA:OA FC Corresponding SRM
peptides
Orosomucoid 1 ORM1 2.5 WFYIASAFR
Cathepsin G CTSG 6.7 NVNPVALPR
Profilin 1 PFN1 9.0 TLVLLMGK
Histone 4 H4 8.6 VFLENVIR
Histone 2A type I A H2AFX 9.7 NDEELNK
Brain acid soluble protein 1 BASP1 7.4 ESEPQAAAEPAEAK
22 kDa interstitial collagenase MMP1 6.1 DIYSSFGFPR
Leukocyte elastase inhibitor SERPINB1 4.3 LGVQDLFNSSK
Myeloperoxidase MPO 3.9 IGLDLPALNMQR
Plastin 2 PLS2 3.9 NWMNSLGVNPR
Galectin-3-binding protein M2BP 3.8 AVDTWSWGER
C4b-binding protein C4BP 2.1 YTCLPGYVR
C-reactive protein CRP 18.7 ESDTSYVSLK
Protein S100A9 S100A9 18.9 LTWASHEK
Stromelysin 1 MMP3 10.6 VWEEVTPLTFSR
Neutrophil alpha defensin 1 DEFA1 13.1 IPACIAGER
CD5-like protein CD5L 3.0 IWLDNVR
Leucine-rich alpha-2-glycoprotein 1*
LRG1
1.0
DLLLPQPDLR
GQTLLAVAK
Complement Factor I*
CFI
1.0
FSVSLK
YTHLSCDK

54
our LC-MS/MS analysis of the pooled samples, overexpression of 13 out of these 17 proteins
was also verified in the individual PsA SF samples (Set I), as compared to the early OA SF
(Figure 2.3). Each sample consisted of two technical replicates. CRP, MMP3, and S100A9,
were amongst these 13 verified proteins. The mean fold change of each protein and the
associated P-values are depicted in Table 2.5.

55
Figure 2.3 Verification of elevated proteins in PsA synovial fluid (Set I) by selected
reaction monitoring assays, normalized against housekeeping protein
OA
PsA
0
5
10
15
20
CTSG
***
OA
PsA
10
12
14
16
18
DEFA1
**
OA
PsA
0
5
10
15
20
25
H2AFX
**
OA
PsA
16
18
20
22
CD5L
***
OA
PsA
0
5
10
15
20
MPO
***
OA
PsA
0
5
10
15
20
25
CRP
***
OA
PsA
0
5
10
15
20
25
MMP3
***
OA
PsA
0
5
10
15
20
M2BP
**
OA
PsA
10
12
14
16
18
20
22
H4
*
OA
PsA
12
14
16
18
20
22
ORM1
*
OA
PsA
0
5
10
15
20
S100A9
***
OA
PsA
0
5
10
15
20
C4BP
**
OA
PsA
0
5
10
15
20
PFN1
***
OA
PsA
1.00
1.05
1.10
1.15
1.20
1.25
1.30
CFI
ns
OA
PsA
0.7
0.8
0.8
0.9
0.9
LRG1
ns
Dots represent SF samples from individual subjects; thin horizontal lines depict the mean,
and vertical lines the SD. **** indicates P<0.0001; ***P<0.001; **P<0.01; *P<0.05; ns:
non-significant.
Norm
aliz
ed X
IC

56
Additionally, we also confirmed the elevation of 12 out of the 17 proteins, in an independent set
of 10 PsA, and 10 early OA SF samples (Set II). In this case, we utilized heavy-labeled peptides
in order to obtain an absolute concentration of these peptides in SF (Figure 2.4). The proteins
included MPO, M2BP, DEFA1, H4, H2AFX, ORM1, CD5L, PFN1, and C4BP, as well as our
positive controls MMP3, S100A9, and CRP. The mean fold change and P-values corresponding
to each protein from SF set II are also depicted in Table 2.5.
Table 2.5 Summary of the fold change (FC) of candidate markers in SF Set I and II*
*Set I and Set II are described in the experimental methods section
Set I Set II
Gene Name PsA:OA FC P-Value PsA:OA FC P-Value
ORM1 2.1 0.0217 1.6 0.0487
CTSG 2.6 0.0001 2.4 0.0887
PFN1 2.6 0.0006 1.9 0.0299
H4 2.2 0.0271 2.5 0.0015
H2AFX 2.2 0.0022 3.3 0.0092
BASP1 1.9 0.8115 2.9 0.1220
MMP1 1.9 0.5580 1.5 0.6182
SERPINB1 2.0 0.4623 1.4 0.3298
MPO 3.5 0.0001 2.8 0.0039
PLS2 2.0 0.3051 1.0 0.9365
M2BP 2.3 0.0041 3.0 0.0048
C4BP 2.3 0.0016 2.1 0.0105
CRP 2.9 0.0001 2.8 0.0010
S100A9 2.8 0.0001 3.9 0.0010
MMP3 2.9 0.0001 3.8 0.0001
DEFA1 2.1 0.0086 2.9 0.0001
CD5L 2.1 0.0005 2.5 0.0002

57
Figure 2.4 Verification and concentration of elevated proteins in PsA synovial fluid (Set II)
by selected reaction monitoring assays, normalized against heavy-labeled peptides.
Dots represent SF samples from individual subjects; thin horizontal lines depict the
mean, and vertical lines the SD. **** indicates P<0.0001; ***P<0.001; **P<0.01;
*P<0.05; ns: non-significant.
ORM1
OA
PsA
0
50
100
150
*
fmol/ul
H2AFX
OA
PsA
-500
0
500
1000
1500
*
fmol/ul
C4BP
OA
PsA
0
5
10
15
*
pmol/ul
MMP3
OA
PsA
0
50
100
150
***
fmol/ul
PFN1
OA
PsA
0
5
10
15
*
fmol/ul
MPO
OA
PsA
0
5
10
15
**
fmol/ul
CRP
OA
PsA
0
5
10
15
20***
pmol/ul
DEFA1
OA
PsA
0
500
1000
1500***
fmol/ul
H4
OA
PsA
0
50
100
150
**
fmol/ul
M2BP
OA
PsA
0
5
10
15*
fmol/ul
S100A9
OA
PsA
0
500
1000
1500
***
fmol/ul
CD5L
OA
PsA
0
50
100
150
***
fmol/ul

58
2.4 Discussion
In the present study, we performed proteomic analysis of SF, and identified 137 proteins that
were differentially expressed between PsA and OA SF. Since one of our future goals is to
investigate these proteins as serum biomarkers, we chose to focus only on the 44 upregulated
proteins. Moreover, these proteins were reduced to 17 promising candidates that are likely
produced by the synovial membrane, cartilage, or surrounding inflammatory cells, and are
secreted into the synovial fluid compartment. The elevation of 12 of these proteins was
confirmed in an independent SF cohort, using SRM assays, in order to provide sensitive and
specific quantification. As an internal validation of our approach, we re-discovered a number of
proteins previously known to be involved in the context of PsA or psoriasis progression. For
example, our top 3 up-regulated proteins (based on fold change) - S100A9 (168, 169), MMP3,
and CRP (115, 167) - have been extensively studied in the context of PsA.
Psoriasis is a T-cell driven disease that causes epidermal hyperplasia, with an influx of
autoimmune effector cells including monocytes, neutrophils, and dendritic cells (1). Erythema is
also an important feature of psoriasis and is caused by increased growth and dilation of
superficial blood vessels in the skin (1). Joint and synovial findings in PsA are T-cell driven, as
in the skin, and the prominent hyperplasia of blood vessels in skin is echoed in the synovial
membrane (148). PsA also causes hyper proliferation of the lining cells of the synovium,
resulting in the formation of invasive, inflammatory tissue (150, 170, 171). These aspects are
reflected in the current study, through the identification of upregulated proteins belonging to I)
acute-phase response signalling, II) granulocyte adhesion and diapedesis, III) production of

59
nitric oxide and reactive oxygen species in macrophage pathways, and IV) cell-to-cell signalling
and interaction, cell movement, and antigen presentation.
One of these proteins, alpha defensin 1 (DEFA1), is secreted by neutrophils in response to
various antigens. Elevated levels have been associated with inflammatory activity in both
rheumatoid arthritis (172) and psoriasis (173). Additionally, antimicrobial defense mechanisms
mediated by DEFA1 have also been described in inflammatory synovium (174). Although a
minor inflammatory process is present in OA synovial tissue, PsA patients demonstrate a more
aggressive state of synovial tissue inflammation compared with OA patients, therefore elevation
in DEFA1 may be a good indicator of PsA pathogenesis.
The enzyme myeloperoxidase (MPO) also seems to play a role in the joint inflammation
associated with PsA, as we have determined that it is elevated in PsA SF. MPO is the
predominant protein present in primary granules of circulating polymorphonuclear cells. It is a
member of the human peroxidase family haeme-containing enzymes that play a role in host
defence against infection, and is the major enzymatic source of leukocyte-generated oxidants,
released by activated neutrophils and used as a marker of leukocyte recruitment and function
and subsequent inflammation (175). Although not specifically in PsA, MPO has been shown to
be elevated in SF and serum derived from RA patients (175) and has been linked to the
maintenance of oxidative stress in both psoriasis (176) and RA (177). Biological similarities
between PsA and RA have been previously described, especially among PsA patients with
polyarticular peripheral arthritis (150, 171). Increased expression of MPO may also represent an
important mediator of PsA. Furthermore, CD5-like protein (CD5L) has been described as an
alternative ligand for CD5, a lymphoid-specific membrane glycoprotein that is constitutively

60
expressed in all T cells, but expressed in highest levels in activated T-cells (178). Recently,
circulating CD5 levels were shown to be increased in RA and systemic lupus erythematosus
(179), and currently we have confirmed the elevation of its ligand, CD5L, in PsA SF. Although
the functional relevance of CD5L is unknown, it may play a role in the stimulation and
regulation of the immune system (179). Moreover, a set of recent experiments have provided
evidence showing that CD5 stimulation, favors Th17- over Th1-driven polarization of naïve T-
cells (180); the functional relevance of CD5L in this has not been investigated yet. This is
relevant since in both psoriatic skin and synovium, while CD8+ T-lymphocytes predominate,
the important role played by the Th17 subset of CD4+ T-cells in psoriatic disease has recently
also become apparent (57-59, 181). Together, these findings corroborate our hypothesis, that the
proteins we have identified are relevant to PsA and the underlying mechanisms that potentiate
this disease.
We also uncovered novel putative mediators, which have yet to be described in arthritides,
which include BASP1, H2AFX, and ORM1. Interestingly, of these, only ORM1 has been
previously associated with psoriasis, where ORM1 was increased in the plasma of psoriatic
patients. The specific function of this protein has not been determined yet, although it is
believed to be involved in aspects of immunosuppression (182). We speculate that ORM1 may
have a protective role in suppressing the immune system to decrease inflammation.
Despite these interesting findings, there are some aspects in the design of this study that need to
be further clarified. First, the “control” synovial fluid originated from joints of patients with
early OA, and not patients with psoriasis without PsA. We decided to use these samples since

61
SF from psoriasis patients is difficult to obtain. Moreover, it has been shown that early OA
represents an appropriate comparison, to our inflammatory PsA SF (147).
Second, pooling of samples in the discovery phase of a proteomic study could potentially mask
meaningful discrepancies among the different individual SF proteomes. While pooling of
biological replicates does not allow for statistical comparison, it does produce sufficient sample
and increases the likelihood of identifying proteins that are otherwise undetectable (low
abundance) in individual samples, therefore allowing a more extensive proteomic coverage of
the disease’s heterogeneity. In the current study, we pooled biological replicates and performed
SCX fractionation of each pool in triplicate. With the discovery step, we intended to generate a
comprehensive SF dataset to identify potential mediators and select candidates for SRM.
Therefore, by pooling samples and subsequently quantifying proteins in individual samples, we
have taken advantage of two complementary approaches in order to obtain more meaningful
results.
Third, many groups have previously utilized albumin depletion prior to in-gel separation (97) ,
and subsequent proteomic analysis, in order to simplify the SF protein content, and reduce the
dynamic range of proteins. We chose to omit this step for the following reasons: I) albumin is a
fundamental carrier protein, and therefore, its depletion would result in loss of potentially
important proteins from our analysis (97), and II) including a step of immune depletion to our
analysis has the potential of increasing the percent error and reducing the reproducibility of our
experiments, both of which could increase our false discovery rate (133). In fact, in a pilot study
where we assessed the protein recovery following albumin depletion, we determined that our
protein recovery was 20-40% lower (data not shown).

62
As discussed previously, quantification of protein levels has been a major challenge in
proteomics (136). We utilized a label-free approach in order to quantify, and identify
upregulated proteins in PsA SF. In general, the advantage of label-free approaches over
chemical labeling lies in the low cost and the high number of samples that can be easily
included in the experiment. Potential disadvantages are lower reproducibility, which may
compromise detection of smaller quantitative changes between samples. The lower
reproducibility mostly results from the fractionation of peptides prior to LC-MS/MS analysis,
and the subsequent pooling of eluted fractions, which can result in unequal/uncontrolled
pooling, as was the case in the present study. For example, based on our SCX chromatographic
spectra, we noticed several PsA fractions contained higher protein amounts, and pooling of
these fractions could hinder the identification of low-abundance proteins; the high-protein
fractions were therefore analyzed individually in the PsA group, resulting in the higher number
of SCX fractions (15, compared to 10 in early OA, as described in the Methods section). To
ensure accuracy and reproducibility of the SCX chromatography, following LC-MS/MS
analysis, several peptides were chosen at random, and their occurrence was monitored across
fractions corresponding to the PsA and early OA pools. Although the peptide profile was not
identical in each fraction, as several peptides in the PsA group spanned multiple fractions,
generally the peptide having the highest abundance was found in the same fraction when
comparing early OA and PsA groups. Additionally, the reproducibility of LFQ experiments is
also largely based on the timeframe of the experiment (97); therefore, in the present study, we
standardized the entire pipeline, from sample collection and processing, to instrument setup and
calibration. Despite the shortcomings of the fractionation and pooling strategy, we did verify the

63
overexpression of particular proteins using specific SRM assays, which provides validity to our
entire strategy.
Overall, this study represents the most comprehensive proteomic analysis of PsA synovial fluid,
to date. We discovered and verified 12 proteins significantly elevated in PsA SF, compared to
early OA SF. Interestingly, the majority of these proteins are part of functional pathways that
are known to be dysregulated in psoriasis or PsA. These proteins may serve as potential
mediators of the pathogenesis of PsA, and should be further investigated in functional
experiments. Also, a large-scale validation of these proteins in serum is essential, in order to
investigate these proteins as putative biomarkers and/or therapeutic targets for the detection and
treatment of PsA.

64
Chapter 3
The data presented in this chapter has been published in Clinical Proteomics:
Cretu D, Liang K, Saraon P, Batruch I, Diamandis EP, Chandran V. Quantitative tandem mass-
spectrometry of skin tissue reveals putative psoriatic arthritis biomarkers. Clin
Proteomics.2015;12:1

65
Quantitative proteomic analysis of skin biopsies from
patients with psoriasis and psoriatic arthritis
3.1 Introduction
Psoriatic arthritis (PsA) is a distinct inflammatory arthritis, which takes its name from its
association with the cutaneous, autoimmune inflammatory disease, psoriasis. It occurs in 30% of
psoriasis patients, with a predicted prevalence of up to 1% in the general population. PsA is a
complex, potentially disabling musculoskeletal disorder often arising early in age. Patients with
PsA have an increased risk for a spectrum of co-morbidities, such as obesity, metabolic
syndrome, diabetes, and cardiovascular disease (31, 32). The diagnosis of PsA presents a
challenge, largely due to its heterogeneous clinical presentation (80, 81); however, early
diagnosis of PsA is essential for prevention of joint damage and disability (88, 89).
The key to early diagnosis is a better recognition of PsA in patients with psoriasis, since the
presence of psoriasis indicates a high risk of the presence or future development of PsA (31).
Soluble biomarkers represent the ideal means for screening patients for PsA. With
improvements in high-throughput genomic platforms, a number of putative markers, ranging
from susceptibility genes, to mRNA profiles have been proposed (9, 41, 42, 106, 151, 152, 183-
185) however there exists no single (or panel) of specific markers, or mediating factor(s). Much
of the research, therefore, focuses on the discovery and validation of PsA biomarkers (186-189).
Identifying these factors would not only facilitate diagnosis and prognosis of PsA, but provide
further insight into disease pathogenesis. Mass spectrometry (MS)-based quantitative proteomic
approaches are well-suited for the discovery of protein mediators and biomarkers of disease

66
(190, 191). Specifically, label-free quantification methods have recently been optimized, where
quantification is based on the differential peak intensity of the peptides in each MS scan (125,
157). Such experiments often result in tens to hundreds of candidate biomarkers that must be
subsequently verified in serum (97). Therefore, in this context of biomarker discovery, high-
throughput proteomics using mass spectrometry is a powerful tool for obtaining disease-specific
proteome profiles of virtually any biological material. Human plasma represents a diverse
proteome and is an excellent source of protein mediators of disease, but proteins secreted by
tissues are diluted in blood, and are often undetectable by current MS methods. Much interest
has been given to the analysis of proximal fluids and tissues, such as synovial fluid and skin.
These represent logical compartments for PsA biomarkers since they are derived directly from
the diseased site and function in the exchange of proteins between the affected site and the
systemic circulation.
Cutaneous psoriasis develops simultaneously or precedes the onset of PsA in up to 90% of PsA
patients, and in order to move forward in the search for PsA screening biomarkers, we must
consider the preceding cutaneous psoriasis stage in PsA patients. Therefore, comparative
analysis of skin between patients with PsA and those with psoriasis but without PsA (PsC)
represents a reasonable experimental workflow. In a pilot study, our group demonstrated that
proteins elevated in the inflamed skin, are likewise upregulated at the serum level, and may
serve as putative markers of PsA (160).
In the current study, we performed label-free quantitation of skin proteins from PsA and PsC
patients. Using selected reaction monitoring assays (SRM) we confirmed the elevation of some
proteins in an independent set of samples from patients with PsA. Following a small-scale

67
validation in serum using ELISAs, we confirmed a significant elevation of β5 Integrin (ITGB5)
in the serum of PsA patients. Periostin (POSTN) also showed a trend towards association. These
proteins may not only serve as potential PsA biomarkers, but may also shed new light into the
pathogenesis of PsA.

68
3.2 Methods
3.2.1 Skin proteomic analysis
3.2.1.1 Clinical samples
Samples were collected with informed consent after institutional review board approval was
obtained from the University Health Network. For the discovery phase, skin biopsies were
obtained from 10 PsA (6 males, 4 females; age range 38-73) and 10 PsC patients (6 males, 4
females; age range 28-77 years) (Set I). PsA patients had psoriasis and satisfied the CASPAR
classification criteria (27), while the PsC patients were assessed by a rheumatologist, to exclude
arthritis. Patients were not undergoing treatment with methotrexate (MTX) or anti-TNF agents.
One 6mm punch biopsy was obtained from unaffected (non-lesional) skin, and one from
affected (lesional) skin from each PsA and PsC patient, amounting to a total of 40 samples.
For the verification (quantification) phase, an independent set of skin samples was acquired
from 5 PsA patients (all males; age range 49-63 years), and 5 PsC patients (3 males, 2 females;
age range 49-67) (Set II). Inclusion criteria were the same as described above.
For the small-scale validation, serum samples were obtained from 33 PsA patients (22 males, 11
females; age range 21-76), and 15 PsC controls (9 males, 6 females, age range 28-77). Inclusion
criteria were the same as described above.

69
3.2.1.2 Pre-analytical sample processing
Skin samples were snap-frozen in liquid nitrogen and stored at -80°C until use. Samples were
suspended in 0.05% RapiGest buffer (Waters, Milford, MA, USA), and the tissue was
homogenized and sonicated for protein extraction. The tissue lysates were spun at 11,000g and
total protein was measured by the Bradford assay (Pierce Biotechnology, Rockford, IL, USA),
on the resulting supernatants. Equal protein amounts from each sample were pooled to create
eight different pools of five samples each [2 PsA lesional (PsA L), 2 PsA non-lesional (PsA N),
2 PsC lesional (PsC L), and. 2 PsC non-lesional (PsC N)]. Proteins in each pool were denatured
and reduced with 5 mM dithiothreitol at 60°C for 45 minutes and alkylated with 15 mM
iodoacetamide, in the dark at room temperature for 45 minutes. Sequencing grade trypsin
(Promega, Madison, WI, USA) was added in a 1:50 (trypsin: protein) ratio, and allowed to
digest for 18 hours at 37°C. Trifluoroacetic acid (1%) was added to cleave RapiGest and inhibit
trypsin activity, and samples were centrifuged at 11,000g for 20 minutes prior to high
performance liquid chromatography (HPLC) using strong cation exchange (SCX) to reduce
peptide mixture complexity.
3.2.1.3 HPLC-SCX
Digested samples were diluted 1:2 in mobile phase A SCX buffer (0.26 M formic acid (FA),
10% acetonitrile (ACN); pH 2.5) and loaded directly onto a 500 μL loop connected to a
PolySULFOETHYL A column (2.1 mm inside diameter × 200 mm length; 5 μm particle size;
200 °A pore size; The Nest Group Inc., MA, USA), containing a silica-based hydrophilic,
anionic polymer (poly-2-sulfotheyl aspartamide). An Agilent 1100 HPLC system was used for

70
fractionation. A 60 minute gradient was employed with a linear gradient starting at 30 minutes
and consisting of mobile phase A and mobile phase B (0.26 M FA, 10% ACN, 1 M ammonium
formate; pH-4.5) for elution of peptides (flow rate 200uL/min). The fractionation was monitored
at a wavelength of 280 nm and performed in duplicate. Fractions were collected every two
minutes from 20 to 55 minutes, and those with a low peak absorbance were pooled, resulting in
a total of 12 fractions per sample. This amounted to a total of 96 SCX fractions, which were
then subjected to liquid chromatographic and tandem mass spectrometric analysis (LC-MS/MS).
SCX column and system performance was ensured by running a quality control peptide mixture
consisting of 1ug/uL Alpha Bag Cell peptide, 1ug/uL Fibrinogen fragment, 5ug/uL Human
ACTH, and 5ug/uL ACE Inhibitor (American Protein Company, CA, USA) after every sample.
3.2.1.4 LC-MS/MS
The SCX fractions were purified through C-18 OMIX Pipette Tips (Agilent Technologies,
Germany), to remove impurities and salts, and eluted in 5 μL of 65% MS buffer B (90% ACN,
0.1% FA, 10% water, 0.02% trifluoroacetic Acid (TFA)) and 35% MS buffer A (5% ACN,
0.1% FA, 95% water, 0.02% TFA). The samples were diluted to 85 μL in MS buffer A and
injected into a nano-LC system (Proxeon Biosystems, FL, USA) connected online to an LTQ-
Orbitrap (Thermo Fisher Scientific, USA). A 90 minute linear gradient reversed phase
chromatography using MS buffer A and MS buffer B, was performed at a flow rate of 400
nL/min to resolve peptides on a C-18 column (75uM x 5 cm; Proxeon Biosystems, FL). The MS
parameters were: 300 Da minimum mass, 4000 Da maximum mass, automatic precursor charge
selection, 10 minimum peaks per MS/MS scan; and 1 minimum scan per group. XCalibur
software v.2.0.7 (Thermo Fisher Scientific, USA) was used for data acquisition.

71
3.2.1.5 Protein identification and quantification
Raw files corresponding to PsA L, PsA N, PsC L, and PsC N data sets were uploaded into
MaxQuant v.1.2.2.2 (www.maxquant.org) (139) and searched with Andromeda (built into
MaxQuant) (138) against the non-redundant IPI.Human v.3.71 database (86, 309 sequences;
released March 2010). Search parameters included a fixed carbamidomethylation of cysteines
and variable modifications of methionine oxidation and N-terminal acetylation. Data was
initially searched against a “human first search” database with a parent tolerance of 20 ppm and
a fragment tolerance of 0.5 Da in order to calculate and adjust the parent tolerance to 5 ppm for
the search against the IPI.Human fasta file. During the search, the IPI.Human fasta database was
randomized and the false discovery rate was set to 1% at the peptide and protein levels. Data
was analyzed using “Label-free quantification” checked, and the “Match between runs” interval
was set to 2 min. Proteins were identified with a minimum of one unique peptide. “LFQ
Intensity” columns corresponding to the extracted ion current (XIC) value of each protein in
replicate PsA L, PsA N, PsC L, and PsC N were averaged, and used to calculate PsA/PsC
lesional and non-lesional ratios (fold change; FC).
3.2.1.6 Bioinformatics analysis
To detect upregulated proteins in the PsA L, one-sided Student’s t-tests were used between PsA
L and PsC L, and PsA N and PsC N after log transformation of XIC values. Only proteins
displaying significant differences [False discovery rate (FDR) <0.2] were used for further
analysis. Averages of the replicate XIC values were calculated for each PsA L, PsA N, PsC L,
and PsC L, and ratios (FC) of PsA L/PsC L, and PsA N/PsC N were computed.

72
Gene names of the upregulated proteins were checked against gene [BioGPS
(http://biogps.org/#goto=welcome) (162)], and protein [Human Protein Atlas
(http://www.proteinatlas.org/) (163)] databases, to identify proteins with strong expression in
PsA-associated tissues and cell types (skin, bone, immune cells).
The Plasma Proteome Database (http:// www.plasmaproteomedatabase.org/) (126) was
employed to identify proteins present in high-abundance in serum, which could represent
potential contaminants. Selected reaction monitoring assays were developed for the top
upregulated proteins in the lesional PsA group and housekeeping (ACTB, TUBB) proteins, and
relative protein quantification was performed in individual skin samples to confirm their
elevation in PsA skin.
3.2.2 Verification of identified proteins using SRM
SRM methods were developed for verification of protein ratios in skin, as described in Chapter
2.
3.2.2.1 SRM assay development
PeptideAtlas (http://www.peptideatlas.org/) was utilized to select 3–4 tryptic peptides for the
proteins of interest. The uniqueness of peptides was verified by BLAST
(https://blast.ncbi.nlm.nih.gov/Blast.cgi). To identify peptide fragments (transitions) to monitor,
in silico peptide fragmentation was performed using Pinpoint software (Thermo Fisher
Scientific, USA) and 5–6 transitions were selected for each peptide. For method optimization,
digested pooled samples of PsA lesional skin, used in our LC-MS/MS analysis, were loaded
onto a C-18 column (Proxeon Biosystems, FL, USA) coupled to a triple quadrupole mass

73
spectrometer (TSQ Vantage; Thermo Fisher Scientific, USA), and approximately 2500
transitions were monitored in 25 subsequent runs. Three transitions were used for subsequent
quantification.
3.2.2.2 Skin sample preparation
Fifty µg of total protein of each skin sample were denatured by heat, reduced, alkylated, and
trypsin-digested as described previously. In sample set II, 500 fmol of a heavy-labeled peptide
(Thermo Fisher), were also added as an internal standard. The heavy peptide sequence was
LGPLVEQGR, where the C-terminal arginine was labeled with 13C and 15N. The resulting
peptides were purified through C-18 OMIX Pipette Tips (Agilent), and eluted in 3µL of 65%
MS buffer B and 35% MS buffer A. Samples were diluted to 40µL of MS buffer A, randomized,
and loaded onto a C-18 column coupled to a triple quadrupole mass spectrometer.
3.2.2.3 SRM Assays
SRM assays were developed on a triple-quadrupole mass spectrometer (TSQ Vantage) using a
nanoelectrospray ionization source (nano-ESI, Proxeon Biosystems, FL), as previously
described in Chapter 2. Briefly, a 60-minute, three-step gradient was used to load peptides onto
the column via an EASY-nLC pump (Proxeon Biosystems, FL), and peptides were analyzed by
a multiplexed SRM method. Quantification, in skin set I was performed after normalization
against a set of 4 peptides corresponding to 2 housekeeping proteins, to offset technical
variations. Each sample was analyzed in duplicate, using a 60-minute method, whereby 153
transitions were monitored. Quantification in SF set II was performed following normalization
against the spiked-in heavy-labeled peptide, as described earlier. Each sample was analyzed in

74
duplicate, using a 60-minute method, whereby 156 transitions were monitored. Reproducibility
of the SRM signal was confirmed by running a quality control solution of 0.1 fmol/μL BSA
after every 10 runs.
3.2.2.4 SRM protein quantification
Raw files recorded for each sample were analyzed using Pinpoint software (Thermo Fisher)
(144), and peptide XIC were extracted. Pinpoint was used for identification and visualization of
transitions. In the first skin set, in order to control for technical variation between the samples,
XIC corresponding to each endogenous peptide replicate were divided by the XIC
corresponding to the average of the two housekeeping peptides. This value was then averaged
amongst the two replicate runs, to obtain “Normalized XIC”. In skin set II, in order to control
for technical variation between the samples and obtain a more robust quantitative value for the
proteins of interest, the XIC value corresponding to each endogenous peptide, was normalized
to the XIC value corresponding to the spiked-in heavy peptide, in order to obtain a light:heavy
(L:H) ratio. Since we added a known amount of heavy peptide to our samples prior to analysis,
we used the L:H ratio to calculate the relative concentration of each endogenous peptide
corresponding to the proteins of interest.
3.2.3 Validation of verified proteins
3.2.3.1 Enzyme-linked immunosorbent assays
The concentration of ITGB5 in serum was measured using an in-house developed protocol.
Sheep anti-human ITGB5 polyclonal antibody (R&D Systems, Minneapolis MN, USA; Cat.#

75
AF3824) was immobilized in a 96-well clear polystyrene plate by incubating 100 μL of
0.75 ng/μL capture antibody in PBS (137 mM NaCl, 2.7 mM KCl, 8.1 mM Na2HPO4, 1.5 mM
KH2PO4, pH 7.4) overnight. The plates were washed three times with wash buffer (5 mmol/L
Tris, 150 mmol/L NaCl, 0.05% Tween® 20, pH 7.8), after which the plate was blocked by
adding 300 μL of 1% BSA in PBS to each well and incubated with shaking at room temperature
for 60 min. The plates were then washed three times with wash buffer and incubated with
100 μL per well of ITGB5 recombinant protein standards (R&D Systems), or serum samples
with shaking at room temperature for 2 h. ITGB5 standards and serum samples were diluted in
1% BSA in PBS, with all serum samples diluted 10-fold. After incubation, the plates were
washed three times with wash buffer and incubated with 100 μL per well of biotinylated sheep
anti-human ITGB5 detection antibody (R&D Systems; Cat.# BAF3824) (0.25ng/μL detection
antibody in 1% BSA in PBS) with shaking at room temperature for 2 h. After washing the plates
three times with wash buffer, 100 μL of streptavidin-conjugated horseradish peroxidase solution
(diluted 200-fold in 1% BSA in PBS) was added to each well and incubated for 15 min with
shaking at room temperature. A final wash of three times with washing buffer was followed by
the addition of 100 μL of 3,3′,5,5′-Tetramethylbenzidine (Sigma Aldrich, St, Louis, MO, USA)
per well and incubated with shaking at room temperature for 10 min. The chromogenic reaction
was stopped with the addition of 50 μL of 2 mol/L hydrochloric acid solution per well.
Subsequently, the absorbance of each well was measured with the Wallac Envision 2103
Multilabel Reader (Perkin Elmer, MA) at 450 nm, standardized to background absorbance at
540 nm. Final serum concentrations were calculated by multiplying by the dilution factor.

76
The concentration of POSTN in serum was measured using a custom multiplexed Luminex
Screening Assay (R&D Systems; Cat.# LXSAH), according to manufacturer’s instructions.
Serum was diluted 100-fold.
3.2.3.2 Statistical analysis
The Student’s t-tests were performed to analyze the LC-MS/MS data using R statistical software
(http://www.r-project.org/). The remaining statistical analyses were performed using Graph Pad
Prism v.6.0 for Mac (GraphPad Software, CA, USA). Results were analyzed using the
nonparametric Mann-Whitney U test. P-values less than 0.05 were considered statistically
significant. Spearman's rank correlation coefficient was used to assess the correlations between
serum levels of POSTN, and ITGB5. Concentrations are reported in the text as mean ± standard
deviation (SD).

77
Figure 3.1 Summary of the biomarker discovery, verification, and preliminary validation
experimental workflow in skin
1922
138

78
3.3 Results
3.3.1 Delineating the PsA skin proteome
Our LC-MS/MS analysis yielded a list of 1922 quantifiable proteins. Student’s t-tests were
utilized to identify upregulated proteins between the PsA and PsC lesional groups, and this
yielded a total of 62 proteins [false discovery rate (FDR) <0.2]. Generally, these proteins
exhibited a ratio above 4.0. In parallel, a comparison between PsA and PsC non-lesional skin,
demonstrated elevated expression of 131 proteins (FDR<0.2). In comparing the proteins
identified from the two independent analyses (PsA L vs PsC L, and PsA N vs. PsC N), only 7 of
these proteins are common.
Since our scope was to identify proteins elevated in lesional PsA skin, we decided to focus on
the 62 proteins overexpressed in the PsA lesional skin, since they are most likely to represent
mediators and potential biomarkers of PsA. We further focused on proteins displaying strong
expression in skin, bone, and immune regulatory cells, but excluded immunoglobulins,
unknown proteins, and high abundance serum proteins from further analysis. Table 3.1 presents
the final list of 47 proteins, the corresponding fold change (FC) between PsA and PsC samples,
and the P-Value and FDR associated with each protein. These were then assessed and
quantified, using a multiplexed selected reaction monitoring assay, in individual skin samples
pertaining to the discovery set (Set I), as well as in an independent set of 10 samples (Set II).

79
Table 3.1 Fold change (FC) of 47 elevated proteins identified by LC-MS/MS in PsA skin
when compared to PsC skin
Protein Name Gene Name
PsA L :PsC
L FC*
P-
Value*** FDR****
Periostin Osteoblast Specific Factor POSTN 2.3 0.006 0.18
Adenylate Kinase 1 AK1 2.4 0.004 0.16
Heat Shock 70kDa Protein 5 HSPA5 2.5 0.008 0.19
WNT1 inducible signaling pathway protein 2 WISP2 2.5 0.002 0.15
Eukaryotic Translation Initiation Factor 2A EIF2A 2.9 0.007 0.18
Activator Of Multicatalytic Protease Subunit 3 PSME3 3.2 0.003 0.16
Alpha-crystallin B chain CRYAB 3.9 0.006 0.18
Proteasome 26S Subunit ATPase 2 PSMC2 3.9 0.001 0.12
Platelet-activating factor acetylhydrolase IB PAFAH1B2 4.5 0 0.12
Keratin 18 KRT18 4.6 0.006 0.18
Carboxypeptidase N 2 CPN2 5.7 0.002 0.15
60S ribosomal protein L19 RPL19 6.6 0.001 0.12
Signal Recognition Particle SRP14 6.8 0.003 0.16
Four And A Half LIM Domains 1 FHL1 7 0.006 0.18
Proline Glutamine-Rich Splicing Factor SFPQ 7.1 0.007 0.18
Asporin ASPN 8.9 0.007 0.18
Gamma-Glutamyltransferase 5 GGT5 9 0.006 0.18
Cytochrome B5 Reductase 2 CYB5R2 9.1 0.006 0.18
Cytoplasmic FMR1 Interacting Protein 1 CYFIP1 10 0.003 0.16
Ring Finger Protein 113A RNF113A 10.4 0.004 0.17
Valyl-TRNA Synthetase VARS 11.7 0.005 0.18
Hydroxysteroid (17-beta) dehydrogenase 4 HSD17B4 15.2 0.003 0.16
Alpha Synuclein SNCA N/A** 0.003 0.16
Heat Shock 70kDa Protein 4-Like HSPA4L N/A 0.003 0.16
26S Proteasome Regulatory Subunit P40.5 PSMD13 N/A 0.004 0.17
KDEL Motif-Containing Protein 2 KDELC2 N/A 0.004 0.17
DNA Polymerase II Subunit A POLE N/A 0.005 0.18
Beta Integrin 5 ITGB5 N/A 0.006 0.18
Armadillo Repeat Containing 1 ARMC1 N/A 0.007 0.18
Transmembrane Emp24 Protein Transport
Domain 7 TMED7 N/A 0.007 0.18
Complement C1q CIQC N/A 0 0.12
Isoform 1 of UPF0505 protein C16orf62 C16orf62 N/A 0 0.12
Sushi repeat-containing protein SRPX N/A 0.001 0.12
Mercaptopyruvate Sulfurtransferase MPST N/A 0.001 0.12

80
Leucine zipper and CTNNBIP1 domain
containing LZIC N/A 0.001 0.12
Mitogen-Responsive Phosphoprotein Disabled
Homolog 2 DAB2 N/A 0.001 0.12
Angiopoietin-like 2 ANGPTL2 N/A 0.001 0.12
Glia maturation factor gamma GMFG N/A 0.001 0.12
Renin binding protein RENBP N/A 0.001 0.12
Ubiquitin-conjugating enzyme E2L 6 UBE2L6 N/A 0.001 0.12
Protein phosphatase 2A activator, regulatory
subunit 4 PPP2R4 N/A 0.002 0.15
Heat shock factor binding protein 1 HSBP1 N/A 0.002 0.15
Glyoxylate reductase/hydroxypyruvate reductase GRHPR N/A 0.002 0.15
Eukaryotic translation initiation
factor 2B, subunit 4 delta EIF2B4 N/A 0.003 0.16
Sorting nexin 1 SNX1 N/A 0.003 0.16
Acyl-CoA Oxidase 1 ACOX1 N/A 0.001 0.12
G protein pathway suppressor 1 GPS1 N/A 0.006 0.18 *FC represents the ratio of the mean XIC values of 10 skin samples per group (PsA L vs. PsC L) **N/A indicates that a ratio could not be compiled since the protein was absent in PsC skin ***P-Values were calculated using the student's t-tests
****FDR represents the false discovery rate of each protein

81
3.3.2 SRM verification of putative markers in individual skin
samples
We developed a multiplexed SRM assay to verify the differences in protein expression between
lesional PsA and PsC skin. Assays were developed for 47 peptides representative of the 47
proteins with increased expression in the skin of PsA patients, as well as 4 peptides representing
2 housekeeping proteins (ACTB, TUBB). Consistent with our LC-MS/MS analysis of the
pooled samples, overexpression of 12 out of the 47 proteins was also verified in the individual
PsA lesional skin samples (Set I), when compared to the lesional PsC samples. Each sample
consisted of two technical replicates. The mean FC of each confirmed protein in the lesional and
non-lesional PsA and PsC skin samples, as well as the associated P-values are depicted in Table
3.2. The proteins included C16ORF62, SNCA, LZIC, SRP14, ITGB5, POSTN, SRPX, FHL1,
PPP2R4, CPN2, GPS1, and PAFAH1B2. The distribution of these, and the housekeeping
proteins across the Set I skin samples, are represented in Figure 3.2.

82
Figure 3.2 Distribution of significant markers and housekeeping proteins across the Set I
PsA and PsC skin samples
Dots represent skin samples from individual subjects; thin horizontal lines depict the mean, and
vertical lines the SD. **** indicates P<0.0001; ***P<0.001; **P<0.01; *P<0.05; ns: non-significant.

83
Table 3.2 Summary of the fold change of candidate markers in skin Set I and Set II
*The description of Set I and Set II are given in the experimental methods section. **Fold change (FC) represents the ratio of means of 10 (Set I) or 5 (Set II) skin samples per
group. Data are based on normalized XIC ratios, as described in the experimental methods
section. PsA, psoriatic arthritis; PsC, cutaneous psoriasis ***P-Values were calculated using the non-parametric Mann-Whitney U test.
Set I Set II
Lesional
Non-lesional Lesional
Protein
Name
PsA:PsC
FC**
P-Value*** PsA:PsC
FC
P-Value PsA:PsC
FC
P-Value
CPN2 17.4 <0.001 2.4 0.030 1.9 0.032
GPS1 6.0 0.014 1.2 0.385 17.9 0.008
C16ORF62 6.0 <0.001 5.3 0.007 3.9 0.667
FHL1 4.6 <0.001 3.1 0.021 2.2 0.016
SRPX 3.8 0.043 3.3 0.014 5.0 0.008
SNCA 3.6 <0.001 1.7 0.089 3.8 0.095
POSTN 3.5 0.001 2.8 0.013 7.5 0.032
PAFAH1B2 3.3 0.004 2.0 0.104 0.8 0.667
SRP14 3.0 0.019 1.3 0.570 2.4 0.016
ITGB5 2.7 0.006 3.5 0.017 4.2 0.032
PPP2R4 2.2 0.043 2.0 0.678 3.9 0.008

84
Additionally, we further confirmed the elevation of 8 of the aforementioned 12 proteins, in an
independent set of 5 PsA, and 5 PsC lesional skin samples (Set II). In this case, we utilized a
heavy-labeled peptide in order to obtain the absolute concentration of these peptides in the skin.
The proteins included SRP14, ITGB5, POSTN, SRPX, FHL1, PPP2R4, CPN2, and GPS1. The
mean FC and P-values corresponding to each protein from SF set II are also depicted in Table
3.2. Figure 3.3 shows the distribution of the 8 proteins across the Set II skin samples, as well as
of the housekeeping proteins. Since only 8 proteins were confirmed in the independent sample
set, we decided to continue all further analyses using these potential markers.

85
Figure 3.3 Distribution of significant markers across the Set II PsA and PsC skin samples
PsA
PsC
0
20
40
60
80
SRP14
fmol/ul
*
PsA
PsC
-500
0
500
1000
1500
2000
POSTN
fmol/ul
*
PsA
PsC
0
20
40
60
80
100
PPP2R4
fmol/ul
**
PsA
PsC
0
20
40
60
ITGB5
fmol/ul
*
PsA
PsC
0
20
40
60
80
100
CPN2
fmol/ul
*
PsA
PsC
0
50
100
150
FHL1
fmol/ul
*
PsA
PsC
0
1000
2000
3000
SRPX
fmol/ul
**
PsA
PsC
0
500
1000
1500
2000
2500
GPS1
fmol/ul
**
PsA
PsC
0
20
40
60
ACTB
fmol/ul
PsA
PsC
0
10
20
30
TUBB
fmol/ul
Dots represent skin samples from individual subjects; thin horizontal lines depict the
mean and vertical lines the SD. **** indicates P<0.0001; ***P<0.001; **P<0.01;
*P<0.05; ns: non-significant.

86
3.3.3 Small-scale ELISA validation in serum
To validate the expression of these markers in serum of PsA patients, we measured the levels of
ITGB5 and POSTN in the serum of 15 PsC and 33 PsA patients. We were unable to measure
SRP14, SRPX, FHL1, PPP2R4, CPN2, and GPS1, due to unavailability of ELISA kits,
antibodies, or protein standards. As shown in Figure 3.4, ITGB5 was significantly elevated in
PsA, when compared to PsC patients (1.19±0.5 compared to 0.77±0.6; p<0.01). The
concentration of POSTN was not significantly different between the two groups, but the mean
level in PsA serum were numerically higher compared to PsC serum (17.71±6.4 compared to
14.53±6.2). The mean FC and distribution of POSTN and ITGB5 in the PsA and PsC serum, is
represented in Figure 3.4.
Figure 3.4 Distribution of markers across PsA (n=33) and PsC (n=15) serum sets
Dots represent serum samples from individual subjects; thin horizontal lines depict the mean,
and vertical lines the standard deviation; FC represents the ratio of the mean concentration
values corresponding to 33 PsA and 15 PsC serum samples. ** indicates P<0.01; ns: non-
significant. PsA, Psoriatic Arthritis; PsC, Cutaneous Psoriasis

87
3.3.4 Correlation amongst markers
Spearman’s rank correlation coefficient was used to assess the correlation amongst markers for
the PsA, and PsC serum groups. ITGB5 correlated significantly with POSTN in PsC serum
(Spearman r = 0.637, P = 0.013), and in PsA serum (Spearman r = 0.433, P = 0.012). Figure 3.5
displays the correlation between POSTN and ITGB5 in all samples (Spearman r = 0.472,
P<0.001).
Figure 3.5. Correlation between ITGB5 and POSTN across the PsA and PsC serum sets.

88
3.4 Discussion
Recent advances in mass spectrometry-based proteomics have facilitated the identification of
putative novel biomarkers and mediators from a variety of tissues, and for various clinical
applications (165, 190, 191). In this study, we conducted high-throughput quantitative
proteomic analyses to identify differentially expressed proteins between skin derived from PsA
and PsC patients. According to our filtering criteria, forty-seven proteins were elevated in the
PsA group, when compared to the PsC group. Eight proteins were verified using a multiplexed
selected reaction monitoring assay, in an independent skin sample set. None of these potential
markers has been described before in the context of PsA or psoriasis. Since serum measurement
of these proteins using SRMs is not efficient due to the high complexity of the fluid, we utilized
available enzyme-linked immunosorbent assays to measure two biomarker candidates in serum
(ITGB5, and POSTN).
Cumulative evidence strongly supports the involvement of Interleukin-23/IL-17 axis in the
pathogenesis of PsA (57-59, 120), and a number of compounds that target components of these
pathways have been recently used in PsA clinical trials (24, 60). IL-23 acts synergistically with
IL-6 and TGF-β to promote rapid Th17 development and IL-17 release (121, 122), which, in
turn, plays a central role in sustaining chronic inflammation (121). Both POSTN and ITGB5
have been implicated, in some manner with this pathway.
Periostin is a matricellular protein belonging to the fascilin family (192). It interacts with several
integrin molecules on cell surfaces, one of which is α5β5 Integrin, and provides signals for tissue
development and remodeling (193). More specifically, it is thought that POSTN interacts with
α5β5 to induce pro-inflammatory cytokine production via the Akt/NF-κB signaling pathway

89
(194). In support of this, deficiency of POSTN or inhibition of α5 integrin (ITGA5) prevented
development or progression of skin inflammation in an Atopic Dermatitis mouse model (193).
Additionally, POSTN has been shown to also act on immune cells, leading to their enhanced
transmigration, chemotaxis, and adhesion (195), all of which further implicate this molecule in
inflammatory processes relevant to PsA.
Apart from acting as a POSTN ligand (along with ITGA5), ITGB5 has also been described in
rheumatoid arthritis, where it serves as a ligand for Cyr61 (195). Cyr61 is a molecule secreted
by fibroblast-like synoviocytes in the joint, and stimulates IL-6 production via ITGA5-
ITGB5/Akt/NF-κB signaling pathway (196). As described earlier, IL-6 production acts with IL-
23 and TGF-β to trigger Th17 differentiation and IL-17 production (121, 122) in inflammatory
processes as they also occur in PsA. As a result, we believe POSTN and ITGB5 are attractive
molecules to investigate further as PsA biomarkers.
Following a small-scale serum validation of POSTN and ITGB5, we determined that only
ITGB5 was significantly elevated in PsA serum, although POSTN also showed a trend.
Additionally, Spearman correlation showed that serum ITGB5 correlates well with POSTN (r =
0.472, p<0.001), which may indicate that these two markers may, in the future, be used as part
of a panel of markers to screen for PsA in PsC patients. The work reported here has some
limitations. First, pooling of the skin samples in the discovery phase has both benefits as well as
drawbacks. While pooling allows a more extensive coverage of the disease’s heterogeneity by
increasing the likelihood of identifying proteins that are otherwise undetectable in individual
samples, it may also mask meaningful discrepancies among the different individual skin
proteomes. To minimize this effect, samples were pooled to obtain two distinct pools in both,

90
PsA and PsC sample groups. Additionally, all pool-derived candidates were further examined in
all individual samples using a targeted and more sensitive mass spectrometry technique. Thus,
by pooling samples as well as verifying protein expression in individual skin samples, we have
taken advantage of two complementary approaches in order to obtain more meaningful results.
Second, the levels of some of the proteins, notably CPN2, differed considerably between the
two verification sets. This could be due to the fact that Set I samples were the original discovery
samples, and thus the large difference seen in Set I verification is expected. Additionally, the
difference observed could simply be due to chance, which outlines the need to perform
verification in hundreds of samples in order to gauge the true distribution of the markers.
Unfortunately, skin biopsies were hard to obtain, and thus we were limited to only 10 and 5
samples for Set I and Set II, respectively.
Third, the identified markers were only tested on a small number of serum samples (n=48), and
only 20 of these were distinct from the Set I and Set II sample sets. Therefore, to assess their
distribution in serum, these markers still need to be tested in a large-scale verification study. In
addition, as discussed previously, only two of the existing eight proposed markers have been
investigated in serum due to the lack of ELISAs or antibodies. Hence, strategies to enable
measurement of the remainder of the markers will have to be employed in the future.
Taken together, our current observations are consistent with the notion that label-free
quantitative LC-MS/MS can be utilized to quantify proteins in tissues, which are shed into the
circulation and serve as serum markers of PsA. Further studies to validate these findings are
underway, in a larger and independent serum cohort. Investigating these proposed markers

91
further, may not only result in the identification of PsA screening biomarkers, but may also
uncover aspects of PsA pathobiology that are currently unknown

92
Chapter 4

93
Validation of three candidate PsA biomarkers in serum
4.1 Introduction
PsA is an inflammatory arthritis associated with the chronic inflammatory skin disease,
psoriasis. The estimated population prevalence of PsA is 0.25%, and it affects approximately
30% of patients seen in dermatology clinics (92, 197, 198). PsA is classified according to the
CASPAR classification criteria (27), which provide high specificity and sensitivity when
applied by rheumatologists (80, 81).
Patients with PsA have progressive joint damage, reduced quality of life, work-related
problems, and more comorbidities when compared to psoriasis patients (200). Additionally,
disease severity at the time of presentation is a risk factor for mortality (201, 202). There is
increasing evidence that early diagnosis and management of PsA leads to better patient
outcomes, and the key to early diagnosis is better recognition of PsA in patients with psoriasis
(79, 87-89).
The presence of cutaneous psoriasis indicates a high risk for developing PsA. Studies conducted
in dermatology clinics have shown high prevalence of undiagnosed PsA in psoriasis patients
(32, 72, 198, 199). This is due to the fact that identifying inflammatory musculoskeletal disease
in patients by non-rheumatologists is difficult since the symptoms are non-specific, and acute-
phase reactants may be normal (80). While there are clinical features that can be utilized to
predict PsA, such as nail, scalp, intergluteal/perianal psoriasis, and psoriasis severity, identifying
soluble biomarkers that can identify PsA in psoriasis patients, may help in early diagnosis, and
subsequent prevention of disability and improvement in quality of life (198, 200, 92, 80, 79).

94
With the aim of identifying new PsA biomarkers, we previously performed proteomic analysis
of synovial fluid and skin biopsies obtained from PsA patients, using LC-MS/MS, and identified
20 putative PsA biomarkers. Of these, the current study details the validation of six candidates,
M2BP, MPO, ITGB5, CD5L, MMP3, and CRP. These were selected based on the availability of
commercial ELISA kits or antibodies, as well as preliminary verification studies reported in a
previous publication.

95
4.2 Methods
4.2.1 Clinical samples
Consent was obtained from all study subjects. Research ethics board approval was obtained
from the University Health Network. Serum samples were obtained from 100 cases with PsA,
100 with PsC, and 100 healthy controls. Patients with PsA had psoriasis, satisfied the CASPAR
classification criteria (27), and had active PsA, defined by at least 3 swollen and tender joints.
PsC patients had chronic plaque psoriasis and were assessed by a rheumatologist to exclude
PsA. Controls represented individuals who did not have psoriasis or inflammatory arthritis.
Patients with PsA and PsC were group matched for age, sex, and psoriasis severity and duration.
Controls were matched for age and sex. The demographics, disease characteristics, and
biomarker levels of recruited patients are demonstrated in Table 4.1.

96
Table 4.1 Demographics, disease characteristics, and serum biomarker levels in studied
cohorts
Characteristics PsA (n=100) PsC (n=100) Controls (n=100)
Females, % 41 45 52
Agea, years 51 (12.1) 49.8 (12.6) 35.2 (10.7)
Psoriasis durationa, years 22.9 (12.5) 20.3 (13.9) -
PsA durationa, years 14.6 (12) - -
Swollen joint counta 3.2 (3.5) - -
Tender joint counta 6 (8.1) - -
Clinically damaged joint counta 7.4 (11.1) - -
PASI scorea 4.7 (6.4) 4 (3.4) -
Patients with current nail involvement, % 74 51 -
Patients on systemic agents, % 35 8 -
Biomarkers
CD5La, ng/mL 192.8 (197.1) 166.9 (147.4) 89.0 (145.1)
ITGB5a, ng/mL 1.5 (2.6) 0.7 (0.4) 0.8 (1.4)
M2BPa, ng/mL 295.6 (50) 269.6 (27.7) 232.9 (64.2)
MMP3a, ng/mL 44.3 (57.3) 22.2 (15.6) 17 (12)
MPOa, ng/mL 418.1 (270.9) 402.5 (217.3) 232.8 (126.6)
CRPa, mg/L 5.9 (2.9) 4 (3.8) 2.3 (2.1)
a Values indicate mean (standard deviation)
No patients were undergoing treatment with biologics at the time of serum collection. Three
patients with PsC were on methotrexate (MTX), while 5 were on retinoids. Thirty-five patients
with PsA were on at least one form of systemic therapy (10 MTX, 13 leflunomide, 10
sulfasalzine, 3 hydroxychloroquine, 1 azathioprine, 1 cyclosporine). Blood samples were drawn
at the time of clinical assessment, processed, and serum aliquots were stored at -80 until
biomarker measurement.

97
4.2.2 Measurement of CD5L, ITGB5, MPO, MMP3, CRP, and
M2BP
4.2.2.1 ITGB5
ITGB5 was measured according to our in-house developed protocol, as described in Chapter 3.
Briefly, sheep anti-human ITGB5 polyclonal antibody (R&D Systems, Minneapolis MN, USA)
was immobilized in a 96-well clear polystyrene plate by incubating 100 μL of 0.75 ng/μL
capture antibody in PBS (137 mM NaCl, 2.7 mM KCl, 8.1 mM Na2HPO4, 1.5 mM KH2PO4,
pH 7.4) overnight. The plates were washed three times with wash buffer (5 mmol/L Tris,
150 mmol/L NaCl, 0.05% Tween® 20, pH 7.8), after which the plate was blocked by adding
300 μL of 1% BSA in PBS to each well and incubated with shaking at room temperature for
60 min. The plates were then washed three times with wash buffer and incubated with 100 μL
per well of ITGB5 recombinant protein standards (R&D Systems), or serum samples with
shaking at room temperature for 2 h. ITGB5 standards and serum samples were diluted in 1%
BSA in PBS, with serum samples diluted 10-fold. After incubation, the plates were washed
three times with wash buffer and incubated with 100 μL per well of biotinylated sheep anti-
human ITGB5 detection antibody (R&D Systems) (0.25ng/μL detection antibody in 1% BSA in
PBS) with shaking at room temperature for 2 h. After washing the plates three times with wash
buffer, 100 μL of streptavidin-conjugated horseradish peroxidase solution (diluted 200-fold in
1% BSA in PBS) was added to each well and incubated for 15 min with shaking at room
temperature. A final wash of three times with washing buffer was followed by the addition of
100 μL of 3,3′,5,5′-Tetramethylbenzidine (TMB) (Sigma Aldrich, St, Louis, MO, USA) per well
and incubated with shaking at room temperature for 10 min. The chromogenic reaction was

98
stopped with the addition of 50 μL of 2 mol/L hydrochloric acid solution per well.
Subsequently, the absorbance of each well was measured with the Wallac Envision 2103
Multilabel Reader (Perkin Elmer, MA) at 450 nm, standardized to background absorbance at
540 nm. Final serum concentrations were calculated by multiplying by the dilution factor.
4.2.2.2 CD5L
The plates were washed three times with wash buffer, after which the plate was blocked by
adding 300 μL of 1% BSA in PBS to each well and incubated with shaking at room temperature
for 60 min. The plates were then washed three times with wash buffer and incubated with
100 μL per well of CD5L recombinant protein standards (R&D Systems; Cat.# 2797-CL-050),
or serum samples with shaking at room temperature for 2 h. CD5L standards and serum samples
were diluted in 1% BSA in PBS, with all serum samples diluted 10-fold. After incubation, the
plates were washed three times with wash buffer and incubated with 100 μL per well of
biotinylated goat anti-human CD5L detection antibody (0.1 ng/μL detection antibody in 1%
BSA in PBS) with shaking at room temperature for 2 h. After washing the plates three times
with wash buffer, 100 μL of streptavidin-conjugated horseradish peroxidase solution (diluted
200-fold in 1% BSA in PBS) was added to each well and incubated for 15 min with shaking at
room temperature. A final wash of three times with washing buffer was followed by the addition
of 100 μL of TMB per well and incubated with shaking at room temperature for 10 min. The
chromogenic reaction was stopped with the addition of 50 μL of 2 mol/L hydrochloric acid
solution per well. Subsequently, the absorbance of each well was measured with the Wallac
Envision 2103 Multilabel Reader (Perkin Elmer, MA) at 450 nm, standardized to background

99
absorbance at 540 nm. Final serum concentrations were calculated by multiplying by the
dilution factor.
4.2.2.3 M2BP
Additionally, the concentration of M2BP was measured using a commercially available ELISA
kit (R&D Systems; Cat.# DY2226) according to manufacturer’s instructions. Samples were
diluted 250-fold.
4.2.2.4 CRP, MMP3, MPO
A commercially available customized multiplexed Luminex Screening Assay (R&D Systems;
Cat.# LXSAH) was purchased for MPO, MMP3, and CRP, and measurement of these markers
was performed according to manufacturer’s instructions. Samples were diluted 100-fold.
4.2.3 Statistical analysis
The levels of most of the proteins are highly skewed to the right, and thus, all statistical analyses
were based on log2 transformed protein levels. The significance of each group (Control, PsC,
PsA) was tested for each biomarker to determine whether there was a significant difference in
protein levels for two group comparisons: PsA vs PsC, and PsA vs Control. Statistical tests were
performed while controlling for significant covariates, which could include age, sex, psoriasis
duration, sample storage duration, PASI score, or drug treatment.
Effects of markers on patients with psoriasis alone vs controls and patients with PsA vs controls
were compared using polychotomous logistic regression, a regression technique useful for
categorical responses with three or more categories. In this way, we were able to test whether

100
the associations between each marker and disease status (PsA or PsC) are the same between the
two disease groups. Univariate, and multivariate logistic regression models were used to identify
which biomarkers were independently associated with PsA, when compared to PsC. These
models were fit with disease classification as the outcome using biomarkers as explanatory
variables while controlling for sex and age. Receiver operating characteristic (ROC) curves
were constructed to investigate how biomarker data can best be used to classify patients into
disease groups. The accuracy of the classification of patients was summarized using the area
under the ROC curve. Finally, to determine if there is significant correlation between
biomarkers, the Spearman's rank correlation coefficients were computed.

101
4.3 Results
The distribution of markers across the three serum sets is demonstrated below.
Figure 4.1 Distribution of markers across control (n=100), PsA (n=100), and PsC (n=100)
serum sets
Dots represent serum samples from individual subjects; thin horizontal lines depict the mean,
and vertical lines the standard deviation; PsA, Psoriatic Arthritis; PsC, Cutaneous Psoriasis
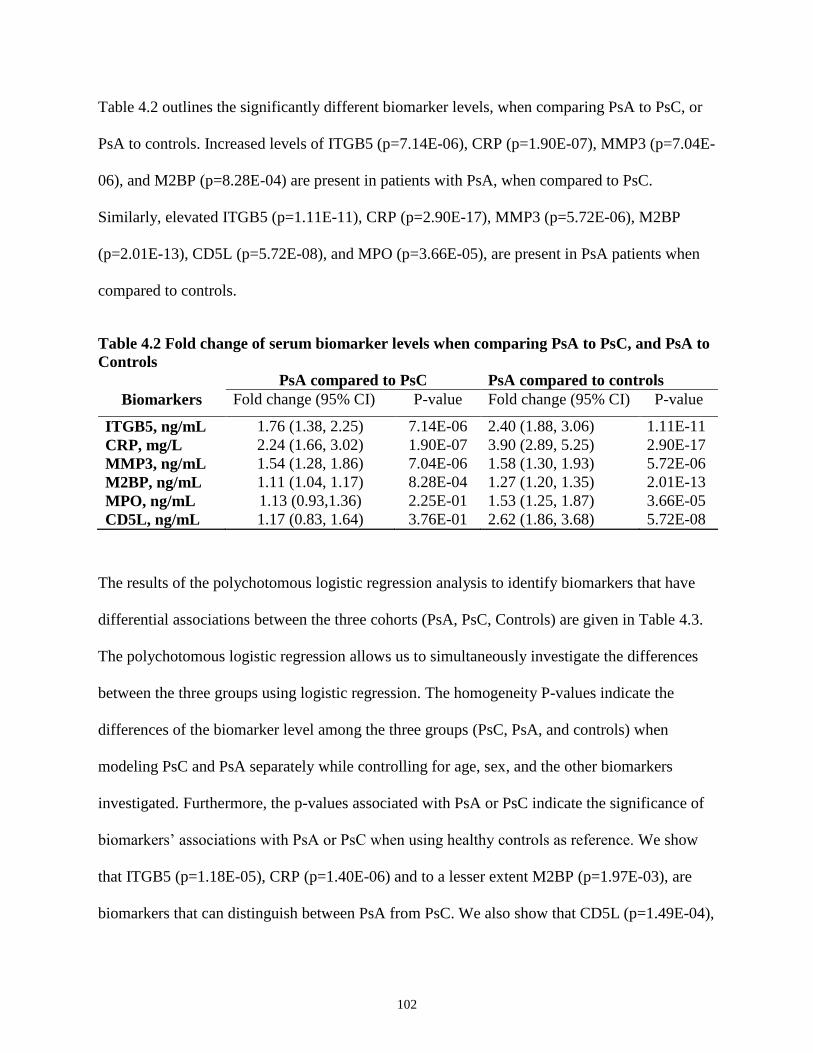
102
Table 4.2 outlines the significantly different biomarker levels, when comparing PsA to PsC, or
PsA to controls. Increased levels of ITGB5 (p=7.14E-06), CRP (p=1.90E-07), MMP3 (p=7.04E-
06), and M2BP (p=8.28E-04) are present in patients with PsA, when compared to PsC.
Similarly, elevated ITGB5 (p=1.11E-11), CRP (p=2.90E-17), MMP3 (p=5.72E-06), M2BP
(p=2.01E-13), CD5L (p=5.72E-08), and MPO (p=3.66E-05), are present in PsA patients when
compared to controls.
Table 4.2 Fold change of serum biomarker levels when comparing PsA to PsC, and PsA to
Controls
PsA compared to PsC PsA compared to controls
Biomarkers Fold change (95% CI) P-value Fold change (95% CI) P-value
ITGB5, ng/mL 1.76 (1.38, 2.25) 7.14E-06 2.40 (1.88, 3.06) 1.11E-11
CRP, mg/L 2.24 (1.66, 3.02) 1.90E-07 3.90 (2.89, 5.25) 2.90E-17
MMP3, ng/mL 1.54 (1.28, 1.86) 7.04E-06 1.58 (1.30, 1.93) 5.72E-06
M2BP, ng/mL 1.11 (1.04, 1.17) 8.28E-04 1.27 (1.20, 1.35) 2.01E-13
MPO, ng/mL 1.13 (0.93,1.36) 2.25E-01 1.53 (1.25, 1.87) 3.66E-05
CD5L, ng/mL 1.17 (0.83, 1.64) 3.76E-01 2.62 (1.86, 3.68) 5.72E-08
The results of the polychotomous logistic regression analysis to identify biomarkers that have
differential associations between the three cohorts (PsA, PsC, Controls) are given in Table 4.3.
The polychotomous logistic regression allows us to simultaneously investigate the differences
between the three groups using logistic regression. The homogeneity P-values indicate the
differences of the biomarker level among the three groups (PsC, PsA, and controls) when
modeling PsC and PsA separately while controlling for age, sex, and the other biomarkers
investigated. Furthermore, the p-values associated with PsA or PsC indicate the significance of
biomarkers’ associations with PsA or PsC when using healthy controls as reference. We show
that ITGB5 (p=1.18E-05), CRP (p=1.40E-06) and to a lesser extent M2BP (p=1.97E-03), are
biomarkers that can distinguish between PsA from PsC. We also show that CD5L (p=1.49E-04),

103
ITGB5 (p=2.88E-06), M2BP (p=1.48E-06), MPO (p=1.97E-04), MMP3 (p=3.18E-02) and CRP
(p=9.93E-07) are independently associated with PsA, while CD5L (p=8.71E-05), M2BP
(p=9.38E-04) and MPO (p=3.27E-06) are independently associated with PsC.
Table 4.3 Polychotomous logistic regression analysis to identify biomarkers associated
with PsA and PsC
aIndicates whether the markers have significantly different effects when modeling PsA and PsC
separately, and controlling for age, sex, and the other biomarkers listed.
bIndicates the significance of difference between PsA or PsC, and controls.
To further determine the significance of our putative PsA biomarkers, we compared the
biomarker levels in patients with PsA, to those in patients with PsC, the results of which are
demonstrated in Table 4.4. Consistent with the results previously described, ITGB5, M2BP, and
CRP are independently associated with the presence of PsA when compared to PsC. ROC
analysis of this combined model showed an AUC of 0.851 with a 95% CI of (0.799,0.904)
(Figure 4.2).
PsA PsC
Biomarkers
Homogeneity
P-valuea OR (95% CI) P-valueb OR (95% CI) P-valueb
CD5L, ng/mL 5.48E-01 1.67 (1.28, 2.17) 1.49E-04 1.57 (1.25, 1.97) 8.71E-05
ITGB5, ng/mL 1.18E-05 3.23 (1.98, 5.27) 2.88E-06 1.21 (0.89, 1.64) 2.14E-01
M2BP, ng/mL 1.97E-03 151.73 (19.64, 1172.19) 1.48E-06 9.19(2.47, 34.25) 9.38E-04
MMP3, ng/mL 1.72E-01 1.79 (1.05, 3.06) 3.18E-02 1.39 (0.86, 2.26) 1.81E-01
MPO, ng/mL 5.33E-01 2.36 (1.50, 3.72) 1.97E-04 2.64 (1.75, 3.98) 3.27E-06
CRP, mg/L 1.40E-06 2.36 (1.67, 3.33) 9.93E-07 1.16 (0.91, 1.47) 2.28E-01

104
Table 4.4 Logistic regression analysis comparing patients with PsA to PsC to identify
biomarkers associated with PsA in patients with PsC
Univariate Multivariate
Biomarkers OR (95% CI) P-value OR(95% CI) P-value
CD5L, ng/mL 1.08 (0.92, 1.26) 3.63E-01 - -
ITGB5, ng/mL 4.07 (2.44, 6.81) 8.36E-08 3.82 (2.18, 6.70) 3.05E-06
M2BP, ng/mL 29.72 (5.88, 150.09) 4.05E-05 32.32 (4.90, 213.32) 3.07E-04
MMP3, ng/mL 1.59 (1.21, 2.11) 1.00E-03 - -
MPO, ng/mL 1.09 (0.83, 1.43) 5.40E-01 - -
CRP, mg/mL 1.93 (1.50, 2.48) 2.55E-07 1.96 (1.46, 2.62) 5.84E-06
Figure 4.2 ROC curve showing the AUC for the logistic regression model comparing PsA,
to PsC patients
AUC=0.851

105
Additionally, after calculating Spearman’s rank correlation coefficients between the markers, we
noted that although there are significant correlations between markers, their magnitudes are not
large (Table 4.5). The largest correlation is between ITGB5 and M2BP (r= 0.24; p=3.51E-05).
Table 4.5 Correlation between markers
CD5L ITGB5 M2BP MMP3 MPO CRP
rsa Pb rs P rs P rs P rs P rs P
CD5L 1 - 0.15 - 0.04 4.79E-01 0.08 1.72E-01 0.06 3.19E-01 0.19 7.38E-04
ITGB5 0.15 1.00E-02 1 1.00E-02 0.24 3.51E-05 0.17 3.40E-03 0.14 1.34E-02 0.19 9.20E-04
M2BP 0.04 4.79E-01 0.24 4.79E-01 1 - 0.19 7.00E-04 0.23 7.43E-05 0.18 1.30E-03
MMP3 0.08 1.72E-01 0.17 1.72E-01 0.19 7.00E-04 1 - 0.19 1.20E-03 0.18 1.50E-02
MPO 0.06 3.19E-01 0.14 3.19E-01 0.23 7.43E-05 0.19 1.20E-03 1 - 0.13 2.96E-02
CRP 0.19 7.38E-04 0.19 7.38E-04 0.18 1.30E-03 0.18 1.57E-32 0.13 2.96E-02 1 -
a Indicates the Spearman’s rank correlation coefficient between markers b Indicates the significance of correlation between markers; P<0.05 is considered significant

106
4.4 Discussion
Psoriatic arthritis is an inflammatory arthritis that is associated with psoriasis, as it develops
primarily in patients already diagnosed with chronic plaque psoriasis. PsA often leads to
progressive joint damage and disability, poor quality of life, and increased mortality risk (32,
200), and early diagnosis and treatment may lead to better long term outcomes (79, 87-89). In
the past, candidate biomarkers have been selected for validation based on their assumed
importance in disease pathogenesis and the availability of assays (115), but to date, the need for
discovery of PsA biomarkers in psoriasis patients, has remained unmet. To discover novel PsA
biomarkers, we previously hypothesized that candidate markers of PsA are differentially
expressed in inflamed skin and SF, and are detectable in serum. With this in mind, we
performed high-throughput and targeted quantitative proteomics, as demonstrated in Chapters 2
and 3, to identify putative PsA biomarkers, and have verified a subset of those, in the current
study. Our results indicate that ITGB5, M2BP, and CRP are associated with PsA and may serve
as biomarkers for this disease.
Through our previously reported proteomic work, we identified increased ITGB5 levels in the
inflamed skin of PsA patients, when compared to PsC. We now show that ITGB5 levels are
elevated in PsA serum. ITGB5 has been described and investigated more extensively in synovial
fibroblasts of patients with rheumatoid arthritis, where it is believed to serve as a ligand for
Cyr61 (196). Cyr61 is a molecule secreted by fibroblast-like synoviocytes in the joint, and
stimulates Interleukin-6 (IL-6) production via ITGA5-ITGB5/Akt/NF-κB signaling pathway
(196). IL-6 production acts with IL-23 and TGB-β to trigger Th17 differentiation and IL-17
production (121, 122) in inflammatory processes, as they also occur in PsA. Here we show that

107
ITGB5 is a marker of PsA in PsC patients, where it may also play a role in the inflammatory
nature of the disease.
M2BP (also known as galectin 3 binding protein) belongs to the family of scavenger receptor
cysteine-rich domain proteins, and is a secreted glycoprotein suggested to have a role in host
defense and tumour invasion (203-205). In addition to galectins, G3BP binds strongly with
extracellular matrix components type IV–VI collagens, fibronectin, and nidogen, as well as with
cell surface β1 integrins (206). M2BP has been investigated in the context of rheumatoid
arthritis. Increased levels of M2BP were found in both synovial fluid and synovial tissue at sites
of joint destruction, and M2BP levels correlated with the number of involved joints (207). It is
believed that M2BP is a marker of synovial cell activation and joint destruction (207). However,
M2BP was not elevated in the serum of patients with RA. We show that M2BP may also be
involved in the pathogenesis of PsA, as it was elevated in both the synovial fluid (208), and
serum of PsA patients, and serves as a specific marker of PsA in PsC patients.
While ITGB5 and M2BP are novel markers, CRP and MMP3 have previously been identified as
markers of PsA in several pilot studies (11, 93, 115, 116). Here, we show that both CRP and
MMP3 are increased in PsA patients, when compared to psoriasis, therefore supporting the
previous data, that MMP3 and CRP are markers of PsA in patients with PsC.
Contrary to our previous findings outlined in Chapter 2, MPO and CD5L were not found to be
elevated in patients with PsA, when compared to PsC. Similar results were obtained in a study
by Ademowo et al. (209), whereby a panel of markers were identified and validated in synovial
tissue biopsies, but when tested in serum, their findings could not be translated. The discrepancy
in protein levels between tissues and serum could largely be due to the different analytical

108
techniques utilized to measure the markers. In targeted mass spectrometry, as discussed in
Chapter 1, proteins are denatured, reduced, alkylated, and digested into peptides, some of which
are then monitored. Unless specified, post translational modifications are not taken into account
during multiple reaction monitoring assays. ELISAs are more sensitive in that respect. Due to
the dependence on antibody-antigen interaction, a post translational modification of a protein
may mask the epitope, thus limiting antigen-antibody binding, and lowering the signal.
Alternatively, since CD5L and MPO were both derived from the comparison of SF from PsA
and early OA, our results may in fact reflect that, and could indicate that these markers may
perform better in differentiating PsA from OA, and not PsA from PsC.
Thus, our results demonstrate that soluble biomarkers, previously identified through our
proteomic studies, have the ability to distinguish PsA from PsC. Additionally, after examining
the correlation between markers, we noted a significant, but low magnitude correlation between
markers, which indicates that these biomarkers are independently associated with PsA.
Moreover, logistic regression analyses provided evidence that these markers are independently
associated with PsA. The diagnostic and prognostic roles of these biomarkers remain to be
investigated in future longitudinal studies in patients with early PsA, and PsC alone.

109
Chapter 5

110
Summary and future directions
5.1 Summary of findings and implications
The preceding chapters of this thesis have described the necessity for identifying and developing
biomarkers for psoriatic arthritis, in psoriasis patients. Prior to the work presented herein,
candidate biomarkers have been selected for validation based on their assumed importance in
PsA pathogenesis and the availability of assays, but to date, the discovery of clinically useful
PsA biomarkers in psoriasis patients, has remained unmet. As such, in chapters two and three of
this thesis we aimed to identify novel PsA candidate biomarkers, using quantitative mass-
spectrometry-based proteomics. These represent the first studies that delineate the proteomes of
synovial fluid and skin from patients with PsA, and led to the identification of 20 candidate PsA
biomarkers. Seventeen of these markers were novel.
Following the discovery and verification of biomarkers, the candidate markers must undergo
validation in serum samples. In chapter 4, I utilized enzyme-linked immunosorbent assays to
measure the concentration of six of the proposed markers in a well-defined cohort of 300
individuals. I demonstrated that two novel markers, M2BP, ITGB5, and the well-known CRP
are associated with PsA and may serve as biomarkers for this disease.
Therefore, through this work I was able to develop and utilize a standard biomarker discovery
pipeline to identify novel biomarkers of psoriatic arthritis, in psoriasis patients. Additionally,
and as important, these biomarkers may serve as interesting factors that could play important
roles in the pathogenesis of PsA

111
5.2 Limitations and considerations
Despite the interesting findings described, the project has several limitations. First, I utilized a
label-free approach in order to quantify, and identify upregulated proteins in PsA target tissues.
Potential disadvantages are lower reproducibility, which may compromise detection of smaller
quantitative changes between samples. The lower reproducibility mostly results from the
fractionation of peptides prior to LC-MS/MS analysis, and the subsequent pooling of eluted
fractions, which can result in unequal/uncontrolled pooling. The reproducibility of LFQ
experiments can be maximized by standardizing the entire pipeline, from sample collection and
processing, to instrument setup and calibration, as I have done in the present study.
Second, pooling of samples in the discovery phase of this study could have potentially masked
meaningful discrepancies among the compared proteomes. To minimize this, I confirmed all
pool-derived using SRM in individual samples. By pooling biological samples as I have done, I
obtained sufficient sample and increased the likelihood of identifying proteins that would
otherwise be undetectable in individual samples, therefore allowing a more extensive proteomic
coverage of the disease’s heterogeneity. Despite the shortcomings of the fractionation and
pooling strategies, I do confirm the elevation of several markers using SRM assays, which
provides validity to my entire strategy.
Third, the “control” synovial fluid described in Chapter 2, originated from joints of patients with
early OA. Early OA synovial tissue has been shown to be inflammatory in nature, with
increased mononuclear infiltration and overexpression of mediators of inflammation (210), so it
does not represent the ideal comparison, as SF from PsC patients would. My use of early OA SF
could have masked important inflammatory mediators otherwise not present in PsC SF, thus

112
interfering with the identifications of PsA markers in PsC patients. Additionally, as described,
PsA is a heterogeneous disease with many clinical phenotypes, and by obtaining SF only from
large joints, I narrowed my analysis to only one clinical phenotype, and excluded the distal
interphalangeal predominant and spondylitis forms of PsA. Therefore, my findings may only be
applicable to the asymmetric or symmetric forms of PsA.
Fourth, to ensure I chose protein markers that were specific to the pathogenesis of PsA, I filtered
my proteins, as described in Chapter 2 and 3. I narrowed my results to include only upregulated
proteins, proteins that are not present in high abundance in the serum, and proteins expressed or
present in cells/tissues associated with PsA. This represents another limitation, since by doing
so, I may have disregarded potentially important proteins of interest. For example, SAA (which
was excluded due to its high abundance in serum in Chapter 2), has been shown to have
important biological effects in driving inflammation in rheumatoid arthritis (211, 212).
Finally, the three biomarkers that were validated only included one of the previously identified
PsA biomarkers by Chandran et al. (115), which may be due to the different and much larger
validation cohort that was utilized in the current study. This fact highlights the importance of
multiple and multi-site validation cohorts, in determining the clinical utility of the possible PsA
biomarkers that have been named in this study and others.
Despite the limitations, the project carries several strengths. The first lies in the quality and
source of the samples analyzed. Any biomarker discovery pipeline relies on the use of well-
characterized, high-quality samples. It is ideal to collect and store samples following a
standardized protocol, which is extremely important during the biomarker development process
considering that a candidate biomarker needs to be repeatedly verified /validated with large and

113
independent sample sets. The synovial fluid, skin, and serum samples used in the current studies
were obtained from one institution and underwent strict sample handling procedures.
Second, the discovery phase of our biomarker development pipeline, was followed by SRM-
based verification of a large number of candidates, which was followed by ELISA-based
validation of three markers in serum samples from a well-defined cohort of 300 patients. The
work presented in this thesis represents the most comprehensive biomarker development project
conducted to date for PsA.

114
5.3 Future directions
In this thesis, 20 proteins were presented that may represent PsA biomarkers, and only 7 of
those were tested in serum, largely due to the lack of commercially available antibodies or
immunoassay kits. Apart from CRP, S100A9, and MMP3, none of the markers proposed have
been previously measured in serum from PsA patients. Therefore, an important next step would
be to develop monoclonal and polyclonal antibodies to allow the measurement of the remaining
candidates in PsA, PsC, and healthy serum.
Protein verification/validation was only performed on upregulated proteins, proteins specific to
PsA cells/tissues, and proteins not present in high abundance in the serum. The proteins I
excluded are also of importance, as they may represent mediators/biomarkers of PsA, and in
future studies, these should be further investigated to delineate their involvement (or lack of
involvement) in PsA.
As described, the validation cohort consisted of patients with PsA, PsC, as well as healthy
controls. Since the ultimate scope is to identify markers of early PsA in psoriasis patients, future
longitudinal studies consisting of patients with early PsA, and psoriasis alone are warranted to
evaluate the diagnostic and prognostic roles of these biomarkers.
Since PsA is a largely heterogeneous disease, it is unlikely that a single biomarker will be
sufficient in predicting PsA in psoriasis patients. There are a number of markers, as exemplified
earlier, that have been tested in pilot studies, and are still awaiting validation in large patient
cohorts. Therefore, another important step would be to evaluate these, alongside those markers
discovered and described in this thesis, in order to compose panels which are likely more

115
informative and reliable. Also, there are some clinical features in psoriasis that indicate higher
risk for developing PsA, such as nail psoriasis, scalp, intergluteal/perianal psoriasis, and severe
psoriasis. Combining these clinical features, with biomarker panels may represent the ideal
predictive model to identify psoriatic arthritis.
Lastly, the work presented in this thesis demonstrated two newly-identified PsA-associated
markers: ITGB5, and M2BP. Studies examining the mechanism resulting in the elevation of
these proteins will be important, as they may provide novel insights into PsA pathogenesis.

116
5.4 Conclusion
Early diagnosis and management of PsA is known to lead to better long-term patient outcomes
(79, 87-89). Unfortunately identifying inflammatory musculoskeletal disease early in patients
with psoriasis is a very difficult task, often due to a lack of validated biomarkers. Therefore,
much of the recent research in PsA, has focused on identifying, serum-based biomarkers, which
could be used to screen psoriasis patients, in order to identify those that may have or will
develop PsA. The work described in this thesis has outlined a mass-spectrometry-based
approach to PsA biomarker discovery, and has resulted in the validation of two novel
biomarkers, adding to the growing list of PsA markers. Large multi-site validation cohorts are
imperative in finally identifying clinically relevant PsA biomarkers.

117
References
1. Nestle FO, Kaplan DH, Barker J. Psoriasis. N Engl J Med 2009;361:496-509.
2. Chandran V, Raychaudhuri SP. Geoepidemiology and environmental factors of psoriasis and
psoriatic arthritis. J Autoimmun 2010;34:J314-21.
3. Parisi R, Symmons DP, Griffiths CE, Ashcroft DM, Identification and Management of
Psoriasis and Associated ComorbidiTy (IMPACT) project team. Global epidemiology of
psoriasis: a systematic review of incidence and prevalence. J Invest Dermatol 2013;133:377-85.
4. Henseler T, Christophers E. Psoriasis of early and late onset: characterization of two types of
psoriasis vulgaris. J Am Acad Dermatol 1985;13:450-6.
5. Langley RGB, Krueger GG, Griffiths CEM. Psoriasis: epidemiology, clinical features, and
quality of life. Ann Rheum Dis 2005;64:ii18-23.
6. Gelfand JM, Gladman DD, Mease PJ, Smith N, Margolis DJ, Nijsten T, et al. Epidemiology
of psoriatic arthritis in the population of the United States. J Am Acad Dermatol 2005;53:573.
7. Gupta MA, Schork NJ, Gupta AK, Kirkby S, Ellis CN. Suicidal ideation in psoriasis. Int J
Dermatol 1993;32:188-90.
8. Kurd SK, Troxel AB, Crits-Christoph P, Gelfand JM. The risk of depression, anxiety, and
suicidality in patients with psoriasis: a population-based cohort study. Arch Dermatol
2010;146:891-5.
9. Bowcock AM, Cookson WO. The genetics of psoriasis, psoriatic arthritis and atopic
dermatitis. Hum Mol Genet 2004;13 Spec No 1:R43-55.
10. Villanova F, Di Meglio P, Nestle FO. Biomarkers in psoriasis and psoriatic arthritis. Ann
Rheum Dis 2013;72:ii104-10.
11. Chandran V, Gladman DD. Update on biomarkers in psoriatic arthritis. Curr Rheumatol Rep
2010;12:288-94.

118
12. Telfer NR, Chalmers RJ, Whale K, Colman G. The role of streptococcal infection in the
initiation of guttate psoriasis. Arch Dermatol 1992;128:39-42.
13. Thappa DM. The isomorphic phenomenon of Koebner. Indian J Dermatol Venereol Leprol
2004;70:187.
14. Basavaraj KH, Ashok NM, Rashmi R, Praveen TK. The role of drugs in the induction and/or
exacerbation of psoriasis. Int J Dermatol 2010;49:1351-61.
15. Armstrong AW, Harskamp CT, Dhillon JS, Armstrong EJ. Psoriasis and smoking: a
systematic review and meta-analysis. Br J Dermatol 2014;170:304-14.
16. Adamzik K, McAleer MA, Kirby B. Alcohol and psoriasis: sobering thoughts. Clin Exp
Dermatol 2013;38:819-22.
17. Krueger JG, Bowcock A. Psoriasis pathophysiology: current concepts of pathogenesis. Ann
Rheum Dis 2005;64 Suppl 2:ii30-6.
18. Bowcock AM, Krueger JG. Getting under the skin: the immunogenetics of psoriasis. Nat
Rev Immunol 2005;5:699-711.
19. Griffiths CE, Barker JN. Pathogenesis and clinical features of psoriasis. Lancet
2007;370:263-71.
20. Langenbruch A, Radtke MA, Krensel M, Jacobi A, Reich K, Augustin M. Nail involvement
as a predictor of concomitant psoriatic arthritis in patients with psoriasis. Br J Dermatol 2014.
21. Kupetsky EA, Keller M. Psoriasis vulgaris: an evidence-based guide for primary care. J Am
Board Fam Med 2013;26:787-801.
22. Mease PJ, Antoni CE. Psoriatic arthritis treatment: biological response modifiers. Ann
Rheum Dis 2005;64:ii78-82.
23. Feldman SR, Krueger GG. Psoriasis assessment tools in clinical trials. Ann Rheum Dis
2005;64:ii65-8.

119
24. Mease PJ. Inhibition of interleukin-17, interleukin-23 and the TH17 cell pathway in the
treatment of psoriatic arthritis and psoriasis. Curr Opin Rheumatol 2015.
25. Villaseñor-Park J, Wheeler D, Grandinetti L. Psoriasis: evolving treatment for a complex
disease. Cleve Clin J Med 2012;79:413-23.
26. Wittmann M, Helliwell PS. Phosphodiesterase 4 inhibition in the treatment of psoriasis,
psoriatic arthritis and other chronic inflammatory diseases. Dermatol Ther (Heidelb) 2013;3:1-
15.
27. Taylor W, Gladman D, Helliwell P, Marchesoni A, Mease P, Mielants H. Classification
criteria for psoriatic arthritis: development of new criteria from a large international study.
Arthritis Rheum 2006;54:2665-73.
28. Chandran V, Schentag CT, Brockbank JE, Pellett FJ, Shanmugarajah S, Toloza SM, et al.
Familial aggregation of psoriatic arthritis. Ann Rheum Dis 2009;68:664-7.
29. Moll JM, Wright V. Familial occurrence of psoriatic arthritis. Ann Rheum Dis 1973;32:181-
201.
30. Alamanos Y, Voulgari PV, Drosos AA. Incidence and prevalence of psoriatic arthritis: a
systematic review. J Rheumatol 2008;35:1354-8.
31. Zachariae H. Prevalence of joint disease in patients with psoriasis: implications for therapy.
Am J Clin Dermatol 2003;4:441-7.
32. Gladman DD, Antoni C, Mease P, Clegg DO, Nash P. Psoriatic arthritis: epidemiology,
clinical features, course, and outcome. Ann Rheum Dis 2005;64:ii14-7.
33. Mease PJ, Gladman DD, Papp KA, Khraishi MM, Thaçi D, Behrens F, et al. Prevalence of
rheumatologist-diagnosed psoriatic arthritis in patients with psoriasis in European/North
American dermatology clinics. J Am Acad Dermatol 2013;69:729-35.

120
34. Eder L, Chandran V, Shen H, Cook RJ, Shanmugarajah S, Rosen CF, Gladman DD.
Incidence of arthritis in a prospective cohort of psoriasis patients. Arthritis Care Res (Hoboken)
2011;63:619-22.
35. Alenius G-M. A Clinical and Genetic Study of Psoriatic Arthritis (Doctoral Dissertation).
2003; Retrieved from DiVA:diva2:144500.
36. Alenius G-M, Friberg C, Nilsson S, Wahlström J, Dahlqvist SR, Samuelsson L. Analysis of
6 genetic loci for disease susceptibility in psoriatic arthritis. J Rheumatol 2004;31:2230-5.
37. Tiilikainen A, Lassus A, Karvonen J, Vartiainen P, Julin M. Psoriasis and HLA-Cw6. Br J
Dermatol 1980;102:179-84.
38. Chiu HY, Wang TS, Chan CC, Cheng YP, Lin SJ, Tsai TF. Human leucocyte antigen-Cw6
as a predictor for clinical response to ustekinumab, an interleukin-12/23 blocker, in Chinese
patients with psoriasis: a retrospective analysis. Br J Dermatol 2014.
39. Enerbäck C, Martinsson T, Inerot A, Wahlström J, Enlund F, Yhr M, Swanbeck G. Evidence
that HLA-Cw6 determines early onset of psoriasis, obtained using sequence-specific primers
(PCR-SSP). Acta Derm Venereol 1997;77:273-6.
40. Winchester R, Minevich G, Steshenko V, Kirby B, Kane D, Greenberg DA, FitzGerald O.
HLA associations reveal genetic heterogeneity in psoriatic arthritis and in the psoriasis
phenotype. Arthritis Rheum 2012;64:1134-44.
41. Eder L, Chandran V, Pellett F, Shanmugarajah S, Rosen CF, Bull SB, Gladman DD.
Differential human leucocyte allele association between psoriasis and psoriatic arthritis: a
family-based association study. Ann Rheum Dis 2012;71:1361-5.
42. Eder L, Chandran V, Pellet F, Shanmugarajah S, Rosen CF, Bull SB, Gladman DD. Human
leucocyte antigen risk alleles for psoriatic arthritis among patients with psoriasis. Ann Rheum
Dis 2011.
43. Gladman DD, Farewell VT. The role of HLA antigens as indicators of disease progression in
psoriatic arthritis. Multivariate relative risk model. Arthritis Rheum 1995;38:845-50.

121
44. Gladman DD, Anhorn KA, Schachter RK, Mervart H. HLA antigens in psoriatic arthritis. J
Rheumatol 1986;13:586-92.
45. Armstrong RD, Panayi GS, Welsh KI. Histocompatibility antigens in psoriasis, psoriatic
arthropathy, and ankylosing spondylitis. Ann Rheum Dis 1983;42:142-6.
46. Gerber LH, Murray CL, Perlman SG, Barth WF, Decker JL, Nigra TA, Mann DL. Human
lymphocyte antigens characterizing psoriatic arthritis and its subtypes. J Rheumatol 1982;9:703-
7.
47. McHugh NJ, Laurent MR, Treadwell BL, Tweed JM, Dagger J. Psoriatic arthritis: clinical
subgroups and histocompatibility antigens. Ann Rheum Dis 1987;46:184-8.
48. González S, Brautbar C, Mart\inez-Borra J, Lopez-Vazquez A, Segal R, Blanco-Gelaz MA,
et al. Polymorphism in MICA rather than HLA-B/C genes is associated with psoriatic arthritis in
the Jewish population. Hum Immunol 2001;62:632-8.
49. Gonzalez S, Martinez-Borra J, Torre-Alonso JC, Gonzalez-Roces S, Sanchez del Rio J,
Rodriguez Perez A, et al. The MICA-A9 triplet repeat polymorphism in the transmembrane
region confers additional susceptibility to the development of psoriatic arthritis and is
independent of the association of Cw* 0602 in psoriasis. Arthritis Rheum 1999;42:1010-6.
50. Trembath RC, Clough RL, Rosbotham JL, Jones AB, Camp RD, Frodsham A, et al.
Identification of a major susceptibility locus on chromosome 6p and evidence for further disease
loci revealed by a two stage genome-wide search in psoriasis. Hum Mol Genet 1997;6:813-20.
51. Allen MH, Veal C, Faassen A, Powis SH, Vaughan RW, Trembath RC, Barker JN. A non-
HLA gene within the MHC in psoriasis. Lancet 1999;353:1589-90.
52. Jadon D, Tillett W, Wallis D, Cavill C, Bowes J, Waldron N, et al. Exploring ankylosing
spondylitis-associated ERAP1, IL23R and IL12B gene polymorphisms in subphenotypes of
psoriatic arthritis. Rheumatology (Oxford) 2013;52:261-6.
53. Valdimarsson H, Baker BS, Jónsdóttir I, Powles A, Fry L. Psoriasis: a T-cell-mediated
autoimmune disease induced by streptococcal superantigens? Immunol Today 1995;16:145-9.

122
54. Espinoza LR, Vasey FB, Espinoza CG, Bocanegra TS, Germain BF. Vascular changes in
psoriatic synovium. A light and electron microscopic study. Arthritis Rheum 1982;25:677-84.
55. Costello P, Bresnihan B, O'Farrelly C, FitzGerald O. Predominance of CD8+ T lymphocytes
in psoriatic arthritis. J Rheumatol 1999;26:1117-24.
56. Ritchlin C, Haas-Smith SA, Hicks D, Cappuccio J, Osterland CK, Looney RJ. Patterns of
cytokine production in psoriatic synovium. J Rheumatol 1998;25:1544-52.
57. Benham H, Norris P, Goodall J, Wechalekar MD, FitzGerald O, Szentpetery A, et al. Th17
and Th22 cells in psoriatic arthritis and psoriasis. Arthritis Res Ther 2013;15:R136.
58. Cauli A, Mathieu A. Th17 and interleukin 23 in the pathogenesis of psoriatic arthritis and
spondyloarthritis. J Rheumatol Suppl 2012;89:15-8.
59. Lowes MA, Russell CB, Martin DA, Towne JE, Krueger JG. The IL-23/T17 pathogenic axis
in psoriasis is amplified by keratinocyte responses. Trends Immunol 2013;34:174-81.
60. Quatresooz P, Hermanns-Lê T, Piérard GE, Humbert P, Delvenne P, Piérard-Franchimont C.
Ustekinumab in psoriasis immunopathology with emphasis on the Th17-IL23 axis: a primer. J
Biomed Biotechnol 2012;2012:147413.
61. Hitchon CA, Danning CL, Illei GG, El-Gabalawy HS, Boumpas DT. Gelatinase expression
and activity in the synovium and skin of patients with erosive psoriatic arthritis. J Rheumatol
2002;29:107-17.
62. Giannelli G, Erriquez R, Iannone F, Marinosci F, Lapadula G, Antonaci S. MMP-2, MMP-9,
TIMP-1 and TIMP-2 levels in patients with rheumatoid arthritis and psoriatic arthritis. Clin Exp
Rheumatol 2004;22:335-8.
63. Sieper J, Braun J. Pathogenesis of spondylarthropathies. Arthritis Rheum 1995;38:1547-54.
64. Rahman MU, Ahmed S, Schumacher HR, Zeiger AR. High levels of antipeptidoglycan
antibodies in psoriatic and other seronegative arthritides. J Rheumatol 1990;17:621-5.

123
65. Eder L, Law T, Chandran V, Shanmugarajah S, Shen H, Rosen CF, et al. Association
between environmental factors and onset of psoriatic arthritis in patients with psoriasis. Arthritis
Care Res (Hoboken) 2011;63:1091-7.
66. Punzi L, Pianon M, Bertazzolo N, Fagiolo U, Rizzi E, Rossini P, Todesco S. Clinical,
laboratory and immunogenetic aspects of post-traumatic psoriatic arthritis: a study of 25
patients. Clin Exp Rheumatol 1997;16:277-81.
67. Pattison E, Harrison BJ, Griffiths CE, Silman AJ, Bruce IN. Environmental risk factors for
the development of psoriatic arthritis: results from a case-control study. Ann Rheum Dis
2008;67:672-6.
68. Ritchlin CT. Pathogenesis of psoriatic arthritis. Curr Opin Rheumatol 2005;17:406-12.
69. Moll JM, Wright V. Psoriatic arthritis. Semin Arthritis Rheum 1973;3:55-78.
70. Braun J, Khan M, Sieper J. Enthesitis and ankylosis in spondyloarthropathy: what is the
target of the immune response? Ann Rheum Dis 2000;59:985-94.
71. McGonagle D, Gibbon W, Emery P. Classification of inflammatory arthritis by enthesitis.
Lancet 1998;352:1137-40.
72. Radtke MA, Reich K, Blome C, Rustenbach S, Augustin M. Prevalence and clinical features
of psoriatic arthritis and joint complaints in 2009 patients with psoriasis: results of a German
national survey. J Eur Acad Dermatol Venereol 2009;23:683-91.
73. Reich K, Krüger K, Mössner R, Augustin M. Epidemiology and clinical pattern of psoriatic
arthritis in Germany: a prospective interdisciplinary epidemiological study of 1511 patients with
plaque-type psoriasis. Br J Dermatol 2009;160:1040-7.
74. Brockbank JE, Stein M, Schentag CT, Gladman DD. Dactylitis in psoriatic arthritis: a
marker for disease severity? Ann Rheum Dis 2005;64:188-90.
75. Gladman DD, Shuckett R, Russell ML, Thorne JC, Schachter RK. Psoriatic arthritis (PSA)--
an analysis of 220 patients. Q J Med 1987;62:127-41.

124
76. Queiro R, Torre JC, Belzunegui J, González C, De Dios JR, Unanue F, Figueroa M. Clinical
features and predictive factors in psoriatic arthritis-related uveitis. Semin Arthritis Rheum
2002;31:264-70.
77. Cantini F, Salvarani C, Olivieri I, Macchioni L, Niccoli L, Padula A, et al. Distal extremity
swelling with pitting edema in psoriatic arthritis: a case-control study. Clin Exp Rheumatol
2001;19:291-6.
78. Jajic J. Blue-coloured skin over involved joints in psoriatic arthritis. Clin Rheumatol
2001;20:304-5.
79. Armstrong AW, Gelfand JM, Garg A. Outcomes research in psoriasis and psoriatic arthritis
using large databases and research networks: a report from the GRAPPA 2013 Annual Meeting.
J Rheumatol 2014;41:1233-6.
80. Chandran V, Toloza S, Shanmugarajah S, Pellet FJ, Schentag CT, Rosen C, Gladman DD.
Clinical predictors for psoriatic arthritis in patients with psoriasis. Arthritis Rheum
2008;58:S364.
81. D’Angelo S, Mennillo GA, Cutro MS, Leccese P, Nigro A, Padula A, Olivieri I. Sensitivity
of the classification of psoriatic arthritis criteria in early psoriatic arthritis. J Rheumatol
2009;36:368-70.
82. Huynh D, Kavanaugh A. Psoriatic arthritis: current therapy and future approaches.
Rheumatology (Oxford) 2014.
83. Nash P, Clegg DO. Psoriatic arthritis therapy: NSAIDs and traditional DMARDs. Ann
Rheum Dis 2005;64:ii74-7.
84. Ritchlin CT, Kavanaugh A, Gladman DD, Mease PJ, Helliwell P, Boehncke W-H, et al.
Treatment recommendations for psoriatic arthritis. Ann Rheum Dis 2000;68:1387-94.
85. Biggioggero M, Favalli EG. Ten-Year Drug Survival of Anti-TNF Agents in the Treatment
of Inflammatory Arthritides. Drug Dev Res 2014;75 Suppl 1:S38-41.

125
86. Piaserico S, Sandini E, Saldan A, Abate D. Effects of TNF-Alpha Inhibitors on Circulating
Th17 Cells in Patients Affected by Severe Psoriasis. Drug Dev Res 2014;75 Suppl 1:S73-6.
87. Haroon M, Gallagher P, Fitzgerald O. Diagnostic delay of more than 6 months contributes to
poor radiographic and functional outcome in psoriatic arthritis. Ann Rheum Dis 2014; Epub 13
Feb 2014.
88. Gladman DD, Thavaneswaran A, Chandran V, Cook RJ. Do patients with psoriatic arthritis
who present early fare better than those presenting later in the disease? Ann Rheum Dis
2011;70:2152-4.
89. Theander E, Husmark T, Alenius GM, Larsson PT, Teleman A, Geijer M, Lindqvist UR.
Early psoriatic arthritis: short symptom duration, male gender and preserved physical
functioning at presentation predict favourable outcome at 5-year follow-up. Results from the
Swedish Early Psoriatic Arthritis Register (SwePsA). Ann Rheum Dis 2014;73:407-13.
90. Lynde CW, Poulin Y, Guenther L, Jackson C. The burden of psoriasis in Canada: insights
from the pSoriasis Knowledge IN Canada (SKIN) survey. J Cutan Med Surg 2009;13:235-52.
91. Taylor SL, Petrie M, O'Rourke KS, Feldman SR. Rheumatologists' recommendations on
what to do in the dermatology office to evaluate and manage psoriasis patients' joint symptoms.
J Dermatolog Treat 2009;20:350-3.
92. Wilson FC, Icen M, Crowson CS, McEvoy MT, Gabriel SE, Kremers HM. Incidence and
clinical predictors of psoriatic arthritis in patients with psoriasis: A population-based study.
Arthritis Care Res (Hoboken) 2009;61:233-9.
93. Chandran V, Scher JU. Biomarkers in psoriatic arthritis: recent progress. Curr Rheumatol
Rep 2014;16:453.
94. Biomarkers Definitions Working Group.. Biomarkers and surrogate endpoints: preferred
definitions and conceptual framework. Clin Pharmacol Ther 2001;69:89-95.
95. Gibson DS, Rooney ME, Finnegan S, Qiu J, Thompson DC, Labaer J, et al. Biomarkers in
rheumatology, now and in the future. Rheumatology (Oxford) 2012;51:423-33.

126
96. Gottlieb AB, Fitzgerald O. Biological biomarkers in psoriatic disease. A review. J
Rheumatol 2008;35:1443-8.
97. Cretu D, Diamandis EP, Chandran V. Delineating the synovial fluid proteome: recent
advancements and ongoing challenges in biomarker research. Crit Rev Clin Lab Sci 2013;50:51-
63.
98. Anders HJ, Rihl M, Vielhauer V, Schattenkirchner M. Assessment of renal function in
rheumatoid arthritis: validity of a new prediction method. J Clin Rheumatol 2002;8:130-3.
99. Pepys MB, Hirschfield GM. C-reactive protein: a critical update. J Clin Invest
2003;111:1805-12.
100. Wiik AS. Anti-nuclear autoantibodies: clinical utility for diagnosis, prognosis, monitoring,
and planning of treatment strategy in systemic immunoinflammatory diseases. Scand J
Rheumatol 2005;34:260-8.
101. Nakamura RM. Progress in the use of biochemical and biological markers for evaluation of
rheumatoid arthritis. J Clin Lab Anal 2000;14:305-13.
102. Chen PP, Robbins DL, Jirik FR, Kipps TJ, Carson DA. Isolation and characterization of a
light chain variable region gene for human rheumatoid factors. J Exp Med 1987;166:1900-5.
103. Meyer O, Labarre C, Dougados M, Goupille P, Cantagrel A, Dubois A, et al.
Anticitrullinated protein/peptide antibody assays in early rheumatoid arthritis for predicting five
year radiographic damage. Ann Rheum Dis 2003;62:120-6.
104. Nielen MM, van Schaardenburg D, Reesink HW, van de Stadt RJ, van der Horst-Bruinsma
IE, de Koning MH, et al. Specific autoantibodies precede the symptoms of rheumatoid arthritis:
a study of serial measurements in blood donors. Arthritis Rheum 2004;50:380-6.
105. Kavanaugh AF, Solomon DH, American College of Rheumatology Ad Hoc Committee on
Immunologic Testing Guidelines. Guidelines for immunologic laboratory testing in the
rheumatic diseases: anti-DNA antibody tests. Arthritis Rheum 2002;47:546-55.

127
106. Chandran V. The genetics of psoriasis and psoriatic arthritis. Clin Rev Allergy Immunol
2013;44:149-56.
107. Chiche L, Jourde-Chiche N, Pascual V, Chaussabel D. Disease Mechanisms in
Rheumatology—Tools and Pathways: Current Perspectives on Systems Immunology
Approaches to Rheumatic Diseases. Arthritis Rheum 2013;65:1407-17.
108. Shankavaram UT, Reinhold WC, Nishizuka S, Major S, Morita D, Chary KK, et al.
Transcript and protein expression profiles of the NCI-60 cancer cell panel: an integromic
microarray study. Mol Cancer Ther 2007;6:820-32.
109. Chen Q-R, Song YK, Yu L-R, Wei JS, Chung J-Y, Hewitt SM, et al. Global genomic and
proteomic analysis identifies biological pathways related to high-risk neuroblastoma. J
Proteome Res 2010;9:373-82.
110. Day RS, McDade KK, Chandran UR, Lisovich A, Conrads TP, Hood BL, et al. Identifier
mapping performance for integrating transcriptomics and proteomics experimental results. BMC
Bioinformatics 2011;12:213.
111. Kulasingam V, Pavlou MP, Diamandis EP. Integrating high-throughput technologies in the
quest for effective biomarkers for ovarian cancer. Nat Rev Cancer 2010;10:371-8.
112. Emery P, Dörner T. Optimising treatment in rheumatoid arthritis: a review of potential
biological markers of response. Ann Rheum Dis 2011;70:2063-70.
113. Aebersold R, Anderson L, Caprioli R, Druker B, Hartwell L, Smith R. Perspective: a
program to improve protein biomarker discovery for cancer. J Proteome Res 2005;4:1104-9.
114. Rogakou EP, Pilch DR, Orr AH, Ivanova VS, Bonner WM. DNA double-stranded breaks
induce histone H2AX phosphorylation on serine 139. J Biol Chem 1998;273:5858-68.
115. Chandran V, Cook RJ, Edwin J, Shen H, Pellett FJ, Shanmugarajah S, et al. Soluble
biomarkers differentiate patients with psoriatic arthritis from those with psoriasis without
arthritis. Rheumatology (Oxford) 2010;49:1399-405.
128
116. Chandran V. Soluble biomarkers may differentiate psoriasis from psoriatic arthritis. J
Rheumatol Suppl 2012;89:65-6.
117. Buckwalter JA, Rosenberg LC, Hunziker EB. Articular cartilage: composition, structure,
response to injury, and methods of facilitating repair. Articular Cartilage and Knee Joint
Function: Basic Science and Arthroscopy. Raven Press ltd., New York 1990:19-56.
118. Chandran V, Shen H, Pollock RA, Pellett FJ, Carty A, Cook RJ, Gladman DD. Soluble
biomarkers associated with response to treatment with tumor necrosis factor inhibitors in
psoriatic arthritis. J Rheumatol 2013;40:866-71.
119. Martel-Pelletier J, Boileau C, Pelletier J-P, Roughley PJ. Cartilage in normal and
osteoarthritis conditions. Best Practice Res Clin Rheumatol 2008;22:351-84.
120. Kirkham BW, Kavanaugh A, Reich K. IL-17A: A Unique Pathway in Immune-Mediated
Diseases: Psoriasis, Psoriatic Arthritis, and Rheumatoid Arthritis. Immunology 2013.
121. Weaver CT, Hatton RD, Mangan PR, Harrington LE. IL-17 family cytokines and the
expanding diversity of effector T cell lineages. Annu Rev Immunol 2007;25:821-52.
122. Mangan PR, Harrington LE, O'Quinn DB, Helms WS, Bullard DC, Elson CO, et al.
Transforming growth factor-β induces development of the TH17 lineage. Nature 2006;441:231-
4.
123. Diarra D, Stolina M, Polzer K, Zwerina J, Ominsky MS, Dwyer D, et al. Dickkopf-1 is a
master regulator of joint remodeling. Nat Med 2007;13:156-63.
124. Dalbeth N, Pool B, Smith T, Callon KE, Lobo M, Taylor WJ, et al. Circulating mediators
of bone remodeling in psoriatic arthritis: implications for disordered osteoclastogenesis and
bone erosion. Arthritis Res Ther 2010;12:R164.
125. Yates JR, Ruse CI, Nakorchevsky A. Proteomics by mass spectrometry: approaches,
advances, and applications. Annu Rev Biomed Eng 2009;11:49-79.

129
126. Nanjappa V, Thomas JK, Marimuthu A, Muthusamy B, Radhakrishnan A, Sharma R, et al.
Plasma Proteome Database as a resource for proteomics research: 2014 update. Nucleic Acids
Res 2014;42:D959-65.
127. Rai AJ, Gelfand CA, Haywood BC, Warunek DJ, Yi J, Schuchard MD, et al. HUPO
Plasma Proteome Project specimen collection and handling: towards the standardization of
parameters for plasma proteome samples. Proteomics 2005;5:3262-77.
128. Omenn GS, States DJ, Adamski M, Blackwell TW, Menon R, Hermjakob H, et al.
Overview of the HUPO Plasma Proteome Project: results from the pilot phase with 35
collaborating laboratories and multiple analytical groups, generating a core dataset of 3020
proteins and a publicly-available database. Proteomics 2005;5:3226-45.
129. Hui AY, McCarty WJ, Masuda K, Firestein GS, Sah RL. A systems biology approach to
synovial joint lubrication in health, injury, and disease. Wiley Interdiscip Rev Syst Biol Med
2012;4:15-37.
130. Hu S, Loo JA, Wong DT. Human body fluid proteome analysis. Proteomics 2006;6:6326-
53.
131. Cao Z, Tang H-Y, Wang H, Liu Q, Speicher DW. Systematic Comparison of Fractionation
Methods for In-depth Analysis of Plasma Proteomes. J Proteome Res 2012.
132. Tao F, Smejkal G. Proteome Society meeting. October 19, 2005, MA, USA. Expert Rev
Proteomics 2006;3:7-8.
133. Chen CP, Hsu CC, Yeh WL, Lin HC, Hsieh SY, Lin SC, et al. Optimizing human synovial
fluid preparation for two-dimensional gel electrophoresis. Proteome Sci 2011;9:65.
134. Picotti P, Rinner O, Stallmach R, Dautel F, Farrah T, Domon B, et al. High-throughput
generation of selected reaction-monitoring assays for proteins and proteomes. Nat Methods
2009;7:43-6.
135. Lange V, Picotti P, Domon B, Aebersold R. Selected reaction monitoring for quantitative
proteomics: a tutorial. Mol Syst Biol 2008;4:222.

130
136. Ong SE, Mann M. Mass spectrometry-based proteomics turns quantitative. Nat Chem Biol
2005;1:252-62.
137. Zhu W, Smith JW, Huang C-M. Mass spectrometry-based label-free quantitative
proteomics. J Biomed Biotechnol 2010;2010:840518.
138. Cox J, Neuhauser N, Michalski A, Scheltema RA, Olsen JV, Mann M. Andromeda: a
peptide search engine integrated into the MaxQuant environment. J Proteome Res
2011;10:1794-805.
139. Cox J, Mann M. MaxQuant enables high peptide identification rates, individualized p.p.b.-
range mass accuracies and proteome-wide protein quantification. Nat Biotechnol 2008;26:1367-
72.
140. Thompson A, Schäfer J, Kuhn K, Kienle S, Schwarz J, Schmidt G, et al. Tandem mass
tags: a novel quantification strategy for comparative analysis of complex protein mixtures by
MS/MS. Anal Chem 2003;75:1895-904.
141. Ross PL, Huang YN, Marchese JN, Williamson B, Parker K, Hattan S, et al. Multiplexed
protein quantitation in Saccharomyces cerevisiae using amine-reactive isobaric tagging reagents.
Mol Cell Proteomics 2004;3:1154-69.
142. Shiio Y, Aebersold R. Quantitative proteome analysis using isotope-coded affinity tags and
mass spectrometry. Nat Protoc 2006;1:139-45.
143. Coombs KM. Quantitative proteomics of complex mixtures. Expert Rev Proteomics
2011;8:659-77.
144. Boersema PJ, Raijmakers R, Lemeer S, Mohammed S, Heck AJR. Multiplex peptide stable
isotope dimethyl labeling for quantitative proteomics. Nat Protoc 2009;4:484-94.
145. Rifai N, Gillette MA, Carr SA. Protein biomarker discovery and validation: the long and
uncertain path to clinical utility. Nat Biotechnol 2006;24:971-83.

131
146. Gibson DS, Rooney ME. The human synovial fluid proteome: A key factor in the
pathology of joint disease. Proteomics Clin Appl 2007;1:889-99.
147. Mateos J, Lourido L, Fernández-Puente P, Calamia V, Fernández-López C, Oreiro N, et al.
Differential protein profiling of synovial fluid from rheumatoid arthritis and osteoarthritis
patients using LC-MALDI TOF/TOF. J Proteomics 2012;75:2869-78.
148. Reece RJ, Canete JD, Parsons WJ, Emery P, Veale DJ. Distinct vascular patterns of early
synovitis in psoriatic, reactive, and rheumatoid arthritis. Arthritis Rheum 1999;42:1481-4.
149. Ryu J, Park SG, Park BC, Choe M, Lee K-S, Cho J-W. Proteomic analysis of psoriatic skin
tissue for identification of differentially expressed proteins: Up-regulation of GSTP1, SFN and
PRDX2 in psoriatic skin. Int J Mol Med 2011;28:785.
150. Rahimi H, Ritchlin CT. Altered bone biology in psoriatic arthritis. Curr Rheumatol Rep
2012;14:349-57.
151. Roberson ED, Bowcock AM. Psoriasis genetics: breaking the barrier. Trends Genet
2010;26:415-23.
152. Chandran V, Bull SB, Pellett FJ, Ayearst R, Rahman P, Gladman DD. Human leukocyte
antigen alleles and susceptibility to psoriatic arthritis. Hum Immunol 2013;74:1333-8.
153. Langevitz P, Buskila D, Gladman DD. Psoriatic arthritis precipitated by physical trauma. J
Rheumatol 1990;17:695-7.
154. Tilleman K, Van Beneden K, Dhondt A, Hoffman I, De Keyser F, Veys E, et al.
Chronically inflamed synovium from spondyloarthropathy and rheumatoid arthritis investigated
by protein expression profiling followed by tandem mass spectrometry. Proteomics
2005;5:2247-57.
155. Bondarenko PV, Chelius D, Shaler TA. Identification and relative quantitation of protein
mixtures by enzymatic digestion followed by capillary reversed-phase liquid chromatography-
tandem mass spectrometry. Anal Chem 2002;74:4741-9.
132
156. Keshishian H, Addona T, Burgess M, Mani DR, Shi X, Kuhn E, et al. Quantification of
cardiovascular biomarkers in patient plasma by targeted mass spectrometry and stable isotope
dilution. Mol Cell Proteomics 2009;8:2339-49.
157. Megger DA, Bracht T, Meyer HE, Sitek B. Label-free quantification in clinical proteomics.
Biochim Biophys Acta 2013;1834:1581-90.
158. Kosanam H, Makawita S, Judd B, Newman A, Diamandis EP. Mining the malignant
ascites proteome for pancreatic cancer biomarkers. Proteomics 2011;11:4551-8.
159. Batruch I, Smith CR, Mullen BJ, Grober E, Lo KC, Diamandis EP, Jarvi KA. Analysis of
seminal plasma from patients with non-obstructive azoospermia and identification of candidate
biomarkers of male infertility. J Proteome Res 2012;11:1503-11.
160. Eissa A, Cretu D, Soosaipillai A, Thavaneswaran A, Pellett F, Diamandis A, et al. Serum
kallikrein-8 correlates with skin activity, but not psoriatic arthritis, in patients with psoriatic
disease. Clin Chem Lab Med 2013;51:317-25.
161. Cameron ML, Briggs KK, Steadman JR. Reproducibility and reliability of the outerbridge
classification for grading chondral lesions of the knee arthroscopically. Am J Sports Med
2003;31:83-6.
162. Wu C, Orozco C, Boyer J, Leglise M, Goodale J, Batalov S, et al. BioGPS: an extensible
and customizable portal for querying and organizing gene annotation resources. Genome Biol
2009;10:R130.
163. Berglund L, Björling E, Oksvold P, Fagerberg L, Asplund A, Szigyarto CA-K, et al. A
genecentric Human Protein Atlas for expression profiles based on antibodies. Mol Cell
Proteomics 2008;7:2019-27.
164. Werner T. Bioinformatics applications for pathway analysis of microarray data. Curr Opin
Biotechnol 2008;19:50-4.
165. Martínez-Morillo E, Cho CK, Drabovich AP, Shaw JL, Soosaipillai A, Diamandis EP.
Development of a multiplex selected reaction monitoring assay for quantification of

133
biochemical markers of down syndrome in amniotic fluid samples. J Proteome Res
2012;11:3880-7.
166. Campbell J, Rezai T, Prakash A, Krastins B, Dayon L, Ward M, et al. Evaluation of
absolute peptide quantitation strategies using selected reaction monitoring. Proteomics
2011;11:1148-52.
167. Mease P. Biologic Agents in Psoriatic Arthritis. Biologics in General Medicine 2007:97-
110.
168. Aochi S, Tsuji K, Sakaguchi M, Huh N, Tsuda T, Yamanishi K, et al. Markedly elevated
serum levels of calcium-binding S100A8/A9 proteins in psoriatic arthritis are due to activated
monocytes/macrophages. J Am Acad Dermatol 2011;64:879-87.
169. Kane D, Roth J, Frosch M, Vogl T, Bresnihan B, FitzGerald O. Increased perivascular
synovial membrane expression of myeloid-related proteins in psoriatic arthritis. Arthritis Rheum
2003;48:1676-85.
170. Yamamoto T. Angiogenic and inflammatory properties of psoriatic arthritis. ISRN
Dermatol 2013;2013:630620.
171. Ritchlin CT. From skin to bone: translational perspectives on psoriatic disease. J
Rheumatol 2008;35:1434-7.
172. Bokarewa MI, Jin T, Tarkowski A. Intraarticular release and accumulation of defensins and
bactericidal/permeability-increasing protein in patients with rheumatoid arthritis. J Rheumatol
2003;30:1719-24.
173. Harder J, Schröder JM. Psoriatic scales: a promising source for the isolation of human skin-
derived antimicrobial proteins. J Leukoc Biol 2005;77:476-86.
174. Paulsen F, Pufe T, Conradi L, Varoga D, Tsokos M, Papendieck J, Petersen W.
Antimicrobial peptides are expressed and produced in healthy and inflamed human synovial
membranes. J Pathol 2002;198:369-77.

134
175. Edwards SW, Hughes V, Barlow J, Bucknall R. Immunological detection of
myeloperoxidase in synovial fluid from patients with rheumatoid arthritis. Biochem J
1988;250:81-5.
176. Doğan P, Soyuer U, Tanrikulu G. Superoxide dismutase and myeloperoxidase activity in
polymorphonuclear leukocytes, and serum ceruloplasmin and copper levels, in psoriasis. Br J
Dermatol 1989;120:239-44.
177. Ramos VA, Ramos PA, Dominguez MC. [Role of oxidative stress in the maintenance of
inflamation in patients with juvenile rheumatoid arthritis]. J Pediatr (Rio J) 2000;76:125-32.
178. Bikah G, Lynd FM, Aruffo AA, Ledbetter JA, Bondada S. A role for CD5 in cognate
interactions between T cells and B cells, and identification of a novel ligand for CD5. Int
Immunol 1998;10:1185-96.
179. Fenutría R, Martinez VG, Gil V, Sintes J, Simôes I, Merino J, et al. Role of CD5/CD5L
interactions in the homeostasis of regulatory lymphocyte subpopulations and the control of
autoimmune disorders. J Transl Med 2011;9:O6.
180. de Wit J, Souwer Y, van Beelen AJ, de Groot R, Muller FJ, Klaasse Bos H, et al. CD5
costimulation induces stable Th17 development by promoting IL-23R expression and sustained
STAT3 activation. Blood 2011;118:6107-14.
181. Lowes MA, Kikuchi T, Fuentes-Duculan J, Cardinale I, Zaba LC, Haider AS, et al.
Psoriasis vulgaris lesions contain discrete populations of Th1 and Th17 T cells. J Invest
Dermatol 2008;128:1207-11.
182. Fan C, Lidén S. Association between orosomucoid (ORM) types and psoriasis. Hum Hered
1994;44:72-6.
183. Mathieu A, Cauli A, Vacca A, Mameli A, Passiu G, Porru G, et al. Genetics of psoriasis
and psoriatic arthritis. Reumatismo 2011;59:25-7.

135
184. Rahman P, Roslin NM, Pellett FJ, Lemire M, Greenwood CM, Beyene J, et al. High
resolution mapping in the major histocompatibility complex region identifies multiple
independent novel loci for psoriatic arthritis. Ann Rheum Dis 2011;70:690-4.
185. Dominguez P, Gladman DD, Helliwell P, Mease PJ, Husni ME, Qureshi AA. Development
of screening tools to identify psoriatic arthritis. Curr Rheumatol Rep 2010;12:295-9.
186. FitzGerald O, Mease PJ. Biomarkers: project update from the GRAPPA 2012 annual
meeting. J Rheumatol 2013;40:1453-4.
187. Yang C, Gu J, Rihl M, Baeten D, Huang F, Zhao M, et al. Serum levels of matrix
metalloproteinase 3 and macrophage colony-stimulating factor 1 correlate with disease activity
in ankylosing spondylitis. Arthritis Rheum 2004;51:691-9.
188. Chen C-H, Lin K-C, Yu DTY, Yang C, Huang F, Chen H-A, et al. Serum matrix
metalloproteinases and tissue inhibitors of metalloproteinases in ankylosing spondylitis: MMP-3
is a reproducibly sensitive and specific biomarker of disease activity. Rheumatology
2006;45:414-20.
189. Bresnihan B. Synovial biomarkers in the spondylarthropathies. Curr Opin Rheumatol
2006;18:359-63.
190. Martínez-Morillo E, García Hernández P, Begcevic I, Kosanam H, Prieto García B,
Alvarez Menéndez FV, Diamandis EP. Identification of novel biomarkers of brain damage in
patients with hemorrhagic stroke by integrating bioinformatics and mass spectrometry-based
proteomics. J Proteome Res 2014;13:969-81.
191. Drabovich AP, Dimitromanolakis A, Saraon P, Soosaipillai A, Batruch I, Mullen B, et al.
Differential diagnosis of azoospermia with proteomic biomarkers ECM1 and TEX101
quantified in seminal plasma. Sci Transl Med 2013;5:212ra160.
192. Hamilton DW. Functional role of periostin in development and wound repair: implications
for connective tissue disease. J Cell Commun Signal 2008;2:9-17.

136
193. Ruan K, Bao S, Ouyang G. The multifaceted role of periostin in tumorigenesis. Cell Mol
Life Sci 2009;66:2219-30.
194. Masuoka M, Shiraishi H, Ohta S, Suzuki S, Arima K, Aoki S, et al. Periostin promotes
chronic allergic inflammation in response to Th2 cytokines. J Clin Invest 2012;122:2590-600.
195. Blanchard C, Mingler MK, McBride M, Putnam PE, Collins MH, Chang G, et al. Periostin
facilitates eosinophil tissue infiltration in allergic lung and esophageal responses. Mucosal
Immunol 2008;1:289-96.
196. Lin J, Zhou Z, Huo R, Xiao L, Ouyang G, Wang L, et al. Cyr61 induces IL-6 production by
fibroblast-like synoviocytes promoting Th17 differentiation in rheumatoid arthritis. J Immunol
2012;188:5776-84.
197. Rachakonda TD, Schupp CW, Armstrong AW. Psoriasis prevalence among adults in the
United States. J Am Acad Dermatol 2014;70:512-6.
198. Haroon M, Kirby B, FitzGerald O. High prevalence of psoriatic arthritis in patients with
severe psoriasis with suboptimal performance of screening questionnaires. Ann Rheum Dis
2013;72:736-40.
199. Khraishi M, Chouela E, Bejar M, Landells I, Hewhook T, Rampakakis E, et al. High
prevalence of psoriatic arthritis in a cohort of patients with psoriasis seen in a dermatology
practice. J Cutan Med Surg 2011;16:122-7.
200. Kennedy M, Papneja A, Thavaneswaran A, Chandran V, Gladman DD. Prevalence and
predictors of reduced work productivity in patients with psoriatic arthritis. Clin Exp Rheumatol
2014;32:342-8.
201. Boehncke WH, Boehncke S. Cardiovascular mortality in psoriasis and psoriatic arthritis:
epidemiology, pathomechanisms, therapeutic implications, and perspectives. Curr Rheumatol
Rep 2012;14:343-8.

137
202. Gelfand JM, Troxel AB, Lewis JD, Kurd SK, Shin DB, Wang X, et al. The risk of
mortality in patients with psoriasis: results from a population-based study. Arch Dermatol
2007;143:1493-9.
203. Forsman H, Islander U, Andréasson E, Andersson A, Onnheim K, Karlström A, et al.
Galectin 3 aggravates joint inflammation and destruction in antigen-induced arthritis. Arthritis
Rheum 2011;63:445-54.
204. Henderson NC, Sethi T. The regulation of inflammation by galectin-3. Immunol Rev
2009;230:160-71.
205. Krautbauer S, Eisinger K, Hader Y, Buechler C. Free fatty acids and IL-6 induce adipocyte
galectin-3 which is increased in white and brown adipose tissues of obese mice. Cytokine
2014;69:263-71.
206. Sasaki T, Brakebusch C, Engel J, Timpl R. Mac-2 binding protein is a cell-adhesive protein
of the extracellular matrix which self-assembles into ring-like structures and binds beta1
integrins, collagens and fibronectin. EMBO J 1998;17:1606-13.
207. Ohshima S, Kuchen S, Seemayer CA, Kyburz D, Hirt A, Klinzing S, et al. Galectin 3 and
its binding protein in rheumatoid arthritis. Arthritis Rheum 2003;48:2788-95.
208. Cretu D, Prassas I, Saraon P, Batruch I, Gandhi R, Diamandis EP, Chandran V.
Identification of psoriatic arthritis mediators in synovial fluid by quantitative mass spectrometry.
Clin Proteomics 2014;11:27.
209. Ademowo OS, Hernandez B, Collins E, Rooney C, Fearon U, van Kuijk AW, Tak PP,
Gerlag DM, FitzGerald O, Pennington SR. Discovery and confirmation of a protein biomarker
panel with potential to predict response to biological therapy in psoriatic arthritis. Ann Rheum
Dis 2014; [Epub ahead of print].
210. Benito MJ, Veale DJ, FitzGerald O, van den Berg WB, Bresnihan B. Synovial tissue
inflammation in early and late osteoarthritis. Ann Rheum Dis 2005;64:1263-7.

138
211. O'Hara R, Murphy EP, Whitehead AS, FitzGerald O, Bresnihan B. Acute-phase serum
amyloid A production by rheumatoid arthritis synovial tissue. Arthritis Res 2000;2:142-4.
212. Mullan RH, Bresnihan B, Golden-Mason L, Markham T, O'Hara R, FitzGerald O, Veale
DJ, Fearon U. Acute-phase serum amyloid A stimulation of angiogenesis, leukocyte
recruitment, and matrix degradation in rheumatoid arthritis through an NF-kappaB-dependent
signal transduction pathway. Arthritis Rheum 2006;54:105-14.