identification and analysis of novel virulence defective ...§ão... · sintomas, mas produziram...
TRANSCRIPT

Identification and analysis of novel virulence-defective
Rhodococcus fascians mutants
Adriana Sofia Silva Cabecinhas
Thesis submitted in partial fulfillment of the requirements for the degree of Master of
Applied Biotechnology
Promotor: Doctor Danny Vereecke
Co-Promotor: Doctor Américo Rodrigues
2014

ii
Title: Identification and analysis of novel virulence-defective Rhodococcus fascians
mutants
Copyright © Adriana Sofia Silva Cabecinhas
A Escola Superior de Turismo e Tecnologia do Mar e o Instituto Politécnico de Leiria têm
o direito, perpétuo e sem limites geográficos, de arquivar e publicar esta dissertação
através de exemplares impressos reproduzidos em papel ou de forma digital, ou por
qualquer outro meio conhecido ou que venha a ser inventado, e de a divulgar através de
repositórios científicos e de admitir a sua cópia e distribuição com objectivos educacionais
ou de investigação, não comerciais, desde que seja dado crédito ao autor e editor.
This work was conducted at the Laboratory of Applied in vitro Plant Biotechnology at the Campus
Schoonmeersen of the Ghent University.
Part of the work was also conducted at the department of Plant Systems Biology (PSB) of the
Flanders Institute for Biotechnology (Vlaams Instituut voor Biotechnologie - VIB).

iii
Acknowledgments
First of all, thanks a lot to Danny Vereecke, my scientific mum, to be not only a
spectacular promotor, that guided and supported me through all the different stages of the
thesis, but also a remarkable touristic guide, gastronomic advisor and a big friend. Thanks
a lot for everything that you taught me, for all the input that you have asked from me and,
specially, for all the effort that you have put into my thesis and to always believe in me.
Thanks to Katrien to always have a big smile, to annoy me when I was trying to work and
to try to put everyone speaking in English and encourage me to give it a try on the Dutch.
Thanks to Joris to improve the quality of my photos and to bake cakes (or at least promise
to). Thanks Nina that was in Belgium for a short time but was a big support for me. Thanks
to the girls (Halima, Salima, Nandini and Mirni) for the support when I was really busy
and tired, the company, the funny moments and to allow me to try a bit of your culture.
Thanks Stefaan to let me working in your lab and for the relaxing effect that you have by
always saying that “it is ok” even when it is not.
Thanks to Stephen to allow me work at your bench in VIB and be always available to help.
Thanks a lot to Annick for the advice in the clonings, to take care of me when I had to
work with the radioactive compounds and to help me at any time. Thanks Belén, not only
for the company at weird hours at VIB but also to be always with a smile and able to help
me even in the most busy days. Thanks to Pieter for the “ai, ai, ai…” and the nice
conversations in the lab. Thanks to Hans and Stephanie because the party is also an
important part of the work. Thanks to the Portuguese people that I met here. You made me
feel at home in a country that is not ours. Thanks to Maria’s (Fonseca and Fuller, my
adopted mum), my two pillars that kept me straight and never allowed me to fall. Thanks
for the awesome company, the nice food and all the support. Thanks to my Erasmus
friends (José, Inês, Sónia, Vicky, Olívia), it would definitely not have been the same
without you. A special thank to Vicky for being the exception.
Obrigada aos Doutores Américo Rodrigues, pelo apoio prestado ao longo deste trabalho, e
Marco Lemos, pela permanente disponibilidade. Por último, mas não menos importante,
obrigada aos meus pais pois sem eles não estaria aqui. Obrigada mãe por não ser preciso
uma palavra para me entenderes. Obrigada pai pelo apoio. Obrigada aos dois por me terem

iv
dado fortes raízes mas também por não me terem cortado as asas. Um grande obrigada ao
João, meu amigo, companheiro e confidente. Obrigada por seres o meu porto de abrigo, me
dares todo o apoio, acreditares em mim e teres sempre uma palavra positiva para me dizer.
Obrigada manas por, cada uma à sua maneira, me darem força todos os dias para
continuar. Obrigada Nádia pelas estrelinhas que me guiaram ao longo de todo o caminho e
por estares sempre disposta a ouvir-me. Obrigada padrinhos pela ajuda, obrigada avó pelos
miminhos e obrigada tios e primos pelo amparo. Obrigada amigos (Serguei, Dani, SaSilva,
Rute, Tilui, Rita Pascoal, Joana Patriarca e Sarah Azinheiro) por terem sempre
disponibilidade para mim e por nada mudar mesmo após meses de ausência.
Words do not come easy to me and it is impossible to say all the names that were
important in this process. I will always be grateful to all of you.
Dank u wel
Muito obrigada
v
Abstract
The phytopathogenic actinomycete Rhodococcus fascians induces a disease, known as
leafy gall, characterized by the induction of multiple shoots, on a broad variety of
dicotyledonous herbaceous plants. The main pathogenicity factor of the bacterium is the
production of a mixture of 6 cytokinins encoded by the genes of the fas operon which is
located on a linear virulence plasmid pFiD188. This research aimed to analyze two novel
virulence loci of the linear plasmid: GT1 encoding a glycosyltransferase and the highly
homologous mtr1 and mtr2 genes encoding SAM-dependent methyltransferases.
Previous data showed that the glycosyltransferase mutant 21D5 had a modified colony
morphology and formed aggregates in liquid cultures. We established that these
characteristics did not affect growth on rich media, but lead to the inability to proliferate
under nutrient deprivation, strongly impacting epiphytic fitness. The latter was illustrated
by the strongly attenuated virulence of 21D5, which was accompanied by a defective
expression of the essential virulence genes fas and att, and the consequent reduced
capacity to invade plant tissues and produce virulence factors. GT1 expression proved to
be induced by compounds that accumulate in plants very early upon infection, placing the
GT1 function at the onset of the interaction.
Just like R. fascians, Streptomyces turgidiscabies carries a fas operon and two associated
mtr genes. Mutants in these mtr’s in R. fascians have lost all ability to provoke symptoms,
but still produce 2MeS-cytokinins, implying that other methylated cytokinins are
imperative for disease induction. By analysing the cytokinin profiles via TLC of a set of
R. fascians strains grown under fas-inducing conditions and of S. turgidiscabies fed with
14C-labelled SAM and adenine we tried to uncover the elusive reaction products of the
MTRs. Unfortunately, no fas- or mtr-dependent compounds were detected in the
supernatants. By determining the expression pattern of the mtr genes in vitro and in planta
it became clear that the regulatory aspects of these genes are very complex, limiting their
expression to R. fascians cells that reside on the host. To open the path to the identification
of the MTR reaction products, we succeeded in developing an assay in which the in planta
expression can be brought in vitro so that the labelling experiments can be repeated.
Keywords: glycosyltransferase; methyltransferase; att operon; fas operon; cytokinins.

vi

vii
Resumo
Rhodococcus fascians é uma actinomiceta fitopatogénica que induz uma doença,
conhecida como irritação frondosa, caracterizada pela indução de múltiplos rebentos, numa
vasta gama de plantas herbáceas dicotiledóneas. O principal factor de patogenicidade da
bactéria é a produção de uma mistura de 6 citoquininas codificadas pelos genes do operão
fas que está localizado num plasmídeo linear associado à virulência, pFiD188. Este
trabalho teve como objectivo a análise de dois novos loci deste plasmídeo associados à
virulência: GT1 que codifica uma glicosiltransferase e os genes mtr1 e mtr2, grandemente
homólogos, que codificam metiltransferases dependentes de SAM.
Trabalhos prévios com 21D5, mutante na glicosiltransferase, mostraram que possui uma
morfologia de colónia modificada e forma agregados em culturas líquidas. Neste trabalho
demonstrou-se que essas características não afectam o crescimento em meio de cultura
rico, mas levam à incapacidade de proliferação em condições de privação de nutrientes,
tendo um impacto forte na competência epifítica. Este impacto foi demostrado pela
atenuação severa da virulência em 21D5, que foi acompanhada de uma expressão alterada
dos genes fas e att, essenciais para a virulência, e consequente redução da capacidade de
invasão dos tecidos da planta e de produção dos factores de virulência. Demonstrou-se
também que a expressão de GT1 é induzida por compostos que são acumulados em plantas
nas fases iniciais da infecção, colocando a função de GT1 no começo da interacção.
Tal como R. fascians, Streptomyces turgidiscabies possui um operão fas e dois genes mtr
associados. R. fascians mutantes nestes genes mtr’s perderam a capacidade de provocar
sintomas, mas produziram 2MeS-citoquininas, implicando que outras citoquininas
metiladas são cruciais para a indução da doença. De modo a identificar os produtos de
reacção das MTRs procedeu-se à análise do perfil de citoquininas de R. fascians em
condições que induzem a expressão dos genes do operão fas e de S. turgidiscabies
alimentados com SAM e adenina marcadas com 14
C em TLC. No entanto, não foi possível
a identificação de compostos dependentes de fas ou mtr nos sobrenadantes. Pela
determinação do perfil de expressão dos genes mtr in vitro e in planta tornou-se claro que
a regulação destes genes é muito complexa, sendo a sua expressão limitada a células de
R. fascians que colonizam o hospedeiro. Para possibilitar a identificação dos produtos de
recção de MTR, desenvolveu-se um protocolo que permite a expressão in planta em
condições in vitro, o que permitirá a repetição dos ensaios de marcação com 14
C.
Palavras-chave: glicosiltransferase; metiltransferase; operão att; operão fas; citoquininas.

viii
Part of this work is published in:
2014 - Adriana Cabecinhas, Petr Tarkowski, Ine Pertry, Stefaan Werbrouck, and Danny
Vereecke “Methylated cytokinins: the secret weapon of the phytopathogen Rhodococcus
fascians?” – Auxins and cytokinins in plant development, International Symposium

ix
Table of contents
Abstract ............................................................................................................................................. v
Resumo ............................................................................................................................................ vii
1. Introduction .................................................................................................................................. 1
A. Rhodococcus fascians, causative agent of the leafy gall syndrome .......................................... 1
B. The molecular basis of the phytopathogenicity of R. fascians strain D188 .............................. 4
C. Glycosyltransferase (GT1), a novel player in the pathology of R. fascians .............................. 9
D. Two methyltransferases, intriguing members of the fas locus ................................................ 13
2. Aim of this work ......................................................................................................................... 17
3. Materials and methods............................................................................................................... 19
3.1 Bacterial strains and growth conditions ................................................................................. 19
3.2 Determination of the colony morphology .............................................................................. 21
3.3 Plant material and growth conditions..................................................................................... 21
3.4 Infection procedures ............................................................................................................... 22
3.5 SEM analysis ......................................................................................................................... 23
3.6 Preparation of plant extracts .................................................................................................. 23
3.7 Transformation procedures and plasmid preparation ............................................................. 23
3.8 In vitro expression analysis .................................................................................................... 24
3.8.1 att expression ................................................................................................................................ 24 3.8.2 fas, GT1, mtr1 and mtr2 expression .............................................................................................. 25
3.9 In planta expression analysis ................................................................................................. 26
3.9.1 Quantitative in planta expression analysis ................................................................................... 26 3.9.2 Histochemical in planta expression analysis ................................................................................ 26
3.10 In planta survival ................................................................................................................. 27
3.11 Cloning of GT1:GUS fusions ............................................................................................... 27
3.12 TLC analysis of bacterial cytokinins ................................................................................... 28
4. Results ......................................................................................................................................... 31
A. Functional analysis of the glycosyltransferase GT1 ............................................................... 31
4.A.1. The colony morphology of R. fascians is defined by the medium composition and modified in the
GT1 mutant 21D5 .................................................................................................................................. 31 4.A.2. Growth capacity of different R. fascians strains on different media ............................................ 34 4.A.3. Mutations in GT1 seriously impair the virulence of R. fascians .................................................. 35 4.A.4. The regulation of fas gene expression is impaired in vitro and in planta affecting the level of
cytokinin production by 21D5 ................................................................................................................ 41
4.A.5. Impaired att gene expression affects the in planta production of the Att compound by 21D5 .... 43
4.A.6. 21D5 is unable to persist on the plant host.................................................................................. 45
4.A.7. Expression of GT1 is possibly induced by carbon sources that accumulate in infected plants and
might be controlled by AttR ................................................................................................................... 48
B. Methylated cytokinins: the secret weapon of R. fascians? ...................................................... 50
5. Discussion .................................................................................................................................... 57
6. Summary and perspectives ........................................................................................................ 61
7. References ................................................................................................................................... 65
8. Annexes ....................................................................................................................................... 73

x
xi
List of figures
Figure 1.1 Typical growth of R. fascians on YEB and symptoms on Nicotiana tabacum infected
with the wild-type strain D188 at 28 dpi .......................................................................................... 2
Figure 1.2 Representation of the linear plasmid of R. fascians strain D188 ................................... 5
Figure 1.3 Organization and homologies of the fas and att loci located in region U1 of pFiD188,
the linear plasmid of R. fascians strain D188 .................................................................................... 5
Figure 1.4 Representation of the molecular processes occurring after the infection of a host plant
by R. fascians ................................................................................................................................... 7
Figure 1.5 Representation of the cytokinin biosynthetic pathway encoded by the fas operon of
R. fascians D188 ............................................................................................................................ 8
Figure 1.6 Organization and homologies of the GT locus genes in R. fascians .................. 10
Figure 1.7 The protein structure of Escherichia coli MurG, a typical B-fold GT, in complex with
its donor substrate, UDP-GlcNAc .................................................................................................. 11
Figure 1.8 Sequence alignment of selected GT-B superfamily members ..................................... 12
Figure 1.9 Organization of the fas loci and induced symptoms by R. fascians strain D188 and S.
turgidiscabies ................................................................................................................................. 14
Figure 3.1 Cloning strategy for the generation of a construct carrying a transcriptional fusion
between GT1 and GUS in pRF37, a bifunctional vector for E. coli and R. fascians ...................... 28
Figure 4.1 Colony morphology of the wild-type R. fascians strain D188, its plasmid-free derivative
D188-5 and the transposon mutant 21D5 grown on different media .............................................. 33
Figure 4.2 Overview of the growth of the wild-type R. fascians strain D188 and the transposon
mutant 21D5 ................................................................................................................................... 34
Figure 4.3 Symptoms on A. thaliana plants inoculated with different R. fascians strains ............ 36
Figure 4.4 Axillary activation in A. thaliana plants inoculated with different R. fascians strains . 37
Figure 4.5 Kinetics of symptom development on A. thaliana plants inoculated with different
R. fascians strains ........................................................................................................................... 38
Figure 4.6 Symptom formation on decapitated N. tabacum xanthi plants when they were 4-week
old inoculated with different R. fascians strains ............................................................................ 39
Figure 4.7 Symptoms on wounded or intact excised leaves of 4-week old N. tabacum xanthi plants
inoculated with different R. fascians strains .................................................................................. 40
Figure 4.8 Expression of fasA and cytokinin production in different R. fascians strains .............. 42
Figure 4.9 Expression of the attA gene and Att compound production in different R. fascians
strains ............................................................................................................................................. 44

xii
Figure 4.10 Colonization capacities of R. fascians strains D188-5, 21D5 and D188 ................... 45
Figure 4.11 Epiphytic colonization of excised tobacco leaves by R. fascians strain D188 and 21D5
5 weeks after infection ................................................................................................................... 47
Figure 4.12 Effect of different conditions on in vitro GT1 expression measured in D188(pRFGT2-
1) with MUG as a substrate ............................................................................................................ 49
Figure 4.13 Effect of different regulators on in vitro GT1 expression measured from the reporter
plasmid pRFGT2-1 in different R. fascians strains with MUG as a substrate ............................... 50
Figure 4.14 Presence of the T-N11-A motif in the upstream sequence of the pFi_135_136 operon
.......................................................................................................................................................... 50
Figure 4.15 Preliminary data on the cytokinin production of different R. fascians strains ........... 51
Figure 4.16 Thin layer chromatography analysis of 14
C-adenine- and 14
C-SAM-labelled
compounds produced by different R. fascians and S. turgidiscabies strains .................................. 52
Figure 4.17 Thin layer chromatography and UV-fluorescence analysis of 14
C-adenine- and 14
C-
SAM-labelled compounds produced by different R. fascians and S. turgidiscabies strains .......... 52
Figure 4.18 Effect of different conditions on in vitro mtr1, mtr2, and fasA expression measured in
D188-mtr1, D188-mtr2, and D188(pJDGV5) ................................................................................ 53
Figure 4.19 In planta expression of fasA, mtr1 and mtr2 using different assays .......................... 54
Figure 4.20 Bringing in planta expression of the mtr1 gene to an in vitro system ....................... 55
Figure 8.1 Colony morphology of the wild-type R. fascians strain D188, the attenuated mutant
D188-att1, and the non-pathogenic mutant D188-fas1 grown on different media ......................... 71
Figure 8.2 Colony morphology of the wild-type R. fascians strain D188 and three GT1 transposon
mutants 45F10, 41H2 and 40G10, grown on different media ........................................................ 72
Figure 8.3 Overview of significant changes in the primary metabolism upon infection with
R. fascians D188 when compared with D188-5 infection .............................................................. 73

xiii
List of tables
Table 3.1 Characteristics of the bacterial strains used in this work ............................................... 20
Table 4.1 Relative growth of different R. fascians strains on different media based on CFU’s ... 35
Table 4.2 Preliminary data on the cytokinin content of the supernatant of different R. fascians
strains grown under inducing conditions ........................................................................................ 43

xiv

xv
List of frequently used abbreviations
2-iP 2-isopentenyladenine
2MeS Methylthio-derivatives
Amp Ampicillin
att Attenuation
CKX Cytokinin oxidase/dehydrogenase
Cm Chloramphenicol
cZ cis-zeatin
DNA Deoxyribonucleic acid
dpi Days post-infection
fas Fasciation
GT Glycosyltransferase
GUS β-Glucuronidase
His Histidine
IM Induction medium
Km Kanamycin
LB Luria broth
MES 2-(N-morpholino)ethanesulfonic acid
MTR Methyltransferase
OD Optical density
Phleo Phleomycin
Pyr Pyruvate
SAM S-adenosyl methionine
TLC Thin layer chromatography
tZ trans-zeatin
YEB Yeast extract broth


Introduction
1
1. Introduction
Organisms living together in ecosystems can interact with each other in different ways.
Mutualism is the interaction where both organisms benefit from the relation.
Commensalism benefits one organism and does not bring advantage or disadvantage for
the other. Pathogenic interactions benefit one of the organisms (the pathogen) and is
disadvantageous for the other (the host) (Rédei, 2008). Pathogens can be differentiated
according to the mechanism used to obtain nutrients. Necrotrophic pathogens kill the host
or the cells of the invaded tissues through the secretion of toxic compounds. Biotrophic
organisms extract nutrients directly from living cells (Dyakov et al., 2007).
Pathogens that affect plants are called phytopathogens. Those interactions have important
economic implications since diseased plants are unfit for consumption or ornamental
purposes (Depuydt et al., 2008). Bacterial interactions with plants can be compatible or
incompatible. Compatible interactions happen when the bacteria infect susceptible host
plants and are able to cause disease symptoms (Collmer, 1998). Incompatible interactions
occur when the bacteria are not able to cause symptoms, because they cannot invade the
plant tissues or because the plant secretes compounds that are toxic for the bacterium or
that interfere with the pathogen’s virulence mechanism.
A. Rhodococcus fascians, causative agent of the leafy gall syndrome
R. fascians is a phytopathogenic Gram-positive, rod-shaped, aerobic, nonmotile, and
nonsportulating bacterium that forms orange colonies (Pertry et al., 2010; Stes et al., 2011;
Tilford, 1936; Vandeputte et al., 2005) (Figure 1.1.A). The taxonomic position of the
bacterium was a matter of debate for several years. Based on phenotypic, biochemical and
genetic data the phytopathogen was positioned within the Actinomycetales in the genus
Rhodococcus (Goodfellow, 1984). Bacteria from the genus Rhodococcus are known
because of their medical, environmental and industrial implications (Gürtler et al., 2004).
Despite the advances in the study of the genus and reports referring to plant-association,
R. fascians is the only pathogenic member (Stes et al., 2011).
When infecting plants, R. fascians induces the development of leafy galls (Figure 1.1.B),
structures consisting of clusters of small often deformed shoots of which further outgrowth

Introduction
2
is inhibited (Crespi et al., 1992; Vereecke et al., 2000). Generally, plant tissues first grow
by cell division and then by cell expansion (Donnelly et al., 1999), but in the formed
structures there is continuous growth through cell proliferation (Depuydt et al., 2009a;
Vereecke et al., 2002b). Although the important role of cytokinins in the development of
those symptoms is established, there is evidence that other hormones are involved as well
(Depuydt et al., 2008; Simón-Mateo et al., 2006). Other gall-inducing pathogens, such as
bacteria of the genera Agrobacterium, Pantoea, and Pseudomonas, cause the proliferation
of undifferentiated tissues (Pitzschke and Hirt, 2010). R. fascians is the only hyperplasia-
inducing bacterium that causes differentiated galls (Vereecke et al., 2000), inducing the
formation of shoots from existing and newly formed meristems (de O Manes et al., 2004).
The leafy galls represent a niche with the perfect conditions for the survival and
maintenance of the pathogen (Bailey et al., 2009; Hayward and Stone, 2005). Other
symptoms observed in plants infected with R. fascians are the deformation of the leaves
and swelling of the vascular tissues (Stes et al., 2011) (Figure 1.1.C). Symptom
development (time to appear and aggressiveness) depends on the infection success, which
is influenced by the initial amount of bacteria, the susceptibility of the plant, and the
general efficiency of the interaction between the plant and the bacterium.
Figure 1.1 Typical growth of R. fascians on YEB and symptoms on Nicotiana tabacum
infected with the wild-type strain D188 at 28 dpi. (A) R. fascians grown on YEB; (B) Leafy gall on infected leaf (ISO 100, Diaphragm 16 and
closing time 1/100sec); (C) Leaf deformation and swelling of the vascular tissue (arrow) on
decapitated plants (ISO 100, Diaphragm 32 and closing time 2,5sec).
With the increase of transport of ornamental plants, this pathogen has become a worldwide
threat in horticulture, leading to significant economic losses (Depuydt et al., 2008; Putnam
and Miller, 2007). Infections have been recorded throughout the world but are mainly
present in temperate regions (CBI, 2006) The reported host range of R. fascians
encompasses 164 different plant species belonging to 43 families, mono- and
A B C

Introduction
3
dicotyledonous, but this number is most probably an underestimation of the pathological
potential of the species (Depuydt, 2008). Few reports describe plants that are resistant to
the morphologic alterations caused by the bacteria. For instance, Dalbergia pervillei
synthesizes a compound - perbergin - that is able to inhibit the expression of the virulence
genes of the bacteria (Rajaoson et al., 2011).
The bacteria can stay on the plant surface for months before symptoms become visible
(Cornelis et al., 2001). Therefore, the propagation of contaminated material is the main
transmission way in horticultural practices (Miller et al., 2007). Moreover, the
phytohormones that are extensively used in horticulture for plant propagation induce
morphological changes that are similar to the ones caused by R. fascians. In that way,
infected symptomatic plants can be mistaken for plants deformed by the exogenous
hormones. Moreover, other pathogens or herbicides can cause R. fascians-like
deformations (Miller et al., 2008; Putnam and Miller, 2006). Altogether, because of these
complications, it is likely that the problem with R. fascians in horticulture is
underestimated and a good diagnosis combined with strict sanitary measures are
imperative to prevent infection spread to other plants (Miller et al., 2007).
Proper diagnosis of the plants is based on the combination of different methods. The
traditional method to isolate the bacteria from the plant has proven to be difficult and can
lead to false negative results. Additionally, non-pathogenic strains can be obtained as well
and, therefore, the pathogenicity of the isolates has to be confirmed by molecular methods
which are time consuming, yet extremely sensitive (Lacey, 1961). Pathogenicity can also
be established by infecting a plant from the same species as the original host (Putnam,
2014; Vereecke et al., 2000). Finally, serological tests, based on the detection of
fluorescent antibodies, are used but those methods are laborious and can raise false results
(de Boer et al., 1988). Adding to the complexity, recent work developed at the Oregon
State University indicated that the causative agent of the leafy gall syndrome is not a single
organism, but two genetically very different bacterial species (Putnam, 2014).
Some plants do not react to the phytohormone-based methods used in in vitro propagation
and hence cannot be propagated artificially (Kevers et al., 2004). Since R. fascians triggers
vegetative multiplication through the action of phytohormones, this pathology also has a
putative positive side and might be useful in different plant research areas. A first line of

Introduction
4
research is to understand the role of plant hormones in regular plant development.
Currently this question is addressed by using plant mutants or exogenous hormones. An
alternative approach is to use R. fascians as a source of phytohormones that are delivered
directly into the plant tissues in a much more controlled and biologically relevant
concentration than exogenous addition (Depuydt et al., 2009a). The direct application of
R. fascians in in vitro technologies still lies far ahead because the leafy gall syndrome is
the result of a complex interaction between the pathogen and its host, and therefore it is
very difficult if not impossible to mimic the shoot formation induced by R. fascians by
exogenous hormone addition. Leafy galls induced by R. fascians bacteria on diverse
medicinal plants have been reported to generate intact plants without phenotypical
abnormalities upon repeated antibiotic treatments (Vereecke et al., 2000). However, it is
difficult to convince plant growers to use a phytopathogenic bacterium to propagate their
plants. Nevertheless, it is worthwhile to continue exploring the possibilities of
implementing R. fascians and/or its morphogens in tissue culture practices since the very
broad host range of the pathogen suggests that it might bring solutions for recalcitrant
plants (Tarkowski and Vereecke, 2014). Consequently, it is imperative to complete the
knowledge on the mechanism of leafy gall development and to get insight into putative
novel virulence factors (Depuydt et al., 2008).
B. The molecular basis of the phytopathogenicity of R. fascians strain D188
A common strategy in plant-associated microbes is the secretion of phytohormones
(Francis et al., 2010). Generally the genes responsible for hormone production are on large
circular plasmids (Nester and Kosuge, 1981), but in R. fascians they are uniquely encoded
by a linear plasmid (Francis et al., 2007). The wild-type R. fascians strain D188 has a
genome consisting of a circular chromosome and two plasmids, one linear, pFiD188,
associated with the pathogenicity, and one circular, pD188, related with cadmium
resistance (Crespi et al., 1994; Desomer et al., 1988). Two different regions can be
considered in the linear plasmid: R regions conserved in other rhodococcal linear plasmids,
involved in the plasmid maintenance functions, and U regions unique to R. fascians
(Francis et al., 2012) (Figure 1.2).
Introduction
5
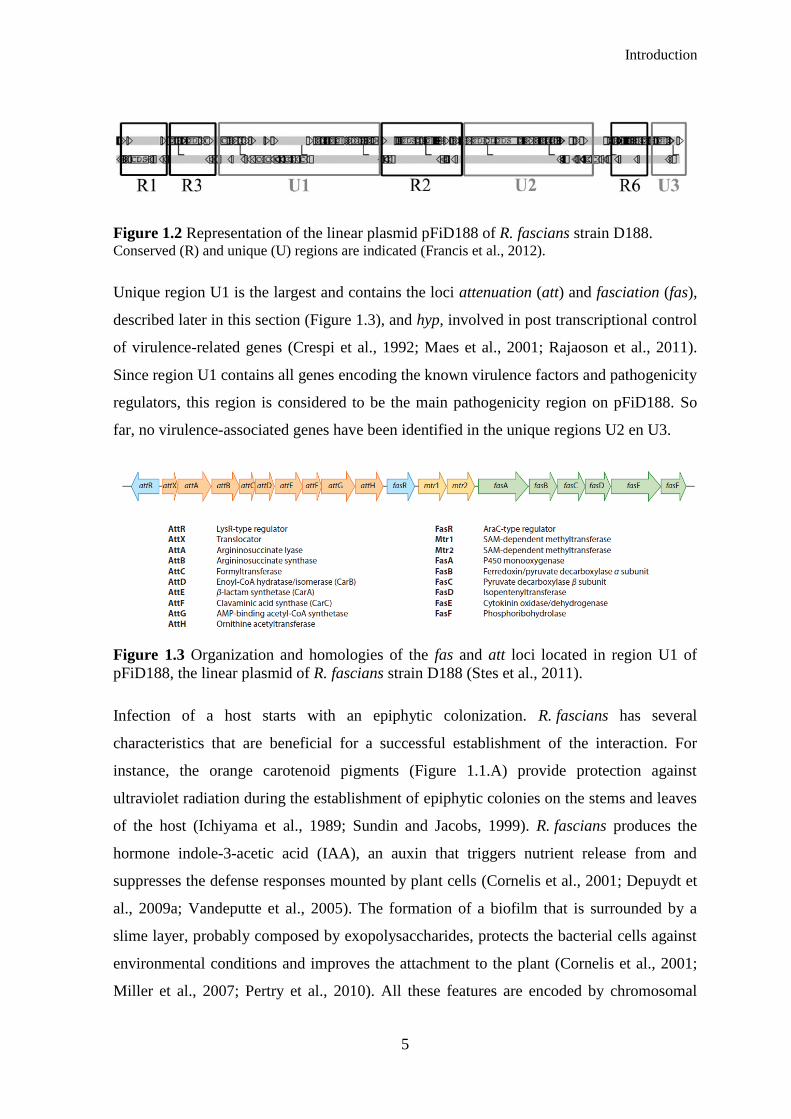
Figure 1.2 Representation of the linear plasmid pFiD188 of R. fascians strain D188. Conserved (R) and unique (U) regions are indicated (Francis et al., 2012).
Unique region U1 is the largest and contains the loci attenuation (att) and fasciation (fas),
described later in this section (Figure 1.3), and hyp, involved in post transcriptional control
of virulence-related genes (Crespi et al., 1992; Maes et al., 2001; Rajaoson et al., 2011).
Since region U1 contains all genes encoding the known virulence factors and pathogenicity
regulators, this region is considered to be the main pathogenicity region on pFiD188. So
far, no virulence-associated genes have been identified in the unique regions U2 en U3.
Figure 1.3 Organization and homologies of the fas and att loci located in region U1 of
pFiD188, the linear plasmid of R. fascians strain D188 (Stes et al., 2011).
Infection of a host starts with an epiphytic colonization. R. fascians has several
characteristics that are beneficial for a successful establishment of the interaction. For
instance, the orange carotenoid pigments (Figure 1.1.A) provide protection against
ultraviolet radiation during the establishment of epiphytic colonies on the stems and leaves
of the host (Ichiyama et al., 1989; Sundin and Jacobs, 1999). R. fascians produces the
hormone indole-3-acetic acid (IAA), an auxin that triggers nutrient release from and
suppresses the defense responses mounted by plant cells (Cornelis et al., 2001; Depuydt et
al., 2009a; Vandeputte et al., 2005). The formation of a biofilm that is surrounded by a
slime layer, probably composed by exopolysaccharides, protects the bacterial cells against
environmental conditions and improves the attachment to the plant (Cornelis et al., 2001;
Miller et al., 2007; Pertry et al., 2010). All these features are encoded by chromosomal

Introduction
6
genes because linear plasmid-free bacteria have similar colonization capacities as the wild-
type strain (Cornelis et al., 2001).
During the epiphytic colonization the primary metabolism of the host changes. In this
process the plant increases the production of carbon and nitrogen sources, which is thought
to facilitate the bacterial colonization (Depuydt et al., 2009a). The bacteria sense these
metabolic changes of the plant and perceive it as a signal that a compatible host has been
found (Maes et al., 2001). The active role of the host in the infection process is very
important and complex. However, since the focus of this work is the phytopathogen and
not the plant, we will not elaborate on the plant side of the interaction. Information about
this topic can be found in recent review articles (Stes et al., 2013; Stes et al., 2011).
When a specific combination of carbon and nitrogen sources is detected, att gene
expression is activated in R. fascians (Figure 1.4.A). This expression is controlled by AttR,
a LysR-type transcriptional regulator (Stes et al., 2011). The att operon is essential at the
onset of the infection and the first locus to be expressed in this process (Cornelis et al.,
2002). An initially low concentration of the att compound is sufficient to activate the
expression of the att biosynthetic genes. With this positive feedback mechanism, the
production of high amounts of the att compound is established (Figure 1.4.B)(Stes et al.,
2013). Such an autoregulatory mechanism resembles the quorum sensing classical concept,
a phenomenon that allows the cells to act as a community rather than as single cells. In
R. fascians the att autoregulatory mechanism is not considered as genuine quorum sensing
since the presence of the plant is required to activate the expression and there is no cell
density-dependent production of the regulatory compound (Maes et al., 2001). The att
regulatory compound is responsible for the activation of the fas operon (Figure 1.4.C).
This operon encodes the genes responsible for the synthesis of the cytokinins and will be
described later (Depuydt et al., 2008). The att knockouts require wounding of the plant
tissues to infect the plant and therefore it is believed that the regulatory compound also
affects, directly or indirectly, the entrance of the bacteria into the plant tissues. Although
the exact mechanism is unknown, it is hypothesized that the att compound itself breaks the
plant cuticula by phytotoxicity or activates the expression of plant cell wall degrading
enzyme genes (Stes et al., 2011). As soon as the bacteria engage in an endophytic stage, att
expression is switched off (Cornelis et al., 2002).

Introduction
7
Figure 1.4 Representation of the molecular processes occurring after the infection of a
host plant by R. fascians. (A) After contact with a compatible host, the expression of the att genes is increased and the att
compound is produced; (B) the accumulation of the att compound triggers the formation of
penetration factors and stimulates the production of high amounts of the att compound through a
positive feedback; (C) the att compound triggers the expression of the fas genes, responsible for the
symptom development (Modified from Stes et al., 2013).
The main pathogenicity strategy of R. fascians is the production of shoot-inducing
cytokinins, triggered by the expression of fas operon genes (Stes et al., 2010) (Figure 1.3).
fas expression is tightly controlled and involves the AttR regulator and FasR, an AraC-type
transcriptional regulator (Temmerman et al., 2000) (Figure 1.4.C). In planta, the fas genes
are active both in the epiphytic and the endophytic populations (Cornelis et al., 2002).
Through biochemical data and the analysis of cytokinin profiles it was possible to
understand that the Fas proteins lead the synthesis of six distinct cytokinins: 2-
isopentenyladenine (2-iP), cis-zeatin (cZ), trans-zeatin (tZ) and their methylthio-
derivatives – 2MeSiP, 2MeScZ and 2MeStZ (Figure 1.5) (Pertry et al., 2009). In contrast
to earlier ideas, the virulence depends more on the cytokinin concentration and ratio of the
different compounds that the host is exposed to, than on the production of specialized
molecules by the bacterium (Pertry et al., 2009). FasD, an isopentenyltransferase, is the
key enzyme in the process. This enzyme synthesizes 2-iP which is the precursor for the
other Fas enzymes (Pertry et al., 2009). FasE is a cytokinin oxidase/dehydrogenase (CKX)
with a strong affinity for 2-iP-type cytokinins and thought to be required for the optimal
functioning of the FasD enzyme. FasA is a putative P450 monooxygenase that
hydroxylates 2-iP to form tZ and cZ. This enzyme can also hydroxylate 2MeSiP, allowing
the formation of 2MeScZ and 2MeStZ. FasA is absolutely required for the virulence of the
phytopathogen (Crespi et al., 1994). FasB and FasC are homologous to the α- and β-
subunit of pyruvate decarboxylase, respectively, and are thought to be accessory proteins
of FasA providing the required electrons (Crespi et al., 1994; Goethals et al., 2001). The
enzymes involved in the direct methylthiolation of 2-iP, tZ, and cZ to produce their 2MeS

Introduction
8
derivatives remain to be identified. FasF is a phophoribohydrolase and represents a
complementary pathway for the formation of Z-type cytokinins. This enzyme directly
releases cytokinin bases from their nucleotide precursors and is crucial for symptoms
maintenance (Figures 1.3 and 1.5) (Stes et al., 2011).
Figure 1.5 Representation of the cytokinin biosynthetic pathway encoded by the fas
operon of R. fascians D188 (Stes et al., 2011).
The production of a mixture of cytokinins instead of the production of large amounts of a
single one has several advantages. In plants, the CKX enzymes are responsible for the
degradation of cytokinins and cytokinin homeostasis. Previous work showed that each
CKX enzyme has a particular substrate specificity and, consequently, the capacity of
different plant tissues and species to degrade specific cytokinins can differ (Galuszka et al.,
2007). In Arabidopsis the activation of the CKX enzymes effectively reduces the in planta
levels of most of the bacterially produced cytokinins, but they are unable to efficiently
degrade cZ and 2MeScZ. The CKX enzymes of Nicotiana tabacum, however, are
ineffective against 2-iP (Pertry et al., 2009). Thus, with the strategy of producing a
cytokinin mixture, some bacterial cytokinins will always be able to accumulate in the
infected plant tissues. The R. fascians cytokinin mixture also modulates the sensitivity of
the plant for those morphogens. In Arabidopsis, when infection by the bacteria occurs, the
secreted cytokinins are perceived by two of the three cytokinin receptors, the
ARABIDOPSIS HISTIDINE KINASES (AHK). At the onset of the interaction, 2-iP

Introduction
9
strongly accumulates and the upregulation of the AHK3 and especially AHK4 receptor
genes occurs. Consequently, even with a relatively low amount of secreted cytokinins, the
cytokinin sensitivity of the plant is the highest when symptoms need to be initiated (Pertry
et al., 2009; Pertry et al., 2010). Finally, adding to the efficiency of producing a cytokinin
mixture, the equimolar mix of the six cytokinins proved to have a stronger effect than an
equal final concentration of the individual molecules in different bioassays (Pertry et al.,
2009; Stes et al., 2011). R. fascians produces its cytokinins in a very controlled and
dynamic way. In the initiation process it secretes mainly high amounts of 2-iP, tZ and cZ
and later it produces a maintenance flow consisting of tZ, 2MeStZ, cZ and 2MeScZ (Pertry
et al., 2010).
During the endophytic colonization, the bacteria undergo a series of adaptations. In order
to adapt to the new environment, the intercellular spaces of plant tissues, their cell wall is
modulated (Cornelis et al., 2001) or lost (Lacey, 1961) and their metabolism shifts to the
use of C2 compounds (Forizs et al., 2009; Vereecke et al., 2002a; Vereecke et al., 2002b).
While the epiphytic bacterial subpopulation triggers the onset of symptoms development,
the maintenance of the symptoms depends on the endophytic population (Stes et al., 2011).
C. Glycosyltransferase (GT1), a novel player in the pathology of R. fascians
The molecular identification of the R. fascians virulence determinants started in 1988 with
the elimination of both plasmids from strain D188 (Desomer et al., 1988). Recently, a large
collection of mutants from this strain has been generated by transposon mutagenesis in the
laboratory of Professor Jaziri at the Université Libre de Bruxelles. R. fascians shifts its
metabolism during the interaction with plants from the Krebs cycle to the glyoxylate shunt,
which allows the bacteria to grow on C2 compounds that are thought to be enriched in
infected tissues (Forizs et al., 2009). Due to this link between the glyoxylate shunt and
virulence, the obtained mutants were screened for their ability to grow on acetate. Twenty
six mutants out of approximately 1400 screened, were unable to grow on acetate, although
their growth on rich medium was not seriously affected. From those, strain 21D5 was the
only mutant that could not induce malformations on infected plants. The mutation in 21D5
was mapped on pFiD188 (Forizs, 2012).
Sequencing of the flanking regions of the transposon located the mutation in 21D5 in a

Introduction
10
gene of unique region U2 of pFiD188 (Forizs, 2012). Interestingly, this region had not
been associated with pathogenicity before. In the mutant library, three additional strains,
45F10, 41H2 and 40G10, were identified with a transposon insertion at different positions
in the same gene (Figure 1.6) (Forizs, 2012). The disrupted gene, pFi_136, encodes a
putative glycosyltransferase (GT) and was named Rf_GT1. The gene is translationally
coupled to the upstream gene, pFi_135, which encodes a putative integral membrane
protein. Based on this configuration, it was postulated that these two genes might
constitute an operon. Upstream from this putative operon, there are two genes that
comprise a two-component regulatory system: pFi_133, a putative sensor histidine kinase
and pFi_134, its cognate response regulator that has a LuxR type DNA binding domain.
These four genes have the same transcriptional orientation and are flanked by genes with
an opposite transcriptional orientation. Altogether this might indicate that they act in the
same pathway (Figure 1.6). The current hypothesis is that the sensor kinase (pFi_133)
recognizes specific environmental signals and triggers the phosphorylation of the response
regulator (pFi_134). This component will then activate de transcription of pFi_135 and
Rf_GT1 (Forizs, 2012).
Figure 1.6 Organization and homologies of the GT locus genes in R. fascians. The arrows in pFi_136 represent the location of the mutations from the different GT1 mutants
studied in this work. The mutation in 40G10 is located in the stop codon.
Besides the virulence defect, the colonies formed by 21D5 on rich LB medium had a very
different morphology compared to that of the wild-type strain D188. In liquid cultures the
mutant cells formed aggregates that precipitated in the medium. An intriguing observation
was that the colony morphology and the behavior in liquid cultures of the plasmid-free
R. fascians strain D188-5, where Rf_GT1 is also absent, was not similar to that of 21D5. It

Introduction
11
was hypothesized that other genes located on pFiD188 were involved in the production of
the matrix as substrates of Rf_GT1. D188-5 does not make those substrates of Rf_GT1, due
to the fact that it does not possess pFiD188, and the pathway cannot be deregulated as in
21D5 (Forizs, 2012).
GTs are a large family of enzymes responsible for diverse transglycosylation reactions,
involved in the biosynthesis of oligosaccharides, polysaccharides, and glycoconjugates
(Berg et al., 2007; Taniguchi et al., 2002). Many of these compounds are cell wall
components (Badreddine et al., 2008; Schaeffer et al., 1999; Wagner and Pesnot, 2010)
that are critical not only in the maintenance of the structural integrity of cell membranes,
but also in the modulation of molecular recognition events (Albesa-Jové et al., 2014).
Obtaining a high level of expression, purification and crystallization were the main
bottlenecks in the crystal structure determination for GT enzymes, but eventually two
structural super-families were identified: GT-A and GT-B. When compared with other
protein sequences, Rf-GT1 belongs to the B-fold GTs which consists of two separated
Rossmann domains with a connecting linker region and a catalytic site located between
these domains (Figure 1.7). Typically, the two Rossmann domains have a high structural
homology, but a minimal sequence homology (Hu et al., 2003).
Figure 1.7 The protein structure of Escherichia coli MurG, a typical B-fold GT, in
complex with its donor substrate, UDP-GlcNAc (Hu et al., 2003).

Introduction
12
Nevertheless, some of the conserved amino acid residues are thought to be important for
catalysis in GT-B glycosyltransferases. When aligning the R. fascians GT1 and related
GTs from other organisms, such as Streptomyces vitaminophilus, S. niveus, and
Mycobacterium smegmatis, with MurG of E. coli (Guerin et al., 2007), conserved glutamic
acid, proline, and glycine residues could be identified in the R. fascians enzyme
(Figure 1.8).
Figure 1.8 Sequence alignment of selected GT-B superfamily members. Conserved residues are boxed in grey and transposon mutations in R. fascians in black. The
sequence accession numbers are: P17443 of E. coli, WP_015586190 of R. fascians,
WP_018382616.1 of S. vitaminophilus), WP_023538738 of S. niveus), and 2GEJ_A of
M. smegmatis.
Another classification system based on amino acid sequence similarities has been proposed
for GT function prediction (Campbell et al., 1997; Coutinho et al., 2003). With this
sequence-based classification method 92 GT families have been identified. GTs belonging
to family 1, to which the protein encoded by pFi_136 of R. fascians belongs, are named
GT1 and are typically responsible for the transfer of a saccharide from a glycosyl donor to
an acceptor, that can be another saccharide, a protein, a peptide, a lipid or a secondary
metabolite (Wagner and Pesnot, 2010).
- - - M S K T L I V T N D F P P R - - - - - - - - - - - - - - - - Q G G I E T F V L A L A H R L P P Majority
10 20 30 40 50
M S G Q G K R L M V M A G G - - - - - - - - - - - - - - - - - - - T G G H V F P G L A V A H H L M A 1 P17443.3
- - - M S R T L I V T N D F P P R - - - - - - - - - - - - - - - - Q G G I E T F A S E M A H R F P S 1 WP_015586190.1
- - - M D K T L I V T N D F P P R - - - - - - - - - - - - - - - - P G G I Q A F V H C L A L Q L D P 1 WP_018382616.1
- - - M S S T L V I T N D F P P R - - - - - - - - - - - - - - - - Q G G I E T F V H A L T S R L P P 1 WP_023538738.1
M G S S H H H H H H S S G L V P R G S H M R I G M V C P Y S F D V P G G V Q S H V L Q L A E V L R D 1 2GEJ
X - - Q V V V Y A S A E R G - - - - A A A Y D A G L P F P V V R D R S R T L L P T G R V T R R A V R Majority
60 70 80 90 100
Q G W Q V R W L G T A D R - - - - - - - - M E A D L V P K H G I E I D F I R I S G L R G K G I K A L 32 P17443.3
E - - S I V V Y T S A E R G - - - - A A A Y D A S L P F L V I R D R S R T L L P T G R V M R R A G R 32 WP_015586190.1
K - - Q V V V Y A S T T K D T A E - V A R F D A G Q P F P V V R D R S R V L L P S R R V T R R A V R 32 WP_018382616.1
D - - R V V V Y T S S E P G - - - - A A A Y D A T L P F P V V R D R A H T L L P T A R V T R T A R E 32 WP_023538738.1
A G H E V S V L A P A S P H V K L P D Y V V S G G K A V P I P Y N G S V A R L R F G P A T H R K V K 51 2GEJ
I A R E H G C D X V W F G A A A P L G L M A P A L R X G G X G R I V A T T H G H E A W W A X L P V T Majority
110 120 130 140 150
I A A P L R I F N A W R Q A R A I M K A Y K P D V V L G - M G G Y V S G P G G L A A W S L G I P V V 74 P17443.3
I A L E H G C D T A W I A A A A P L G L I A P A L R A C G V K R V V A T T H G H E T W W A K V P L T 76 WP_015586190.1
L L R E H G C S S V W F G A A A P L G L M A P A L R E A G A R R I V A T T H G H E A G W A A L P V T 79 WP_018382616.1
T A R S H G C D R V W F G A A A P L A Y M A P E L R N G G I R R M V A T T H G H E I W W A R T P G A 76 WP_023538738.1
K W I A E G D F D V L H I H E P N A P S L S M L A L Q A A E G P I V A T F H T S T T K S L T L S V F 101 2GEJ
R Q X L R R I G X X V D V V T A L G E Y T R S R I A P A L G P D A A - - M V R L X P G V D A A X F A Majority
160 170 180 190 200
L H E Q N G I A G L T N K W L A K I A T K V M Q A F P G A F P N A E - - - V V G N P - V R T D V L A 123 P17443.3
R W G L H T I G R W V D V L T Y I S G H T Y R A I L P A V T P D T A - - L V R L S P G V D V E Q F N 126 WP_015586190.1
R Q L L R R I G D G V D T V T F L G E Y T R S R I A P A L S P R A A G A M V R L T P G V E A E L F H 129 WP_018382616.1
R Q V L R R V G A H V D V V T Y L G E Y T R S R I A P A L G P G A R - - M S R L V P G V D A A M F R 126 WP_023538738.1
Q G I L R P Y H E K I I G R I A V S D L A R R W Q M E A L G S D A V - - - - E I P N G V D V A S F A 151 2GEJ
P X R - - - - - X A V L D R X R L X G R X V I V C V S R L V P R K G Q D V L I R A L P X V L A R V P Majority
210 220 230 240 250
L P - - - - - - - - - L P Q Q R L A G R E G P V R V L V V G G S Q G A R I L N Q T M P Q V A A K L G 169 P17443.3
P V R G S - - - V A G P D P S P D G N S G V I V C T A R L V P R K G Q D S L I R A L P A V L E R H P 174 WP_015586190.1
P G V D R - - - Q A V R D R L R L S T R P V V V C V S R L V P R K G Q D T L I R A W P R V L A R V P 179 WP_018382616.1
P D R A A S C A R D V R D R H G I R G K K I I L C V S R L V T R K G Q D V L I R A L P L I R R S V P 174 WP_023538738.1
D - - - - - - - A P L L D G Y P R E G R T V L F L G R Y D E P R K G M A V L L A A L P K L V A R F P 197 2GEJ
D A V L L V V G X G P D E R R L R E L A R T X A G - - A V R F X G G V P H T E X A S X Y A A A D V F Majority
260 270 280 290 300
D S V T I W H Q S G K G S Q Q S V E Q A Y A E A G - - - - - Q P - Q H K V T E F I D D M A A A Y A W 210 P17443.3
D T T L L L V G D G P D R R R L Q R L A R T K G V E N A V T F V G G L P H E L V A Q V L A G A T I F 221 WP_015586190.1
D A V L L V V G G G P G L R R L E R L A E T A G V R E A V R F T G E V P W T E L P A H Y A A G D V F 226 WP_018382616.1
D A V L V V V G Q G P D E R R L R A L A R R H A P - G A V V F A G G R S H T E T A S Y Y A A A D V F 224 WP_023538738.1
D V E I L I V G R G - D E D E L R E Q A G D L A G - - H L R F L G Q V D D A T K A S A M R S A D V Y 240 2GEJ
A M P C R T R L G G L E V E G L G I V Y L E A S A X G L P V V A G D S G G A P D A V L D G R T G Y V Majority
310 320 330 340 350
A D V V V C R S G A L T V S E I A A A G L P A L F V P F Q H K D R Q Q Y W N A L P L E K A G A A K I 254 P17443.3
A M P C R T R R L G L E E E G L G I A Y L E A S A M G L P I I A G D S G G A P E T V Q A G R T G Y V 271 WP_015586190.1
A M P C R T R L R G L D V E G L G I V Y L E A S A T G L P V I A G D S G G A P D A V L Q G E T G Y V 276 WP_018382616.1
A M P C R T R K G G L E A E G L G I V F L E A A A S G L P V V V G D S G G A P D A V L D G R T G H V 273 WP_023538738.1
C A P - H - - L G G - - - E S F G I V L V E A M A A G T A V V A S D L D A F R R V L A D G D A G R L 287 2GEJ
V X G X - - D V D S V A X A L V G L L D D P X L A R A M G E R G R S W V X A X W R W X X X A S R L A Majority
360 370 380 390 400
I E Q P Q L S V D A V A N T L A G W S R E T L L T M A E R A R A A S I P D A T E R V A N E V S R V A 304 P17443.3
V K - - - - D V E Q L T Q A I V E L L D N P V R A R A M G E R G R S W V A A Q W T W N T A Y S T L L 321 WP_015586190.1
V R G G - - S P A S V A E R V V E L L D D P G L R R R M G E R G R S W V E E S W R W D R L A Q R L A 326 WP_018382616.1
V D G T - - D V P S V A R T L T T L L L A P E R A G A M G E A G R R W V S E E W S W E A S A R R L T 323 WP_023538738.1
V P V D - - D A D G M A A A L I G I L E D D Q L R A G Y V A R A S E R V H R - Y D W S V V S A Q I M 331 2GEJ
R A L - P - - - - - - - - - - - - - - N R - - T P - - - - Majority
410 420
R A 354 P17443.3
T A L F P N V - - - - - - - L A D G Q D R S S T P Q Q 367 WP_015586190.1
A L L 374 WP_018382616.1
R L L T P - - - - - - - - - - - - - E N T R T T P 371 WP_023538738.1
R V Y E T V S G A G I K V Q V S G A A N R D E T A G E S V 378 2GEJ
Decoration 'Decoration #1': Shade (with deep red at 40% fill) residues that match the Consensus exactly.
E. coli
R. fascians
S. vitaminophilus
S. niveus
M. smegmatis
E. coli
R. fascians
S. vitaminophilus
S. niveus
M. smegmatis
E. coli
R. fascians
S. vitaminophilus
S. niveus
M. smegmatis
E. coli
R. fascians
S. vitaminophilus
S. niveus
M. smegmatis
E. coli
R. fascians
S. vitaminophilus
S. niveus
M. smegmatis

Introduction
13
In pathogenic organisms, the molecules involved in host recognition, adhesion, and
colonization, as well as the antigens that target host responses are all located in the cell
wall (Albesa-Jové et al., 2014; Netea et al., 2008). The expanding bacterial sequence
dataset coupled with developments in mass spectrometry and analytical glycosciences has
identified protein glycosylation systems in most bacterial pathogens (Cuccui and Wren,
2013). Those systems have proven to be essential for viability and virulence (Cuccui and
Wren, 2013; Dover et al., 2004). As an example, in Streptococcus mutans, a mutant
defective in a GT exhibited a modified colony morphology and an impaired aggregation
(Kuramitsu, 1976; Taniguchi et al., 2010). In other pathogens as well, including
phytopathogens, protein glycosylation systems were shown to be required for biofilm
formation and virulence (Cuccui and Wren, 2013). In the pathogen Burkholderia cepacia
(Bcc), the inability to produce exopolysaccharide (EPS) was correlated with a deletion in
the bceB gene, which encodes a GT. EPS is a putative Bcc virulence factor that is involved
in bacterial persistence, interaction with antimicrobial peptides, and biofilm formation
(Bartholdson et al., 2008). Xanthomonas campestris causes citrus canker, a leaf-spotting
and fruit rind-blemishing disease that can lead to defoliation, shoot dieback and fruit drop
when conditions are highly favorable for infection (Gottwald et al., 2002). In this
pathogen, silencing of the gpsX gene, that encodes a GT, resulted in a reduction in the
amount of EPS and lipopolysaccharides (LPS) in the cell wall, defects in biofilm
formation, delayed growth, a higher sensitivity to various stress compounds, and reduced
symptoms on the host plant (Chou et al., 1997; Dow et al., 2003; Li and Wang, 2012).
Similarly, in Xanthomonas citri, another citrus pathogen causing citrus canker, the knock-
out of gpsX, also leads to a decreased biofilm formation and a reduced virulence.
Nonetheless, quantitative PCR revealed that the mutation had no effect on the expression
of the virulence genes (Li and Wang, 2012).
D. Two methyltransferases, intriguing members of the fas locus
As described above, previous studies on the fas operon identified the functions of all of the
Fas proteins in the production of the cytokinin mixture (Pertry, 2009; Pertry et al., 2010).
In between fasR, encoding the main regulator of fas gene expression, and fasA, the first
gene on the fas operon, two genes are located that are homologous to putative S-adenosyl
methionine (SAM)-dependent methyltransferases (MTRs), pFi_075 and pFi_076 (mtr1
and mtr2) (Figure 1.3) (Stes et al., 2011).

Introduction
14
These genes are conserved in the fas operon of the phytopathogen Streptomyces
turgidiscabies (Joshi and Loria, 2007) (Figure 1.9). This organism is the causative agent of
potato scab disease, a pathology that leads to significant annual losses to potato growers
world-wide. The disease symptoms, characterized by erumpent lesions on the tubers
(Figure 1.9-right), is caused by the main phytopathogenicity factor produced by
S. turgidiscabies, i.e. the toxin thaxtomin (Loria et al., 2006). Although there are no reports
for gall formation caused by this phytopathogen in nature, S. turgidiscabies has a fas
operon that strongly resembles and is largely collinear to the one of R. fascians (Figure
1.9-middle). Furthermore, infection of Nicotiana tabacum and Arabidopsis thaliana with a
thaxtomin-deficient mutant, lead to the formation of leafy galls similar with those induced
by R. fascians (Figure 1.9-left and right). Intriguingly, upstream of the fas operon of
S. turgidiscabies there are two mtr genes highly homologous to those of R. fascians (Joshi
and Loria, 2007; Kers et al., 2005) (Figure 1.9-middle). Altogether, these observations
suggest that the mtr gene products are involved in cytokinin production and/or
pathogenicity. Indeed, preliminary data revealed that mutations in the mtr genes in
R. fascians cause a complete loss of virulence (Pertry, 2009).
Figure 1.9 Organization of the fas loci of and induced symptoms by R. fascians strain
D188 (left) and S. turgidiscabies (right).
Methyltransferases are a large family of enzymes that catalyze the transfer of a methyl
group from a donor to an acceptor. Those enzymes can be divided in several subclasses
based on their structural features and used substrates. Most common are the number I
methyltransferases, encompassing by SAM-dependent enzymes with a Rossman fold (Katz
et al., 2003). SAM-dependent methyl transfers are found in different pathways and
mutations is the corresponding genes cause severe or complete impairment of regular
behavior of the organism (Struck et al., 2012).
Although it is unlikely to be the case for R. fascians, in other pathogens MTRs are often
linked to cell wall formation. In diverse plant pathogens, such as the gram-negative
Xanthomonas oryzae, Xanthomonas campestris, Pseudomonas syringae, and Ralstonia

Introduction
15
solanacearum, MTRs have been associated with the methylation of LPS (Whitfield et al.,
1997) which have been shown to be critical virulence determinants and control a number
of defense-related responses in plants (Desaki et al., 2006). It has also been suggested that
LPS are likely to be involved in the association of bacteria with plant cell walls during the
infection process (Boher et al., 1997). In the phytopathogen Xanthomonas albilineans
MTRs are important in the biosynthesis of the key pathogenicity factor, i.e. the toxin
albicidin (Birch, 2001; Hashimi and Birch, 2010). MTRs in Candida albicans, an
opportunistic pathogen, are important for the maintenance of cellular homeostasis and
regulation of intra- and interspecies interactions. It was found that those enzymes are also
important for virulence-related processes, such as adhesion and membrane transport
(Lissina et al., 2014). A gene that encodes a specialized o-methyltransferase is present in
all virulent lineages from Francisella, a bacterial human pathogen (Champion, 2011), and
therefore is assumed to be related with pathogenicity. Finally, in the gram-positive human
pathogen Mycobacterium tuberculosis, MTRs are involved in the biosynthesis of mycolic
acids, major components of the cell wall also present in the cell wall of members of the
genus Rhodococcus (Nishiuchi et al., 2000). The envelope from M. tuberculosis is partly
responsible for its resistance to antibiotics and plays a major role in the virulence and the
persistence of the pathogen (Cantaloube et al., 2011; Simeone et al., 2013).

Introduction
16

Aim of this work
17
2. Aim of this work
Despite extensive mutagenesis screens, the main pathogenicity factors of R. fascians
appeared to be linked to unique region U1 of the linear plasmid. Nevertheless, for the
majority of genes on pFiD188, the function in the life style of R. fascians remains to be
determined. Recently, two loci on pFiD188 were shown to be essential for the pathology of
the bacteria: the glycosyltransferase GT1 (pFi_136), situated in unique region U2, and two
methyltransferases mtr1 and mtr2 (pFi_075 and pFi_076), located immediately upstream
of the fas operon. Here we aim to get insight into the role of GT1 and the two MTRs in the
phytopathogenicity of R. fascians.
Preliminary data on GT1 revealed that mutants in the gene have a strong colony phenotype
and a severe loss of pathogenicity. Till today, virulence defects of R. fascians are either
linked with cytokinin production and the regulation thereof (fas, att, hyp) or with in planta
survival (vic) (Stes et al., 2012). GTs are known to glycosylate secondary metabolites. The
fas cytokinins can be considered as secondary metabolites of R. fascians and it is currently
unknown if their secretion into the environment is active or passive. Moreover, high
cytokinin concentrations are toxic for living cells (Pertry et al., 2009). Based on this
information we postulated a first working hypothesis that the GT1 mutant 21D5 is non-
pathogenic because it is defective in cytokinin production or secretion. The second
working hypothesis is based on the knowledge that R. fascians forms an epiphytic biofilm
prior to plant tissue penetration (Cornelis et al., 2001) and the finding that, in other
pathogens, GTs are important for the survival in host tissues (see Introduction). So, we
postulated that the inability of 21D5 to cause disease is the result of a severely impaired
capacity to survive on or in the plant tissues. Before testing these hypotheses, we will first
confirm the virulence defect by assessing symptom formation upon infection of Nicotiana
tabacum cv. Havana and Xanthi (seedlings, decapitated plants and leaves) and Arabidopsis
thaliana plants with strain 21D5. We will also evaluate the colony morphology on
different defined media. Both phenotypes will be compared to the wild-type strain D188
and its plasmid-free non-pathogenic derivative D188-5; virulence will also be compared to
the attenuated att mutant and the non-pathogenic fas mutant. With these experiments, we
will get insight into the behavior of the mutant 21D5. The first hypothesis will be tested by
measuring the expression of the fas and att genes in the 21D5 mutant, both in vitro and in
planta using quantitative assays and histochemical stainings. The secretion of cytokinins

Aim of this work
18
will be addressed by determining the cytokinin profile of 21D5 supernatants (in
collaboration with Petr Tarkowski, Laboratory of Growth Regulators, Palacký University,
Olomouc, Czech Republic). The secretion of the att compound by 21D5 will be verified by
assessing the inducing capacity of extracts of plant tissues infected with 21D5. To test the
second hypothesis, we will infect tobacco plants with 21D5 and quantify the endophytic
and epiphytic populations after different time points. We will also evaluate the behavior of
21D5 on the plant tissues by scanning electron microscopy. Finally, the regulation of GT1
expression will be determined by introducing a transcriptional GT1:GUS fusions into
strains D188, D188-5, D188-ΔattR, and D188-ΔfasR and performing in vitro GUS assays
with these reporter strains. As a result, we will hopefully have established how the gene is
regulated and get some insight on when and where it is expressed during the interaction
with a host.
Concerning the MTRs, their location upstream of the fas operon, their conservation in
S. turgidiscabies, and the complete loss of phytopathogenicity upon their mutation,
strongly indicate that they are involved in the biosynthesis of an essential cytokinin. Based
on their homology we postulated that the reaction product of these enzymes is a
methylated cytokinin. This hypothesis will be tested by comparing the cytokinin
production of R. fascians strains D188, D188-5, D188-fas1, the two mtr mutants D188-
mtr1 and D188-mtr2, and two S. turgidiscabies strains containing a fas operon and the mtr
genes (Aittamaa et al., 2010). Therefore, the bacteria will be grown under particular
conditions, fed with labeled precursors, and the partially purified supernatants will be
evaluated by thin layer chromatography. We will also assess the regulation of the mtr
genes both in vitro and in planta by using available translational mtr:GUS reporter strains.
As such, we hope to be able to answer the question whether methylated cytokinins are the
secret weapon of R. fascians.
Based on the obtained data on GT1 and the mtr’s we anticipate to make a considerable
contribution to the understanding of the pathogenicity process of R. fascians and to open
new research perspectives that might enable the use of R. fascians or its morphogens in
tissue culture practices or help horticulturists in safe-guarding their ornamental crops from
R. fascians.

Materials and methods
19
3. Materials and methods
3.1 Bacterial strains and growth conditions
An overview of the bacterial strains used in this study is given in Table 3.1.
The R. fascians strains were grown on Yeast Extract Broth (YEB) (5g/L beef extract
(Sigma-Aldrich, Mexico), 1g/L yeast extract (Oxoid, England), 5g/L peptone (Duchefa
Biochemie, The Netherlands), 5g/L sucrose (C12H22O11, Grand Pont®, Belgium), 500mg/L
magnesium sulfate heptahydrate (MgSO4.7H2O, purity >99%, Duchefa Biochemie, The
Netherlands) and 15g/L agar (micro agar, Lab associates, The Netherlands) when solid
medium was prepared) for two days at 28ºC. Suspension cultures were grown in 5ml liquid
YEB and grown for two days at 28ºC under gentle agitation (160 rpm). Bacterial stocks
were kept in glycerol (glycerine anhydrous, purity >95%, Duchefa Biochemie, The
Netherlands) (25% final volume) at -80ºC.
The S. turgidiscabies strains were grown on Glucose-Yeast-Malt (GYM) medium (4g/L
glucose (C6H12O6, purity >99.5%, Duchefa Biochemie, The Netherlands), 4g/L yeast
extract and 10g/L malt extract (Duchefa Biochemie, The Netherlands), pH set at 7.2 with
potassium hydroxide (KOH, purity 85%, Duchefa Biochemie, The Netherlands) and 2g/L
calcium carbonate (CaCO3, purity >99%, UCB, Belgium) and 12g/L agar when solid
medium was prepared) for three days at 28ºC. A spore solution stock was prepared to store
the S. turgidiscabies. Vegetative mycelium was plated in sporulation medium (for 500mL:
250mL solution with 10g mannitol (purity >98%, Duchefa Biochemie, The Netherlands),
10g agar and 2.5mL of 2M magnesium chloride (MgCl2, UCB, Belgium) added to 250mL
solution with 10g soy flower (local bioshop) and grown at 28ºC for seven days. The spore
solution was obtained by successive washings of the spores scraped gently with 7mL of
sterile water (3mL, 2mL and 2mL). The resulting solution was vortexed, poured over
sterile cheesecloth and centrifuged at 14 000rpm for 10min at 4ºC. The obtained pellet was
resuspended in 1mL sterile 20% glycerol at 4ºC, divided over 3 eppendorfs in aliquots of
250µL and 500µL and stored at -80ºC.
The E. coli strains were grown on Luria Broth (LB) (1g/L glucose, 10g/L tryptone
(Duchefa Biochemie, The Netherlands), 5g/L yeast extract, 10g/L sodium chloride (NaCl,
purity ≥95%, Carl Roth) and 15g/L agar when solid medium was prepared) for one day at
37ºC with agitation (160 rpm). Bacterial stocks were kept in glycerol (25% final volume)
at -80ºC.

Materials and methods
20
Ba
cteri
al st
rain
Co
nst
ruct
Vect
or
Desc
ripti
on
Use
Sele
cta
ble
ma
rker
Refe
rence
D1
88
none
Rh
odo
cocc
us
fasc
ian
s,
wild
-typ
eP
heno
typ
eD
eso
mer
et al
., 1
98
8
D1
88-5
none
Rh
odo
cocc
us
fasc
ian
s,
pla
smid
-fre
e d
eriv
ativ
eP
heno
typ
eD
eso
mer
et al
., 1
98
8
D1
88-a
tt1
pR
F3
2O
rigi
nal a
tt m
utan
t; D
18
8-a
tt1
Phe
noty
pe
Cm
(2
5µg
/ml)
Cre
spi e
t al
. 1
99
2
D1
88-f
as1
pR
F3
2O
rigi
nal f
as
mut
ant; D
18
8-f
as1
Phe
noty
pe
Cm
(2
5µg
/ml)
Cre
spi e
t al
. 1
99
2
D1
88
21
D5
Tn
inse
rtio
n m
utan
t in
GT
1 (
pF
i_1
36
) p
osi
tion
63
6; av
irul
ent
Phe
noty
pe
Km
(1
00µg
/ml)
Fo
rizs
and
Van
dep
utte
D1
88
40
G1
0T
n in
sert
ion
mut
ant in
GT
1 (
pF
i_1
36
) p
osi
tion
sto
p c
od
on;
virul
ent
Phe
noty
pe
Km
(1
00µg
/ml)
Fo
rizs
and
Van
dep
utte
D1
88
41
H2
Tn
inse
rtio
n m
utan
t in
GT
1 (
pF
i_1
36
) p
osi
tion
99
3; at
tenu
ated
Phe
noty
pe
Km
(1
00µg
/ml)
Fo
rizs
and
Van
dep
utte
D1
88
45
F1
0T
n in
sert
ion
mut
ant in
GT
1 (
pF
i_1
36
) p
osi
tion
97
5; at
tenu
ated
Phe
noty
pe
Km
(1
00µg
/ml)
Fo
rizs
and
Van
dep
utte
D1
88
pJD
GV
5p
RF
41
Rep
licat
ing
pla
smid
with
tra
nsla
tiona
l fa
sA:G
US
fus
ion
fas
oex
pre
ssio
nC
m (
25
µg/m
l)T
emm
erm
an e
t al
. 2
00
0
21
D5
pJD
GV
5p
RF
41
Rep
licat
ing
pla
smid
with
tra
nsla
tiona
l fa
sA:G
US
fus
ion
fas
oex
pre
ssio
nC
m (
25
µg/m
l)+
Km
(1
00µg
/ml)
Thi
s w
ork
D1
88
pR
FG
usT
M3
pR
F3
7R
eplic
atin
g a
ttA
:GU
Sa
tt e
xpre
ssio
nP
hleo
(1
.5µg
/ml)
Mae
s et
al.
200
1
21
D5
pR
FG
usT
M3
pR
F3
7R
eplic
atin
g a
ttA
:GU
Sa
tt e
xpre
ssio
nK
m (
10
0µg
/ml)+
Phl
eo (
1.5
µg/m
l)T
his
wo
rk
D1
88-5
pR
FG
T2
-1p
RF
37
Tra
nscr
iptio
nal f
usio
n o
f G
T1
gen
eG
T1
exp
ress
ion
Phl
eo (
1.5
µg/m
l)T
his
wo
rk
D1
88-a
tt1
pR
FG
T2
-1p
RF
37
Tra
nscr
iptio
nal f
usio
n o
f G
T1
gen
eG
T1
exp
ress
ion
Phl
eo (
1.5
µg/m
l)T
his
wo
rk
D1
88-f
as1
pR
FG
T2
-1p
RF
37
Tra
nscr
iptio
nal f
usio
n o
f G
T1
gen
eG
T1
exp
ress
ion
Phl
eo (
1.5
µg/m
l)T
his
wo
rk
D1
88
pR
FG
T2
-1p
RF
37
Tra
nscr
iptio
nal f
usio
n o
f G
T1
gen
eG
T1
exp
ress
ion
Phl
eo (
1.5
µg/m
l)T
his
wo
rk
D1
88:m
tr1
GU
Sm
tr1
GU
SC
mp
SP
72
Inte
grat
ed tra
nsla
tiona
l fus
ion
mtr
exp
ress
ion
Cm
(2
5µg
/ml)
PhD
the
sis
Ine
Per
try
D1
88:m
tr2
GU
Sm
tr2
GU
SC
mp
SP
72
Inte
grat
ed tra
nsla
tiona
l fus
ion
mtr
ex
pre
ssio
nC
m (
25
µg/m
l)P
hD the
sis
Ine
Per
try
DH
5α
none
Gen
eral
clo
ning
str
ain
Pla
smid
pre
par
atio
n
DH
5α
pJD
GV
5R
eplic
atin
g p
lasm
id w
ith tra
nsla
tiona
l fa
sA:G
US
fus
ion
fas
oex
pre
ssio
nA
mp
(1
00µg
/ml)
Tem
mer
man
et al
. 2
00
0
DH
5α
pR
FG
usT
M3
pR
F3
7R
eplic
atin
g a
ttA
:GU
Sa
tt e
xpre
ssio
nA
mp
(1
00µg
/ml)
Thi
s w
ork
DH
5α
pG
US
1-G
T2
-1p
GU
S1
Tra
nscr
iptio
nal f
usio
n o
f G
T1
gen
eG
T1
exp
ress
ion
Am
p (
10
0µg
/ml)
O.V
and
eput
te
DH
5α
pG
US
1C
loni
ng v
ecto
r fo
r tr
ansl
atio
nal G
US
fus
ions
GT
1 e
xpre
ssio
nA
mp
(1
00µg
/ml)
Pel
eman
et al
. 1
98
9
DH
5α
pR
F3
7
Bifu
nctio
nal c
loni
ng v
ecto
r E
coli/R
. fa
scia
ns
GT
1 e
xpre
ssio
nA
mp
(1
00µg
/ml)
Des
om
er e
t al
19
92
DH
5α
pR
FG
T2
-1p
RF
37
Tra
nscr
iptio
nal f
usio
n o
f G
T1
gen
eG
T1
exp
ress
ion
Am
p (
10
0µg
/ml)
Thi
s w
ork
S.
turg
idis
cab
ies
DS
M 4
199
0
Cyt
ok
inin
pro
file
Aitt
amaa
et al
. 2
01
0
S.
turg
idis
cab
ies
DS
M 4
199
7C
yto
kin
in p
rofil
eA
ittam
aa e
t al
. 2
01
0
Rhodococcus fascians S.tEscherichia coli
Tab
le 3
.1 C
har
acte
rist
ics
of
the
bac
teri
al s
trai
ns
use
d i
n t
his
work
.

Materials and methods
21
All media were prepared with purified water (Synergy UV, Milipore) and supplemented
with the following antibiotics when appropriate (Table 3.1): ampicillin (Amp) (ampicillin
sodium, purity >91%, Duchefa Biochemie, The Netherlands), chloramphenicol (Cm)
(Duchefa Biochemie, The Netherlands) phleomycin (Phleo) (Cayla, France), and
kanamycin (Km) (kanamycin monosulfate, Sigma-Aldrich).
3.2 Determination of the colony morphology
For the determination of the colony morphology the R. fascians strains were grown as
described above and washed once with sterile water. Then, serial dilutions were made from
100 till 10
-8 in sterile water. For each dilution, three spots of 10µL were placed on seven
different solid media: LB, YEB, Minimal A (10.5g/L dipotassium phosphate (K2HPO4,
purity >98% UCB, Belgium), 4.5g/L monopotassium phosphate (KH2PO4, purity >99%,
UCB, Belgium), 1g/L ammonium sulfate ((NH4)2SO4, purity >99.5%, Fluka Chemie,
Switzerland), 0.5g/L trisodium citrate (Na3C6H5O7, Duchefa Biochemie, The Netherlands),
2.5mL/L 10% magnesium sulfate heptahydrate, 2g/L glucose and 15g/L agar), and
Minimal A supplemented with uninfected plant extract (20µl/mL), leafy gall extract
(20µl/mL), pyruvate (20mM, sodium pyruvate, purity ≥99%, Sigma-Aldrich, Japan), or
pyruvate/histidine (L-histidine, purity 98%, Janssen Chimica, Belgium) (20mM and 5mM,
respectively). The filter sterilized compounds were added to the medium after autoclaving.
Overview pictures were taken using a Canon OS 50D camera and detailed images were
obtained using a binocular with LED light and the ProRes®CapturePro 2.8 software.
3.3 Plant material and growth conditions
Nicotiana tabacum cv. Havana and N. tabacum cv. Xanthi were grown in Murashige and
Skoog (MS) medium (8g/L agar, 20g/L sucrose, 0.5g/L MES monohydrate (2-(N-
Morpholino)ethanesulfonic acid, purity >99%, Duchefa Biochemie, The Netherlands),
0.1g/L myo-inositol (purity >97%, Duchefa Biochemie, The Netherlands); 4.4g/L MS salts
(Duchefa Biochemie, The Netherlands), pH set at 5.7 with potassium hydroxide). Seeds
were rinsed in sterile water and then submerged in 70% ethanol (C2H6O, purity 96%,
Fiers) for 2min, 5% sodium hypochlorite (NaClO, local supermarket) with 0.05%
Tween®80 (Ferak, Berlin) for 10min, rinsed again with sterile water three times, dried on
sterile filter paper and kept in the dark.

Materials and methods
22
Arabidopsis thaliana accession Col-0 was grown in ½ MS medium (identical to MS
medium except for 10g/L sucrose and 2.2g/L MS salts). Seeds were submerged in 70%
ethanol for 2min, 5% sodium hypochlorite with 0.05% Tween for 10min, 100% ethanol for
2 min, dried on sterile filter paper and kept in the dark.
For germination, seeds were placed in petri dishes with appropriate medium, vernalized for
3d at 4°C in the dark and then transferred to a growth chamber at 23ºC; with a light/dark
cycle of 18/6 hours (Galbraith et al., 1995).
3.4 Infection procedures
The R. fascians strains were grown as described, collected by centrifugation, washed once
with sterile water and concentrated 4 times. For all procedures, inoculation with water was
used as a negative control. Infections with the wild-type strain D188 and its plasmid-free
derivative D188-5 were used as references.
For N. tabacum, different infection procedures were followed to allow a quantification of
the virulence of the different R. fascians strain. Seedlings were infected after radicle
emergence (7d in growth chamber) with a drop of 20µL from each bacterial solution or
water. Seedlings exhibiting normal growth, intermediate growth inhibition and full growth
inhibition were scored at 24 and 45d after infection according to Pertry (2009). Three-
week old N. tabacum cv. Xanthi plants were decapitated and infected with a drop of
R. fascians solution or water. Leaves from three-week old plants were excised, placed on
MS medium and infected with four drops of 10µL from each bacterial solution or water.
The assay was done on wounded and intact leaves. For both experiments photos were
taken 28d after the infection. Finally, for infection by dipping, plants or excised leaves
were submerged in a washed R. fascians solution and placed on the appropriate medium.
14d-old Arabidopsis thaliana Col-0 plants were infected by placing 20µL of washed
R. fascians culture in the heart of the rosette. Growth inhibition, anthocyanin
accumulation, and serrated leaves were considered as symptoms. Symptomatic plants, non-
symptomatic plants, and plants with axillary meristem activation were scored at 7, 14, 21
and 28d after infection. The number of shoots formed from activated axillary meristems
was evaluated, under the binocular, 10d after infection.

Materials and methods
23
3.5 SEM analysis
Epiphytic colonization was visualized by scanning electron microscopy (SEM). For this
purpose R. fascians strains were grown as described above and 3-week old N. tabacum cv.
Xanthi leaves were infected by dipping. After 7 weeks, the leaves were divided in sections
and samples were analyzed with a Tabletop Microscope TM-1000 (Hitachi) without
sample processing. Images were taken with the accompanying software.
3.6 Preparation of plant extracts
Infected plants or tissues were collected and macerated in a mortar using a pestle. The
obtained pulp was collected in eppendorfs and centrifuged at 14 000rpm for 15min. The
supernatant was collected, filter sterilized (0.45µm membrane, Chem-Lab), and stored at -
20ºC until further use.
3.7 Transformation procedures and plasmid preparation
Constructs or ligation mixtures were introduced into available competent E. coli DH5α
cells by heat shock transformation. Therefore, aliquots of competent cells were thaw,
placed on ice, 100ng of the desired DNA added, and incubated on ice for 30min. Then
cells were exposed to 42ºC for 30sec, placed back on ice, 300µL of SOC medium (Super
Optimal Broth with Catabolite repression) (2% tryptone, 0.5% yeast extract, 10mM
sodium chloride, 2.5mM potassium chloride (RPL, Belgium), 10mM MgCl2, 10mM
magnesium sulfate, and 20mM glucose) was added and the bacteria were placed at 37ºC
for 60min. A 100µL-aliquot of the transformed bacteria was plated on LB with the
appropriate antibiotics in triplicate and left at 37ºC overnight. At least six E. coli clones
were subsequently grown on LB with the appropriate antibiotics at 37ºC overnight for
plasmid preparation and construct verification. The plasmid preparations were done using
the Pure YieldTM Plasmid Miniprep System by Promega.
R. fascians was transformed by electroporation. For this procedure the desired DNA was
dialyzed for 1h on a Millipore membrane VS (0.025µm) and in the meantime, 0.2cm
electrode gap electroporation cuvettes (BioRad) were cooled on ice. Bacteria were grown
as described above, washed three times with ice cold sterile water, resuspended in the

Materials and methods
24
initial volume, and placed on ice. 400µL-aliquots from these cells were transformed with
7µL (containing aprox. 1µg DNA) of dialyzed DNA using a Gene Pulser Xcell™ (Bio-
Rad) with a voltage of 2500V, a capacity of 25µF, and a resistance of 400Ω. After the
electroporation, 600µL of YEB was added to the bacteria and the mixture placed at 28ºC
for 4h. 300µL-samples of the bacteria were plated in triplicate on YEB with the adequate
antibiotics and placed at 28ºC until growth was observed (around 7d). At least six
R. fascians clones were grown in YEB with the appropriate antibiotics at 28ºC for two
days for further analysis or use.
3.8 In vitro expression analysis
R. fascians was grown as described above, washed with Induction medium (IM) (3.875g/L
Gamborg B5 salts (Duchefa Biochemie, The Netherlands), 500mg/L MES monohydrate,
250mg/L ammonium nitrate (NH4NO3, purity >97.5%, Duchefa Biochemie, The
Netherlands) and pH set at 5.5 with potassium hydroxide) and resuspended in the initial
volume. For GT1, mtr1, and mtr2 expression, bacterial cultures were concentrated 5 times
in order to use a high bacteria concentration (2 times diluted as final concentration). In 24-
well plates (VWR), the filter sterilized desired inducers, 900µL IM and 100µL-aliquots of
washed bacteria were mixed and incubated at 28ºC overnight with agitation (100 rpm). The
inducers used throughout the experiments were: 20mM pyruvate, 20mM histidine, 20mM
sucrose, 20µl/mL uninfected plant extracts, 20µl/mL leafy gall extracts, (D-frutose
(C6H12O6, purity ≥ 99%, Fluka Chemie, Switzerland), 20mM citrate (trisodium citrate),
20mM fumarate (fumaric acid purity >99.5%, Fluka Chemie, Switzerland; pH set at 6 with
1M sodium hydroxide, measured with Universal Indicator Strips pH 0-14, Merck,
Germany), 20mM malate (maleic acid, purity ≥99%, Sigma-Aldrich, United States of
America; pH set at 7 with 1M sodium hydroxide), 20mM acetate (sodium acetate, purity
>99%, Anala®, England), or 20mM succinate (succinic acid disodium salt hexahydrate,
ICN Biomedicals Inc., United States of America; pH set at 7 with 1M sodium hydroxide).
3.8.1 att expression
For analysis of the att expression, cells were collected (2min centrifugation at 13000rpm,
Microcentrifuge Eppendorf, 5417C, Rotor F45-30-10) and resuspended in 1mL of GUS
buffer (for 50mL: 50mM sodium phosphate buffer pH=7.5 (in 100mL: 28mL 1M
dipotassium phosphate and 72mL 1M monopotassium phosphate), 100µL 0.5M EDTA,

Materials and methods
25
40µL 10mM β-mercaptoethanol (purity ≥99%, Fluka, Germany), 50µL 10% SDS (sodium
dodecyl sulfate, purity >99%, Duchefa Biochemie, The Netherlands). A 100-µL sample
was collected to determine the optical density at 600nm by diluting the solution twice with
sterile water in a 96-well plate (NuncTM
, Denmark)(Tunable microplate reader
VERSAmax, Molecular devices). Then, 30µL of chloroform (purity 99.2%, VWR) was
added to permeabilize the membrane of the cells and after 5min the reaction was started by
adding the substrate, 1µL of 1M pNPG (p-nitrophenyl-β-D-glucuronide, purity ≥99%,
Duchefa Biochemie, The Netherlands). The mixture was homogenized by inverting and
incubated at 37ºC. The reactions were stopped with the addition of 400µL of 2-amino-2-
methyl-1,3-propanediol (purity ≥99%, Sigma-Aldrich, Germany) when a clear yellow
color was observed; the time was registered. After centrifugation (2min at 13000rpm), the
optical density at 415nm of the supernatant was measured in 96-well plates. The -
glucuronidase (GUS) activity was calculated using the following formula:
OD415nm/(OD600nm*dilution*time(min))*1000.
3.8.2 fas, GT1, mtr1 and mtr2 expression
For analysis of the fas, GT1, and mtr1 and mtr2 expression the more sensitive MUG assay
was used, which is more suitable for genes with a low expression. The cells were collected
(2min centrifugation at 13000rpm) and resuspended in 1mL of MUG buffer (for 200mL:
50mM sodium phosphate pH=7, 160µL 10mM β-mercaptoethanol, 4mL 10mM EDTA,
2mL 10% SDS and 200µL 0.1% Triton X-100 (Acros organics, Belgium)). A 100µL-
sample was taken to determine the optical density at 600nm by diluting the solution twice
with sterile water in 96-well plates. The reaction was started by adding the substrate, 10µL
of 100mM MUG (4-methylumbelliferyl-β-D-glucuronide, purity ≥99%, Sigma-Aldrich,
UK) dissolved in DMSO (dimethyl sulfoxide, C2H6OS, purity >99.9%, Duchefa
Biochemie, The Netherlands), inverting and incubating at 37ºC. The reaction was stopped
at different time points (15, 30, and 60min) by taking 50µL-samples of the reaction
mixture and adding it to 200µL of 200mM sodium carbonate (Na2CO3, purity ≥99.5%,
Normapur®, France) in black Nunc Polysorb 96-well plates (ThermoFischer Scientific).
The emitted fluorescence was measured after excitation at 355nm and emission at 460nm
(FLUOstar OPTIMA reader, Isogen). The MUG activity was calculated using the
following formula: fluorescence/(OD600nm*dilution*time(min))*1000.

Materials and methods
26
3.9 In planta expression analysis
3.9.1 Quantitative in planta expression analysis
To determine the att, fas, GT1, and mtr1 and mtr2 expression on the plant, 3-week old
N. tabacum plants were infected by dipping in the appropriate bacterial suspension. After
7d, the leaves were crushed in eppendorf tubes and 500µL of sterile water was added. 10-
µL-samples were taken from the plant extract and 490µL of sterile water was added as a
start for 8 serial 10-fold dilutions to determine the colony forming units (CFUs). For in
planta gene expression, 500µL of 2-times concentrated MUG buffer (100mM sodium
phosphate (pH=7.0), 20mM β-mercaptoethanol, 20mM EDTA, 0.2% SDS) was added to
the remaining plant extract. These mixtures were homogenized by vortexing and 10µL of
100mM MUG was added to start the reaction. The reaction mixtures were incubated at
37ºC and the reaction was stopped at 15, 30 and 60min by adding 50µL-samples of the
reaction mixtures to 200µL of 200mM sodium carbonate in black Nunc Polysorb 96-well
plates (ThermoFischer Scientific). Excitation at 365nm and measurement at 460nm was
performed (FLUOstar OPTIMA reader, Isogen) and -glucuronidase (GUS) activity was
calculated as the measured emission/[time(min)*log(CFU)]. The presented results are the
average of four biological repeats.
In order to bring the in planta mtr expression in vitro, excised leaves and complete plants
were infected by dipping with D188-mtr1. After 7d, the plant material was either crushed
or cut in small pieces and placed in 1mL IM medium. In some of the cases 100-µL aliquots
of D188-mtr1 cells grown in vitro were added to evaluate if in these cells mtr1 gene
expression could be activated. The expression analysis was as described above with MUG
as a substrate. In these experiments, no normalization to OD600 or CFU was done, so the
emitted fluorescence was, therefore, used as an approximation of the gene expression.
3.9.2 Histochemical in planta expression analysis
In order to locate the gene expression in planta, 3 week-old plants were infected by
dipping. After 7d, plants were immerged in 90% acetone (C3H6O, purity ≥99.7%, Carl
Roth) for 30min, washed three times with phosphate buffer (NaPO4) (pH=7.2) and placed
in 6 well-plates. Plants were submerged in staining buffer (50mM sodium phosphate buffer
pH 7.2, 0.2% Triton X-100, 5mM potassium ferrocyanide (K4Fe(CN)6.3H2O, Sigma-
Aldrich, Japan), 5mM potassium ferricyanide (K3Fe(CN)6, purity 99.8%, Sigma-Aldrich,

Materials and methods
27
Germany), 2mM X-gluc (purity ≥97%, Carl Roth)) and plates were covered with
aluminum foil and left at 37ºC overnight. The staining buffer was replaced for 70% ethanol
and the plates were placed at room temperature with low agitation (50rpm) until all the
chlorophyll was extracted from the plant tissues. Gene expression was visible as a blue
precipitate.
3.10 In planta survival
Complete 4 week-old tobacco plants were infected by dipping with the desired bacterial
suspension. The CFUs of the total and the endophytic populations per gram fresh weight
(FW) plant tissue were determined at different time points after infection: 2, 7, and 21d.
Therefore, a minimum of four leaves was collected, divided in two, and their weight was
measured. One half of each leaf was immersed in 6% sodium hypochloride for 1min and
washed twice with sterile water; the other half was not treated. The resulting tissues were
crushed and 10µL of the tissue fluid was diluted 100 times in sterile water. Serial dilutions
from these tissue extracts were plated on YEB medium, the number of colonies counted,
and the CFU’s per gram of fresh plant tissue was calculated and logarithmically
transformed.
3.11 Cloning of GT1:GUS fusions
A construct with a transcriptional fusion of GT1 with GUS, pGUS1-GT2-1, was available
in the E. coli vector pGUS1 (O. Vandeputte). To allow its introduction into R. fascians, the
fusion were cloned in the bifunctional vector pRF37 which replicates both in E. coli and
R. fascians (Figure 3.1.A). For this purpose the fusion was isolated from the construct and
the vector pRF37 was linearized with the restriction enzymes HindIII (10U/µL,
InvitrogenTM
) and XbaI (20U/µL, Biolabs, New England). The reaction mixtures
contained: 20µL sterile water, 3µL NEBuffer 2.1 (Biolabs, New England), 1µg DNA and
1µL of each enzyme, and was placed at 37ºC for 60min. Then, 1µL GelRed (Biotium, Inc.)
and 4µL LD (Blue Loading Dye, Promega, United States of America) was added to each
sample. The fragments were subsequently separated by agarose gel electrophoresis (i-
Mupid®, Japan): 1% agarose (InvitrogenTM
, UK) in 0.5x TAE buffer buffer (242g/L Tris,
51.7mL/L acetic acid, 100mL/L dissodic EDTA), the same running buffer, at 100V, for
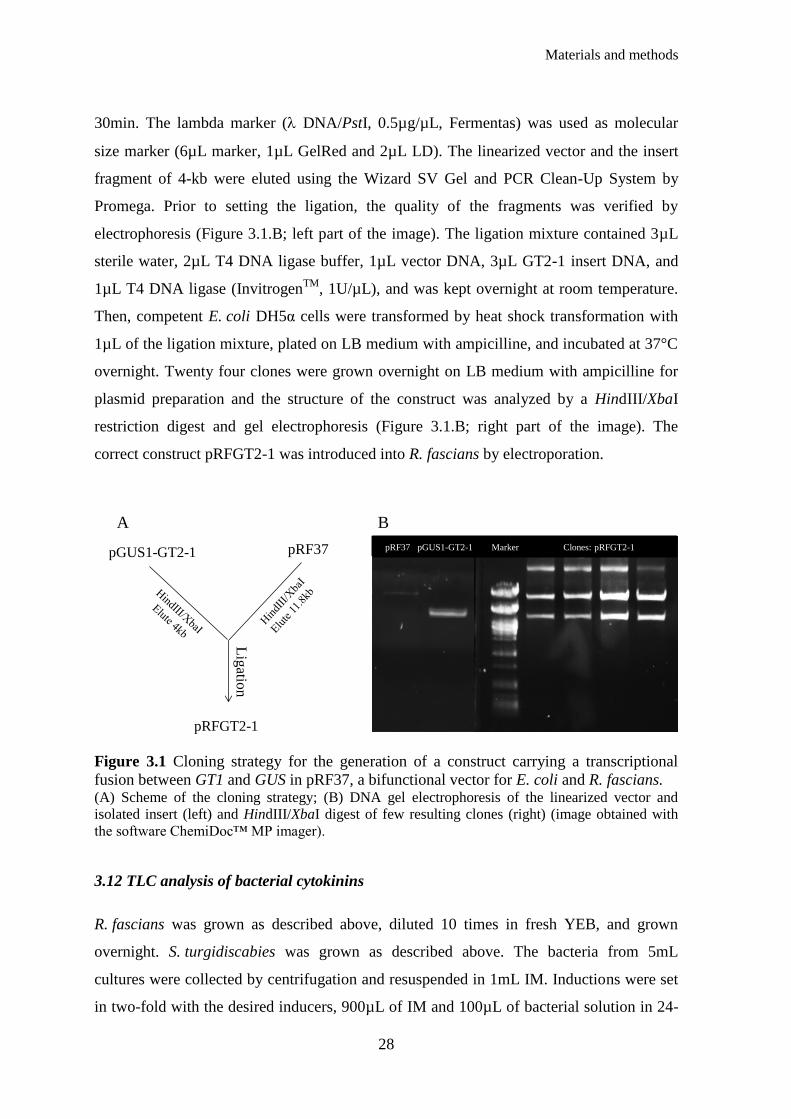
Materials and methods
28
30min. The lambda marker ( DNA/PstI, 0.5µg/µL, Fermentas) was used as molecular
size marker (6µL marker, 1µL GelRed and 2µL LD). The linearized vector and the insert
fragment of 4-kb were eluted using the Wizard SV Gel and PCR Clean-Up System by
Promega. Prior to setting the ligation, the quality of the fragments was verified by
electrophoresis (Figure 3.1.B; left part of the image). The ligation mixture contained 3µL
sterile water, 2µL T4 DNA ligase buffer, 1µL vector DNA, 3µL GT2-1 insert DNA, and
1µL T4 DNA ligase (InvitrogenTM
, 1U/µL), and was kept overnight at room temperature.
Then, competent E. coli DH5α cells were transformed by heat shock transformation with
1µL of the ligation mixture, plated on LB medium with ampicilline, and incubated at 37°C
overnight. Twenty four clones were grown overnight on LB medium with ampicilline for
plasmid preparation and the structure of the construct was analyzed by a HindIII/XbaI
restriction digest and gel electrophoresis (Figure 3.1.B; right part of the image). The
correct construct pRFGT2-1 was introduced into R. fascians by electroporation.
Figure 3.1 Cloning strategy for the generation of a construct carrying a transcriptional
fusion between GT1 and GUS in pRF37, a bifunctional vector for E. coli and R. fascians. (A) Scheme of the cloning strategy; (B) DNA gel electrophoresis of the linearized vector and
isolated insert (left) and HindIII/XbaI digest of few resulting clones (right) (image obtained with
the software ChemiDoc™ MP imager).
3.12 TLC analysis of bacterial cytokinins
R. fascians was grown as described above, diluted 10 times in fresh YEB, and grown
overnight. S. turgidiscabies was grown as described above. The bacteria from 5mL
cultures were collected by centrifugation and resuspended in 1mL IM. Inductions were set
in two-fold with the desired inducers, 900µL of IM and 100µL of bacterial solution in 24-
Lig
ation
pRF37 pGUS GT1-1 Marker clones: pRF37 GT1-1
pRF37 GT1-1
pGUS GT1-1 pRF37
A B
pRF37 pGUS1-GT2-1 Marker Clones: pRFGT2-1pGUS1-GT2-1
pRFGT2-1

Materials and methods
29
well plates. After 2h of growth at 28ºC with agitation, either 2.5µCi of 14
C labelled adenine
(3301 Adenine [14
C(U)]hydrochloride, specific activity 238mCi/mL, purity 99%, ARC,
United States of America) or 2.5µCi SAM (0344 Adenosyl-L-methionine, S-[methyl-14
C],
specific activity 55mCi/mL, purity 99%, ARC, United States of America) were added and
incubated overnight at 28ºC with agitation. Then, the induced cultures were collected in
eppendorfs and centrifuged at 16 000rpm for 10min; both the pellet and the supernatants
were kept for further processing. The supernatants were acidified with TFA
(Trifluoroacetic acid, purity ≥99.9%, Carl Roth) (0.1% final volume). Sep-Pak Waters C18
Classic cartridges (Waters, Ireland) were activated with 3mL 100% methanol (CH4O,
purity>99.9%, Fluka, Germany) and equilibrated with 5mL 0.1% TFA in water. The
acidified samples were loaded on the cartridges (maximum speed 1mL/min), washed with
6mL 0.01% TFA in water, and eluted with 6mL 80% methanol. The eluate was dried under
vacuum (Speed Vac Concentrator, Savant) and resuspended in 30µL of a mixture of 0.1%
TFA and 15% methanol in water. For the collected pellet, a volume of 100µL water and
100µL butanol (C4H9OH, purity 99.5%, Carl Roth) was added and the suspension was
vigorously shaken for 60min. These suspensions were centrifuged at 16 000rpm for 10min,
the upper butanolic phases collected, dried under vacuum, and the resulting fraction
resuspended in 30µL of a mixture of 0.1% TFA and 15% methanol in water. Before use,
the TLCs (Thin Layer Chromatography, Polygram Sil G/UV254, 20*20cm, Machery-
Nagel) were washed with 100% methanol for 30min with slow shaking and dried to the air.
In a first TLC, a volume of 10µL from each sample was loaded; the second TLC was
loaded with the remaining 20µL (in 5µL-aliquots). Then, the TLCs were developed for 6h
with a mobile phase consisting of the upper organic phase from butanol/water/ammonia
25% (purity 25%, RPL, Belgium) (4/2/1); the second TLCs were developed a second time
with the same mobile phase for another 6h. The TLCs were air dried and placed in
phosphor-imager cassette (445 SI, Molecular Dynamics) overnight. The banding pattern
was visualized with the Image Quant software package. Only the results of the second
TLCs are shown in the Results section.

Materials and methods
30

Results
31
4. Results
A. Functional analysis of the glycosyltransferase GT1
4.A.1. The colony morphology of R. fascians is defined by the medium composition and
modified in the GT1 mutant 21D5
The 21D5 mutant has been identified in a collection of transposon mutants of the wild-type
R. fascians strain D188 based on its growth impairment in LB medium supplemented with
acetate (Forizs, 2012). As a first step to understand if the observed modified colony
morphology has biological relevance for the interaction with the host, the development of
single colonies obtained through serial dilutions of R. fascians strain D188, its plasmid-
free derivative D188-5 and mutant 21D5 was evaluated and compared on different media.
On the one hand we tested the bacterial behavior on rich media, such as LB and YEB. On
the other hand, since virulence gene expression can be induced under particular conditions
mimicking the plant tissue environment (Temmerman et al., 2000), we also tested minimal
medium supplemented or not with pyruvate, histidine, and extracts of non-infected plants
and of leafy galls.
As shown in Figure 4.1, the medium composition had a strong impact on the colony
morphology of all three strains. Although the colony diameter of strain D188-5 was
generally half that of strain D188, the overall appearance of the colonies on rich media and
minimal medium supplemented with plant-derived extracts was comparable for both
strains: the bright orange-yellow colonies were convex and smooth and had a sharp edge
(Figure 4.1). On the minimal media without plant-derived extracts, the colonies of D188-5
and D188 looked very different: their color was less pronounced and their surface appeared
more fuzzy or rough, but the most striking characteristic was the elaboration of a thin
protrusion layer surrounding the colonies. For strain D188 this protrusion layer was less
pronounced than for strain D188-5; in the presence of histidine/pyruvate it was even
almost absent (Figure 4.1).
The colony morphology of mutant 21D5 on LB medium confirmed the observations made
by Forizs (2012) and resembled that of D188-5 and D188 on minimal media: the colonies

Results
32
were pale with a fuzzy and rough surface and had a broad protrusion layer. On YEB, the
colonies appeared very rough and flat and had a whitish yellow color. Whereas the colony
morphology of 21D5 on minimal medium supplemented with leafy gall extract was
comparable to that on the rich media, surprisingly, the morphology was largely restored to
that of the wild-type in minimal medium supplemented with non-infected plant extract
(Figure 4.1). Finally, the mutant was not able to grow on minimal medium without plan-
derived extracts (Figures 4.1 and 4.2).
The colony morphology of other R. fascians mutants was evaluated as well on the same set
of media. The attenuated D188-att1 and the non-pathogenic D188-fas1 mutants revealed a
similar phenotype as the wild-type strain D188 on the rich media and the minimal medium
supplemented with plant-derived extracts or with pyruvate. In contrast to D188, both
mutants exhibited an extensive protrusion layer on minimal medium supplemented with
histidine and pyruvate; the D188-att1 mutant did not have the protrusions when grown on
minimal medium alone (Figure 8.1 in the Annexes).
Interestingly, none of the other GT1 transposon mutants, 45F10, 41H2 and 40G10 (Figure
8.2 in the Annexes), had a colony morphology defect like 21D5 when grown on rich media
and minimal medium supplemented with plant-derived extracts. Moreover, unlike 21D5,
the three mutants grew well on the minimal media without plant-derived extracts. As
expected, 40G10 had a colony morphology similar to that of D188, except on minimal
medium alone, where no protrusion layer was formed. On this medium, the other two GT1
mutants did not exhibit the protrusion layer either. The colonies of 45F10 and 41H2 also
differed from those of D188 and 40G10 on minimal medium supplemented with pyruvate
and with histidine and pyruvate in the sense that no clear protrusion layer was formed
(Figure 8.2 in the Annexes).
Although we currently have no information on which molecular mechanisms determine the
colony morphology, our results clearly show that R. fascians can adjust its shape in
response to particular conditions which might affect its capacity to interact with or survive
on its host. Moreover, the mutation in the GT1 gene in the 21D5 mutant must affect the
activity of the protein in a much more profound way than in the other three GT1 mutants,
since it exhibits the strongest phenotype.

Results
33
Figure 4.1 Colony morphology of the wild-type R. fascians strain D188, its plasmid-free
derivative D188-5 and the transposon mutant 21D5 grown on different media. Photos of representative colonies after 4 days of growth at 28°C were taken with a binocular and
the ProRes®CapturePro 2.8 software (exposure time of 650ms). The experiment was performed
once.
1mm0.5mm 1mm
1mm0.5mm
LB
1mm
1mm1mm0.5mm
1mm
1mm
1mm
1mm
0.5mm
No growth
No growth
No growth
YE
BM
inA
+
Gal
l(2
0µ
l/m
L)
Min
A
21D5D188-5 D188
0.5mm
Min
A+
Pyr
(20m
M)
0.5mmMin
A+
His
(5m
M)
/Pyr
(20m
M)
0.5mm
Min
A+
Pla
nt
(20µ
l/m
L)
1mm

Results
34
Figure 4.2 Overview of the growth of the wild-type R. fascians strain D188. (A) and the transposon mutant 21D5 (B) on minimal medium supplemented with 20 mM
pyruvate/5 mM histidine after 4 days incubation at 28°C. Photos were taken with a Canon OS 50D
(ISO 100, Diaphragm 18 and closing time 1/13).
4.A.2. Growth capacity of different R. fascians strains on different media
Forisz (2012) noticed that mutant 21D5 formed aggregates when cultured in liquid LB
medium. Essentially, the bacteria do not homogeneously spread in the medium, but
coagulate and eventually precipitate. We confirmed this finding and observed the same
behavior of 21D5 in YEB medium (data not shown). None of the other GT1 mutants
exhibited the coagulation behavior in liquid cultures which is in agreement with the lack of
a colony morphology phenotype. To evaluate if the aggregate formation by 21D5 would
reflect differences in growth capacity, we determined the CFUs on the plates of the
previous experiment with the different media, set the growth on YEB at 100% because this
is the standard growth medium for R. fascians, and compared the growth on the other
media to that value (Table 4.1).
The data presented in Table 4.1 are the result of a single experiment and should be
interpreted with some caution. For all strains, growth on MinA without any supplements
was low, whereas the addition of plant-derived extracts, pyruvate, or histidine/pyruvate
(partially) restored growth. When comparing the growth pattern of D188 with that of
D188-5, it appears that the linear plasmid might encode functions that enable R. fascians to

Results
35
grow better in minimal conditions. Moreover, the colony morphology of 21D5 nor its
coagulation seemed to affect the capacity to grow on relatively rich media (including
MinA with plant-derived extracts), although the GT1 mutation completely abolished
growth under nutrient-restrictive conditions.
Table 4.1: Relative growth of different R. fascians strains on different media based on
CFU’s (%).
Strain YEB LB MinA+
Gall
(20µl/mL)
MinA+
Plant
(20µl/mL)
MinA MinA+
Pyr
(20mM)
MinA+
His (5mM)/
Pyr (20mM)
D188
D188-5
D188-att1
D188-fas1
21D5
45F10
41H2
40G10
100
100
100
100
100
100
100
100
123
72
97
91
126
87
79
13
138
13
84
101
172
16
102
97
110
11
106
94
171
13
19
9
93
0
16
23
0
1
0
0
125
81
69
114
0
110
0
12
160
68
91
130
0
92
0
97
Based on these preliminary observations, we can postulate that 21D5 has no fitness defect
when sufficient nutrients are provided.
4.A.3. Mutations in GT1 seriously impair the virulence of R. fascians
To assess the effect of the mutation in GT1 on the pathogenicity of the strains, we analyzed
the response of Arabidopsis and tobacco plants at different time points after infection with
21D5, 45F10, 41H2, and 40G10 and compared it to the phenotypes induced by the wild-
type strain D188, its non-pathogenic plasmid-free derivative D188-5, the non-pathogenic
D188-fas1 mutant, and the attenuated D188-att1 mutant.

Results
36
For Arabidopsis, 2-week old plants were infected by placing a 20-µl drop of bacterial
suspension in the heart of the rosette. At 7, 14, 21 and 28 days post infection (dpi) the
occurrence of different responses, such as stunted growth, leaf deformation, anthocyanin
production, and serration of leaf margins, was scored by eye. When at least one of these
responses occurred, the plants were considered symptomatic. When plants were
symptomatic but also exhibited the most typical symptom, activation and neoformation of
shoot meristems in the axillary regions, they were scored separately at each time point.
Moreover, the degree of axillary activation was scored under the binocular at 10 dpi by
counting the number of shoots that were formed in the axils.
Figure 4.3 shows a general overview of the infected plants at 28 dpi. Clearly, the strains
D188-5 and D188-fas1 could not provoke symptoms and the infected plants had a similar
phenotype as the mock-inoculated control (water). The responses induced by D188-att1
and 21D5 were limited to some axillary activation and anthocyanin accumulation that was
not accompanied by leaf deformations (Figure 4.3). Infection with 45F10 lead to more
pronounced axillary activation, but hardly no growth inhibition was observed. Finally,
although 41H2 induced the full array of symptoms, the degree of symptom formation was
lower than that upon infection with strains 40G10 and D188 (Figure 4.3).
Figure 4.3 Symptoms on A. thaliana plants inoculated with different R. fascians strains at
28 dpi. At least 50 seedlings were analyzed per treatment. Photos were taken with a Canon OS 50D (ISO
100, Diaphragm 16 and closing time 6 sec, except for 21D5, 41H2 and 45F10 which was 5sec).
Bar=1cm.

Results
37
Quantification of the axillary activation (Figure 4.4) showed that the activity of 41H2 was
comparable to that of D188. 45F10 and 40G10 induced a response that resembled that of
D188-att1, and 21D5 hardly induced shoot formation. D188-5 and D188-fas1 could not
activate the axillary region.
Figure 4.4 Axillary activation in A. thaliana plants inoculated with different R. fascians
strains at 10 dpi. At least 50 plants were scored per treatment.
When the kinetics of symptom formation were considered, all mutants, except for 41H2
and 40G10, were strongly delayed (Figure 4.5). The pattern of symptom development by
21D5 was similar to that of D188-att1, and, although 41H2 and 40G10 strongly activated
the axillary region, the response was not as strong as that obtained by D188 infection
(Figure 4.5).
From these data we can conclude that the GT1 mutation in 21D5 severely attenuates the
virulence capacity of R. fascians.
0
10
20
30
40
50
60
70
80
90
100
Axil
lary
mer
iste
m a
ctiv
ati
on
(per
cen
tag
e)
Strain
+5
4
3
2
1
0

Results
38
0
20
40
60
80
100
Water
D188-5
D188-fas1
D188-att1
D188
21D5
41H2
45F10
40G10
Water
D188-5
D188-fas1
D188-att1
D188
21D5
41H2
45F10
40G10
Water
D188-5
D188-fas1
D188-att1
D188
21D5
41H2
45F10
40G10
Water
D188-5
D188-fas1
D188-att1
D188
21D5
41H2
45F10
40G10
71
42
12
8
Percentage
Da
ys
po
st i
nfe
ctio
n
Fig
ure
4.5
Kin
etic
s o
f sy
mpto
m d
evel
opm
ent
on
A.
thali
ana p
lants
inocu
late
d w
ith d
iffe
rent
R. fa
scia
ns
stra
ins
at 7
, 14,
21 a
nd
28 d
pi.
W
hit
e, n
on
-sy
mp
tom
atic
pla
nts
; gre
y,
sym
pto
mat
ic p
lants
exhib
itin
g a
nth
ocy
anin
acc
um
ula
tio
n,
swoll
en v
ein
s, a
nd/o
r se
rrat
ed l
eaves
; b
lack,
sym
pto
mat
ic p
lan
ts e
xhib
itin
g a
ctiv
atio
n o
f th
e ax
illa
ry m
eris
tem
s. A
t le
ast
50 p
lants
wer
e sc
ore
d.
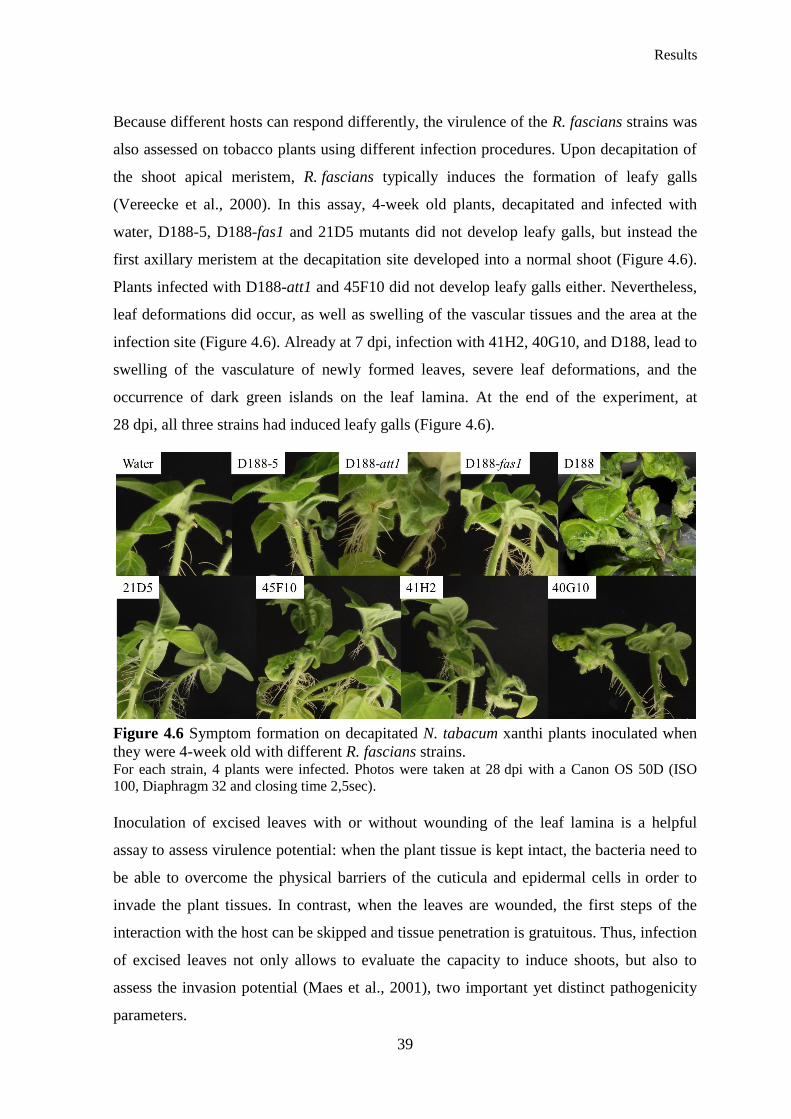
Results
39
Because different hosts can respond differently, the virulence of the R. fascians strains was
also assessed on tobacco plants using different infection procedures. Upon decapitation of
the shoot apical meristem, R. fascians typically induces the formation of leafy galls
(Vereecke et al., 2000). In this assay, 4-week old plants, decapitated and infected with
water, D188-5, D188-fas1 and 21D5 mutants did not develop leafy galls, but instead the
first axillary meristem at the decapitation site developed into a normal shoot (Figure 4.6).
Plants infected with D188-att1 and 45F10 did not develop leafy galls either. Nevertheless,
leaf deformations did occur, as well as swelling of the vascular tissues and the area at the
infection site (Figure 4.6). Already at 7 dpi, infection with 41H2, 40G10, and D188, lead to
swelling of the vasculature of newly formed leaves, severe leaf deformations, and the
occurrence of dark green islands on the leaf lamina. At the end of the experiment, at
28 dpi, all three strains had induced leafy galls (Figure 4.6).
Figure 4.6 Symptom formation on decapitated N. tabacum xanthi plants inoculated when
they were 4-week old with different R. fascians strains. For each strain, 4 plants were infected. Photos were taken at 28 dpi with a Canon OS 50D (ISO
100, Diaphragm 32 and closing time 2,5sec).
Inoculation of excised leaves with or without wounding of the leaf lamina is a helpful
assay to assess virulence potential: when the plant tissue is kept intact, the bacteria need to
be able to overcome the physical barriers of the cuticula and epidermal cells in order to
invade the plant tissues. In contrast, when the leaves are wounded, the first steps of the
interaction with the host can be skipped and tissue penetration is gratuitous. Thus, infection
of excised leaves not only allows to evaluate the capacity to induce shoots, but also to
assess the invasion potential (Maes et al., 2001), two important yet distinct pathogenicity
parameters.

Results
40
Infection of wounded leaves largely confirmed the results obtained upon decapitation:
D188-5 and D188-fas1 did not provoke any symptoms, whereas D188, 45F10, 41H2, and
40G10 induced bumps (i.e. regions of increased cell division) and green islands at 7 dpi
and, eventually at 28 dpi, leafy galls in almost all infected leaves (Figure 4.7). This assay
also illustrated the attenuated virulence of the D188-att1 mutant: although bumps and
green islands were induced, only in 60% of the cases leafy galls formed, but they were
much smaller than those induced by D188 (Figure 4.7). Similar observations were made
for 21D5, but the primordial leafy galls only appeared in 20% of the cases (Figure 4.7),
signifying extreme virulence attenuation and suggesting a defective production of
morphogens
Infection of unwounded leaves corroborated the non-pathogenicity of D188-5 and D188-
fas1 (Crespi et al., 1992), the inability of D188-att1 to invade plant tissues in the absence
of wounds (Maes et al., 2001), and the wound-independence of D188, 41H2, and 40G10 to
induce leafy galls (Figure 4.7). Interestingly, both 21D5 and 45F10 were unable to cause
leafy galls if the plant tissue was intact (Figure 4.7), implying that their penetration
capacity is impaired.
Figure 4.7 Symptoms on wounded or intact excised leaves of 4-week old N. tabacum
xanthi plants inoculated with different R. fascians strains at 28 dpi. For each strain and each condition, five leaves were infected. The percentage given with each
image represents the occurrence of leafy gall formation. Photos were taken with a Canon OS 50D
ISO 100 (Diaphragm 16 and closing time 1/100sec). Bar=1cm.

Results
41
Altogether, the virulence assessment on different hosts using different infection procedures
showed that 40G10 and 41H2 are the most pathogenic GT1 mutants, whereas the
pathogenicity of 45F10 is reduced. The capacity of 21D5 to induce symptoms is extremely
attenuated because the mutation apparently affects both the ability to invade the plant
tissues and the production of morphogens.
4.A.4. The regulation of fas gene expression is impaired in vitro and in planta affecting the
level of cytokinin production by 21D5
Although the virulence of 21D5 was extremely weak, on wounded excised leaves
occasionally small leafy galls developed suggesting that cytokinin production is not
completely shut down in this strain. To get more insight into cytokinin gene expression in
21D5, an available fasA:GUS reporter plasmid pJDGV5 (Temmerman et al., 2000) was
introduced into 21D5 cells by electroporation. The resulting strain 21D5(pJDGV5) and the
wild-type strain D188(pJDGV5) carrying the same plasmid, were subsequently grown
under particular conditions known to induce fas gene expression (Temmerman et al.,
2000). As shown in Figure 4.8.A, especially the combination of 5 mM histidine or leafy
gall extract (20 µl/ml) with 20 mM pyruvate induced fasA expression in the D188
background, confirming previous reports (Temmerman et al., 2000). In contrast, in the
21D5 mutant, no differential expression of the fas genes could be measured, suggesting
that cytokinin production would be impaired in this strain.
Then, both reporter strains were used to infect excised leaves and 7 days later in planta
expression was quantified using MUG as a substrate (Figure 4.8.B) or visualized by
histochemical staining (Figure 4.8.C-F). In D188-infected plants, fasA expression could be
measured (Figure 4.8.B) and was localized in distinct patches on the leaf lamina and in the
axillary regions (Figure 4.8.C and D). In contrast, no fasA expression was detectable with
either of the assays in the 21D5 background (Figure 4.8.B, E and F). These results are
consistent with the in vitro expression and virulence data and indicate that this mutant has
severe difficulties to interact in an appropriate way with its host.
To substantiate this finding, Petr Tarkowski, our collaborator at Palacký University
(Olomouc, Czech Republic), grew D188-5, D188, and 21D5 in vitro under inducing
conditions (5 mM His/20 mM Pyr) and quantified the cytokinins secreted into the
supernatant. Although the analysis was done only once, his results showed that the

Results
42
cytokinin profile of the three strains was different (Figure 4.8.G). Whereas no large
differences were observed between D188 and 21D5 for the cZ-type cytokinins, the level of
2-iP-type cytokinins was considerably lower in 21D5 compared to D188, resulting in a
34% lower total cytokinin amount secreted by 21D5 under these conditions (Table 4.2). As
reported before, D188-5 is able to secrete a low amount of cytokinins as well (Figure 4.8.G
and Table 4.2).
Figure 4.8 Expression of fasA and cytokinin production in different R. fascians strains. (A) Effect of different conditions on fasA expression in vitro in D188 (black bars) and 21D5 (white
bars) measured with the reporter plasmid pJDGV5 and MUG as substrate. Inductions were
performed in IM medium in the presence of 20 mM pyruvate, 5 mM histidine, 20 mM sucrose and
20 µl/ml leafy gall extract. Statistical differences within each strain indicated by different letters
were evaluated with Student's t-tests (p<0.05). Error bars represent SE (n=3). (B) Expression of
fasA in the D188 and 21D5 background in planta 7 days after infection of excised leaves and
measured with MUG as substrate. The asterisk marks the statistical difference between both
conditions according to Student's t-tests (p<0.05). Error bars represent SE (n=4). (C-F)
Histochemical staining visualizing in planta fasA expression in the D188 (C-D) and 21D5 (E-F)
background. D and F are details of C and E, respectively. Photos were taken with a Canon OS 50D
ISO 100 (Diaphragm 16 and closing time 1/100sec). (G) Preliminary data on the cytokinin
production by D188-5, D188 and 21D5 grown under inducing conditions (20 mM pyruvate and
5 mM histidine).
0
5
10
15
20
25
D188 21D5
GU
S a
ctiv
ity (
u)
*0
50
100
150
200
GU
S a
ctiv
ity (
u)
aa a
aa
aa aa
b
c
c
dd d
e
A B
0
20
40
60
80
Con
cen
trati
on
(n
M)
Cytokinin
D188-5
D188
21D5
G
C D E F

Results
43
Table 4.2 Preliminary data on the cytokinin content of the supernatant of different
R. fascians strains grown under inducing conditions (20 mM pyruvate and 5 mM histidine).
Strain cZ-type
cytokinins (nM)
2-iP-type
cytokinins (nM)
Total cytokinin
content (nM)
Relative total cytokinin
content (%)
D188-5
D188
21D5
44
15
49
108
52
21
153
37
101
100
24
66
4.A.5. Impaired att gene expression affects the in planta production of the Att compound
by 21D5
Since expression of the att genes and the production of Att compound is tightly linked to
the invasion capacity of R. fascians and to fas gene regulation (Maes et al., 2001), the
phenotypes of 21D5 might suggest that the att autoregulatory system is defective in this
mutant. To test this hypothesis, we first introduced an available attA:GUS reporter plasmid
pRFTM3 (Maes et al., 2001) into 21D5 cells by electroporation and measured the GUS
activity after in vitro growth of the resulting strain 21D5(pRFTM3) and D188(pRFTM3)
under several att-inducing conditions (Maes et al., 2001). As shown in Figure 4.9.A, attA
expression in the D188 background was highly induced by combining 5 mM histidine with
20 mM pyruvate or 20 mM sucrose or leafy gall extract (20 µl/ml) with 20 mM pyruvate.
Although a similar expression pattern was obtained in the 21D5 mutant, the overall
expression level was significantly lower (Figure 4.9.A).
To verify whether this defect also occurred in planta, excised leaves were infected with
both reporter strains and in planta attA expression was quantified after 7 days.
Surprisingly, the attA gene was highly expressed when 21D5 was present on the host
(Figure 4.9.B). To obtain further evidence for this finding, we evaluated whether the Att
compound could be detected in infected plants. Therefore, Arabidopsis plants were
infected with different R. fascians strains and, 28 days after infection, extracts were
prepared from these plants. These extracts were subsequently used to quantify their
inducing capacity on attA expression in the absence or presence of 20 mM pyruvate. The
presence of pyruvate strongly enhances gall-induced virulence gene expression and can be
used to detect low amounts of Att compound (Maes et al., 2001; Temmerman et al., 2000).
In accordance with the in planta expression data, extracts obtained from 21D5-infected
plants indeed had inducing activity, indicating that the Att compound is produced and
secreted into the plant tissues by 21D5 (Figure 4.9.C). However, just as for extracts of
plants infected with strain D188-att1, in the absence of pyruvate, the inducing activity was
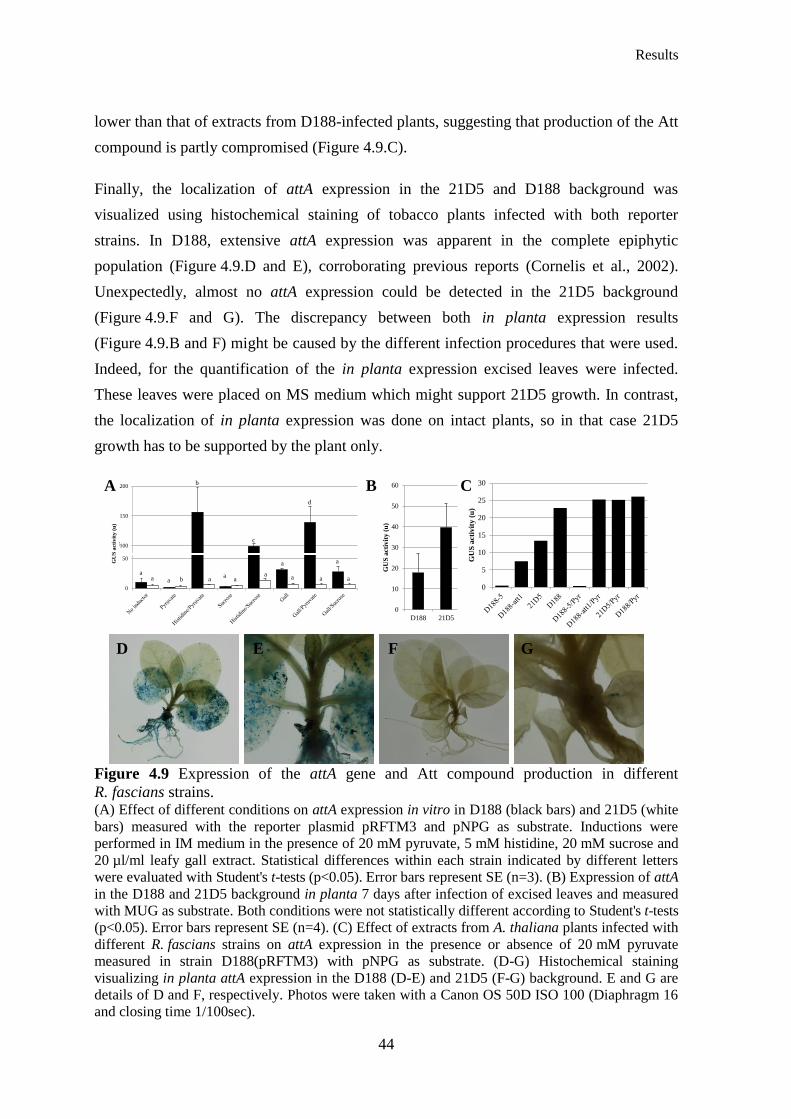
Results
44
lower than that of extracts from D188-infected plants, suggesting that production of the Att
compound is partly compromised (Figure 4.9.C).
Finally, the localization of attA expression in the 21D5 and D188 background was
visualized using histochemical staining of tobacco plants infected with both reporter
strains. In D188, extensive attA expression was apparent in the complete epiphytic
population (Figure 4.9.D and E), corroborating previous reports (Cornelis et al., 2002).
Unexpectedly, almost no attA expression could be detected in the 21D5 background
(Figure 4.9.F and G). The discrepancy between both in planta expression results
(Figure 4.9.B and F) might be caused by the different infection procedures that were used.
Indeed, for the quantification of the in planta expression excised leaves were infected.
These leaves were placed on MS medium which might support 21D5 growth. In contrast,
the localization of in planta expression was done on intact plants, so in that case 21D5
growth has to be supported by the plant only.
Figure 4.9 Expression of the attA gene and Att compound production in different
R. fascians strains. (A) Effect of different conditions on attA expression in vitro in D188 (black bars) and 21D5 (white
bars) measured with the reporter plasmid pRFTM3 and pNPG as substrate. Inductions were
performed in IM medium in the presence of 20 mM pyruvate, 5 mM histidine, 20 mM sucrose and
20 µl/ml leafy gall extract. Statistical differences within each strain indicated by different letters
were evaluated with Student's t-tests (p<0.05). Error bars represent SE (n=3). (B) Expression of attA
in the D188 and 21D5 background in planta 7 days after infection of excised leaves and measured
with MUG as substrate. Both conditions were not statistically different according to Student's t-tests
(p<0.05). Error bars represent SE (n=4). (C) Effect of extracts from A. thaliana plants infected with
different R. fascians strains on attA expression in the presence or absence of 20 mM pyruvate
measured in strain D188(pRFTM3) with pNPG as substrate. (D-G) Histochemical staining
visualizing in planta attA expression in the D188 (D-E) and 21D5 (F-G) background. E and G are
details of D and F, respectively. Photos were taken with a Canon OS 50D ISO 100 (Diaphragm 16
and closing time 1/100sec).
0
10
20
30
40
50
60
D188 21D5
GU
S a
ctiv
ity
(u
)
0
50
100
150
200
GU
S a
ctiv
ity
(u
)
aa
a b a aa
a aa
b
a
c
a
d
a
0
50
100
150
200
GU
S a
ctiv
ity (
u)
aa
a b a aa
a aa
b
a
c
a
d
a
0
50
100
150
200
GU
S a
ctiv
ity
(u
)
aa
a b a aa
a aa
b
a
c
a
d
a
0
5
10
15
20
25
30
GU
S a
ctiv
ity
(u
)
B C
D F GE
A

Results
45
4.A.6. 21D5 is unable to persist on the plant host
From the fasA and attA expression data and the cytokinin and Att compound production
results, we can conclude that both these essential virulence factors are not completely shut
down in strain 21D5, but they are not functioning optimally. To get more insight into why
the mutation in GT1 causes this partial defect, we evaluated the persistence of 21D5 on its
host in time, by quantifying at 2, 7 and 21 dpi the establishment of the total and the
endophytic subpopulations on tobacco leaves dissected from plants that were infected by
dipping. For comparison, similar manipulations were done with D188 and D188-5. To
assure a comparable initial inoculum, for each bacterial strain, the washed bacterial
solution was set to the same OD600. The total D188-5 population did not change much
with time, whereas the contribution of the endophytic subpopulation increased with one
log between 2 and 7 dpi (Figure 4.10). The total population of D188 increased with one log
by 21 dpi, but the endophytic subpopulation remained stable throughout the experiment
(Figure 4.10). The initial 21D5 total population was one log lower than those of D188-5
and D188 and dropped another log by the end of the experiment (Figure 4.10). Moreover,
the endophytic subpopulation of 21D5 dropped 2 logs between 2 and 7 dpi, but stayed
stable thereafter, ending 3-3.5 logs lower than the endophytic populations of D188-5 and
D188 (Figure 4.10).
Figure 4.10 Colonization capacities of R. fascians strains D188-5, 21D5 and D188. Infected leaves were used as such (total population) or first submitted to a bleach treatment
(endophytic subpopulation); after several time points the leaves were crushed and serial dilution
were made and plated on YEB medium to determine the colony forming units per gram fresh plant
tissue. Black bars: total population; white bars: endophytic subpopulation. Statistical differences
between time points for total population of each strain indicated by different letters were evaluated
with Student's t-tests (p<0.05). Endophytic subpopulations were not statistically different according
to Student's t-tests (p<0.05). For each time point, the asterisks indicate significant differences with
D188 according to Student's t-tests (p<0.05). Error bars are SE (n=4).
0
2
4
6
8
10
12
14
D188-5 21D5 D188 D188-5 21D5 D188 D188-5 21D5 D188
2dpi 7dpi 21dpi
Lo
g (
CF
U/g
pla
nt
tiss
ue)
Days post infection
a a a* * *a
a
a
a
b
a
Results
46
These data suggested that 21D5 experiences difficulties to maintain itself on the host. To
verify whether this was indeed the case, excised tobacco leaves infected for 5 weeks with
D188 or 21D5 were observed by scanning electron microscopy without sample pre-
treatment. In agreement with previous reports (Cornelis et al., 2001), strain D188 formed
large epiphytic colonies covered by a layer on the leaf blade (Figure 4.11.A and B), almost
appearing like a crust (Figure 4.11.C). Also the leaf edges contacting the medium were
heavily colonized by D188 (Figure 4.11.D). In contrast, it was very difficult to find sites
extensively colonized by 21D5 (Figure 4.11.E and F) and a thick crusty biofilm was not
found either (Figure 4.11.G). However, small patches of bacteria (Figure 4.11.I) and
peculiar globular structures (Figure 4.11.J) were occasionally observed. 21D5 was
apparently only able to efficiently colonize the leaf margins that were in contact with the
medium (Figure 4.11.H), supporting the hypothesis stated to explain the discrepancy
between the in planta att expression data in the 21D5 background (Figure4.9).

Results
47
Figure 4.11 Epiphytic colonization of excised tobacco leaves by R. fascians strain D188
(A-D) and 21D5 (E-J) 5 weeks after infection. At least 3 regions from several infected leaves were analyzed for each strain. (A-B) Large
epiphytic D188 colonies; (C) Epiphytic D188 biofilm resembling a bacterial crust; (D) Extensive
D188 colonization at the leaf edge; (E-F) Absence of extensive epiphytic colonization by 21D5;
(G) Marginal crust-like colonization by 21D5; (H) Extensive 21D5 colonization at the leaf edge. (I)
Small patches of epiphytic 21D5 bacteria; (J) Peculiar global colonization structures observed
during 21D5 infection; Images were taken with a Tabletop Microscope TM-1000 (Hitachi) without
sample processing.
A
B
C
E
F
G
D
I
H
J
Results
48
4.A.7. Expression of GT1 is possibly induced by carbon sources that accumulate in
infected plants and might be controlled by AttR
Altogether, the colonization data indicate that strain 21D5 has difficulties to establish itself
on the plant host. Moreover, the in planta fas and att expression data suggest that the
limited amount of bacteria that do persist on the plant are not in the appropriate
physiological condition to express these essential virulence factors to the level that is
required to achieve full pathogenicity. This finding is supported by the complete inability
of 21D5 to grow on a medium with minimal nutritional resources. To get more insight into
the timing at which the GT1 function is required during the interaction with the host and
into the regulation of the GT1 gene expression, an available transcriptional GT1:GUS
fusion was cloned into a bifunctional vector (see Material an Methods) and the resulting
construct pRFGT2-1 was introduced into R. fascians D188 and D188-5, but also in D188-
ΔattR and D188-ΔfasR, two mutants carrying a deletion in the master regulators AttR and
FasR (Maes et al., 2001; Temmerman et al., 2000).
One of the earliest responses of the plant on infection with R. fascians is the modulation of
its primary metabolism, leading to the accumulation of carbon sources related to the Krebs
cycle, such as pyruvate, succinate, fumarate, malate, glucose, and fructose (Depuydt et al.,
2009b) (Figure 8.3 in the Annexes). Since GT1 might be required at the onset of the
interaction, we first tested whether GT1 expression in the D188 background was
modulated by these carbon compounds. In this experiment, we also included the standard
inducers histidine and uninfected plant and leafy gall extracts, and acetate and citrate, two
additional compounds of the Krebs cycle. The data are the result of a single experiment
and should be considered as preliminary. As shown in Figure 4.12, all of the carbon
sources that accumulate in infected plants, as well as histidine and leafy gall extracts,
induced the GT1 expression. One exception was fumarate, but this compound was toxic to
R. fascians at the concentrations used (data not shown). Extract from uninfected plants and
citrate, which does not accumulate in infected plants, did not induce GT1 expression
(Figure 4.12). Interestingly, acetate, which was used in the primary screen as a carbon
source to identify 21D5 as a mutant, activated GT1 expression as well (Figure 4.12). These
data suggest that the GT1 function is activated in response to the modulation of the
primary metabolism of the plant and is likely required at the onset of the interaction.

Results
49
Figure 4.12 Effect of different conditions on in vitro GT1 expression measured in D188(pRFGT2-
1) with MUG as a substrate.
Inductions were done in IM medium with the different compounds (10 mM and 20 mM) and plant-
derived extracts (20 µl/ml). The data are the results of a single experiment and should be
considered as preliminary.
Next, we evaluated the expression of GT1 in different regulatory mutants under conditions
typically used to determine virulence gene expression. In the D188 background, pyruvate,
histidine/pyruvate, and leafy gall extract induced GT1 expression, whereas plant extract
did not (Figure 4.13), confirming the data of the previous experiment (Figure 4.12).
Similar results were obtained in D188-ΔfasR (Figure 4.13), indicating that GT1 expression
is independent from the FasR master regulator and the GT1 function likely unrelated to
cytokinin production. The complete loss of GT1 expression in the D188-ΔattR background
(Figure 4.13), suggests that the autoregulatory system encoded by the att operon would
control GT1 expression, supporting the requirement of the GT1 function at the first steps of
the interaction. However, if this were the case, no GT1 expression would be expected in
the plasmid-free D188-5 background. Surprisingly, in D188-5, GT1 expression was as high
as in D188 and not differential compared to the negative control (Figure 4.13). To get more
insight into these conflicting results, the plasmid content of the different strains will have
to be verified and the experiment repeated.
0
1000
2000
3000
4000
No i
nduct
or
Pyru
vat
e 10
Pyru
vat
e 20
His
tidin
e 10
His
tidin
e 20
Gal
l ex
trac
t
Pla
nt
extr
act
Glu
cose
10
Glu
cose
20
Fru
tose
10
Fru
tose
20
Ace
tate
10
Ace
tate
20
Cit
rate
10
Cit
rate
20
Succ
inat
e 10
Succ
inat
e 20
Fum
arat
e 10
Fum
arat
e 20
Mal
ate
10
Mal
ate
20
GU
S a
ctiv
ity (
u)

Results
50
Figure 4.13 Effect of different regulators on in vitro GT1 expression measured from the reporter
plasmid pRFGT2-1 in different R. fascians strains with MUG as a substrate.
Inductions were done in IM medium with 20 mM pyruvate (Pyr), 5 mM histidine (His), 20 µl/ml
leafy gall extract (Gall) and 20 µl/ml plant extract (Plant). The data are the results of a single
experiment and should be considered as preliminary.
Nevertheless, when we analyzed the promoter region of the pFi_135-136 operon, a typical
LysR-type binding motif could be detected (Figure 4.14), suggesting that AttR regulation
might indeed occur.
Figure 4.14 Presence of the T-N11-A motif in the upstream sequence of the pFi_135_136 operon.
This motif is typically present in promoters regulated by LysR-type proteins (Goethals et al., 1992).
B. Methylated cytokinins: the secret weapon of R. fascians?
As explained in the Introduction, the two phytopathogenic actinomycetes R. fascians and
Streptomyces turgidiscabies, that are known to induce leafy galls, have related SAM-
dependent methyltransferase genes (mtr) associated with their fas operons (Figure 1.9).
Their location in the fas locus and the loss of virulence of R. fascians mtr mutants,
suggests their involvement in the biosynthesis of an essential methylated cytokinin. To
0
1000
2000
3000
4000
5000
No
in
duct
or
Pyr
His
/Pyr
Gal
l
Pla
nt
Gal
l/P
yr
Pla
nt/
Py
r
No
in
duct
or
Pyr
His
/Pyr
Gal
l
Pla
nt
Gal
l/P
yr
Pla
nt/
Py
r
No
in
duct
or
Pyr
His
/Pyr
Gal
l
Pla
nt
Gal
l/P
yr
Pla
nt/
Py
r
No
in
duct
or
Pyr
His
/Pyr
Gal
l
Pla
nt
Gal
l/P
yr
Pla
nt/
Py
r
D188-5 D188-att1 D188-fas1 D188
GU
S a
ctiv
ity
(u
)

Results
51
analyze the impact of the mutations in the mtr genes on the cytokinin production in
R. fascians, the cytokinin profile of the supernatant of D188-5, D188, D188-mtr1 and
D188-mtr2 grown under fas-inducing conditions was determined by Petr Tarkowski, our
collaborator at Palacký University (Olomouc, Czech Republic). The data presented in
Figure 4.15 are preliminary and still incomplete, but they support the hypothesis that the
MTRs are apparently not involved in the production of 2MeScZ or any other of the
detected cytokinins.
Figure 4.15 Preliminary data on the cytokinin production of different R. fascians strains
induced with 20 mM pyruvate and 20 µl/ml leafy gall extract.
So, to visualize the reaction product(s) of the MTR proteins, different bacterial strains were
grown under fas-inducing conditions in IM medium in the presence of 14
C-labelled
Adenine or 14
C-labelled SAM. The bacterial pellets and the supernatants were extracted
and the extracts analyzed on silica thin layers using butanol/water/25% ammonia (4/2/1) as
mobile phase (see Materials and Methods for details). The labelled compounds were
visualized with a phosphor-imager and the UV fluorescence by irradiation at 365 nm. The
comparison of the pattern obtained in D188-5, D188-fas1, D188-mtr1, and D188-mtr2
with that of D188 should allow the identification of fas- and mtr-dependent compounds.
These compounds are expected to be present in the S. turgidiscabies DSM41990 and
DSM41997 as well, because they carry the fas operon and the mtr genes (Aittamaa et al.,
2010). The labeling experiments revealed clear patterns, both for the cellular extracts
(Figure 4.16) and for the extracts of the supernatants (Figure 4.17), but unfortunately none
of the compounds could be linked to the fas or the mtr genes.
0
20
40
60
Con
cen
trati
on
(n
M)
Cytokinin
D188-5
D188
D188-mtr1
D188-mtr2

Results
52
Figure 4.16 Thin layer chromatography analysis of 14
C-adenine- and 14
C-SAM-labelled
compounds produced by different R. fascians and S. turgidiscabies strains. Analysis of the butanol fraction of the bacterial cells. R. fascians strains were induced in IM
medium with pyruvate (20 mM) combined with leafy gall extract (20 µl/mL); the S. turgidiscabies
strains were not induced.
No UV-fluorescent compounds were detected in the cellular extracts (data not shown) and
none of the UV-fluorescent compounds secreted in the supernatants were fas- or mtr-
dependent (Figure 4.17).
Figure 4.17 Thin layer chromatography and UV-fluorescence analysis of 14
C-adenine- and 14
C-SAM-labelled compounds produced by different R. fascians and S. turgidiscabies
strains. Analysis of extracts of the supernatants of the different strains. R. fascians strains were induced in
IM medium with pyruvate (20 mM) combined with leafy gall extract (20 µl/mL); the
S. turgidiscabies strains were not induced.
UV 365 nm UV 365
nm

Results
53
To understand this unexpected result, we decided to analyze the in vitro expression of the
mtr genes and compare it to that of fasA. Therefore, D188-mtr1, D188-mtr2, and
D188(pJDGV5) were grown under the typical inducing conditions and the expression of
the GUS reporter gene was quantified with MUG as a substrate. Whereas for fasA a
significant expression was measured with histidine/pyruvate and gall/pyruvate, hardly no
expression was measured for both mtr genes (Figure 4.18). These data explain the TLC
results and indicate that the mtr genes are not co-expressed with the fas genes in vitro. We
reasoned that the mtr gene expression might be substrate dependent and so inductions were
set with 2-iP, cZ and tZ, but again no expression could be measured (Figure 4.18).
Figure 4.18 Effect of different conditions on in vitro mtr1, mtr2, and fasA expression
measured in D188-mtr1, D188-mtr2, and D188(pJDGV5), respectively, with MUG as a
substrate. Inductions were performed in IM medium in the presence of 20 mM pyruvate (Pyr), 5 mM
histidine (His), 20 µl/ml leafy gall extract, 20 µl/ml plant extract, 10 µM 2-iP, 10 µM cZ and
10 µM tZ. The data are the results of a single experiment and should be considered as preliminary.
Finally, excised leaves from 4-week old tobacco plants were infected by dipping with
D188-mtr1, D188-mtr2, and D188(pJDGV5) and in planta expression was quantified after
7 days with MUG as a substrate (Figure 4.19.A). Interestingly, both mtr genes were
expressed in planta and their expression level was comparable or even exceeded that of
fasA (Figure 4.19.A). To confirm the obtained results, the localization of mtr1, mtr2, and
fasA expression was visualized using histochemical staining of 4-week old tobacco plants
infected for 7 days with the reporter strains. The expression level of all three genes was
comparable and it was localized in distinct patches on the leaf lamina and in the axillary
0
40
80
120
160
No
in
duct
or
His
Pyr
His
/Pyr
Gal
l/P
yr
2-i
P
cZ tZ
No
in
duct
or
His
Pyr
His
/Pyr
Gal
l/P
yr
2-i
P
cZ tZ
No i
nduct
or
His
Pyr
His
/Pyr
Gal
l/P
yr
2-i
P
cZ tZ
D188-mtr1 D188-mtr2 D188(pJDGV5)
GU
S a
ctiv
ity
(u
)

Results
54
regions (Figure 4.19.B-D). Altogether, the expression results show that the fas and mtr
genes are controlled by different regulatory mechanisms. Apparently, the ones that
determine mtr expression are even more stringent that those controlling fas expression. The
results also highlight the complication to identify the MTR-dependent cytokinins.
Figure 4.19 In planta expression of fasA, mtr1 and mtr2 using different assays. (A) Quantification of the expression of fasA, mtr1 and mtr2 in the D188 background in planta 7
days after infection of excised leaves and measured with MUG as substrate. fasA and mtr
expression were not statistically different according to Student's t-tests (p<0.05). Error bars
represent SE (n=4). (B-D) Histochemical staining visualizing in planta fasA (B), mtr1 (C) and mtr2
(D) expression in the D188 background. Photos were taken with a Canon OS 50D ISO 100
(Diaphragm 16 and closing time 1/100sec).
To find a solution for this problem, we then tried if we could bring the in planta expression
in vitro so that the labelling experiments could be repeated under conditions in which the
mtr genes are expressed. Therefore, 4-week old tobacco plants and excised leaves of plants
of the same age were infected with D188-mtr1 by dipping. After 7 days, these plant tissues
were used to set in vitro inductions. Therefore, the plant material was either crushed or cut
in pieces and placed in IM medium overnight to evaluate whether mtr1 expression from
the bacteria present on the plants could be detected. We also wondered if the
supplementation of additional D188-mtr1 cells that were grown in vitro to such samples,
would positively affect the mtr1 expression levels. Therefore, inductions were performed
0
10
20
30
40
50
60
D188(pJDGV5) D188-mtr1 D188-mtr2
GU
S a
ctiv
ity
(u
)
1cm 1cm1cm
B C D
A

Results
55
in the presence of dissected infected leaves, crushed or cut leaves from infected plants, and
D188-mtr1 diluted two times. As control for the previous experiment, in vitro grown
D188-mtr1 cells were induced with leafy gall extract. Importantly, in this assay, significant
mtr1 expression could be measured in all the samples taken from the infected excised
leaves (Figure 4.20). Expression in most of the samples from intact plants was much lower
(Figure 4.20). Generally, addition of in vitro grown D188-mtr1 cells did not strongly
increase the measured mtr1 expression, except in the case of cut leaves from infected
complete plants (Figure 4.20). Based on these results, the labelling experiment can be
repeated starting from infected crushed plant material that is incubated overnight in IM
medium in the presence of 14
C-labelled Adenine or 14
C-labelled SAM. Unfortunately, due
to time constraints, I was unable to perform this experiment myself, but, hopefully, future
work on this subject will allow to discover the methylated cytokinins of R. fascians.
Figure 4.20 Bringing in planta expression of the mtr1 gene to an in vitro system. Effect of different conditions on in vitro mtr1 expression measured in D188-mtr1 with MUG as
substrate. Inductions were performed in IM medium on a single crushed or cut D188-mtr1 infected
excised leaf, or 3 small crushed or cut leaves dissected from entire D188-mtr1 infected plants. In
vitro grown D188-mtr1 cells induced with 20 µl/ml leafy gall extract (LG) were used as a control.
The data are the results of a single experiment and should be considered as preliminary.
0
10
20
30
40
Flu
ore
scen
ce a
t 3
55
nm

Results
56

Discussion
57
5. Discussion
In this work we analyzed the putative function of two new pFiD188-located loci in the
pathology of R. fascians strain D188: the glycosyltransferase GT1 encoded by pFi_136
and two SAM-dependent methyltransferases MTR1 and MTR2 encoded by pFi_075 and
pFi_076, respectively.
Glycosyltransferase enzymes play an important role in the biosynthesis of cell wall
components, including peptidoglicans, arabinogalactans and lipoarabinomannans (Wagner
and Pesnot, 2010), and the bacterial cell wall has proven to be essential for the virulence in
multiple pathogens (Bizzini et al., 2007; Paterson et al., 2009). When R. fascians initiates
an interaction with a host plant, it first goes through an epiphytic growth stage. Several
characteristics of the bacterium indicate that it is well adapted for this phase of its life
cycle, suggesting that it is important for the subsequent success of the pathological phase
(Stes et al., 2011). However, to date, almost no information is available on the molecular
determinants that control the epiphytic behavior. Similarly, the putative role of the cell
wall of R. fascians during the interaction with its host is largely unknown. Nevertheless,
the attenuated virulence of the att mutants coincides with their inability to cause symptoms
when the plants are intact, implying that active penetration of the plant tissues is controlled
by this autoregulatory system either directly or indirectly (Maes et al., 2001). Moreover,
Lacey (1961) suggested that R. fascians would lose its cell wall during the interaction with
the host and these L-forms would be difficult to re-isolate from infected tissues. Based on
the differential visualization of the bacterial populations living in and on the plant with in
situ hybridization and immuno-localization, Cornelis and colleagues concluded that major
reorganizations of the cell wall likely occur during the interaction with the host (Cornelis
et al., 2002; Cornelis et al., 2001).
With the identification of the 21D5 mutant, it became possible, for the first time, to get
insight into factors that are vital for the very early steps of the interaction with the host and
that are unrelated to molecular signaling through phytohormones. One important finding
was that the colony morphology of R. fascians was strongly dependent of the growth
conditions. Especially on the defined minimal media, but not on the minimal media with
plant-derived extracts which are complex mixtures of many compounds, the bacteria
produced a very peculiar colony shape characterized by a distinctive protrusion layer

Discussion
58
(Figure 4.1). It has been shown that the leaf surface is a hostile and patchy nutrient-poor
environment for epiphytic bacteria (Beattie and Lindow, 1995; Beattie and Lindow, 1999)
and surface properties are known to affect adhesion and biofilm formation (Lorite et al.,
2013). Thus, it is very likely that the behavior of R. fascians on the plant host will depend
on their position on the leaf and will change as the interaction proceeds. The 21D5 mutant
has a very strong colony morphology defect: it exhibits the protrusion layer on rich
medium and is unable to grow on defined minimal media (Figures 4.1 and 4.2). Based on
our results, we can conclude that although this modified growth behavior does not affect
growth capacity when sufficient nutrients are available (Table 4.1), it has a very severe
impact on the epiphytic fitness of R. fascians and, consequently, on its pathogenicity.
Indeed, the mutation in the GT1 gene lead to an almost complete loss of virulence
illustrated by the strongly attenuated ability of 21D5 to induce symptoms on Arabidopsis
and tobacco (Figures 4.3 – 4.7). This reduction in pathogenic capacity coincided with a
strongly reduced ability to establish epiphytic colonies (Figures 4.8.E, 4.9.F, and 4.11) and
a sustained endophytic population (Figure 4.10). The importance of the endophytic
subpopulation on symptom maintenance had been illustrated before by the identification of
the vic mutant, which is unable to grow on the C2 carbons provided by infected plant
tissues (Vereecke et al., 2002a; Vereecke et al., 2002b), but the absolute requirement of
extensive epiphytic colonization for the pathology is new. Moreover, the defective
colonization potential of 21D5 also resulted in a strongly impaired in planta expression of
the att and fas genes (Figures 4.8.E and 4.9.F), which would inevitably lead to an
uncoordinated and inadequate production of cytokinins. A comparable effect of a defective
attachment on virulence factor production has been reported in other phytopathogens as
well (Anand and Mysore, 2007; Gelvin, 2000; Gelvin, 2010; Hsiao et al., 2011). Finally,
although the results are only preliminary, the expression pattern of the GT1 gene was
shown to be rather unique (Figure 4.12): a GT1:GUS transcriptional fusion was activated
upon incubation with the carbon sources that accumulate when plants perceive the
colonization by R. fascians (Depuydt et al., 2009b). Such a pattern indicates that the GT1
function is most likely required very early during the interaction, which is in agreement
with the colonization data. The observation that GT1 expression would be controlled by
the att autoregulatory system (Figures 4.13 and 4.14), extends the att regulon and identifies
the GT1 function as a putative invasion factor.

Discussion
59
Concerning the fas-associated mtr genes, the most important question we wanted to
address was what are the reaction products of the encoded MTR proteins. Previous work
has shown that R. fascians produces a mixture of six cytokinins (Pertry et al., 2009) and
this offers a variety of potential benefits during the interaction with the plant host, amongst
which their synergistic action is thought to explain the strong morphogenic activity of the
bacteria (Stes et al., 2011). Nevertheless, the observation that the complete loss of
pathogenicity of the mtr mutants (Pertry, 2009) is not correlated with a strong reduction in
the level of a subset of the six cytokinins (Figure 4.15) is very intriguing and might
indicate that there are still new R. fascians cytokinins to be discovered. Therefore, we took
an approach to feed a set of bacteria with 14
C-labelled adenine and 14
C-labelled SAM, both
thought to be precursors of the elusive MTR-cytokinins. Unfortunately, none of the
compounds visualized by TLC were fas- or mtr-dependent (Figures 4.16 and 4.17).
Determination of the expression profile of the mtr genes showed that also these genes were
regulated in a novel way: mtr expression could not be obtained in vitro under any of the
conditions tested (Figure 4.18), albeit that their in planta expression was comparable to
that of the fas genes (Figure 4.19). This result illustrates that laboratory media do not
necessarily mimic the physiological conditions of plants, a conclusion that has been drawn
before by Marco and colleagues for Pseudomonas syringae, another intimate plant-
pathogen interaction (Marco et al., 2005). Nevertheless, till now, there always seemed to
be a nice correlation between in vitro and in planta data (Pertry, 2009), but with the results
on the mtr genes, caution should be taken when making firm hypotheses or conclusions
based on in vitro results only. We succeeded in developing a system by which the in planta
expression could be brought in vitro (Figure 4.20) so that the feeding experiments can be
repeated and the mtr-dependent cytokinins will hopefully be identified. Finally, based on
reports on other pathogens, an alternative hypothesis could be formulated in which the
R. fascians MTR’s would function in cell wall formation (Lissina et al., 2014; Nishiuchi et
al., 2000; Whitfield et al., 1997) or in adhesion (Lissina et al., 2014). However, the lack of
a colony phenotype (data not shown) and the good epiphytic colonization (Figure 4.19)
rule out this possibility.
Altogether, the results obtained during this master thesis have illustrated clearly that a lot
remains to be discovered on the bacterial side of the interaction between R. fascians and its
plant host. Although some data are still preliminary and await confirmation, we have

Discussion
60
identified the GT1 gene as a putative novel member of the att regulon and a first invasion
factor that acts at the very onset of the interaction with the host. The finding that the
bacterial behavior is strongly dependent of the growth conditions was novel as well and
adds another interaction parameter to this multifaceted pathology. The results on the mtr
genes revealed that the regulation of the fas genes is even more complex than previously
anticipated (Pertry, 2009) and identification of the elusive MTR-cytokinins will require
novel and imaginative approaches.
Summary and perspectives
61
6. Summary and perspectives
Until now all the identified pathogenicity factors in R. fascians were located in unique
region U1 of the linear plasmid pFiD188. However, the function of the majority of genes
on the linear plasmid is still unknown. In this thesis two loci on pFiD188 were proven to
be essential for the pathogenicity of the bacteria: the glycosyltransferase GT1, situated in
unique region U2, and two SAM-dependent methyltransferases mtr1 and mtr2, located
immediately upstream of the fas operon in unique region U1.
Glycosyltransferase mutants were identified in a collection of transposon mutants of the
wild-type R. fascians strain D188 and strain 21D5 was selected based on its growth
impairment in LB medium supplemented with acetate. In this work, we further developed
this line of research and could show that the medium composition has a strong impact on
the appearance of the bacterial colonies. This finding illustrates that R. fascians can adjust
its shape in response to particular conditions, which might be of significant importance
during the interaction with the plant host. The mutant 21D5 exhibited a strong colony
morphology phenotype and coagulated when grown in liquid medium. Whereas these
phenotypes did not affect the growth potential of this mutant on rich media, it did result in
a complete inability to grow under nutrient deprivation, which might affect its epiphytic
fitness. Indeed, when we analyzed the virulence capacity of 21D5, a very severe
attenuation was revealed. The impaired symptom development induced by this mutant
coincided with a reduced fas gene expression resulting in a lower cytokinin production and
a defective att autoregulation affecting both the invasion ability and virulence gene
expression. Finally, the mutation in the GT1 gene strongly compromised the survival of
R. fascians on and in the plant tissues, indicating that the GT1 function is likely essential at
the onset of the interaction. This hypothesis was supported by the unique expression
profile: GT1 expression was induced by all the Krebs cycle intermediates that accumulate
in plants that sense the presence of R. fascians and this induction might be controlled by
AttR.
Although some of the generated data are still preliminary, based on all available
information, we would like to postulate a speculative working hypothesis for the role of the
GT1 locus in the R. fascians pathology. When R. fascians makes contact with a plant, this
host quickly reacts by altering its primary metabolism. The differential accumulation of

Summary and perspectives
62
Krebs cycle intermediates is sensed by the bacteria through the sensor histidine kinase
encoded by pFi_133 located upstream of the GT1 locus and leads to the activating
phosphorylation of the response regulator encoded by pFi_134. As a result, pFi_134
protein activates the transcription of the pFi_135-pFi_136 operon. Expression of this
operon is also controlled by AttR which is known to be activated upon perception of a
compatible host. As such, GT1 is produced and glycosylates the integral membrane protein
encoded by pFi_135 leading to the modification of the cell wall which determines biofilm
formation and adaptation to life on and in its host. Because this modification cannot occur
in 21D5, the way in which the bacterial cells interact with each other is modified, the
mutant is unable to adapt to the plant host environment, exhibits a strong loss of epiphytic
fitness, resulting in inadequate production of virulence factors an consequently, a very
poor pathogenicity.
Clearly, many aspect of this model remain to be substantiated by data, but if this is
successful, the GT1 locus will be identified as the earliest determinant of pathology of
R. fascians. The most important issues that need to be addressed are: 1) analyzing the
virulence of mutants in the 2-component regulatory system encode by pFi_133-pFi_134
and determining the expression profile of both genes; 2) establishing that the phenotypes of
21D5 are caused by the transposon mutation by doing complementation assays; 3)
confirming the expression profile of GT1 and its dependence of AttR; 4) demonstrating the
GT activity of GT1 and showing that pFi_135 is its substrate; 5) identifying the defect in
the 21D5 cell wall.
The two mtr mutants that have been created in previous work, were shown to be non-
pathogenic albeit that the levels of none of the fas-dependent cytokinins were strongly
altered. Moreover, S. turgidiscabies, the only other known microorganism know to induce
leafy galls, also has the mtr genes associated with its fas operon. These finding led us to
postulate that the R. fascians pathogenicity was determined by unidentified methylated
cytokinins. Because we anticipated that the mtr genes would be co-regulated with the fas
genes, we initiated a feeding experiment in which different R. fascians strains were grown
under fas-inducing conditions in the presence of 14
C-labelled adenine and 14
C-labelled
SAM; two S. turgidiscabies strains were included in the analysis as well. The supernatants
were extracted and the extracts analyzed by TLC. Unexpectedly, no fas- or mtr-dependent
compounds could be identified amongst the secreted compounds. When we evaluated the
Summary and perspectives
63
expression of the mtr genes grown in vitro under the fas-inducing conditions, much to our
surprise, both mtr’s were not expressed at all, showing that their expression is even more
tightly controlled than that of the fas genes. However, when the bacteria colonized the
host, a strong in planta expression, comparable to that of fasA, was observed. To permit
the identification of the mtr-dependent cytokinins, we set out to develop an assay in which
the in planta conditions could be brought to an in vitro system. By infecting plants and
crushing the infected tissue after 7 days in induction medium, we were able to detect a
considerable level of mtr gene expression after an overnight in vitro incubation period,
opening the path to the identification of the elusive methylated cytokinins. Unfortunately,
due to a lack of time, new feeding experiments could not be done during this thesis. A very
important implication of these results is the interpretation of the in vitro obtained data on
the spectrum of cytokinins produced by R. fascians. Indeed, in view of the current results it
seems very likely that the full capacity of cytokinin production and even of other plant
growth regulators is completely different and underestimated than what we think it is based
on all previous data.
Thus, the mtr genes and especially their reaction products hold great putative potential for
tissue culture, as they may represent very potent and novel plant growth regulators.
However, to finalize the mtr story, several topics will have to be tackled: 1) the feeding
experiment has to be repeated with crushed infected plant tissue and the extracts have to be
analyzed in multiple TLC systems with different mobile phases; 2) the labeled mtr-
dependent compounds have to be identified and traced back in infected plant tissues; 3) the
MTR proteins have to be expressed in a heterologous system and the SAM-dependent
methyl transfer to a cytokinin has to be demonstrated; 4) the mtr genes in S. turgidiscabies
have to be mutated and the effect on leafy gall development and the production of
methylated cytokinin has to be assessed; 5) the activity of the elusive methylated
cytokinins has to be tested on diverse and recalcitrant plants in tissue culture practices.
Altogether, the work described in this report is a considerable contribution to the
understanding of the pathogenicity process of R. fascians. Moreover, it opens new and
exciting research perspectives that might enable the use of R. fascians or its morphogens in
tissue culture practices or help horticulturists in safe guarding their ornamental crops from
this pathogen.

Summary and perspectives
64

References
65
7. References
Aittamaa M, Somervuo P, Laakso I, Auvinen P, Valkonen JP. Microarray-based
comparison of genetic differences between strains of Streptomyces turgidiscabies with
focus on the pathogenicity island Molecular Plant Pathology 2010; 11: 733-746.
Albesa-Jové D, Giganti D, Jackson M, Alzari PM, Guerin ME. Structure-function
relationships of membrane-associated GT-B glycosyltransferases. Glycobiology 2014;
24: 108-124.
Anand A, Mysore KS. Agrobacterium biology and crown gall disease. Dordrecht:
Springer, 2006.
Badreddine I, Lafitte C, Heux L, Skandalis N, Spanou Z, Martinez Y, et al. Cell wall
chitosaccharides are essential components and exposed patterns of the phytopathogenic
oomycete Aphanomyces euteiches. Eukaryotic cell 2008; 7: 1980-1993.
Bailey R, Schönrogge K, Cook JM, Melika G, Csóka G, Thuróczy C, et al. Host niches
and defensive extended phenotypes structure parasitoid wasp communities. Plos
Biology 2009; 7: 1-12.
Bartholdson SF, Brown AR, Mewburn BR, Clarke DJ, Fry SC, Campopiano DJ, et al.
Plant host and sugar alcohol induced exopolysaccharide biosynthesis in the
Burkholderia cepacia complex. Microbiology 2008; 154: 2513-2521.
Beattie GA, Lindow SE. The secret life of foliar bacterial pathogens on leaves. Annual
Review of Phytopathology 1995; 33: 145-172
Beattie GA, Lindow SE. Bacterial colonization of leaves: a spectrum of strategies.
Phytopathology 1999; 89: 353-359.
Berg S, Kaur D, Jackson M, Brennan PJ. The glycosyltransferases of Mycobacterium
tuberculosis - roles in the synthesis of arabinogalactan, lipoarabinomannan, and other
glycoconjugates. Glycobiology 2007; 17: 35R-56R.
Birch RG. Xanthomonas albilineans and the antipathogenesis approach to disease
control. Molecular Plant Pathology 2001; 2: 1-11.
Bizzini A, Majcherczyk P, Beggah-Möller S, Soldo B, Entenza JM, Gaillard M, et al.
Effects of α-phosphoglucomutase deficiency on cell wall properties and fitness in
Streptococcus gordonii. Microbiology 2007; 153: 490-498.
Boher B, Nicole M, Potin M, Geiger JP. Extacellular polysaccharides from
Xanthomonas axonoplodis pv. manihotis interact with cassava cell walls during
pathogenesis. Molecular Plant-Microbe Interactions Journal 1997; 10: 803-811.
Campbell JA, Davies GJ, Bulone V, Henrissat B. A classification of nucleotide-
diphospho-sugar glycosyltransferases based on amino acid sequence similarities.
Biochemical Journal 1997; 326: 929-939.

References
66
Cantaloube S, Veyron-Churlet R, Haddache N, Daffé M, Zerbib D. The
Mycobacterium tuberculosis FAS-II dehydratases and methyltransferases define the
specificity of the mycolic acid elongation complexes. Plos One 2011; 6: 1-11.
CBI. The plants and young plant material market in the EU, Centre for the promotion
of imports from developing countries (Ed) CBI, Rotterdam, The Netherlands.:
Available online: www.cbi.nl/marketinfo/cbi/, 2006.
Champion MD. Host-pathogen o-methyltransferase similarity and its specific presence
in highly virulent strains of Francisella tularensis suggests molecular mimicry. Plos
One 2011; 6: 1-12.
Chou FL, Chou HC, Lin YS, Yang BY, Lin NT, Weng SF, et al. The Xanthomonas
campestris gumD gene required for synthesis of xanthan gum is involved in normal
pigmentation and virulence in causing black rot. Biochemical and Biophysical
Research Communications 1997; 233: 265–269.
Collmer A. Determinants of pathogenicity and avirulence in plant pathogenic bacteria.
Current Opinion in Plant Biology 1998; 1: 329-335.
Cornelis K, Ritsema T, Nijsse J, Holsters M, Goethals K, Jaiziri M. The plant pathogen
Rhodococcus fascians colonizes the exterior and interior of the aerial parts of plants.
Molecular Plant-Microbe Interactions Journal 2001; 14: 599-608.
Cornelis K, Maes T, Jaziri M, Holsters M, Goethals K. Virulence genes of the
phytopathogen Rodococcus fascians show specific spatial and temporal expression
patterns during plant infection. Molecular Plant-Microbe Interactions Journal 2002; 15:
398-403.
Coutinho PM, Deleury E, Davies GJ, Henrissat B. An evolving hierarchical family
classification for glycosyltransferases. Journal of Molecular Biology 2003; 328: 307-
317.
Crespi M, Messens E, Caplan AB, van Montagu M, Desomer J. Fasciation induction
by the phytopatogen Rhodococcus fascians depends upon a linear plasmid encoding a
cytokinin synthase gene. EMBO Journal 1992; 11: 795-804.
Crespi M, Vereecke D, Temmerman W, Van Montagu M, Desomer J. The fas operon
of Rhodococcus fascians encodes new genes required for efficient fasciation of host
plants. Journal of Bacteriology 1994; 176: 2492-2501.
Cuccui J, Wren BW. Bacteria like sharing their sweets. Molecular Microbiology 2013;
89: 811-815.
de Boer SH, Wieczorek A, Kummer A. An ELISA test for bacterial ring rot of potato
with a new monoclonal antibody. Plant Disease 1988; 72: 874-878.
de O Manes CL, Beeckman T, Ritsema T, Van Montagu M, Goethals K, Holsters M.
Phenotypic alterations in Arabidopsis thaliana plants caused by Rhodococcus fascians
infection. Journal of Plant Research 2004; 117: 139-145.

References
67
Depuydt S, Dolezal K, Van Lijsebettens M, Moritz T, Holsters M, Vereecke D.
Modulation of the hormone setting by Rhodococcus fascians results in ectopic KNOX
activation in Arabidopsis. Plant Physiology 2008; 146: 1267-1281.
Depuydt S, De Veylder L, Holsters M, Vereecke D. Eternal youth, the fate of
developing Arabidopsis leaves upon Rhodococcus fascians infection. Plant Physiology
2009a; 149: 1387-1398.
Depuydt S, Trenkamp S, Fernie AR, Elftieh S, Renou J, Vuylsteke M, et al. An
integrated genomics approach to define niche establishment by Rhodococcus fascians.
Plant Physiology 2009b; 149: 1366-1386.
Desaki Y, Miya A, Venkatesh B, Tsuyumu S, Yamane H, Kaku H, et al. Bacterial
lipopolysaccharides induce defense responses associated with programmed cell death
in rice cells. Plant and Cell Physiology 2006; 47: 1530–1540.
Desomer J, Dhaese P, Van Montagu M. Conjugative transfert of cadmium resistance
plasmids in Rhodococcus fascians strains. Journal of Bacteriology 1988; 170: 2401-
2405.
Donnelly PM, Bonetta D, Tsukaya H, Dengler NG. Cell cycling and cell enlargement
in developing leaves of Arabidopsis. Developmental Biology 1999; 215: 407-419.
Dover LG, Cerdeño-Tárraga AM, Pallen MJ, Parkhill J, Besra GS. Comparative cell
wall core biosynthesis in the mycolated pathogens, Mycobacterium tuberculosis and
Corynebacterium diphtheriae. FEMS Microbiology Reviews 2004; 28: 225-250.
Dow JM, Crossman L, Findlay K, He YQ, Feng JX, Tang JL. Biofilm dispersal in
Xanthomonas campestris is controlled by cell–cell signaling and is required for full
virulence to plants. PNAS 2003; 100: 10995–11000.
Dyakov Y, Dzhavakhiya V, Korpela T. Comprehensive and molecular phytopathology,
2007.
Forizs L, Lestrade S, Mol A, Dierick JF, Gerbaux C, Diallo B, et al. Metabolic shift in
the phytopathogen Rhodococcus fascians in response to cell-free extract of infected
tobacco plant tissues. Current Microbiology 2009; 58: 483-487.
Forizs L. Metabolism and pathogenicity in the phytopathogen Rhodococcus fascians.
PhD thesis. Université Libré de Bruxelles, Brussels, Belgium, 2012, pp. 171.
Francis I, Gevers D, Karimi M, Holsters M, Vereecke D. Linear plasmids and
phytopathogenicity. Vol 7: Microbial Linear Plasmids. Berlin: Springer-Verlag, 2007.
Francis I, Holsters M, Vereecke D. The Gram-positive side of plant-microbe
interactions. Environmental Microbiology 2010; 12: 1-12.
Francis I, De Keyser A, De Backer P, Simón-Mateo C, Kalkus J, Pertry I, et al.
pFiD188, the Linear Virulence Plasmid of Rhodococcus fascians D188 Molecular
Plant-Microbe Interactions Journal 2012; 25: 637-647.
References
68
Galbraith DW, Bourque DP, Bohnert HJ. Methods in plant cell biology - Part B. Vol
50. London: Academi Press, inc., 1995.
Galuszka P, Popelková H, Werner T, Frébortová J, Pospísilová H, Mik V, et al.
Biochemical characterization of cytokinin oxidases/dehydrogenases from Arabidopsis
thaliana expressed in Nicotiana tabacum L. Journal of Plant Growth Regulation 2007;
26: 255-267.
Gelvin SB. Agrobacterium and plant genes involved in T-DNA transfer and
integration. Annual Review of Plant Physiology and Plant Molecular Biology 2000;
51: 223-256.
Gelvin SB. Plant proteins involved in Agrobacterium-mediated genetic transformation.
Annual Review of Phytopathology 2010; 48: 45-68.
Goethals K, Montagu M, Holsters M. Conserved motifs in a divergent nod box of
Azorhizobium caulinodans ORS571 reveal a common structure in promoters regulated
by LysR-type proteins. PNAS 1992; 89: 1646-1650.
Goethals K, Vereecke D, Jaziri M, Van Montagu M, Holsters M. Leafy gall formation
by Rhodococcus fascians. Annual Review of Phytopathology 2001; 39: 27-52.
Goodfellow M. Reclassification of Corynebacterium fascians (Tilford) Dowson in the
Genus Rhodococcus, as Rhodococcus fascians comb. nov. Systematic and Applied
Microbiology 1984; 5: 225-229.
Gottwald TR, Graham JH, Schubert TS. Citrus canker: The pathogen and its impact.
Plant Health Progress 2002.
Guerin M, Kordulakova J, Schaeffer F, Svetlikova Z, Gicquel B, Mikusova K, et al.
Molecular recognition and interfacial catalysis by the essential phosphatidylinositol
mannosyltransferase PimA from mycobacteria. The Journal of Biological Chemistry
2007; 282: 20705-20714.
Gürtler V, Mayall BC, Seviour R. Can whole genome analysis refine the taxonomy of
the genus Rhodococcus? FEMS Microbiology Reviews 2004; 28: 377-403.
Hashimi SM, Birch RG. Functional analysis of genes for benzoate metabolism in the
albicidin biosynthetic region of Xanthomonas albilineans. Applied Microbiology and
Biotechnology 2010; 87: 1475–1485.
Hayward A, Stone G. Oak gall wasp communities: Evolution and ecology. Basic and
Applied Ecology 2005; 6: 435-443.
Hsiao YM, Liu YF, Fang MC, Song WL. XCC2731, a GGDEF domain protein in
Xanthomonas campestris, is involved in bacterial attachment and is positively
regulated by Clp Microbiological research 2011; 166: 548-565.
Hu Y, Chen L, Ha S, Gross B, Falcone B, Walker D, et al. Crystal structure of the
MurG:UDP-GlcNAc complex reveals common structural principles of a superfamily of
glycosyltransferases. PNAS 2003; 100: 845-849.
References
69
Ichiyama S, Shimokata K, Tsukamura M. Carotenoid pigments of genus Rhodococcus.
Microbiology and Immunology 1989; 33: 503-508.
Joshi M, Loria R. Streptomyces turgidiscabies possesses a functional cytokinin
biosynthetic pathway and produces leafy galls. Molecular Plant-Microbe Interactions
Journal 2007; 20: 751–758.
Katz JE, Dlakic M, Clarke S. Automated identification of putative methyltransferases
from genomic open reading frames. Molecular & Cellular Proteomics 2003; 2: 525-
540.
Kers JA, Cameron KD, Joshi MV, Bukhalid RA, Morello JE, Wach MJ, et al. A large,
mobile pathogenicity island confers plant pathogenicity on Streptomyces species.
Molecular Microbiology 2005; 55: 1025–1033.
Kevers C, Franl T, Strasser RJ, Dommes J, Gaspar T. Hyperhydricity of
micropropagated shoots: a typically stress-induced change of physiological state. Plant
Cell, Tissue and Organ Culture 2004; 77: 181-191.
Kuramitsu HK. Proprieties of a mutant of Streptococcus mutans altered in
glucosyltransferase activity. Infection and Immunity 1976; 13: 345-353.
Lacey MS. The development of filter-passing organisms in Corynebacterium fascians
cultures. Annals of Applied Biology 1961; 49: 634-644.
Li J, Wang N. The gpsX gene encoding a glycosyltransferase is important for
polysaccharide production and required for full virulence in Xanthomonas citri subsp.
citri. BMC Microbiology 2012; 12: 31.
Lissina E, Weiss D, Young B, Rella A, Cheung-Ong K, Del Poeta M, et al. A novel
small molecule methyltransferase is important for virulence in Candida albicans. ACS
Chemical Biology 2014; 8: 2785-2793.
Loria R, Kers J, Joshi M. Evolution of plant pathogenicity in Streptomyces. Annual
Review of Phytopathology 2006; 44: 469-487.
Lorite GS, Richard J, Clerici JH. Surface Physicochemical Properties at the Micro and
Nano Length Scales: Role on Bacterial Adhesion and Xylella fastidiosa Biofilm
Development Plos One 2013; 8: e75247.
Maes T, Vereecke D, Ritsema T, Cornelis K, Thi Thu HN, Van Montagu M, et al. The
att locus of Rhodococcus fascians strain D188 is essential for full virulence on tobacco
through the production of an autoregulatory compound. Molecular Microbiology 2001;
42: 13-28.
Marco ML, Legac J, Lindow SE. Pseudomonas syringae genes induced during
colonization of leaf surfaces. Environmental Microbiology 2005; 7: 1379-1391.
Miller ML, Putnam ML, Kraus J. Survival and spread of Rhodococcus fascians in
greenhouse grown herbaceous perennials. Phytopathology 2007; 97 (Suppl.).

References
70
Miller ML, Putnam ML. Pathogenicity testing of Agrobacterium tumefaciens and
Rhodococcus fascians isolates on micropropagated plants. Phytopathology 2008; 98
(Suppl.).
Nester EW, Kosuge T. Plasmids specifying plant hyperplasias. Annual Review of
Microbiology 1981; 35: 531-565.
Netea MG, Brown GD, Kullberg BJ, Gow NA. An integrated model of the recognition
of Candida albicans by the innate immune system. Nat. Rev. Microbiol. 2008; 6: 67–
78.
Nishiuchi Y, Baba T, Yano I. Mycolic acids from Rhodococcus, Gordonia, and
Dietzia. Journal of microbiological methods 2000; 40: 1-9.
Paterson GK, Cone DB, Peters SE, Maskell DJ. The enzyme phosphoglucomutase
(Pgm) is required by Salmonella enterica serovar Typhimurium for O-antigen
production, resistance to antimicrobial peptides and in vivo fitness. Microbiology 2009;
155: 3403-3410.
Pertry I. How the fas locus contribues to Rhodococcus fascians cytokinin production:
an in-depth molecular and biochemical analysis. PhD thesis. Ghent University, Ghent,
Belgium, 2009, pp. 170.
Pertry I, Václavíková K, Depuydt S, Galuska P, Spíchal L, Temmerman W, et al.
Identification of Rhodococcus fascians cytokinins and their modus operandi to reshape
the plant. Proc Natl Acad Sci USA 2009; 106: 929-934.
Pertry I, Václavíková K, Gemrotová M, Spíchal L, Galuszka P, Depuydt S, et al.
Rhodococcus fascians impacts plant development through the dynamic Fas-mediated
production of a cytokinin mix. Molecular Plant-Microbe Interactions Journal 2010; 23:
1164-1174.
Pitzschke A, Hirt H. New insights into an old story: Agrobacterium-induced tumour
formation in plants by plant transformation. EMBO J. 2010; 29: 1021-1032.
Putnam ML, Miller ML. It is crown gall or leafy gall? Digger 2006; 50: 39-46.
Putnam ML, Miller ML. Rhodococcus fascians in herbaceous perennials. Plant Dis.
2007; 91: 1064-1076.
Putnam M. Demystifying Rhodococcus fascians. Digger 2014: 33-37.
Rajaoson S, Vandeputte OM, Vereecke D, Kiendrebeogo M, Ralambofetra E, Stévigny
C, et al. Virulence quenching with a prenylated isoflavonone renders the Malagasy
legume Dalbergia pervillei resistant to Rhodococcus fascians. Environmental
Microbiology 2011; 13: 1236-1252.
Rédei GP. Encyclopedia of genetics, genomics, proteomics, and informatics, 2008.
Schaeffer ML, Khoo KH, Besra GS, Chatterjee D, Brennan PJ, Belisle JT, et al. The
pimB gene of Mycobacterium tuberculosis encodes a mannosyltransferase involved in
References
71
lipoarabinamannan biosynthesis. The Journal of Biological Chemistry 1999; 274:
31625-31631.
Simeone R, Huet G, Constant P, Malaga W, Lemassu A, Laval F, et al. Functional
characterisation of three O-methyltransferases involved in the biosynthesis of
phenolglycolipids in Mycobacterium tuberculosis. Plos One 2013; 8: 1-13.
Simón-Mateo C, Depuydt S, de Oliveira Manes CL, Cnudde F, Holsters M. The
phytopathogen Rhodococcus fascians breaks apical dominance and activates axillary
meristems by inducing plant genes involved in hormone metabolism. Molecular Plant
Pathology 2006; 7: 103-112.
Stes E, Holsters M, Vereecke D. Phytopathogenic strategies of Rhodococcus fascians.
Vol 16: Biology of Rhodococcus. Berlin: Springer-Verlag, 2010.
Stes E, Vandeputte OM, El Jaziri M, Holsters M, Vereecke D. A successful bacterial
coup d'état: how Rhodococcus fascians redirects plant development. Annual Review of
Phytopathology 2011; 49: 1-118.
Stes E, Prinsen E, Holsters M, Vereecke D. Plant-derived auxin plays an accessory role
in symptom development upon Rhodococcus fascians infection. The Plant Journal
2012; 70: 513-527.
Stes E, Francis I, Pertry I, Dolzblasz A, Depuydt S, Vereecke D. The leafy gall
syndrome induced by Rhodococcus fascians. FEMS Microbiology Letters 2013; 342:
187-194.
Struck AW, Thompson ML, Wong LS, Micklefield J. S-adenosyl-methionine-
dependent methyltransferases: highly versatile enzymes in biocatalysis, biosynthesis
and other biotechnological applications. Chembiochem 2012; 13: 2642-2655.
Sundin GW, Jacobs JL. Ultraviolet radiation (UVR) sensitivity analysis and UVR
survival strategies of a bacterial community from the phyllosphere of field-grown
peanut (Arachis hypogeae L.). Microbial Ecology 1999; 38: 27-38.
Taniguchi N, Honke K, Fukuda M. Handbook of Glycosyltransferase and Related
Genes. Tokyo, 2002.
Taniguchi N, Nakano K, Nomura R, Naka S, Kojima A, Matsumoto M, et al. Defect of
glucosyltransferases reduces platelet aggregation activity of Streptococcus mutans:
analysis of clinical strains isolated from oral cavities. Archives of Oral Biology 2010;
55: 410-416.
Tarkowski P, Vereecke D. Threats and opportunities of plant pathogenic bacteria.
Biotechnol Advances 2014; 32: 215-229.
Temmerman W, Vereecke D, Dreesen R, Montagu M, Holsters M, Goethals K. Leafy
gall formation is controlled by fasR, an AraC-type regulatory gene in Rhodococcus
fascians. Journal of bacteriology 2000; 182: 5832-5840.
Tilford PE. Fasciation of sweet peas caused by Phytomonas fascians n.sp. . African

References
72
Journal of Agricultural Research 1936; 53: 383-394.
Vandeputte OM, Öden S, Mol A, Vereecke D, Goethals K, El Jaziri M, et al.
Biosynthesis of auxin by the Gram-positive phytopathogen Rhodococcus fascians is
controlled by compounds specific to infected plant tissues. Applied and Environmental
Microbiology 2005; 71: 1169-1177.
Vereecke D, Burssens S, Simón-Mateo C, Inzé D, Van Montagu M, Goethals K, et al.
The Rhodococcus fascians - plant interaction: morphological traits and
biotechnological applications. Planta 2000; 210: 241-251.
Vereecke D, Cornelis K, Temmerman W, Holsters M, Goethals K. Versatile
persistence pathways for pathogens of animals and plants. Trends in Microbiology
2002a; 10: 485-488.
Vereecke D, Cornelis K, Temmerman W, Jaziri M, Van Montagu M. Chromosomal
locus that affects the pathogenicity of Rhodococcus fascians. Journal of Bacteriology
2002b; 184: 1112-1120.
Wagner GK, Pesnot T. Glycosyltransferases and their assays. Chembiochem 2010; 11:
1939-1949.
Whitfield C, Amor PA, Koplin R. Modulation of the surface architecture of gram-
negative bacteria by the action of surface polymer:lipid A-core ligase and by
determinants of polymer chain length. Molecular Microbiology 1997; 23: 629-638.

Annexes
73
8. Annexes
Figure 8.1 Colony morphology of the wild-type R. fascians strain D188, the attenuated
mutant D188-att1, and the non-pathogenic mutant D188-fas1 grown on different media. Photos of representative colonies after 4 days of growth at 28°C were taken with a binocular and
the ProRes®CapturePro 2.8 software (exposure time of 650ms).
D188 D188-fas1D188-att1
1mm 1mm1mm
1mm
1mm
1mm
1mm
1mm
1mm
0.5mm 1mm
0.5mm1mm
1mm 1mm
0.5mm 1mm
1mm 1mm
1mm 1mm
LB
YE
BM
inA
+
Gal
l(2
0µ
l/m
L)
Min
AM
inA
+
Pyr
(20m
M)
Min
A+
His
(5m
M)
/Pyr
(20m
M)
Min
A+
Pla
nt
(20µ
l/m
L)

Annexes
74
Figure 8.2 Colony morphology of the wild-type R. fascians strain D188 and three GT1
transposon mutants 45F10, 41H2 and 40G10, grown on different media. Photos of representative colonies after 4 days of growth at 28°C were taken with a binocular and
the ProRes®CapturePro 2.8 software (exposure time of 650ms).
1mm
1mm
41H2
1mm
1mm
1mm
1mm
1mm
1mm
1mm
D188
1mm
1mm
40G10
1mm
1mm
45F10
0.5mm 0.5mm 0.5mm
1mm 0.5mm0.5mm
1mm 0.5mm 1mm
1mm 0.5mm 0.5mm
1mm 0.5mm 1mm
LB
YE
BM
inA
+
Gal
l(2
0µ
l/m
L)
Min
AM
inA
+
Pyr
(20m
M)
Min
A+
His
(5m
M)
/Pyr
(20m
M)
Min
A+
Pla
nt
(20µ
l/m
L)

Annexes
75
Figure 8.3 Overview of significant changes in the primary metabolism upon infection with
R. fascians D188 when compared with D188-5 infection. Green and red represent compounds of which the concentration increases or decreases with time,
respectively. Grey indicates no significant changes. Red boxes are the C-sources used in the
induction assays. Acetate is in the form of Acetyl-CoA and Histidine can be transformed in 2-
oxoglutarate (Depuydt et al., 2009b).