ideal free distribution: experiment with turtles · 1 ideal free distribution: experiment with...
TRANSCRIPT

1
Ideal Free Distribution: Experiment with Turtles
Karla Cabello, George Liu, Julia Levay, Julian James, Ray Pache, Michael Perez
University of Miami
Biology Department
Coral Gables, Florida
Abstract
In our experiment we tested the ideal free distribution on turtles. The ideal free
distribution is the ecological hypothesis that if animals have a free choice of where to find food,
they will distribute themselves in a way that optimizes the food intake of each individual. We did
this test by feeding turtles in a pond. After collecting our data we were able to reject our null
hypothesis proving that other organisms such as turtles use the ideal free distribution.
Introduction
“The remarkable ability of groups of animals to divide themselves rapidly and precisely
among 2 or more feeding sites in proportion to their rate of food delivery results in one of the
best matches between theory and observation in contemporary behavioral ecology.” Talbot and
Kramer (1986) made this statement about the marvels of the theory we call the Ideal Free
Distribution. The Ideal Free Distribution is an ecological concept that, if animals have a free
choice of where to feed, they will distribute themselves so that each makes as large a profit as it
possibly can. The theory of Ideal Free Distribution (IFD) was first introduced by Steve Fretwell
and Henry Lucas in 1970 and has continued to be tested throughout the years with several
different types of organisms.

2
As an example of the IFD, suppose a group of 11 monkeys encounter 4 large mango
trees. The monkeys estimate that there are 15 fruits on one tree, 6 fruits on another tree, 9 fruits
on the third tree and 3 fruits on the last tree. Using the theory of IFD, you would predict that
there would be 5 monkeys on the first tree, 2 on the 2nd, 3 on the 3rd, and 1 on the 4th tree. This
ecological concept is utilized daily by both humans and animals and states the way organisms
will distribute themselves among several patches of resources.
Another distribution that could occur in animals is the Ideal Despotic Distribution (IDD).
The IDD differs from the IFD in that one animal dominates and monopolizes the biggest source
of food. In our study it would be caused by a dominant turtle warding off other turtles, so the
others would be forced to go elsewhere. The null hypothesis is that the animals would distribute
themselves randomly, neither with the IFD or IDD.
The IFD has been tested many times using many different animals. Roe deer have been
tested by Kjell Walhström and Petter Kjellander (1995) near Stockholm Sweden. Tadpoles have
been tested by Dheeraj K Veeranagoudar, Bhagyashiri A Shanbag, and Srinivas K Saidapur in
India (2004), raised in an aquarium caught from a stream in India. Cranes have been used by
LM. Bautista J.C.Alonso J.A.Alonso (1995) in lake basin, NE spain. Black bears have been
tested by Jon P. Beckmann and Joel Berger (2003) in Nevada. Even the simplest creatures such
as gold fish have been tested by W. J. Sutherland, C. R. Townsend and J. M. Patmore (1988) in
Great Britain who used a 60x30x30 cm tank. So this shows that animals of all sorts and sizes can
be used to test this theory.
In our case we used turtles, which is not a common animal used to test ideal free
distribution. Our experiment’s setting is at a pond in Florida International University. In our
3
experiment, we divided into two or three groups. Each group threw a different amount of food
every 30 seconds and counted 10 seconds later. In that way, we tested ideal free distribution on
turtles.
METHODS
Our experiment was performed on red-eared sliders and soft shelled turtles in June 2009,
at a pond at the Florida International University, University Park campus
Materials: For our feeding source, we used Wardley’s pond pellets and we purchased it
from Pet Supermarket. The other materials that were used were measuring spoons (tablespoon,
½-tablespoon, teaspoon, ½-teaspoon) for throwing the food, a stop watch for keeping time, and
paper cups for storing the food.
Location: The location of the experiment was at a Florida International University pond
that was about 1 acre in size (Figure 1). This location was a good place to perform the
experiment, because the water was clear and there was not much vegetation in the water to
interfere with the view of either the turtles or experimentera. Besides the turtles, there were
fishes in the pond, including tilapia, Oscars, and catfish. There were occasionally ducks, but they
were some absent from the experimental area. We estimate that there were more than 100 turtles,
mostly red-eared sliders.
Time: The experiments were performed on 6/19/09, 6/22/09, 6/24/09 and 6/26/09 in the
morning. The weather was calm and warm. The calm weather made the experiment easier.
Procedures: On June 19 and 22, we performed experiments with two feeding stations. At
each feeding station, a team of students did the feeding of turtles and recording of data. The
4
feeding stations were called “left” and “right”. When there were two feeding stations and teams,
we used a tablespoon and a teaspoon. The teams were about three meters apart. There was a time
keeper keeping track of the time. Every 30 seconds, the timekeeper would say “throw the food”.
Every ten seconds after the time keeper said “count” and we count the number of turtles. After
we counted the turtles, we recorded the number of turtles and the time. After 15 minutes, we
switched spoons and recorded data on that position. We switched to another position to see if the
turtles would follow the food.
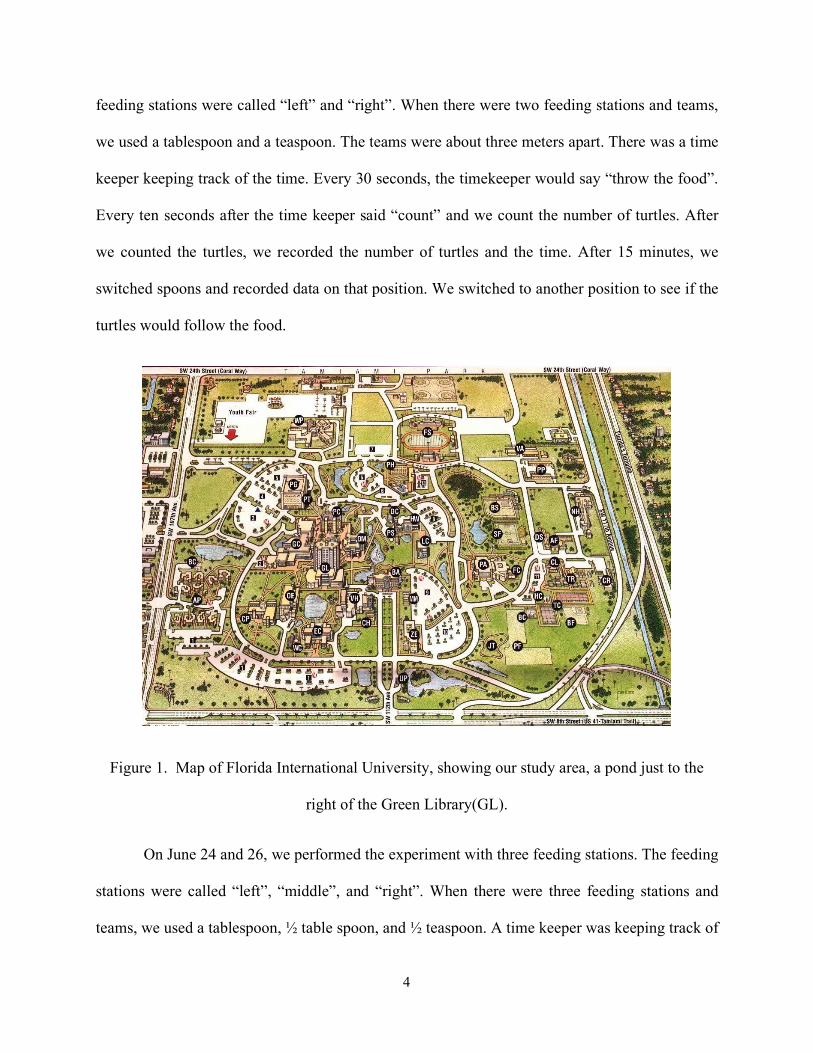
Figure 1. Map of Florida International University, showing our study area, a pond just to the
right of the Green Library(GL).
On June 24 and 26, we performed the experiment with three feeding stations. The feeding
stations were called “left”, “middle”, and “right”. When there were three feeding stations and
teams, we used a tablespoon, ½ table spoon, and ½ teaspoon. A time keeper was keeping track of

5
the time. There were two members in each team. In each team, one person was throwing the food
and one person was recording the data. Otherwise the procedure was exactly the same except
there three teams.
RESULTS
In our four experiments, two feeding stations were used in the first two experiments;
three stations were used in the 2nd two experiments. One feeding station was given a teaspoon
and the other was given the tablespoon to feed the turtles with. After 15 minutes, the spoons
were switched.
Experiment 1 (June 19): Two feeding stations were used, left and right. The results are
shown in Figure 2. The count of turtles at the left station is in red, and the count of turtles at the
right feeding station is blue. The left station initially had a tablespoon and the right feeding
station had a teaspoon. After 15 minutes the spoons were switched. The Means and Standard
Deviation is as follows (Table 1):
Table 1 Mean and St Dev of turtle number of Experiment 1, before and after switch.
Mean Std. Dev.
Left (tablespoon) 31.6 3.6
Right (teaspoon) 6.5 2.0
Left (teaspoon) 7.9 2.4
Right (tablespoon 27.0 5.7

6
Figure 2. Counts of turtles in Experiment 1.
Experiment 2 (June 22): Two feeding stations were used. The results are shown in
Figure 3. The count of turtles at the left station is red, and the count of turtles at the right station
is blue. The left feeding station initially had a tablespoon and the right feeding station had a
teaspoon, After 15 minutes the spoons were switched. The Means and Standard Deviation are
shown as follows (Table 2).
Table 2. Mean and St Dev of turtle number of Experiment 2, before and after switch.
Mean Std. Dev.
Left (tablespoon) 43.6 5.2
Right (teaspoon) 13.5 3.6
Left (teaspoon) 17.5 3.6
Right (tablespoon) 44.9 7.8

7
Figure 3. Count of turtles in Experiment 2.
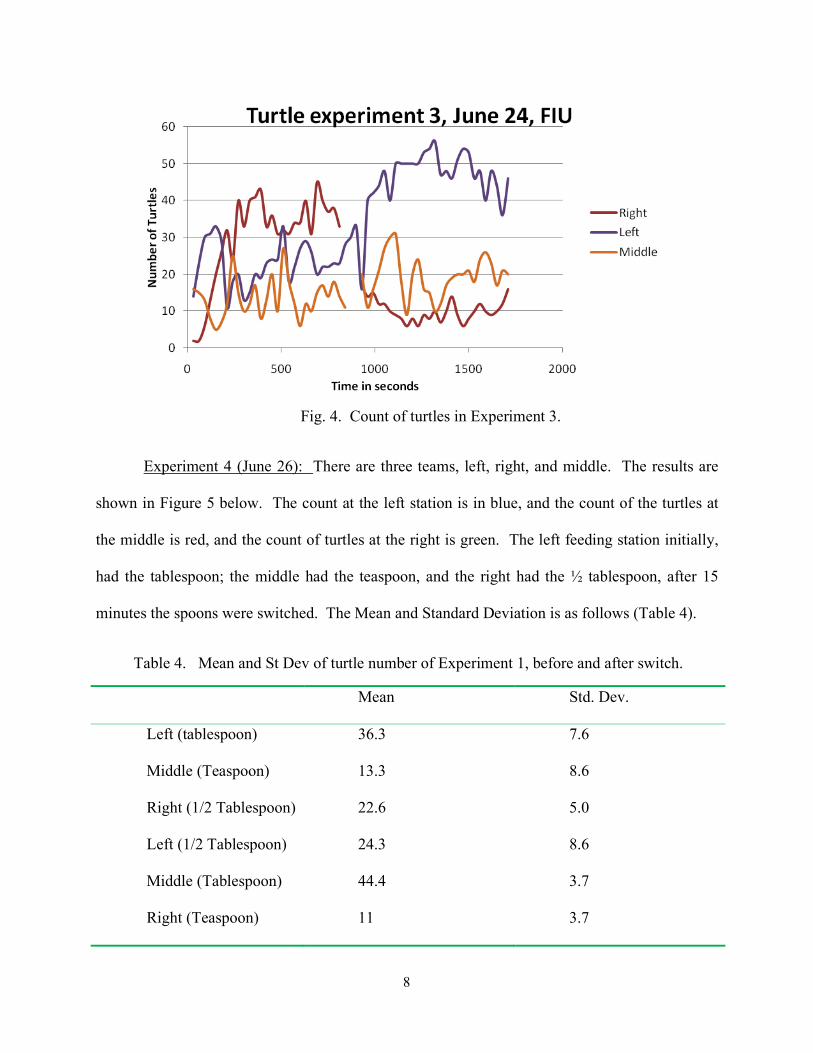
Experiment 3 (June 24): In this experiment there were three feeding stations. The results
are shown at Figure 4. The count of turtles at the left station is blue, the count for turtles at the
middle station is orange, and the count at the right station is red. The left feeding station had the
½ Tablespoon, the middle had teaspoon, and the right had Tablespoon. After 15 minutes the
spoons were switched. The means and Standard Deviation are as follows in Table 3.
Table 3. Mean and St Dev of turtle number of Experiment 3, before and after switch.
Mean Std. Dev.
Left (1/2 tablespoon) 22.7 5.9
Middle (Teaspoon) 18.9 10.8
Right (Tablespoon) 30.3 12.2
Left (Tablespoon) 46.0 7.5
Middle(1/2 Tablespoon) 17.9 5.1
Right (Teaspoon) 13.6 3.7
8
Fig. 4. Count of turtles in Experiment 3.
Experiment 4 (June 26): There are three teams, left, right, and middle. The results are
shown in Figure 5 below. The count at the left station is in blue, and the count of the turtles at
the middle is red, and the count of turtles at the right is green. The left feeding station initially,
had the tablespoon; the middle had the teaspoon, and the right had the ½ tablespoon, after 15
minutes the spoons were switched. The Mean and Standard Deviation is as follows (Table 4).
Table 4. Mean and St Dev of turtle number of Experiment 1, before and after switch.
Mean Std. Dev.
Left (tablespoon) 36.3 7.6
Middle (Teaspoon) 13.3 8.6
Right (1/2 Tablespoon) 22.6 5.0
Left (1/2 Tablespoon) 24.3 8.6
Middle (Tablespoon) 44.4 3.7
Right (Teaspoon) 11 3.7

9
Figure 5. Count of turtles in Experiment 4.
DISCUSSION
Our null hypothesis for this experiment was that there would be a random distribution of
turtles, as opposed to the turtles using our alternative hypothesis, the Ideal Free Distribution.
Based on the data from our experiments, we conclude that the data allow us to reject the null
hypothesis. The results show, overall, that the spoon size (that is, the amount of food offered) are
roughly proportional to the number of turtles at each site.
Throughout the experiment, there were a few factors that may have caused variability in
the turtle count data. These factors include uncontrolled variables such as, the small fish
interfering with the turtle food, the difference in sizes of the turtles, and the satiation of turtles.
Human error also could have altered the results of our experiment such as through inconsistent
throws and rough estimates in counting. Looking at our data, we can conclude that, although they
caused a small amount of variation in our data, these factors did not make a significant enough
difference in our data to alter our conclusion.

10
We observed some fighting and bit of despotic behavior between two soft-shells. We also
noticed the technique turtles used, first they would watch at a distance then pick out a spot where
there was more food or less turtles and they would stay there almost all throughout the
experiment. So there were usually more turtles at the larger piles, proving the ideal free
distribution.
There are different variations that could have been done with this experiment. Turtles
could be studied individually or marked to see how they interact with other turtles with their
regular food.
This experiment indicates that turtles, along with other animals and humans, use the Ideal
Free Distribution. They may not know what it is called, but, to them, it comes naturally.
Acknowledgments
We appreciate the help of: Howard Hughes medical institute-funding, Dr.Donald
DeAngelis-faculty mentor, Jiang Jiang-Graduate student mentor, Dr. Dana Krempels- program
manager , Dr. Micheal Gaines- principle investigator, Jessica Kirsner-Undergraduate mentor,
Ms.Maureen Obrien-MDCPS science teacher, and Ms.Brenda Strachan-MDCPS teacher.

11
References
Bautista, L.M., Alonso, J.C., Alonso, J.A. 1995. A field test of ideal free distribution in
flock-feeding common cranes. J. Anim. Ecol, 64, 747-757.
Beckmann, J.P., Berger, J. 2003. Using black bears to test ideal-free distribution models
experimentally. Journal of mammalogy, 84, 594-606.
Fretwell, S.D., Lucas, H.L. 1970. On territorial behavior and other factors influencing
habitat distribution in birds. I. Theoretical development. Acta Biotheor, 19, 16-36.
Sutherland, W.J., Townsend, C.R., Patmore, J. M. 1988. A test of the ideal free
distribution with unequal competitors. Behav Ecol Sociobiol, 23, 51-53.
Talbot, A.J., Kramer, D.L. 1986. Effects of food and oxygen availability on habitat
selection by guppies. Can J Zool, 64, 88-93.
Veeranagoudar, D.K., Shanbag, B.A., Saidapur, S.K. 2004. Foraging behavior in tadpoles
of the bronze froRana temporalis: Experimental evidence for the ideal free distribution. Journal
of Biosciences, 29, 201-207.
Wahlström, L.K., Kjellander, F. 1995. Ideal free distribution and natal dispersal in
female roe deer. Oecologia, 103,302-308.