i/dd members and dsrip: data initiatives promoting quality...
TRANSCRIPT
I/DD Members and DSRIP:
Data Initiatives Promoting Quality Outcomes for Individuals with Disabilities
June 2, 2016
Saratoga, NY
Douglas G. Fish, MDMedical DirectorDivision of Program Development and ManagementOffice of Health Insurance ProgramsNew York State Department of Health
2
Objectives
June 2016
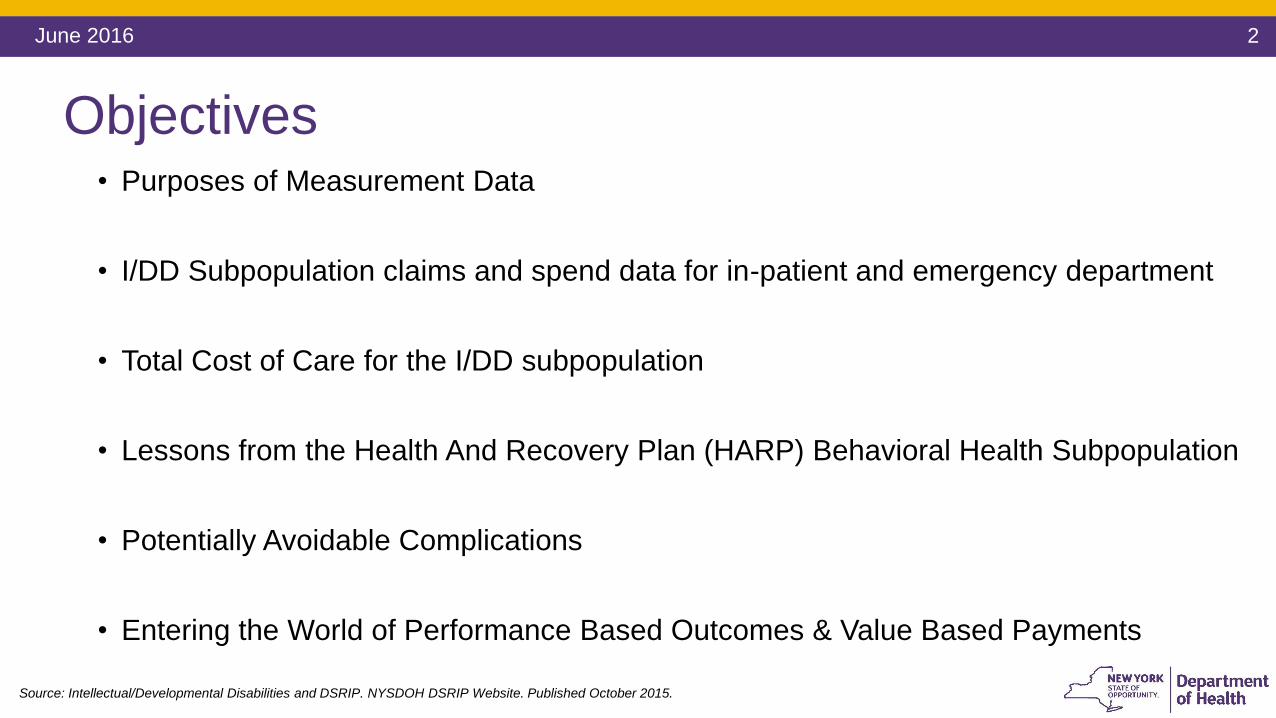
• Purposes of Measurement Data
• I/DD Subpopulation claims and spend data for in-patient and emergency department
• Total Cost of Care for the I/DD subpopulation
• Lessons from the Health And Recovery Plan (HARP) Behavioral Health Subpopulation
• Potentially Avoidable Complications
• Entering the World of Performance Based Outcomes & Value Based Payments
Source: Intellectual/Developmental Disabilities and DSRIP. NYSDOH DSRIP Website. Published October 2015.
3
DSRIP Objectives Explained
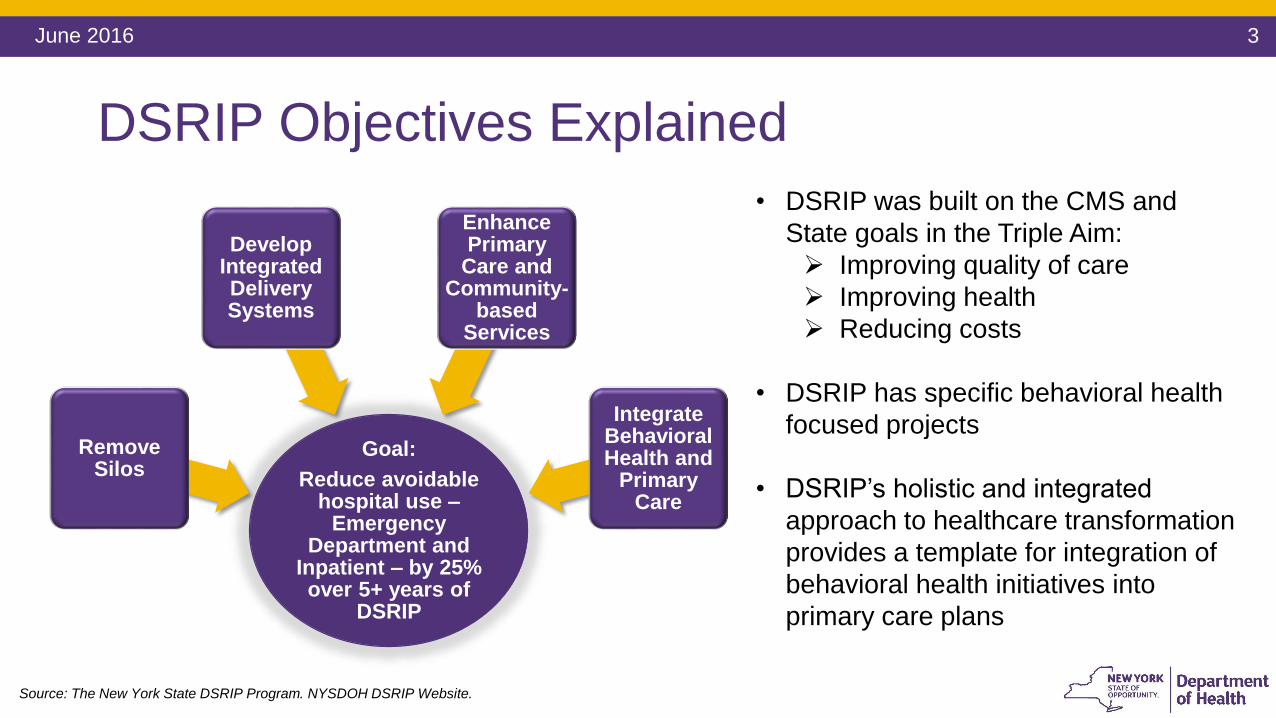
Goal:
Reduce avoidable hospital use –
Emergency Department and
Inpatient – by 25% over 5+ years of
DSRIP
Remove Silos
Develop Integrated Delivery Systems
Enhance Primary
Care and Community-
based Services
Integrate Behavioral Health and
Primary Care
• DSRIP was built on the CMS and
State goals in the Triple Aim:
Improving quality of care
Improving health
Reducing costs
• DSRIP has specific behavioral health
focused projects
• DSRIP’s holistic and integrated
approach to healthcare transformation
provides a template for integration of
behavioral health initiatives into
primary care plans
June 2016
Source: The New York State DSRIP Program. NYSDOH DSRIP Website.
4June 2016
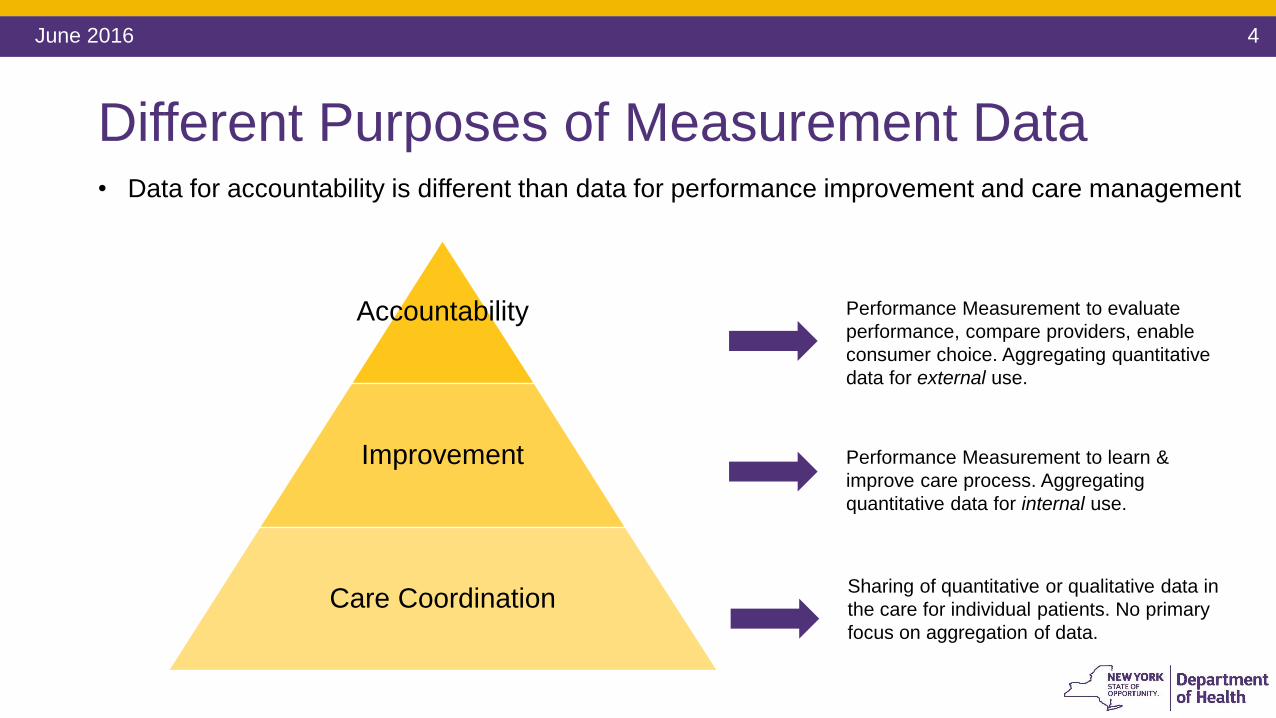
Different Purposes of Measurement Data
Accountability
Improvement
Care Coordination
Performance Measurement to evaluate
performance, compare providers, enable
consumer choice. Aggregating quantitative
data for external use.
Performance Measurement to learn &
improve care process. Aggregating
quantitative data for internal use.
Sharing of quantitative or qualitative data in
the care for individual patients. No primary
focus on aggregation of data.
• Data for accountability is different than data for performance improvement and care management
5
The Intellectual/ Developmental Disability (I/DD) Behavioral Health Sub-population
June 2016
• An estimated 1.5% to 2.5% of the general population has an intellectual or developmental disability
• I/DD is a lifelong impairment
Significant differences in functional status and abilities
Co-morbidities and co-occurring conditions are common
Over a lifetime, people’s health status change
• Persons with I/DD who enter the Emergency Room are more than twice as likely to be admitted than the general population
• An estimated 1 in 21 hospitalizations in New York State (NYS) involve persons with I/DD
Source: Intellectual/Developmental Disabilities and DSRIP. NYSDOH DSRIP Website. Published October 2015.
6
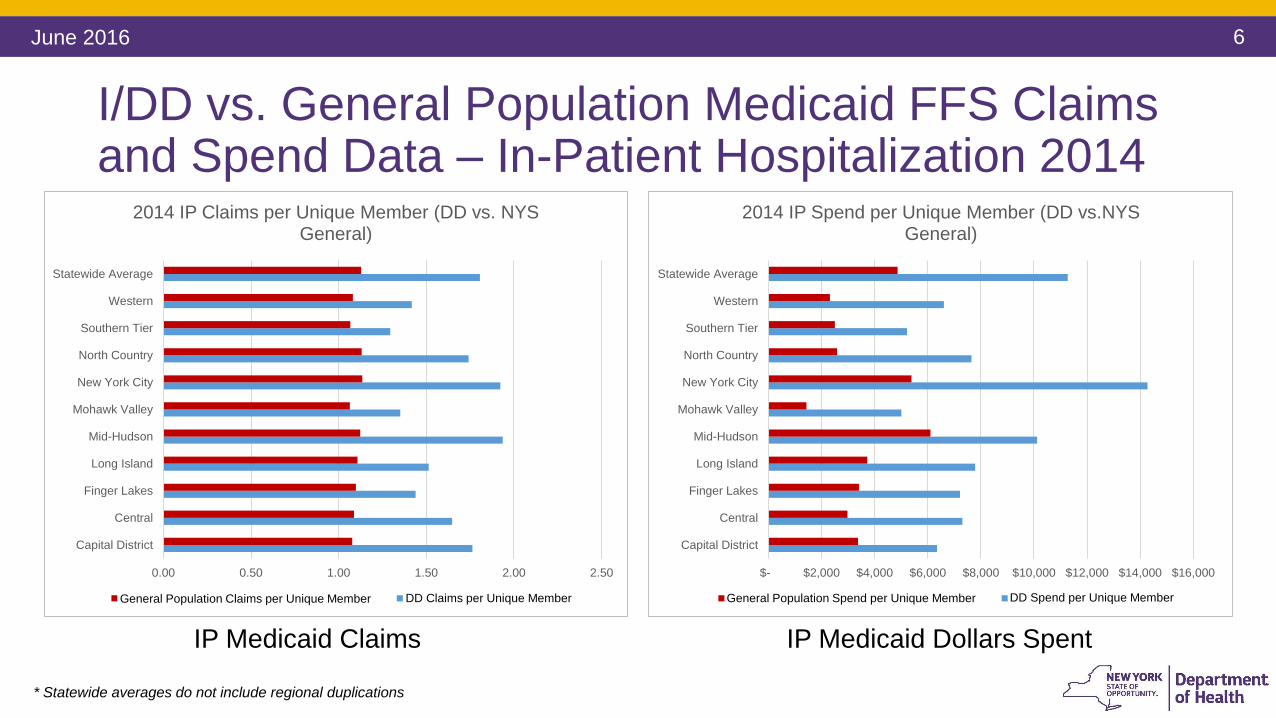
I/DD vs. General Population Medicaid FFS Claims and Spend Data – In-Patient Hospitalization 2014
June 2016
* Statewide averages do not include regional duplications
0.00 0.50 1.00 1.50 2.00 2.50
Capital District
Central
Finger Lakes
Long Island
Mid-Hudson
Mohawk Valley
New York City
North Country
Southern Tier
Western
Statewide Average
2014 IP Claims per Unique Member (DD vs. NYS General)
General Population Claims per Unique Patient DD Claims per Unique Patient
IP Medicaid Claims
General Population Claims per Unique Member DD Claims per Unique Member
$- $2,000 $4,000 $6,000 $8,000 $10,000 $12,000 $14,000 $16,000
Capital District
Central
Finger Lakes
Long Island
Mid-Hudson
Mohawk Valley
New York City
North Country
Southern Tier
Western
Statewide Average
2014 IP Spend per Unique Member (DD vs.NYS General)
General Population Spend per Unique Patient DD Spend per Unique Patient
IP Medicaid Dollars Spent
General Population Spend per Unique Member DD Spend per Unique Member
7
$- $50 $100 $150 $200 $250 $300 $350
Capital District
Central
Finger Lakes
Long Island
Mid-Hudson
Mohawk Valley
New York City
North Country
Southern Tier
Western
Statewide Average
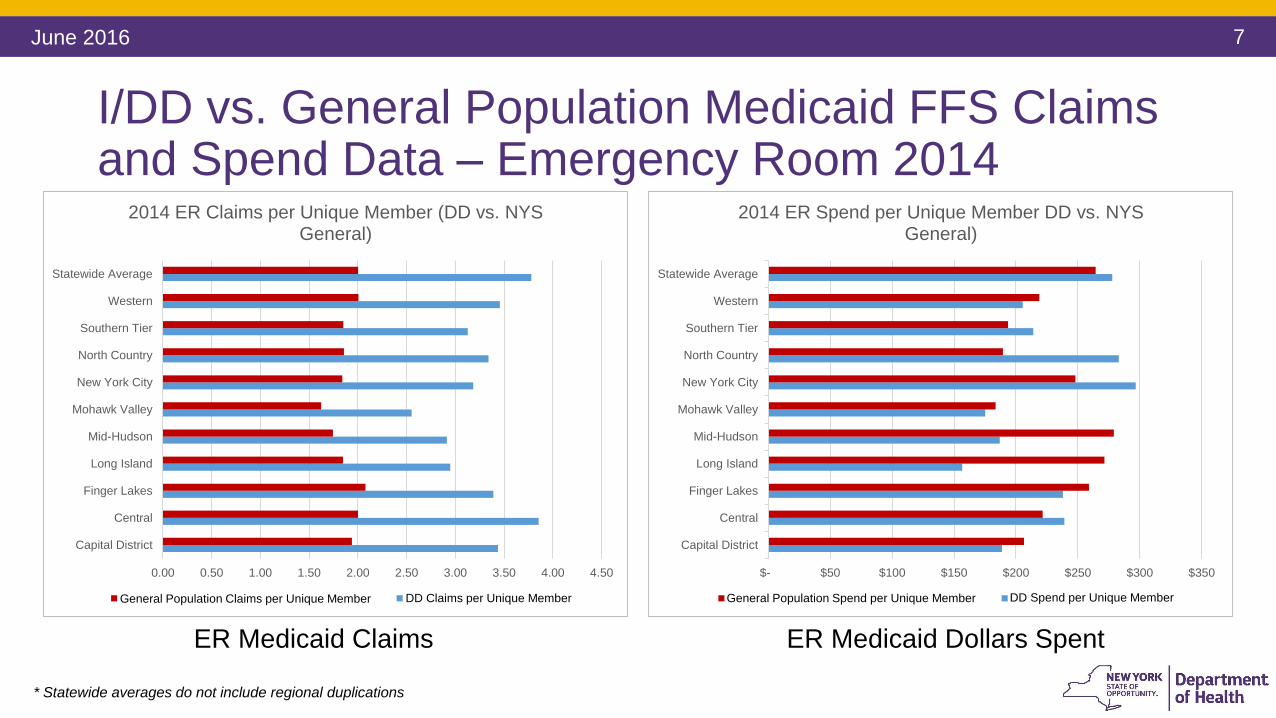
2014 ER Spend per Unique Member DD vs. NYS General)
General Population Spend per Unique Patient DD Spend per Unique Patient
0.00 0.50 1.00 1.50 2.00 2.50 3.00 3.50 4.00 4.50
Capital District
Central
Finger Lakes
Long Island
Mid-Hudson
Mohawk Valley
New York City
North Country
Southern Tier
Western
Statewide Average
2014 ER Claims per Unique Member (DD vs. NYS General)
General Population Claims per Unique Patient DD Claims per Unique Patient
I/DD vs. General Population Medicaid FFS Claims and Spend Data – Emergency Room 2014
June 2016
* Statewide averages do not include regional duplications
ER Medicaid Claims ER Medicaid Dollars Spent
General Population Claims per Unique Member DD Claims per Unique Member General Population Spend per Unique Member DD Spend per Unique Member
8
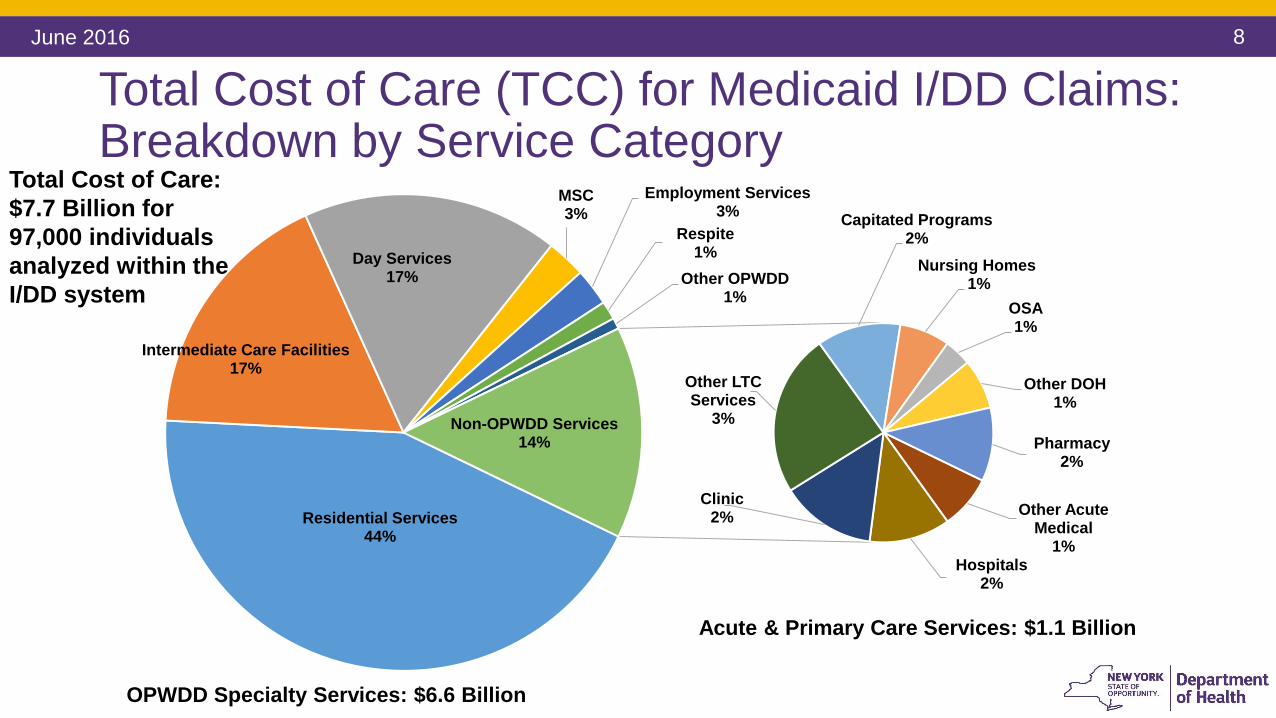
Total Cost of Care (TCC) for Medicaid I/DD Claims: Breakdown by Service Category
June 2016
Residential Services44%
Intermediate Care Facilities17%
Day Services17%
MSC3%
Employment Services3%
Respite1%
Other OPWDD1%
Other Acute Medical
1%Hospitals
2%
Clinic2%
Other LTC Services
3%
Capitated Programs2%
Nursing Homes 1%
OSA1%
Other DOH1%
Pharmacy2%
Non-OPWDD Services14%
Acute & Primary Care Services: $1.1 Billion
OPWDD Specialty Services: $6.6 Billion
Total Cost of Care:
$7.7 Billion for
97,000 individuals
analyzed within the
I/DD system
9
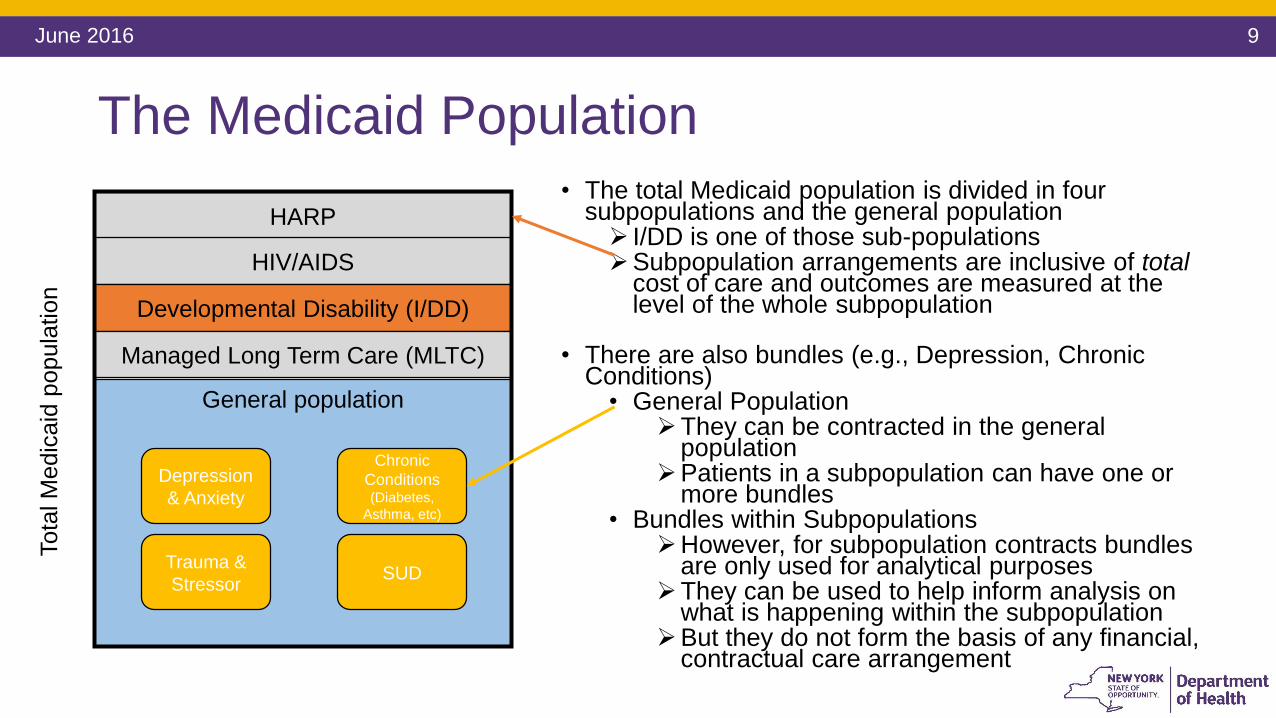
The Medicaid Population
• The total Medicaid population is divided in four subpopulations and the general population I/DD is one of those sub-populationsSubpopulation arrangements are inclusive of total
cost of care and outcomes are measured at the level of the whole subpopulation
• There are also bundles (e.g., Depression, Chronic Conditions)
• General PopulationThey can be contracted in the general
populationPatients in a subpopulation can have one or
more bundles• Bundles within Subpopulations
However, for subpopulation contracts bundles are only used for analytical purposes
They can be used to help inform analysis on what is happening within the subpopulation
But they do not form the basis of any financial, contractual care arrangement
Tota
l M
edic
aid
popula
tion
General population
HARP
HIV/AIDS
Developmental Disability (I/DD)
Managed Long Term Care (MLTC)
Depression
& Anxiety
Chronic
Conditions (Diabetes,
Asthma, etc)
Trauma &
StressorSUD
June 2016
10
Health And Recovery Plans (HARPs)
June 2016
HARPs specialize in serving people with serious behavioral health conditions
Eligibility is based on utilization or functional impairment
Enhanced benefit package - HARPs offer all Medicaid Managed Care Plan (MMC) covered benefits plus access to additional services called Behavioral Health Home and Community Based Services (BH HCBS), if eligible
Enhanced care coordination through Health Homes: A Care Manager
Providers and Plans will work together to assist HARP members
Performance metrics specific to higher need population and BH HCBS
VBP can support the goals by making more flexible and performance-based payments that over time measure what matters to this population, like functional status improvement on domains such as housing, social stability, and employment, e.g.
11
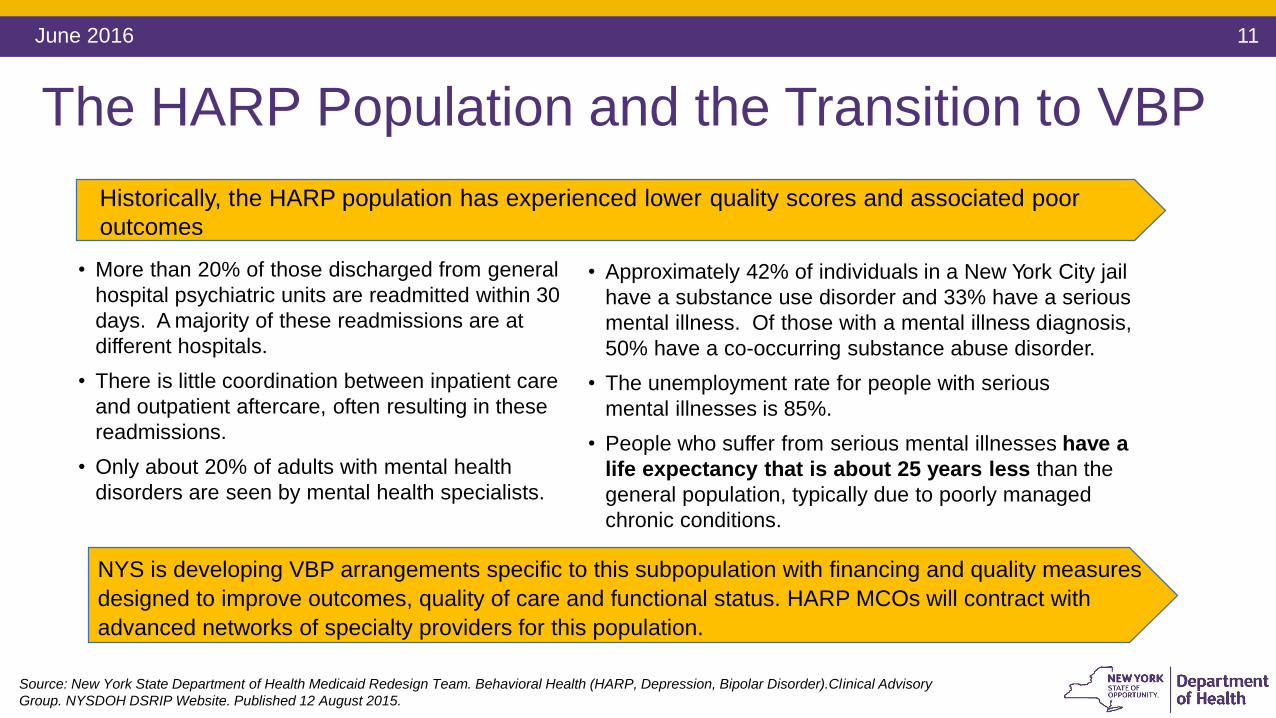
The HARP Population and the Transition to VBP
June 2016
Historically, the HARP population has experienced lower quality scores and associated poor
outcomes
NYS is developing VBP arrangements specific to this subpopulation with financing and quality measures
designed to improve outcomes, quality of care and functional status. HARP MCOs will contract with
advanced networks of specialty providers for this population.
• More than 20% of those discharged from general
hospital psychiatric units are readmitted within 30
days. A majority of these readmissions are at
different hospitals.
• There is little coordination between inpatient care
and outpatient aftercare, often resulting in these
readmissions.
• Only about 20% of adults with mental health
disorders are seen by mental health specialists.
• Approximately 42% of individuals in a New York City jail
have a substance use disorder and 33% have a serious
mental illness. Of those with a mental illness diagnosis,
50% have a co-occurring substance abuse disorder.
• The unemployment rate for people with serious
mental illnesses is 85%.
• People who suffer from serious mental illnesses have a
life expectancy that is about 25 years less than the
general population, typically due to poorly managed
chronic conditions.
Source: New York State Department of Health Medicaid Redesign Team. Behavioral Health (HARP, Depression, Bipolar Disorder).Clinical Advisory
Group. NYSDOH DSRIP Website. Published 12 August 2015.
12
Evidence Informed Case Rates
June 2016
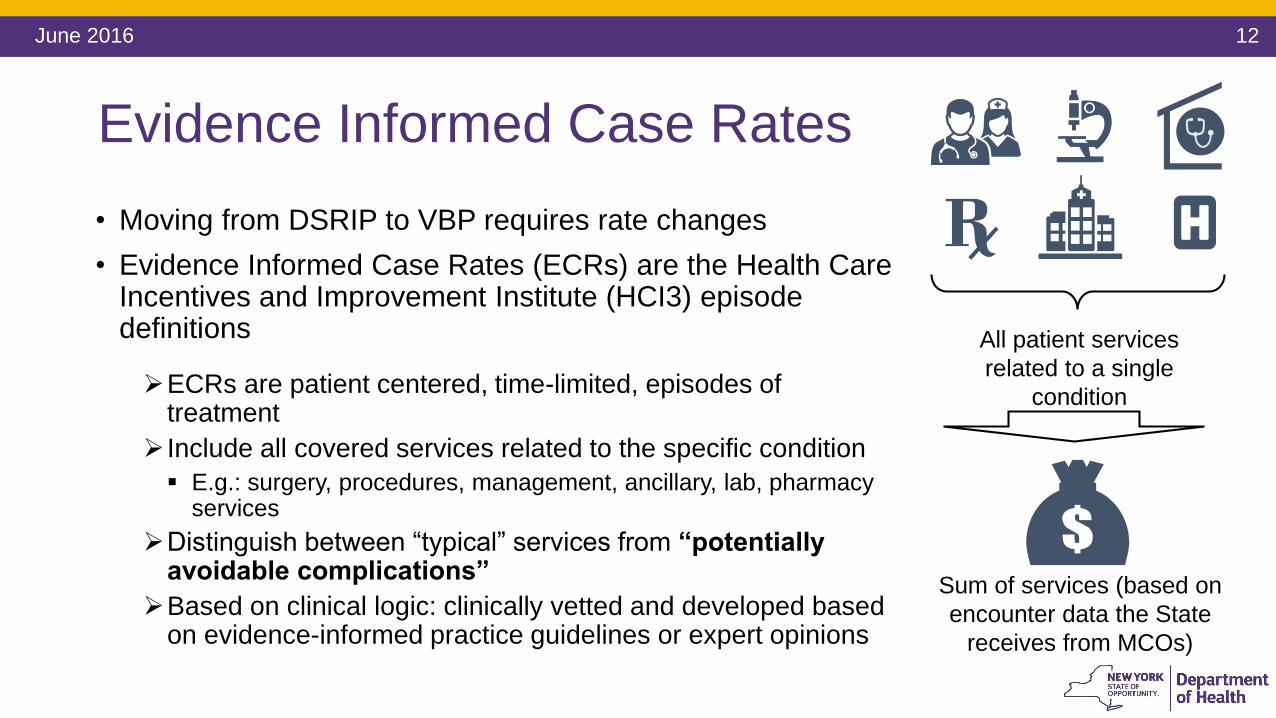
• Moving from DSRIP to VBP requires rate changes
• Evidence Informed Case Rates (ECRs) are the Health Care Incentives and Improvement Institute (HCI3) episode definitions
ECRs are patient centered, time-limited, episodes of treatment
Include all covered services related to the specific condition
E.g.: surgery, procedures, management, ancillary, lab, pharmacy services
Distinguish between “typical” services from “potentially avoidable complications”
Based on clinical logic: clinically vetted and developed based on evidence-informed practice guidelines or expert opinions
All patient services
related to a single
condition
Sum of services (based on
encounter data the State
receives from MCOs)
13
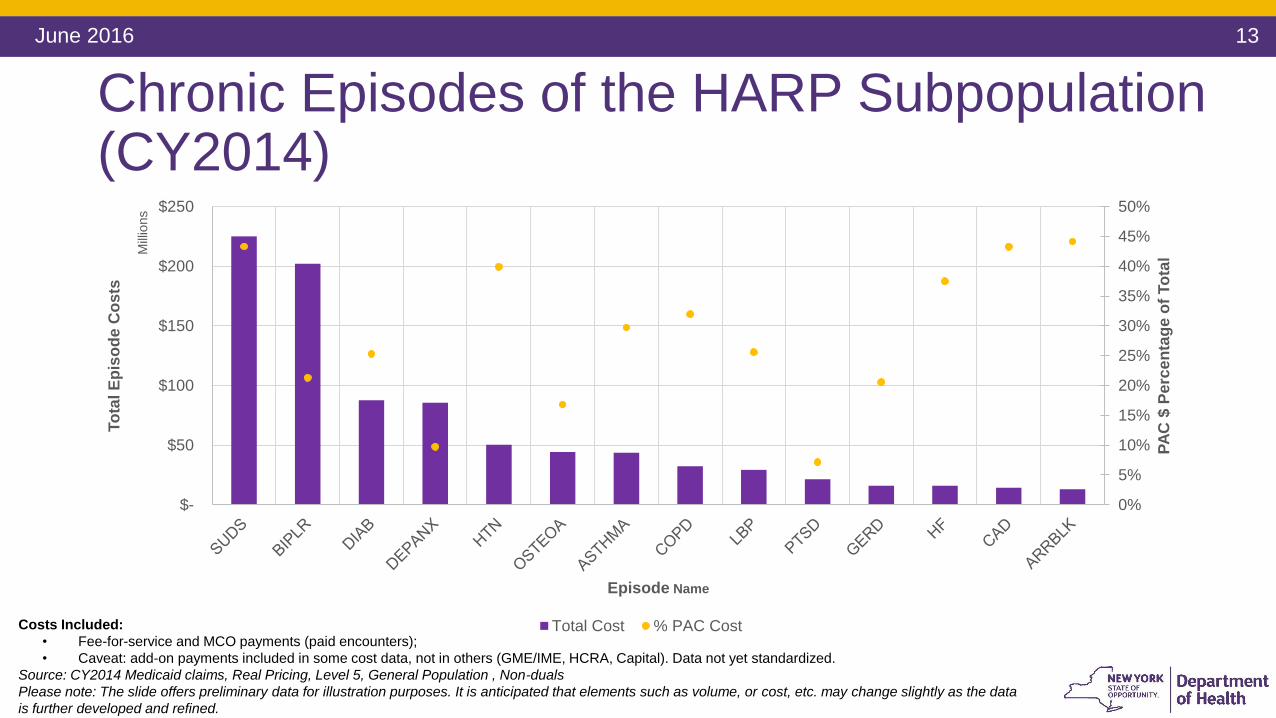
Chronic Episodes of the HARP Subpopulation (CY2014)
June 2016
0%
5%
10%
15%
20%
25%
30%
35%
40%
45%
50%
$-
$50
$100
$150
$200
$250
PA
C $
Pe
rce
nta
ge
of
To
tal
To
tal E
pis
od
e C
os
ts
Mill
ions
Episode Name
Total Cost % PAC CostCosts Included:
• Fee-for-service and MCO payments (paid encounters);
• Caveat: add-on payments included in some cost data, not in others (GME/IME, HCRA, Capital). Data not yet standardized.
Source: CY2014 Medicaid claims, Real Pricing, Level 5, General Population , Non-duals
Please note: The slide offers preliminary data for illustration purposes. It is anticipated that elements such as volume, or cost, etc. may change slightly as the data
is further developed and refined.
14
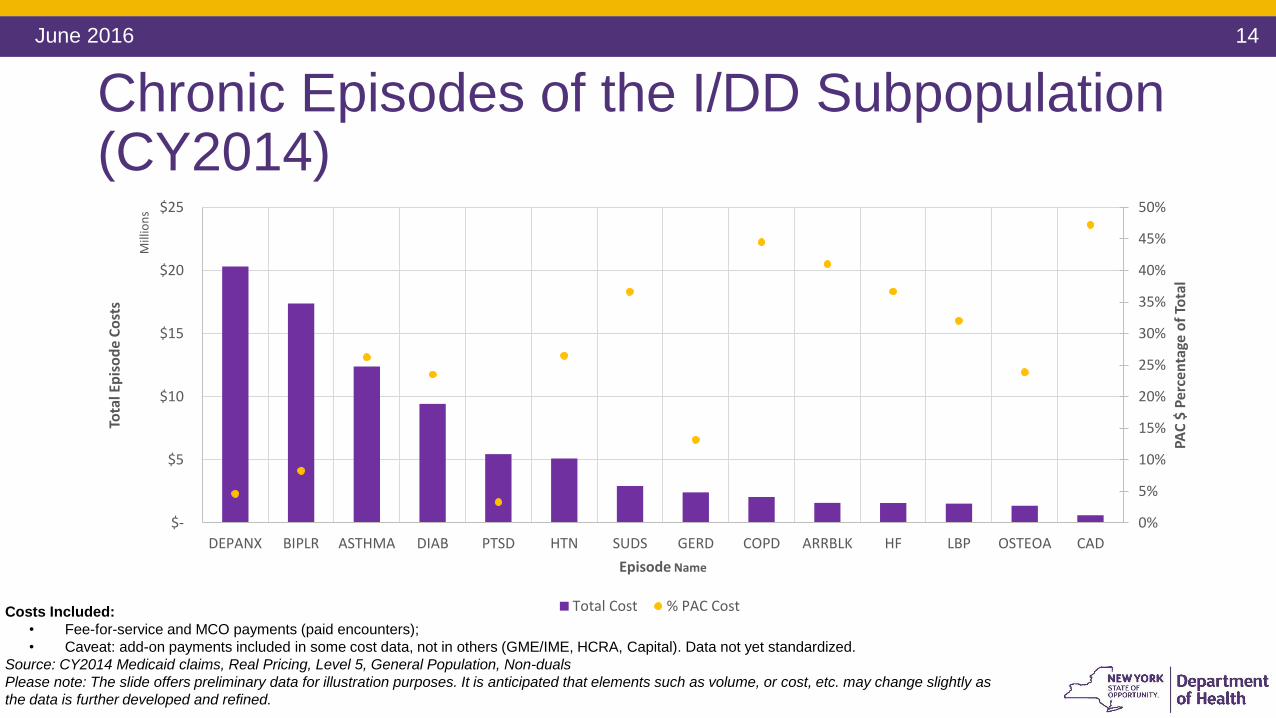
Chronic Episodes of the I/DD Subpopulation (CY2014)
June 2016
0%
5%
10%
15%
20%
25%
30%
35%
40%
45%
50%
$-
$5
$10
$15
$20
$25
DEPANX BIPLR ASTHMA DIAB PTSD HTN SUDS GERD COPD ARRBLK HF LBP OSTEOA CAD
PAC
$ P
erce
nta
ge o
f To
tal
Tota
l Ep
iso
de
Co
sts
Mill
ion
s
Episode Name
Total Cost % PAC CostCosts Included:
• Fee-for-service and MCO payments (paid encounters);
• Caveat: add-on payments included in some cost data, not in others (GME/IME, HCRA, Capital). Data not yet standardized.
Source: CY2014 Medicaid claims, Real Pricing, Level 5, General Population, Non-duals
Please note: The slide offers preliminary data for illustration purposes. It is anticipated that elements such as volume, or cost, etc. may change slightly as
the data is further developed and refined.
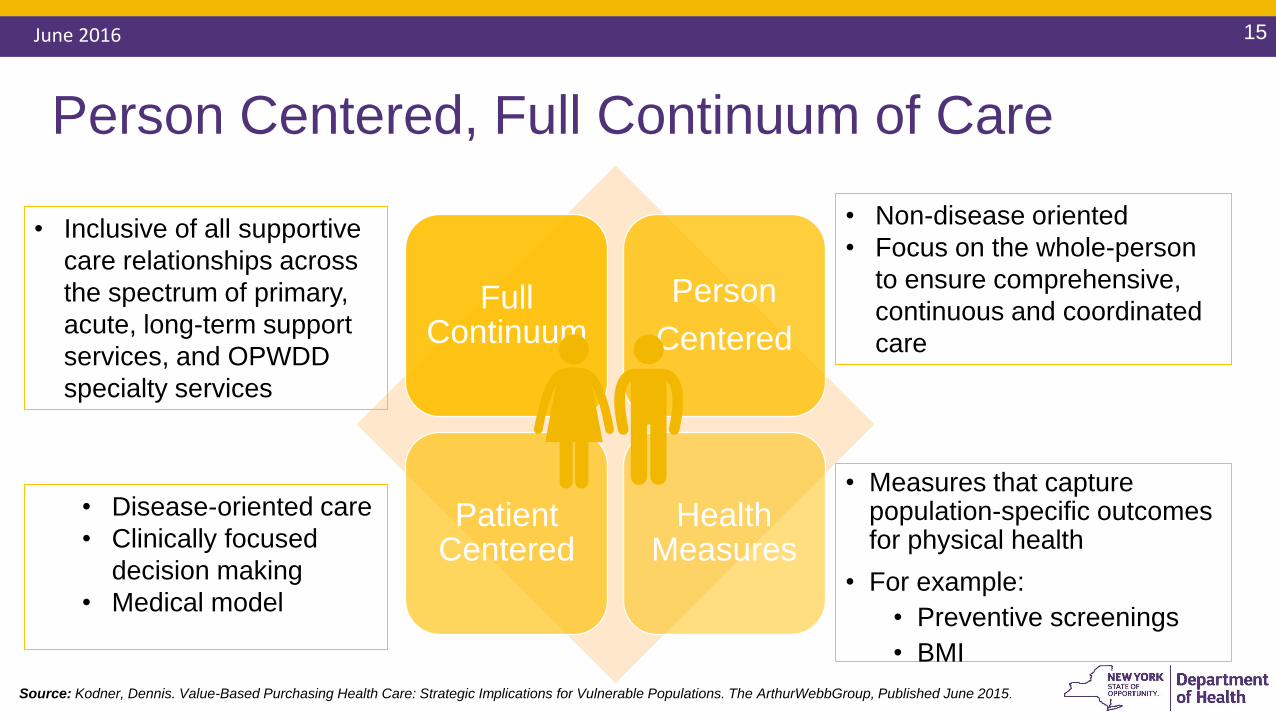
Person Centered, Full Continuum of Care
15June 2016
• Measures that capture population-specific outcomes for physical health
• For example:
• Preventive screenings
• BMI
Source: Kodner, Dennis. Value-Based Purchasing Health Care: Strategic Implications for Vulnerable Populations. The ArthurWebbGroup, Published June 2015.
Full Continuum
Person
Centered
Patient Centered
Health Measures
• Inclusive of all supportive
care relationships across
the spectrum of primary,
acute, long-term support
services, and OPWDD
specialty services
• Non-disease oriented
• Focus on the whole-person
to ensure comprehensive,
continuous and coordinated
care
• Disease-oriented care
• Clinically focused
decision making
• Medical model
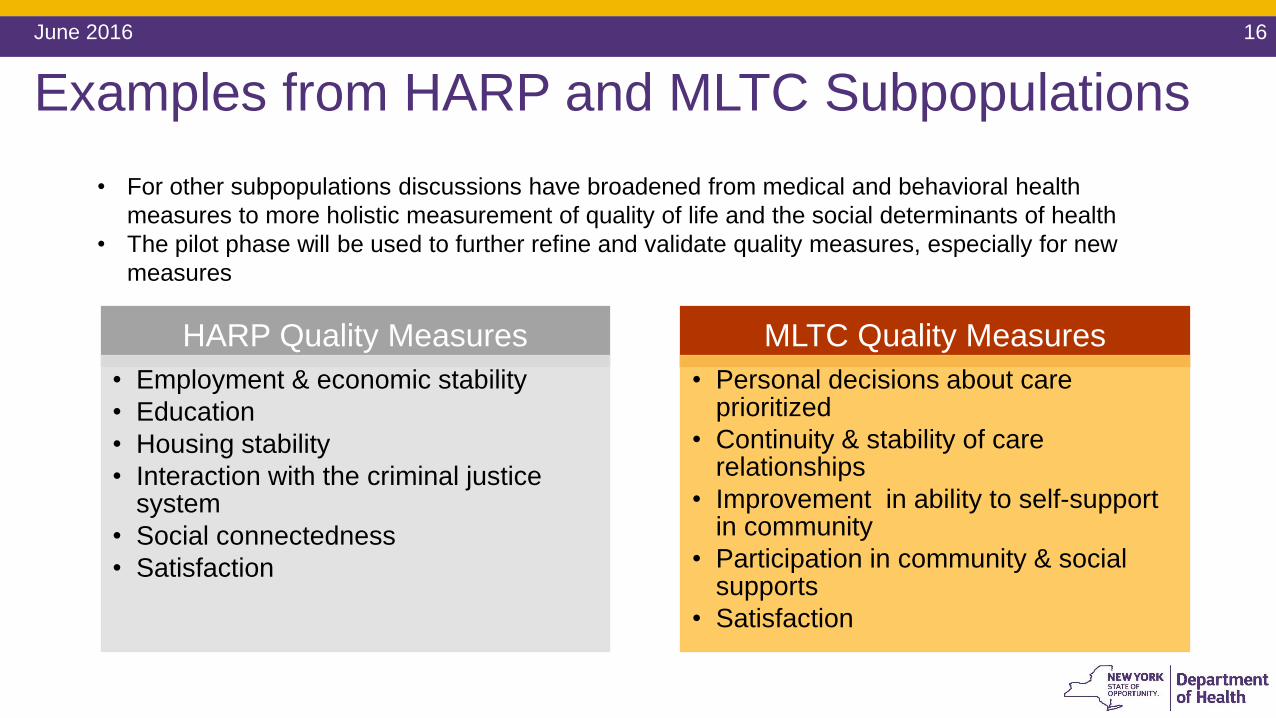
Examples from HARP and MLTC Subpopulations
June 2016 16
HARP Quality Measures
• Employment & economic stability
• Education
• Housing stability
• Interaction with the criminal justice system
• Social connectedness
• Satisfaction
MLTC Quality Measures
• Personal decisions about care prioritized
• Continuity & stability of care relationships
• Improvement in ability to self-support in community
• Participation in community & social supports
• Satisfaction
• For other subpopulations discussions have broadened from medical and behavioral health
measures to more holistic measurement of quality of life and the social determinants of health
• The pilot phase will be used to further refine and validate quality measures, especially for new
measures
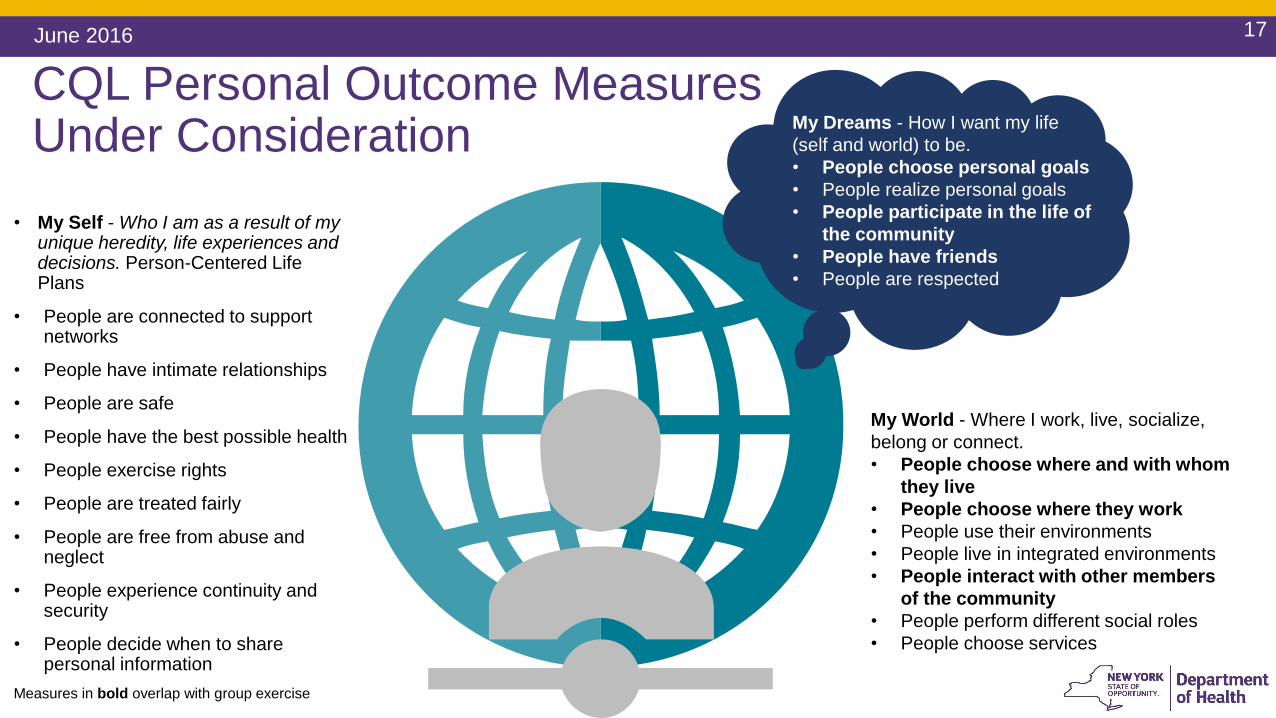
CQL Personal Outcome Measures Under Consideration
17June 2016
• My Self - Who I am as a result of my unique heredity, life experiences and decisions. Person-Centered Life Plans
• People are connected to support networks
• People have intimate relationships
• People are safe
• People have the best possible health
• People exercise rights
• People are treated fairly
• People are free from abuse and neglect
• People experience continuity and security
• People decide when to share personal information
My World - Where I work, live, socialize,
belong or connect.
• People choose where and with whom
they live
• People choose where they work
• People use their environments
• People live in integrated environments
• People interact with other members
of the community
• People perform different social roles
• People choose services
My Dreams - How I want my life
(self and world) to be.
• People choose personal goals
• People realize personal goals
• People participate in the life of
the community
• People have friends
• People are respected
Measures in bold overlap with group exercise
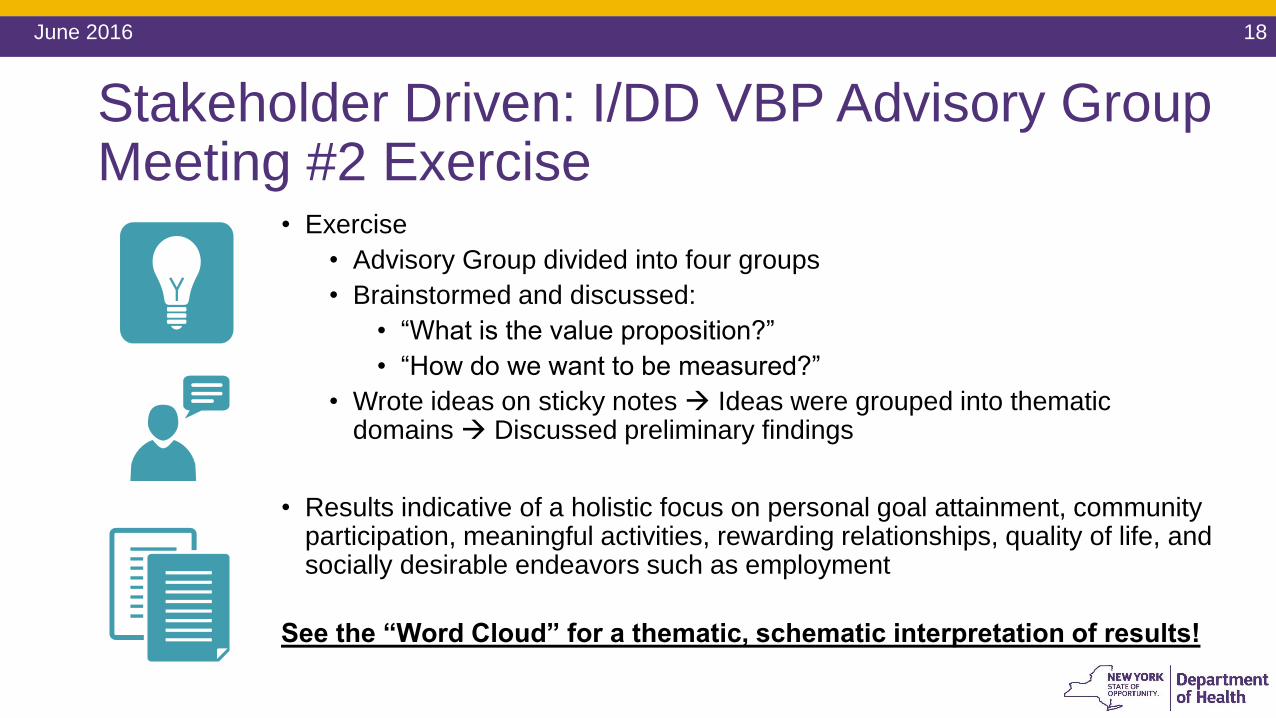
Stakeholder Driven: I/DD VBP Advisory Group Meeting #2 Exercise
• Exercise
• Advisory Group divided into four groups
• Brainstormed and discussed:
• “What is the value proposition?”
• “How do we want to be measured?”
• Wrote ideas on sticky notes Ideas were grouped into thematic domains Discussed preliminary findings
• Results indicative of a holistic focus on personal goal attainment, community participation, meaningful activities, rewarding relationships, quality of life, and socially desirable endeavors such as employment
See the “Word Cloud” for a thematic, schematic interpretation of results!
June 2016 18
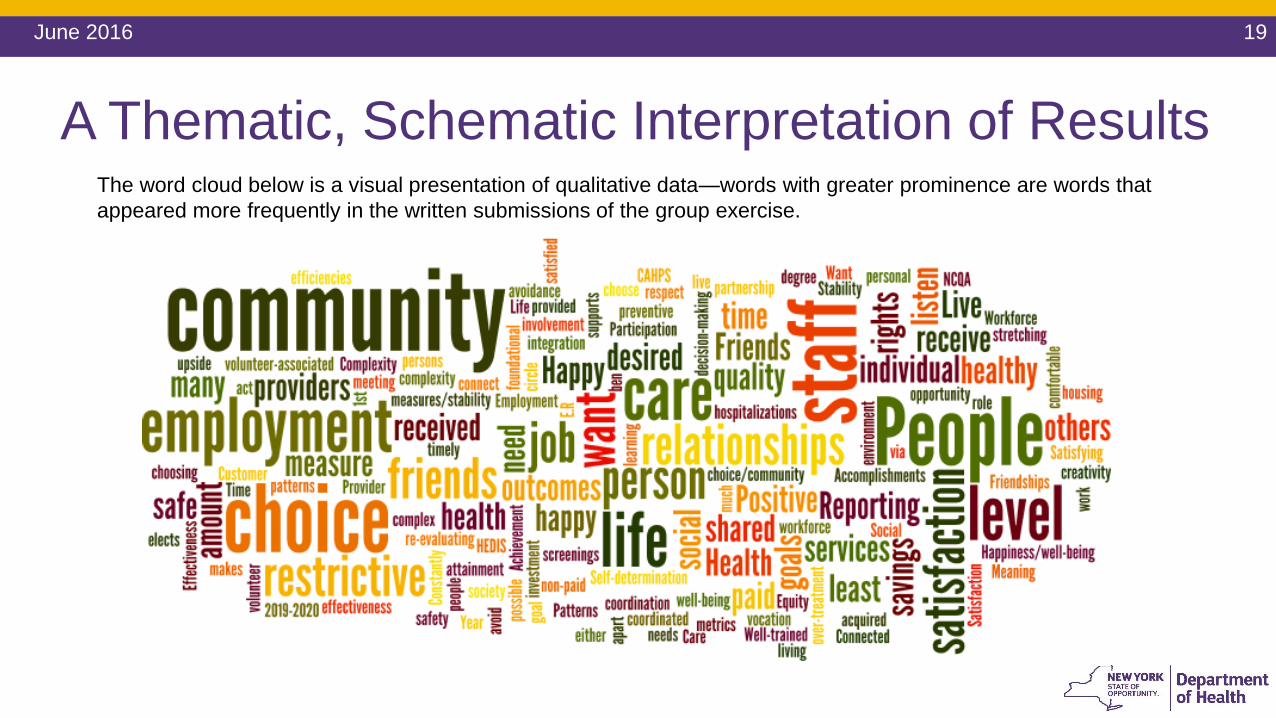
A Thematic, Schematic Interpretation of Results
June 2016 19
The word cloud below is a visual presentation of qualitative data—words with greater prominence are words that
appeared more frequently in the written submissions of the group exercise.