id massachusetts - uark – department of education reform · massachusetts by meagan batdorff...
TRANSCRIPT

198
MassachusettsBy Meagan Batdorff
Introduction
This chapter compares district and charter
school revenues statewide, and for Boston
Public Schools for fiscal year 2011(FY11)1.
Comparisons are made to previous
research for fiscal year 2003 (FY03) and
fiscal year 2007 (FY07), based on the same
methodology. Funding disparities between districts and charter schools for the same
geographic area are explored. The per pupil funding values in the analysis are weighted
to compare district and charter schools as though they served the same proportions
of urban and suburban students (see Methodology for details). Additional research
and insights not included in this chapter appear in the monograph at the beginning of
this report. The monograph also includes a state-by-state Return on Investment (ROI)
analysis, which combines the analysis of revenues with student performance data.
D D DFY2003
Grade based on % of Weighted Funding Disparity
FY2007 FY2011
B C DFY2003
Grade based on % of Weighted Funding Disparity
FY2007 FY2011
F C FFY2003
Grade based on % of Weighted Funding Disparity
FY2007 FY2011
C F DFY2003
Grade based on % of Actual Funding Disparity
FY2007 FY2011
CA
D D DFY2003
Grade based on % of Weighted Funding Disparity
FY2007 FY2011
CO
C D FFY2003
Grade based on % of Weighted Funding Disparity
FY2007 FY2011
CT
D D FFY2003
Grade based on % of Weighted Funding Disparity
FY2007 FY2011
ID
D C DFY2003
Grade based on % of Weighted Funding Disparity
FY2007 FY2011
IL
MD OR
MN
B C BFY2003
Grade based on % of Weighted Funding Disparity
FY2007 FY2011
NM
D D FFY2003
Grade based on % of Weighted Funding Disparity
FY2007 FY2011
PA
F D DFY2003
Grade based on % of Weighted Funding Disparity
FY2007 FY2011
SC
A C FFY2003
Grade based on % of Weighted Funding Disparity
FY2007 FY2011
IN
C F FFY2003
Grade based on % of Weighted Funding Disparity
FY2007 FY2011
LA
C D FFY2003
Grade based on % of Weighted Funding Disparity
FY2007 FY2011
D F FFY2003
Grade based on % of Weighted Funding Disparity
FY2007 FY2011
MI
NY
F F FFY2003
Grade based on % of Weighted Funding Disparity
FY2007 FY2011
NJ
F D FFY2003
Grade based on % of Weighted Funding Disparity
FY2007 FY2011
OHWI
FL
F D FFY2003
Grade based on % of Actual Funding Disparity
FY2007 FY2011
D D DFY2003
Grade based on % of Weighted Funding Disparity
FY2007 FY2011
GA
HI
F F FFY2003
Grade based on % of Weighted Funding Disparity
FY2007 FY2011
DEAZ
AR FFY2011
FFY2011
UT DFY2011
MA FFY2011
FFY2011
FFY2011
MA
F F FFY2003
Grade based on % of Weighted Funding Disparity
FY2007 FY2011
MO
C C DFY2003
Grade based on % of Weighted Funding Disparity
FY2007 FY2011
NC
C C BFY2003
Grade based on % of Actual Funding Disparity
FY2007 FY2011
TX
D F FFY2003
Grade based on % of Actual Funding Disparity
FY2007 FY2011
DC

Charter School Funding: Inequity Expands 199
Highlights of the FY11 Analysis
• Statewide, Massachusetts’s 63 charter schools included in this analysis received 16.9 percent less funding than district schools: $17,020 vs. $14,140 per pupil (Figures 1 & 3).
• Massachusetts charter schools received $14,140 per pupil, but district schools would have received an estimated $17,942 to educate the same students, a difference of $3,803 or 21.2 percent. Weighting the district per pupil revenue therefore increases the funding disparity by $923 from the unweighted statewide difference above (Figure 3).
• Boston’s 16 charter schools included in this report received 18.5 percent less funding than district schools: $23,326 vs. $19,011 per pupil, a difference of $4,315 per pupil.
• Charter schools in Massachusetts educate 3.0 percent of total public school enrollment but receive only 2.5 percent of total revenues (Figures 2 & 3).
• Magnitude of Disparity: In Massachusetts, if districts statewide received the same level of per pupil funding as charter schools in FY11, they would have received over $2.5 billion less in total revenues ($2,589,747,757).
Probable Causes of the Disparities
Disparities by Design
(1) Local Revenue Access
• Charter schools do not have access to Local municipal revenues beyond those included in foundation formula tuition. Massachusetts does not collect data on school district Local revenues, so we cannot determine the amount of Local revenues from municipalities beyond the requirements for Chapter 70 contributions for capital and other projects. Therefore, total expenditures are used as an estimate for Local revenues.
(2) Facilities Funding Access
• Charter schools do not have access to State facilities funding from the Massachusetts School Building Authority or from Local sources. Charter school facility allocations per pupil are based on statewide average facility expenditures, which are generally much less than school district capital revenues.
(3) Calculated Differences
• Chapter 71 states that tuition payments from sending districts to charter schools should be roughly equal
District$17,020
Charter$14,140
Disparity($2,880)
$0 $5,000 $10,000 $15,000 $20,000Per Pupil Revenue
FY11 Total Statewide Revenue & DisparityMA
97.0%899,298
3.0%28,214
0 500,000 1,000,000
District
Charter
Enrollment
FY11 Total Statewide EnrollmentMA
Figure 1
Figure 2

Charter School Funding: Inequity Expands 200
Figure 3
MA
Per Pupil Revenue$17,020 $17,942 $23,326$14,140 $14,140 $19,011($2,880) ($3,803) ($4,315)(16.9%) (21.2%) (18.5%)
District Charter District Charter District Charter
Federal $1,325 $1,266 $1,555 $1,266 $2,896 $2,142State $6,463 $5,888 $6,407 $5,888 $6,082 $4,660Local $8,698 $5,705 $9,479 $5,705 $14,038 $8,846Other $375 $1,279 $387 $1,279 $459 $3,352Public-Indeter. $207 $0 $175 $0 ($12) $0Indeterminate ($49) $2 ($62) $2 ($137) $12Total $17,020 $14,140 $17,942 $14,140 $23,326 $19,011Enrollment
Total Enrollment 927,512 59,077
Revenue
District Charter District Charter District Charter
7.8% 9.0% 8.7% 9.0% 12.4% 11.3%38.0% 41.6% 35.7% 41.6% 26.1% 24.5%51.1% 40.3% 52.8% 40.3% 60.2% 46.5%
2.2% 9.0% 2.2% 9.0% 2.0% 17.6%1.2% 0.0% 1.0% 0.0% -0.1% 0.0%
-0.3% 0.0% -0.3% 0.0% -0.6% 0.1%Magnitude of Disparity = Total Funding Difference x District Enrollment (see above)
by Charter EnrollmentStatewide
$15,305,738,605
Public SchoolsBostonStatewide Weighted
N/A
53,515
$1,248,307,110
63N/AN/A
899,29897.0%
28,214 5,5623.0% 9.4%
16
N/A
2.5% N/A 7.8%$398,948,608 N/A $105,732,866
90.6%
DistrictCharterDifference
($2,589,747,757) ($230,919,205)
97.5% N/A 92.2%
Focus Area Districts Educate 6.0% of All District Students
Focus Area Charters Educate 19.7% of All Charter Students
% of District
FY2010-11
FederalStateLocalOtherPublic-Indeter.Indeterminate
$15,704,687,213 N/A $1,354,039,977
Summary Data Table
District
CharterSchools
Per Pupil Revenue by Source
District
Charter
Charter
Total RevenuePercentage of Revenue by Source
Note: All FY11 revenues for operational charter schools are included in this analysis.
Charter School Funding: Inequity Expands 201
to what districts spend per pupil, but actual tuition from sending districts is often less. The sending district tuition amount can vary from charter school to charter school based on the needs and numbers of students from a sending district. As an example, one charter school’s sending district tuition2 from Boston for FY11 was $12,039, whereas the actual school spending3 per pupil in Boston was $13,369. Another charter school with students from Cambridge received $22,900 per student, but the Cambridge district Actual School Spending per pupil was $24,699. Note that the FY11 charter tuition amounts include base foundation tuition plus above school spending but do not include the facilities amount because the district actual school spending, from which the tuition is calculated, does not include capital expenditures.
(4) Assumptions of Fixed Versus Variable Costs
• Charter tuition amounts from sending districts are adjusted to remove funding for teacher health care, if applicable, for out-of-district special education costs (for residential or private day programs), and for differences in students served. Some adjustments are certainly applicable based on population differences in actual students served. Other adjustments are based on assumptions that district schools operate on fixed costs whereas charter schools are variable cost entities.
(5) Hold-harmless
• Massachusetts maintains a hold harmless provision, which reimburses school districts for students who enroll in charter schools. Therefore, although “home” districts do not educate these students, these districts receive funding for them.
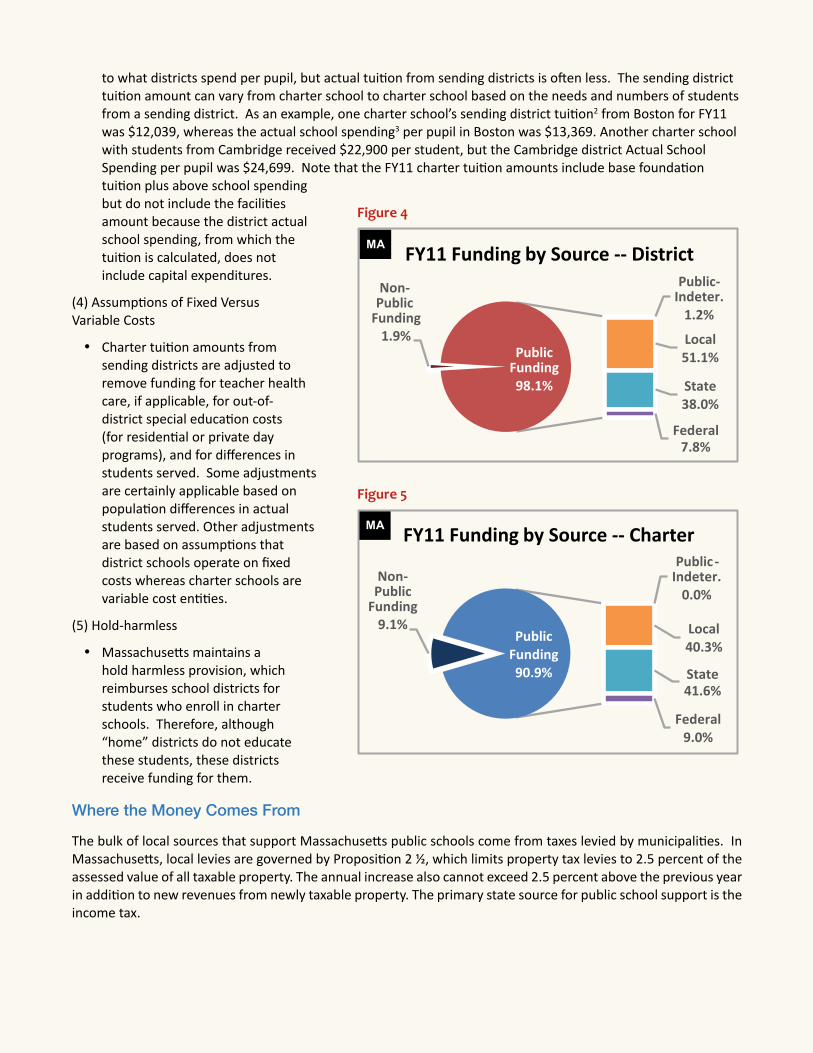
Where the Money Comes From
The bulk of local sources that support Massachusetts public schools come from taxes levied by municipalities. In Massachusetts, local levies are governed by Proposition 2 ½, which limits property tax levies to 2.5 percent of the assessed value of all taxable property. The annual increase also cannot exceed 2.5 percent above the previous year in addition to new revenues from newly taxable property. The primary state source for public school support is the income tax.
Non-Public
Funding1.9%
Public-Indeter.
1.2%
Local51.1%
State38.0%
Federal7.8%
Public Funding98.1%
FY11 Funding by Source -- DistrictMA
Non-Public
Funding9.1%
Public -Indeter.
0.0%
Local40.3%
State41.6%
Federal9.0%
Public Funding90.9%
FY11 Funding by Source -- CharterMA
Figure 4
Figure 5

Charter School Funding: Inequity Expands 202
How Massachusetts Funds Its Districts4
The Chapter 70 state aid program was enacted in 1993 as part of the Education Reform Act. Chapter 70 was designed in response to an adequacy study and significant local wealth inequalities across the state. The funding system sets a foundation funding level per student that varies from district to district. The foundation budget represents the minimum funding level needed to provide an adequate education to a district’s students.
Foundation budgets are built starting with October 1 enrollment data from the prior fiscal year to determine each district’s subsequent fiscal year budget. So, for example, the October 1, 2009, enrollment count was used to build the FY11 foundation budget for each district. Massachusetts calculates foundation enrollment quite differently from headcount enrollment, which is why these two numbers often vary and sometimes differ by quite a bit. A school district is financially responsible for all students residing within the district’s boundaries, whether they attend a district school, a charter school or another district through school choice. When students residing in a district attend a non-district school, those funds are tuitioned-out using the sending district’s foundation amount.
Each district’s budget is calculated by multiplying the number of students in 14 different enrollment categories (grade level, ELL, economically disadvantaged, special education, etc.) by cost rates assigned to 11 functions that correspond to the state’s chart of accounts. These functions align with staffing and operational expenses such as teaching, administration, professional development, or psychological services. The cost rates increase for pupils in upper-level grades, students with additional educational needs, or poverty factors. Base foundation amounts are set for each function and inflation adjustments are made annually. Some high-cost districts’ foundation budgets are adjusted further using a wage adjustment factor that affects salaries only.
The state then sets a target “local required effort” amount that districts contribute to generate total foundation funding. Target percentages of total foundation funding vary based on district wealth, which is calculated annually by the most recent
personal income and property wealth data. The state makes up the difference between minimum required local effort and Chapter 70 state aid. The totals of Chapter 70 state aid and required local effort equals a district’s required “net school spending” (NSS) requirement. Districts are free to spend beyond their required school spending, and many districts do. Each district’s “actual net school spending” is reported on EOY reports.
There are several other types of state aid, but Chapter 70 foundation aid is the only type that is constitutionally mandated. Minimum aid is often used to guarantee that districts receive a per pupil increase in a subsequent fiscal year. Growth aid is sometimes used to fund enrollment growth, and target aid can be used to rectify inequities in aid apportionments based on district wealth.
School food programs, transportation and school facilities construction are supported through other state programs, and the state’s Circuit Breaker program funds above and beyond foundation allowance costs for special education. These funds are not included in the chapter 70 state aid formula, which also contributes to actual school spending generally being much higher than required NSS.
Local revenues are raised by cities and municipalities in Massachusetts; school districts do not have authority to levy millages. School districts are funded by additional local revenues from cities and municipalities that are not accounted for in state revenue monitoring.
Massachusetts is one of the few remaining states to maintain a “hold harmless” provision for loss of enrollment to charter schools. Hold harmless provisions compensate school districts for loss of enrollment to charter schools by providing reimbursements for a period of time to allow districts to adjust their budgets. The formula for distributing reimbursement aid was changed in FY11 to be spread across six years rather than three, as it was originally designed. Now the reimbursement percentage rates are set at 100/25/25/25/25/25. This means that home districts receive reimbursement for 100 percent of tuition distributions for any student that enrolls in a Commonwealth charter school the first year a student leaves the district, then for 25 percent of the amount in years two through six.

Charter School Funding: Inequity Expands 203
How Massachusetts Funds Its Charter Schools5
There are two types of charter schools in Massachusetts: Commonwealth charters and Horace Mann charter schools. Commonwealth charter schools are independent LEAs that receive funding directly from the state. Horace Mann charter schools are independently operated but are approved by the local school committee, teachers union, and state Board of Education. Horace Mann charter schools receive funding from their authorizing district through a budget request and negotiation process. The funding formula below pertains to Commonwealth charter schools.
Commonwealth charter schools are funded using a formula that works to establish a tuition rate for each enrolled student that is comparable to what would have been spent to educate each student in the “home” district. Total charter school tuition combines three different calculations: 1) the foundation base rate from the sending district; 2) the above foundation spending rate from the sending district; and 3) the state-set facilities tuition rate.
The state determines the foundation base rate by dividing the foundation budget by the foundation enrollment for each sending district at each charter school. Districts in Massachusetts retain the financial responsibility for special education students educated in out-of-district programs, so that component of tuition is removed. Next, the above-foundation spending rate is calculated by comparing each district’s actual net school spending with its foundation budget to generate a percentage of “above foundation spending.” This amount is added to the charter school base rate. Lastly, since revenues for district capital expenditures are not a component of Chapter 70 state aid, and charter schools do not have access to state or local revenues used for facilities, the state calculates a statewide average facilities per pupil expenditure amount, which is added to the total tuition rate.
Commonwealth charters are independent LEAs and may therefore apply for and receive federal funding like other Massachusetts school districts.
Funding for Public School Facilities
Massachusetts district schools receive state facilities funding from the Massachusetts School Building Authority and Chapter 70B. State financing of school capital is provided by local district application for funding on a competitive and need basis. Municipal governments raise all sources of local capital funding. Municipalities make on behalf of payments for school district capital needs, and there is no centralized collection or monitoring of specific local revenues disbursed to school districts.
Charter schools, however, do not receive funding from local capital revenue sources. As described above, the state provides an average facilities amount per pupil for all charter school students based on the most recently available data on statewide district building expenses. For FY11 the facilities aid rate was $893 per pupil. Massachusetts also makes tax-exempt bonds available to charter schools.
Long-term Funding Patterns
For Massachusetts, we now have three point-in-time snapshots of public education funding for FY03, FY07, and FY11.6 Please note that in the presentation and discussion of longitudinal data that follow, the figures used are inflation-adjusted to fiscal year 2007 dollars and differ from figures presented in Figure 3, which includes actual and weighted per pupil revenues representing FY11 only. The inflation-adjusted per pupil revenues in Figures 6‒8 are for comparative purposes only. Refer to the Methodology section for more on inflation adjustments.

Charter School Funding: Inequity Expands 204
Total Funding
As Figure 6 shows below, when adjusted for inflation, both school districts and charters had gains in revenues between FY03 and FY07. This also held true for the time period between FY07 and FY11 for districts and charters statewide and for the Boston school district but not for Boston charters. Boston charter school revenues declined $112 per pupil between FY07 and FY11 after a strong gain of $3,148 per student, or 21.8 percent, between FY03 and FY07. Despite the economic downturn, between FY03 and FY11 districts statewide had overall increased revenues of $1,096 per pupil, or 7.5 percent. Charter schools statewide saw increases of $1,343 or 11.5% of total revenues. Boston Public Schools generated $1,626 more per student (8.2%), and Boston charters had a total increase of $3,037 per pupil.
Figure 6
Statewide District (D) Statewide Charter (C) Boston Public Schools-D Boston Public Schools-C
FY03 $14,562 $11,666 $19,834 $14,454
FY07 $15,396 $12,838 $20,570 $17,602
FY11 $15,658 $13,009 $21,460 $17,490
$0
$5,000
$10,000
$15,000
$20,000
$25,000
Per Pupil Revenue
Total Funding, All Sources -- Inflation Adjusted -- Over TimeMA
FY03 FY07 FY11DISTRICT CHARTER

Charter School Funding: Inequity Expands 205
Total Funding Less Other
Our study includes total funding whether the funds originate from public or private sources. The “Other” category is comprised primarily of philanthropic dollars, which can play a significant role in the financing of charter schools. Therefore, we have removed Other dollars from this level of the analysis to determine if funding from public sources is distributed equitably to districts and to charter schools. Public funding includes Local, State, Federal, Indeterminate-Public, and where we cannot determine the source, Indeterminate.
Looking at Figure 7 below, the general pattern of increased public revenues is consistent with total funding presented above in Figure 6 for both districts and charter schools statewide. The Boston Public Schools numbers look as if public revenues declined between FY03 and FY07, when actually they misreported Other revenues in FY03, which amounted to $1 per pupil. Therefore, the true gain or loss is unknown. On the other hand, Boston charter schools, which showed a slight decrease in total revenues between FY07 and FY11 (Figure 6), had overall increases in Public-only revenues between all three snapshot periods with a total gain of $1,865 or 14.9 percent between FY03 and FY11.
Figure 7
Statewide District (D) Statewide Charter (C) Boston Public Schools-D Boston Public Schools-C
FY03 $14,396 $10,827 $19,833 $12,544
FY07 $14,949 $11,292 $18,921 $12,950
FY11 $15,313 $11,832 $21,038 $14,407
$0
$5,000
$10,000
$15,000
$20,000
$25,000
Per Pupil Revenue
Total Funding Less Other-- Inflation Adjusted -- Over TimeMA
FY03 FY07 FY11DISTRICT CHARTER

Charter School Funding: Inequity Expands 206
Other Funding
Other revenue encompasses all forms of revenue not originating from public revenue sources, such as returns on investments, charges for facility rentals, and philanthropy. Of all the sources included in Other revenue, philanthropy has often served an important role in charter school financing to narrow the equity gap. As Figure 8 indicates, this has historically remained true for Massachusetts charter schools, but Other revenue has not remained consistent over the years.
Figure 8
Statewide District (D) Statewide Charter (C) Boston Public Schools-D Boston Public Schools-C
FY2003 $166 $840 $1 $1,910
FY2007 $447 $1,546 $1,649 $4,652
FY2011 $345 $1,176 $422 $3,083
$0
$500
$1,000
$1,500
$2,000
$2,500
$3,000
$3,500
$4,000
$4,500
$5,000
Per Pupil Revenue
Other Funding, Non-Tax Sources -- Inflation Adjusted -- Over TimeMA
FY03 FY07 FY11DISTRICT CHARTER
Other revenues play a much more important role in overall funding for charter schools than for districts. As Figure 8 shows, FY07 was a high point for Other revenue collections across the state. Statewide, charter schools saw an overall gain in Other dollars of 40 percent per pupil since FY03, but that includes a decline of $370 per pupil between FY07 and FY11. Although districts statewide had an overall increase of 107.8 percent in Other dollars, the starting point was only $166 per pupil. For FY11, Other revenue comprised 9.0 percent of charter school total revenues, whereas Other revenues contributed just 2.2 percent of total statewide district revenues, a difference of $831 per pupil.
Boston charter schools reported a staggering $4,652 per pupil in Other dollars in FY07, which represented over a quarter of Boston charter school total revenues, or 26.4 percent. It is precisely this reason that Boston charters show a decline in total revenues in FY11 (Figure 6). Between FY07 and FY11, Boston charter school Other revenue

Charter School Funding: Inequity Expands 207
dropped by 33.8 percent, from $4,652 to $3,083 per pupil. Other dollars continue to play an important role in Boston charter school funding, however, making up 17.6 percent of total revenues in FY11 compared with only 2.0 percent for Boston Public Schools, a difference of $2,660 per pupil. Boston Public Schools Other dollars also declined from a high of $1,649 in FY07 to $422 per pupil in FY11, a loss of 74.4 percent. As noted above, Boston Public Schools Other dollars for FY03 should be ignored since they were erroneously reported.
Note. Boston Public Schools did not accurately report Other revenues for FY03, which skews the actual funding pattern shown in Figures 7 & 8.
Changes in Funding Results
Figure 9 shows the percentage increase/decrease in funding between FY03 and FY11 by each type of revenue stream. Because of the complications and changes in charter school data availability and reporting quality for many states in this study, the data reported in this figure may be somewhat misleading, and this is true for some of the Massachusetts numbers below.
Figure 9
MA
From/To: FY2003 / FY2011 Federal State Local Other TotalStatewide District (D) 30.3% 3.3% 9.0% 107.7% 7.5%Statewide Charter (C) 83.8% 1.5% 14.8% 40.1% 11.5%Boston Public Schools-D 18.7% -10.3% 17.3% 37237.0% 8.2%Boston Public Schools-C 85.7% -2.4% 18.5% 61.5% 21.0%
Per Pupil Revenue -- Inflation Adjusted -- Over TimePercentage Increase / Decrease (black shading)
Over the FY03 to FY11 time period, the only revenue losses occurred for the Boston district and Boston charter schools; both had decreases in State revenues. Charters statewide and in Boston had the largest overall total gains (11.5% and 21.0%, respectively). Charters experienced significant increases in Federal revenues since FY03. This is likely a combination of Federal stimulus dollar receipt and increased numbers of at-risk students served at charter schools, which may generate additional Federal funds (Figure 11). Other revenues also increased across the board but again, the figure for Boston Public Schools is misleading. Like so many other states, the squeeze in State funding after the economic recession resulted in overall increases in Local revenues to make up for shortages in State funds.
Figure 10
MA
FY2003 FY2007 FY2011Statewide -19.9% -19.3% -16.9%Boston Public Schools -27.1% -14.4% -18.5%
Negative Disparities Mean Districts Receive More (red text)
Disparity as Percent of District -- Over Time
Focus Area
Figure 10 indicates changes to the variance in funding between Massachusetts districts and charter schools for FY03, FY07 and FY11. The variance represents the difference in funding between a district and the charters located within the boundaries of the district. When the percentage nears or is at zero, the district and the charters are being funded equitably.

Charter School Funding: Inequity Expands 208
Overall, the disparity has decreased both statewide and in the focus area but still persists. Statewide, the disparity has dropped by 3.0 percent, and in Boston the disparity decreased by 8.6 percent for reported revenues. However, to recap from Figure 3, the FY11 Magnitude of Disparity would leave districts statewide over $2.5 billion short in total revenues if subjected to the Massachusetts charter funding mechanism.
Select Enrollment Characteristics7
Figure 11 shows data for both charter and district school demographics. We include these data, if available, to look at possible differences in the types of students served to discern if high-need student populations may be resulting in higher levels of funding for either charter or district schools.
Figure 11
MA
FY03 FY07 FY11 FY03 FY07 FY11 FY03 FY07 FY11
Statewide District N/A 28.3% 34.8% N/A 54.7% 53.9% N/A N/A 17.9%Statewide Charter N/A 41.5% 50.3% N/A 79.7% 84.1% N/A N/A 12.2%
Select Enrollment CharacteristicsPercentage of Total Enrollment
Free & Reduced Lunch Title I Special EducationStudent Group >>>Year >>>
Data provided by the Massachusetts Department of Elementary and Secondary Education show charter schools educating higher percentages of students eligible for free or reduced-price lunch (15.5% more) and that 30.2 percent more charter schools than district schools are Title I schools. Charters, however, educate 5.7 percent less special education students.
State Practices Summary
We have assigned ratings to each state based on the quality of the data available, as well as the extent to which charter schools have access to specific streams of revenue (Figure 12).

Charter School Funding: Inequity Expands 209
Figure 12
MA
REFFY2003 FY2007 FY2011
D D D
Yes Yes Yes Yes 1
Yes No No No 2
Yes No No No
No 3
Yes
Yes 4
Yes
This table summarizes answers to key funding mechanism questions in context with a
grade based on actual funding results.
Funding Practices SummaryPURPOSE
ACCESS TO FUNDING SOURCESGrade based on % of Weighted Funding Disparity
DATA AVAILABILITYDoes the state provide reasonable access to detailed public data on federal, state, local, and other revenues for district schools?Does the state provide reasonable access to detailed public data on federal, state, local, and other revenues for charter schools?
FUNDING FORMULA
Are charter schools treated as LEAs for funding purposes?
Does the state provide funding for charter schools and districts based primarily on student enrollment?
GRADE FUNDING
Fede
ral S
ourc
e
Stat
e So
urce
Loca
l Sou
rce
Faci
lities
Sou
rce
Do charter schools have access to this funding source according to state statutes?In practice, do charter schools have at least as much access to this funding source as districts have?Do charter school students receive at least 95% as much per pupil in revenue for this source as district students?
1 Charter schools do not have access to the same facilities sources as district schools; they receive a per pupil facilities amount paid by the state.
2 Commonwealth charter schools received nearly as much federal revenue statewide as did districts. However, Horace Mann charter schools do not have independent access to federal funds.
3 District reports of revenues are incomplete and based on expenditures.
4 Commonwealth charter schools are treated as LEAs for funding purposes, but Horace Mann charter schools are not.

Charter School Funding: Inequity Expands 210
Endnotes
1 District Data: Massachusetts school district revenue data are incomplete as collected by the Massachusetts Department of Elementary and Secondary Education. MA uses an expenditure basis for revenue accounting. In addition, neither the DOE or local municipalities collect local revenue data. Therefore, our data analysis uses the MA DOE End of Year (EOY) reports as a starting point for district revenues. However, these accounts do not include several major revenue sources such as retirement funds, which were near $1 billion for FY11. Therefore, after exhausting every other option, we fell back to using FY11 NCES revenue data for both statewide totals and Boston totals. NCES revenue totals are imperfect, based on MA expenditures, and include charter school revenues, but they are the closest we could come to an estimate of total revenues. Therefore, using NCES data for revenues totals, 1) we used DOE EOY reports to identify line items for deduction from source totals (e.g., PreK and adult education). 2) Note that PreK deductions were estimated using NIEER expenditure estimates per pupil because total PreK revenues could not be separated from tuition. 3) Other revenues identified in EOY reports were moved to their own source category from NCES categorized Local revenues.
Charter School Data: Contrary to district revenue collection and reporting, the Massachusetts Department of Elementary and Secondary Education Charter Schools Office provides excellent and comprehensive charter school revenue data. To approximate a total of charter school and district school revenues separately, we used the following process:
• MA reports charter school Local and State revenues as a combined total “tuition.” The process used to separate Local and State revenues is as follows: (1) FTE counts and the Total Foundation Formula Rate from sending districts for each charter were obtained from “FY2011 Rates by Charter School by Sending District (Q4)” at the MA DOE. (2) The percentage of Chapter 70 revenues (State) from each sending district’s Actual Net School Spending (NSS) was determined for each sending district for every Commonwealth Charter School. (3) The Total Foundation formula rate per sending district was multiplied by each sending district’s chapter 70 percentage of Actual NSS, the product of which was then multiplied by the total FTE count for each sending district to determine the total amount of State revenue received by FTEs from each sending district. (4) This State revenue total for all sending districts at each school was totaled per school and deducted from each school’s “tuition” total to produce a remaining Local revenue total per school. (5) Charter School deductions from Boston District State and Local revenues were calculated separately for all Boston sending district charter FTEs. (6) Totals of charter school public revenue sources were then deducted from school district statewide totals and for Boston.
• Horace Mann charter school revenues are negotiated with the authorizing district. To approximate a Local and State revenue amount for Horace Mann charter schools, we used the Chapter 70 percentage of Actual NSS from the district in which the Horace Mann charter school is located.
• FTE Data: District FTE totals are a combination of tuitioned pupils at the district and tuitioned-out. From “FY2011 Expenditures Per Pupil, all Funds, Summary by Function.”
2 Sending District tuition is taken from “FY2011 Charter Rate Summary” at the Massachusetts Department of Education.
3 Actual School Spending Amounts were derived from “Chapter 70 Trends,” Massachusetts Department of Elementary Secondary Education, 2/22/14.
4 This section was completed using the following two major sources unless otherwise noted: 1) “Report on the State of the Public Education Financing System in Massachusetts.” Massachusetts Department of Elementary Secondary Education. July, 2013; and 2) “The Massachusetts Foundation Budget.” Massachusetts Department of Education. July 12, 2013.
5 “Charter Tuition rate Summary.” Massachusetts Department of Education.
6 Data for FY03 compiled by the authors for the Thomas B. Fordham Institute report, Charter School Funding: Inequity’s Next Frontier, 2005. Data for FY07 compiled by the authors for the Ball State University Report, Charter School Funding: Inequity Persists, 2010.
7 FY11 Data provided by the Massachusetts Department of Elementary and Secondary Education: “Title I 2011 Schools”; “Massachusetts School and District Profiles: 2010-11 Selected Populations Report (District).