ict and economic growth – comparing developing, emerging...
TRANSCRIPT

Dis cus si on Paper No. 14-117
ICT and Economic Growth – Comparing Developing, Emerging
and Developed Countries
Thomas Niebel
Dis cus si on Paper No. 14-117
ICT and Economic Growth – Comparing Developing, Emerging
and Developed Countries
Thomas Niebel
Download this ZEW Discussion Paper from our ftp server:
http://ftp.zew.de/pub/zew-docs/dp/dp14117.pdf
Die Dis cus si on Pape rs die nen einer mög lichst schnel len Ver brei tung von neue ren For schungs arbei ten des ZEW. Die Bei trä ge lie gen in allei ni ger Ver ant wor tung
der Auto ren und stel len nicht not wen di ger wei se die Mei nung des ZEW dar.
Dis cus si on Papers are inten ded to make results of ZEW research prompt ly avai la ble to other eco no mists in order to encou ra ge dis cus si on and sug gesti ons for revi si ons. The aut hors are sole ly
respon si ble for the con tents which do not neces sa ri ly repre sent the opi ni on of the ZEW.
ICT and Economic Growth - Comparing Developing, Emerging andDeveloped Countries
Thomas Niebel∗
ZEW Mannheim
December 2014
Abstract
This paper analyzes the impact of information and communication technologies (ICT) on eco-nomic growth in developing, emerging and developed countries. It is based on a sample of 59countries for the period 1995 to 2010. Various panel data regressions confirm the positive rela-tionship between ICT capital and GDP growth. The regressions for the subsamples of developing,emerging and developed countries do not reveal statistically significant differences of the outputelasticity of ICT between these three country groups.
Keywords: ICT, Economic GrowthJEL Classification Numbers: E22, J24, O47
∗Centre for European Economic Research (ZEW) Mannheim, P.O. Box 10 34 43, 68034 Mannheim, Phone: +49-621-1235-228, Fax:-333, E-mail: [email protected]. For further information on projects of the author see www.zew.de/staff_tnias well as the ZEW annual report on www.zew.de/en. The author thanks James Binfield, Marianne Saam and PatrickSchulte as well as participants at the 33rd IARIWGeneral Conference in Rotterdam for helpful comments and suggestions.All remaining errors are mine.
1 Introduction
Productivity growth lays the foundation for improvements in the standard of living.1 Investments ininformation and communication technologies (ICT) are seen as a key driver of productivity growth.This relationship has been extensively studied for developed countries at the firm, industry and countrylevel with the majority of studies showing the productivity effect of ICT as positive and economicallysignificant.2 Recent literature reviews by Draca et al. (2007), Van Reenen et al. (2010), and Cardonaet al. (2013) list a comprehensive set of studies applying different methodologies. To date there israther weak and ambiguous empirical evidence on the contribution of ICT investments on economicgrowth for emerging and especially developing countries. Despite the rather ambiguous empiricalevidence, the World Bank (2012) takes an optimistic view stating that “Information and communica-tion technologies (ICTs) have great promise to reduce poverty, increase productivity, boost economicgrowth (. . . )”. The weak and ambiguous empirical evidence of the impact of ICT in developing coun-tries may largely be driven by the lack of high quality micro and macro level data sets on ICT forthese countries.A priori, there may be valid reasons why the impact of ICT on growth in developing and emerg-ing countries is different than in developed countries. On the one hand, developing and emergingcountries might be lacking absorptive capacities like an appropriate level of human capital or othercomplementarity factors such as R&D expenditures3 and therefore gain less than developed countriesfrom investments in ICT. On the other hand, ICT could enable developing and emerging countries to‘leapfrog’ traditional methods of increasing productivity as mentioned by Steinmueller (2001). Theadditional productivity gains could be triggered by “ICT-related spillovers or network effects”4 asICT may lower transaction costs and speed up the process of knowledge creation.5 But these networkeffects may be more pronounced “when many firms in a region or industry are using similar levels ortypes of ICT”.6
This paper contributes to the literature in several ways. Section 2 reviews the current empirical litera-ture on the impact of ICT on economic growth, focusing on differences in methodologies, data sourcesand sample periods. Section 3 describes the unique features of the data set used for the empirical work.The Conference Board Total Economy Database (The Conference Board, 2014a), the main source,contains annual data for GDP, ICT and non-ICT capital services as well as labor services to controlfor changes in human capital. In contrast to previous studies, the empirical work is based on thesecapital and labor services which are a more appropriate measure than stock variables. The samplefor the empirical analysis consists of 59 developing, emerging and developed countries for 1995-2010and thus covers more countries and years than previous studies were able to. This rich, high qualitydata set allows clarification of the previous empirical results. Based on this data, Section 4 presentsthe results including a comparison of the estimated coefficients for the output elasticity of ICT for thepooled sample and the three country subgroups.The results for the full sample of countries confirm the positive contribution of ICT to economic
1 See e.g. Timmer et al. (2010, p. 18).2 Cardona et al. (2013, p. 109).3 Keller (2004, p. 774).4 Stiroh (2002, p. 43).5 Pilat (2004, pp.57-58).6 Draca et al. (2007, p. 106).
1
growth with an output elasticity of about 10 percent, exceeding the factor compensation share bya large amount.7 The estimates with sub-samples for the three country groups only reveal smalldifferences between developing, emerging and developed countries. Thus, the results indicate thatdeveloping and emerging countries are not gaining more from investments in ICT than developedeconomies, questioning the ‘leapfrogging’ through ICT argument.
2 Related Literature
The macro-level empirical work on the relationship between ICT and economic growth is based ongrowth accounting and econometric studies. Several growth accounting studies reveal economically sig-nificant contributions of ICT capital to economic growth after the mid 1990s in developed economies.These studies by Oliner and Sichel (2000), Jorgenson and Stiroh (2000) and Oliner and Sichel (2002)focused on the productivity effects of ICT in the US because “European statistics offices’ publishedindustry data on ICT assets lag behind the US”.8 The work by Inklaar et al. (2005) compared the ICTcontribution of the US and the EU4 consisting of France, Germany, the Netherlands and the UnitedKingdom showing higher contributions for the US than the EU4 during the period 1979 to 2000.With the release of the EU KLEMS database (O’Mahony and Timmer, 2009), cross-country studieslike Inklaar et al. (2008), Van Ark et al. (2008), Strauss and Samkharadze (2011) as well as Timmeret al. (2011) appeared, showing substantial sectoral and cross-country heterogeneity with respect tothe contribution of ICT on labor productivity growth in developed countries.In the past decade, a number of macro-level econometric studies on ICT and productivity in developedcountries have been carried out. Stiroh (2002) surprisingly finds a negative output elasticity of ICTcapital in his pooled OLS and IV regressions based on US manufacturing industries data for the years1984-1999. With an updated data set and more detailed industry breakdown, Stiroh (2005) reportspositive coefficients of ICT capital in the production function regressions. Based on dynamic paneldata estimations, O’Mahony and Vecchi (2005) as well as Dimelis and Papaioannou (2011) show thatthere is a significant effect of ICT capital on output growth for both the UK and the US. Dahl et al.(2011) confirm these findings for eight European countries using EU KLEMS data (O’Mahony andTimmer, 2009).Another strand of the literature focuses on just communication technology (CT). Roller and Waverman(2001) find a causal relationship between CT and GDP for 21 OECD countries. Czernich et al. (2011)support the finding by Roller and Waverman (2001) on the importance of communication technology.Based on a panel of 20 OECD countries, they provide empirical evidence that increasing broadbandpenetration raises GDP growth rates. More comprehensive literature reviews with a focus on devel-oped countries include Draca et al. (2007), Van Reenen et al. (2010), Biagi (2013) and Cardona et al.(2013).A priori, it is not clear whether the impact of ICT on economic growth in emerging and developingcountries is larger than in developed countries. Steinmueller (2001, p. 194) points out that “ICTshave the potential to support the development strategy of leapfrogging, i.e. bypassing some of theprocesses of accumulation of human capabilities and fixed investment in order to narrow the gaps in
7 This difference is smaller in the IV regressions.8 Draca et al. (2007, p. 112).
2
productivity and output that separate industrialized and developing countries.” Whether this strat-egy is successful crucially depends on the absorptive capacities (“the ability and effort of workersand managers to apply new technology”9) of the emerging and developing countries (see e.g. Keller1996, Keller 2004 and Henry et al. 2009). The report by the United Nations (2011, pp. 71-78) listsa variety of examples, why ICTs may have a strong(er) impact on economic performance in emergingand developing countries. First of all, investments in ICT may decrease the administrative burdenof firms through the introduction of e-government applications. Furthermore, ICT can be used fortraining and advisory services. It also enhances access to relevant information. Mobile money services,as a tool to save travel time and to reduce transaction costs, are particularly important to micro- andsmall enterprises. None of these ICT services and applications are specific to emerging and developingcountries. But in these countries, ICT often provides services that were previously not available ineither the digital or the non-digital economy.
The empirical macro-level literature on ICT and growth in developing and emerging countries examinesdiffering country groups and time periods which narrows the comparability and generalizability of theresults. Dewan and Kraemer (2000) find a positive effect of the ICT capital stock on GDP growthin developed countries, whereas the ICT coefficient for developing countries is insignificant. Theauthors explain this finding by potentially missing ‘IT-enhancing complementarity factors’ like humancapital. The estimation is performed with a panel of 36 countries (14 developing and 22 developedcountries) for the years 1985 to 1993. As this period was just the start of the rapid diffusion ofICT in developed countries, it was probably to early to see any (economically) significant effects indeveloping countries. Pohjola (2002), with data on 42 countries within the period 1985-1999, doesnot find any significant relationship between ICT and economic growth in either the full sample,or any of the country subgroups. These results are possibly driven by the fact that the ICT inputvariable is measured as the share of nominal ICT investment in GDP, which does not incorporate anyquality improvements of ICT over time. Papaioannou and Dimelis (2007) show that the impact of theICT capital stock on labor productivity growth is stronger in developed than in developing countries.Their analysis is based on an Arellano and Bond (1991) panel data estimator applied to a sampleof 22 developed and 20 developing countries for the period 1993 to 2001. Based on the same databut with a refined econometric approach and the inclusion of foreign direct investment (FDI) as anadditional control variable, which is seen as an important channel for technology diffusion,10 Dimelisand Papaioannou (2010) report that the impact of ICT is stronger in developing than in developedcountries. The study by Yousefi (2011) uses World Bank data for the period 2000 to 2006 and findsan insignificant impact of ICT capital investment on output growth for developing countries. Thepaper by Dedrick et al. (2013) has the most recent and comprehensive data so far. Their data setconsists of 45 upper-income developing and developed countries for the period 1994 to 2007. Theirset of so-called ‘upper-income developing countries’ are comparable to the emerging countries in thepresent study. They provide econometric evidence for the contribution of ICT to growth for bothdeveloping and developed countries with slightly larger output elasticities of ICT stock in developedthan in the upper-income developing countries. As mentioned before, the rather ambiguous empirical
9 Kneller (2005).10See e.g. Keller (2004, p. 752).
3
evidence so far might be explained by different analytical approaches and the use of data sets coveringdifferent countries and time periods.11
Apart from the econometric analyses, several growth accounting studies by Jorgenson and Vu (2005,2010, 2011) focus on specific regional groups of countries like ‘Developing Asia’ and Latin Americaand therefore implicitly perform a comparison of the contribution of ICT to growth in developing,emerging and developed countries. The same applies to Vu (2011), who uses data on penetration ratesof personal computers, mobile phones and internet users in 107 developing, emerging and developedcountries to investigate the impact of ICT on growth, but does not distinguish between these countrygroups.Furthermore, a number of micro-level studies analyze the impact of ICT on productivity for certaindeveloping and emerging countries. Aker and Mbiti (2010) discuss, based on the fact that mobilephone usage in Sub-Saharan Africa has grown significantly over the past decade, the economic impactof this rapid diffusion. Commander et al. (2011) find a positive relation between ICT capital and theproductivity of firms in Brazil and India.
3 Data and Methodology
The primary data source for the analysis is the Conference Board Total Economy Database12 (TheConference Board, 2014a). It was originally developed by the Groningen Growth and DevelopmentCentre13 and since 2007 has been maintained by the Conference Board. The database contains annualdata for i.a. GDP, ICT and non-ICT capital services as well as labor services for 123 countries. Outputdata are available for the period 1950 to 2013, whereas capital input and detailed labor input data aregenerally only available for a subset of countries for the years 1990 to 2013. The final data set for theempirical analysis consists of 59 countries for the period 1995 to 2010 with a total of 893 observations.There are two reasons for restricting the sample to the period 1995-2010. First, years prior to 1995often show missing values for the ICT input variables especially in developing countries. Second,capital input data of the Total Economy Database after 2010 are often inferred from different sourcesor calculated with a slightly different methodology, which could reduce the overall data quality for themost recent years. Further control variables for the robustness checks are taken from the World BankWorld Development Indicators (WDI).14
3.1 Categorization of Countries
As the primary goal of this empirical work is to compare the contribution of ICT to economic growthfor developing, emerging and developed countries, it is necessary to do divide the total sample intothree reasonable subsamples. The definition of the country groups is usually based on GDP/GNIper capita or more general indicators like the literacy rate of the countries. The threshold variablechosen in this empirical application is GDP per capita in 1995 expressed in purchasing power parity11In contrast to the one-time compilation of data sets used in previous studies, the present empirical work is based onan annually updated publicly available data set on ICT and economic growth. See Section 3 for details.
12To be precise, I use the March 2014 update of the Conference Board Total Economy Database January 2014 release. Seehttps://www.conference-board.org/retrievefile.cfm?filename=TED-Change-Notes.pdf&type=subsite. I thankKlaas De Vries for providing this update covering the majority of errors I found in the January 2014 release.
13See http://www.rug.nl/research/ggdc/data/total-economy-database-.14World Bank (2014).
4
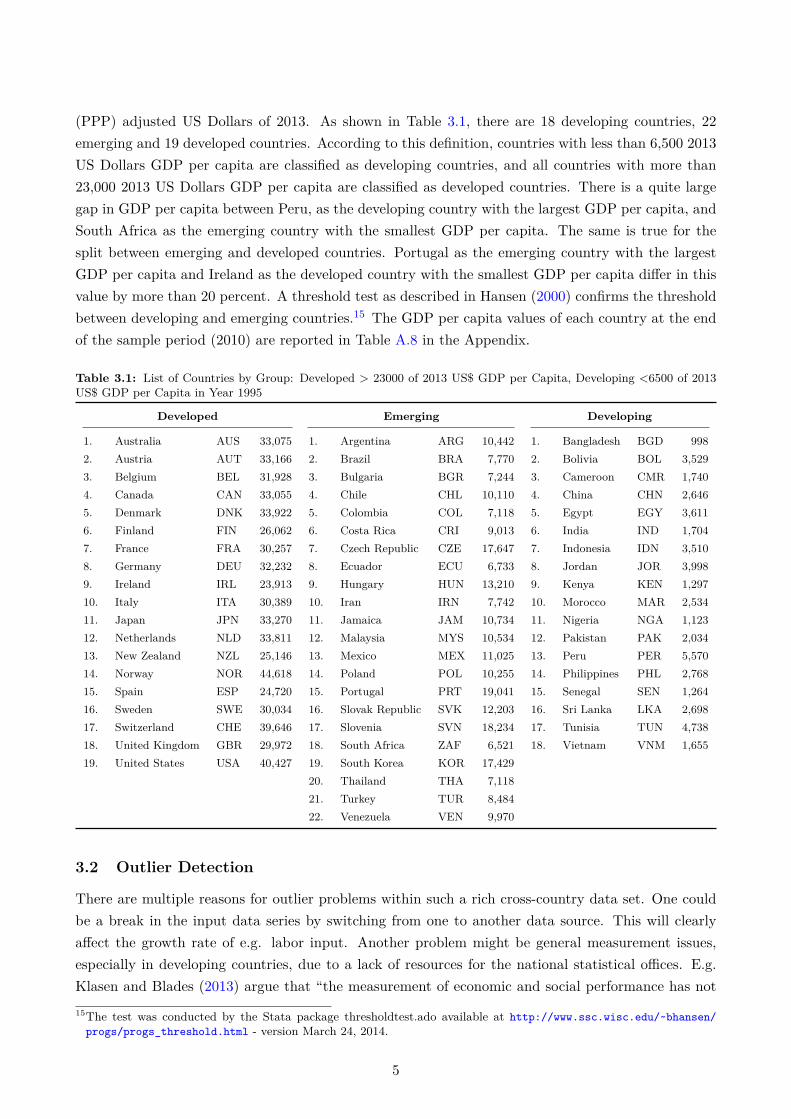
(PPP) adjusted US Dollars of 2013. As shown in Table 3.1, there are 18 developing countries, 22emerging and 19 developed countries. According to this definition, countries with less than 6,500 2013US Dollars GDP per capita are classified as developing countries, and all countries with more than23,000 2013 US Dollars GDP per capita are classified as developed countries. There is a quite largegap in GDP per capita between Peru, as the developing country with the largest GDP per capita, andSouth Africa as the emerging country with the smallest GDP per capita. The same is true for thesplit between emerging and developed countries. Portugal as the emerging country with the largestGDP per capita and Ireland as the developed country with the smallest GDP per capita differ in thisvalue by more than 20 percent. A threshold test as described in Hansen (2000) confirms the thresholdbetween developing and emerging countries.15 The GDP per capita values of each country at the endof the sample period (2010) are reported in Table A.8 in the Appendix.
Table 3.1: List of Countries by Group: Developed > 23000 of 2013 US$ GDP per Capita, Developing <6500 of 2013US$ GDP per Capita in Year 1995
Developed Emerging Developing
1. Australia AUS 33,075 1. Argentina ARG 10,442 1. Bangladesh BGD 9982. Austria AUT 33,166 2. Brazil BRA 7,770 2. Bolivia BOL 3,5293. Belgium BEL 31,928 3. Bulgaria BGR 7,244 3. Cameroon CMR 1,7404. Canada CAN 33,055 4. Chile CHL 10,110 4. China CHN 2,6465. Denmark DNK 33,922 5. Colombia COL 7,118 5. Egypt EGY 3,6116. Finland FIN 26,062 6. Costa Rica CRI 9,013 6. India IND 1,7047. France FRA 30,257 7. Czech Republic CZE 17,647 7. Indonesia IDN 3,5108. Germany DEU 32,232 8. Ecuador ECU 6,733 8. Jordan JOR 3,9989. Ireland IRL 23,913 9. Hungary HUN 13,210 9. Kenya KEN 1,29710. Italy ITA 30,389 10. Iran IRN 7,742 10. Morocco MAR 2,53411. Japan JPN 33,270 11. Jamaica JAM 10,734 11. Nigeria NGA 1,12312. Netherlands NLD 33,811 12. Malaysia MYS 10,534 12. Pakistan PAK 2,03413. New Zealand NZL 25,146 13. Mexico MEX 11,025 13. Peru PER 5,57014. Norway NOR 44,618 14. Poland POL 10,255 14. Philippines PHL 2,76815. Spain ESP 24,720 15. Portugal PRT 19,041 15. Senegal SEN 1,26416. Sweden SWE 30,034 16. Slovak Republic SVK 12,203 16. Sri Lanka LKA 2,69817. Switzerland CHE 39,646 17. Slovenia SVN 18,234 17. Tunisia TUN 4,73818. United Kingdom GBR 29,972 18. South Africa ZAF 6,521 18. Vietnam VNM 1,65519. United States USA 40,427 19. South Korea KOR 17,429
20. Thailand THA 7,11821. Turkey TUR 8,48422. Venezuela VEN 9,970
3.2 Outlier Detection
There are multiple reasons for outlier problems within such a rich cross-country data set. One couldbe a break in the input data series by switching from one to another data source. This will clearlyaffect the growth rate of e.g. labor input. Another problem might be general measurement issues,especially in developing countries, due to a lack of resources for the national statistical offices. E.g.Klasen and Blades (2013) argue that “the measurement of economic and social performance has not15The test was conducted by the Stata package thresholdtest.ado available at http://www.ssc.wisc.edu/~bhansen/
progs/progs_threshold.html - version March 24, 2014.
5
kept pace with the apparent drastic improvements in that performance in recent years.”To account for breaks in data series and more general data errors, I use a five step approach. First,I drop countries with erroneous or implausible data during the whole period. This reduces numberof countries with data on ICT input from 68 to 59 countries.16 The next step is to drop the singleobservations of the remaining 59 countries with obvious data errors such as a zero ICT capital com-pensation share (12 observations). Visual inspection of year by year scatter plots between the GDPgrowth rate and the growth rates of factor input variables revealed 11 additional problematic observa-tions. The fourth step is to calculate the so-called DFBETA17 values. The idea behind this method isto calculate the impact of the ith observation on the regression coefficient and drop the observationswith abnormal high impact (9 observations dropped). The methodology proposed by Hadi (1992,1994) is another commonly used approach to detect outliers in the empirical literature.18 This fifthstep detects another 12 observations as outliers. The complete list of the 44 dropped observations andthe approach that identified the outlier is available in Table A.7.
3.3 Capital and Labor Input Variables
In contrast to previous studies, the empirical work is based on capital services instead of capitalstocks. Capital services are a more appropriate measure than capital stocks. This is, e.g., emphasizedby Inklaar and Timmer (2013, p13): “A capital services measure would reflect that shorter lived assetshave a larger return in production, as indicated by the user cost of capital of each asset”. ICT capitalservices as well as non-ICT capital services are calculated as the growth rates of the stocks of thesingle assets (information technology equipment, communication technology equipment and softwarefor ICT) weighted by their factor shares in total ICT (non-ICT) capital compensation. The labor inputvariable is the growth rate of labor services. It is the sum of the growth rate of the labor compositionindex and the growth rate of labor quantity. The growth rate of the labor composition reflects changesin human capital. It is constructed19 as the growth rate of the share of different skill-level groupingsin the labor force weighted by their share in total labor compensation. The definition of the growthrate of labor quantity differs between countries. In the more advanced economies, it is the growth rateof total hours worked. In contrast, the labor quantity for less developed countries is usually based onthe employment growth rate. These two methodologies do not lead to any differences as long as theaverage hours worked per person do not change over time.20
Nearly all developing and some of the emerging countries are lacking data for labor compensation. Thead hoc approach of the The Conference Board (2014a) is to assume a labor compensation share in totalfactor compensation of 0.5. This assumption is justified by the fact that in economies where capitalis scarcer, the returns for capital should be higher and the returns for labor smaller.21 As the laborcompensation is not directly included in the regression, this does not influence the estimated output
16The countries not in the sample are Algeria (implausible labor services growth rates), Greece (overall data qualityissues), Hong Kong and Singapore (very specific export oriented type of economy), Israel, Romania and the RussiaFederation (implausible non-ICT capital services growth rates), Taiwan (no data on export share) as well as Uruguay(implausible ICT capital services growth rates).
17See e.g. Temple (2000).18See e.g. Harbaugh et al. (2002), Durham (2004) and Ardizzi et al. (2014).19See The Conference Board (2014b) page 5.20See The Conference Board (2014b) page 2.21See The Conference Board (2014b) page 12. See also Tables 3.2, 3.3 and 3.4.
6
elasticities of ICT- and non-ICT capital. However, the potentially underestimated labor compensationshare in developing countries might affect the comparison between the output elasticity of ICT andthe growth accounting based ICT compensation share.
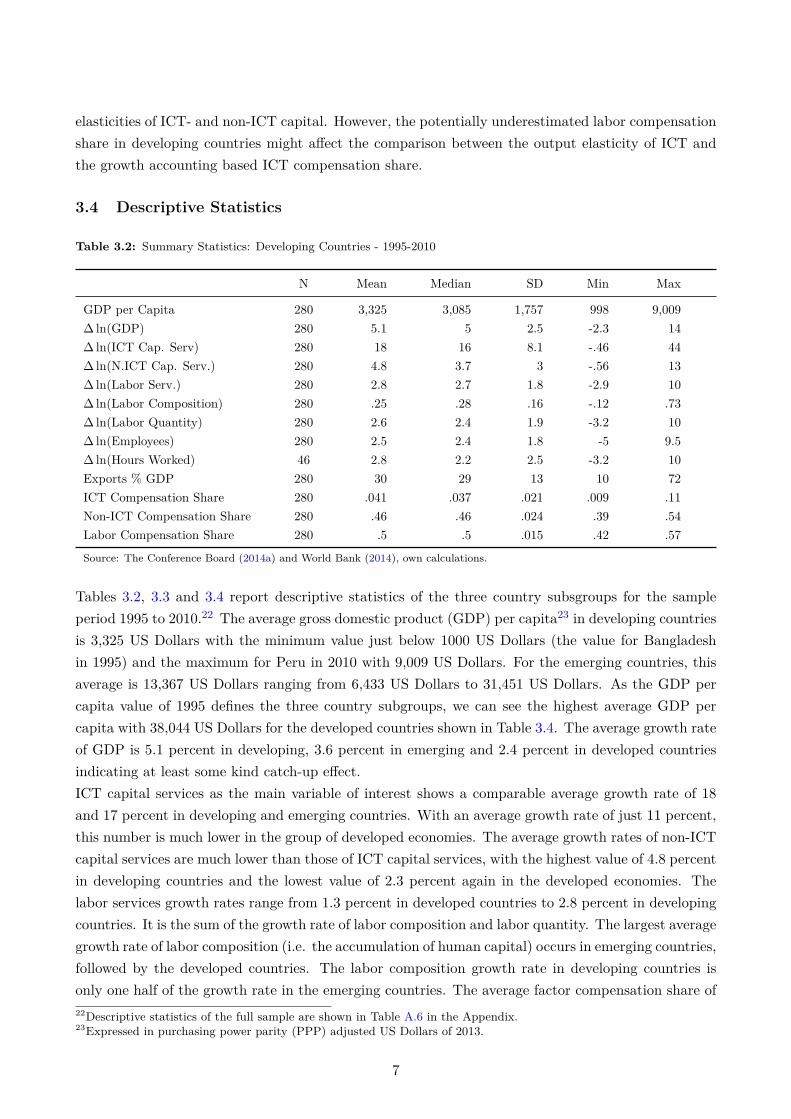
3.4 Descriptive Statistics
Table 3.2: Summary Statistics: Developing Countries - 1995-2010
N Mean Median SD Min Max
GDP per Capita 280 3,325 3,085 1,757 998 9,009∆ ln(GDP) 280 5.1 5 2.5 -2.3 14∆ ln(ICT Cap. Serv) 280 18 16 8.1 -.46 44∆ ln(N.ICT Cap. Serv.) 280 4.8 3.7 3 -.56 13∆ ln(Labor Serv.) 280 2.8 2.7 1.8 -2.9 10∆ ln(Labor Composition) 280 .25 .28 .16 -.12 .73∆ ln(Labor Quantity) 280 2.6 2.4 1.9 -3.2 10∆ ln(Employees) 280 2.5 2.4 1.8 -5 9.5∆ ln(Hours Worked) 46 2.8 2.2 2.5 -3.2 10Exports % GDP 280 30 29 13 10 72ICT Compensation Share 280 .041 .037 .021 .009 .11Non-ICT Compensation Share 280 .46 .46 .024 .39 .54Labor Compensation Share 280 .5 .5 .015 .42 .57
Source: The Conference Board (2014a) and World Bank (2014), own calculations.
Tables 3.2, 3.3 and 3.4 report descriptive statistics of the three country subsgroups for the sampleperiod 1995 to 2010.22 The average gross domestic product (GDP) per capita23 in developing countriesis 3,325 US Dollars with the minimum value just below 1000 US Dollars (the value for Bangladeshin 1995) and the maximum for Peru in 2010 with 9,009 US Dollars. For the emerging countries, thisaverage is 13,367 US Dollars ranging from 6,433 US Dollars to 31,451 US Dollars. As the GDP percapita value of 1995 defines the three country subgroups, we can see the highest average GDP percapita with 38,044 US Dollars for the developed countries shown in Table 3.4. The average growth rateof GDP is 5.1 percent in developing, 3.6 percent in emerging and 2.4 percent in developed countriesindicating at least some kind catch-up effect.ICT capital services as the main variable of interest shows a comparable average growth rate of 18and 17 percent in developing and emerging countries. With an average growth rate of just 11 percent,this number is much lower in the group of developed economies. The average growth rates of non-ICTcapital services are much lower than those of ICT capital services, with the highest value of 4.8 percentin developing countries and the lowest value of 2.3 percent again in the developed economies. Thelabor services growth rates range from 1.3 percent in developed countries to 2.8 percent in developingcountries. It is the sum of the growth rate of labor composition and labor quantity. The largest averagegrowth rate of labor composition (i.e. the accumulation of human capital) occurs in emerging countries,followed by the developed countries. The labor composition growth rate in developing countries isonly one half of the growth rate in the emerging countries. The average factor compensation share of22Descriptive statistics of the full sample are shown in Table A.6 in the Appendix.23Expressed in purchasing power parity (PPP) adjusted US Dollars of 2013.
7
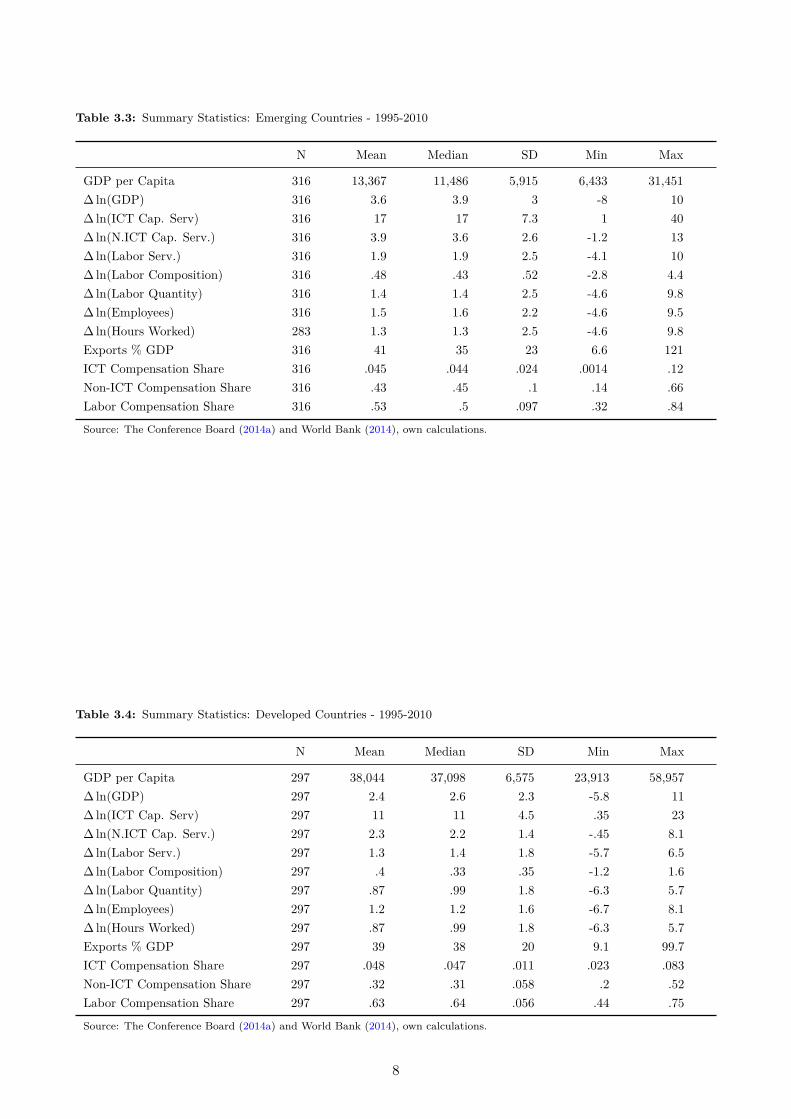
Table 3.3: Summary Statistics: Emerging Countries - 1995-2010
N Mean Median SD Min Max
GDP per Capita 316 13,367 11,486 5,915 6,433 31,451∆ ln(GDP) 316 3.6 3.9 3 -8 10∆ ln(ICT Cap. Serv) 316 17 17 7.3 1 40∆ ln(N.ICT Cap. Serv.) 316 3.9 3.6 2.6 -1.2 13∆ ln(Labor Serv.) 316 1.9 1.9 2.5 -4.1 10∆ ln(Labor Composition) 316 .48 .43 .52 -2.8 4.4∆ ln(Labor Quantity) 316 1.4 1.4 2.5 -4.6 9.8∆ ln(Employees) 316 1.5 1.6 2.2 -4.6 9.5∆ ln(Hours Worked) 283 1.3 1.3 2.5 -4.6 9.8Exports % GDP 316 41 35 23 6.6 121ICT Compensation Share 316 .045 .044 .024 .0014 .12Non-ICT Compensation Share 316 .43 .45 .1 .14 .66Labor Compensation Share 316 .53 .5 .097 .32 .84
Source: The Conference Board (2014a) and World Bank (2014), own calculations.
Table 3.4: Summary Statistics: Developed Countries - 1995-2010
N Mean Median SD Min Max
GDP per Capita 297 38,044 37,098 6,575 23,913 58,957∆ ln(GDP) 297 2.4 2.6 2.3 -5.8 11∆ ln(ICT Cap. Serv) 297 11 11 4.5 .35 23∆ ln(N.ICT Cap. Serv.) 297 2.3 2.2 1.4 -.45 8.1∆ ln(Labor Serv.) 297 1.3 1.4 1.8 -5.7 6.5∆ ln(Labor Composition) 297 .4 .33 .35 -1.2 1.6∆ ln(Labor Quantity) 297 .87 .99 1.8 -6.3 5.7∆ ln(Employees) 297 1.2 1.2 1.6 -6.7 8.1∆ ln(Hours Worked) 297 .87 .99 1.8 -6.3 5.7Exports % GDP 297 39 38 20 9.1 99.7ICT Compensation Share 297 .048 .047 .011 .023 .083Non-ICT Compensation Share 297 .32 .31 .058 .2 .52Labor Compensation Share 297 .63 .64 .056 .44 .75
Source: The Conference Board (2014a) and World Bank (2014), own calculations.
8
ICT capital24 ranges in all countries groups between 4 and 5 percent, with the highest value in thedeveloped economies.25 This is clearly an interesting result on its own. The within group variationin developing and emerging countries is much larger than in developed countries. The variation intime of the average ICT compensation share is displayed in Figure A.1 in the Appendix, showing forthe emerging countries a slight upward trend and in contrast for the developed countries a minimaldownward trend.26
3.5 Econometric Model
As shown in the descriptive statistics, the factor compensation shares of ICT capital in total factorcompensation are nearly identical in developing, emerging and developed countries, with values rangingfrom 0.04 to 0.05. Regression-based output elasticities are able to reveal whether there are excessreturn of investments in ICT capital and whether these returns are differing between the countrysubgroups. For the comparison of output elasticities between the three country groups, following e.g.Stiroh (2002), an (augmented) Cobb-Douglas production function without imposing constant returnsto scale is estimated as follows:
∆ lnYc,t = βICT ∆ lnKICTc,t + βNICT ∆ lnKNICT
c,t + βL∆ lnLc,t + βXXc,t + λt + µc + εc,t (1)
with ∆ lnYc,t being the growth rate of GDP and ∆ lnKICTc,t , ∆ lnKNICT
c,t , ∆ lnLc,t the growth ratesof the input factors ICT capital services, non-ICT capital services and labor services in country c attime t. X denotes additional control variables in an augmented Cobb-Douglas production functionsetting controlling for differences in the production technology between countries. λt are time dum-mies, whereas µc indicates country dummies (in the fixed effects setting). εc,t is the general error term.The time dummies control for common shocks arising for (almost) all countries such as the GlobalFinancial Crisis of 2007–2008.The econometric analysis is carried out for the full sample as well as for the subsamples of countrygroups. For the full sample regressions, I use four different estimators to estimate the Cobb-Douglasproduction function. The baseline specification is a pooled OLS (POLS) regression. In addition, Iuse a random effects (RE) estimator as well as a fixed-effects (FE) panel regressions model, where thelatter controls for unmeasured cross-country differences. The fourth specification features a Panel-IVapproach with lagged growth rates of ICT capital services. This controls, albeit not as perfectly asan external instrument, for the endogeneity of the ICT input variables. Due to the small number ofobservations, the IV approach is not feasible for the split-sample regressions.If the ‘leapfrogging’ effect described by Steinmueller (2001) holds, the output elasticities of ICT indeveloping and emerging countries should be larger than those in developed countries. Another al-ternative would be the mean group (MG) estimator that allows for parameter heterogeneity betweencountries as described in Pesaran and Smith (1995). With this type of estimator, country specificestimations are carried out and later averaged across these countries. Given the still rather short time
24The country with the extraordinary low ICT capital compensation share is Iran in 1995.25The two period averages of ICT and non-ICT capital compensation shares shown in Table in Tables 3.2, 3.3 and 3.4are not directly available from the Total Economy Database and therefore calculated recursively: two period averageICT capital compensation = GDP contribution of ICT/∆ ln ICT capital services.
26The non-ICT compensation share is very stable over time for all country subgroups as shown in A.2 in the Appendix.
9
dimension in this empirical application, this estimator (and other heterogeneous parameter estimators)should be viable in future research with data sets of larger time dimension.27
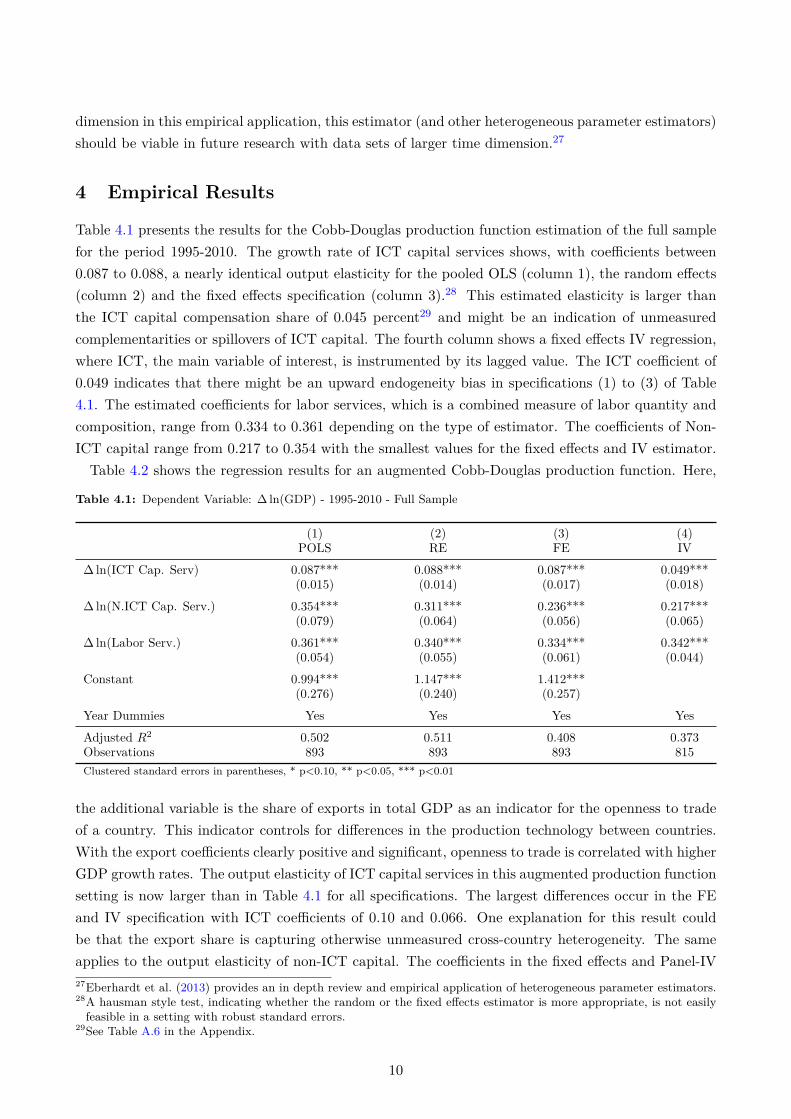
4 Empirical Results
Table 4.1 presents the results for the Cobb-Douglas production function estimation of the full samplefor the period 1995-2010. The growth rate of ICT capital services shows, with coefficients between0.087 to 0.088, a nearly identical output elasticity for the pooled OLS (column 1), the random effects(column 2) and the fixed effects specification (column 3).28 This estimated elasticity is larger thanthe ICT capital compensation share of 0.045 percent29 and might be an indication of unmeasuredcomplementarities or spillovers of ICT capital. The fourth column shows a fixed effects IV regression,where ICT, the main variable of interest, is instrumented by its lagged value. The ICT coefficient of0.049 indicates that there might be an upward endogeneity bias in specifications (1) to (3) of Table4.1. The estimated coefficients for labor services, which is a combined measure of labor quantity andcomposition, range from 0.334 to 0.361 depending on the type of estimator. The coefficients of Non-ICT capital range from 0.217 to 0.354 with the smallest values for the fixed effects and IV estimator.Table 4.2 shows the regression results for an augmented Cobb-Douglas production function. Here,
Table 4.1: Dependent Variable: ∆ ln(GDP) - 1995-2010 - Full Sample
(1) (2) (3) (4)POLS RE FE IV
∆ ln(ICT Cap. Serv) 0.087*** 0.088*** 0.087*** 0.049***(0.015) (0.014) (0.017) (0.018)
∆ ln(N.ICT Cap. Serv.) 0.354*** 0.311*** 0.236*** 0.217***(0.079) (0.064) (0.056) (0.065)
∆ ln(Labor Serv.) 0.361*** 0.340*** 0.334*** 0.342***(0.054) (0.055) (0.061) (0.044)
Constant 0.994*** 1.147*** 1.412***(0.276) (0.240) (0.257)
Year Dummies Yes Yes Yes Yes
Adjusted R2 0.502 0.511 0.408 0.373Observations 893 893 893 815Clustered standard errors in parentheses, * p<0.10, ** p<0.05, *** p<0.01
the additional variable is the share of exports in total GDP as an indicator for the openness to tradeof a country. This indicator controls for differences in the production technology between countries.With the export coefficients clearly positive and significant, openness to trade is correlated with higherGDP growth rates. The output elasticity of ICT capital services in this augmented production functionsetting is now larger than in Table 4.1 for all specifications. The largest differences occur in the FEand IV specification with ICT coefficients of 0.10 and 0.066. One explanation for this result couldbe that the export share is capturing otherwise unmeasured cross-country heterogeneity. The sameapplies to the output elasticity of non-ICT capital. The coefficients in the fixed effects and Panel-IV27Eberhardt et al. (2013) provides an in depth review and empirical application of heterogeneous parameter estimators.28A hausman style test, indicating whether the random or the fixed effects estimator is more appropriate, is not easilyfeasible in a setting with robust standard errors.
29See Table A.6 in the Appendix.
10
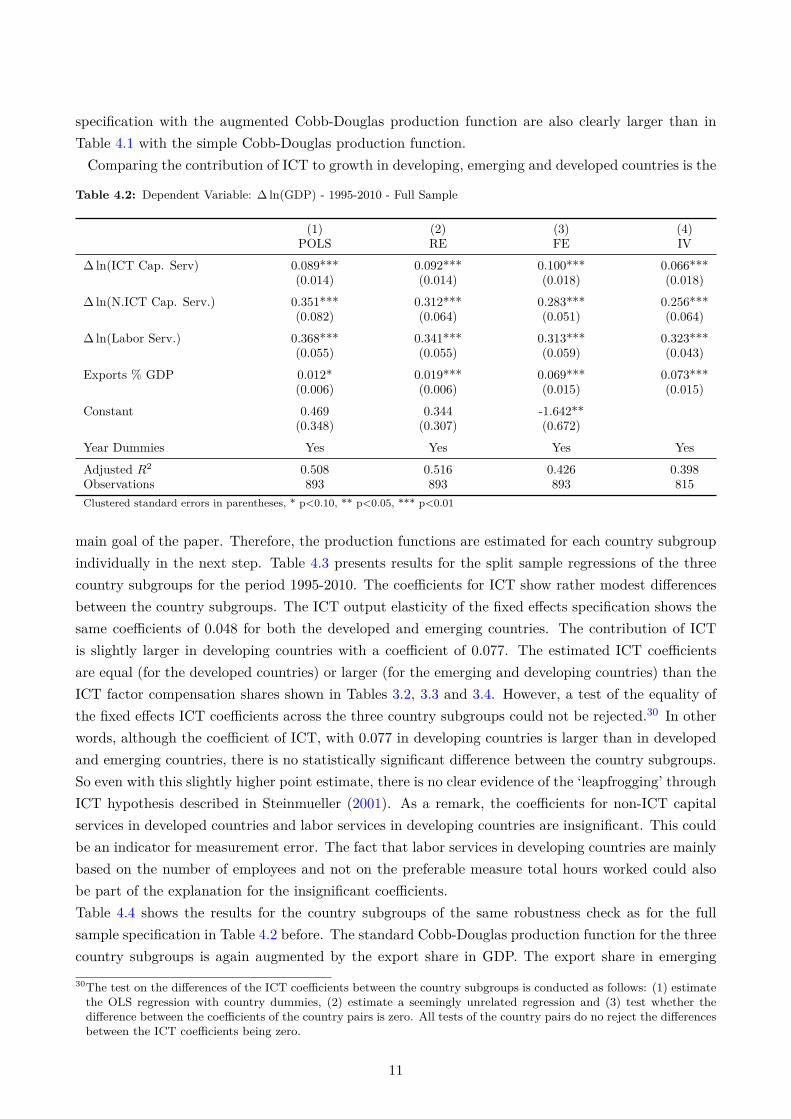
specification with the augmented Cobb-Douglas production function are also clearly larger than inTable 4.1 with the simple Cobb-Douglas production function.Comparing the contribution of ICT to growth in developing, emerging and developed countries is the
Table 4.2: Dependent Variable: ∆ ln(GDP) - 1995-2010 - Full Sample
(1) (2) (3) (4)POLS RE FE IV
∆ ln(ICT Cap. Serv) 0.089*** 0.092*** 0.100*** 0.066***(0.014) (0.014) (0.018) (0.018)
∆ ln(N.ICT Cap. Serv.) 0.351*** 0.312*** 0.283*** 0.256***(0.082) (0.064) (0.051) (0.064)
∆ ln(Labor Serv.) 0.368*** 0.341*** 0.313*** 0.323***(0.055) (0.055) (0.059) (0.043)
Exports % GDP 0.012* 0.019*** 0.069*** 0.073***(0.006) (0.006) (0.015) (0.015)
Constant 0.469 0.344 -1.642**(0.348) (0.307) (0.672)
Year Dummies Yes Yes Yes Yes
Adjusted R2 0.508 0.516 0.426 0.398Observations 893 893 893 815Clustered standard errors in parentheses, * p<0.10, ** p<0.05, *** p<0.01
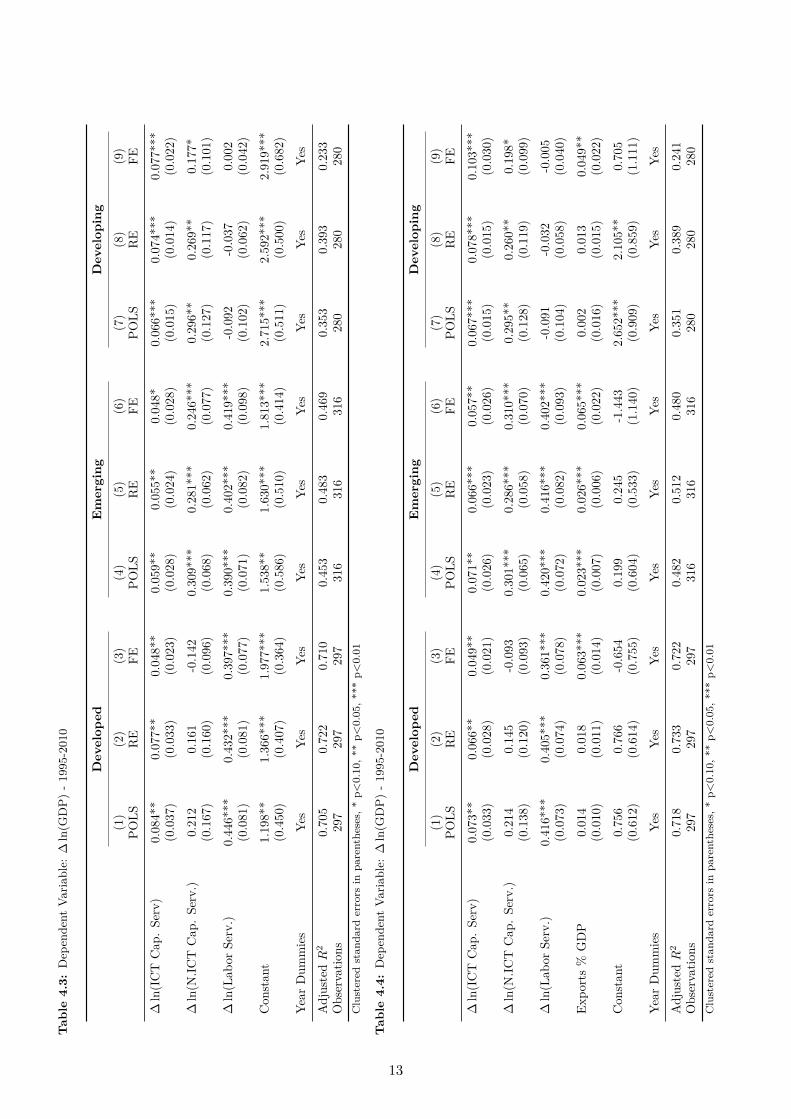
main goal of the paper. Therefore, the production functions are estimated for each country subgroupindividually in the next step. Table 4.3 presents results for the split sample regressions of the threecountry subgroups for the period 1995-2010. The coefficients for ICT show rather modest differencesbetween the country subgroups. The ICT output elasticity of the fixed effects specification shows thesame coefficients of 0.048 for both the developed and emerging countries. The contribution of ICTis slightly larger in developing countries with a coefficient of 0.077. The estimated ICT coefficientsare equal (for the developed countries) or larger (for the emerging and developing countries) than theICT factor compensation shares shown in Tables 3.2, 3.3 and 3.4. However, a test of the equality ofthe fixed effects ICT coefficients across the three country subgroups could not be rejected.30 In otherwords, although the coefficient of ICT, with 0.077 in developing countries is larger than in developedand emerging countries, there is no statistically significant difference between the country subgroups.So even with this slightly higher point estimate, there is no clear evidence of the ‘leapfrogging’ throughICT hypothesis described in Steinmueller (2001). As a remark, the coefficients for non-ICT capitalservices in developed countries and labor services in developing countries are insignificant. This couldbe an indicator for measurement error. The fact that labor services in developing countries are mainlybased on the number of employees and not on the preferable measure total hours worked could alsobe part of the explanation for the insignificant coefficients.Table 4.4 shows the results for the country subgroups of the same robustness check as for the fullsample specification in Table 4.2 before. The standard Cobb-Douglas production function for the threecountry subgroups is again augmented by the export share in GDP. The export share in emerging
30The test on the differences of the ICT coefficients between the country subgroups is conducted as follows: (1) estimatethe OLS regression with country dummies, (2) estimate a seemingly unrelated regression and (3) test whether thedifference between the coefficients of the country pairs is zero. All tests of the country pairs do no reject the differencesbetween the ICT coefficients being zero.
11
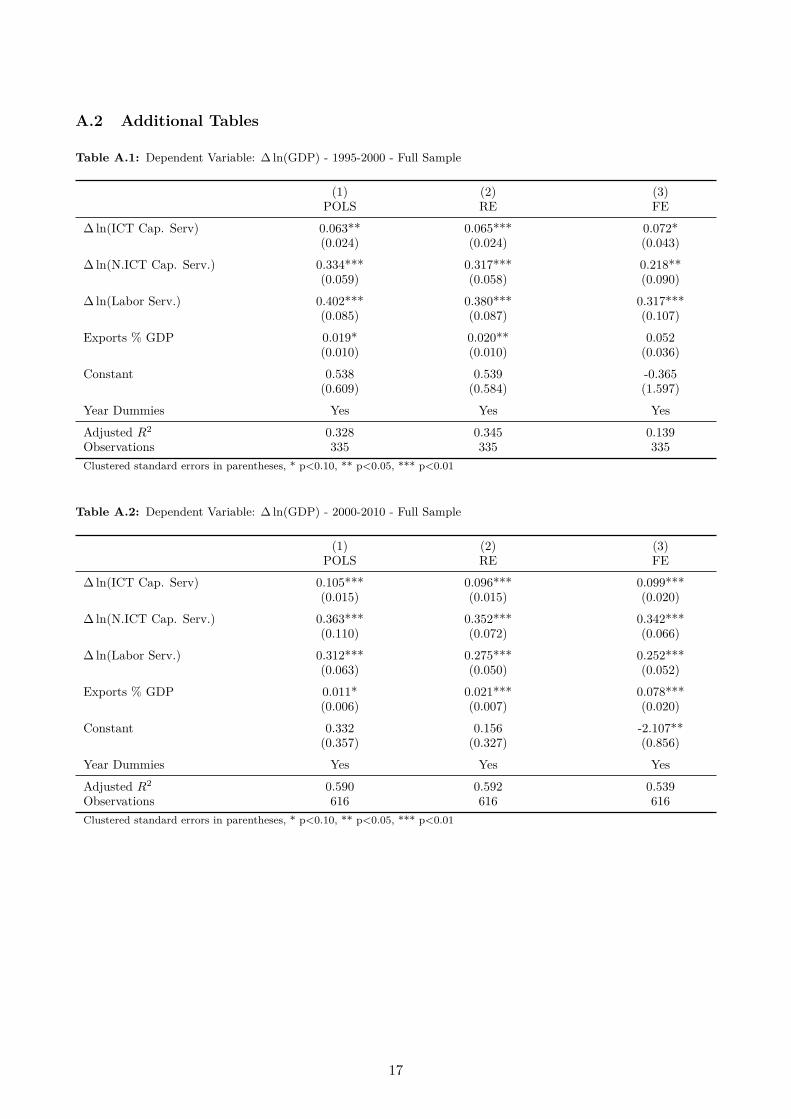
countries is, as in the full sample, positively correlated with GDP growth, whereas for developing anddeveloped countries, only the FE specifications show significant effects. The fixed effects specifications(columns 3, 6 and 9) show slightly larger coefficients than before, ranging from 0.049 in developedcountries to 0.103 in developing countries.Tables A.1 and A.2 in the Appendix present results for a split into the subperiods 1995 to 2000 and2000 to 2010 and reveal a lower ICT coefficient in the earlier period. These results seems to be largelydriven by the emerging countries between 1995 and 2000, which display insignificant coefficients for thissubperiod.31 However, during the subperiod 2000 to 2010, the ICT coefficients in emerging countriesare slightly larger than in developing and developed countries. These substantial productivity gainsof ICT capital in emerging countries still cannot provide statistically significant evidence for the‘leapfrogging’ hypothesis.
31See Tables A.3 and A.4.
12
Tab
le4.
3:Dep
ende
ntVa
riable:
∆ln(G
DP)-1
995-2010
Develop
edEmerging
Develop
ing
(1)
(2)
(3)
(4)
(5)
(6)
(7)
(8)
(9)
POLS
RE
FEPO
LSRE
FEPO
LSRE
FE
∆ln(ICT
Cap
.Serv)
0.084**
0.077**
0.048**
0.059**
0.055**
0.048*
0.066***
0.074***
0.077***
(0.037)
(0.033)
(0.023)
(0.028)
(0.024)
(0.028)
(0.015)
(0.014)
(0.022)
∆ln(N
.ICT
Cap
.Serv.)
0.212
0.161
-0.142
0.309***
0.281***
0.246***
0.296**
0.269**
0.177*
(0.167)
(0.160)
(0.096)
(0.068)
(0.062)
(0.077)
(0.127)
(0.117)
(0.101)
∆ln(L
abor
Serv.)
0.446***
0.432***
0.397***
0.390***
0.402***
0.419***
-0.092
-0.037
0.002
(0.081)
(0.081)
(0.077)
(0.071)
(0.082)
(0.098)
(0.102)
(0.062)
(0.042)
Con
stan
t1.198**
1.366***
1.977***
1.538**
1.630***
1.813***
2.715***
2.592***
2.919***
(0.450)
(0.407)
(0.364)
(0.586)
(0.510)
(0.414)
(0.511)
(0.500)
(0.682)
Year
Dum
mies
Yes
Yes
Yes
Yes
Yes
Yes
Yes
Yes
Yes
AdjustedR
20.705
0.722
0.710
0.453
0.483
0.469
0.353
0.393
0.233
Observatio
ns297
297
297
316
316
316
280
280
280
Clu
ster
edst
anda
rder
rors
inpa
rent
hese
s,*
p<0.
10,*
*p<
0.05
,***
p<0.
01
Tab
le4.
4:Dep
ende
ntVa
riable:
∆ln(G
DP)-1
995-2010
Develop
edEmerging
Develop
ing
(1)
(2)
(3)
(4)
(5)
(6)
(7)
(8)
(9)
POLS
RE
FEPO
LSRE
FEPO
LSRE
FE
∆ln(ICT
Cap
.Serv)
0.073**
0.066**
0.049**
0.071**
0.066***
0.057**
0.067***
0.078***
0.103***
(0.033)
(0.028)
(0.021)
(0.026)
(0.023)
(0.026)
(0.015)
(0.015)
(0.030)
∆ln(N
.ICT
Cap
.Serv.)
0.214
0.145
-0.093
0.301***
0.286***
0.310***
0.295**
0.260**
0.198*
(0.138)
(0.120)
(0.093)
(0.065)
(0.058)
(0.070)
(0.128)
(0.119)
(0.099)
∆ln(L
abor
Serv.)
0.416***
0.405***
0.361***
0.420***
0.416***
0.402***
-0.091
-0.032
-0.005
(0.073)
(0.074)
(0.078)
(0.072)
(0.082)
(0.093)
(0.104)
(0.058)
(0.040)
Expo
rts%
GDP
0.014
0.018
0.063***
0.023***
0.026***
0.065***
0.002
0.013
0.049**
(0.010)
(0.011)
(0.014)
(0.007)
(0.006)
(0.022)
(0.016)
(0.015)
(0.022)
Con
stan
t0.756
0.766
-0.654
0.199
0.245
-1.443
2.652***
2.105**
0.705
(0.612)
(0.614)
(0.755)
(0.604)
(0.533)
(1.140)
(0.909)
(0.859)
(1.111)
Year
Dum
mies
Yes
Yes
Yes
Yes
Yes
Yes
Yes
Yes
Yes
AdjustedR
20.718
0.733
0.722
0.482
0.512
0.480
0.351
0.389
0.241
Observatio
ns297
297
297
316
316
316
280
280
280
Clu
ster
edst
anda
rder
rors
inpa
rent
hese
s,*
p<0.
10,*
*p<
0.05
,***
p<0.
01
13
5 Conclusion
This paper investigates the importance of ICT for economic growth based on a sample of 59 countriesover the period 1995 to 2010. The main question is whether the gains from investments in ICT aredifferent between developing, emerging and developed countries. The regression of the full sample ofcountries reveals an output elasticity of ICT that is larger than the ICT factor compensation shareindicating possible spillovers and complementarities of investments in ICT.
The regressions for the three country subsamples reveal rather small differences in the output elas-ticities of ICT between developing, emerging and developed countries. These output elasticities are,except for the developed countries, larger than the ICT capital compensation shares, whereas the ICTcapital compensation shares are nearly identical in the three country subgroups and rather stable overtime. A test on the equality of estimated coefficients could not be rejected, despite the coefficients be-ing somewhat larger for the developing and emerging countries. There is no clear statistical indicationthat developing and emerging countries are gaining more from investments in ICT than developedeconomies. Therefore, the macroeconometric validity of the ‘leapfrogging’ through ICT argument aspointed out by Steinmueller (2001) remains questionable.
Two additional issues are worth mentioning. While the present data set covers the majority of devel-oped countries, emerging and developing countries are only represented to a certain extent. The list ofdeveloping and emerging countries with data on ICT capital input might not be randomly defined, butrather represents countries with larger GDP growth during the sample period. Therefore, a selectionbias into the direction of countries that use ICT more efficiently might be present, resulting in thegeneralizability of the results being only valid to a certain extent. Furthermore, not only economicbut also political and societal aspects such as the simplified access to information should be taken intoaccount when investigating the impact of ICT in developing and emerging countries.
Additional analysis, based on larger sample sizes with respect to time as well as to the number ofcountries per subgroup, should be able to use more refined econometric methods, helping to confirmthe current results. This is especially important with regard to the potential endogeneity issueswithin macro-level production function estimations. Furthermore, complementary firm-level studiescould help to gain deeper insights into the productivity effects of ICT in developing and emergingcountries.
14
A Appendix
A.1 Additional Graphs
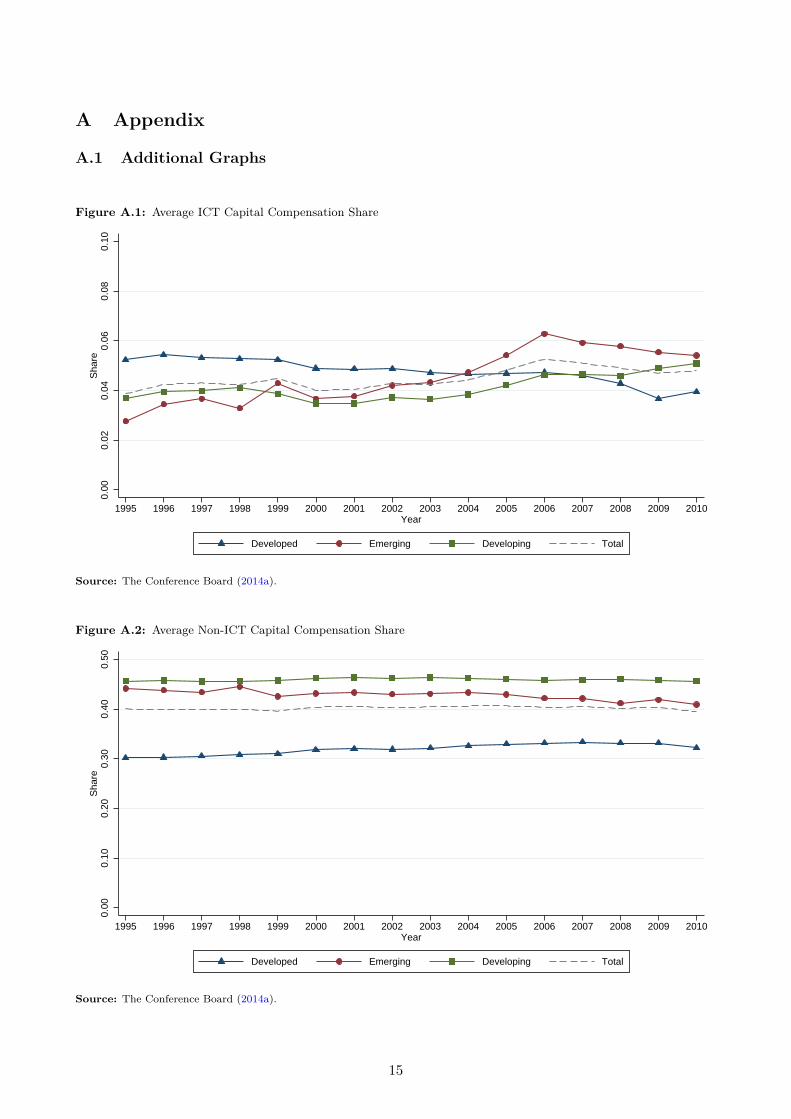
Figure A.1: Average ICT Capital Compensation Share
0.00
0.02
0.04
0.06
0.08
0.10
Sha
re
1995 1996 1997 1998 1999 2000 2001 2002 2003 2004 2005 2006 2007 2008 2009 2010Year
Developed Emerging Developing Total
Source: The Conference Board (2014a).
Figure A.2: Average Non-ICT Capital Compensation Share
0.00
0.10
0.20
0.30
0.40
0.50
Sha
re
1995 1996 1997 1998 1999 2000 2001 2002 2003 2004 2005 2006 2007 2008 2009 2010Year
Developed Emerging Developing Total
Source: The Conference Board (2014a).
15

Figure A.3: GDP Growth vs ICT Capital Services Growth - Average of 1995-2010
AUSAUSAUSAUSAUSAUSAUSAUSAUSAUSAUSAUSAUSAUSAUSAUS
AUTAUTAUTAUTAUTAUTAUTAUTAUTAUTAUTAUTAUTAUTAUTAUT
BELBELBELBELBELBELBELBELBELBELBELBELBELBELBELBEL CANCANCANCANCANCANCANCANCANCANCANCANCANCANCANCAN
DNKDNKDNKDNKDNKDNKDNKDNKDNKDNKDNKDNKDNKDNKDNKDNKFINFINFINFINFINFINFINFINFINFINFINFINFIN
FRAFRAFRAFRAFRAFRAFRAFRAFRAFRAFRAFRAFRAFRAFRAFRA
DEUDEUDEUDEUDEUDEUDEUDEUDEUDEUDEUDEUDEUDEUDEUDEU
IRLIRLIRLIRLIRLIRLIRLIRLIRLIRLIRLIRLIRL
ITAITAITAITAITAITAITAITAITAITAITAITAITAITAITAITAJPNJPNJPNJPNJPNJPNJPNJPNJPNJPNJPNJPNJPNJPNJPNJPN
NLDNLDNLDNLDNLDNLDNLDNLDNLDNLDNLDNLDNLDNLDNLDNLD
NZLNZLNZLNZLNZLNZLNZLNZLNZLNZLNZLNZLNZLNZLNZLNZLNORNORNORNORNORNORNORNORNORNORNORNORNORNORNORNOR
ESPESPESPESPESPESPESPESPESPESPESPESPESPESPESPESPSWESWESWESWESWESWESWESWESWESWESWESWESWESWESWE
CHECHECHECHECHECHECHECHECHECHECHECHECHECHECHECHEGBRGBRGBRGBRGBRGBRGBRGBRGBRGBRGBRGBRGBRGBRGBRGBRUSAUSAUSAUSAUSAUSAUSAUSAUSAUSAUSAUSAUSAUSAUSAUSA
BGDBGDBGDBGDBGDBGDBGDBGDBGDBGDBGDBGDBGDBGDBGDBGD
BOLBOLBOLBOLBOLBOLBOLBOLBOLBOLBOLBOLBOLBOLBOLBOL
CMRCMRCMRCMRCMRCMRCMRCMRCMRCMRCMRCMRCMRCMRCMRCMR
CHNCHNCHNCHNCHNCHNCHNCHNCHNCHNCHNCHNCHNCHN
EGYEGYEGYEGYEGYEGYEGYEGYEGYEGYEGYEGYEGYEGYEGYEGY
INDINDINDINDINDINDINDINDINDINDINDINDINDINDINDIND
IDNIDNIDNIDNIDNIDNIDNIDNIDNIDNIDNIDNIDNIDNIDN
JORJORJORJORJORJORJORJORJORJORJORJORJORJORJORJORKENKENKENKENKENKENKENKENKENKENKENKENKENKENKENKEN
MARMARMARMARMARMARMARMARMARMARMARMARMARMAR
NGANGANGANGANGANGANGANGANGANGANGANGANGANGANGA
PAKPAKPAKPAKPAKPAKPAKPAKPAKPAKPAKPAKPAKPAKPAKPAK
PERPERPERPERPERPERPERPERPERPERPERPERPERPERPERPER
PHLPHLPHLPHLPHLPHLPHLPHLPHLPHLPHLPHLPHLPHLPHLPHL
SENSENSENSENSENSENSENSENSENSENSENSENSENSENSENSEN
LKALKALKALKALKALKALKALKALKALKALKALKALKALKA
TUNTUNTUNTUNTUNTUNTUNTUNTUNTUNTUNTUNTUNTUNTUNTUN
VNMVNMVNMVNMVNMVNMVNMVNMVNMVNMVNMVNMVNMVNMVNMVNM
ARGARGARGARGARGARGARGARGARG
BRABRABRABRABRABRABRABRABRABRABRABRABRABRABRABGRBGRBGRBGRBGRBGRBGRBGRBGRBGRBGRBGRBGRBGR
CHLCHLCHLCHLCHLCHLCHLCHLCHLCHLCHLCHLCHLCHLCHLCHL
COLCOLCOLCOLCOLCOLCOLCOLCOLCOLCOLCOLCOLCOLCOL
CRICRICRICRICRICRICRICRICRICRICRICRICRICRICRICRI
CZECZECZECZECZECZECZECZECZECZECZECZECZE
ECUECUECUECUECUECUECUECUECUECUECUECUECUECUECU
HUNHUNHUNHUNHUNHUNHUNHUNHUNHUNHUNHUNHUNHUNHUNHUN
IRNIRNIRNIRNIRNIRNIRNIRNIRNIRNIRNIRNIRN
JAMJAMJAMJAMJAMJAMJAMJAMJAMJAMJAMJAM
MYSMYSMYSMYSMYSMYSMYSMYSMYSMYSMYSMYSMYSMYS
MEXMEXMEXMEXMEXMEXMEXMEXMEXMEXMEXMEXMEXMEXMEXMEX
POLPOLPOLPOLPOLPOLPOLPOLPOLPOLPOLPOLPOLPOLPOL
PRTPRTPRTPRTPRTPRTPRTPRTPRTPRTPRTPRTPRTPRTPRTPRT
SVKSVKSVKSVKSVKSVKSVKSVKSVKSVKSVKSVKSVKSVKSVKSVK
SVNSVNSVNSVNSVNSVNSVNSVNSVNSVNSVNSVNSVNSVNSVNZAFZAFZAFZAFZAFZAFZAFZAFZAFZAFZAFZAFZAFZAFZAFZAF
KORKORKORKORKORKORKORKORKORKORKORKORKORKORKOR
THATHATHATHATHATHATHATHATHATHATHATHATHATHATHATHA
TURTURTURTURTURTURTURTURTURTURTURTURTURVENVENVENVENVENVENVENVENVENVEN
ARGARGARGARGARGARGARGARGARG
AUSAUSAUSAUSAUSAUSAUSAUSAUSAUSAUSAUSAUSAUSAUSAUS
AUTAUTAUTAUTAUTAUTAUTAUTAUTAUTAUTAUTAUTAUTAUTAUT
BGDBGDBGDBGDBGDBGDBGDBGDBGDBGDBGDBGDBGDBGDBGDBGD
BELBELBELBELBELBELBELBELBELBELBELBELBELBELBELBEL
BOLBOLBOLBOLBOLBOLBOLBOLBOLBOLBOLBOLBOLBOLBOLBOL
BRABRABRABRABRABRABRABRABRABRABRABRABRABRABRABGRBGRBGRBGRBGRBGRBGRBGRBGRBGRBGRBGRBGRBGR
CMRCMRCMRCMRCMRCMRCMRCMRCMRCMRCMRCMRCMRCMRCMRCMR
CANCANCANCANCANCANCANCANCANCANCANCANCANCANCANCAN
CHLCHLCHLCHLCHLCHLCHLCHLCHLCHLCHLCHLCHLCHLCHLCHL
CHNCHNCHNCHNCHNCHNCHNCHNCHNCHNCHNCHNCHNCHN
COLCOLCOLCOLCOLCOLCOLCOLCOLCOLCOLCOLCOLCOLCOL
CRICRICRICRICRICRICRICRICRICRICRICRICRICRICRICRI
CZECZECZECZECZECZECZECZECZECZECZECZECZE
DNKDNKDNKDNKDNKDNKDNKDNKDNKDNKDNKDNKDNKDNKDNKDNK
ECUECUECUECUECUECUECUECUECUECUECUECUECUECUECU
EGYEGYEGYEGYEGYEGYEGYEGYEGYEGYEGYEGYEGYEGYEGYEGYFINFINFINFINFINFINFINFINFINFINFINFINFIN
FRAFRAFRAFRAFRAFRAFRAFRAFRAFRAFRAFRAFRAFRAFRAFRA
DEUDEUDEUDEUDEUDEUDEUDEUDEUDEUDEUDEUDEUDEUDEUDEU
HUNHUNHUNHUNHUNHUNHUNHUNHUNHUNHUNHUNHUNHUNHUNHUN
INDINDINDINDINDINDINDINDINDINDINDINDINDINDINDIND
IDNIDNIDNIDNIDNIDNIDNIDNIDNIDNIDNIDNIDNIDNIDN
IRNIRNIRNIRNIRNIRNIRNIRNIRNIRNIRNIRNIRN
IRLIRLIRLIRLIRLIRLIRLIRLIRLIRLIRLIRLIRL
ITAITAITAITAITAITAITAITAITAITAITAITAITAITAITAITAJAMJAMJAMJAMJAMJAMJAMJAMJAMJAMJAMJAM
JPNJPNJPNJPNJPNJPNJPNJPNJPNJPNJPNJPNJPNJPNJPNJPN
JORJORJORJORJORJORJORJORJORJORJORJORJORJORJORJORKENKENKENKENKENKENKENKENKENKENKENKENKENKENKENKEN MYSMYSMYSMYSMYSMYSMYSMYSMYSMYSMYSMYSMYSMYS
MEXMEXMEXMEXMEXMEXMEXMEXMEXMEXMEXMEXMEXMEXMEXMEX
MARMARMARMARMARMARMARMARMARMARMARMARMARMAR
NLDNLDNLDNLDNLDNLDNLDNLDNLDNLDNLDNLDNLDNLDNLDNLD
NZLNZLNZLNZLNZLNZLNZLNZLNZLNZLNZLNZLNZLNZLNZLNZL
NGANGANGANGANGANGANGANGANGANGANGANGANGANGANGA
NORNORNORNORNORNORNORNORNORNORNORNORNORNORNORNOR
PAKPAKPAKPAKPAKPAKPAKPAKPAKPAKPAKPAKPAKPAKPAKPAK
PERPERPERPERPERPERPERPERPERPERPERPERPERPERPERPER
PHLPHLPHLPHLPHLPHLPHLPHLPHLPHLPHLPHLPHLPHLPHLPHL
POLPOLPOLPOLPOLPOLPOLPOLPOLPOLPOLPOLPOLPOLPOL
PRTPRTPRTPRTPRTPRTPRTPRTPRTPRTPRTPRTPRTPRTPRTPRTSENSENSENSENSENSENSENSENSENSENSENSENSENSENSENSEN
SVKSVKSVKSVKSVKSVKSVKSVKSVKSVKSVKSVKSVKSVKSVKSVK
SVNSVNSVNSVNSVNSVNSVNSVNSVNSVNSVNSVNSVNSVNSVNZAFZAFZAFZAFZAFZAFZAFZAFZAFZAFZAFZAFZAFZAFZAFZAF
KORKORKORKORKORKORKORKORKORKORKORKORKORKORKOR
ESPESPESPESPESPESPESPESPESPESPESPESPESPESPESPESP
LKALKALKALKALKALKALKALKALKALKALKALKALKALKA
SWESWESWESWESWESWESWESWESWESWESWESWESWESWESWE
CHECHECHECHECHECHECHECHECHECHECHECHECHECHECHECHETHATHATHATHATHATHATHATHATHATHATHATHATHATHATHATHA
TUNTUNTUNTUNTUNTUNTUNTUNTUNTUNTUNTUNTUNTUNTUNTUNTURTURTURTURTURTURTURTURTURTURTURTURTUR
GBRGBRGBRGBRGBRGBRGBRGBRGBRGBRGBRGBRGBRGBRGBRGBRUSAUSAUSAUSAUSAUSAUSAUSAUSAUSAUSAUSAUSAUSAUSAUSA
VENVENVENVENVENVENVENVENVENVEN
VNMVNMVNMVNMVNMVNMVNMVNMVNMVNMVNMVNMVNMVNMVNMVNM
010
2030
010
2030
0 2 4 6 8 10 0 2 4 6 8 10
Developed Developing
Emerging Total
Average growth rate of ICT capital services Fitted values
Average growth rate of GDP EKS
Note: Developed > 23000 of 2013 US$ GDP per Capita, Developing <6500 of 2013 US$ GDP per Capita in Year 1995
Source: The Conference Board (2014a).
16
A.2 Additional Tables
Table A.1: Dependent Variable: ∆ ln(GDP) - 1995-2000 - Full Sample
(1) (2) (3)POLS RE FE
∆ ln(ICT Cap. Serv) 0.063** 0.065*** 0.072*(0.024) (0.024) (0.043)
∆ ln(N.ICT Cap. Serv.) 0.334*** 0.317*** 0.218**(0.059) (0.058) (0.090)
∆ ln(Labor Serv.) 0.402*** 0.380*** 0.317***(0.085) (0.087) (0.107)
Exports % GDP 0.019* 0.020** 0.052(0.010) (0.010) (0.036)
Constant 0.538 0.539 -0.365(0.609) (0.584) (1.597)
Year Dummies Yes Yes Yes
Adjusted R2 0.328 0.345 0.139Observations 335 335 335Clustered standard errors in parentheses, * p<0.10, ** p<0.05, *** p<0.01
Table A.2: Dependent Variable: ∆ ln(GDP) - 2000-2010 - Full Sample
(1) (2) (3)POLS RE FE
∆ ln(ICT Cap. Serv) 0.105*** 0.096*** 0.099***(0.015) (0.015) (0.020)
∆ ln(N.ICT Cap. Serv.) 0.363*** 0.352*** 0.342***(0.110) (0.072) (0.066)
∆ ln(Labor Serv.) 0.312*** 0.275*** 0.252***(0.063) (0.050) (0.052)
Exports % GDP 0.011* 0.021*** 0.078***(0.006) (0.007) (0.020)
Constant 0.332 0.156 -2.107**(0.357) (0.327) (0.856)
Year Dummies Yes Yes Yes
Adjusted R2 0.590 0.592 0.539Observations 616 616 616Clustered standard errors in parentheses, * p<0.10, ** p<0.05, *** p<0.01
17

Tab
leA
.3:Dep
ende
ntVa
riable:
∆ln(G
DP)-1
995-2000
Develop
edEmerging
Develop
ing
(1)
(2)
(3)
(4)
(5)
(6)
(7)
(8)
(9)
POLS
RE
FEPO
LSRE
FEPO
LSRE
FE
∆ln(ICT
Cap
.Serv)
0.144**
0.104**
0.061*
0.060
0.058
-0.015
0.093***
0.098***
0.198***
(0.062)
(0.047)
(0.032)
(0.040)
(0.041)
(0.049)
(0.030)
(0.029)
(0.057)
∆ln(N
.ICT
Cap
.Serv.)
0.488**
0.269*
-0.010
0.314***
0.300***
0.230
0.230**
0.227**
0.127
(0.190)
(0.139)
(0.175)
(0.073)
(0.072)
(0.134)
(0.092)
(0.091)
(0.144)
∆ln(L
abor
Serv.)
0.338***
0.318***
0.265**
0.531***
0.535***
0.573**
0.005
0.006
0.005
(0.096)
(0.097)
(0.113)
(0.144)
(0.148)
(0.205)
(0.052)
(0.047)
(0.054)
Expo
rts%
GDP
0.025
0.033*
0.075
0.027***
0.028***
0.082
-0.017
-0.017
0.033
(0.015)
(0.018)
(0.056)
(0.009)
(0.009)
(0.062)
(0.013)
(0.013)
(0.055)
Con
stan
t-1.004
-0.130
-0.340
-0.104
-0.091
-0.871
2.462***
2.403***
-0.278
(1.052)
(0.864)
(2.263)
(1.124)
(1.145)
(2.566)
(0.664)
(0.676)
(2.215)
Year
Dum
mies
Yes
Yes
Yes
Yes
Yes
Yes
Yes
Yes
Yes
AdjustedR
20.642
0.653
0.290
0.265
0.320
0.199
0.347
0.404
0.170
Observatio
ns112
112
112
120
120
120
103
103
103
Clu
ster
edst
anda
rder
rors
inpa
rent
hese
s,*
p<0.
10,*
*p<
0.05
,***
p<0.
01
18

Tab
leA
.4:Dep
ende
ntVa
riable:
∆ln(G
DP)-2
000-2010
Develop
edEmerging
Develop
ing
(1)
(2)
(3)
(4)
(5)
(6)
(7)
(8)
(9)
POLS
RE
FEPO
LSRE
FEPO
LSRE
FE
∆ln(ICT
Cap
.Serv)
0.059*
0.059**
0.064**
0.088***
0.084***
0.069*
0.063*
0.062***
0.065
(0.030)
(0.029)
(0.028)
(0.026)
(0.023)
(0.039)
(0.033)
(0.023)
(0.038)
∆ln(N
.ICT
Cap
.Serv.)
0.155
0.153
-0.004
0.303***
0.341***
0.459***
0.311
0.240*
0.158
(0.122)
(0.121)
(0.124)
(0.095)
(0.090)
(0.087)
(0.182)
(0.130)
(0.118)
∆ln(L
abor
Serv.)
0.370***
0.363***
0.301***
0.346***
0.315***
0.269***
-0.139
-0.018
0.013
(0.063)
(0.066)
(0.062)
(0.066)
(0.068)
(0.075)
(0.153)
(0.072)
(0.062)
Expo
rts%
GDP
0.007
0.008
0.104***
0.023***
0.023***
0.056
0.012
0.032*
0.052*
(0.007)
(0.007)
(0.022)
(0.007)
(0.008)
(0.035)
(0.022)
(0.019)
(0.025)
Con
stan
t1.200**
1.179**
-2.561**
0.065
0.115
-1.431
2.427**
1.901*
1.568
(0.480)
(0.481)
(1.119)
(0.688)
(0.576)
(1.829)
(1.121)
(1.143)
(1.851)
Year
Dum
mies
Yes
Yes
Yes
Yes
Yes
Yes
Yes
Yes
Yes
AdjustedR
20.757
0.774
0.780
0.619
0.642
0.630
0.340
0.367
0.261
Observatio
ns204
204
204
217
217
217
195
195
195
Clu
ster
edst
anda
rder
rors
inpa
rent
hese
s,*
p<0.
10,*
*p<
0.05
,***
p<0.
01
19
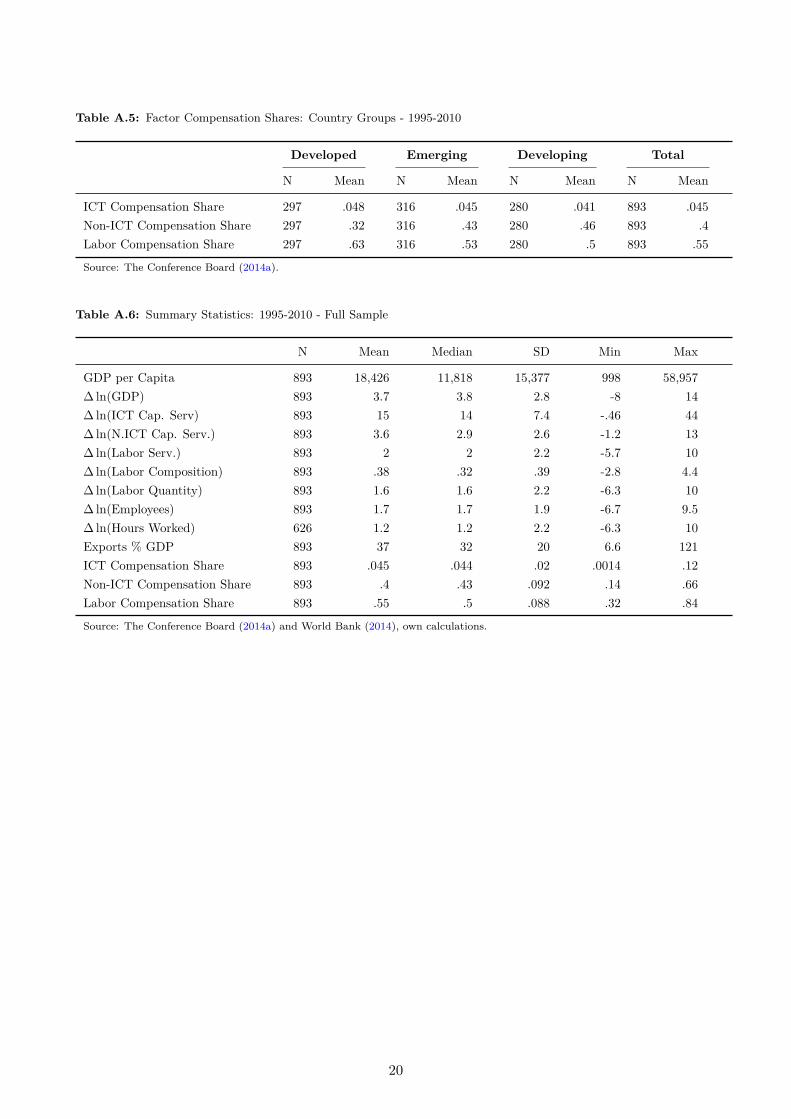
Table A.5: Factor Compensation Shares: Country Groups - 1995-2010
Developed Emerging Developing Total
N Mean N Mean N Mean N Mean
ICT Compensation Share 297 .048 316 .045 280 .041 893 .045Non-ICT Compensation Share 297 .32 316 .43 280 .46 893 .4Labor Compensation Share 297 .63 316 .53 280 .5 893 .55
Source: The Conference Board (2014a).
Table A.6: Summary Statistics: 1995-2010 - Full Sample
N Mean Median SD Min Max
GDP per Capita 893 18,426 11,818 15,377 998 58,957∆ ln(GDP) 893 3.7 3.8 2.8 -8 14∆ ln(ICT Cap. Serv) 893 15 14 7.4 -.46 44∆ ln(N.ICT Cap. Serv.) 893 3.6 2.9 2.6 -1.2 13∆ ln(Labor Serv.) 893 2 2 2.2 -5.7 10∆ ln(Labor Composition) 893 .38 .32 .39 -2.8 4.4∆ ln(Labor Quantity) 893 1.6 1.6 2.2 -6.3 10∆ ln(Employees) 893 1.7 1.7 1.9 -6.7 9.5∆ ln(Hours Worked) 626 1.2 1.2 2.2 -6.3 10Exports % GDP 893 37 32 20 6.6 121ICT Compensation Share 893 .045 .044 .02 .0014 .12Non-ICT Compensation Share 893 .4 .43 .092 .14 .66Labor Compensation Share 893 .55 .5 .088 .32 .84
Source: The Conference Board (2014a) and World Bank (2014), own calculations.
20
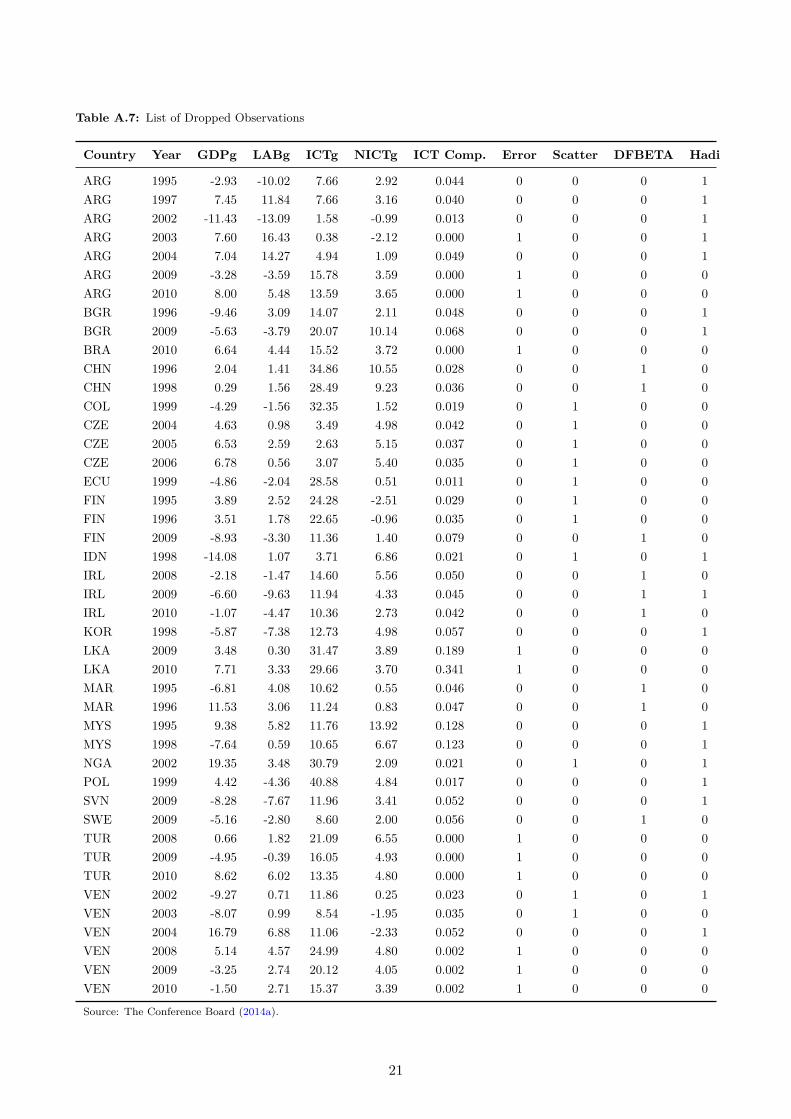
Table A.7: List of Dropped Observations
Country Year GDPg LABg ICTg NICTg ICT Comp. Error Scatter DFBETA Hadi
ARG 1995 -2.93 -10.02 7.66 2.92 0.044 0 0 0 1ARG 1997 7.45 11.84 7.66 3.16 0.040 0 0 0 1ARG 2002 -11.43 -13.09 1.58 -0.99 0.013 0 0 0 1ARG 2003 7.60 16.43 0.38 -2.12 0.000 1 0 0 1ARG 2004 7.04 14.27 4.94 1.09 0.049 0 0 0 1ARG 2009 -3.28 -3.59 15.78 3.59 0.000 1 0 0 0ARG 2010 8.00 5.48 13.59 3.65 0.000 1 0 0 0BGR 1996 -9.46 3.09 14.07 2.11 0.048 0 0 0 1BGR 2009 -5.63 -3.79 20.07 10.14 0.068 0 0 0 1BRA 2010 6.64 4.44 15.52 3.72 0.000 1 0 0 0CHN 1996 2.04 1.41 34.86 10.55 0.028 0 0 1 0CHN 1998 0.29 1.56 28.49 9.23 0.036 0 0 1 0COL 1999 -4.29 -1.56 32.35 1.52 0.019 0 1 0 0CZE 2004 4.63 0.98 3.49 4.98 0.042 0 1 0 0CZE 2005 6.53 2.59 2.63 5.15 0.037 0 1 0 0CZE 2006 6.78 0.56 3.07 5.40 0.035 0 1 0 0ECU 1999 -4.86 -2.04 28.58 0.51 0.011 0 1 0 0FIN 1995 3.89 2.52 24.28 -2.51 0.029 0 1 0 0FIN 1996 3.51 1.78 22.65 -0.96 0.035 0 1 0 0FIN 2009 -8.93 -3.30 11.36 1.40 0.079 0 0 1 0IDN 1998 -14.08 1.07 3.71 6.86 0.021 0 1 0 1IRL 2008 -2.18 -1.47 14.60 5.56 0.050 0 0 1 0IRL 2009 -6.60 -9.63 11.94 4.33 0.045 0 0 1 1IRL 2010 -1.07 -4.47 10.36 2.73 0.042 0 0 1 0KOR 1998 -5.87 -7.38 12.73 4.98 0.057 0 0 0 1LKA 2009 3.48 0.30 31.47 3.89 0.189 1 0 0 0LKA 2010 7.71 3.33 29.66 3.70 0.341 1 0 0 0MAR 1995 -6.81 4.08 10.62 0.55 0.046 0 0 1 0MAR 1996 11.53 3.06 11.24 0.83 0.047 0 0 1 0MYS 1995 9.38 5.82 11.76 13.92 0.128 0 0 0 1MYS 1998 -7.64 0.59 10.65 6.67 0.123 0 0 0 1NGA 2002 19.35 3.48 30.79 2.09 0.021 0 1 0 1POL 1999 4.42 -4.36 40.88 4.84 0.017 0 0 0 1SVN 2009 -8.28 -7.67 11.96 3.41 0.052 0 0 0 1SWE 2009 -5.16 -2.80 8.60 2.00 0.056 0 0 1 0TUR 2008 0.66 1.82 21.09 6.55 0.000 1 0 0 0TUR 2009 -4.95 -0.39 16.05 4.93 0.000 1 0 0 0TUR 2010 8.62 6.02 13.35 4.80 0.000 1 0 0 0VEN 2002 -9.27 0.71 11.86 0.25 0.023 0 1 0 1VEN 2003 -8.07 0.99 8.54 -1.95 0.035 0 1 0 0VEN 2004 16.79 6.88 11.06 -2.33 0.052 0 0 0 1VEN 2008 5.14 4.57 24.99 4.80 0.002 1 0 0 0VEN 2009 -3.25 2.74 20.12 4.05 0.002 1 0 0 0VEN 2010 -1.50 2.71 15.37 3.39 0.002 1 0 0 0
Source: The Conference Board (2014a).
21
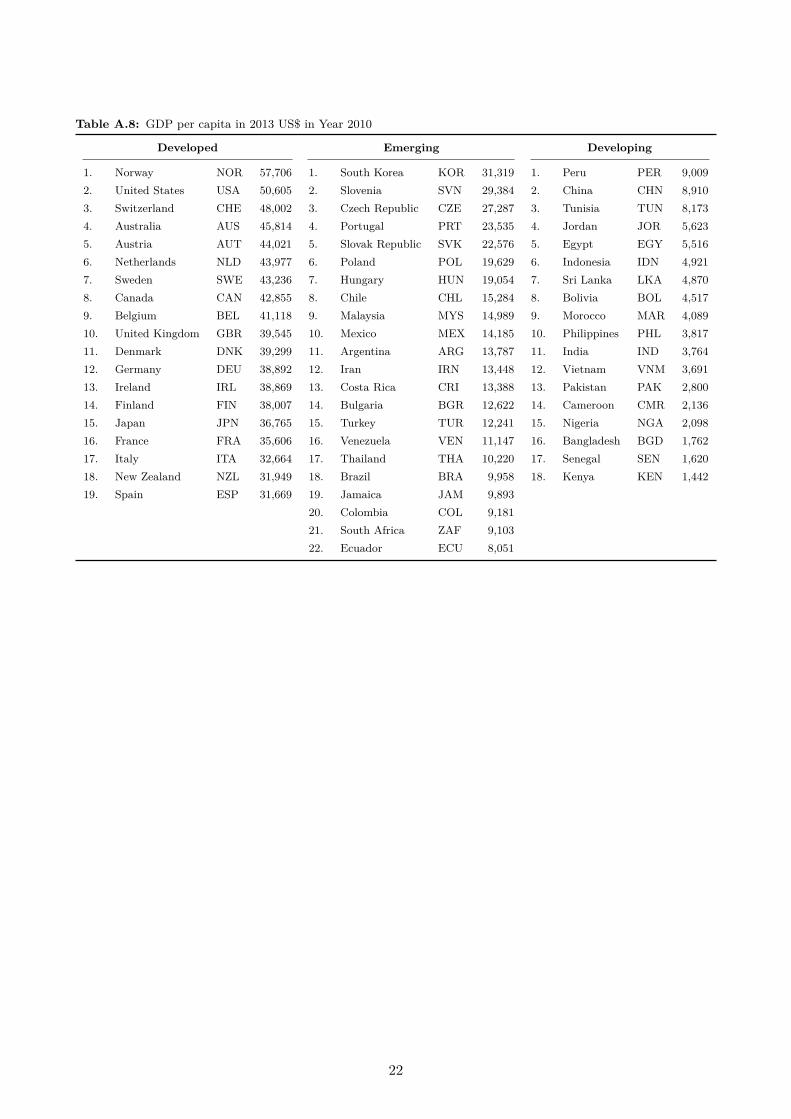
Table A.8: GDP per capita in 2013 US$ in Year 2010
Developed Emerging Developing
1. Norway NOR 57,706 1. South Korea KOR 31,319 1. Peru PER 9,0092. United States USA 50,605 2. Slovenia SVN 29,384 2. China CHN 8,9103. Switzerland CHE 48,002 3. Czech Republic CZE 27,287 3. Tunisia TUN 8,1734. Australia AUS 45,814 4. Portugal PRT 23,535 4. Jordan JOR 5,6235. Austria AUT 44,021 5. Slovak Republic SVK 22,576 5. Egypt EGY 5,5166. Netherlands NLD 43,977 6. Poland POL 19,629 6. Indonesia IDN 4,9217. Sweden SWE 43,236 7. Hungary HUN 19,054 7. Sri Lanka LKA 4,8708. Canada CAN 42,855 8. Chile CHL 15,284 8. Bolivia BOL 4,5179. Belgium BEL 41,118 9. Malaysia MYS 14,989 9. Morocco MAR 4,08910. United Kingdom GBR 39,545 10. Mexico MEX 14,185 10. Philippines PHL 3,81711. Denmark DNK 39,299 11. Argentina ARG 13,787 11. India IND 3,76412. Germany DEU 38,892 12. Iran IRN 13,448 12. Vietnam VNM 3,69113. Ireland IRL 38,869 13. Costa Rica CRI 13,388 13. Pakistan PAK 2,80014. Finland FIN 38,007 14. Bulgaria BGR 12,622 14. Cameroon CMR 2,13615. Japan JPN 36,765 15. Turkey TUR 12,241 15. Nigeria NGA 2,09816. France FRA 35,606 16. Venezuela VEN 11,147 16. Bangladesh BGD 1,76217. Italy ITA 32,664 17. Thailand THA 10,220 17. Senegal SEN 1,62018. New Zealand NZL 31,949 18. Brazil BRA 9,958 18. Kenya KEN 1,44219. Spain ESP 31,669 19. Jamaica JAM 9,893
20. Colombia COL 9,18121. South Africa ZAF 9,10322. Ecuador ECU 8,051
22
References
Aker, J. C. and I. M. Mbiti (2010). “Mobile Phones and Economic Development in Africa”. TheJournal of Economic Perspectives 24(3), pp. 207–232.
Ardizzi, G., C. Petraglia, M. Piacenza, and G. Turati (2014). “Measuring the Underground Economywith the Currency Demand Approach: A Reinterpretation of the Methodology, With an Applica-tion to Italy”. Review of Income and Wealth 60(4), pp. 747–772.
Arellano, M. and S. Bond (1991). “Some Tests of Specification for Panel Data: Monte Carlo Evidenceand an Application to Employment Equations”. The Review of Economic Studies 58(2), pp. 277–297.
Biagi, F. (2013). ICT and Productivity: A Review of the Literature. JRC-IPTS Working Papers onDigital Economy 2013-09. Institute of Prospective Technological Studies, Joint Research Centre.
Cardona, M., T. Kretschmer, and T. Strobel (2013). “ICT and Productivity: Conclusions from theEmpirical Literature”. Information Economics and Policy 25(3), pp. 109–125.
Commander, S., R. Harrison, and N. Menezes-Filho (2011). “ICT and Productivity in DevelopingCountries: New Firm-Level Evidence from Brazil and India”. Review of Economics and Statistics93(2), pp. 528–541.
Czernich, N., O. Falck, T. Kretschmer, and L. Woessmann (2011). “Broadband Infrastructure andEconomic Growth”. The Economic Journal 121(552), pp. 505–532.
Dahl, C., H. Kongsted, and A. Sørensen (2011). “ICT and Productivity Growth in the 1990s: PanelData Evidence on Europe”. Empirical Economics 40(1), pp. 141–164.
Dedrick, J., K. L. Kraemer, and E. Shih (2013). “Information Technology and Productivity in De-veloped and Developing Countries.” Journal of Management Information Systems 30(1), pp. 97–122.
Dewan, S. and K. L. Kraemer (2000). “Information Technology and Productivity: Evidence fromCountry-Level Data”. Management Science 46(4), pp. 548–562.
Dimelis, S. and S. Papaioannou (2010). “FDI and ICT Effects on Productivity Growth: A ComparativeAnalysis of Developing and Developed Countries”. European Journal of Development Research22(1), pp. 79–96.
— (2011). “ICT Growth Effects at the Industry Level: A Comparison Between the US and the EU”.Information Economics and Policy 23(1), pp. 37–50.
Draca, M., R. Sadun, and J. Van Reenen (2007). “Productivity and ICT: A Review of the Evidence”.The Oxford Handbook of Information and Communication Technologies. Ed. by R. Mansell. OxfordUniversity Press, pp. 100–147.
Durham, J. (2004). “Absorptive Capacity and the Effects of Foreign Direct Investment and EquityForeign Portfolio Investment on Economic Growth”. European Economic Review 48(2), pp. 285–306.
Eberhardt, M., C. Helmers, and H. Strauss (2013). “Do Spillovers Matter when Estimating PrivateReturns to R&D?” Review of Economics and Statistics 95(2), pp. 436–448.
Hadi, A. S. (1992). “Identifying Multiple Outliers in Multivariate Data”. Journal of the Royal Statis-tical Society. Series B (Methodological), pp. 761–771.
23
Hadi, A. S. (1994). “A Modification of a Method for the Detection of Outliers in Multivariate Samples”.Journal of the Royal Statistical Society. Series B (Methodological), pp. 393–396.
Hansen, B. E. (2000). “Sample Splitting and Threshold Estimation”. Econometrica 68(3), pp. 575–604.
Harbaugh, W. T., A. Levinson, and D. M. Wilson (2002). “Reexamining the Empirical Evidence foran Environmental Kuznets Curve”. Review of Economics and Statistics 84(3), pp. 541–551.
Henry, M., R. Kneller, and C. Milner (2009). “Trade, Technology Transfer and National Efficiency inDeveloping Countries”. European Economic Review 53(2), pp. 237–254.
Inklaar, R., M. O’Mahony, and M. P. Timmer (2005). “ICT and Europe’s Productivity Performance:Industry-Level Growth Account Comparisons with the United States”. Review of Income andWealth 51(4), pp. 505–536.
Inklaar, R. and M. P. Timmer (2013). Capital, Labor and TFP in PWT8.0. Available at http://www
.rug.nl/research/ggdc/data/pwt/v80/capital_labor_and_tfp_in_pwt80.pdf.Inklaar, R., M. P. Timmer, and B. Van Ark (2008). “Market Services Productivity Across Europe and
the US”. Economic Policy 23(53), pp. 139–194.Jorgenson, D. W. and K. J. Stiroh (2000). “Raising the Speed Limit: U.S. Economic Growth in the
Information Age”. Brookings Papers on Economic Activity 31(1), pp. 125–236.Jorgenson, D. W. and K. M. Vu (2005). “Information Technology and the World Economy”. Scandi-
navian Journal of Economics 107(4), pp. 631–650.— (2010). “Potential Growth of the World Economy”. Journal of Policy Modeling 32(5), pp. 615–631.— (2011). “The Rise of Developing Asia and the New Economic Order”. Journal of Policy Modeling
33(5), pp. 698–716.Keller, W. (1996). “Absorptive Capacity: On the Creation and Acquisition of Technology in Develop-
ment”. Journal of Development Economics 49(1), pp. 199–227.— (2004). “International Technology Diffusion”. Journal of Economic Literature 42(3), pp. 752–782.Klasen, S. and D. Blades (2013). “Issues and Challenges in Measuring National Income, Wealth,
Poverty, and Inequality in Sub-Saharan African Countries: An Introduction”. Review of Incomeand Wealth 59, S1–S8.
Kneller, R. (2005). “Frontier Technology, Absorptive Capacity and Distance”. Oxford Bulletin of Eco-nomics and Statistics 67(1), pp. 1–23.
Oliner, S. D. and D. E. Sichel (2000). “The Resurgence of Growth in the Late 1990s: Is InformationTechnology the Story?” Journal of Economic Perspectives 14(4), pp. 3–22.
— (2002). “Information Technology and Productivity: Where are we now and Where are we Going?”Economic Review Q3, pp. 15–44.
O’Mahony, M. and M. P. Timmer (2009). “Output, Input and Productivity Measures at the IndustryLevel: The EU KLEMS Database”. Economic Journal 119(538), F374–F403.
O’Mahony, M. and M. Vecchi (2005). “Quantifying the Impact of ICT Capital on Output Growth: AHeterogeneous Dynamic Panel Approach”. Economica 72(288), pp. 615–633.
Papaioannou, S. and S. Dimelis (2007). “Information Technology as a Factor of Economic Develop-ment: Evidence from Developed and Developing Countries”. Economics of Innovation and NewTechnology 16(3), pp. 179–194.
24
Pesaran, M. H. and R. Smith (1995). “Estimating Long-Run Relationships from Dynamic Heteroge-neous Panels”. Journal of Econometrics 68(1), pp. 79–113.
Pilat, D. (2004). “The ICT Productivity Paradox: Insights from Micro Data”. OECD Economic Studies2004(1), pp. 37–65.
Pohjola, M. (2002). “The New Economy in Growth and Development”. Oxford Review of EconomicPolicy 18(3), pp. 380–396.
Roller, L.-H. and L. Waverman (2001). “Telecommunications Infrastructure and Economic Develop-ment: A Simultaneous Approach”. American Economic Review 91(4), pp. 909–923.
Steinmueller, W. E. (2001). “ICTs and the Possibilities for Leapfrogging by Developing Countries”.International Labour Review 140(2), pp. 193–210.
Stiroh, K. J. (2002). “Are ICT Spillovers Driving the New Economy?” Review of Income and Wealth48(1), pp. 33–57.
— (2005). “Reassessing the Impact of IT in the Production Function: A Meta-Analysis and SensitivityTests”. Annales d’Economie et de Statistique 79/80, pp. 529–561.
Strauss, H. and B. Samkharadze (2011). “ICT Capital and Productivity Growth”. EIB Papers 16(2),pp. 8–28.
Temple, J. (2000). “Growth Regressions and What the Textbooks Don’t Tell You”. Bulletin of Eco-nomic Research 52(3), pp. 181–205.
The Conference Board (2014a). Total Economy DatabaseTM, January 2014. http://www.conferenc
e-board.org/data/economydatabase/.— (2014b). Total Economy DatabaseTM, January 2014 - Methodological Notes. Available at http:
//www.conference-board.org/retrievefile.cfm?filename=TED-Methodological-Notes.pd
f&type=subsite.Timmer, M. P., R. Inklaar, M. O’Mahony, and B. Van Ark (2010). Economic Growth in Europe: A
Comparative Industry Perspective. Cambridge University Press.— (2011). “Productivity and Economic Growth in Europe: A Comparative Industry Perspective”.
International Productivity Monitor 21, pp. 3–23.United Nations (2011). Information Economy Report 2011: ICTs as an Enabler for Private Sector
Development. United Nations Conference on Trade and Development. United Nations Publications.Van Ark, B., M. O’Mahony, and M. P. Timmer (2008). “The Productivity Gap Between Europe and
the United States: Trends and Causes”. The Journal of Economic Perspectives 22(1), pp. 25–44.Van Reenen, J., N. Bloom, M. Draca, T. Kretschmer, and R. Sadun (2010). The Economic Impact of
ICT. Available at http://cep.lse.ac.uk/textonly/_new/research/productivity/Managem
ent/PDF/breugel_cStudyTheImpactofICTLSE.pdf. Centre for Economic Performance, LondonSchool of Economics.
Vu, K. M. (2011). “ICT as a Source of Economic Growth in the Information Age: Empirical Evidencefrom the 1996-2005 Period”. Telecommunications Policy 35(4), pp. 357–372.
World Bank (2012). ICT for Greater Development Impact. http://siteresources.worldbank.org/E
XTINFORMATIONANDCOMMUNICATIONANDTECHNOLOGIES/Resources/WBG_ICT_Strategy-2012.pdf.— (2014). World Development Indicators 2014. http://data.worldbank.org/indicator. World
Bank, Washington, DC.
25

Yousefi, A. (2011). “The Impact of Information and Communication Technology on Economic Growth:Evidence from Developed and Developing Countries”. Economics of Innovation and New Technol-ogy 20(6), pp. 581–596.
26