ice/structure interaction tests with ice ... oj glaciology, vol. 33, no. 114, 1987 ice/structure...
TRANSCRIPT

Journal oJ Glaciology, Vol. 33, No. 114, 1987
ICE/STRUCTURE INTERACTION TESTS WITH ICE CONTAINING FLAWS
By G.W. TIMCO
(Hydraulics Laboratory, National Research Council of Canada, Ottawa, Ontario KIA OR6. Canada)
ABSTRACT. A test series has been performed to investigate the influence of flaws or cracks in ice during an ice/structure interaction event. The tests were carried out by measuring the horizontal load on a 6 cm diamter vertical indentor which was being pushed through sheets of freshwater ice containing flaws of various shapes, lengths, and densities. The results are analyzed and correlated in terms of an elementary damage theory. The tests show that flaws can have a significant influence on the load which an ice sheet can exert on a structure.
INTRODUCTION
In the recent ice-mechanics literature, there has been considerable discussion on the so-called "scale-effect"; that is, the peak ice pressures measured on relatively small structure areas in laboratory tests are considerably higher than those measured in the field on full-scale structures. Although this scale effect has been postulated for years (Kry, 1980; Iyer, 1983), most recently there has been increasing evidence to support it through the release of some previously proprietary information on ice-force measurements on Arctic structures (Sanderson, 1984). The importance of understanding the causes of this are quite clear. If understood, it would be possible to design fullscale structures with more confidence, and it would allow more accurate extrapolation of laboratory-derived data. This phenomenon has recently been reviewed in a paper by Sanderson (1986) to which the reader is referred for details. Suffice to say, the cause for the scale effect is not known.
Several explanations have been proposed to explain it and these can be subdivided into two competing approaches.
First, it has been postulated that as the structure gets larger, non-simultaneous failure of the ice occurs locally by successive fracturing of independent zones (Kry, 1980; Slomski and Vivatrat, 1983), resulting in a "smearing out" of the peak stresses and lower overall loads. A more recent explanation based on non-simultaneous failure has been put forward by Ashby and others (1986). It is based on a mechanical argument and supported by experiments with brittle foam.
The second approach to explain the size effect is related to the existence of microscopic "flaws" (or preexisting cracks) in the ice. The explanation is based on the hypothesis that, as the sample size of the ice gets larger, there is an increasing probability of it containing a larger flaw; hence, the ice would be weaker. This approach contains many explicit and implicit assumptions and in its present form cannot fully explain the size-effect phenomenon (Sanderson, 1986).
In considering this problem, it seems that the phenomenon incorporates aspects of both non-simultaneous failure (of some type) as well as strength reduction caused by the flaws in the ice. Although the models provided by Kry (1980), Slomski and Vivatrat (1983), and Ashby and others (1986) appear encouraging to explain this effect, anyone who has travelled in the Arctic will attest to the existence
186
of a multitude of flaws in the ice, ranging from the very small (on the order of I m in length) to the very large flaw ~eads which can stretch for several kilometers. The question IS: do these flaws affect the load which an ice sheet can exert .on a structure, and if so, to what extent? Questions of thiS type cannot be answered easily through field observations due to the complex nature of the environmental and experimental conditions. In a laboratory, however a test to investigate this can be performed in a systematic 'way in an experimentally tractable situation. The results of such a test series are presented here.
GENERAL CONSIDERATIONS
In designing the test, there are many parameters which must be considered. The overall scheme of the test is to measure the forces which an ice sheet exerts on a structure with varying numbers and types of flaws in the ice. Th~ influence of the flaws will undoubtedly vary depending upon the failure mode of the ice. In this test series it was decided to arrange the experimental parameters such that the unflawed ice would fail by crushing when interacting with a structure.
.A test series of this type may be performed by using phYSical modelling techniques in which the ice/structure interaction event is scaled according to modelling laws (see Timco, 1984). For the present test series, however, it was felt that this approach would be somewhat restrictive since the "model" ice which is used in these types of tests is optically opaque, and uncertainties might exist as to its failure mode and cracking pattern. Therefore, it was decided to perform small-scale tests using fresh-water ice. This overcomes the optical problems of the model ice and has the added advantage of providing a much better-defined experimental arrangement (since the mechanical and rheological properties of fresh-water ice are well known). Because of this, the test results can be analyzed reliably using finite-element techniques. Recently, it has been shown that these FE techniques provide valuable insight into the fracturing behaviour of ice (Jordaan, 1986; Tomin and others, 1986; Cormeau and others, in press). The present tests are amenable to such an analysis.
EXPERIMENTAL
The tests were performed in the ice tank in the Hydraulics Laboratory at the National Research Council in Ottawa (Pratte and Timco, 198 I). The tank is 21 m long, 7 m wide, and 1.2 m deep, and is spanned by a carriage which is capable of generating horizontal loading to 45 kN. For this test series a cylindrical-shaped structure was employed. Because of the high forces which can be generated in tests of this type using fresh-water ice, a relatively small pile diameter (8) of 6 cm was used. The pile had a rusted surface which provided a relatively constant friction factor for the whole test series. The ice was grown using a wet-seeding nucleation technique which results in a fine-grained (1-2 mm diameter) columnar ice

(Timco and Frederking, 1982). A nominal ice thickness of 1.0 ± 0.2 cm was used, giving an aspect ratio of 6 ± I for the test series. The structure (i.e. pile) was mounted to a 14 kN capacity load cell, which in turn was bolted to the front face of the carriage. In order to have continuous crushing of the ice against the pile, the carriage was driven at a constant speed of 20 cm S-1 for all the tests . The ambient ?.ir temperature in the room was held constant at -10 ·C. In performing the tests, the leading edge of the ice sheet was cut to have a clean interface, and flaws with the appropriate length and density (i.e. number per square meter) were put in the ice. Then the carriage was ramped up to the test speed and the data-acquisition system started just before the pile made contact with the ice edge. The forces were sampled at a rate of 100 Hz over a total time of 12 s for each test. With these conditions, the pile penetrated 1112 m through the ice, a distance representing over 30 times the pile diameter. Then, the carriage was stopped, a new interface cut, and the process repeated . In total , 60 test runs were performed with a variety of flaws in the ice.
In Nature, flaws or cracks in ice are generated due to a variety of natural causes, including thermal expansion and contraction, collisions between ice floes, dynamic movement during ice growth, etc. Clearly, these conditions cannot all be duplicated in a laboratory basin. Instead, flaws must be generated mechanically by appropriate cutting of the ice. In choosing the type of flaws to be put in the ice, it was decided that there were several parameters which would be of interest to study. First of all, the shape of the flaw is important. In Nature, flaws are generally long and straight, although cracks and leads can have many forms . It was decided, therefore , to use two different crack shapes: (I) long narrow (flat) flaws or silts, and (2) round flaws or holes. Although round flaws are obviously not abundant in Nature, they provide a somewhat more tractable set-up for FE analysis, since the stress-intensity factor for round flaws is known and is not sensitive to "tip blunting". To introduce the flaws into the ice, a small pruning saw or a pneumatically driven hole saw were used for the flat and round flaws, respectively. In addition to the shape of the flaw, the flaw length is important. For this test series, flat flaws were cut in the ice with three different lengths (L) - 3, 30, and 60 cm all with a constant width of "'0.3 cm. However, only one flaw length was used in any given test run. For the round flaws, only one size was used - that with a diameter (d) of 4.4 cm. In all cases, the "flaws" were cut through the full thickness of the ice and placed in a random orientation in the ice sheet. Finally, since the flaw • density would seem to be important, the tests were performed to measure the loads from ice having different flaw densities. Thus, before each test run, flaws with the appropriate shape (round or flat), length (3, 30, or 60 cm), and density were cut in the ice . In addition, a number of tests were performed in virgin ice to obtain a reference pressure value for unflawed ice.
Timco: I ce/ structure interaction tests
RESULTS AND DISCUSSION
Tests in unflawed ice Twelve test runs were performed in un flawed ice. In
each of these tests, the ice failed by continuous crushing with radial cracks. The continuous crushing produced a cyclic load-time series which was analyzed to give the mean, standard deviation, and maximum load (presented in Table I). Averaged over all these tests, the peak pressure of the time series was 8.6 :I: 0.8 MPa, and the average pressure was 4.1 ± 0.4 MPa. These values are in excellent agreement with previous indentation tests of this type at similar aspect ratios and rates of loading (Hirayama and others, 1974; Michel and Blanchet, 1983; Timco, 1986). The occurrence of the radial cracks in the ice in indentation tests has been shown by Palmer and others (1983) to form at relatively low loads, so their appearance is not surprising . Palmer and others showed that the load F required to extend a radial crack of length c is
~hK.~
F - --'-'"-2.13 a
(1)
where h is the ice thickness, K1C is the fracture toughness, and a is a constant taken to be 0.5. In indentation tests of this type it is known (and was also observed here) that the ice in front of the indentor internally fractures into a 'series of small micro-cracks which are the size of the grains in the ice (see Timco, 1986, or Tomin and others, 1986). Using a crack of this length ("'1.5 mm) and the measured fracture toughness of the ice (K1C = 90 kPa mI/2; Timco and Frederking, 1986), the stress necessary to propagate it to a larger radial crack would be (re-arranging Equation (1) and using (] = FI Bh)
g K __ ...::l.C. '" 0.1 MPa. 2.13 aB
(2)
This is much lower than the loading on the structure and therefore propagation of the radial cracks will occur. In general, the length of these radial cracks was somewhat variable but they were typically of the order of 0 .5-1 m during the tests . A schematic diagram of this failure mode is shown in Figure la.
Round flaws For the round flaws of diameter 4.4 cm, 12 tests were
run for flaw densities up to 40 m -2. In these tests, regardless of the flaw density, the ice failed in the same manner - crushing with radial cracking. This crushing behaviour was evident as a cyclic pattern in the time series of the interaction event. There were, however, distinct differences in the time series for differences in the flaw density.
TABLE 1. TEST RESULTS IN UNFLA WED ICE (pile diameter 6 cm; speed = 20 cm S- I)
lee Average Standard deviation Measured maximum Peak Average thickness h load of time series load pressure pressure
cm N N N MPa MPa
0.97 2250 950 4970 8.5 3.8 0 ,91 2260 930 4430 8.1 4,1 1.05 2760 1200 5840 9.2 4.4 0 .95 2430 1020 5130 9.0 4.2 1.17 2700 1140 5520 7.8 3,8 1.23 2910 1220 6430 8.7 3.9 1.21 3250 1360 7130 9.8 4,5 1.10 2920 1220 6060 9.1 4.4 1.0 2010 790 4300 7.1 3,3 0.95 2280 910 4670 8.2 4.0 0.92 2340 860 4440 8.0 4,2 1.13 3120 1130 6260 9.2 4,6
A ve rage of all tes ts: 8.6 ± 0.8 4,1 ± 0.4
187

Journal of Glaciology
I FAILURE MODES I
(a)
(c)
.. .. .. \ I I
" " \ ... ,
I ,
\ '.
RADIAL CRACKS
.-' \ /i
~• '~CRUSHED
ICE
,
NO FLAWS
I
I , ,
\ \ I ...
\ I '. \ \ I \. :
.. I
I - I ... -" , ~. - _;.----- RADIAL CRACKS
" -t- .' CURVE TO FOLLOW , .... : \ FLAWS
~
'M " SHORT FLAWS
.... •
• • (b)
• • •
r1': • -- LOAD REDUCED AS
FLAW PASSES BY INDENTOR
. ROUND FLAWS
---
SECONDARY RADIAL ~: CRACK TO FORM _:
TRIANGULAR ICE PIECE : .
-LOAD REDUCED DUE : •.. TO BUCKLING OR : •. '- INITIAL LOW LEVEL CRUSHING ~.. RADIAL
CRACK
(d) LONG FLAWS
Fig . 1. Schematic representation of the failure modes observed in the tests.
Figure 2 shows the load-time records for the test in three different ice sheets with different round flaw densities. For virgin ice (n - 0), the load-time series is cyclic and relatively uniform throu~hout the whole test. With a small flaw density (n = 7 m-), "dips" occur in the load-time series, resulting in less uniform behaviour. These "dips" in the load occur when the indentor interacts directly with one of the round flaws (see Fig. lb). For high flaw densities
6
4
2
o
6
z = 4 o (§ 2 -'
o
6
4
2
o
o 2
d-4.4cm ROUND
n-O
n-7m- 2
n- 25m- 2
4 6 8 10 12
TIME (5)
Fig . 2. Time series of the load on the structure for ice containing round flaws of density n = 0, 7, and 25 m-2
•
188
(n = 25 m-2), these dips are, as expected, much more
numerous. From the load-time series, the average and peak loads were determined for each case and the results are listed in Table n. (Note: in determining these loads, the time series from 2 to 12 s was used; i.e. the initial zero load before contact with the ice was omitted.) The results are presented in Figure 3 in terms of average and peak pressures on the structure as a function of flaw density. These are compared to the values measured in the unflawed ice. With regard to the peak pressure on the indentor in the flawed ice, it appears that the flaws have no effect, regardless of their density. For the average pressure, on the other hand, it is evident that it decreases with increasing flaw density. This results from the drop in the load as the indentor interacts with a flaw.
It is possible to calculate the "expected" reduction in load, on average, if this load reduction was simply due to a decrease in the amount of ice that the indentor had to crush during the test time. The reduction in the area of ice
~ ~
10
8
UJ 6 a: :J CJ) CJ)
~ 4 CL
2
o
f- •
f-
f-
•
f-
o
I I
• .. - •
• -. • •
I I
10
I I I I I I ROUND d - 4.4cm -
• PEAK PRESSURE - NO FLAWS •
• -• • •
-
AVERAGE PRESSURE - NO FLAWS
• • • • • • -
I I I I I I 20 30 40
FLAW DENSITY (m-2)
Fig . 3. Peak ( e ) and average (_) pressure on the structure as a function of flaw density for round flaws of diameter 4.4 cm.

Timco: lee/ structure interaction tests
TABLE 11. TEST RESULTS WITH ROUND FLAWS (pile diameter - 6 cm; flaw diameter - 4.4 cm; speed = 20 cm s- 1)
Flaw lee Average load Measured maximum Peak Average density thickness load pressure pressure
m-2 cm N N MPa MPa
3 0.87 2010 5290 10.1 3.8 7 0.94 2090 4590 8.1 3.7 8 1.09 2300 5410 8.2 3.5 9 0.93 1450 4690 8.4 2.6
10 1.2 2890 6530 9.0 4.0 II 1.22 2730 6040 8.2 3.7 16 1.25 2670 7060 9.4 3.5 20 1.04 2070 4640 7.4 3.3 25 1.2 2400 5470 7.6 3.3 30 1.06 2060 5190 8.1 3.2 35 l.l 2210 6040 9.1 3.3 40 1.06 1760 4910 7.7 2.8
TABLE III. TEST RESULTS WITH FLAT FLAWS (pile diameter = 6 cm; speed = 20 cm s- 1 )
Flaw lee thickness Average load Measured maximum Peak Average density load pressure pressure
m- 2 cm N N MPa MPa
Flaw length (L) = 3cm
3 0.97 2380 5020 8.6 4.1 4 0.92 2220 4880 8.8 4.0 7 0.94 2160 4940 8.7 3.8 8 l.l3 2640 6450 9.5 3.9 9 0.92 2330 4790 8.6 4.2
10 1.23 3210 6630 8.9 4.3 11 l.l0 2390 5080 7.7 3.6 16 1.23 3050 6770 9.1 4.1 20 0.95 2270 4890 8.5 4.0 25 0.98 2330 5000 8.5 3.9 30 1.23 2730 5630 7.6 3.7 40 1.03 2550 5360 8.6 4.1 40 0.84 1970 4390 8.7 3.9 50 0.85 1840 4750 9.3 3.6 60 0.94 2150 5290 9.3 3.8 80 0.91 1820 4150 7.6 3.3 100 0.94 1920 4620 8.2 3.4 120 1.0 2090 5750 9.5 3.5 140 l.l 2380 5540 8.4 3.6
Flaw length (L) = 30cm
2 1.06 2250 5290 8.3 3.5 4 1.04 2140 4880 7.8 3.4 5 0.93 1760 4240 7.6 3.1 6 1.03 2170 5100 8.2 3.5 8 0.99 1370 4410 7.4 2.3 10 1.02 1550 5380 8.7 2.5 12 0.96 1320 4110 7.1 2.3 14 1.21 1440 4630 6.3 2.0 15 0.85 80 2030 4.0 0.2
Flaw length (L) = 60 cm
I 0.87 1640 3740 7.1 3.1 I l.ll 2510 5360 8.0 3.8 2 0.95 910 3930 6.9 1.6 3 1.12 1140 5330 7.9 1.7 4 1.16 620 5180 7.4 0.9 5 1.23 870 4410 5.9 1.2 6 0.92 490 3210 5.8 0.9 7 I.l 240 2630 4.0 0.4
189

Journal of Glaciology
(AR) with a density of n circular flaws of diameter d is given by
(3)
Thus, for a flaw density of 40 m- 2, this would be 0.06 or 6%. However, from Figure 3, it would seem that the average pressure at that flaw density has been reduced by ~5% from that of the un flawed ice. Clearly, these round flaws play a much more important role than a simple reduction in volume of ice crushed.
Flat flaws For the long flat flaws or slits, three different flaw
lengths (L) of various densities (n) were studied.
L = 3 cm. For relatively short flaws of 3 cm length, 19 tests were performed for flaw densities up to 140 m-2 (see Table III). In these tests, the ice failed by crushing with radial cracking similar to that of the unflawed ice. For high flaw densities, however, it was noted that the radial cracks would sometimes deviate slightly from their apparent path to follow one of the flaws (see Fig. lc). This occurred only if the flaws were more or less parallel to the direction of the crack propagation. In terms of the load-time series, their behaviour with increasing flaw density (shown in Figure 4) was very similar to that observed for the round flaws. Similarly, as shown in Figure 5, the peak pressures remain independent of flaw density, whereas average pressures decreased with increasing flaw density.
L = 30 cm. For this longer flaw length, nine tests were performed for flaw densities up to 15 m-2 (see Table Ill) . In this case, for low flaw densities, the ice failed by crushing with radial cracking. However, as the flaw density increased, a significant change occurred in the failure mode of the ice. With the higher densities (n ~ 6 m- 2
), two radial cracks would sometimes propagate to the same flaw creating a triangular-shaped ice piece (see Fig. Id). Then, the ice would fail either in a buckling-like mode (where the ice piece would slide up the face of the indentor), or by crushing. This change is reflected in the load-time series of
6
4
2
0
6
Z 4 ~
0 « 2 0 ....J
0
6
4
2
0
0 2 4 6 8 10 12
TIME (s)
Fig. 4. Time series of the load on the structure for ice containing flat flaws of length 3 cm and densities 0, 20, and 140 m- 2 •
190
I I I I I I I 10 I- L - 3cm -
• • • • I ... • • • PEAK PRESSURE - NO FLAWS
8 • . -r- • • • -;;;
a.. ~ IJ.J 6 - -a: :::J m m IJ.J a: a..
.L AVERAGE PRESSURE - NO FLAWS
j'"" • ... . • • • • • • • 2 r- -
0 I I I I I I I
o 20 40 60 80 100 120 140 160
FLAW DENSITY (m-2)
Fig. 5. Peak (. J and average (aJ pressure on the structure as a function of flaw density for flat flaws of 3 cm length.
o « o ....J
6
4
2
o
6
4
2
o
6 ice
4 crushing
2
o
o 2
L • 30cm
n-15m - 2
4 6 8 10 12
TIME (s)
Fig. 6. Time series of the load on the structure for ice containing flat flaws of length 30 cm and densities 0, la, and 15 m-2•
the tests as shown in Figure 6. For intermediate flaw densities (11 = 10 m-2), the overall level of the crushing force is significantly reduced, and there are times when very low loading occurs . For the higher flaw densities of 15 m- 2
, the overall loading is very significantly reduced, having long stretches with no load at all on the indentor. Figure 7 shows the peak and average pressure as a function of flaw density for L = 30 cm. For flaw densities up to ""10 m-2
, the peak pressure is similar to but slightly less than that for unflawed ice but, for densities higher than that, the peak pressures decrease significantly. With regard to the average pressure, it is lower than that for unflawed ice for all flaw densities.
L = 60 cm. For this flaw length, eight tests were performed for flaw densities up to 7 m- 2 (see Table Ill). Even at the lowest flaw density (1 m- 2
), there was a marked change in the failure mode of the ice compared to unflawed ice. With the radial cracks connecting to the flaws, an ice-splitting event would occur such that triangular pieces of ice would form and fail by buckling or crushing (see Fig. Id). Similar

I I I. 1 1 1 I 10 r- L - 30cm -
~AK PRESSURE - NO FLAWS
8 -;;;
• • r- • -• • • Cl.
~ w 6 • - -Cl: => (j) (j) w 4 Cl:
AVERAGE PRESSURE - NO FLAWS
• Cl. • • • •
2 • • • r- • -
0 1 I I I 1 1 I • o 2 4 6 8 10 12 14 16
FLAW DENSITY (m-2)
Fig. 7. Peak (e) and average ( _) pressure on the structure as a function of flaw density for flat flaws of 30 cm length.
to that for the 30 cm flaws, this crushing would occur at a lower load than that for the unflawed ice. This was apparent when viewing the tests, since the sound of the ice crushing in the tests with the long flaws was much quieter and subdued compared to the crushing in the unflawed ice. The reason for this apparent reduction in the crushing loads is not completely clear. In observing the tests, it was evident that the high crushing loads occurred when the ice sheet in front of the indentor was totally confined by the parent ice sheet. However, when the radial cracks connected to the long flaws to create triangular pieces, the ice being crushed was no longer in a fully confined state. The crushing and clearing of the ice pieces in front of the indentor was less restricted in this case. The lack of confinement produced crushing at lower load levels.
Figure 8 shows the changes in the time series with increasing flaw density. For n = 7 m- 2, the crushing occurs at very low loads, with significant times when there is no load at all on the structure. During this time of zero load,
6
4
2
0
6
Z ~ 4
0 et 2 0 -.J
0
6
4
2
0
0 2 4 6
ice crushing
8
TIME (s)
n-O
n-2m - 2
10 12
Fig. 8. Time series of the load on the structure for ice containing flat flaws of length 60 cm and densities O. 2. and 7 m- 2.
Ti mco: Ice/ structure illleraction tests
I I I 1 I 1 1
10 r- L - 60cm -
PEAK PRESSURE - NO FLAWS
8 r- • • -n; 0..
~ • • •
w 6 Cl:
r- • • -::J (j) (j) w
4 Cl: Cl.
AVERAGE PRESSURE - NO FLAWS
• •
2 I- -• • •
0
• 1 I 1 i 1 I ,
o 2 3 5 6 7 8
FLAW DENSITY (m-2)
Fig. 9. Peak ( e ) and average ( _) pressure on the structure as a function of flaw density for flat flaws of 60 cm length.
the large broken pieces of ice would slide past the indentor, producing a relatively low loading event. In Figure 9, a comparison of both the peak and time-average loads with that for unflawed ice shows that the long flaws significantly reduce these loads on the structure. As shown in the loadtime series, there can be extensive time periods when the load on the structure is small or zero (if the flaw density in the ice is high and the flaw lengths are long). This can significantly change the nature of the loading on the structure.
COMPARISON OF RESULTS
A comparison can be made of the relative frequency of the load on the structure for any flaw length. This is done in Figure 10 for comparable total flaw lengths (360 cm m- 2
) for all flat flaws. Also included on this figure is the load-frequency histogram for the case of no flaws. Comparing the loading behaviour on the structure is very informative when viewed in this manner. If there are no flaws in the ice, the loading events follow a more or less
15
>-u z w :::> 0 10 w a: u. w Cl « I-
5 z w u a: w Q.
15
>-u z w :::> 0 10 w a: u. w Cl ;0
5 z w u a: w Q.
NO FLAWS
0
LOAD IkNJ
L-3cm n -1 20m"
L-60cm n-6m-:!
LOAD IkNI
Fig. 10 . Frequency histograms of the load on the structure (a) no flaws, ( b) L = 3 cm, 11 = 120 m- 2 , (c) L = 30 cm, n = 12 m- 2, (d) L = 60 cm, 11 = 6 m-2• Note the shift towards lower loads and long times with zero load on the structure for the longer flaws.
191

Journal of Glaciology
normal distribution. For high-flaw densities of the smaller flaws, the distribution retains its normal shape, but there is an added "spike" in the spectrum representing zero load on the structure. For increasing flaw length, this "spike" at zero load increases dramatically, such that for L = 60 cm the load on the structure is non-existent 43% of the time. Also, the whole spectrum shifts towards lower loads with increasing flaw length.
It is of interest to compare the relative effectiveness of each flaw length in reducing the loads on the structure. This can be accomplished by normalizing the flaw length in terms of the total flaw length per square meter (given by n x L). This is shown for all flat flaws in Figure II (for the peak pressure) and Figure 12 (for the average pressure). In examining these figures, it can be seen that long flaws can have a great impact on the loads on the structure, even for very low flaw densities. The reduction in the load can be substantial.
It should not be surprising that the long flaws are more effective in reducing loads than the short ones. For many years, researchers in several disciplines such as metallurgy and geophysics have been interested in the influence of flaws on the strength of materials. This is the study of material damage. Numerous theories have been proposed to look at the influence and mutual interaction of cracks in materials (Dey and Wang, 1981; Nemat-Nasser and Horii, 1982; Cooksley, 1984). Their application is, however, not straightforward. In the present tests the generation of flaws in the ice is essentially damaging it. Clearly, as the flaw density increases, the damage in the material increases.
10
ca 8 a.. ~ w a: ::::> 6 (f) (f) w lE :.: 4 « w a..
2
0 0
PEAK PRESSURE WITH NO FLAWS
~* / *-* I * j )'\-I~ /-:~;~----""-=-----i
L-3cm
* ~.7 ~ .~:ocm
60 120 180 240
.- . \ A. _ L-60cm
300 360 420
TOTAL FLAW LENGTH (cm-m- 2)
Fig. n . Peak pressure on the structure versus total flaw length (cm m-2) in the ice for flaws of length 3 cm. 30 cm . and 60 cm.
5
ca AVERAGE PRESSURE WITH NO FLAWS a..
4 .~* ~ .'* .... /,*"'-- /*~ * w
:\ "'>"'\*- *\-a: ::::> (f)
3 (f) L-3cm w a: L-30cm a.. ----------..--<--w ~ 2
.-.~.----:~~\ a: w ~
0 0 60 120 180 240 300 360 420
TOTAL FLAW LENGTH (cm-m- 2)
Fig. 12. Average pressure on the structure versus total flaw length (cm m-2) in the ice for flaws of length 3 cm. 30 cm . and 60 cm.
192
Recently, Cooksley (1984) examined the behaviour of damaged ice in uni-axial and multi-axial tests. She observed that, in a damaged material, there are two different types of damage which may be distinguished. The first is damage caused by the existence of initial cracks or flaws in the ice. This is measured using the dimensionless quantity D where
(4)
The second type of damage is caused by the extension of these cracks parallel to the axis of greatest compression. This is measured by the dimensionless quantity R where
R = 1/2L (5)
where I is the length of a "wing" crack which extends from the end of the main crack, In the present tests, there is clearly damage due to the former cause but relatively little (or none) due to the latter. In none of the tests was there any evidence of the extension of the pre-existing flaws .
The test data can be examined in terms of the damage coefficient D; this gives more meaningful comparison of the different tests than simply looking at the total flaw length (i.e. Figs II and 12). Figure 13 shows the peak pressure versus the damage in the ice (defined using Equation (4»
12
10
-;; Cl.
3! w
* * * * / PEAK PRESSUR E *-.~*,--i ___ --:::--<-_W'_TH_N_O_F_LA_W_S_ ------i
* * • * * * • a:
:::J <f) <f) w
.. a: Cl.
'" .. w Cl.
DAMAGE
Fig . 13. Peak pressure on the structure versus the damage (D) in the ice for flaws of length 3 cm. 30 cm. and 60 cm.
for all three flaw lengths. In general, there is a good correlation amongst the three. The figure indicates that the peak pressure which the ice sheet can exert on the structure is relatively insensitive to damage up to a level of 0 .2. Above this value, the peak pressure decreases rapidly. In a similar manner, Figure 14 shows the average pressure versus damage for all three flaw lengths. Again there is good correlation. In this case, however, it appears that the average pressure is insensitive to damage for D up to 10-2
•
w a: :::J <f) <f) w 3 a: Cl.
w (0 .. 2 a: w ~
*~ ____ * ______ ~~~E~RA~G~E~PR~E~SS~U~RE~W~'~TH~NO~FL~AW~S~ .* * * * ... * * *
** * *
DAMAGE
..
• I
10'
Fig. 14. Average pressure on the structure versus the damage ( D ) in the ice for flaws of length 3 cm . 30 cm. and 60 cm.
Above this value, the average pressure decreases slightly up to D = 0.1, whereupon it drops rapidly with increasing damage. This simple analysis yields consistent results and may be a very useful way of looking at ice behaviour.
APPLICA TION
The interaction of an ice cover with a structure is a complex phenomenon in which many factors come into play. The present tests illustrate the potential role of the flaws in ice for reducing loads on structures. It should be kept in mind, however, that as the aspect ratio increases there is an increasing chance of the non-simultaneous failure of the ice occurring across the front of the structure. As previously discussed, it has been postulated that this can aid in reducing the total load . For an Arctic structure, which may have an aspect ratio of 50-lOO, it is almost certain that both the flaws in ice and the non-simultaneity of the failure play an important role in determining the ice loads . The complexity of the interaction should always be kept in mind.
In applying the test results to the case of an Arctic structure in sea ice, there are several things to consider. As previously discussed, these tests do not represent a model of the prototype situation; they are small-scale tests which are meant to supply insight into the influence of flaws on the ice loads on structures. To apply these results fully to the Arctic situation, a realistic mathematical model (probably using FEM) should be used . The development of such a model is beyond the intended scope of this paper. However, by employing some simple models, it is possible to use the tests to get an idea of the typical sizes and flaw densities which would be required for load reduction.
In the present tests, load reduction occurred when radial cracks emanating from the structure extended and interacted with the pre-existing flaws in the ice. The existence of both the radial cracks and flaws were necessary conditions for strength reduction. It is therefore necessary to investigate their existence in Nature.
In terms of the radial cracks, Palmer and others (I983) and Hallam (1986) have shown that radial cracks can form at relatively low loads when ice interacts with Arctic structures. Using Equation (2), for an Arctic structure of 100 m diameter, the stress necessary to propagate a preexisting crack of say 10 m length is "'0.004 MPa. This stress level is low when compared with average stresses measured on Arctic structures on the order of 0.05--0.8 MPa (Sanderson, 1986). This would indicate that radial cracks can form readily in Nature. Moreover, field experiments such as those conducted at Hans Island (Danielewicz and Metge, 1981) have shown that radial cracks and splitting do occur frequently in Nature.
In terms of the pre-existing flaws in the ice, to the author's knowledge there have been no detailed studies in this area, other than a few limited investigations of ice cracks which occur in small areas (Kingery and Coble , 1963). Overflights in the Arctic, however, show clearly the existence of very long flaws or leads in the ice (extending several kilometers), and treks across the ice usually reveal numerous "dry" cracks of various lengths. These cracks are observable only by ground truthing, since a snow cover often hides them. In Nature, there are many mer.hanisms which can cause the ice to crack and flaws to form , including changes in the thermal conditions of the ice , changes in the elevation of the ice due to tidal action, icefloe collisions, ice interaction with the shoreline or Man-made structures, etc . It would seem that the occurrence of flaws in sea ice can be high.
There are two ways in which the present test results can be used readily to estimate the flaw densities and sizes in ice required for significant load reduction on Arctic structures. Both methods give similar results .
The first approach is to use geometric scaling. In comparing sizes, the longest flaw length in the test series was 60 cm which is ten times longer than the width of the structure under test. Keeping this ratio constant in scaling, this would suggest that for an Arctic structure of 100 m diameter, flaw lengths of the order of I km would be significant for reducing loads. Flights across Arctic sea ice clearly show that flaws of this length (and even much
Timco: Ice/structure interaction tests
longer) are abundant in the Arctic. In terms of flaw density, significant reductions were obtained for flaw densities greater than 3 m- 2 for flaws of this length. Taken to full scale, this would convert to three long flaws on average per 2.8 km2• The validity of this flaw density of approximately I km- 2 for sea ice is not known. Certainly, if one considers a flaw in Nature as synonymous with an open lead, this flaw density is greater than observed. However, if the long "dry" cracks come into play in the interaction process, there may be a sufficient number to cause a load reduction on Arctic structures. Statistics on these types of cracks unfortunately are sadly lacking.
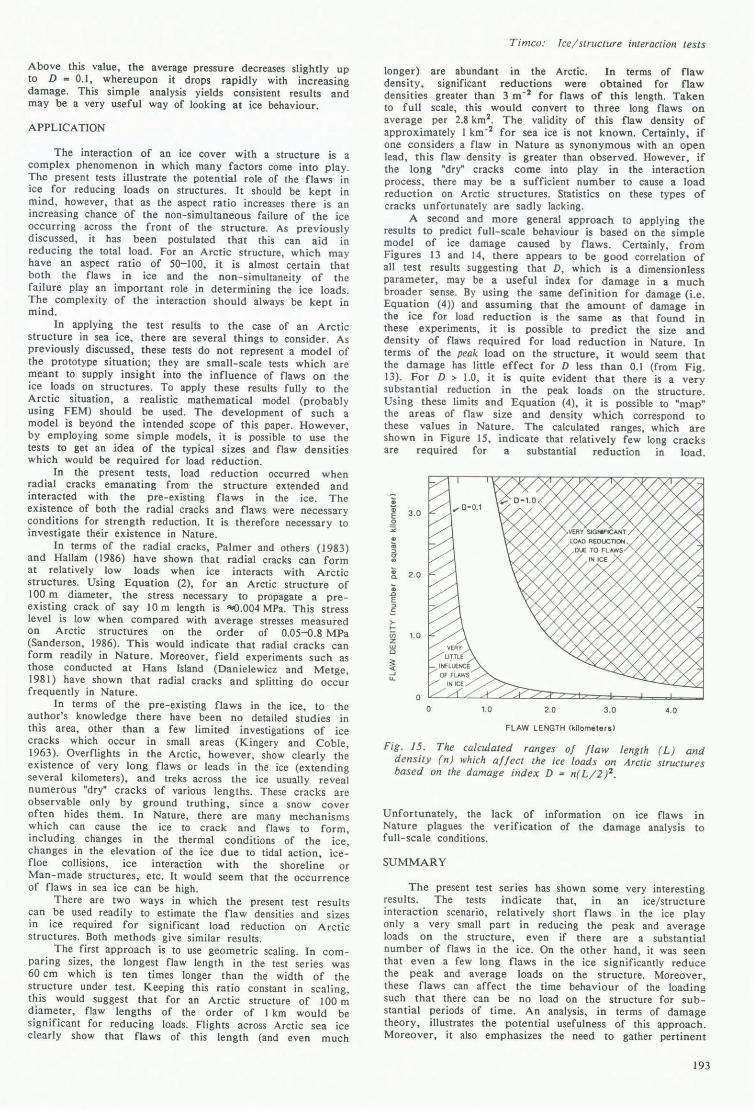
A second and more general approach to applying the results to predict full-scale behaviour is based on the simple model of ice damage caused by flaws. Certainly, from Figures 13 and 14, there appears to be good correlation of all test results suggesting that D, which is a dimensionless parameter, may be a useful index for damage in a much broader sense. By using the same definition for damage (i .e . Equation (4» and assuming that the amount of damage in the ice for load reduction is the same as that found in these experiments, it is possible to predict the size and density of flaws required for load reduction in Nature. In terms of the peak load on the structure, it would seem that the damage has little effect for D less than 0.1 (from Fig. 13). For D > \.0 , it is quite evident that there is a very substantial reduction in the peak loads on the structure. Using these limits and Equation (4), it is possible to "map" the areas of flaw size and density which correspond to these values in Nature. The calculated ranges, which are shown in Figure 15, indicate that relatively few long cracks are required for a substantial reduction in load.
.. a;
3 .0 E .2 x .. .. ::l g-;0 2. 0 a. ;0 D E ::l
5 >->-Ui 1.0 z UJ 0
;: <( ...J u..
o o 1.0 2.0 3 .0 4.0
FLAW LENGTH (kllome1ers)
Fig . 15. The calculated ranges of flaw length ( L ) and density (n ) which aflect the ice loads on Arctic structures based on the damage index D = n( L /2 ;2.
Unfortunately, the lack of information on ice flaws in Nature plagues the verification of the damage analysis to full - scale conditions.
SUMMARY
The present test series has shown some very interesting results . The tests indicate that, in an ice/ structure interaction scenario, relatively short flaws in the ice play onl y a very small part in reducing the peak and average loads on the structure, even if there are a substantial number of flaws in the ice. On the other hand, it was seen that even a few long flaws in the ice significantly reduce the peak and average loads on the structure. Moreover, these flaws can affect the time behaviour of the loading such that there can be no load on the structure for substantial periods of time. An analysis, in terms of damage theory, illustrates the potential usefulness of this approach. Moreover, it also emphasizes the need to gather pertinent
193

Journal of Glaciology
information on flaws in sea ice through ground-truthing techniques. Only with this type of information will it be possible to make an informed estimate of the actual influence of flaws in ice loading on Arctic structures.
ACKNOWLEDGEMENTS
Part of this program was performed with the assistance of Mrs E . Lehmus of the Technical Research Centre of Finland, during her 2 month stay with the author at the National Research Council of Canada. The author would like to thank her for her contribution to the project. Thanks also to R. Bowen for his usual high standard of technical support in performing the tests. Helpful comments on the manuscript were provided by B. Pratte, R. Frederking, and I. Jordaan.
REFERENCES
Ashby, M.F., and 9 others. 1986. Nonsimultaneous failure and ice loads on Arctic structures. (In Eighteenth Annual Offshore Technology Conference; 1986 proceedings. Vol. 1. Richardson, TX, Offshore Technology Conference, p. 399-404. (OTC 5127.»
Cooksley, S.D. Unpublished. Yield and fracture surfaces of brittle solids under multi-axial loading. [Ph.D. thesis, University of Cambridge, 1984.]
Cormeau, A ., and others. In press. Analysis of strength reduction caused by systems of microcracks in ice, by A. Cormeau, M. Maes, I.J. Jordaan, and G.W. Timco. (In IAHR Symposium on lee. 1986. Iowa City. August 18-22. 1986. Proceedings. Vol . 3. Iowa City, lA, University of Iowa. Institute of Hydraulic Research.)
Danielewicz, B.W., and Metge, M. 1981. Ice forces on Hans Island. Calgary, Arctic Petroleum Operators' Association. (Project No. 180.)
Dey, T .N ., and Wang, C . 1981. Some mechanisms of microcrack growth and interaction in compressive rock failure . International Journal of Rock Mechanics and Mining Sciences and Geomechanics Abstracts, Vol. 18, p. 199-209.
Hallam, S.D. 1986. The role of fracture in limiting ice forces . (In IAHR Symposium on lee. 1986. Iowa City. August 18-22. 1986. Proceedings. Vol . 2. Iowa City, lA, University of Iowa. Institute of Hydraulic Research, p. 287-319.)
Hirayama, K., and others. 1974. An investigation of ice forces on vertical structures. by K. Hirayama. J . Schwarz. and H. Wu. Iowa City, lA , University of Iowa. Institute of Hydraulic Research. (Report No. 158.)
Iyer, S.H. 1983. Size effects in ice and their influence on the structural design of offshore structures. (In POAC 83: the Seventh International Conference on Port and Ocean Engineering under Arctic Conditions . Helsinki . Finland. 5--9 April. 1983. Proceedings. Vol. 3. Espoo, Technical Research Centre of Finland, p. 414-32.)
Jordaan, I.J. 1986. Numerical and finite element techniques in calculation of ice-structure interaction. (In IAHR Symposium on lee. 1986. Iowa City. August 18-22. 1986. Proceedings. Vol . 2. Iowa City, lA, University of Iowa. Institute of Hydraulic Research, p. 405-41 .)
Kingery, W.D., and Coble, R .L. 1963. Cracks in sea ice and their effect on operations. (In Kingery, W.D., ed . lee and Snow. Properties. Processes. and Applications. Proceedings of a conference held at the Massachusetts Institute of Technology. February 12-16. 1962. Cambridge, MA, M.I.T. Press, p. 322-34.)
Kry, P.R. 1980. Third Canadian Geotechnical Colloquium: Ice forces on wide structures. Canadian Geotechnical Journal, Vol. 17, No. 1, p. 91-113.
Michel, B., and Blanchet, D. 1983. Indentation of an S2 floating ice sheet in the brittle range. Annals of Glaciology, Vol. 4, p. 180-87.
Nemat-Nasser, S., and Horii, H. 1982. Compression-induced nonplanar crack extension with application to splitting, exfoliation, and rockburst. Journal of Geophysical Resellrch, Vol. 87, No. B8, p. 6805-21.
Palmer, A.C., and others. 1983. Fracture and its role in determining ice forces on offshore structures, by A.C. Palmer, D.J. Goodman, M.F. Ashby, A.G. Evans, J.W. Hutchinson, and A.R.S. Ponter. Annals of Glaciology, Vol. 4, p. 216-21.
Pratte, B.D., and Timeo, G .W. 1981. (In POAC 81 : the Sixth International Conference on Port and Ocean Engineering under Arctic Conditions . Quebec. July 17-31. 1981. Proceedings. Vol. 2. Quebec, Universite Laval, p. 857-66.)
Sanderson, T .J .O . 1984. Theoretical and measured ice forces on wide structures. (In IAHR Ice Symposium 1984. Hamburg , August 27-31 . 1984. Proceedings. Vol . 4. Hamburg, Hamburgische Schiffbau-Versuchsanstalt, p. 151-207.)
Sanderson, T .J.O. 1986. A pressure-area curve for ice. (In IAHR Symposium on Ice. 1986. Iowa City. August 18-22. 1986. Proceedings. Vol . 2. Iowa City, lA, University of Iowa. Institute of Hydraulic Research, p. 361-84.)
Slomski, S. , and Vivatrat, V. 1983. Selection of design ice pressures and application to impact load prediction. (In POAC 83: the Seventh International Conference on Port and Ocean Engineering under Arctic Conditions . Helsinki . Finland. 5-9 April 1983. Proceedings. Vol . 2. Espoo, Technical Research Centre of Finland, p. 909-19.)
Timco, G.W. 1984. Ice forces on structures: physical modelling techniques. (In IAHR Ice Symposium 1984. Hamburg. August 27-31. 1984. Proceedings. Vol. 4. Hamburg, Hamburgische Schiffbau-Versuchsanstalt, p. 117-50.)
Timco, G.W. 1986. Indentation and penetration of edge-loaded freshwater ice sheets in the brittle range. (In Lunardini, V.J., and others. eds. Fifth International Offshore Mechanics and Arctic Engineering ( OMAE) Symposium ... Tokyo. Japan . April 13-18. 1986. Proceedings. Vol . 4. Edited by V.J. LUllardini. Y .S . Wallg. O.A. Ayorinde. and DY. Sodhi. New York, American Society of Mechanical Engineers, p . 444-52.)
Timco, G.W., and Frederking, R .M.W. 1982. Comparative strengths of fresh water ice. Cold Regions Science alld Technology , Vol. 6, No. I , p . 21-27.
Timco, G .W., and Frederking, R.M.W. 1986. The effects of anisotropy and microcracks on the fracture toughness (K1C) of freshwater ice. (In Lunardini, V.J., and others. eds. Fifth International Offshore Mechanics and Arctic Engineering (OMAE) Symposium ... Tokyo. Japan . April 13-18. 1986. Proceedings. Vol. 4. Edited by V.J. Lunardini . Y.S . Wang. O.A . Ayorinde. and D.v. Sodhi. New York, American Society of Mechanical Engineers, p. 341-48.)
Tomin, M.J., and others. 1986. Analysis of failure modes and damage processes of freshwater ice in indentation tests, by M.J. Tomin, M. Cheung, 1.1. Jordaan, and A. Cormeau . (In Lunardini, V .J ., and others. eds. Fifth International Offshore Mechanics and Arctic Engineering (OMAE) Symposium .. . Tokyo. Japan . April 13-18. 1986. Proceedings . Vol . 4. Edited by V.J. Lunardini. Y.S . Wang. O.A. Ayorinde. and DY. Sodhi. New York, American Society of Mechanical Engineers , p. 453-60.)
MS. received 12 March 1987
194