iceberg quantities, shapes, and sizes in western ross … quantities, shapes, and sizes in western...
TRANSCRIPT

Iceberg quantities, shapes, and sizesin western Ross and D'Urvifle Seas
J. R. KEYS*
Antarctic ConsultantWellington, New Zealand
Icebergs are more than simply a conspicuous element in theantarctic marine environment. They are a hazard to shippingand a hindrance to possible offshore oil-drilling rigs. They affectand are affected by antarctic surface water and thus can havesignificant local effects on benthic communities and other partsof the ecosystem. On the positive side, icebergs may one day beused as a source of fresh water. Boon or bane, icebergs are afeature of the antarctic environment warranting further study.
Icebergs were counted in the southern ocean and westernRoss Sea during January 1983 during the cruise of the USCGC
Glacier from Christchurch to McMurdo. Similar counts weredone on my behalf by personnel from the bridge of the ice-breaker during its return cruise in February 1983. Icebergcounts were also made from the yacht Dick Smith Explorer head-ing south from Hobart, Australia, in the southern ocean andD'Urville Sea during January 1982. Longitudes of the cruises areshown on the figure.
Radar was used as the basic tool for estimating iceberg quan-tities. Counts were made of the numbers of targets present onradar screens within certain ranges (usually 6, 8, or 12 nauticalmiles) of the moving vessel at time intervals corresponding tothe diameter of the radar view divided by the ship's speed.Radar echoes from icebergs obviously or possibly grounded(inshore or in waters shallower than 300 meters) were not nor-mally counted. At times of radar counts, supplementary visualand binocular counts were also made, with some sextant con-trol, of the number of icebergs present that were longer thanapproximately 50-100 meters.
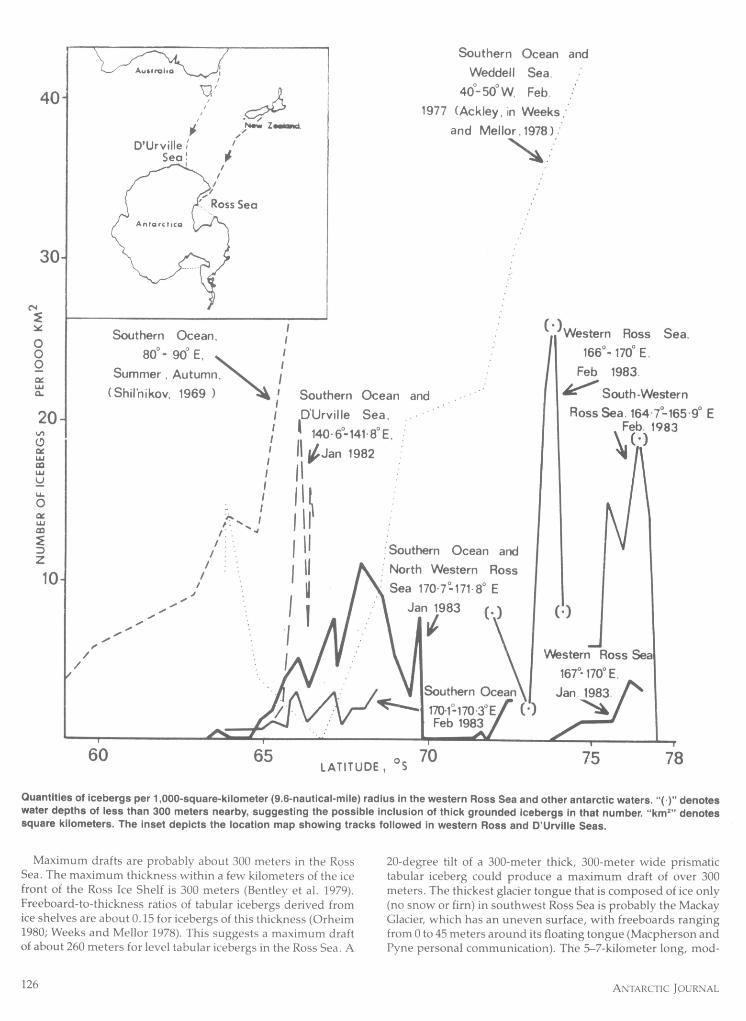
The procedure gives an estimate of iceberg quantities within aunit area. Because of the well known difficulties of detectingsea-borne ice on radar, an error of about 20 percent is associatedwith the number of radar targets counted. The figure shows theestimated quantities in Ross and D'Urville Seas as a function oflatitude with numbers of some other antarctic waters alsoshown. The curve attributed to Shil'nikov (1969) is a summaryof data for different longitudes. Budd, Jacka, and Morgan (1980)give a similar curve displaced to the south by up to 5 degrees oflatitude.
Iceberg quantities vary widely in space and time. In thewestern Ross Sea, the quantities within 1,000-square-kilometerareas range from 0 to more than 20. Early reports from U.S.ships and aircraft (U.S. Navy 1957) show a similar high vari-ability in concentrations during the months of November-March in the years 1955-1957, with possibly some tendencyfor higher concentrations in the southwest and west Ross Seaand to the north of the northwest Ross Sea. As in the LancasterSound/Baffin Bay/Davis Strait/Labrador Sea region of easternarctic Canada (Marko 1982; Petro-Canada 1982), much of this
* Present address: Commission for the Environment, Wellington, NewZealand.
variability is due probably to icebergs moving in "pulses"(loosely spaced groups), in a core (or cores) of rapidly movingwater. In the case of the southwest and west Ross Sea, this corecorresponds to the west then north-moving portions of thecyclonic Ross Sea Gyre (Angino and Lepley 1966). The AntarcticDivergence [a zone of upwelling located at about 65°S north ofRoss and D'Urville Seas (Gordon and Goldberg 1970)] andiceberg decay, are probably additional reasons for the reductionin iceberg quantities apparent at this latitude in the respectivecurves in the figure.
A speculative conclusion based partly on the presence of theRoss Sea Gyre might be that the southwest and west areas ofRoss Sea contain more icebergs on average than elsewhere inthe Ross Sea.
Some iceberg shape data are presented in the table. Previousshape classification systems are not entirely adequate for thewide range of antarctic iceberg shapes. The table is a simplifica-tion of an evolving classification divided into four broad classesrepresenting common shapes seen during two cruises. Duringcruise 1, emphasis was on tabularform icebergs (never tiltedand tilted). During cruise 2, an attempt was made to describe arepresentative selection of the whole population. Accurate clas-sification requires careful examination, from at least two direc-tions, of features including snow stratification and wavecutnotches. Tilt angles are often very small. The data suggest thattabular icebergs that have never tilted are one-quarter to one-half as numerous as similar icebergs that are tilted but notoverturned. Irregular shaped and rounded icebergs (mainlythose that have overturned) are more numerous collectivelythan non-overturned icebergs in the southern ocean. However,within the Ross Sea, non-overturned icebergs may be morenumerous. Another conclusion, based on observations not in-cluded in the table, is that crevassed tabularform icebergs aremore numerous in the D'Urville Sea than in the Ross Sea. This isprobably due more to the prevalence of crevassed ice tonguesalong the George V and Adélie Coasts than to preliminarystages of iceberg splitting, although the latter is obviously asignificant cause of crevassing.
The size data obtained were insufficient for assessing sizedistribution, but the smallest icebergs (less than 200 meterslong) seemed to be the most common in both the western Rossand D'Urville Seas. This is consistent with Orheim's (1980) sizedistribution for icebergs in the vicinity of the Weddell Sea andwith Neshyba's (1980) theoretical distribution.
Freeboards (height above sea level) of nontilted tabular ice-bergs are normally in the 10-40-meter range in the Ross Sea butmaximum heights of tilted icebergs can be much higher. The tiltangles of two tilted tabular icebergs 200-300 meters wide in theD'Urville Sea were 15-20 degrees; generally, angles vary from 0to almost 90 degrees.
Some idea of iceberg draft in the Ross Sea can be obtainedindirectly, from known bathymetry in areas of grounded ice-bergs and from known heights and thicknesses of ice shelvesand ice tongues. In mid-January 1983 more than 40 groundedicebergs were present within 1 to 5 kilometers of the coast, fromnorth of Cape Adare southward 75 kilometers along the eastside of Adare Peninsula to Cape McCormick. Other areas withseveral obviously grounded icebergs nearby included Posses-sion Islands, Cotter Cliffs, and Franklin Island. Water depths of100-200 meters in these areas (U.S. Geological Survey 1:250,000map series, Cape Adare, Cape Hallett, and Franklin Islandsheets) suggest maximum drafts of this magnitude arecommon.
1983 REVIEW 125
Southern Ocean,800 90° E,
Summer, Autumn,(ShiI'njkov, 1969 )
I.I..I..
//
.1
.IA
(N
000
0
20-
uJCMLUUU-
0LU
z
10.
Southern Ocean andWeddell Sea,
40°-50°W,Feb.1977 (Ackley, in Weeks;
and Mellor, 1978)
Australia
40'
Now Zs.//
D'Urville I/
Sea'pt
RossCAnta rc t i
SeaCa
30A
Southern Ocean andD'Urville Sea,
1406°-1418°E,IlJan 1982
Il
I lISouthern Ocean and
INorth Western RossSea 17O7171•8° E
Jan 1983:\
Southern Ocea\
AL
y
OSLATITUDE ,70
Western Ross Sea,166°- 170° E.
Feb 1983.
South-WesternRoss Sea, 164 7 0 165 - 50 E
Feb. 1983
(;)j
Western Ross Sea167°- 1700 E.
Jan. 1983. f's.
757860 65
Quantities of icebergs per 1,000-square-kilometer (9.6-nautical-mile) radius in the western Ross Sea and other antarctic waters. 1')" denoteswater depths of less than 300 meters nearby, suggesting the possible inclusion of thick grounded Icebergs In that number. "km 2" denotessquare kilometers. The inset depicts the location map showing tracks followed in western Ross and D'Urvllle Seas.
Maximum drafts are probably about 300 meters in the RossSea. The maximum thickness within a few kilometers of the icefront of the Ross Ice Shelf is 300 meters (Bentley et al. 1979).Freeboard-to-thickness ratios of tabular icebergs derived fromice shelves are about 0.15 for icebergs of this thickness (Orheim1980; Weeks and Mellor 1978). This suggests a maximum draftof about 260 meters for level tabular icebergs in the Ross Sea. A
20-degree tilt of a 300-meter thick, 300-meter wide prismatictabular iceberg could produce a maximum draft of over 300meters. The thickest glacier tongue that is composed of ice only(no snow or firn) in southwest Ross Sea is probably the MackayGlacier, which has an uneven surface, with freeboards rangingfrom 0 to 45 meters around its floating tongue (Macpherson andPyne personal communication). The 5-7-kilometer long, mod-
126 ANTARCTIC JOURNAL

Quantities of icebergs of different shapes described during two cruises in the southern ocean, D'Urville Sea, and western Ross Sea(percentages given in parentheses)
Tilted icebergsIrregular icebergsRounded icebergsTabular Icebergs(never completely(angular features(rounded featuresTotal number
(never tilted) overturned) dominant) dominant) described
Cruise 1Southern ocean and DUrville Sea (January—February 1982)24 (30) 57 (70) Not included Not included 81a
Cruise 2aSouthern ocean, north of Ross Sea (January 1983)2 (5) 7 (16) 8 (19) 26 (60) 43
Cruise 2bWestern Ross Sea (January 1983)21 (17) 50(40) 12 (9) 43 (34) 126
a Does not include irregular-shaped or rounded icebergs.
erately crevassed tongue averages up to about 350 meters thicktoward the northern thicker side (Calkin 1974). A mean draftover 300 meters is possible for some icebergs freshly calvedfrom this tongue. Therefore, the extreme maximum draft oficebergs in Ross Sea is probably greater than 300 meters. Thethickest tabular iceberg measured by Orheim (1980) in the east-ern Weddell Sea had a draft of 330 meters.
This study was made possible by the generous invitation ofPhilip R. Kyle for me to participate in Deep Freeze 83 aboardUSCGC Glacier. I am also grateful to the captain, officers, andcrew. The D'Urville Sea data were obtained during the1981-1982 expedition of the Oceanic Research Foundation (Syd-ney, Australia). I am indebted to the National Science Founda-tion, the expedition's leader David Lewis, and other crew mem-bers, particularly Karen Williams, for the opportunity to makethis study and for the assistance each gave me. This work wassupported by National Science Foundation grants DPP 80-20002and DPP 80-21402 to Philip R. Kyle.
References
Angino, E. E., and L. K. Lepley. 1966. Ross Sea. In R. W. Fairbridge(Ed.), The encyclopedia of oceanography. New York: ReinholdPublishing.
Bentley, C. R., J . W. Clough, K. C. Jezek, and S. Shabtaie. 1979. Ice-thickness patterns and the dynamics of the Ross Ice Shelf. Journal ofGlaciology, 24, 287-294.
Budd, W. F., T. H. Jacka, and V. I. Morgan. 1980. Antarctic iceberg meltrates derived from size distributions and movement rates. Annals ofGlaciology, 1, 103-112.
Calkin, P. E. 1974. Subglacial geomorphology surrounding the ice-freevalleys of southern Victoria Land, Antarctica. Journal of Glaciology, 13,415-429.
Gordon, A. L., and R. D. Goldberg. 1970. Circumpolar characteristics ofantarctic waters. (Antarctic Map Folio Series, Folio 13.) New York:American Geographical Society.
Marko, J. R. 1982. The ice environment of eastern Lancaster Sound andnorthern Baffin Bay. (Environmental Studies 26.) Northern AffairsProgram, Department of Indian Affairs and Northern Development,Canada.
Macpherson, T., and A. Pyne. 1983. Personal communication.Neshyba, S. 1980. On the size distributions of antarctic icebergs. Cold
Regions Science and Technology, 1, 241-248.Orheim, 0. 1980. Physical characteristics and life expectancy of tabular
antarctic icebergs. Annals of Glaciology, 1, 11-18.Petro-Canada. 1982. Offshore Labrador, initial environmental assessment.
Calgary, Alberta, Canada: Petro-Canada Ltd.Shil'nikov, V. I. 1969. Aysbergi. In Ye. I. Tolstikov (Ed.), Atlas Antarktiki
II. Leningrad: Gidrometerologicheskoye Izdatel'stvo. (Cited in Buddet al. 1980.)
U.S. Navy. 1957. Meteorological and oceanographic factors relating to ant-arctic air-sea rescue operations and human surv ival. (Technical Report 54,Division of Oceanography, U.S. Navy Hydrographic Office.) Wash-ington, D.C.: U.S. Government Printing Office.
Weeks, W. F., and M. Mellor. 1978. Some elements of iceberg techology.In A. A. Husseiny (Ed.), Proceedings of the First international Con-ference on iceberg Utilization. New York: Pergamon Press.
1983 REVIEW 127