icar-icrisat collaborative project tracking change in
TRANSCRIPT

ICAR-ICRISAT Collaborative Project
Tracking Change in Rural Poverty in Household and Village
Economies in Eastern India
Dubaliya: A Village Profile of Ranchi District, Jharkhand
2013

II
Dubaliya (Jharkhand)
—A Village Profile
Anjani Kumar
Ramesh Chand
K M Singh
M S Meena
Sant Kumar Rai
Usha Rani Ahuja
Rajni Jain
Md. Ejaz Anwer
National Centre for Agricultural Economics and Policy Research,
New Delhi – 110012
ICAR Research Complex for Eastern Region
Patna – 800014, Bihar
International Crop Research Institute for the Semi – Arid Tropics
(ACRISAT), Patancheru-502 324,
Andhra Pradesh

III
Dubaliya (Jharkhand) — A Village Profile
© 2013 NCAP, New Delhi
Under ICAR-ICRISAT Collaborative Project
Tracking Change in Rural Poverty in Household and
Village Economies in Eastern India
(Sponsored by Bill and Melinda Gates Foundation)
Published by
Director
NCAP, New Delhi – 110012

IV
Contents Foreword .................................................................................................................................................... V Acknowledgement.................................................................................................................................... VI List of Box and Figures ........................................................................................................................ VIII An Overview of the Dubaliya Village ....................................................................................................... 1 1. Introduction ........................................................................................................................................ 2 2. The District Ranchi ............................................................................................................................ 3
2.1. History .......................................................................................................................................... 3 2.2. Natural Division ........................................................................................................................... 4 2.3. Demographic Features .................................................................................................................. 4 2.4. Special Characteristics .................................................................................................................. 4 2.5. Climate and Rainfall ..................................................................................................................... 5 2.6. Language ...................................................................................................................................... 5 2.7. Biodiversity .................................................................................................................................. 5
3. The Village Dubaliya .......................................................................................................................... 6 3.1. History .......................................................................................................................................... 6 3.2. Location ........................................................................................................................................ 6 3.3. Road Connectivity ........................................................................................................................ 6 3.4. Major Past Events ......................................................................................................................... 6 3.5. Demographic Structure ................................................................................................................. 7 3.6. Status of Education ....................................................................................................................... 8 3.7. Social Structure ............................................................................................................................ 8 3.8. Social and Resource Map ............................................................................................................. 9 3.9. Community and Caste Structure ................................................................................................... 9 3.10. Culture ........................................................................................................................................ 10 3.11. Migration .................................................................................................................................... 11
4. Agriculture ........................................................................................................................................ 12 4.1. Land Holding and Land Use Pattern .......................................................................................... 12 4.2. Soil and Irrigation ....................................................................................................................... 13 4.3. Crops and cropping pattern......................................................................................................... 13 4.4. Preferences for Seed Varieties .................................................................................................... 13 4.5. Livestock .................................................................................................................................... 14 4.6. Farm Implements and Machinery ............................................................................................... 15
5. Economic Status ............................................................................................................................... 16 5.1. Sources of Income and Occupational Diversification ................................................................ 16
6. Health Care and Sanitation ............................................................................................................. 17 6.1. Health ......................................................................................................................................... 17 6.2. Drinking Water ........................................................................................................................... 17 6.3. Sanitation and hygiene ............................................................................................................... 17
7. Market, Transport and Communication ........................................................................................ 18 7.1. Market......................................................................................................................................... 18 7.2. Transport..................................................................................................................................... 19 7.3. Communication .......................................................................................................................... 19 7.4. Electricity ................................................................................................................................... 19
8. Welfare and Development Programmes ........................................................................................ 20 9. Households’ Preference for Different Public Institutions ............................................................ 22 10. Changes in Socio-economic and Ecological Indicators in Dubaliya ............................................ 23 11. Opportunities and Problems ........................................................................................................... 24
11.1. Opportunities .............................................................................................................................. 24 11.2. Problems and Constraints ........................................................................................................... 24

V
Foreword
The eastern region of India continues to have high concentration of poverty. Reducing
poverty in this region has been a major challenge and therefore, Bill and Melinda Gates
Foundation deserves high appreciation for initiating a study on understanding the ways of
reducing poverty in this region. NCAP is happy to be a partner in this significant study
which is a part of a mega project on “Tracking Change in Rural Poverty in Household and
Village Economies in South Asia” being undertaken in collaboration with International
Crops Research Institute For Semi-Arid Tropics (ICRISAT), Hyderabad, with International
Rice Research Institute (IRRI), Manila, Philippines. The project aims at understanding the
dynamic process for reducing poverty in the poverty-laden agro-ecologies of south Asia by
tracking the household and village economies continuously.
NCAP is focusing on the three states, namely Bihar, Jharkhand and Orissa, in eastern
India with the over-all objective of evolving appropriate and effective strategies for
accelerated poverty reduction in the study area. For implementation of the project, 12
villages have been selected from these three states and a profile of each village has been
prepared to highlight the prevailing socio-economic scenario of that village. The present
profile of village Dubaliya, of Jharkhand would significantly contribute to our understanding
of socio-economic and cultural setting of the region.
I do acknowledge the funding support of Bill and Melinda Gates Foundation to this
project. I compliment the project team for bringing out this publication. The information
provided in the village profile will be helpful to state as well as central departments of rura l
development.
Ramesh Chand
Director
NCAP, New Delhi

VI
Acknowledgement
The village profile is the basic output of the ICAR-ICRISAT collaborative project,
“Tracking Change in Rural Poverty in Household and Village Economies in South Asia” and
in bringing out this village profile, we were benefitted by the cooperation and support of
several people. Foremost among them being Prof. Ramesh Chand, Director, National Centre
for Agricultural Economics and Policy Research, New Delhi, and Dr. M.C.S. Bantilan,
Global Theme Leader and Project Director, VDSA, International Crop Research Institute for
the Semi-Arid Tropics, Hyderabad. We are grateful to them for their encouragement and
support.
Thanks are also due to Dr. B.P. Bhatta, Director, ICAR-Research Complex for Eastern
Region, Patna and the Research team at ICAR-RCER at Patna for their help in the study.
Mrs. Neha Atri and Ms. Susmita Panda and Naveen Kumar, Field Investigators provided
excellent support in conducting Participatory Rural Appraisals. They deserve our sincere
thanks for their diligence. We are also grateful to Mr. Shivjee and Ms. Chitra Yadav for their
analytical and secretarial support. We thank all those with whom we interacted during field
surveys, in particular farmers, workers, village leaders, traders, extension functionaries, etc.
We are grateful to Bill and Melinda Gates Foundation for their funding support to this
project. The views expressed in this publication are those of the authors and may not
necessarily present the views of their respective organizations.
Authors

VII
List of Tables
Table 1: General Characteristics of Households in Dubaliya Village ........................................... 7
Table 2: Literacy Rate across Different Categories of Households in Dubaliya Village............... 8
Table 3: Distribution of Households by Community in Dubaliya Village (in per cent) .............. 10
Table 4: Distribution of Households by Caste Group in Dubaliya Village (in per cent) ............. 10
Table 5: Incidence of Migration in Dubaliya Village (%) ........................................................... 11
Table 6: The Landholding Pattern across Different Households in Dubaliya Village ................. 12
Table 7: Incidence of Tenancy in Dubaliya village ..................................................................... 12
Table 8: Changing Cropping Pattern in Dubaliya Village ........................................................... 13
Table 9: Preference of Farmers for Seed Variety in Dubaliya ..................................................... 14
Table 10: Rearing of Different Livestock Species in Dubaliya Village (%)................................ 14
Table 11: Occupational Diversification in Dubaliya Village ....................................................... 16
Table 12: Developmental Infrastructure in Dubaliya Village ...................................................... 21
Table 13: Changes in Socio-Economic and Ecological Indicators in Dubaliya Village: ............. 23

VIII
List of Box and Figures
Box 1: Important Past Events in Dubaliya Village ........................................................................ 7
&
Figure 1: Farmer with Horticulture Field in the Village Dubaliya 2
Figure 2: Road Map to Ranchi District 4
Figure 3: Social and Resource Map of Dubaliya Village 9
Figure 4: Personal Drinking Water Facility of a Rich Household 17
Figure 5: Modern Communication Facilities (Mobile). 19
Figure 6: Preference of Households for Public Institutions and Their Location. 22

1
An Overview of the Dubaliya Village
Dubaliya village is located in Kanke block of Ranchi district. The village is about 9 km from
Kanke and 14 km from the district and state headquarters, Ranchi. Dubaliya village was
established in about 1800 AD. Earlier, there used to be a dense forest in the area. After 1950, the
livelihood situation and other facets have changed substantially. The village is well connected
by a pucca road to the state capital. The educational infrastructure has also been created during
1952, whereas now this village is equipped with many schemes like Community Development
Scheme; MNREGA, Indira Awas Yojna, Ration Card Distribution Scheme and Public
Distribution Scheme. There are also many socio-economic and developmental organisations like
Aanganwadi Kendra, Post Office, Middle School and Health Centre which are working to
improve the status among the villagers.
Paddy is the main crop which is cultivated in the village. The village has less irrigated land
and the farmers do irrigation through wells and ponds. About 5 per cent of the operated area is
under tenant cultivation, but as usual the tenancy is more prevalent among landless households.
Majority of the households are engaged in agriculture, though some of the households are also
engaged in non-farm activities.
Dubaliya is less diversified village in towards animal husbandry or live stock. Number of
livestock decreased over the last several years. This is because of the non-availability of fodder
and man power. Villagers are not growing fodder for the last many years due to impact of the
severe drought. The villager seems more concern for education to their children. They prefer to
send their children to schools rather than to fields.
There is a Primary Healthcare Centre in the Dubaliya village. There is only one doctor, visits
also the PHC and who diagnose the patients for 2-3 hours regularly. For such a bigger village,
the present doctor-patient ratio in the PHC is very much less. Due to sloppiness from the
doctors, fair treatment to the patients is not possible. Therefore, the villagers are willing to go to
Kanke or Ranchi for their medical needs or any major treatment. The veterinary hospital for
livestock is not available in the village. Thus, for the treatment of livestock, they have to go to
the nearby village Chandwe which is about 2 km away from the village Dubaliya.
On the social front, there is high addiction to alcohol and smoking in the village, as the
villagers count the reason of tiredness and availability of alcohol at the cheaper rates. Even on
some cultural occasions, the villagers collectively take the local beer „Handiya‟.
The village is dominated by Oraon tribes and headed by male counterpart. The village
registered relatively better literacy rate as compared to other villages of the state i.e., around 60
per cent. The incidence of migration in the village is meagre i.e., 2.62 per cent which is
prevalent only in small and medium farmers. On an average 40 per cent of the total migration is
attributed to seek education and jobs. This shows that people have better opportunities within the
village for their livelihoods.
The villagers fulfil their needs through Haats or unorganised markets which are organised in
the village, twice a week on Tuesdays and Fridays. The village is culturally very active as they
celebrate all the festivals collectively with harmony at a common place and follow all the rituals.

2
1. Introduction
A research project entitled “Tracking Change in Rural Poverty in Household and Village
Economies in Eastern India” is being implemented by National Centre for Agricultural
Economics and Policy Research (NCAP), New Delhi and International Crops Research Institute
for the Semi-Arid Tropics (ICRISAT), Hyderabad. The project is sponsored by Bill and Melinda
Gates Foundation aims at understanding the dynamic process for reducing poverty in the
poverty-laden agro-ecologies of Eastern India by tracking the household and village economies
continuously.
The Eastern region is one of the most poverty-laden regions in India. Reducing poverty in
Eastern India has been a big challenge before the policy makers and the successful
implementation of this project is expected to contribute to our understanding of the complex
poverty dynamism in the region. The NCAP will focus on three states of Eastern India, namely
Bihar, Jharkhand and Orissa.
The overall objective of the Project is to help evolve appropriate and effective strategies for
accelerated reduction of poverty in Eastern India. Specific objectives of the Project are:
To enhance the availability of reliable household, individual and field-specific, high
frequency, time series data in selected villages and to address the dynamics of economic,
social and institutional development at meso-level (e.g., district level), and
To nurture policy analysis and strengthen capacity building for poverty reduction in
Eastern Region of India.
Collection of longitudinal data on household, individual and field levels in selected villages
is one of the major activities. Twelve villages have been selected for continuously tracking the
changes in rural economies under the Project. The Dubaliya village of Ranchi district in
Jharkhand is one of the selected villages. Before selection of sample households for continuous
monitoring, the village census has been conducted in each selected village to understand the
general and socio-economic profile of the village. This village profile is based on the village
census carried out and qualitative information gathered by the project team.
Figure 1: Farmer with Horticulture Field in the Village Dubaliya

3
2. The District Ranchi
2.1. History
The history of the Jharkhand started after the bifurcation of the parent state of Bihar on Nov
15, 2000, the birth anniversary of Bhagwan Birsa Munda. The most natural resources abundant
southern districts of old Bihar was given a separate entity. It has been associated with the newly
created state of Jharkhand. The literal meaning of Jharkhand is 'the territory of forests'. Being rich
in minerals, the state is one of the most industrialized states of the country.
In the earlier period, the district of Ranchi was known as Lohardaga. It was the name of a
type of bird seen in the local mountain temple. Ranchi district was formerly part of old Lohardaga
district of the British India. In the year 1831-32, a part of old Lohardaga district was carved out
and given the name of the Non-regulation South-West Frontier. In 1899, the name of the district
was changed to Ranchi district. Ranchi was the name of a small tribal village which has since been
assimilated into the city of Ranchi.
The state Jharkhand was covered with the hills and forests. It is inaccessible to a large
segment of the people. The tribes of this state are living within the state for thousands of years
who have not much changed in their lives and cultures, barring the last few decades. There are
many places within the state, especially in the district of Hazaribagh, Koderma and Giridih, where
rock paintings can be found in the cave painted by the earlier tribal people. The painting shows
their lives and cultures of tribal people of since ancient times. Many scholars now believe that the
language used by tribes within the state of Jharkhand is identical to which was used by the
Harappan Civilization. This has led to a great interest in the deciphering of Harappan inscriptions.
For a greater part of the Vedic age, Jharkhand remained masked. During the age of
Mahajanpadas (around 500 BC), India emerged with 16 large states that controlled the entire
Indian subcontinent. The region around Jharkhand was extremely rich in its mineral resources,
including iron. The Janpad that controlled this region, eventually, Magadha controlled most of the
country.
Ranchi is the administrative headquarter of Ranchi district as well as capital of the State of
Jharkhand lies in the southern part of Jharkhand state. The district is bounded on the north by
Hazaribagh district, on the south by West Singhbhum, on the west by Gumla and Lohardaga
district and on the east by East Singhbhum and Purulia district of West Bengal. It is connected
through National Highway NH-33 from the district headquarters of the state. It is also connected
through Gumla and Rourkela by NH-23.
The district is divided into two subdivisions namely Ranchi Sadar and Bundu. It has 21
administrative blocks. The district comprises of 319 Panchayats and 2145 villages. The population
density is 557 people per sq. km. As per Census 2011, Ranchi has total population of 2912022 of
which 1493376 are males and remaining 1418646 are females.

4
Figure 2: Road Map to Ranchi District
2.2. Natural Division
Ranchi is located between 220 45‟- 23
0 45‟ North latitude to 84
0 45‟- 84
0 50‟ East longitude.
It is located on the southern part of the Chota Nagpur plateau, which forms the eastern edge of
the Deccan plateau. Ranchi is referred to as the City of Waterfalls, due to the presence of a
number of large and small falls of around the close vicinity to the city. The most popular ones
are Dasham, Hundru, Jonha, Hirni and Panchghat Falls. The district has a total area of 7698 sq.
km. Its average elevation is 651 m above sea level. The Subarnarekha River and its tributaries
constitute the local river system. Dams in Kanke, Rukka and Hatia have been built over these
channels to cater to the water requirements of majority of the population. Ranchi has a hilly
topography and its combination with dense tropical forests ensures that it enjoy a comparatively
moderate climate as compared to the other states of the country.
2.3. Demographic Features
As per census 2011, population of Ranchi district is 2,914,253 and it comprises the
51.3% males and 48.7% females. Ranchi is the third-largest city in Jharkhand after
Jamshedpur and Dhanbad and the second most populous district of Jharkhand after Dhanbad.
The District Ranchi has an average literacy rate of about 88 per cent, which is higher than the
national average (74.04%).
2.4. Special Characteristics
Ranchi is the major healthcare centre for the people of Jharkhand and nearby states.
Rajendra Institute of Medical Sciences (RIMS) is one of the biggest and oldest hospitals of
Ranchi. It has also several private hospitals. Government Hospitals like the Central Institute of
Psychiatry (CIP) and Ranchi Institute of Neuropsychiatry and Allied Sciences (RINPAS) are
famous throughout the country for Psychiatric treatment.

5
Ranchi is well connected with metro and major cities of India via road, rail and air routes.
District Ranchi is one of the most commercial stations in South Eastern Railways. Apart from it,
there are few more stations in city called Hatia Station, Tatisilwai Station and Namkom Station.
Birsa Munda Airport (IXR) of Ranchi has direct flights from Ranchi, Delhi, Mumbai,
Bangalore, Pune, Chennai, Jammu, Goa and Kolkata. An international terminal with some ultra-
modern facilities is ready for China, Germany and Singapore. Recently, the
annual Haj pilgrimage flights to Saudi Arabia have also started.
2.5. Climate and Rainfall
Ranchi has a humid subtropical climate. However, due to dense forests, it is known for its
pleasant climate, because of this, Ranchi was once the summer capital of the undivided state of
Bihar. Temperature ranges from maximum 42 to 20 °C during summer and from 25 to 0 °C
during winter. The annual rainfall is about 1430 mm (56.34 inches). From the month of June to
September, the rainfall is about 1,100 mm.
2.6. Language
The major languages spoken by the people of Ranchi district like Hindi, Oraon, Nagpuri,
Kurmali and Mundari. These languages in Jharkhand are easy to master and convenient to speak
with absolute fluency. In recent years, there is awareness of the continued expansion of modern
education; English is widely spoken by the urban population of Ranchi.
2.7. Biodiversity
Tribal population dominates the district. The tribal people are solely dependent on forest for
firewood, fodder, food and timber. The vast lists of plant species found in Jharkhand state is
diminishing at a fast rate due to deforestation. Over grazing by livestock and loss of wetland due
to siltation and exploitation of forest is putting pressure on plant biodiversity.

6
3. The Village Dubaliya
3.1. History
The villagers narrate the story of Dubaliya. The word „Dubaliya‟ stands for two streets, i.e.,
do galiya in the village. The existence of Dubaliya village can be found from 18th
century. Prior
to 1769 AD, the area was covered by highly dense forest with full of wild animals. After 1880,
the area was gradually deforested and converted into the fertile land. During the British rule, the
Zamindari System was widespread and practiced in the village. Villagers were used to do work
as a tenant for their subsistence under the Zamindars (landlords).
With the passage of time, many tribal families and a Sahukaar (businessman) family settled
in the village. He started to employ the tribal people as labourers and credited the money with
the higher interest rates. In case of non-repayment, he started to capture the land of the villagers.
At last, if the villager fails to repay their debt within the stipulated time-period, Sahukaar
(Moneylenders) captured the whole land of the debtors/villagers.
The land was the only the means of livelihood in the village. Hence, villagers united and
threw the Sahukaar from the village. Ultimately, Sahukaar left the village. Again in 1950-51,
the government distributed the whole land amongst the villagers. The social map (Fig. 2) shows
the picture of social, economic, cultural and other aspects of the villagers.
3.2. Location
The village Dubaliya, 23o27.811‟ N and 85023.151‟ E, falls under Kanke block of Ranchi
district. It is well connected by road. The village is about 9 km from Kanke (north east) and
about 14 km from Ranchi district towards east.
The village is surrounded by four villages namely Pataratu on its south, while, on the west
by Banhara, on the east by Purnadih and on the north by Siddhi. The map indicates that the
village is surrounded by up-land. The villagers are well connected to the markets due to
proximity of district headquarter.
3.3. Road Connectivity
The village has fairly good road connectivity. It is well linked to the block as well as to the
district. The good condition of roads provide opportunities to the villagers to visit places like
Ranchi to fulfill their needs. Because of the good roads connectivity, the people from this
village also use their own vehicles to go to places.
3.4. Major Past Events
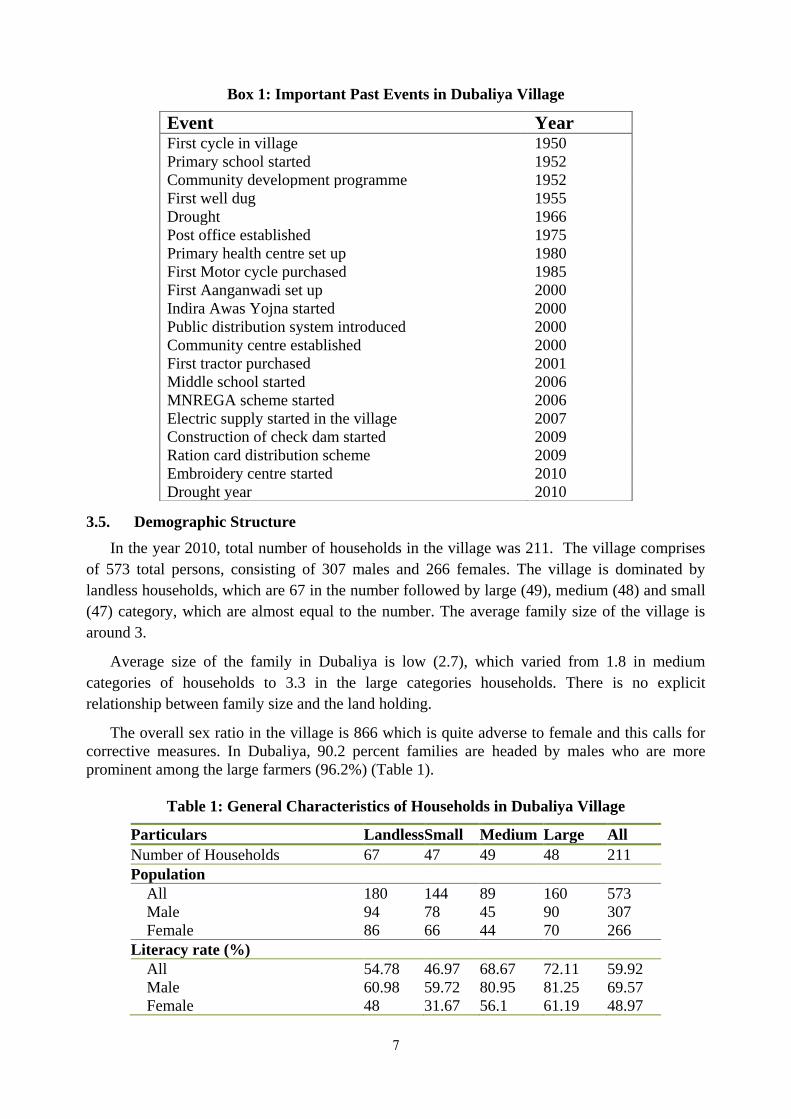
A chronological list of major past events presented in Box 1, indicates the general
development pathways of Dubaliya village.
7
Box 1: Important Past Events in Dubaliya Village
3.5. Demographic Structure
In the year 2010, total number of households in the village was 211. The village comprises
of 573 total persons, consisting of 307 males and 266 females. The village is dominated by
landless households, which are 67 in the number followed by large (49), medium (48) and small
(47) category, which are almost equal to the number. The average family size of the village is
around 3.
Average size of the family in Dubaliya is low (2.7), which varied from 1.8 in medium
categories of households to 3.3 in the large categories households. There is no explicit
relationship between family size and the land holding.
The overall sex ratio in the village is 866 which is quite adverse to female and this calls for
corrective measures. In Dubaliya, 90.2 percent families are headed by males who are more
prominent among the large farmers (96.2%) (Table 1).
Table 1: General Characteristics of Households in Dubaliya Village
Particulars Landless Small Medium Large All
Number of Households 67 47 49 48 211
Population
All 180 144 89 160 573
Male 94 78 45 90 307
Female 86 66 44 70 266
Literacy rate (%)
All 54.78 46.97 68.67 72.11 59.92
Male 60.98 59.72 80.95 81.25 69.57
Female 48 31.67 56.1 61.19 48.97
Event Year First cycle in village 1950
Primary school started 1952
Community development programme 1952
First well dug 1955
Drought 1966
Post office established 1975
Primary health centre set up 1980
First Motor cycle purchased 1985
First Aanganwadi set up 2000
Indira Awas Yojna started 2000
Public distribution system introduced 2000
Community centre established 2000
First tractor purchased 2001
Middle school started 2006
MNREGA scheme started 2006
Electric supply started in the village 2007
Construction of check dam started 2009
Ration card distribution scheme 2009
Embroidery centre started 2010
Drought year 2010

8
Particulars Landless Small Medium Large All
Age (Years) 24.5 27.1 28.5 26.5 26.3
Education (Years) 3.1 3.2 4.9 5.1 4.0
Family size (no.) 2.7 3.1 1.8 3.3 2.7
% headed by male 87.8 93.1 81.3 96.2 90.2
Female sex ratio per 1000 male 915 846 978 778 866
3.6. Status of Education
The literacy rate of the village is about 60 per cent and it was higher (69.6 per cent) for males
than females (49 per cent). Farm-size-wise analysis of literacy has revealed that farm households
with larger land base are more literate (72.1 per cent) than households with a low land base.
Similarly, the female literacy rate is more evident in the large farmers. As a result, the literacy rate
is quite high in large farmers‟ households and comparatively low in families of small and landless
households (Table 2).
The educational level of the village seems relatively better. A primary school was
established in Dubaliya in 1952 which is still in a good condition. The middle school has been
established in 2006. There is no high school in the village and the children who desire for higher
education had to go to either Ranchi or Kanke.
Table 2: Literacy Rate across Different Categories of Households in Dubaliya Village
Particulars Households
Landless Small Medium Large All
Literacy rate (%)
All 54.8 47.0 68.7 72.1 59.9
Male 61.0 59.7 81.0 81.3 69.6
Female 48.0 31.7 56.1 61.2 49.0
3.7. Social Structure
The social structure of the village Dubaliya is diverse to be less. There seems disparity
between the male and female. The females are given equal importance, even some of the
households in the village are headed by females. In the village Dubaliya, some women are
politically and socially active and they also participate in local elections.
Once an incident happened in the village, the women of the village collectively dragged back
a Herbal company trying to establish at the place of their worship Jatra Sthal. This incidence
shows the involvement of the females in social activities. Despite their active participation and
involvement, there is a difference in wages between male and female.
The family size in Dubaliya is very low. This is because of, non prevalence of the joint-
family system in the village. In Dubaliya, the majority of the population directly or indirectly
depends on the agriculture and its allied activities. The villagers mutually help each other in
agriculture and allied activities. The women of this village act as an unsung hero, because they
take care of the household‟s activities besides agriculture and allied activities.

9
3.8. Social and Resource Map
Figure 2 shows the household pattern according to the caste and community. The village is
divided into two parts: Badi Dubaliya and Choti Dubaliya, which are divided by a pucca road.
These are further divided in mohallas. Each mohalla consists of about 10-50 households or more.
Based on the major characteristics, the mohalla is re-named. For example, the neeche mohalla
is geographically down; kathal kocha mohalla had lotted of jackfruit trees. The map also indicates
the resources available in the village, like personal wells (there are about 250 in the village).
Figure 3: Social and Resource Map of Dubaliya Village
3.9. Community and Caste Structure
Dubaliya is dominated by the Oraon tribe. Lohra and Karmali are tribes residing in the
village. Schedule tribes account for 99.5 per cent of the village population and the remaining
few households to OBCs. The households of this tribe are headed by male counterparts. In the
village, the castes are distinguished on the basis of the profession, which their ancestors adopted.
The households in Dubaliya fall only under Hindu religion (100%)(Table 3).

10
Table 3: Distribution of Households by Community in Dubaliya Village (in per cent)
Particulars Households
Landless Small Medium Large All
Hindu 100.0 100.0 100.0 100.0 100.0
Muslim 0.0 0.0 0.0 0.0 0.0
Christian 0.0 0.0 0.0 0.0 0.0
There is no single household of Forward Caste (FC) and scheduled caste (SC) in the village
(Table 4).
Table 4: Distribution of Households by Caste Group in Dubaliya Village (in per cent)
Particulars Households
Landless Small Medium Large All
ST 98.5 100.0 100.0 100.0 99.5
OBC 1.5 0.0 0.0 0.0 0.5
3.10. Culture
Being a bountiful natural resource dominated village; nature has been given vital
importance in every sphere of life and culture. Sarhul, Karma Puja, Mukka Sendra and Jitia
Puja are the major festivals of this village. Out of these, Sarhul is the most important
festival of all the tribes in the village as well as Jharkhand. The word „Sarhul’ means Sal
tree blossom and worship of these tree parts associated with goddesses. The tribal
communities of the village worship the tree of Sal to seek the blessings of their spirits. On
the occasion of Sarhul festival, people dance with unrestricted drinking of Handiya (a local
beer made of rice), and branches of this holy tree are ceremonially planted in the courtyards.
Indeed, Handiya beer is culturally consumed by both men and women on social occasions
like marriage and other festivals. The village had a common worship place which they called
as Jatra Tand.
The folk harvesting festival (when new crops are harvested) called Poush Mela or Tusu
Mela is celebrated, with brightly coloured and excellently decorated symbolic artefacts of
folk deity, during the Makar Sankranti. Mukka Sendra is different kinds of the festival which
is celebrated once in every twelve years by the women of Oraon tribe.
In tribes, great importance is given to the nature, goddesses, colours and music. The
major musical instruments which the tribal people of Dubaliya village use in the festivals are
Bansuri, Arbansi, Sahnai, Madanvari, Singa, Sankh Mandar, Dhol, Dhak, Dhamsa, Nagara,
Damama, Karha, Tasa, Jurinagra, Visamdhanki, Thapchanchu, Kartal, Jhanjh, Thala,
Manjhira and Ghanta.
There are many foods and dishes of the village are parts of the traditional cuisine. These
include Dudhauri, Dhuska, Pittha, Rotis and Saag (leaves of the different shrubs and small
plants). Sattu is major part of cuisine. Tribals also use the different types of flowers i.e.
drum-stick, august and Jhirool as vegetables.

11
3.11. Migration
People generally opt to migrate from their place of living to other places when
employment opportunities are not locally available. The incidence of migration is almost meagre
in Dubaliya village (2.6%). The migration is mostly prevalent in medium-farm-size- households
followed by small farm-size households. It is about 15 per cent on medium farmers and 1.4 per
cent on small farmers‟ category (Table 5). However, the incidence of migration is almost nil in
landless-farm-size households.
On an average, about 40 per cent people migrate for their education and salaried jobs,
which are from small and medium farmers‟ households. Purpose-wise analysis has also revealed
that, there is no migration for daily wage employment. Only 20 per cent of people of the village
migrate for other purposes. This shows that people have either better opportunities within the
village for their livelihoods (Table 5), or they have less access or exposure to better avenues of
remunerative employment.
Table 5: Incidence of Migration in Dubaliya Village (%)
Particulars Households
Landless Small Medium Large All
Out-migration 0.0 1.4 14.8 0.0 2.6
Purpose of leaving outside the village
Education 0.0 50.0 38.5 0.0 40.0
Salaried job 0.0 50.0 38.5 0.0 40.0
Daily wage employment 0.0 0.0 0.0 0.0 0.0
Own business 0.0 0.0 0.0 0.0 0.0
Searching job 0.0 0.0 0.0 0.0 0.0
Others 0.0 0.0 23.1 0.0 20.0

12
4. Agriculture
4.1. Land Holding and Land Use Pattern
In Dubaliya, agriculture is the main occupation, but the percentage of irrigated land is zero.
Agriculture of the village is totally dependent on rain, wells and ponds. The average size of
landholding is 1.9 acre. The operated land-size is also lower (1.4 acres); with 0.2 acre for
landless and 3.7 acres for large farmers‟ households. Due to lack of irrigation facilities the
permanent fallow land constitutes 27 per cent of total land.
Table 6: The Landholding Pattern across Different Households in Dubaliya Village
It is observed from the Table 7 leasing-in and leasing-out of land are more common across
small (8.5%) and large (6.3%) households respectively. It is also observed that about 3 per cent
of households have leased-out land and about 5.7 per cent of households have leased-in land for
crop production with some variation across different categories of households. Six per cent of
landless and 8.5 per cent of small farmers have leased-in land for crop production (Table-7).
About 6.3 percent of the large farmers have leased-out their land to landless, small and medium
farmers for cultivation because of surplus availability of land.
Though, the village have low incidence of tenancy because of no irrigated land in the village.
In terms of operated land, the shares of leased- in and leased-out lands are very high in case of
landless households. It about 35.4 per cent of operated land have been leased-in and about 17.3
per cent of operated land has been leased-out.
Table 7: Incidence of Tenancy in Dubaliya village
Particulars Households
Landless Small Medium Large All
Households leasing land (%)
Leased-in 6.0 8.5 6.1 2.1 5.7
Leased-out 1.5 2.1 2.0 6.3 2.8
Share in operated land (%)
Leased-in 35.4 10.2 4.6 0.6 4.4
Leased-out 17.3 0.7 1.5 2.6 2.8
Particulars Households
Landless Small Medium Large All
Size of land holding (acre) 0.2 0.9 1.7 5.3 1.9
Operated land (acre) 0.2 0.8 1.3 3.7 1.4
Irrigated area (%) 0.0 0.0 0.0 0.0 0.0
Permanent fallows (%) 4.1 25.9 24.6 29.2 27.1

13
4.2. Soil and Irrigation
In Jharkhand, about 90 per cent of land area falls under the red soil and it spread throughout
the state. Out of the total geographical area (7.9 million ha) of the state, the net cultivated area is
around 2.2 million hectares. While the total irrigated area is recorded only about 0.2 million
hectares.
The village Dubaliya is characterized with red soil which is reddish in colour due to
presence of iron. This soil was formed due to weathering of ancient crystalline and metamorphic
rocks. The soil is rich in potash and become fertile with the proper use of fertilizers and
irrigation. The major concern in the village is to maintain the soil fertility due to factors such as
soil erosion because of poor soil management and injudicious use of fertilizers.
4.3. Crops and cropping pattern
Prior to the onset of green revolution (1970), the principal crops grown in the village were
paddy, finger millet and maize during the Kharif season and lethyrus, gram and sweet potato
during the Rabi season.
Nowadays, in the Dubaliya village, paddy becomes the major crop grown during the Kharif
season. It covers more than 80 per cent of the total cultivable area. Though, the villagers also
cultivate maize during the Kharif season. While Urad, potato, sweet potato, gram and onion are
grown in Rabi season and it covers less than 5 per cent of cultivable area in the village. Summer
gram is also grown in this village which covers almost 1 per cent of the cultivated area.
Table 8: Changing Cropping Pattern in Dubaliya Village
Crop season 1970 2010
Kharif
Paddy
Maize
Finger millet
Paddy
Maize
Rabi
Lethyrus
Gram
Linseed
Sweet potato
Vegetables (Potato, Onion)
Sweet potato
Gram
Summer Summer vegetables Summer vegetables
4.4. Preferences for Seed Varieties
In Dubaliya village, paddy is the main crop cultivated by the farmers. While interacting with
the farmers of Dubaliya village it was revealed that the farmers select the seed variety for
cultivation based upon the seed characteristics like yield, irrigation-need, fertiliser-need, crop
duration and cooking of quality. The preferred seed varieties commonly used for paddy
cultivation are Pioneer, IR 64, Shankar and Advanta which are ranked by the villagers (Table 9).

14
Table 9: Preference of Farmers for Seed Variety in Dubaliya
Variety Higher
yield
Less
irrigation Less fertilizer
Short
duration
Good
taste
Preference
of farmers
Rice
Pioneer
Second
IR 64 First
Shankar
Second
JK
Fourth
Advantage
Third
Note: Symbols are only indicators of change and do not depict the extent of that change in real terms
with time
4.5. Livestock
Livestock is an important source of livelihood and the village Dubaliya is not an exception.
The village had 183 cattle, 44 buffaloes and 122 goats in 2010. Besides, the village also had 160
poultry birds during the census of village in 2010. The average size of cattle worked out to be
about 1 per household, while the average size of buffalo holding was only 0.2 per household
(Table 10).
Table 10: Rearing of Different Livestock Species in Dubaliya Village (%)
Parti-
culars
Landless Small Medium Large All
Live-
Stock
Avera
ge
Live-
Stock
Avera
ge
Live-
Stock
Avera
ge
Live-
Stock
Avera
ge
Live-
Stock
Avera
ge
Cattle 47 0.7
(6.0)
24 0.5
(10.6)
39 0.8
(0.0)
73 1.5
(18.8)
183 0.9
(8.5)
Buffalo 9 0.1
(22.4)
15 0.3
(19.2)
0 0.0
(22.5)
20 0.4
(31.3)
44 0.2
(23.7)
Goat 46 0.7
(17.9)
29 0.6
(19.2)
17 0.3
(10.2)
30 0.6
(16.7)
122 0.6
(16.1)
Poultry 32 0.5
(7.5)
45 1.0
(12.8)
23 0.5
(12.2)
60 1.3
(22.9)
160 0.8
(13.3)
Other 1 0.0
(1.5)
5 0.1
(8.5)
8 0.2
(8.2)
4 0.1
(6.3)
18 0.1
(5.7)
Livestock* 135 118 87 187 527
Note: Average figure in numbers, figure in parentheses are percentage.
* Total number of livestock in the village
In Dubaliya village, the number of livestock decreased in last few years. The villagers gave
two reasons behind this decline. The first reason is the lack of availability of fodder due to less
rainfall in the past years. The second reason is the lack of irrigation facilities constrains fodder
cultivation in the village. Due to non-availability of labour to take care of livestock in the
village, this work was done by the children. Though, after the opening of schools, parents prefer

15
to send their child to school rather than the grazing areas. The value of livestock per household
has been registered by Rs 5731.
Though the livestock population is high in Dubaliya village, despite this, there is no
veterinary hospital in the village. Thus, for the treatment of livestock, the villagers have to go to
the nearest village Chandwe where a Vulnerary Hospital for animals is run by BAIF.
4.6. Farm Implements and Machinery
India is gradually moving towards the modern farming. With the introduction of mechanized
farming, it has been possible to cut-down the farm-production costs, increase the productivity
and check the post-harvest losses in the agriculture sector of the country.
Despite this, the farmers of Dubaliya village are still stuck to the traditional modes of
farming. Khurpi, Hasia, iron plough, wooden plough and other small implements are used for
cultivation in the village. On average, few farmers are having electric motors, which are used for
their personal purpose (Table 12). Only 1.42 per cent households are having machines, and on
an average total value of machines is Rs.11, 429.38. The investment in agricultural machinery is
high in small farmers (Rs. 20, 340) in comparison to the large farmers who invest about Rs.
17,883 in machineries.

16
5. Economic Status
The economy of the village Dubaliya is mainly based on agriculture and its allied sector.
Majority of the households of the village are engaged in fish farming. But, due to heavy use of
chemical fertilizers the fish farming almost disappeared.
5.1. Sources of Income and Occupational Diversification
In Dubaliya village, agriculture and allied activities were the key sources of income and
employment. The working population is around 29 per cent in this village with little variation
across different categories of households. The working population of Dubaliya village were
classified into four occupational categories like (i) Cultivator (ii) Agricultural labourers (iii)
Non-farm workers, and (iv) salaried jobs.
More than two-third of the working population are engaged in cultivation and 23 per cent of
them are employment as non-farm worker. About 7 per cent of the working population are
regular salaried worker. The agriculture labour accounted for only 2.4 per cent of the working
population (Table 13).
In the case of medium farmers, it is 60 per cent from agriculture and 40 per cent from
horticulture. The landless farmers earn the great portion of their income i.e. 60 per cent by
working as labourers both on-farm and off-farm and the remaining 40 per cent from agricultural
activities in their fields.
According to the villager‟s perception, the majority of the population of Dubaliya falls under
the „poor‟ category (68%). While, only a small proportion of the village population (i.e. 2 per
cent) is in „rich‟ category. About 30 per cent of households in the village are in „average or
medium‟ category.
Table 11: Occupational Diversification in Dubaliya Village
Particulars Households
Landless Small Medium Large All
% share of working population (No.)* 28.3 29.9 31.8 26.9 28.9
Cultivator 51.0 76.7 71.4 76.7 67.9
Agricultural worker 02.0 00.0 10.7 00.0 02.4
Non-farm worker 45.1 20.9 10.7 07.0 23.0
Salaried worker 02.0 02.3 07.1 16.3 06.7
*Share of different occupations particulars in total working population

17
6. Health Care and Sanitation
6.1. Health
There is one primary health centre (PHC) in the village Dubaliya. It has been established in
1980. But, it lacks infrastructural facilities and sufficient medical staffs. A lady doctor is
attached to the PHC, who visits this centre for 2-3 hours daily. Consequently, the villagers prefer
to proceed towards the Kanke for any major treatment, which is about 6 km away from
Dubaliya.
According to the villagers of Dubaliya, few years back, the children were more prone to
diseases. However, the proneness of children to disease has declined in recent years. The
functioning of the PHC should be improved and infrastructure of the same need to be
strengthened to ensure better health facilities within the village itself.
6.2. Drinking Water
Unsafe drinking water and inadequate sanitation are the major causes responsible to the poor
health in the villages. There is no scarcity of drinking water in Dubaliya village. Almost, all the
households of Dubaliya use to drink of water from their personal wells. Besides, government
also established about 50 hand pumps to meet the need of safe drinking water in the village.
However, the quality of drinking water is an issue and often there is an outbreak of water born
diseases.
Figure 4: Personal Drinking Water Facility of a Rich Household
6.3. Sanitation and hygiene
The sanitation condition in Dubaliya village is poor. There are only three pucca latrines in
the village. The majority of the population of this village defecate in the open field, which is not
only indecent but in-sanitary also.

18
7. Market, Transport and Communication
7.1. Market
Two weekly markets i.e., Haat (unorganized market) are held in the village Dubaliya, on
Tuesday and Friday of every week. These markets cater to the need of the villagers. Similarly,
within a half kilometre radius, another village namely Kumaria also organizes the same type of
Haat where villagers of the surrounding area used to visit.
The village Dubaliya is located very close (11 km) to the state capital Ranchi. Hence, people
from this village prefer to go to the Ranchi market as bigger markets give better opportunities
and wider options to them.
Figure 6: Unorganized Vegetable Market (Haat) at Dubaliya Village.
Figure 7: Kirana Shops at the Village.

19
7.2. Transport
Dubaliya village is located nearby the road. The people from this village are used to visit
Ranchi and other places by the mode of bus, auto and other vehicles. In Dubaliya, there are ten
bullock carts, two tractor, one auto, three car and thirty five motorcycles.
7.3. Communication
Communication network provides linkage between people and institution for promotion of
mutual learning and use of agriculture-related technology, knowledge, skills and information.
The system integrates farmers, agricultural scientists, input dealers and the private sectors to
harness the knowledge and information from various sources i.e. television, radio, news papers
and mobile phones and other modern technologies etc. for better farming and improved
livelihood. The mobile phone revolution has changed the situation in this village and many
mobile companies are now offering their services in this village. Almost every household has at
least one mobile phone except weaker sections of the society. The modern communication
technology i.e. mobile phones help the family members to connect with their out-migrated
family members, who have gone-out for their higher education and to earn livelihood.
Figure 5: Modern Communication Facilities (Mobile).
7.4. Electricity
Electricity supply was started in the village in the year 2007. Though, the village is getting
sufficient power supply with 15-16 hours a day. There is one Vocational Training Centre run by
the SHGs in the village.

20
8. Welfare and Development Programmes
Central and state government‟s sponsored several welfare programmes are being
operated in the village Dubaliya. These are as under;
1. Aanganwadi Schemes
2. Public Distribution Scheme
3. Antyodaya Yojana
4. Annapurna Yojana
5. Mid-Day Meal Scheme
6. Mahatama Gandhi National Rural Employment Guarantee Scheme
7. Crop Insurance
8. Old Age Pension
9. Pension for Physically Handicapped
10. Self Help Group (SHGS)/ Farmers Club
11. Subsidy on Farm Well/Farm Ponds
12. Subsidy on Shade Net
13. Subsidy on Purchase of Agricultural Implementation/ Machinery
14. Scholarship Program
15. Widow Pensions
16. Family Planning
17. Integrated Scheme of Oilseeds Pulses Oil Palm and Maize (ISOPOM)
18. Livestock Insurance Scheme
19. National Food Security Mission
20. National Horticultural Mission
21. Shri Vidhi Agricultural Organization
22. Prime Minister Relief Package Program (For Seed Purchase)
23. Rajeev Aarogya Shree
24. Rashtriya Krishi Vikas Yojana
25. Subsidy on Purchase of Livestock
26. Watershed Programs
The effect of some of these schemes has become visible like implementation of
Anganwadi Yojana has facilitated continuation of education, free meal and regular and
proper vaccinations in the village. It aims at improving the nutritional and health status of
children in the age group of 0-6 years. Implementation of Scholarship Programme made
possible to continue the higher education, especially for girls, after the primary education in
the native village. Introduction of mid-day meal schemes has increased enrolment in schools,
etc. however; a wider impact has yet to emerge.

21
A glance at the infrastructural facilities of Dubaliya village can be had from Table 14.
Table 12: Developmental Infrastructure in Dubaliya Village
Particulars Number
Upper Middle School : One
High School : No
Vocational Training Centre : One
Primary Health Centre : One
Hospital : No
Qualified Private Doctor : Yes
Auxiliary Nurse Mid-Wife : One
Anganwadi Centres : Two
Private Chemist Shop : No
Thrashers : -
Tractors : Two
Bullock Carts : Ten
Rickshaws : One
Mechanical Thela : -
Private Four Wheeler : Three
(For public transport)
Bus Service : No
Rail Head : No
Bank : No
Drinking Water Supply : No
Electric Supply : Good
Street Solar Light : -
Radio Sets : -
TV Sets : Few
Public Hand Pumps : Fifty
Post Office : Yes
Telephone Land Line : No
Mobile Phone : Yes
Agricultural Input Shop : No
Agricultural Market : No
Public Distribution System : Yes

22
9. Households’ Preference for Different Public Institutions
According to the people of Dubaliya, „School‟ (Figure-6) is the most important public
institution, because as they understand the value of education, which would help for the growth
and development of the family and village.
The next rank is given to the „Primary Health Centre (PHC)‟ by the villagers, which is
available in the village. But the villagers complain that there is no any qualified doctors,
sufficient medical staffs and infrastructural facilities in the village PHC. Because of this, they
have to go to Kanke for their major medical treatment.
Figure 6: Preference of Households for Public Institutions and Their Location.
Note: The number in the circle shows the preferential ranking of that institution by the villagers, and
length of arrow depicts the relative distance from village.
The other two most important institutions are: ‘Samudaik Bhawan’ and „Veterinary
Hospital‟. Though, the Samudaik Bhawan is the gathering place of all the villagers on any
occasion. There is no veterinary hospital exists in the village. The villagers have to go to the
nearest village namely Chandwe for any treatment to their livestock.
The other preference is given to the Anganwadi Kendras. The women and girls of the village
learn to sew or stitching in Anganwadi Kendras. It helps them to earn money and make self-
reliance. Anganwadi Kendras also organizes the Jatra Tand, where all the religious activities of
the village take place.
Police station, court, Panchayat Bhavan is regarded least important by the villagers as the farm
community seems to be peaceful with almost no incidence of thefts, dacoity, fights, etc..
9
Police Station 10
Court
7
Bank
8
Kissan
Centre
1
School 6
Anganwadi
3
Samudaik Bhavan
DUBALIYA
YUSARI
2
Primary Health
Centre
4
Veterinary
Hospital
5
Jatra Tand

23
10. Changes in Socio-economic and Ecological Indicators in Dubaliya
Based on rural development indicators, the socio-economic and ecological changes in the
village Dubaliya are depicted in Table 15. The perceived reasons for the change have also been
indicated in the Table 15.
Table 13: Changes in Socio-Economic and Ecological Indicators in Dubaliya Village:
1970-2010
Indicators 1970 1990 2010 Reasons
Soil fertility
Chemical intervention,
Less use of organic
manure, and lack of
insects
Number of crops
Lack of water,
Demonstration effect,
Lack of initiative
Fertilizer use
Decreasing soil fertility
Area of cultivation
(Per capita)
Increasing population,
decreasing water
availability, if not
seasonal than perennial
Horticulture
More vegetables
production
Irrigation
More investment in
private boring,
Government initiative
Migration
For education and
salaried jobs.
Ground water
level - - - - - - - - - - - - - - - - - - - - - - - - - - Less rain
Livestock
Less manpower, less
fodder, inclination
towards education
Diseases
Intervention of
chemicals in crops
increased.
Forest
Lack of rain, cutting of
forests
Wild life
Decreasing forest and
encroachment
Note: The symbols used in this table are only indicators of a change and do not depict the extent of
change in real terms over time.

24
11. Opportunities and Problems
11.1. Opportunities
w With increased irrigation facilities, the farmers of this village could diversity their
cropping pattern toward horticultural crops like Jack fruits and drum sticks, which
can augment the farm income of the village.
w Establishment of a high school in the village will strengthen the rational thinking
about the people, particularly the younger generation and will provide them income
opportunities.
w Establishment of a veterinary hospital in the village will help in reducing the
livestock diseases by providing the proper treatment.
w With desired availability of fodder which will increase the livestock-rearing in the
village. It will also help to in setting-up of milk cooperatives in the village may add
to the village economy.
w Re-functioning of the Vocational Training Centre in the village can be more useful to
the villagers.
11.2. Problems and Constraints
During the interactions with the villagers highlighted several problems and constraints which
have significant bearing on their socio-economic status. Important problems and constraints are
listed below;
w Addiction of alcohol, (particularly local beer Handiya) especially in male is highly
prevalent in the village.
w Lack of strong educational infrastructural facilities is the main hurdle in the growth and
development of the people of Dubaliya village.
w Lacks of proper primary healthcare facilities in the village, people have to go to the
Kanke for major medical treatment.
w Lack of healthcare facilities for livestock in the village.
w Lack of adequate electric supply (in terms of mega watt), which leads to more units
consumption within the village.
w Lack of adequate numbers of Anganwadi centres to teach the stitching and other
activities
w Lack of irrigation facilities in the village, which limits the scope of diversification in
favour of fruits cultivation.
w Lack of adequate knowledge and skills in adopting modern farming techniques.
w Lack of post harvest infrastructure for agro-produce management in the village.
w Lack of markets for agro-products.
w Lack of sanitation facilities and poor awareness about the hygiene practices make
villagers more susceptible to diseases.
Non-existence of any cooperative institution like Farmers Club, PACs, Cooperative/Welfare
Society in the village.