icao seminar on aerodrome physical characteristics … sem… · icao seminar on aerodrome physical...
TRANSCRIPT
ICAO Seminar on Aerodrome Physical Characteristics and Pavements
By Dr.M.W.Witczak Invited Speaker
Held at
ICAO South American Regional Office Lima, Peru
6 – 9 August 2013

Speaker Introduction
Invited Seminar Speaker – Pavement Systems
Dr.M.W.Witczak
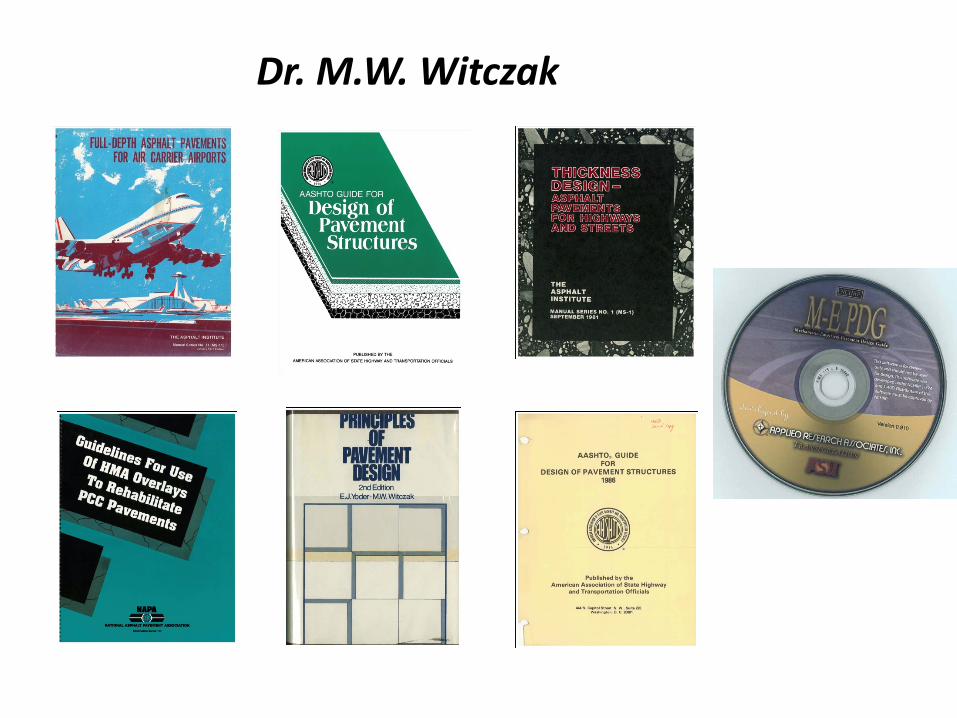
Dr. M.W. Witczak

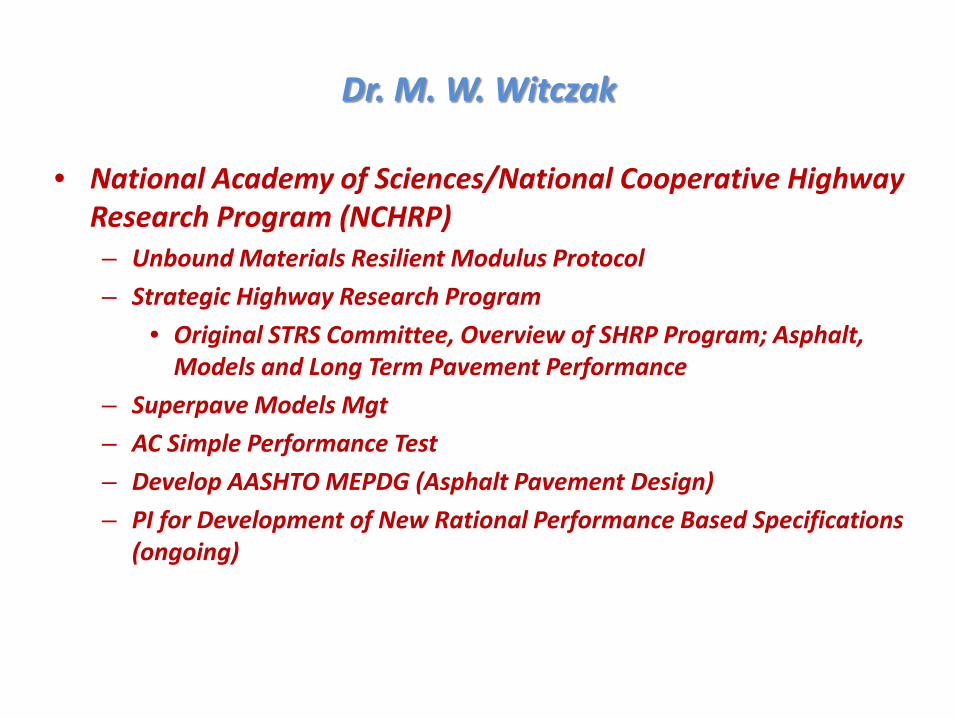
Dr. M. W. Witczak
• Consultant to Hundreds of Pavement Agencies-Countries – US Military (Airfields and Design Manuals) – FAA, FHWA, NAS, The Asphalt Institute, National Asphalt Pavement
Assn, State DOTS, Law Firms, Countries, Private Industry
• Awarded 18 Career Engineering/Construction Honors – Asphalt Institute Hall of Fame – AAPT Honorary Member – NAPA Kenyon Research Implementation Award – ENR Construction Men of the Year – USACE US Army Commendation Medal – Military Construction – TRB DIstinquished T. Deen Transportation Lecture – Best Technical Papers - TRB (2), AAPT, ASCE – University of Maryland- Witczak Graduate Scholarship Award
Dr. M. W. Witczak
• National Academy of Sciences/National Cooperative Highway Research Program (NCHRP) – Unbound Materials Resilient Modulus Protocol – Strategic Highway Research Program
• Original STRS Committee, Overview of SHRP Program; Asphalt, Models and Long Term Pavement Performance
– Superpave Models Mgt – AC Simple Performance Test – Develop AASHTO MEPDG (Asphalt Pavement Design) – PI for Development of New Rational Performance Based Specifications
(ongoing)

Speaker Introduction

Invited Seminar Speaker- Pavement Environmental Specialist
Dr. Claudia Zapata
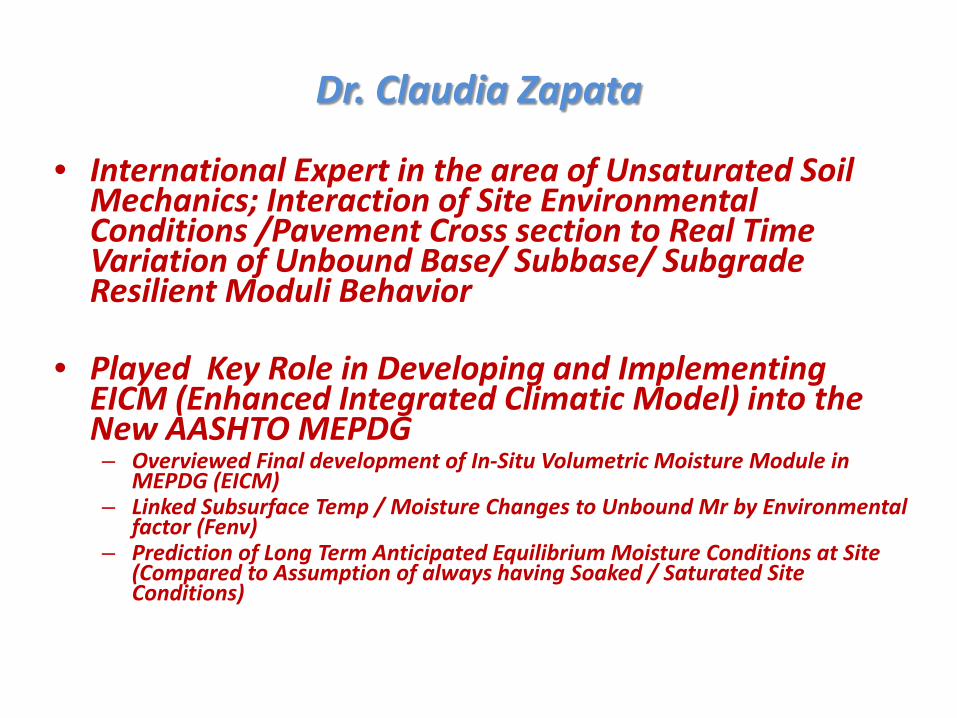
Dr. Claudia Zapata
• International Expert in the area of Unsaturated Soil Mechanics; Interaction of Site Environmental Conditions /Pavement Cross section to Real Time Variation of Unbound Base/ Subbase/ Subgrade Resilient Moduli Behavior
• Played Key Role in Developing and Implementing EICM (Enhanced Integrated Climatic Model) into the New AASHTO MEPDG – Overviewed Final development of In-Situ Volumetric Moisture Module in
MEPDG (EICM) – Linked Subsurface Temp / Moisture Changes to Unbound Mr by Environmental
factor (Fenv) – Prediction of Long Term Anticipated Equilibrium Moisture Conditions at Site
(Compared to Assumption of always having Soaked / Saturated Site Conditions)

Dr. Claudia Zapata
• Expert in Advanced Laboratory Characterization of Unbound Materials – Soil Water Characteristic Curves (SWCC) – Matric Suction – Non-Linear Mr Incorporating Stress States and Soil Suction
• Developer of Most Comprehensive Data Base in the World of SWCC Parameters – US – NAS Study Based upon Historic USDA and BPR (FHWA) Studies – 31,000+ Soils in US (Entire Country) – Categorizes Fredlund / Xing SWCC Regression Coefficients of SWCC
Equation
Pavement Evaluation
Aircraft Traffic Considerations
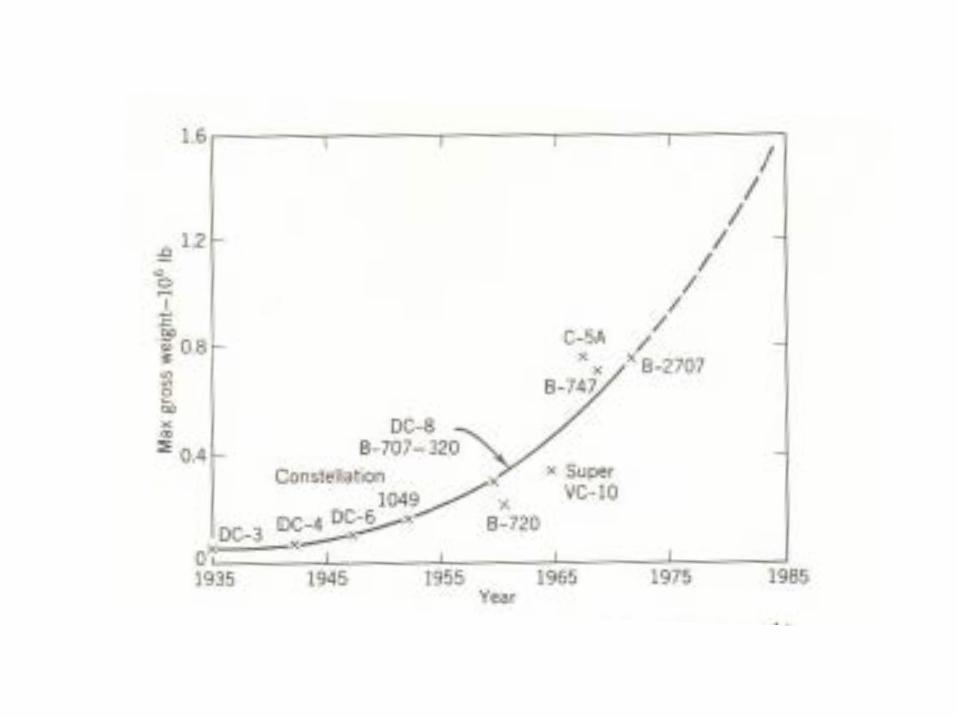
Pavement Evaluation
Historic Growth Projections in Aircraft Gross Weight
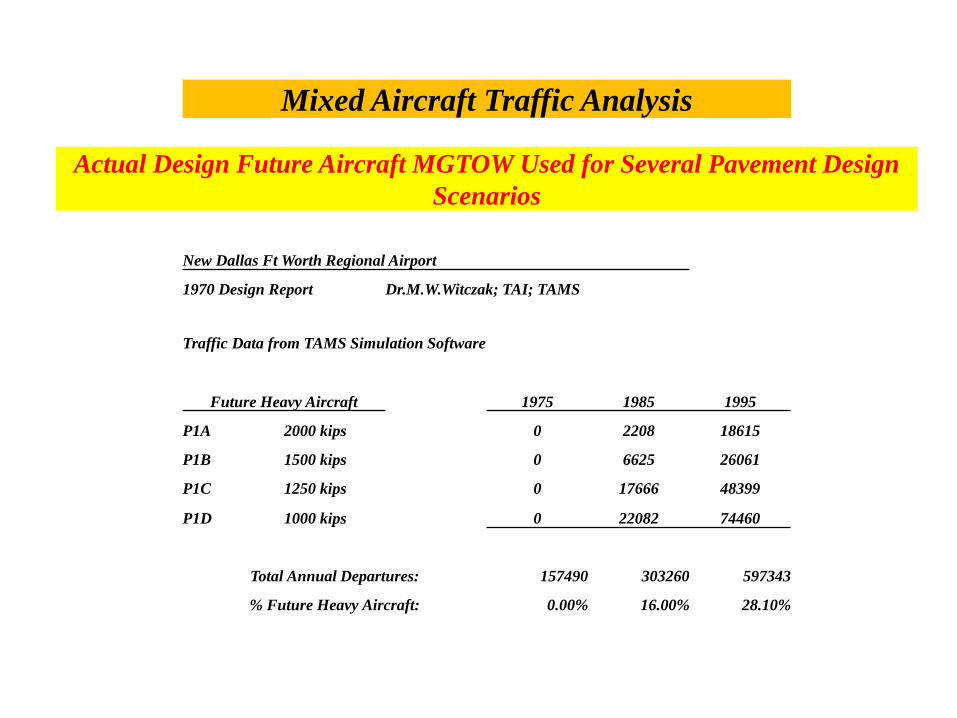
Mixed Aircraft Traffic Analysis
Actual Design Future Aircraft MGTOW Used for Several Pavement Design Scenarios
New Dallas Ft Worth Regional Airport
1970 Design Report Dr.M.W.Witczak; TAI; TAMS
Traffic Data from TAMS Simulation Software
Future Heavy Aircraft 1975 1985 1995
P1A 2000 kips 0 2208 18615
P1B 1500 kips 0 6625 26061
P1C 1250 kips 0 17666 48399
P1D 1000 kips 0 22082 74460
Total Annual Departures: 157490 303260 597343
% Future Heavy Aircraft: 0.00% 16.00% 28.10%
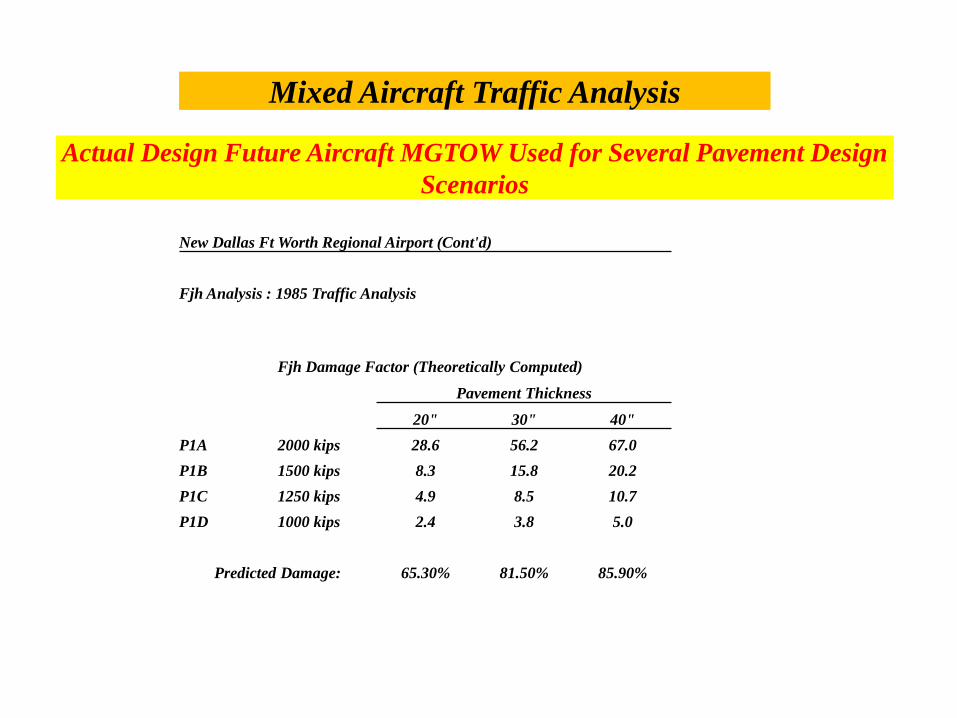
Mixed Aircraft Traffic Analysis
Actual Design Future Aircraft MGTOW Used for Several Pavement Design Scenarios
New Dallas Ft Worth Regional Airport (Cont'd)
Fjh Analysis : 1985 Traffic Analysis
Fjh Damage Factor (Theoretically Computed) Pavement Thickness
20" 30" 40" P1A 2000 kips 28.6 56.2 67.0 P1B 1500 kips 8.3 15.8 20.2 P1C 1250 kips 4.9 8.5 10.7 P1D 1000 kips 2.4 3.8 5.0
Predicted Damage: 65.30% 81.50% 85.90%
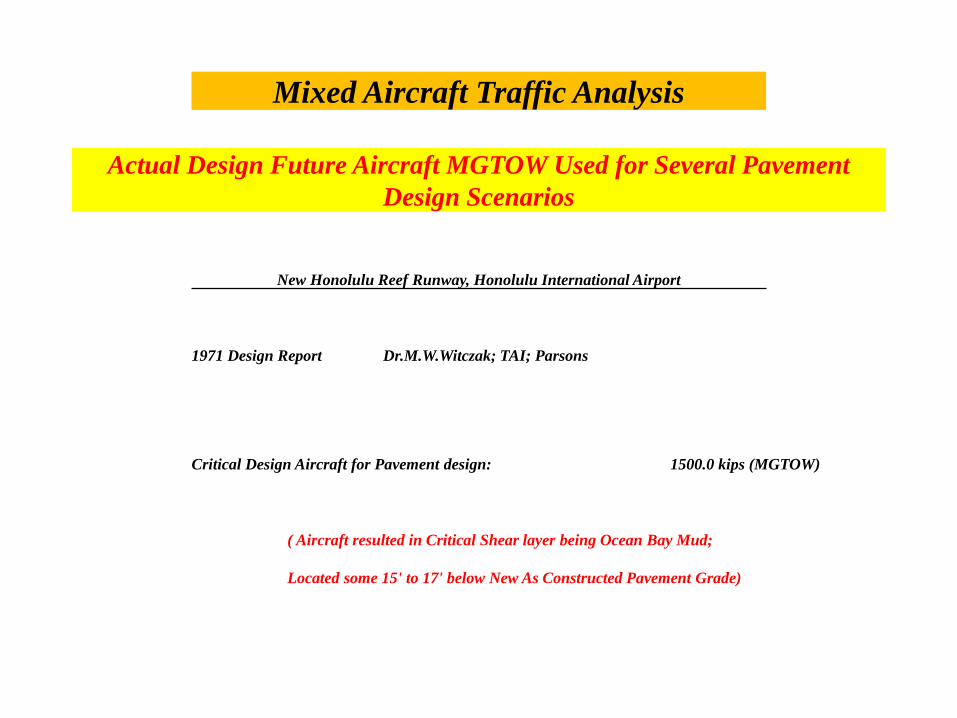
Mixed Aircraft Traffic Analysis
Actual Design Future Aircraft MGTOW Used for Several Pavement Design Scenarios
New Honolulu Reef Runway, Honolulu International Airport
1971 Design Report Dr.M.W.Witczak; TAI; Parsons
Critical Design Aircraft for Pavement design: 1500.0 kips (MGTOW)
( Aircraft resulted in Critical Shear layer being Ocean Bay Mud;
Located some 15' to 17' below New As Constructed Pavement Grade)
Pavement Evaluation
New Very Large Air Carrier Aircraft
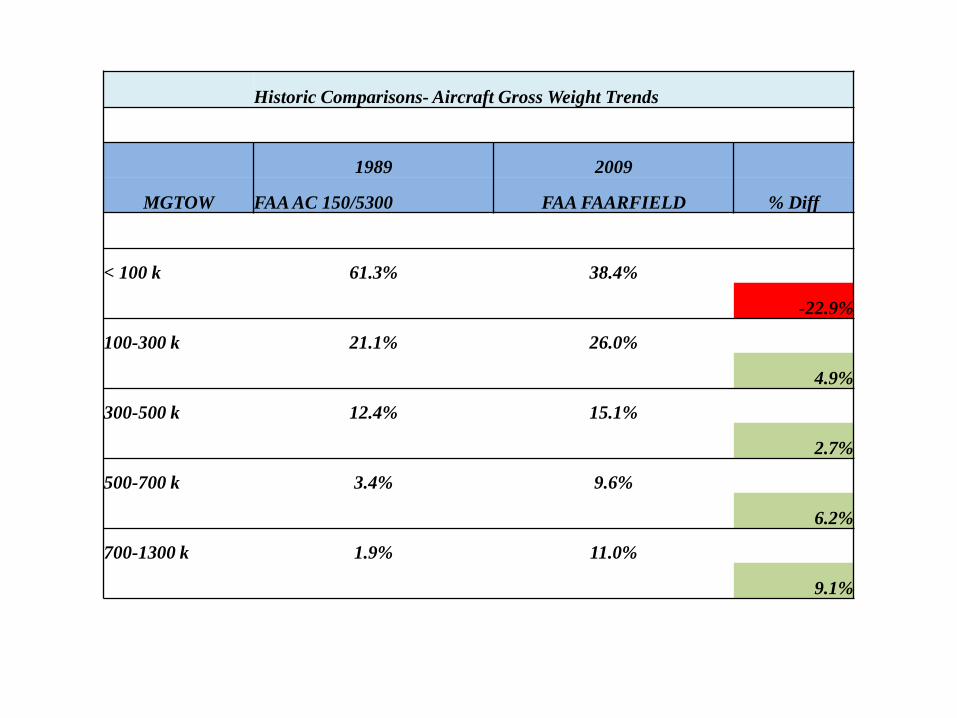
Historic Comparisons- Aircraft Gross Weight Trends
1989 2009
MGTOW FAA AC 150/5300 FAA FAARFIELD % Diff
< 100 k 61.3% 38.4%
-22.9%
100-300 k 21.1% 26.0%
4.9%
300-500 k 12.4% 15.1%
2.7%
500-700 k 3.4% 9.6%
6.2%
700-1300 k 1.9% 11.0%
9.1%
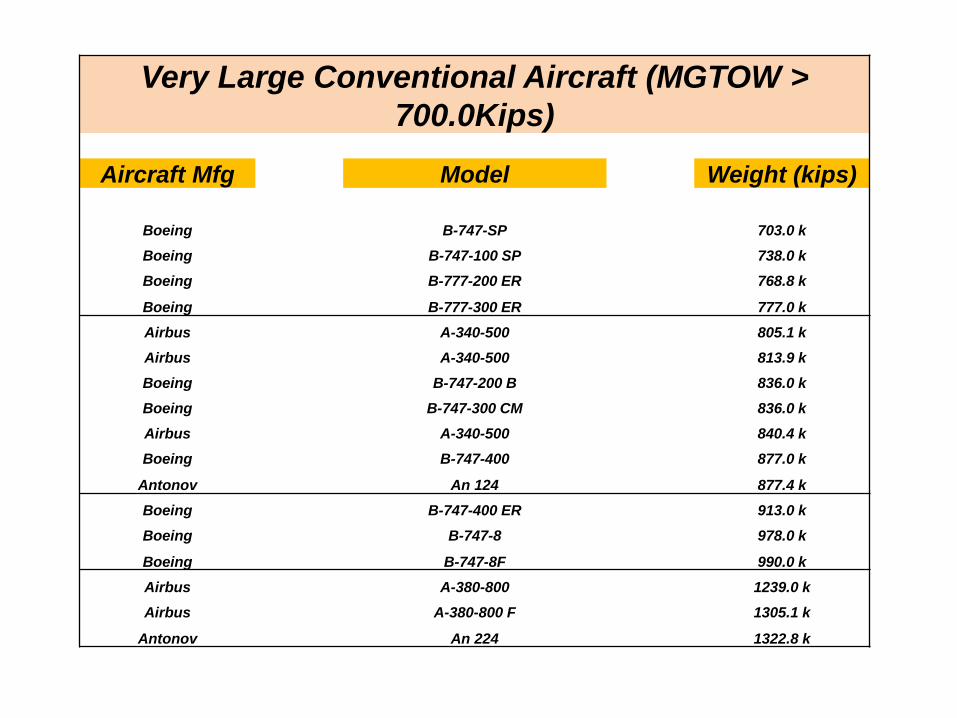
Very Large Conventional Aircraft (MGTOW > 700.0Kips)
Aircraft Mfg Model Weight (kips)
Boeing B-747-SP 703.0 k Boeing B-747-100 SP 738.0 k Boeing B-777-200 ER 768.8 k
Boeing B-777-300 ER 777.0 k Airbus A-340-500 805.1 k Airbus A-340-500 813.9 k Boeing B-747-200 B 836.0 k Boeing B-747-300 CM 836.0 k Airbus A-340-500 840.4 k Boeing B-747-400 877.0 k
Antonov An 124 877.4 k Boeing B-747-400 ER 913.0 k Boeing B-747-8 978.0 k
Boeing B-747-8F 990.0 k Airbus A-380-800 1239.0 k Airbus A-380-800 F 1305.1 k
Antonov An 224 1322.8 k

Pavement Evaluation
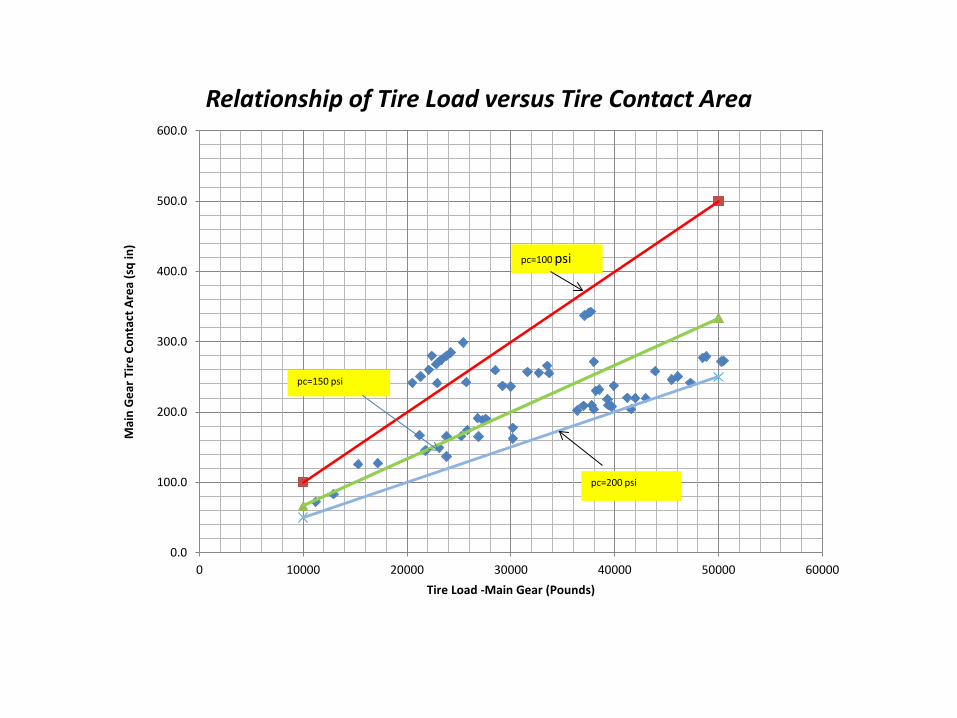
Tire Load and Tire Contact Pressure Pavement Considerations
0.0
100.0
200.0
300.0
400.0
500.0
600.0
0 10000 20000 30000 40000 50000 60000
Mai
n G
ear T
ire C
onta
ct A
rea
(sq
in)
Tire Load -Main Gear (Pounds)
Relationship of Tire Load versus Tire Contact Area
pc=100 psi
pc=150 psi
pc=200 psi
0.0
50.0
100.0
150.0
200.0
250.0
300.0
350.0
400.0
0 20000 40000 60000 80000
Mai
n G
ear T
ire C
onta
ct A
rea
(sq
in)
Tire Load -Main Gear (Pounds)
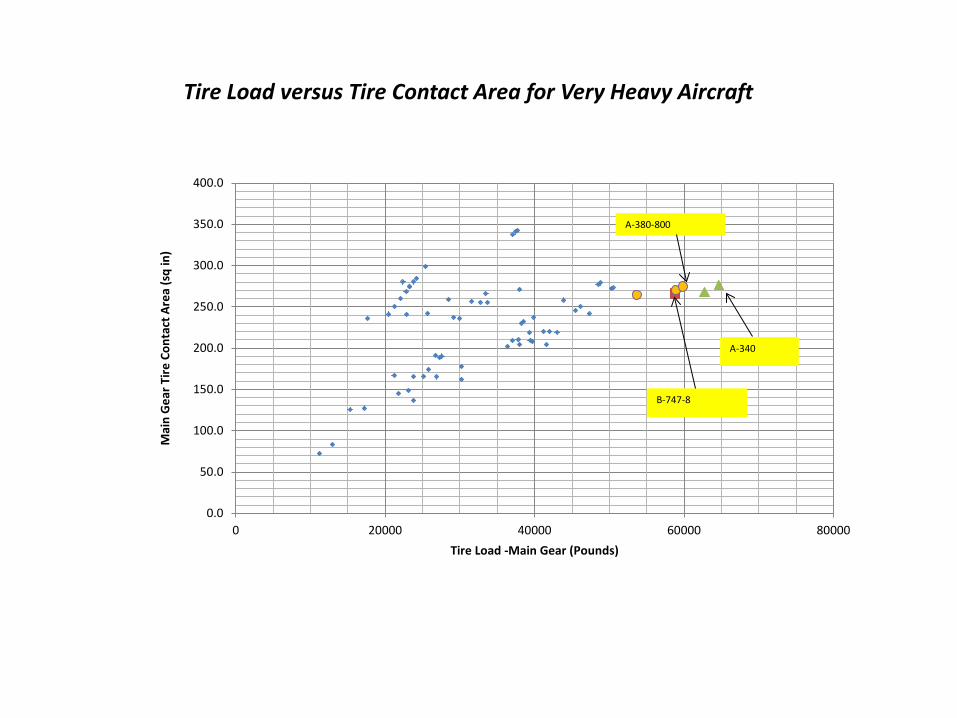
Tire Load versus Tire Contact Area for Very Heavy Aircraft
A-340
B-747-8
A-380-800
0
10
20
30
40
50
60
0 50 100 150 200 250 300
DEpt
h W
ithin
Pav
emen
t Sys
tem
(inc
hes)
Vertical Stress (psi)
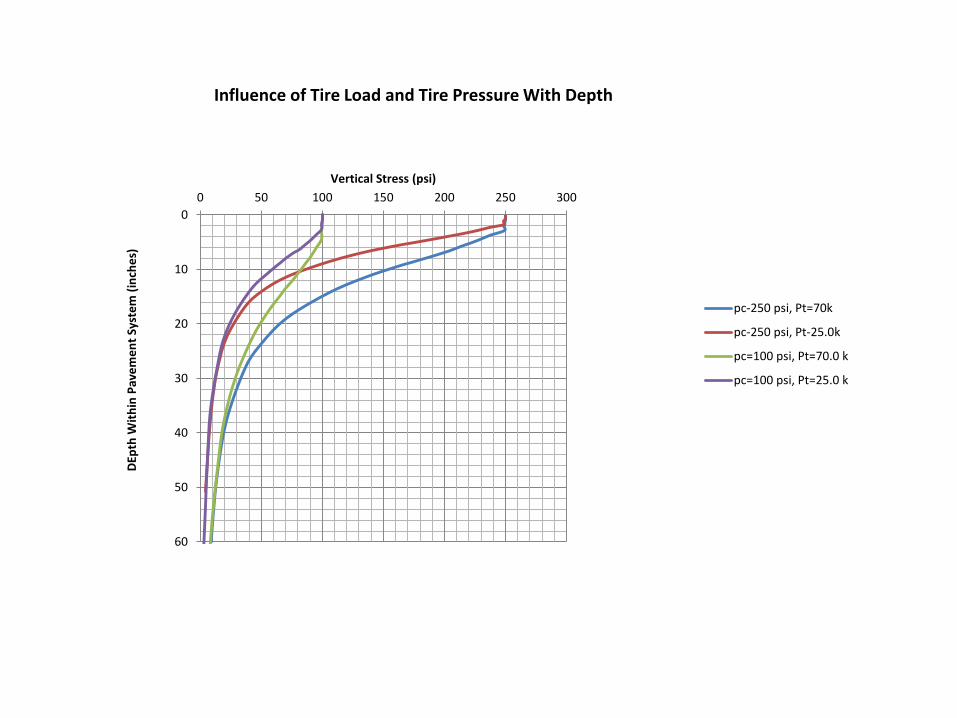
Influence of Tire Load and Tire Pressure With Depth
pc-250 psi, Pt=70k
pc-250 psi, Pt-25.0k
pc=100 psi, Pt=70.0 k
pc=100 psi, Pt=25.0 k
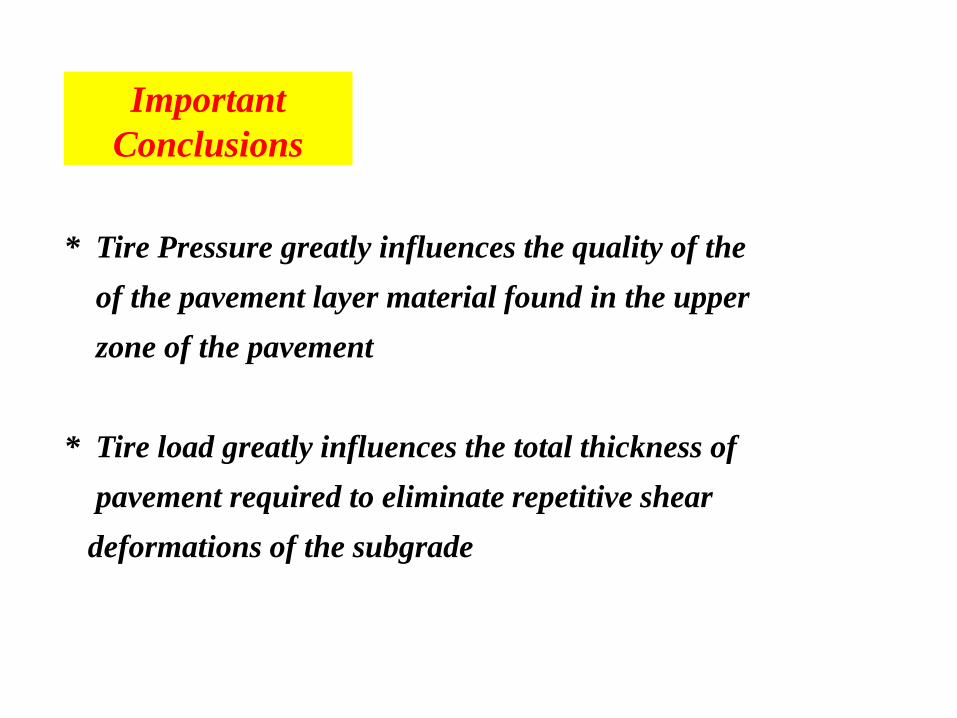
Important Conclusions
* Tire Pressure greatly influences the quality of the of the pavement layer material found in the upper zone of the pavement
* Tire load greatly influences the total thickness of pavement required to eliminate repetitive shear deformations of the subgrade

Pavement Evaluation
Types of Aircraft Gear Arrangements and Tire Configurations
Various Types of Aircraft Gear Assemblies
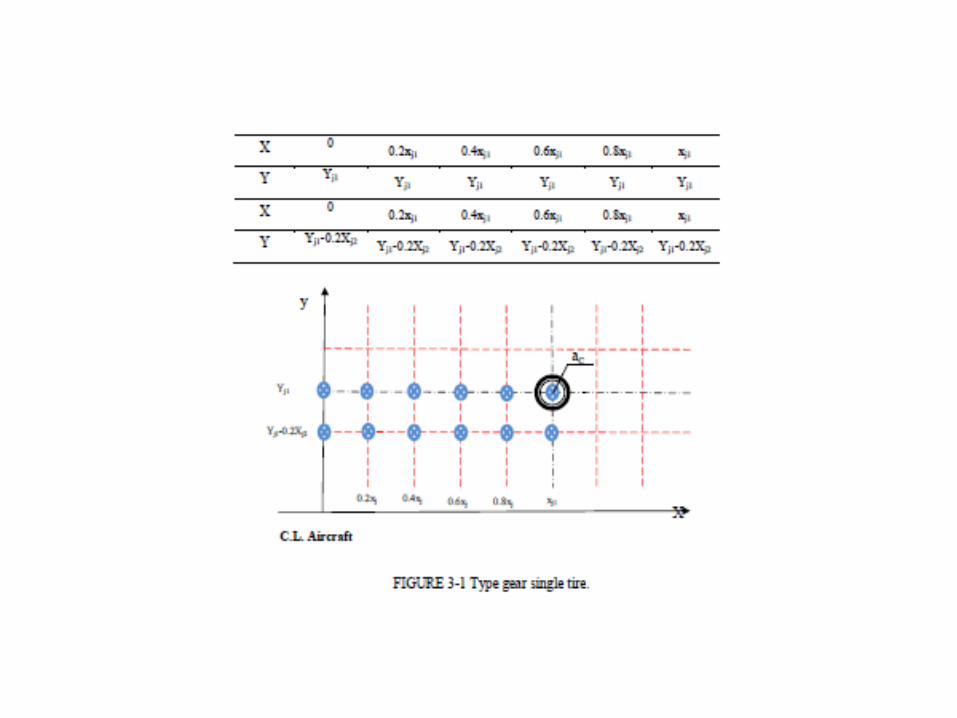
Geometric Coordinates for Locating Bogey (Truck) Gears
L-500 Aircraft Characteristic Summary
Pavement Evaluation
Mixed Traffic Damage Analysis (Technology has bypassed “Design Critical Aircraft” and has
been replaced by Cumulative Damage due to entire Traffic Mix)
Mixed Aircraft Traffic Analysis
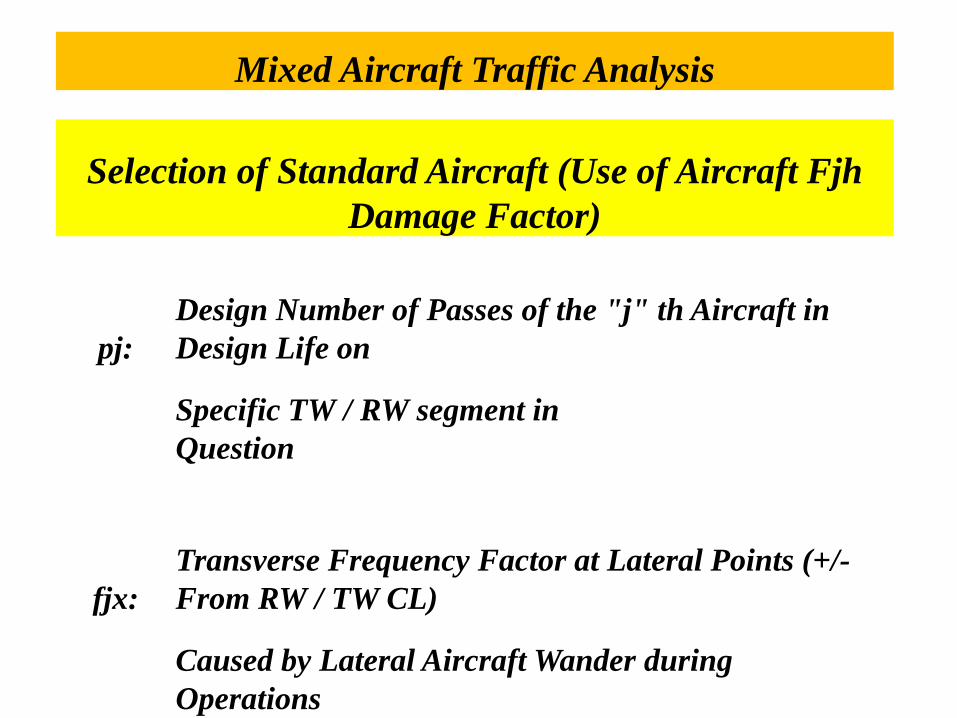
Selection of Standard Aircraft (Use of Aircraft Fjh Damage Factor)
pj: Design Number of Passes of the "j" th Aircraft in Design Life on
Specific TW / RW segment in Question
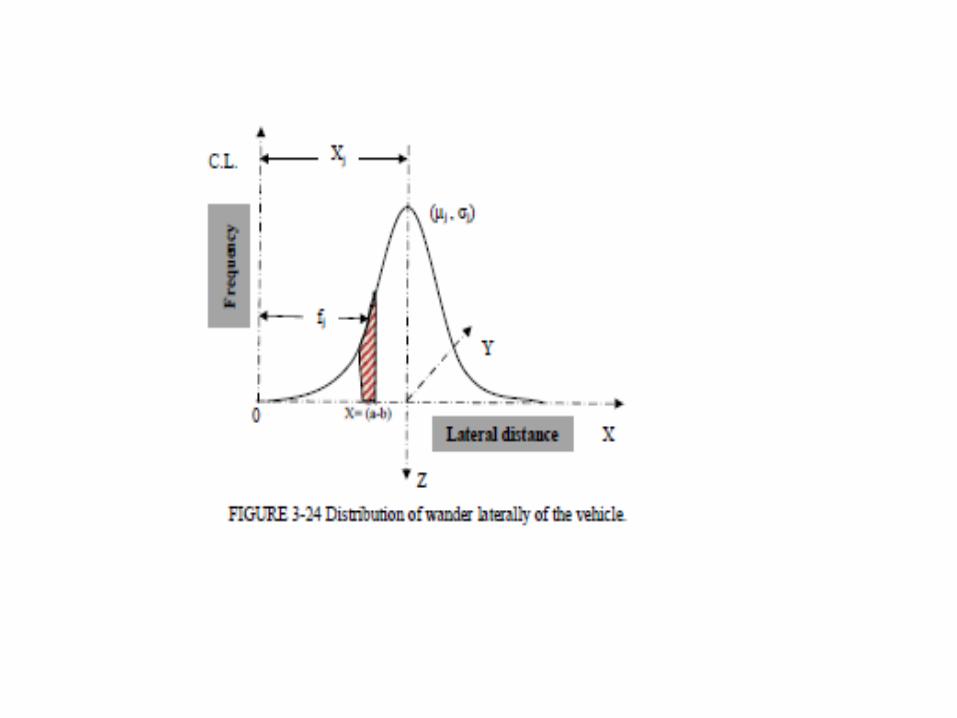
fjx: Transverse Frequency Factor at Lateral Points (+/- From RW / TW CL)
Caused by Lateral Aircraft Wander during Operations
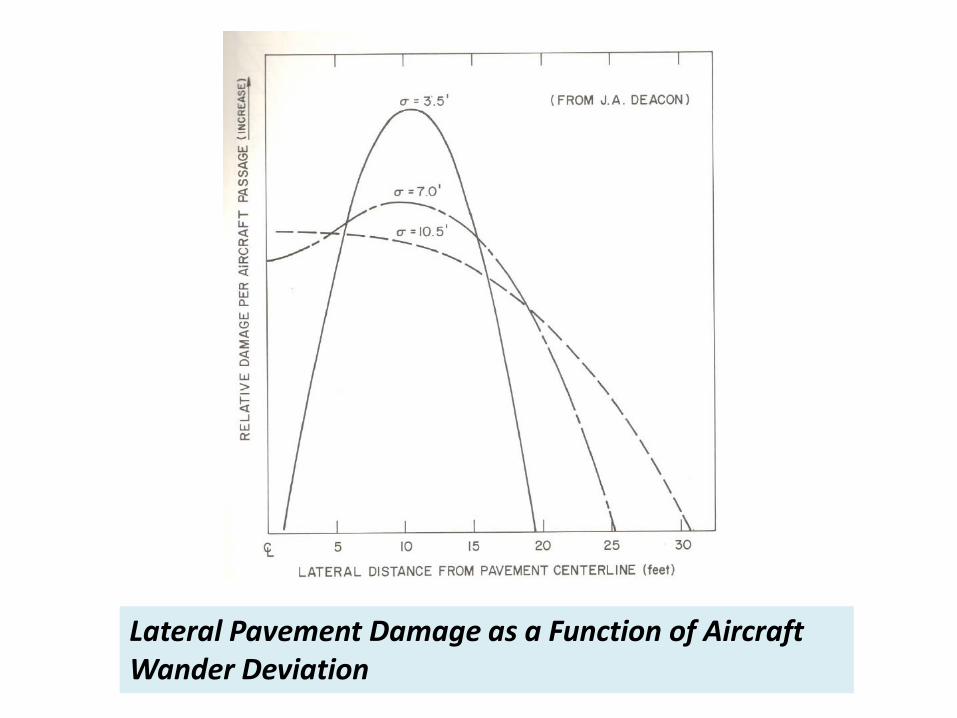
Lateral Pavement Damage as a Function of Aircraft Wander Deviation
Mixed Aircraft Traffic Analysis
Selection of Standard Aircraft (Use of Aircraft Fjh Damage Factor)
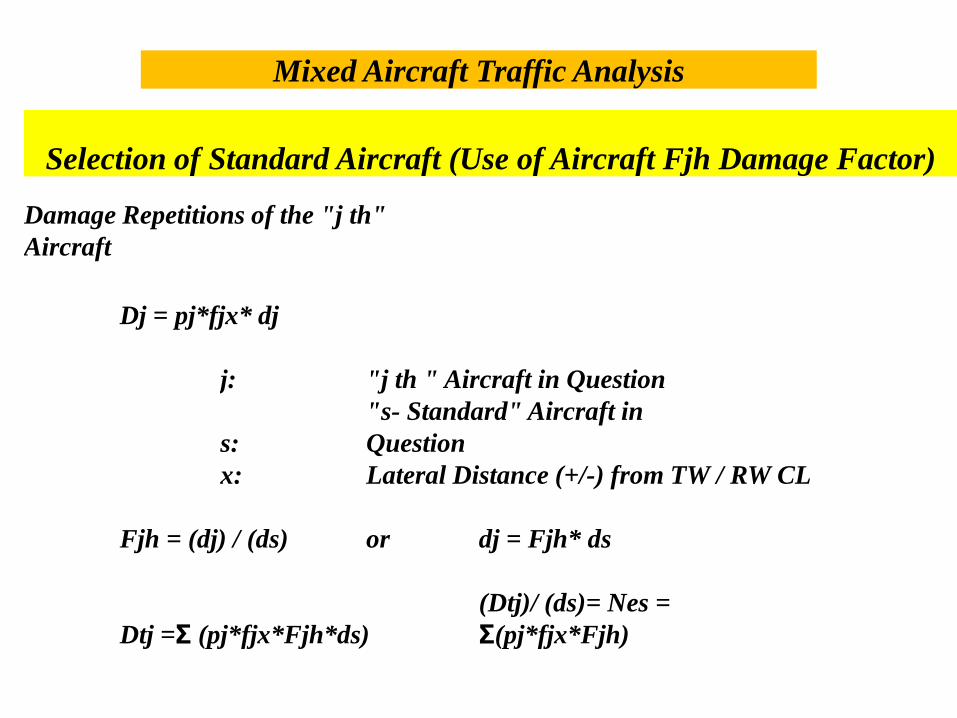
Damage Repetitions of the "j th" Aircraft
Dj = pj*fjx* dj
j: "j th " Aircraft in Question
s: "s- Standard" Aircraft in Question
x: Lateral Distance (+/-) from TW / RW CL
Fjh = (dj) / (ds) or dj = Fjh* ds
Dtj =Σ (pj*fjx*Fjh*ds) (Dtj)/ (ds)= Nes = Σ(pj*fjx*Fjh)
Mixed Aircraft Traffic Analysis
Selection of Standard Aircraft (Use of Aircraft Fjh Damage Factor)
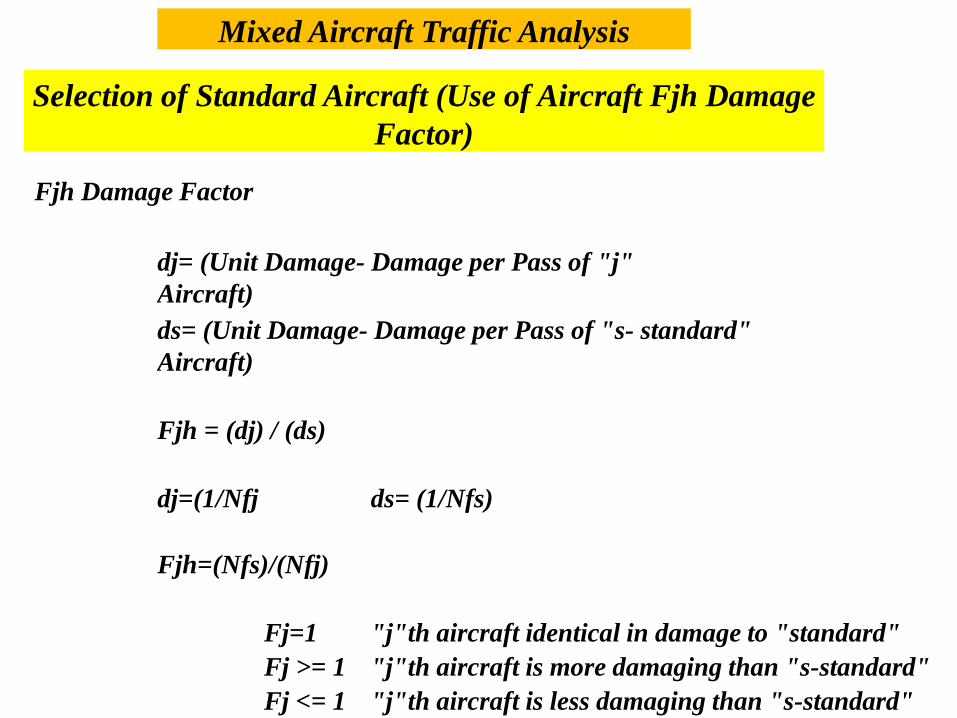
Fjh Damage Factor
dj= (Unit Damage- Damage per Pass of "j" Aircraft) ds= (Unit Damage- Damage per Pass of "s- standard" Aircraft)
Fjh = (dj) / (ds)
dj=(1/Nfj ds= (1/Nfs)
Fjh=(Nfs)/(Nfj)
Fj=1 "j"th aircraft identical in damage to "standard" Fj >= 1 "j"th aircraft is more damaging than "s-standard" Fj <= 1 "j"th aircraft is less damaging than "s-standard"
Mixed Aircraft Traffic Analysis
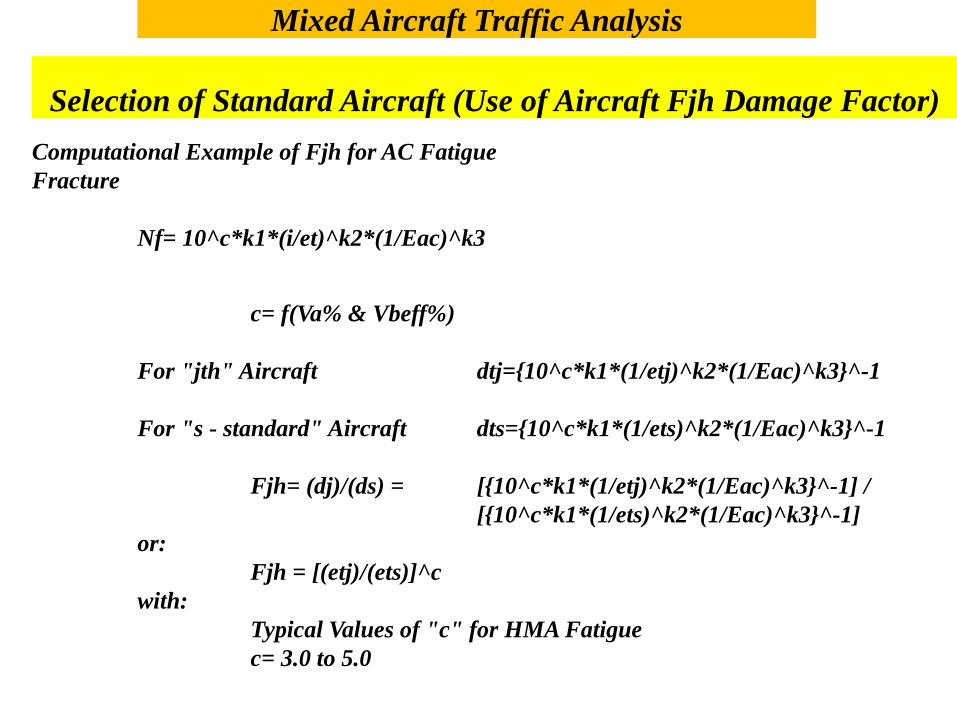
Selection of Standard Aircraft (Use of Aircraft Fjh Damage Factor) Computational Example of Fjh for AC Fatigue Fracture
Nf= 10^c*k1*(i/et)^k2*(1/Eac)^k3
c= f(Va% & Vbeff%)
For "jth" Aircraft dtj={10^c*k1*(1/etj)^k2*(1/Eac)^k3}^-1
For "s - standard" Aircraft dts={10^c*k1*(1/ets)^k2*(1/Eac)^k3}^-1
Fjh= (dj)/(ds) = [{10^c*k1*(1/etj)^k2*(1/Eac)^k3}^-1] / [{10^c*k1*(1/ets)^k2*(1/Eac)^k3}^-1]
or: Fjh = [(etj)/(ets)]^c
with: Typical Values of "c" for HMA Fatigue c= 3.0 to 5.0
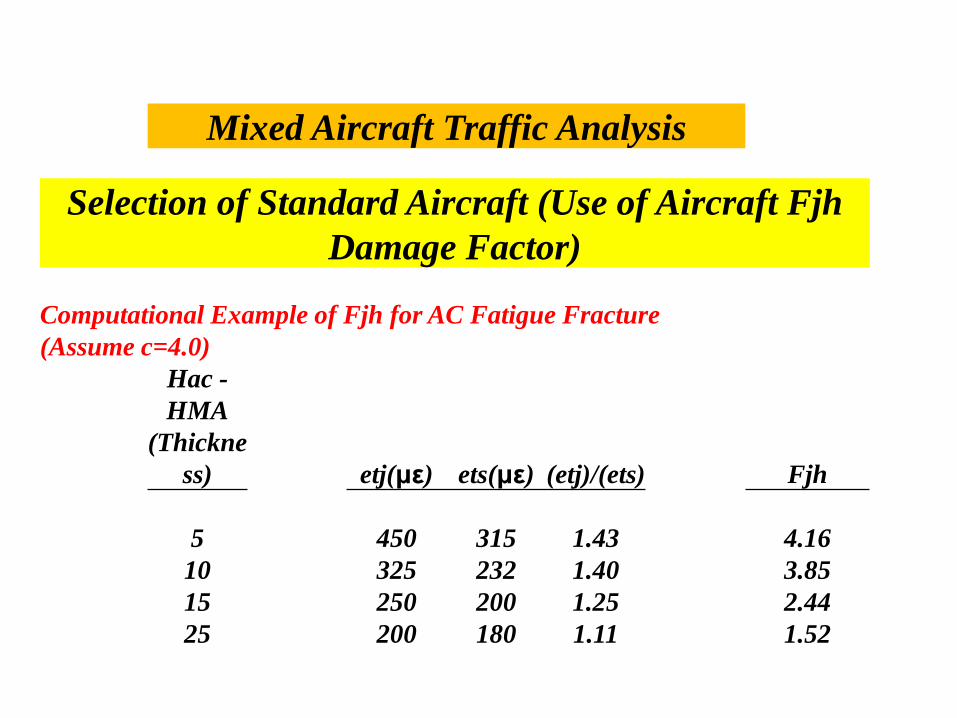
Mixed Aircraft Traffic Analysis
Selection of Standard Aircraft (Use of Aircraft Fjh Damage Factor)
Computational Example of Fjh for AC Fatigue Fracture (Assume c=4.0)
Hac -HMA
(Thickness) etj(με) ets(με) (etj)/(ets) Fjh
5 450 315 1.43 4.16 10 325 232 1.40 3.85 15 250 200 1.25 2.44 25 200 180 1.11 1.52
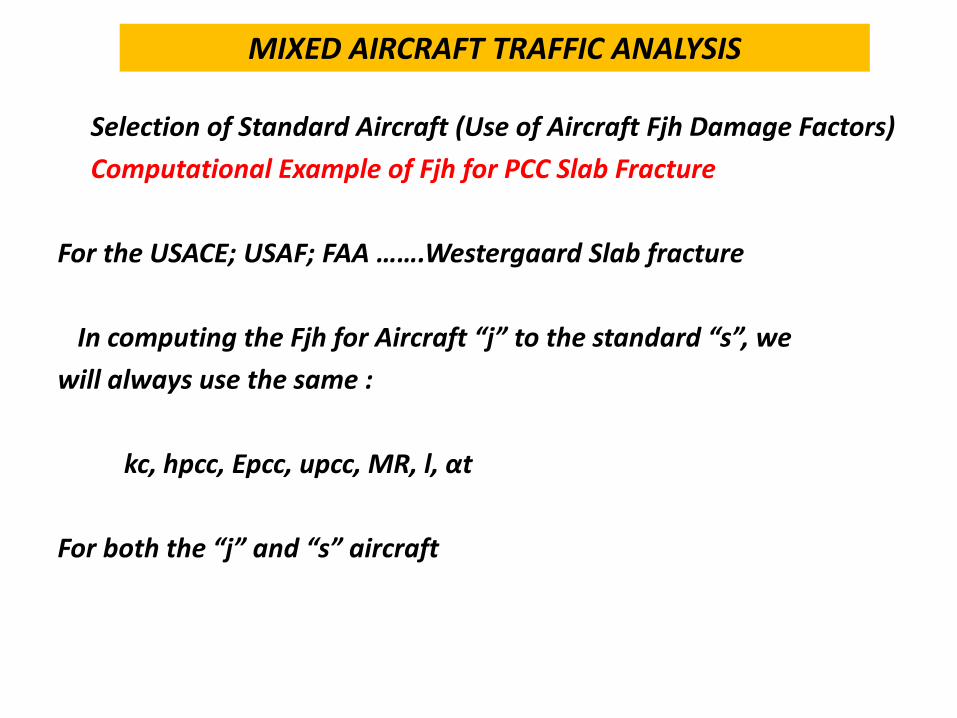
MIXED AIRCRAFT TRAFFIC ANALYSIS
Selection of Standard Aircraft (Use of Aircraft Fjh Damage Factors) Computational Example of Fjh for PCC Slab Fracture For the USACE; USAF; FAA …….Westergaard Slab fracture In computing the Fjh for Aircraft “j” to the standard “s”, we will always use the same : kc, hpcc, Epcc, upcc, MR, l, αt For both the “j” and “s” aircraft
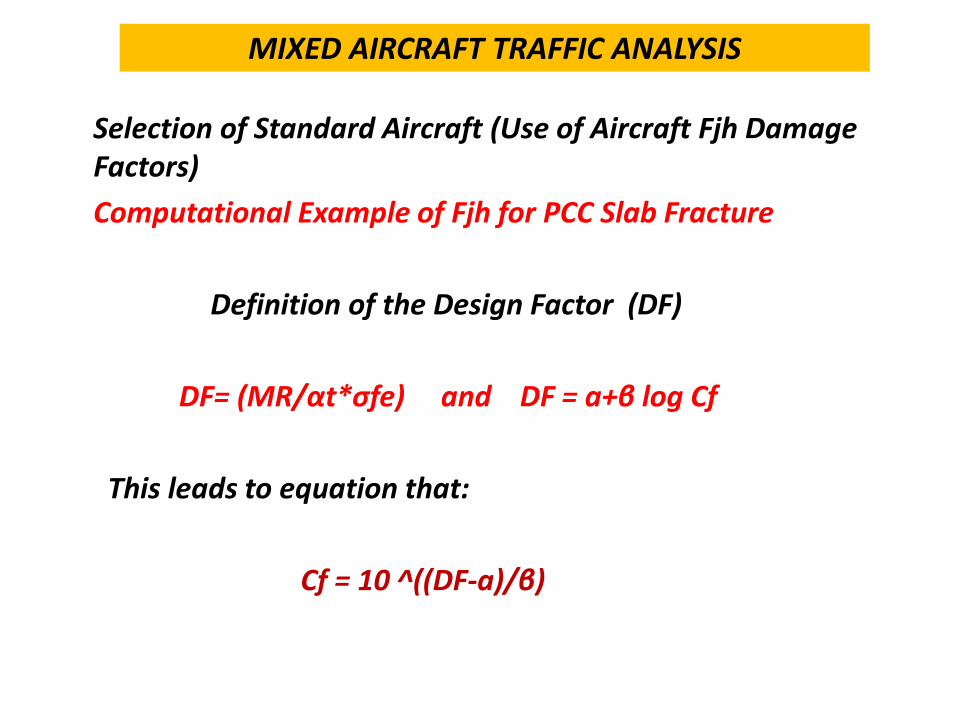
MIXED AIRCRAFT TRAFFIC ANALYSIS
Selection of Standard Aircraft (Use of Aircraft Fjh Damage Factors)
Computational Example of Fjh for PCC Slab Fracture Definition of the Design Factor (DF) DF= (MR/αt*σfe) and DF = a+β log Cf This leads to equation that: Cf = 10 ^((DF-a)/β)
MIXED AIRCRAFT TRAFFIC ANALYSIS
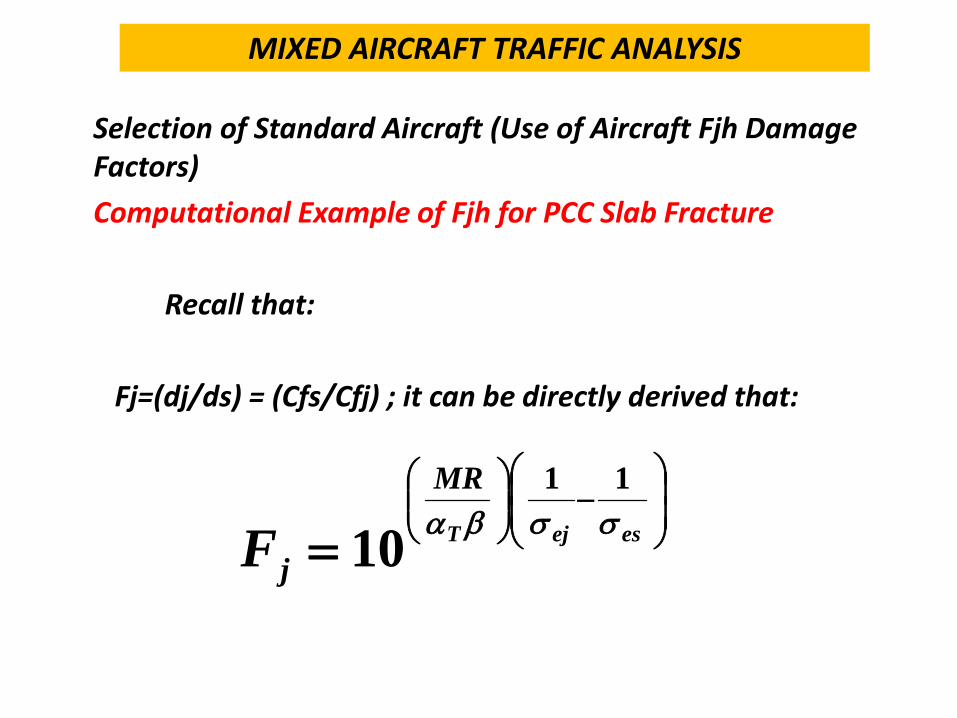
Selection of Standard Aircraft (Use of Aircraft Fjh Damage Factors)
Computational Example of Fjh for PCC Slab Fracture Recall that: Fj=(dj/ds) = (Cfs/Cfj) ; it can be directly derived that:
−
= esejT
MR
jF σσβα11
10
MIXED AIRCRAFT TRAFFIC ANALYSIS
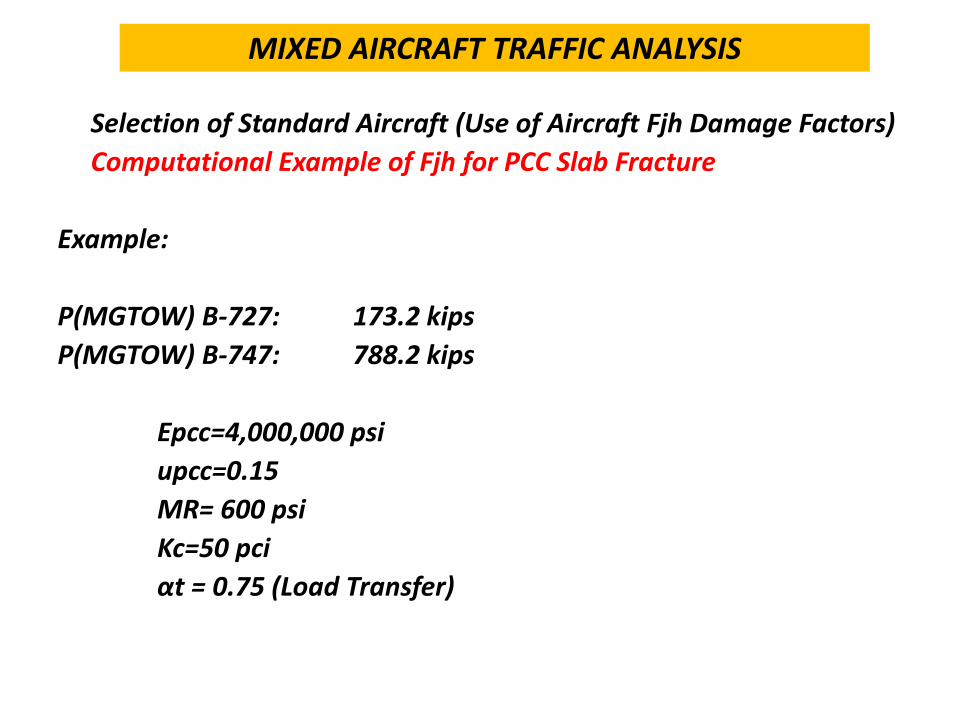
Selection of Standard Aircraft (Use of Aircraft Fjh Damage Factors) Computational Example of Fjh for PCC Slab Fracture Example: P(MGTOW) B-727: 173.2 kips P(MGTOW) B-747: 788.2 kips Epcc=4,000,000 psi upcc=0.15 MR= 600 psi Kc=50 pci αt = 0.75 (Load Transfer)
MIXED AIRCRAFT TRAFFIC ANALYSIS
Selection of Standard Aircraft (Use of Aircraft Fjh Damage Factors)
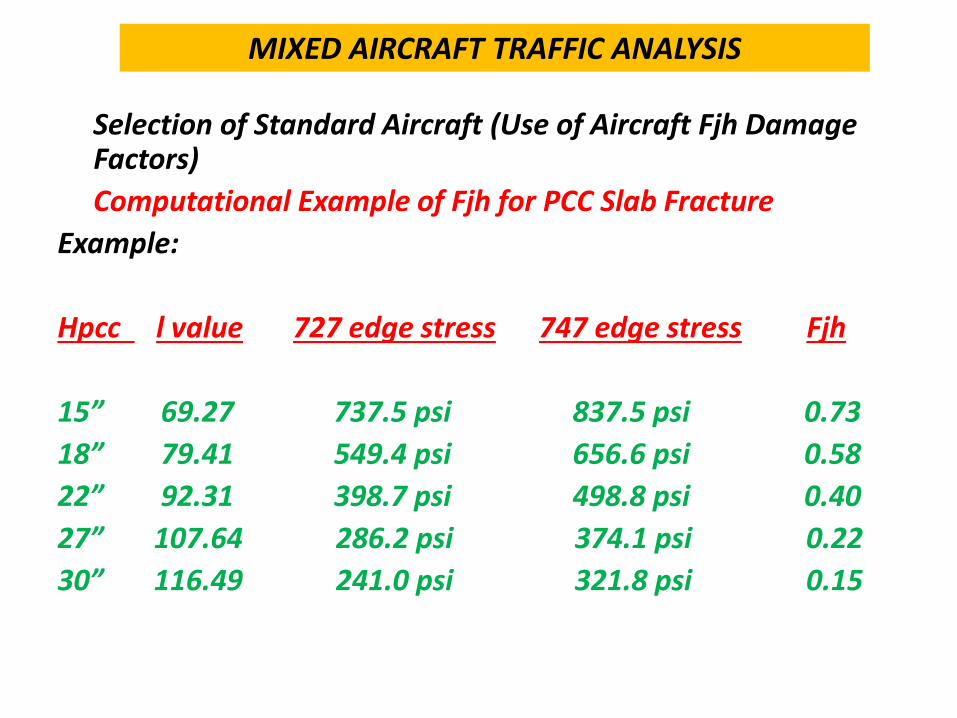
Computational Example of Fjh for PCC Slab Fracture Example: Hpcc l value 727 edge stress 747 edge stress Fjh 15” 69.27 737.5 psi 837.5 psi 0.73 18” 79.41 549.4 psi 656.6 psi 0.58 22” 92.31 398.7 psi 498.8 psi 0.40 27” 107.64 286.2 psi 374.1 psi 0.22 30” 116.49 241.0 psi 321.8 psi 0.15
Mixed Aircraft Traffic Analysis
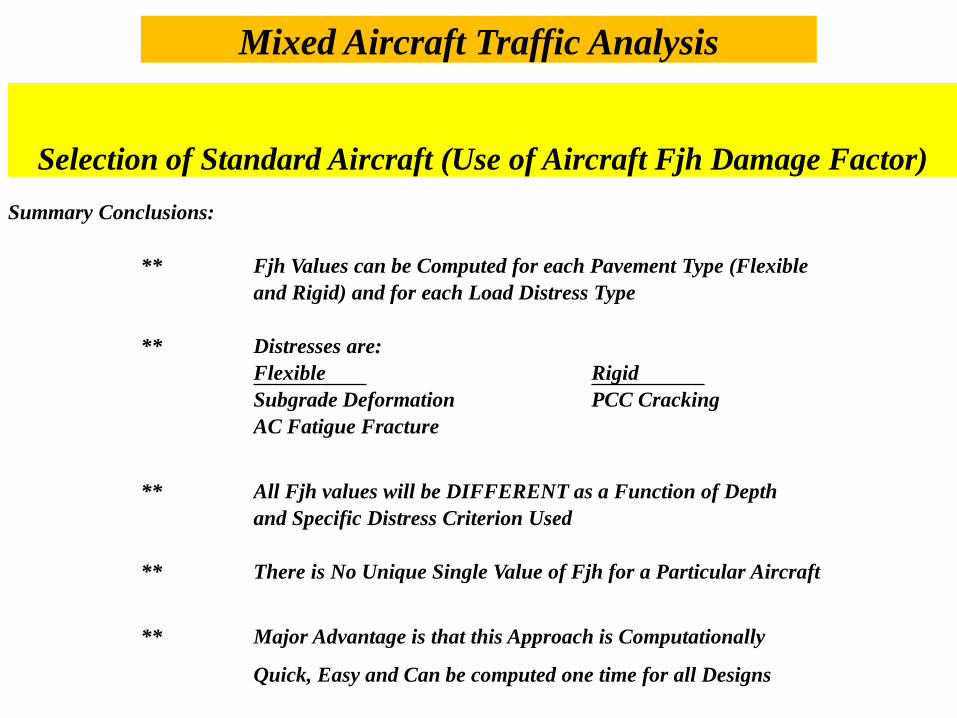
Selection of Standard Aircraft (Use of Aircraft Fjh Damage Factor) Summary Conclusions:
** Fjh Values can be Computed for each Pavement Type (Flexible and Rigid) and for each Load Distress Type
** Distresses are: Flexible Rigid Subgrade Deformation PCC Cracking AC Fatigue Fracture
** All Fjh values will be DIFFERENT as a Function of Depth and Specific Distress Criterion Used
** There is No Unique Single Value of Fjh for a Particular Aircraft
** Major Advantage is that this Approach is Computationally
Quick, Easy and Can be computed one time for all Designs
Mixed Aircraft Traffic Analysis
Direct Damage Computation for All Aircraft in Mix (No Use of Fjh Damage Factor)
** Directly Use Computation of Dj =f(x) for each Aircraft in the Mix
**
Computationally Very Extensive; but Solvable through Computerized Solution Methodology
** Each Damage Computation will be a Function of Specific Aircraft Type, Pavement Structure, Lateral Wander Effect, Failure Distress Criterion and Pavement Type
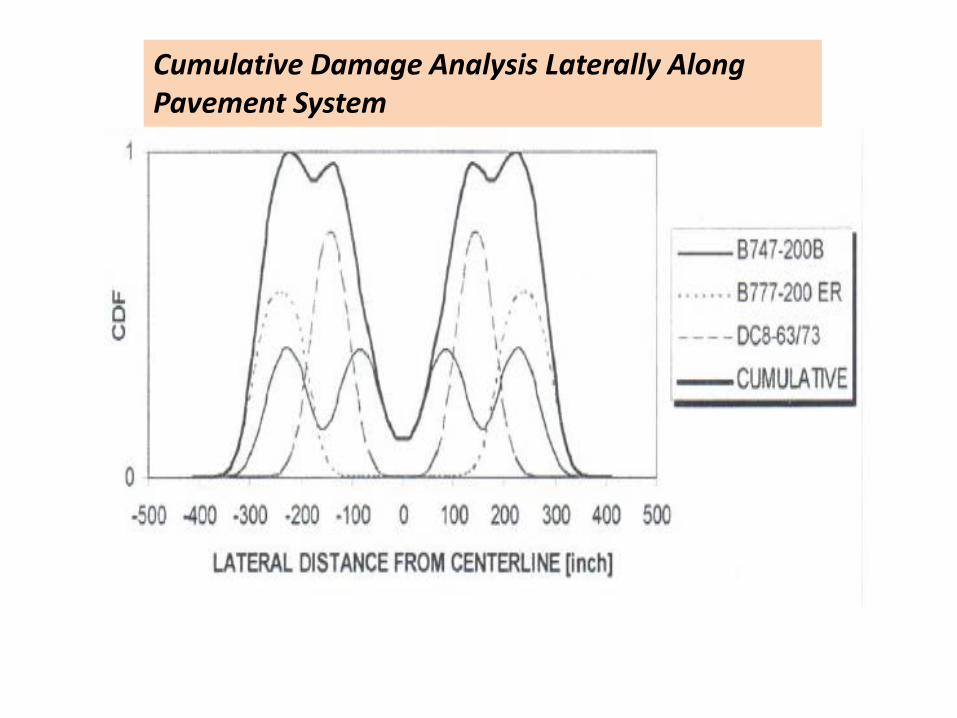
Cumulative Damage Analysis Laterally Along Pavement System
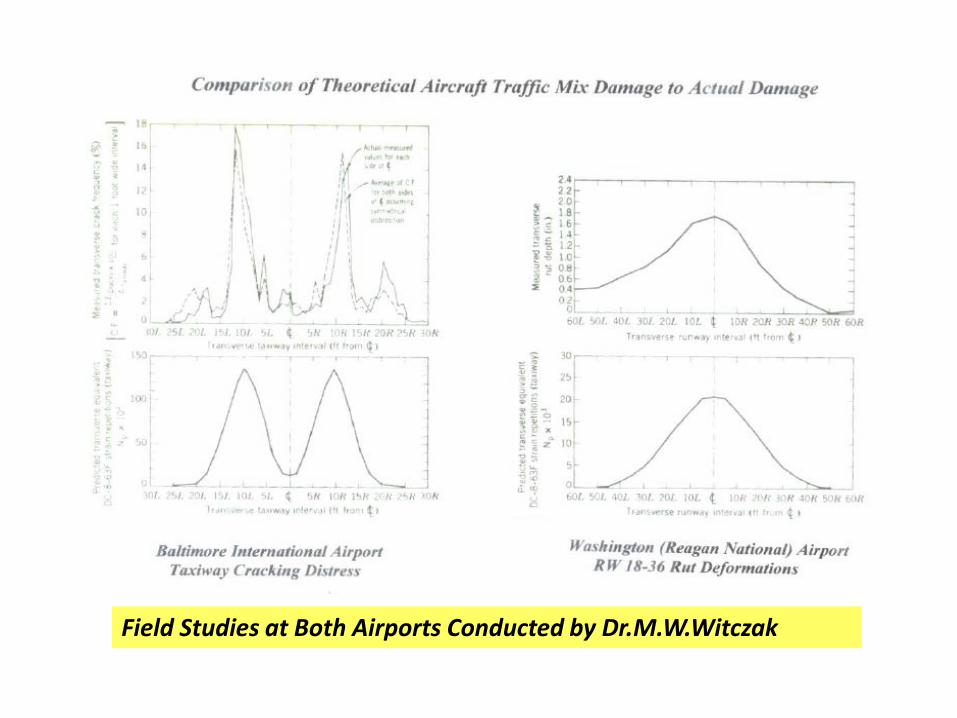
Field Studies at Both Airports Conducted by Dr.M.W.Witczak
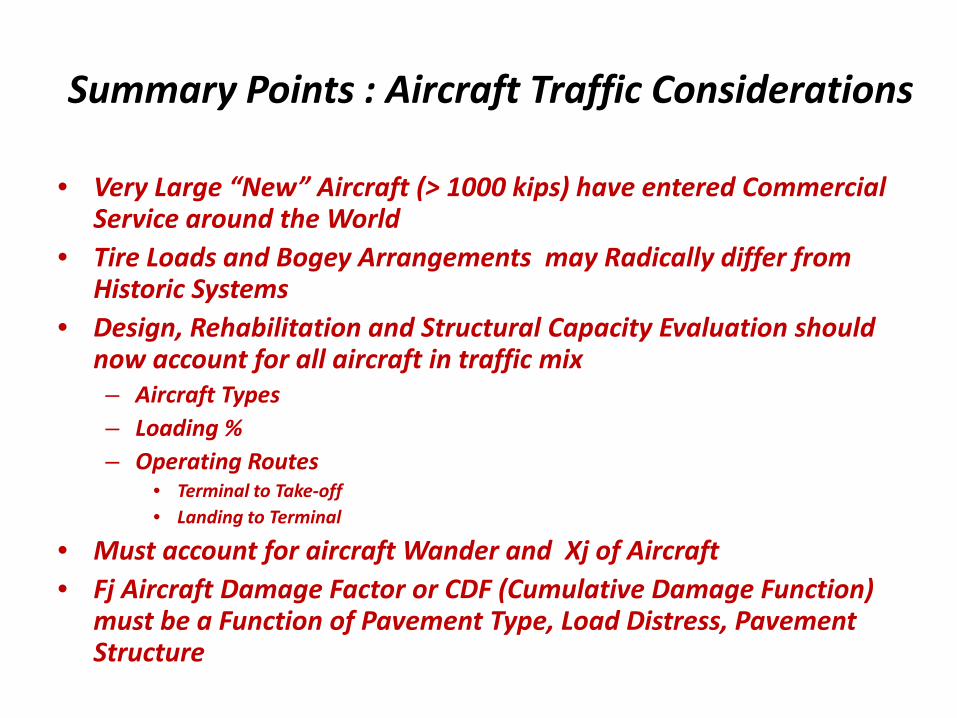
Summary Points : Aircraft Traffic Considerations
• Very Large “New” Aircraft (> 1000 kips) have entered Commercial Service around the World
• Tire Loads and Bogey Arrangements may Radically differ from Historic Systems
• Design, Rehabilitation and Structural Capacity Evaluation should now account for all aircraft in traffic mix – Aircraft Types – Loading % – Operating Routes
• Terminal to Take-off • Landing to Terminal
• Must account for aircraft Wander and Xj of Aircraft • Fj Aircraft Damage Factor or CDF (Cumulative Damage Function)
must be a Function of Pavement Type, Load Distress, Pavement Structure

Variability and its Impact Upon Reliability
The Critical Importance of Using Statistics and Probability in Pavement Engineering
Decisions
Significance & Use of Different Reliabilities for Given Model’s Use
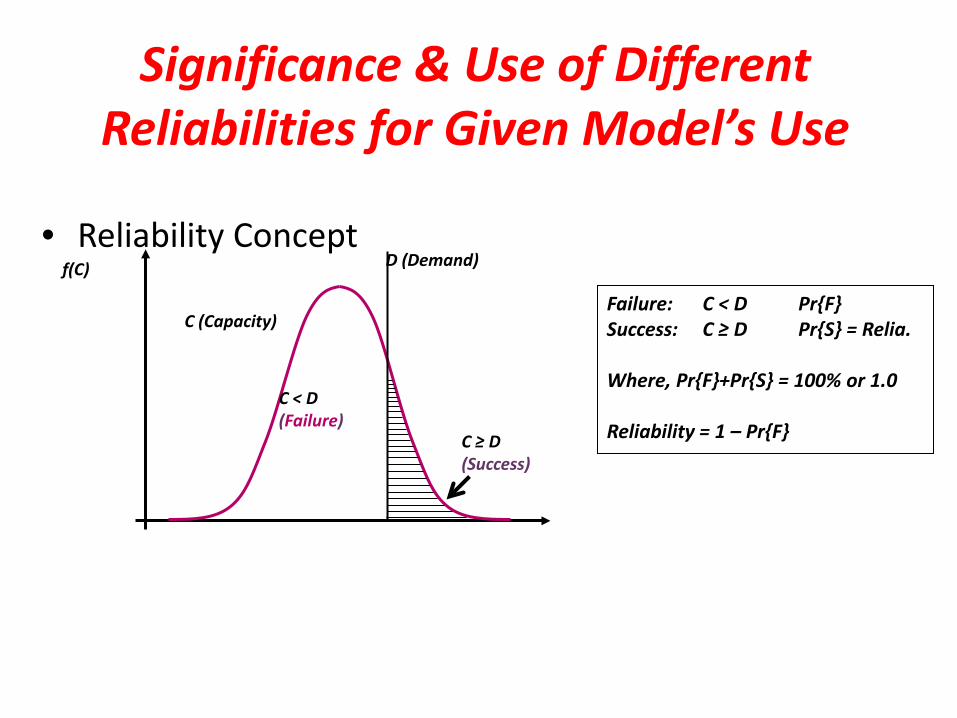
• Reliability Concept
C ≥ D (Success)
C (Capacity)
C < D (Failure)
f(C) D (Demand)
Failure: C < D Pr{F} Success: C ≥ D Pr{S} = Relia. Where, Pr{F}+Pr{S} = 100% or 1.0 Reliability = 1 – Pr{F}
Significance & Use of Different Reliabilities for Given Model’s Use
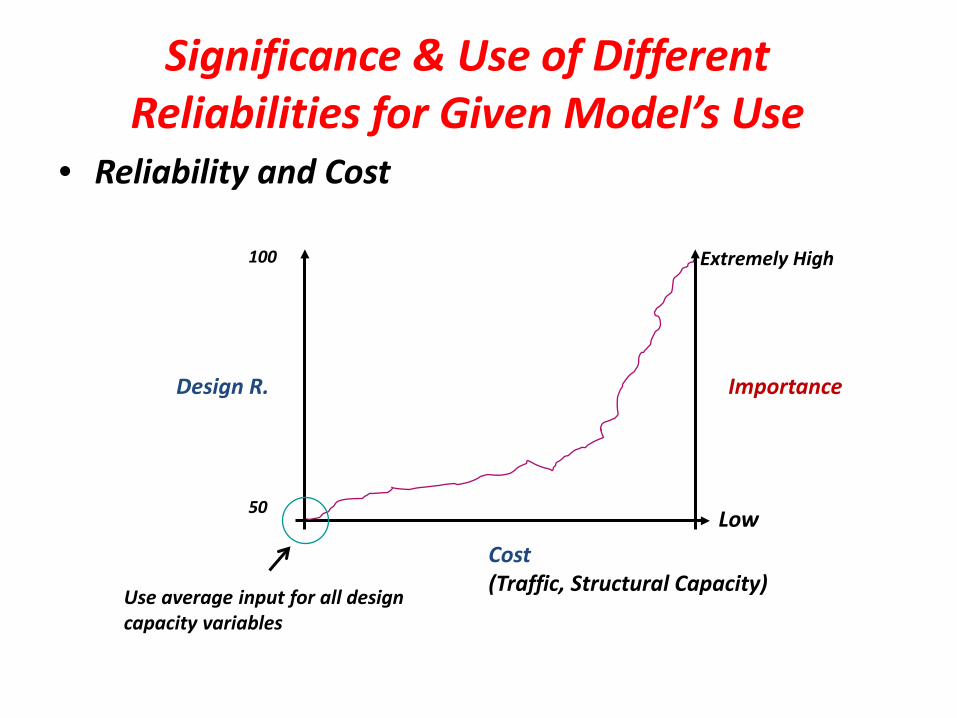
• Reliability and Cost
Design R.
100
50
Extremely High
Low Cost (Traffic, Structural Capacity) Use average input for all design
capacity variables
Importance
Significance & Use of Different Reliabilities for Given Model’s Use
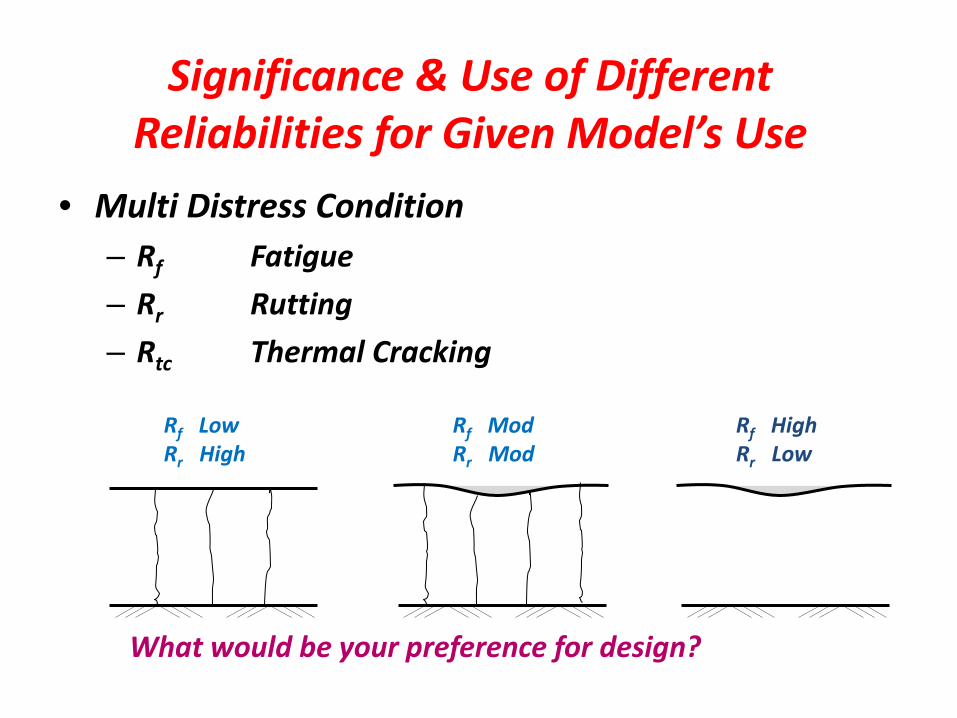
• Multi Distress Condition – Rf Fatigue – Rr Rutting – Rtc Thermal Cracking
Rf Low Rr High
Rf Mod Rr Mod
Rf High Rr Low
What would be your preference for design?
Significance & Use of Different Reliabilities for Given Model’s Use
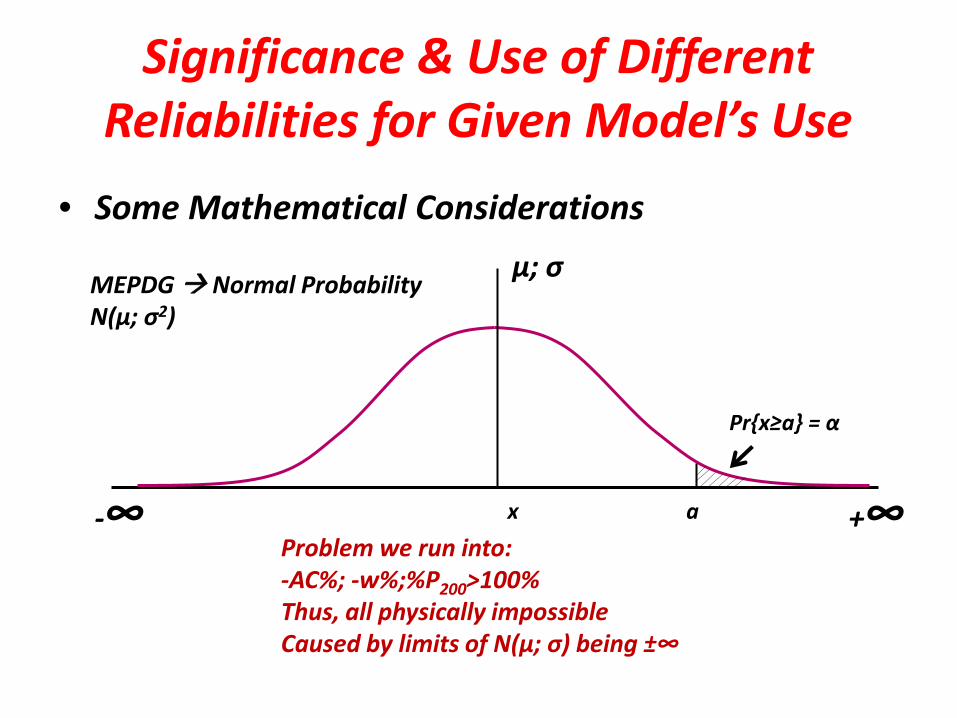
• Some Mathematical Considerations
-∞ Problem we run into: -AC%; -w%;%P200>100% Thus, all physically impossible Caused by limits of N(μ; σ) being ±∞
+∞
μ; σ
Pr{x≥a} = α
a
MEPDG Normal Probability N(μ; σ2)
x
Significance & Use of Different Reliabilities for Given Model’s Use
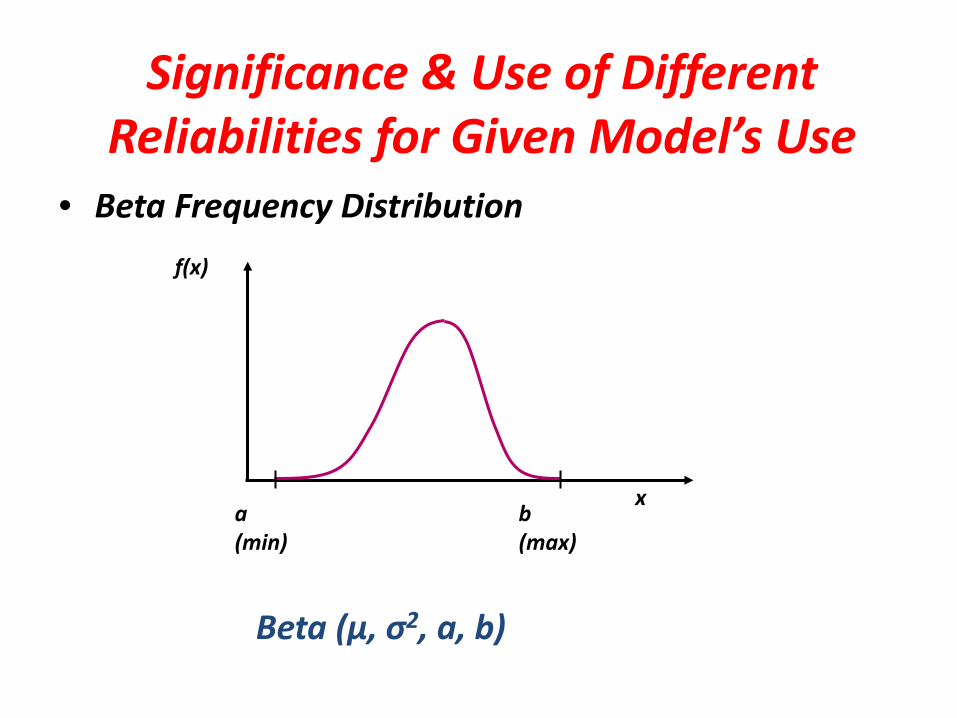
• Beta Frequency Distribution
Beta (μ, σ2, a, b)
a (min)
b (max)
f(x)
x
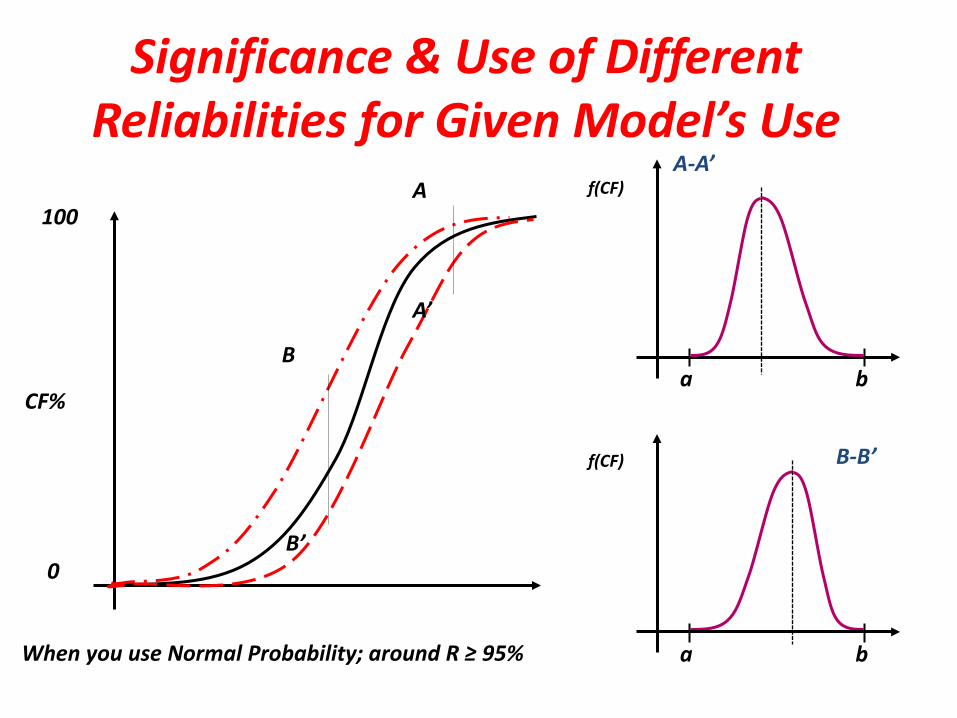
Significance & Use of Different Reliabilities for Given Model’s Use
A-A’
a CF%
100
b
a b
B-B’
0
A
A’
B
B’
f(CF)
f(CF)
When you use Normal Probability; around R ≥ 95%
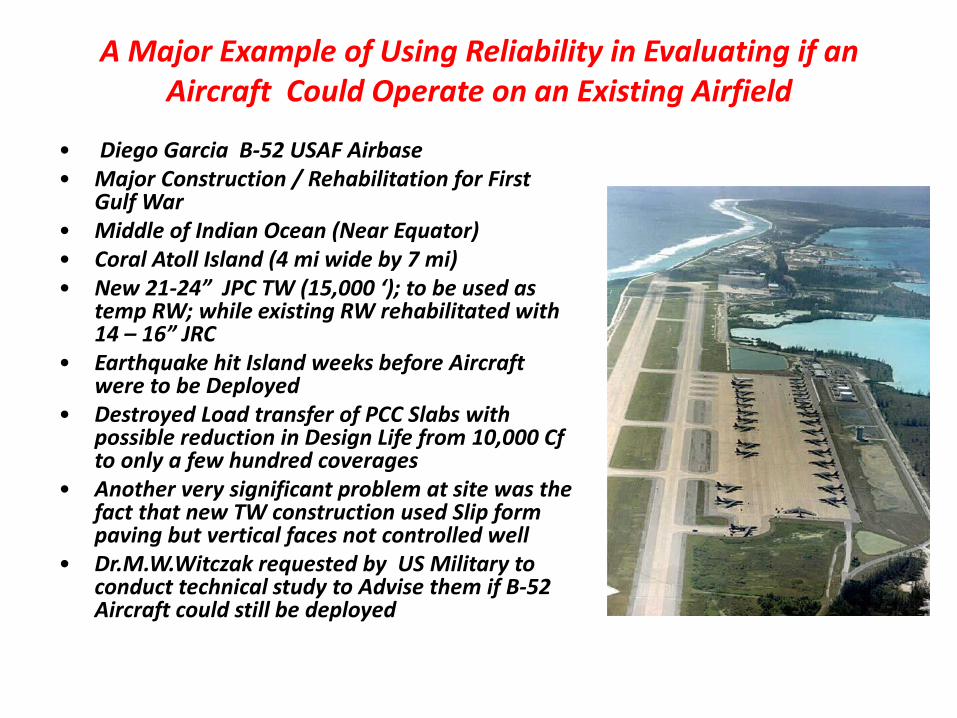
A Major Example of Using Reliability in Evaluating if an Aircraft Could Operate on an Existing Airfield
• Diego Garcia B-52 USAF Airbase • Major Construction / Rehabilitation for First
Gulf War • Middle of Indian Ocean (Near Equator) • Coral Atoll Island (4 mi wide by 7 mi) • New 21-24” JPC TW (15,000 ‘); to be used as
temp RW; while existing RW rehabilitated with 14 – 16” JRC
• Earthquake hit Island weeks before Aircraft were to be Deployed
• Destroyed Load transfer of PCC Slabs with possible reduction in Design Life from 10,000 Cf to only a few hundred coverages
• Another very significant problem at site was the fact that new TW construction used Slip form paving but vertical faces not controlled well
• Dr.M.W.Witczak requested by US Military to conduct technical study to Advise them if B-52 Aircraft could still be deployed
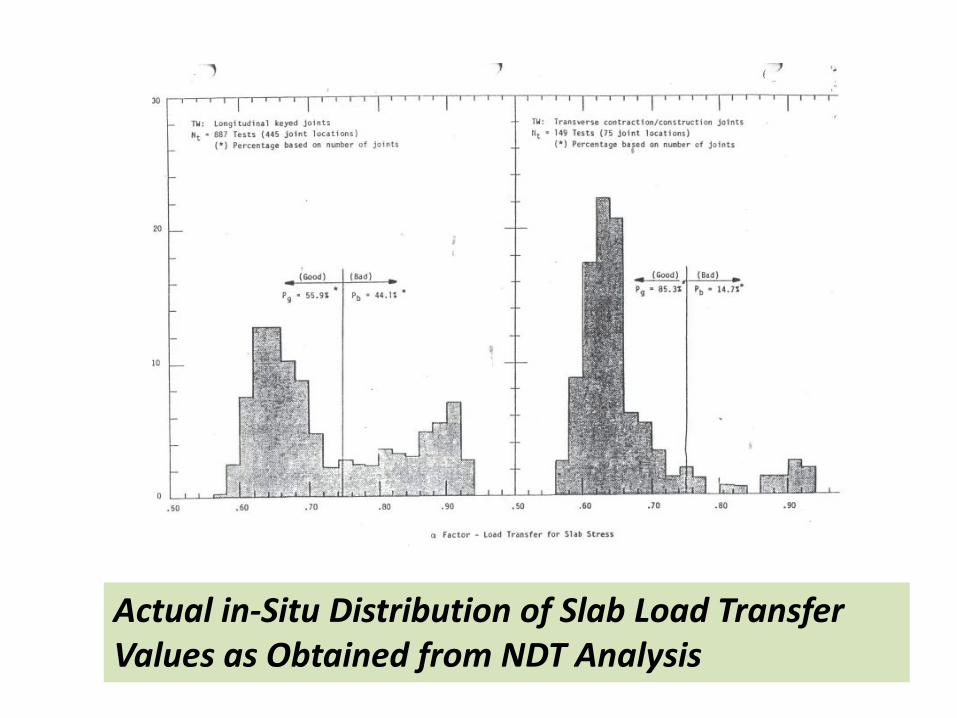
Actual in-Situ Distribution of Slab Load Transfer Values as Obtained from NDT Analysis
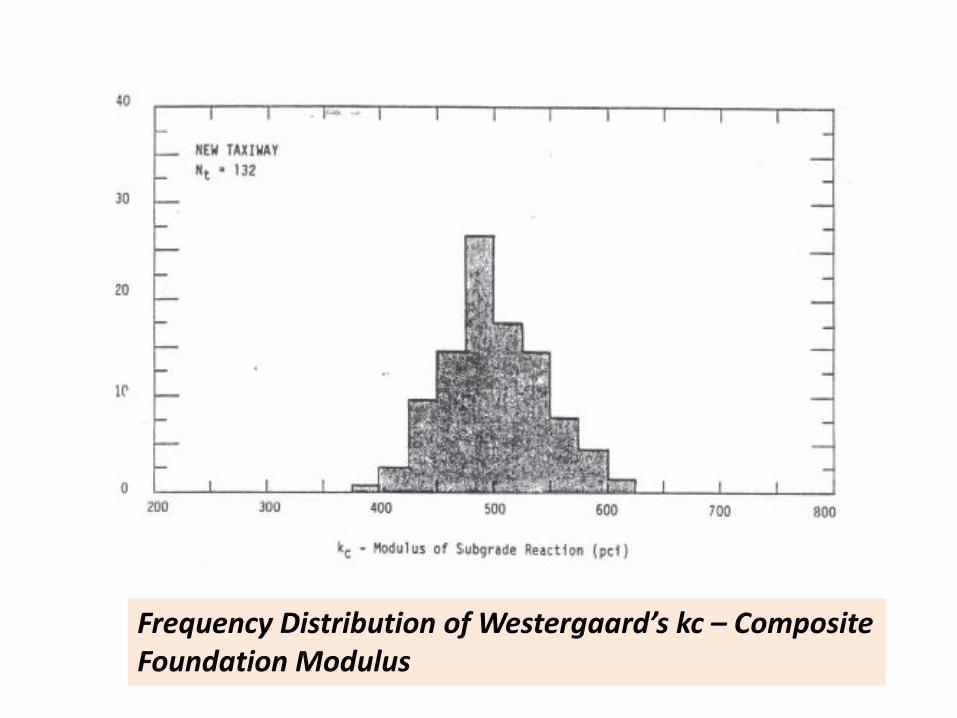
Frequency Distribution of Westergaard’s kc – Composite Foundation Modulus
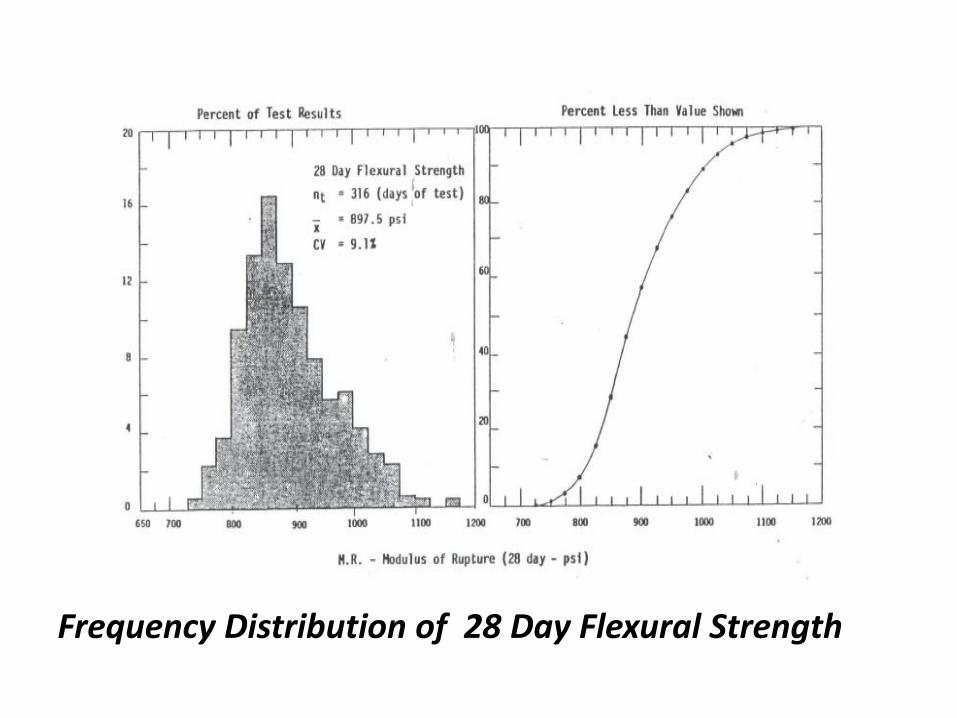
Frequency Distribution of 28 Day Flexural Strength
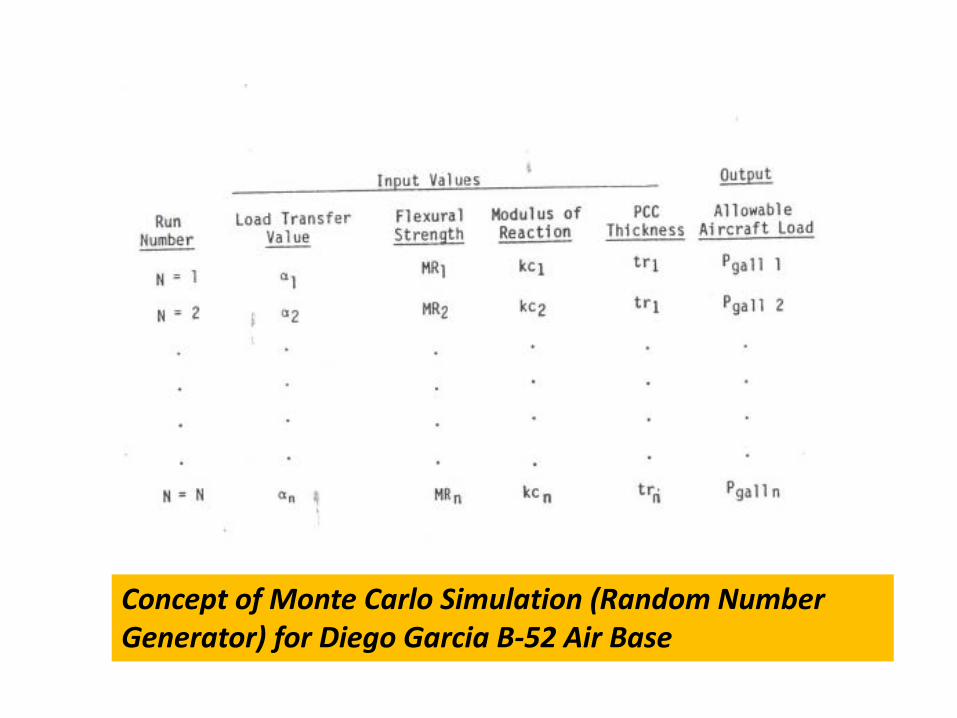
Concept of Monte Carlo Simulation (Random Number Generator) for Diego Garcia B-52 Air Base
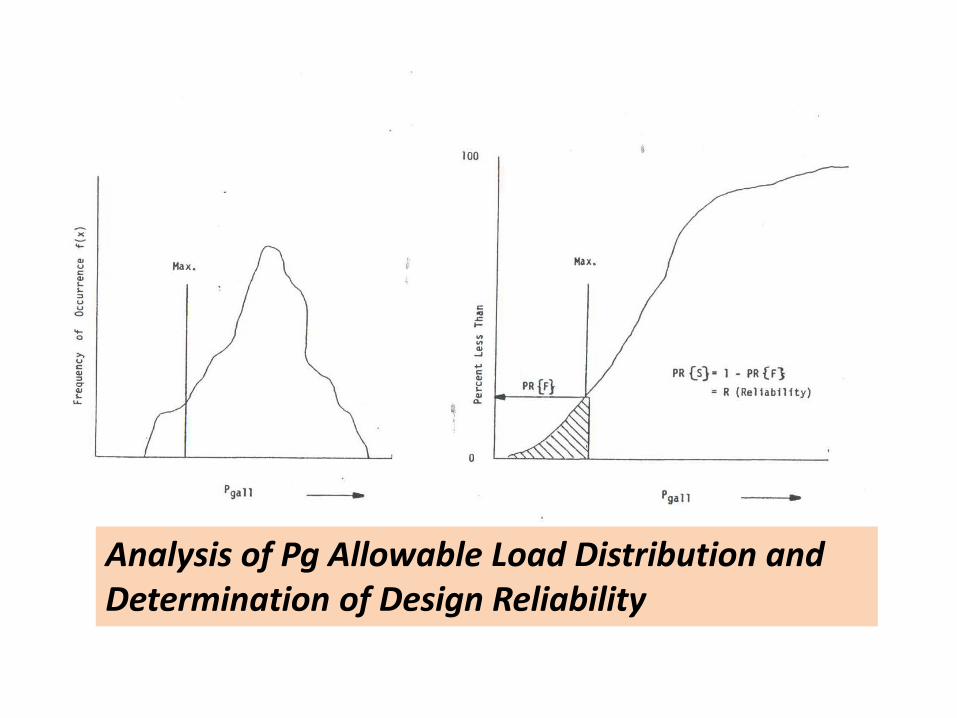
Analysis of Pg Allowable Load Distribution and Determination of Design Reliability
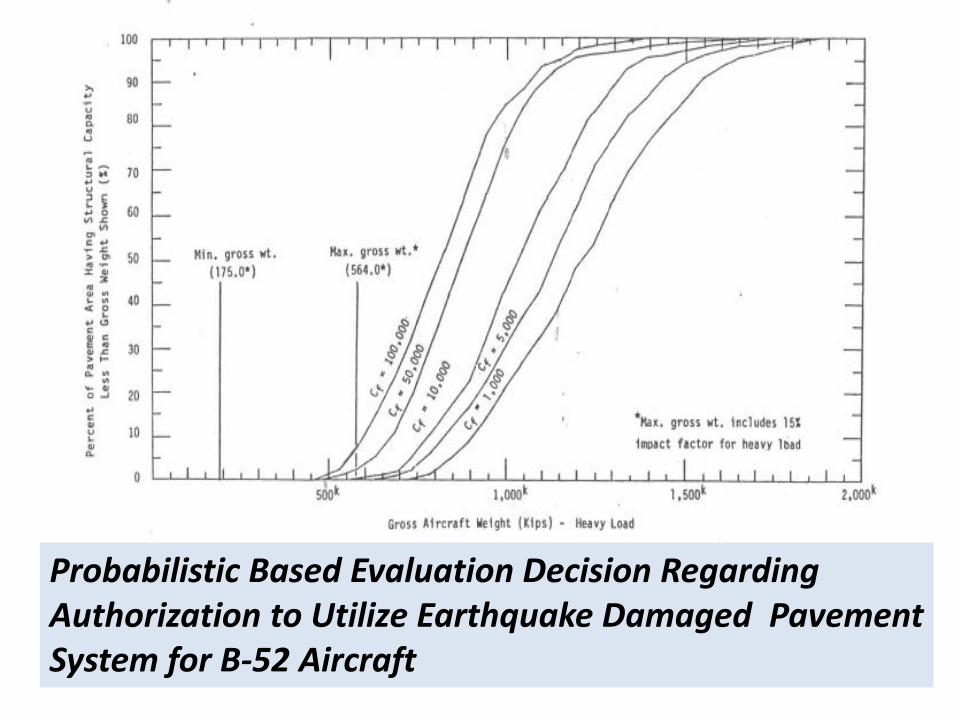
Probabilistic Based Evaluation Decision Regarding Authorization to Utilize Earthquake Damaged Pavement System for B-52 Aircraft
The Selection of the Design Reliability
Its Immense Sensitivity in Airfield Pavement Design / Evaluation
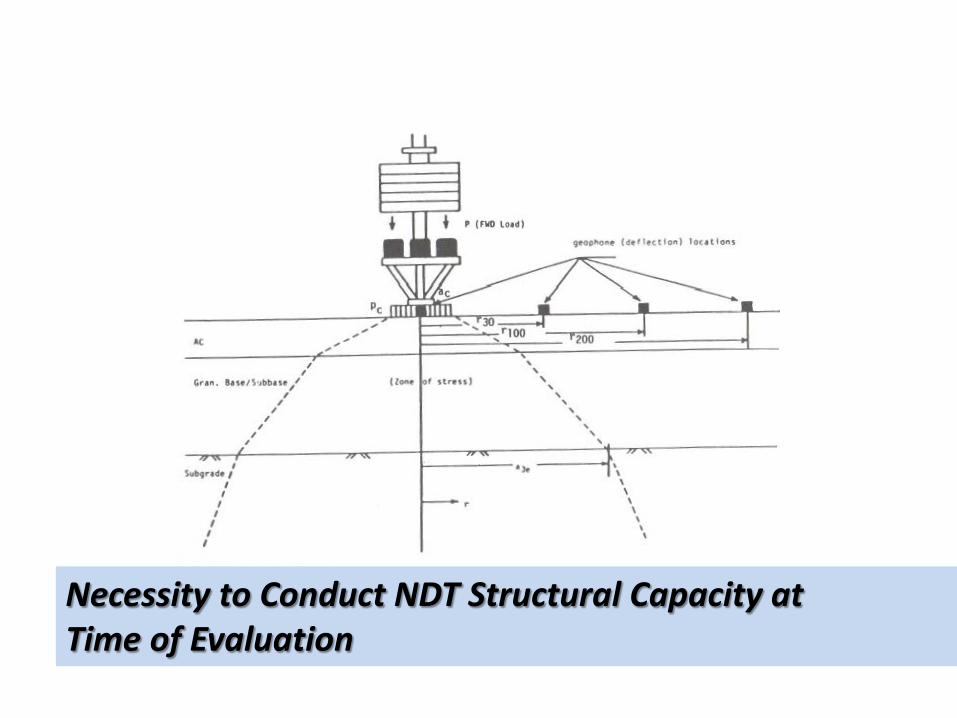
Necessity to Conduct NDT Structural Capacity at Time of Evaluation
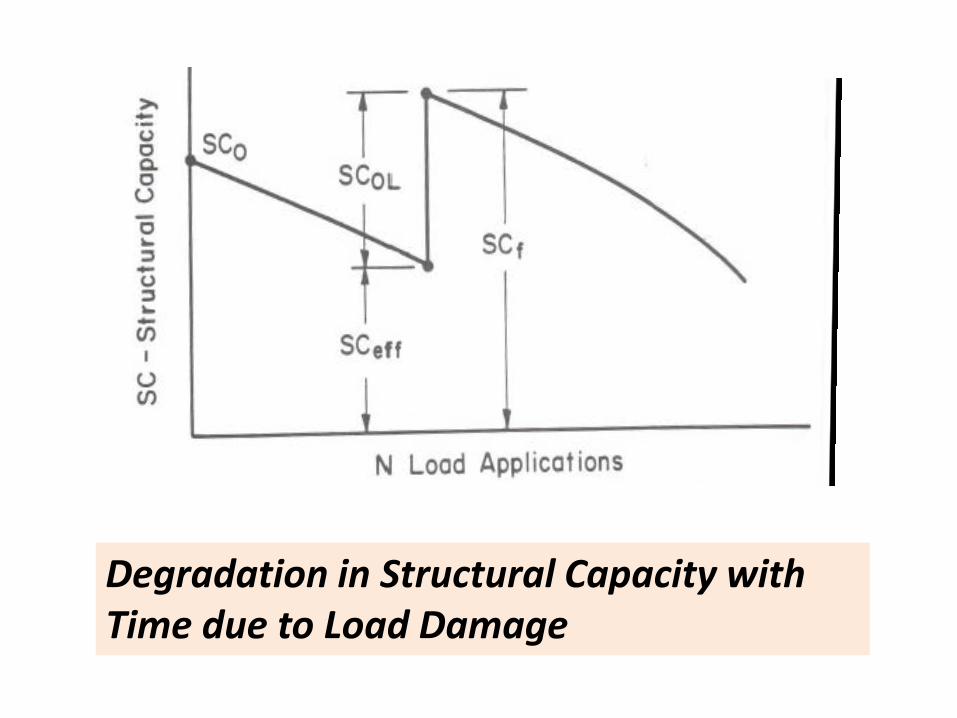
Degradation in Structural Capacity with Time due to Load Damage
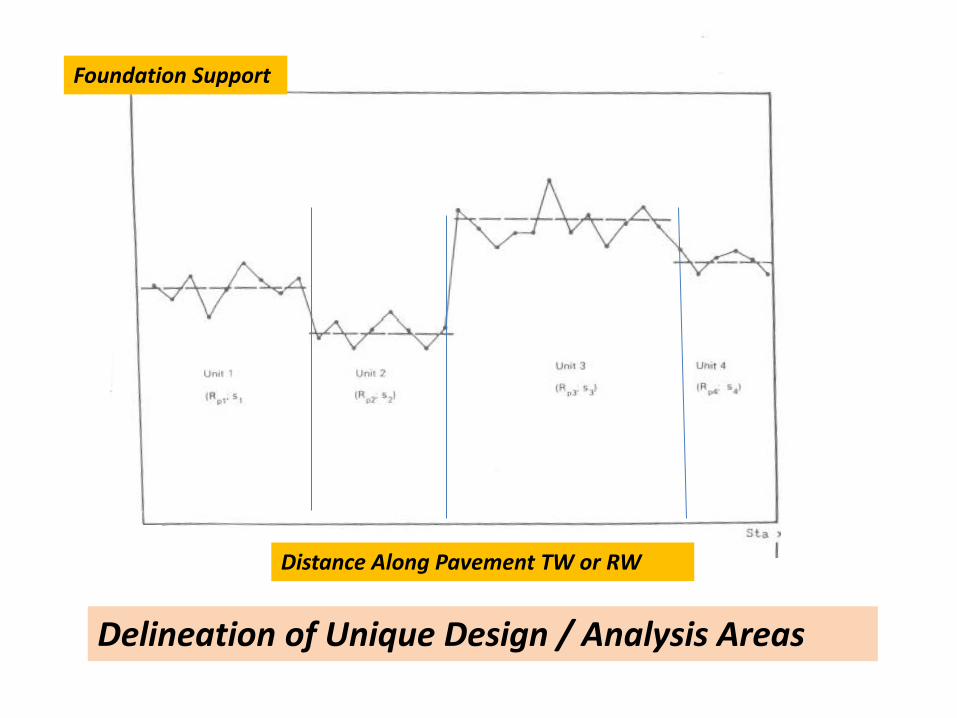
Distance Along Pavement TW or RW
Foundation Support
Delineation of Unique Design / Analysis Areas
0
20
40
60
80
100
120
140
160
180
200
1 10 100
Tota
l Pav
emen
t Thi
ckne
ss (i
n)
Subgrade CBR-%
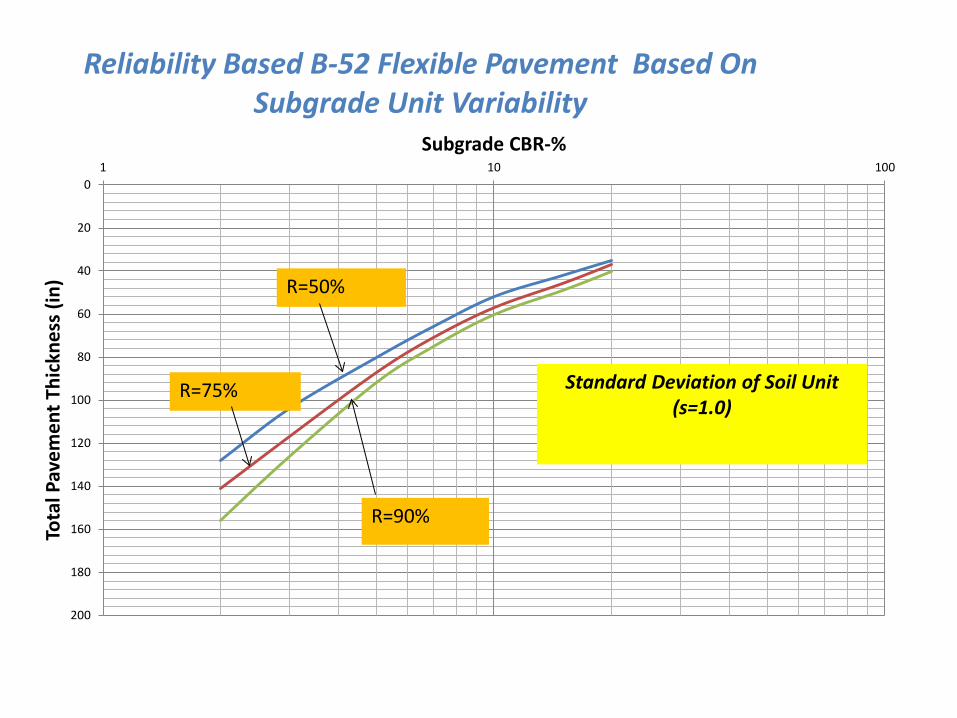
Reliability Based B-52 Flexible Pavement Based On Subgrade Unit Variability
R=50%
R=75%
R=90%
Standard Deviation of Soil Unit (s=1.0)
0
20
40
60
80
100
120
140
160
180
200
1 10 100
Tota
l Pav
emen
t Thi
ckne
ss (i
n)
Subgrade CBR-%
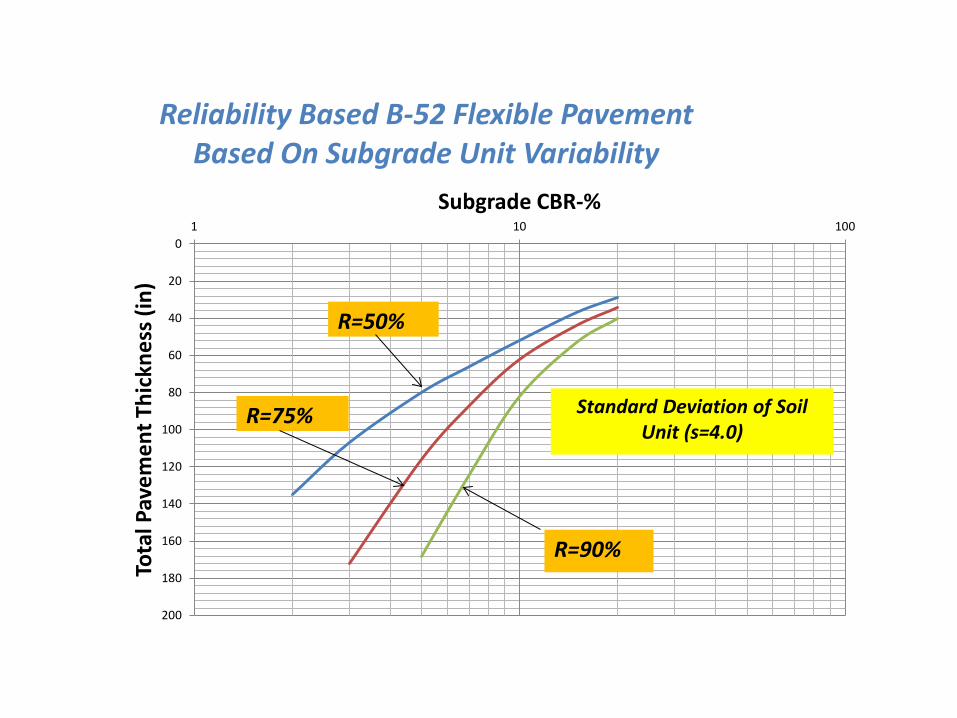
Reliability Based B-52 Flexible Pavement Based On Subgrade Unit Variability
R=50%
R=75%
R=90%
Standard Deviation of Soil Unit (s=4.0)
Selection of the Appropriate Number of Test Results Within the
Pavement Unit
Limit of Accuracy and the Presumptive Number
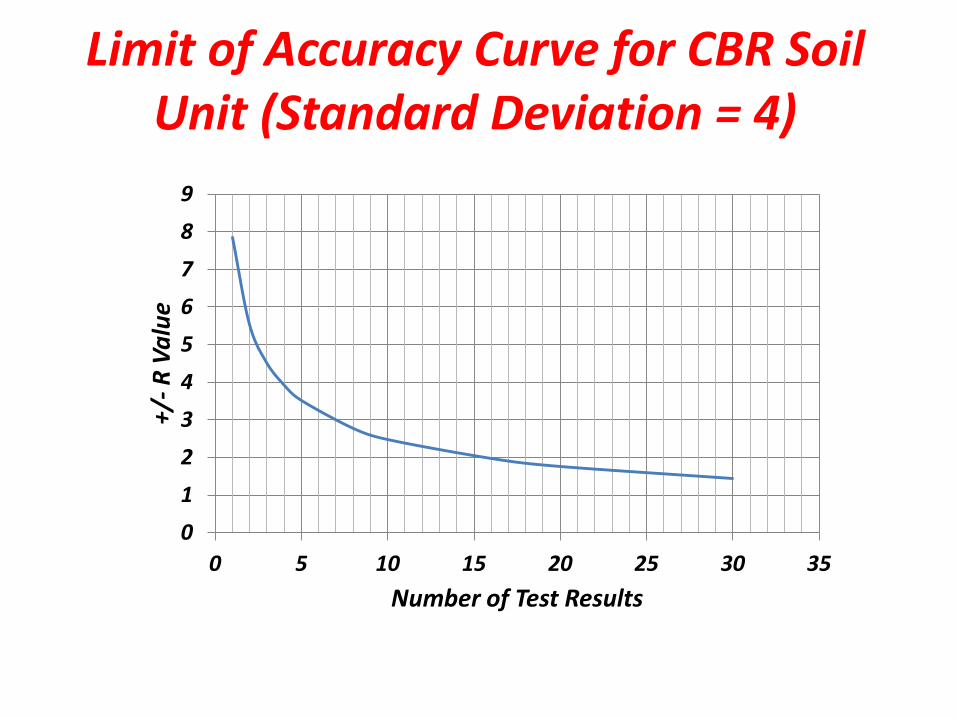
Limit of Accuracy Curve for CBR Soil Unit (Standard Deviation = 4)
0123456789
0 5 10 15 20 25 30 35
+/- R
Val
ue
Number of Test Results
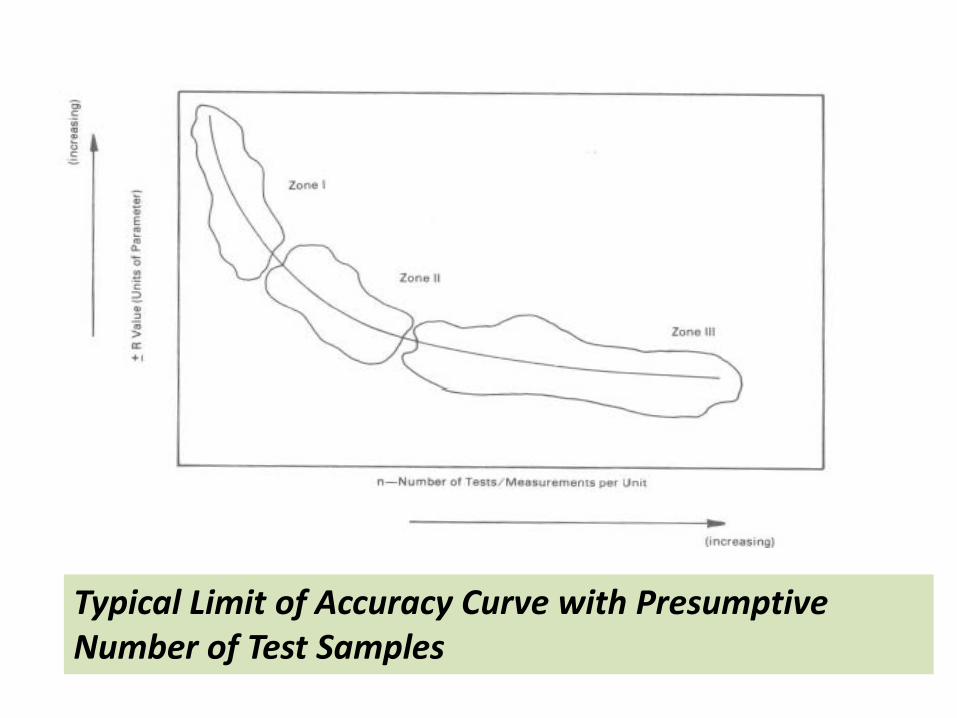
Typical Limit of Accuracy Curve with Presumptive Number of Test Samples

Types of Tire / Gear Arrangements
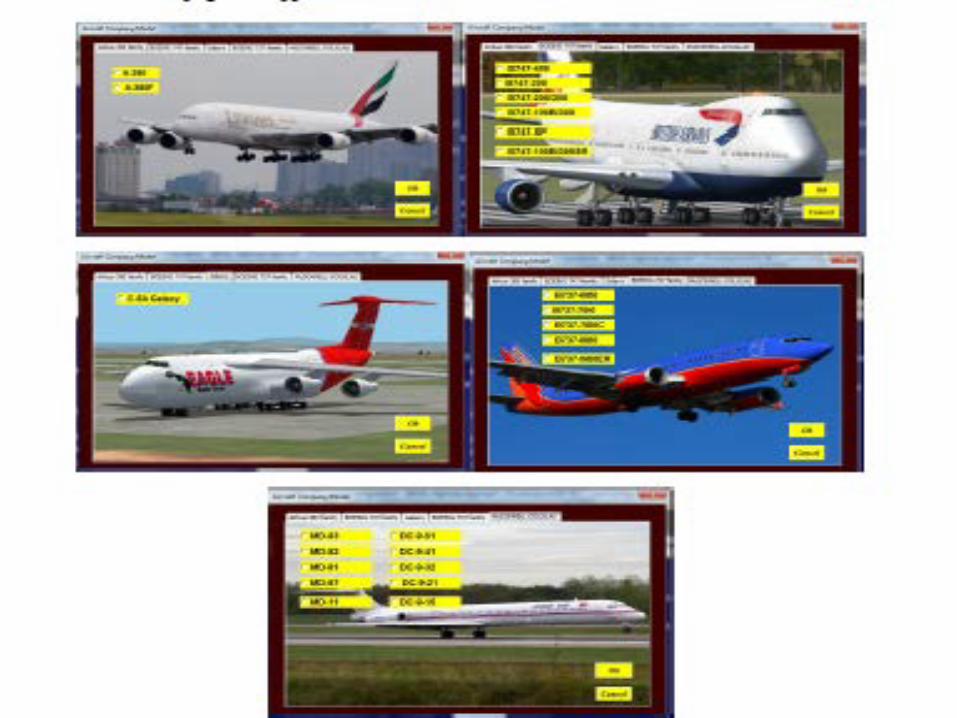
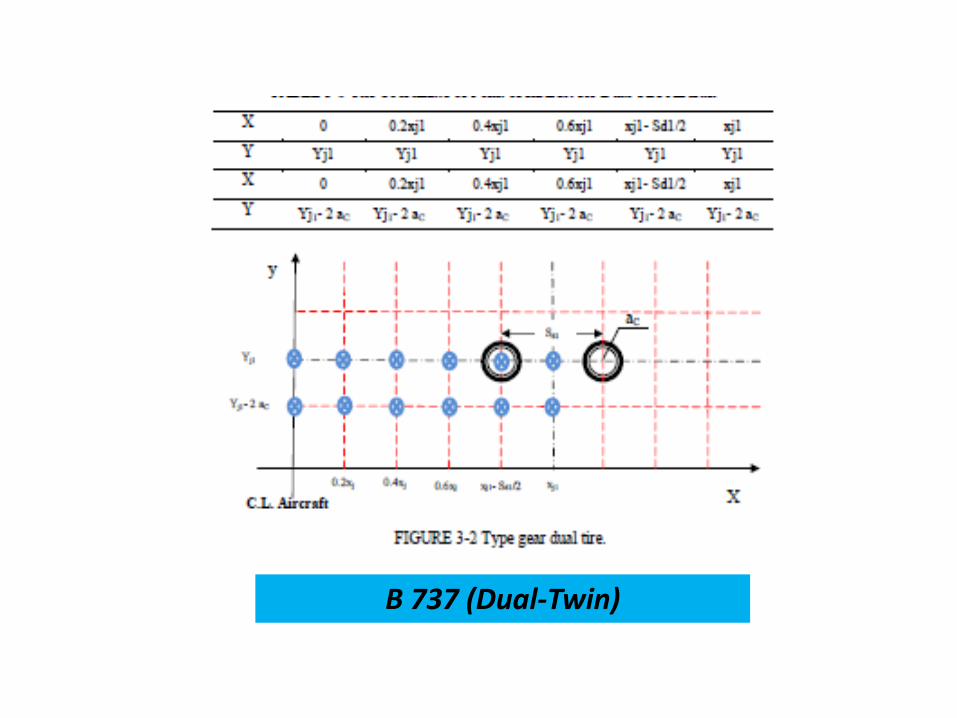
B 737 (Dual-Twin)
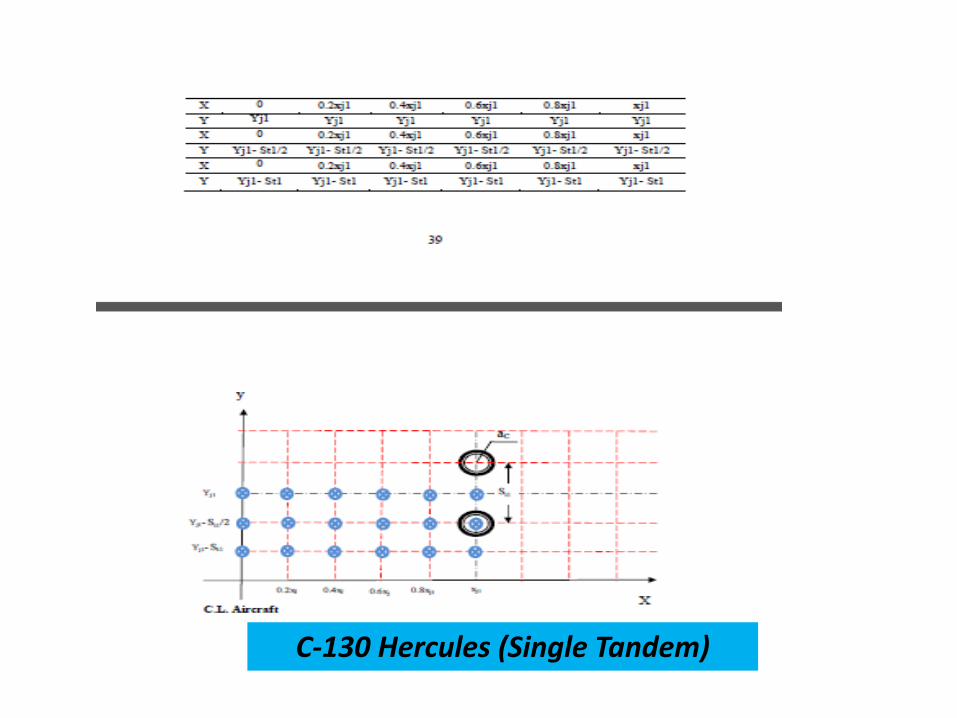
C-130 Hercules (Single Tandem)
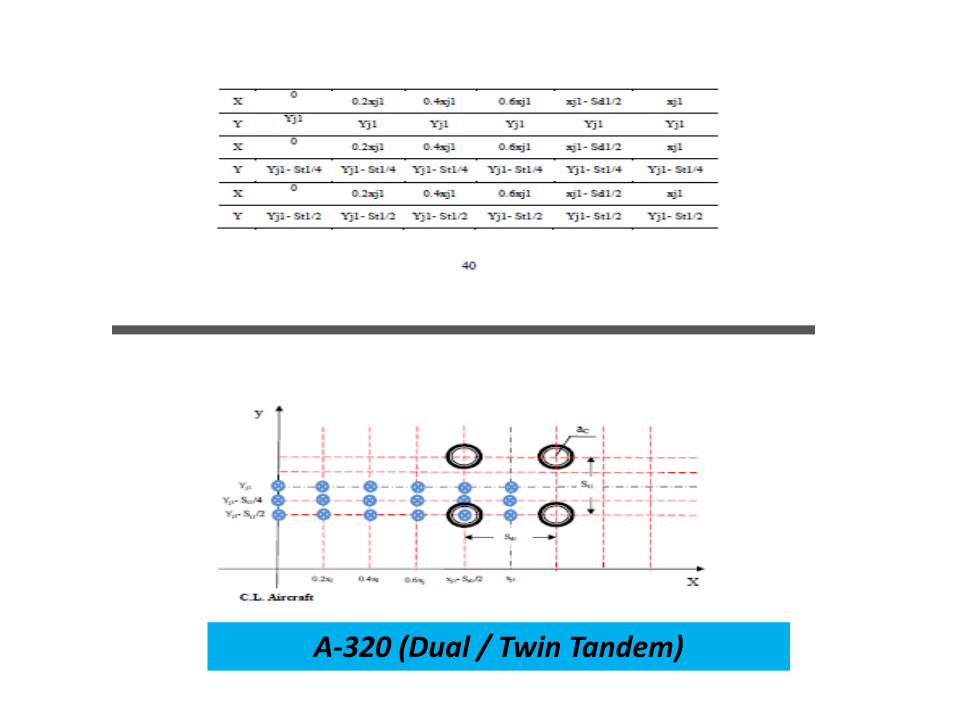
A-320 (Dual / Twin Tandem)
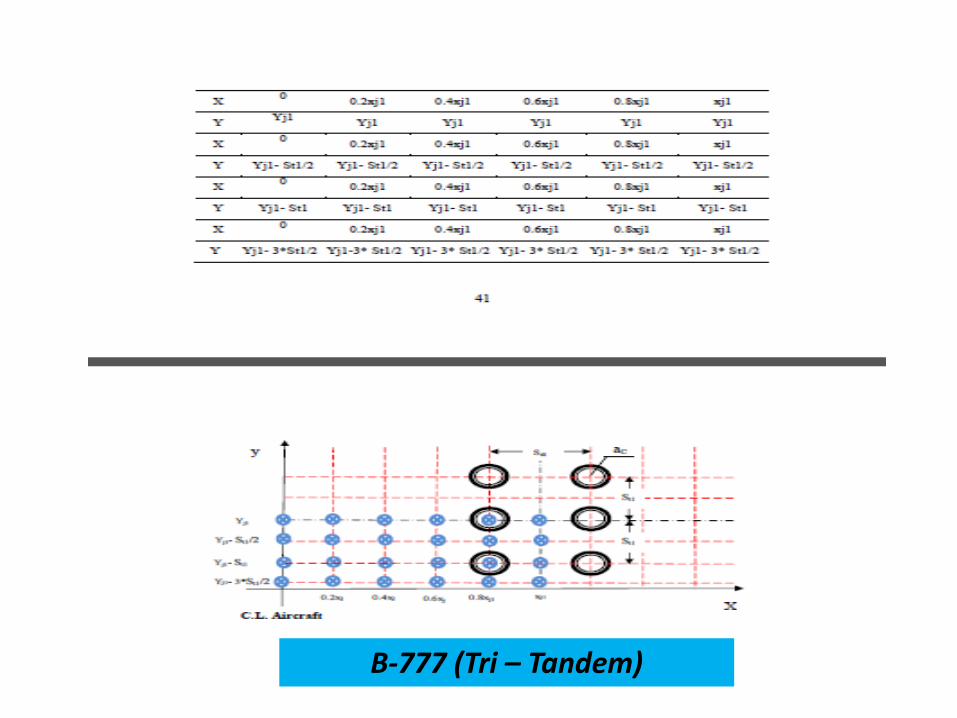
B-777 (Tri – Tandem)
C-5A Galaxy
B-52 (Twin-Twin)
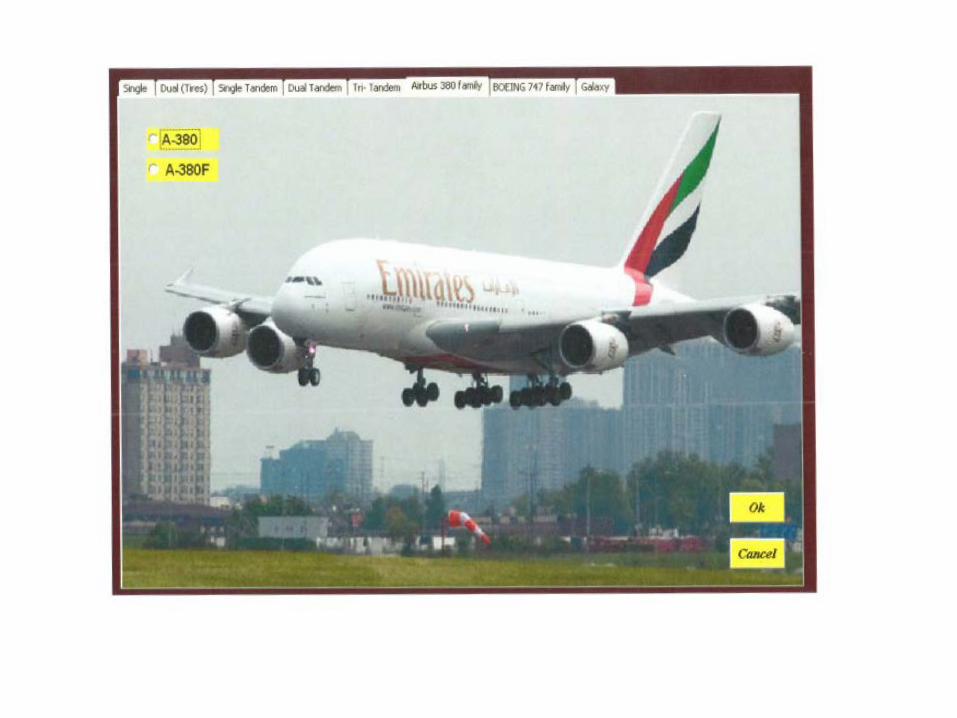
A-380 (Twin Tandem & Tri Tandem)
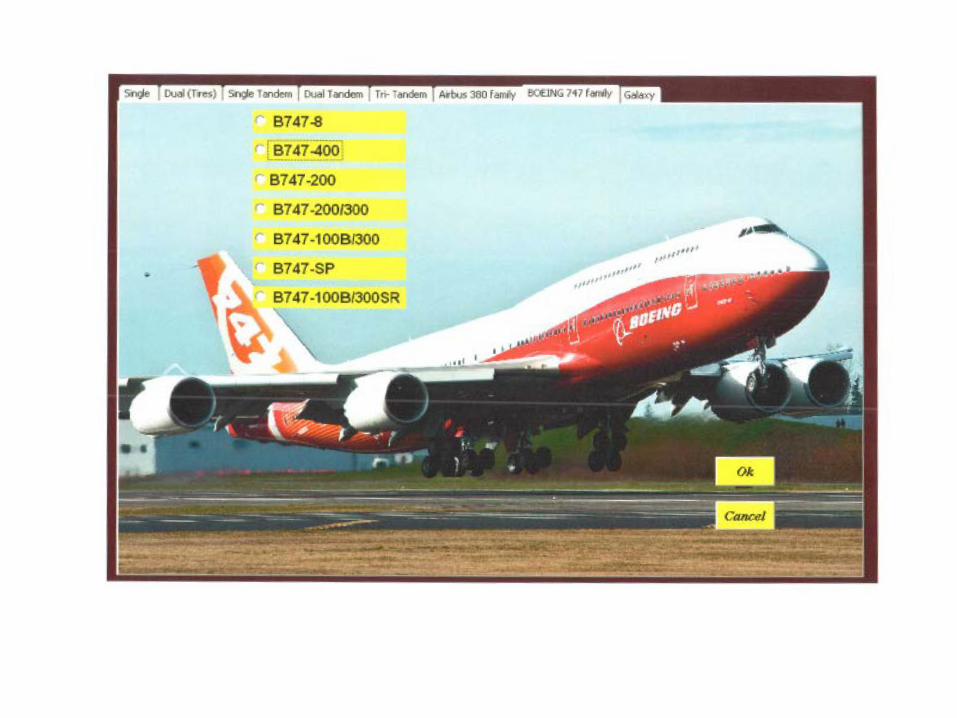
B-747 (Offset Twin Tandems)
Typical Maximum Strain Results Along X Axis (Transverse Axis)
Some Limiting Vertical Subgrade Strain Criterion for AC Flexible
Pavements
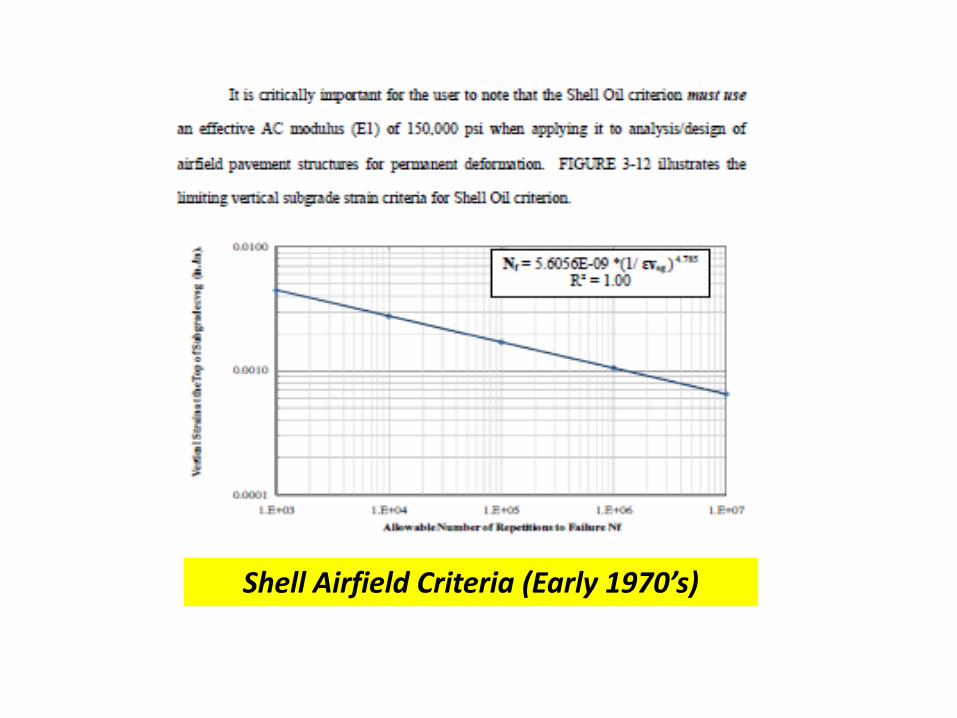
Shell Airfield Criteria (Early 1970’s)
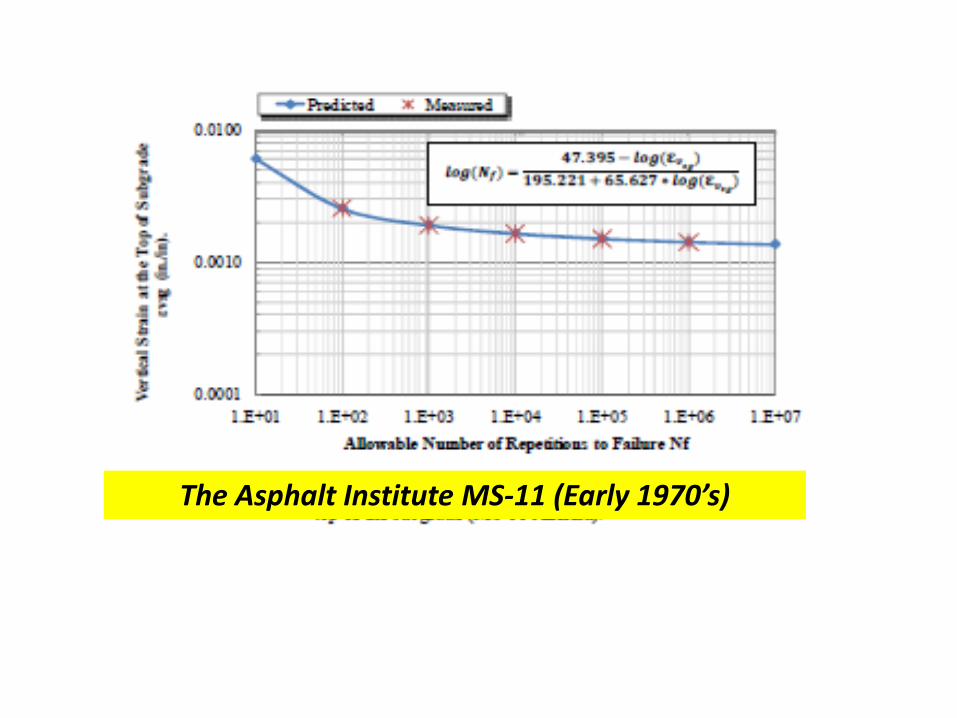
The Asphalt Institute MS-11 (Early 1970’s)
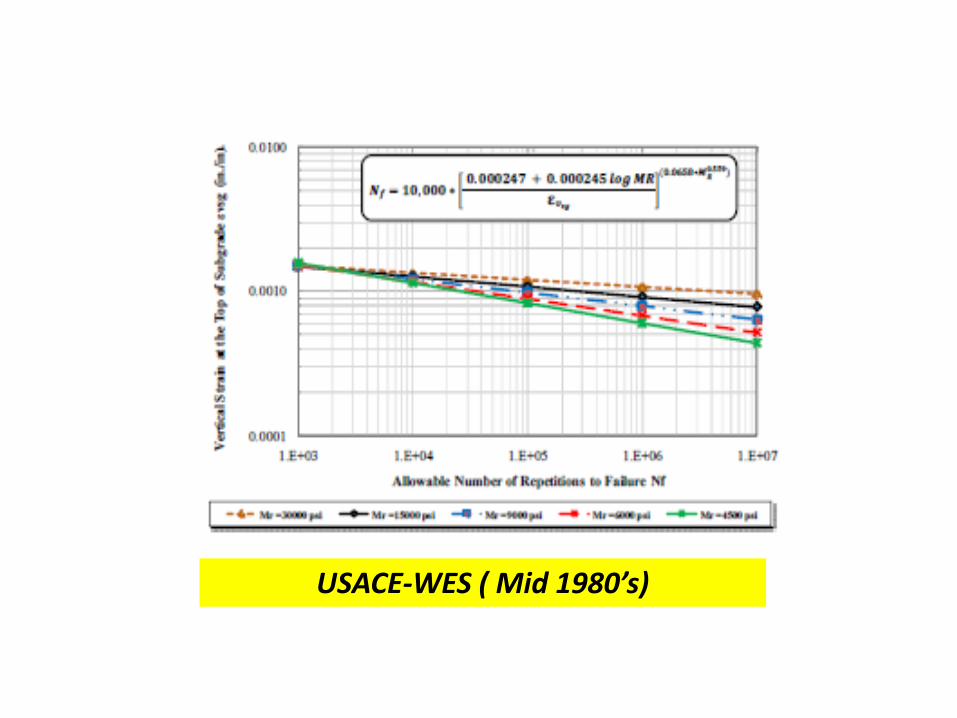
USACE-WES ( Mid 1980’s)
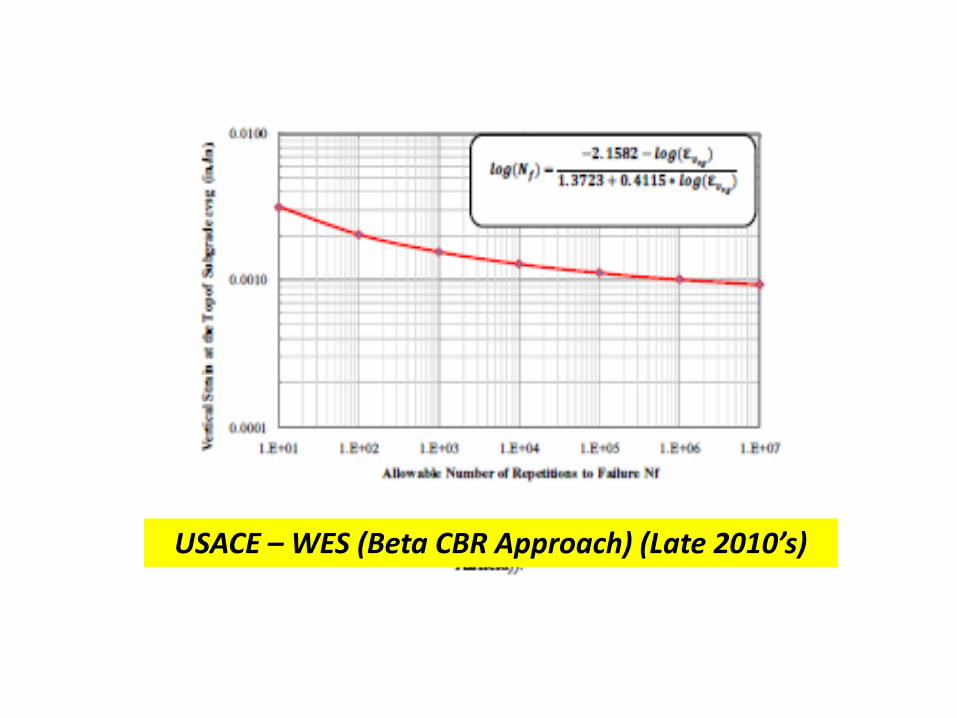
USACE – WES (Beta CBR Approach) (Late 2010’s)
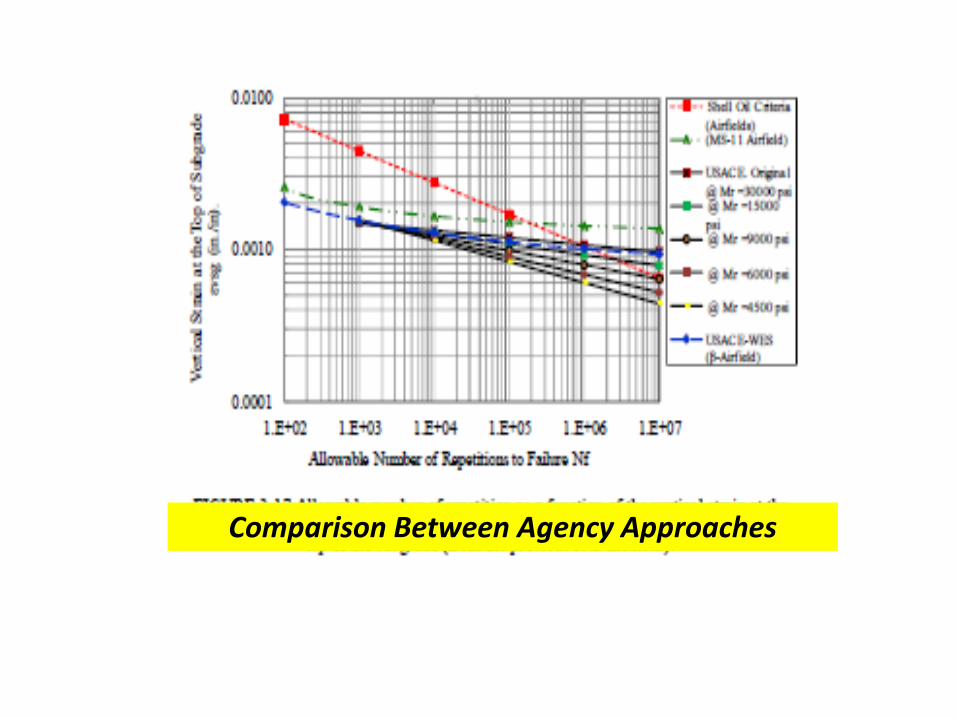
Comparison Between Agency Approaches
Speaker Assessment of Aircraft – Pavement Evaluation
Some Thoughts and Considerations About Pavement Aircraft Evaluations
• One of the most complex technical computations in airfiekd pavement engineering which is very difficult to accurately evaluate
• The use of the ACN / PCN approach is not the most accurate methodology to use to formulate this decision as it neglects to consider several important factors affecting pavement performance (such as the current distress condition, actual traffic mixture etc..) although it is an excellent first screening methodology that should be employed
• Airfields should have a history of periodic Condition Surveys in order to know the condition and distress categories present when a new heavy aircraft is introduced
Some Thoughts and Considerations About Pavement Aircraft Evaluations
• It is absolutely imperative to accurately know the historic traffic mixtures by type; weight; number of historic passes on each unique traffic (RW / TW) segment
• Historic availability of NDT Back Calculation Studies are necessary to establish the Soil / Pavement Units at the Airfield (For example there are well over 200 pavement “design” units at J.F.Kennedy Airport in New York) and the variability of the unit for reliability analysis
• Need to have precise pavement structural compositions of each unit (material type, thickness and material property)
• Airport Owner must use Cumulative Damage Principles in his decision and not rely on”Critical Design Aircraft Concepts”.
Some Thoughts and Considerations About Pavement Aircraft Evaluations
• Flexible Pavement Aircraft – Pavement decisions must be based upon the most accurate available Design Methodologies available today – CBR Design Procedures should be Avoided – Use of MLET pavement approaches are much more preferred – However, future improvements in the MLET airfield design method, currently used by airfield agencies (TAI; USMilitary UFC and
FAARFIELD) should be immediately pursued by ICAO to greatly enhance the predictability of the approach
-- Cumulative Damage Effects of the Aircraft Traffic mixture must be used and one should not rely on a “critical aircraft “ approach
Some Thoughts and Considerations About Pavement Aircraft Evaluations
• Rigid Pavement Aircraft – Pavement decisions must be based upon the most accurate design methodologies available today – Theoretical solutions that can model slab boundary effects caused by
joints, dowels etc must be utilized – The finite element FAARFIELD methodology is the most currently
preferred approach – However, there are still some limitations in this methodology which
should be enhanced to make it a powerful aircraft – pavement evaluation / design procedure for rigid PCC systems
– Cumulative Damage effects of the aircraft traffic mixture must be used and one should not rely upon a “critical aircraft” approach
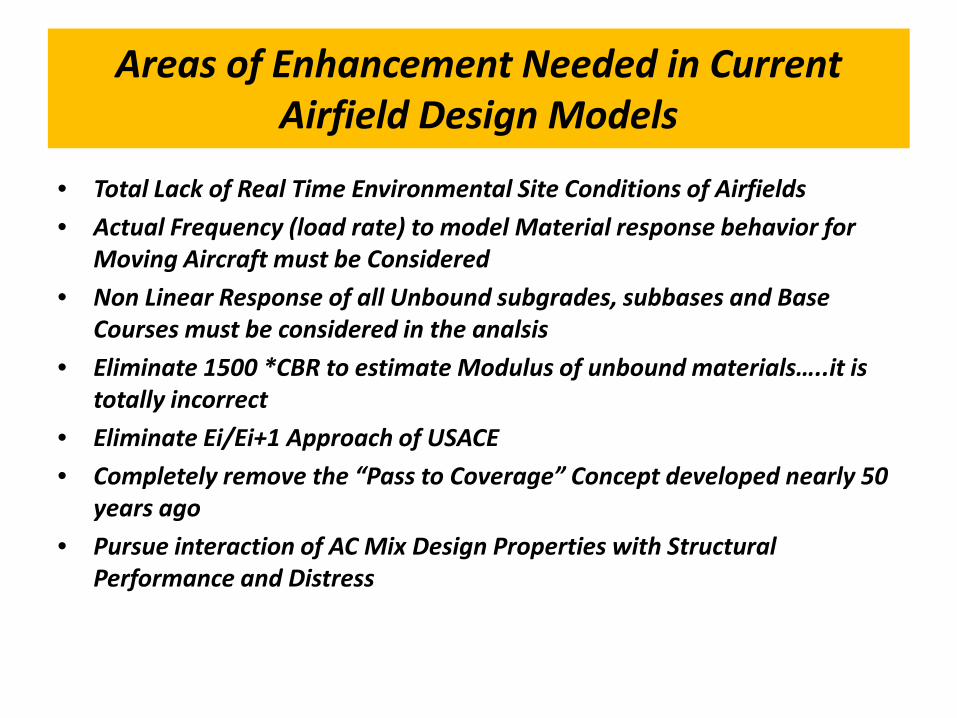
Areas of Enhancement Needed in Current Airfield Design Models
• Total Lack of Real Time Environmental Site Conditions of Airfields • Actual Frequency (load rate) to model Material response behavior for
Moving Aircraft must be Considered • Non Linear Response of all Unbound subgrades, subbases and Base
Courses must be considered in the analsis • Eliminate 1500 *CBR to estimate Modulus of unbound materials…..it is
totally incorrect • Eliminate Ei/Ei+1 Approach of USACE • Completely remove the “Pass to Coverage” Concept developed nearly 50
years ago • Pursue interaction of AC Mix Design Properties with Structural
Performance and Distress
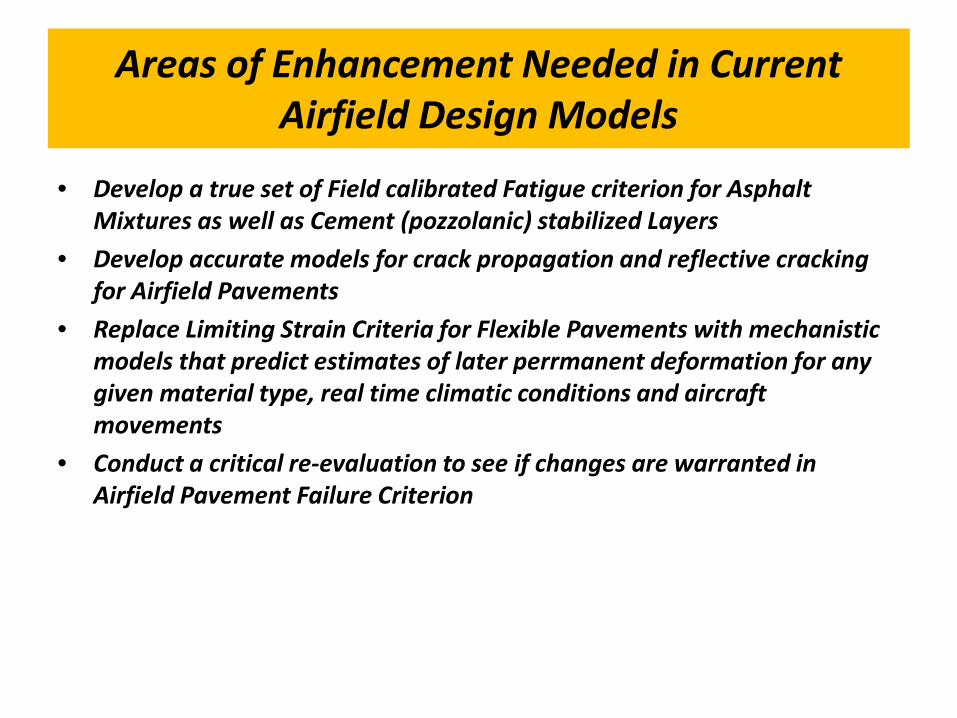
Areas of Enhancement Needed in Current Airfield Design Models
• Develop a true set of Field calibrated Fatigue criterion for Asphalt Mixtures as well as Cement (pozzolanic) stabilized Layers
• Develop accurate models for crack propagation and reflective cracking for Airfield Pavements
• Replace Limiting Strain Criteria for Flexible Pavements with mechanistic models that predict estimates of later perrmanent deformation for any given material type, real time climatic conditions and aircraft movements
• Conduct a critical re-evaluation to see if changes are warranted in Airfield Pavement Failure Criterion
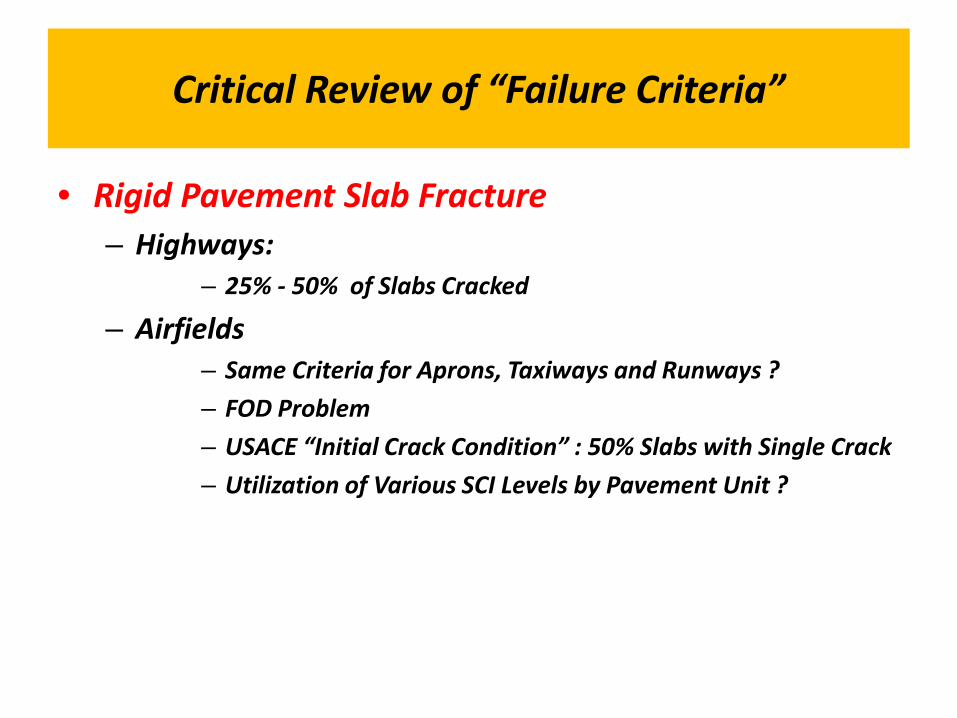
Critical Review of “Failure Criteria”
• Rigid Pavement Slab Fracture – Highways:
– 25% - 50% of Slabs Cracked
– Airfields – Same Criteria for Aprons, Taxiways and Runways ? – FOD Problem – USACE “Initial Crack Condition” : 50% Slabs with Single Crack – Utilization of Various SCI Levels by Pavement Unit ?
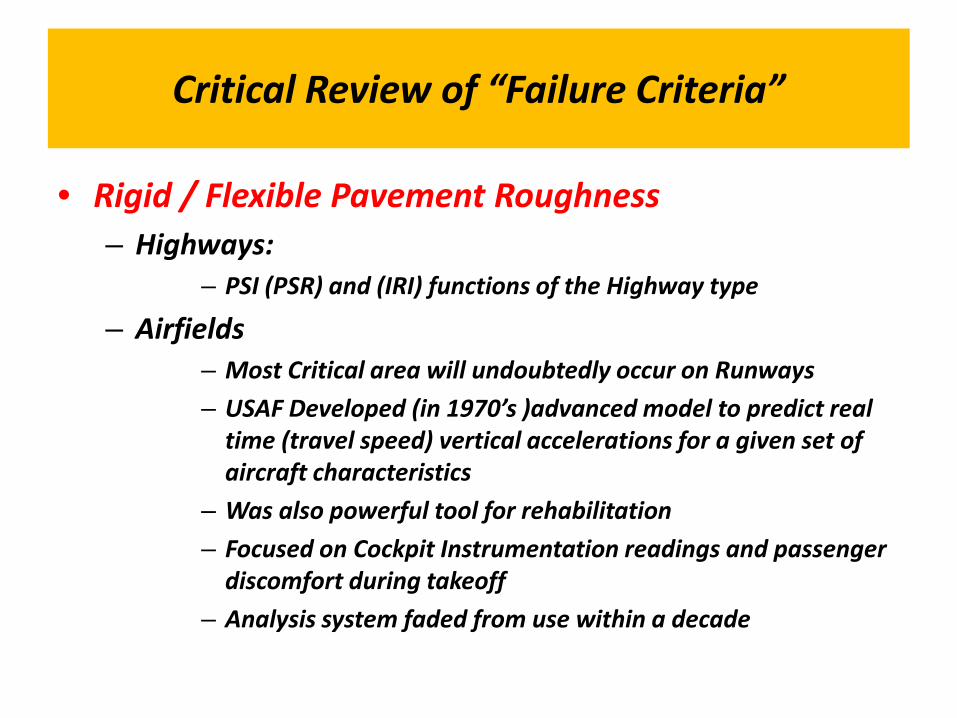
Critical Review of “Failure Criteria”
• Rigid / Flexible Pavement Roughness – Highways:
– PSI (PSR) and (IRI) functions of the Highway type
– Airfields – Most Critical area will undoubtedly occur on Runways – USAF Developed (in 1970’s )advanced model to predict real
time (travel speed) vertical accelerations for a given set of aircraft characteristics
– Was also powerful tool for rehabilitation – Focused on Cockpit Instrumentation readings and passenger
discomfort during takeoff – Analysis system faded from use within a decade
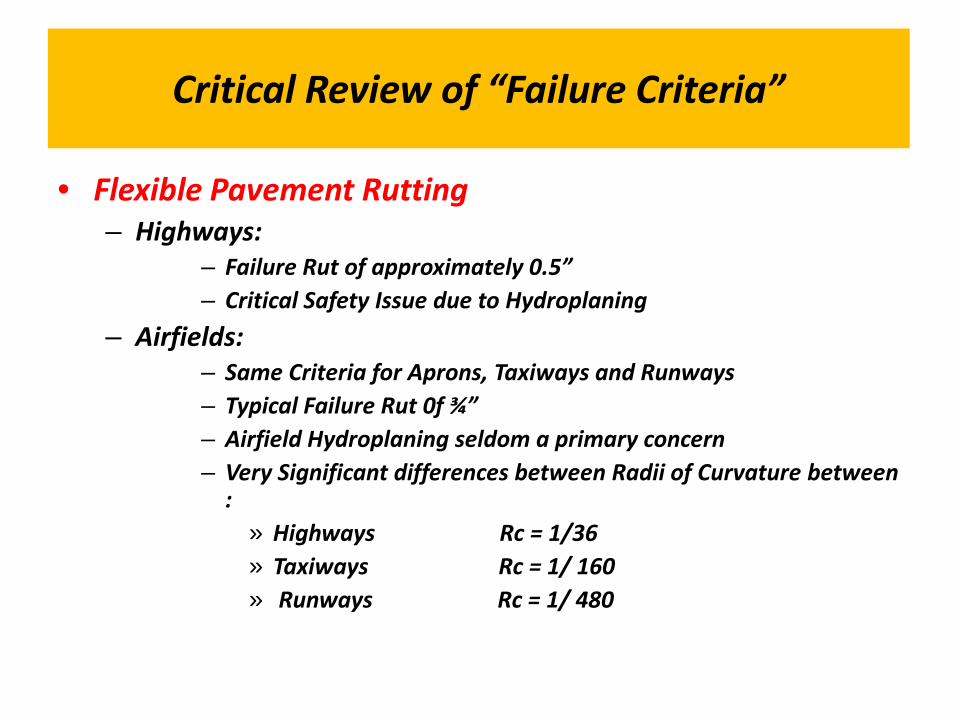
Critical Review of “Failure Criteria”
• Flexible Pavement Rutting – Highways:
– Failure Rut of approximately 0.5” – Critical Safety Issue due to Hydroplaning
– Airfields: – Same Criteria for Aprons, Taxiways and Runways – Typical Failure Rut 0f ¾” – Airfield Hydroplaning seldom a primary concern – Very Significant differences between Radii of Curvature between
: » Highways Rc = 1/36 » Taxiways Rc = 1/ 160 » Runways Rc = 1/ 480
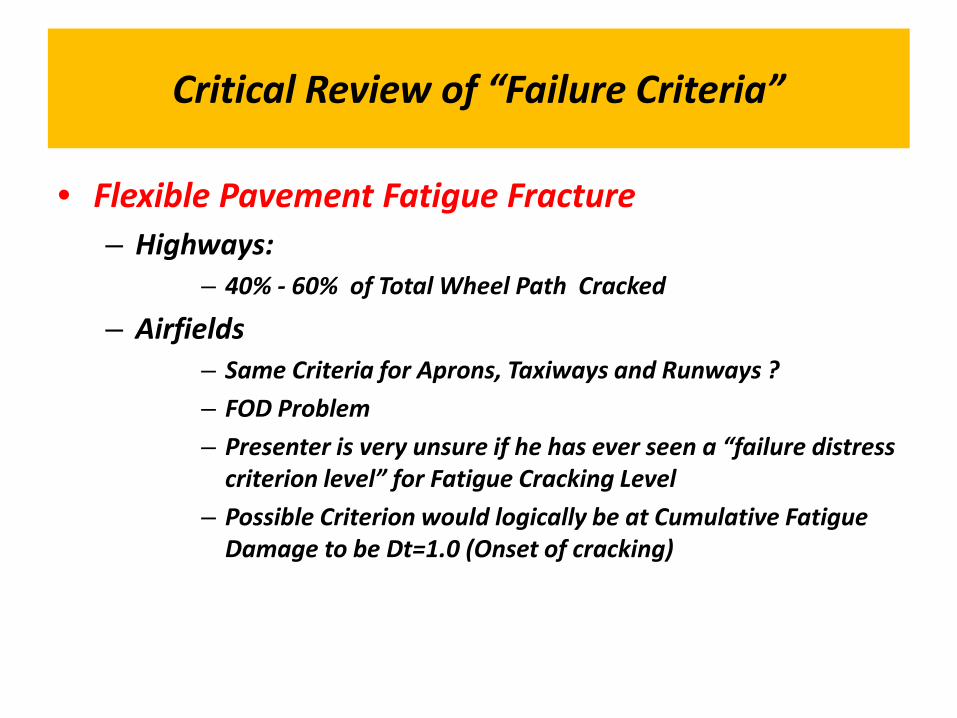
Critical Review of “Failure Criteria”
• Flexible Pavement Fatigue Fracture – Highways:
– 40% - 60% of Total Wheel Path Cracked
– Airfields – Same Criteria for Aprons, Taxiways and Runways ? – FOD Problem – Presenter is very unsure if he has ever seen a “failure distress
criterion level” for Fatigue Cracking Level – Possible Criterion would logically be at Cumulative Fatigue
Damage to be Dt=1.0 (Onset of cracking)