ibm security solutions x-force 2009 trend and risk report
TRANSCRIPT

February 2010IBM Security Solutions
IBM Security SolutionsX-Force® 2009 Trend and Risk Report:Annual Review of 2009

2 IBM X-Force 2009 Trend and Risk Report IBM Security Solutions
Contents
6 Contributors
6 About the X-Force
7 Overview
7 The Threat Landscape Lifecycle
8 2009 Highlights
8 Vulnerabilities and Exploitation
9 Malware and the Malicious Web
9 Spam and Phishing
10 Vulnerabilities
10 2009 Vulnerability Disclosure Count
11 Vulnerability Disclosure Timing
12 Vulnerability Disclosures by Severity
13 CVSS Base Scores
13 Exploitability Probability Quadrant
14 Vendors with the Most Vulnerability Disclosures
15 Changes in the Top Vendor List
16 Where Did the Web Application Vendors Go?
16 Availability of Vulnerability Fixes and Patches
17 Best and Worst Patchers
18 Remotely Exploitable Vulnerabilities
19 Consequences of Exploitation
20 Operating System Vulnerabilities
20 All Operating Systems Vulnerabilities
21 Critical and High Operating System Vulnerabilities
22 How to Win the Operating System Religious War
24 Web Application Threats and Vulnerabilities
25 Web Application Vulnerability Disclosures by Attack Categories
27 Web Application Platforms with the Most Vulnerability Disclosures
29 Moral of the Story
30 Conclusions from Real-World Web Application Assessments
30 Methodology
32 Improvements Noted, but Additional Improvements Needed
34 Most Prevalent Web Application Vulnerabilities by Industry
35 Recommendations
36 Web Application Attacks
38 Client Threats and Vulnerabilities
39 Client Vulnerabilities by Category
40 Browser Vulnerabilities
41 Document Reader and Editor Vulnerabilities
42 Multimedia Vulnerabilities
44 Availability of 0-Day Exploit Code
45 Affected Vendors and Availability of Patches
46 Client Exploitation Trends
46 Most Prevalent Exploit Categories
47 Exploits from Malicious Websites
49 Top Five Web-Based Exploits
50 Top Five Web Exploit Toolkits
51 Obfuscation
51 Flash
51 PDFs
51 Visual Basic Obfuscation
51 Other Obfuscation Techniques

3 IBM X-Force 2009 Trend and Risk Report IBM Security Solutions
53 Web Content Trends
53 Analysis Methodology
54 Percentage of Unwanted Internet Content
54 Increase of Anonymous Proxies
58 Malicious Web Sites
58 Geographical Location of Malicious Web Links
60 Good Web Sites with Bad Links
64 Malware
64 What’s in a Name?
65 Double, Triple, Quad—Categories and Names to the Nth Degree
67 How Did We Get Here?
67 Number of New Samples
67 Blended Threats
67 Multi-Component Threats
68 Next Generation Malware Labeling
68 Malicious Attacks of 2009
69 The Koobface Worm: An In-Depth Look
70 Fraudulent Malware
71 Toolkit Malware
72 Conclusion
74 Spam
74 Spam Volume
75 Types of Spam
76 The Rebirth of Image-Based Spam and a Short Guest Performance of MP3 Spam
78 Common Domains in URL Spam
82 Common Top Level Domains in URL Spam
84 Do Spam URLs Link Back to the Internet?
86 Types of Web Sites Linked to Spam URLs
87 Spam—Country of Origin
88 Spam—Country of Origin Trends
90 Growth in BRIC Countries
90 Spam URLs—Country of Origin
91 Spam URLs—Country of Origin Trends
92 Spam—Average Byte Size
93 Spam—Most Popular Subject Lines
94 Continued Changes After the McColo Takedown—Up and Coming Spammers in New Countries
94 Changes in International Distribution of Spam
96 Phishing
96 Phishing Volume
97 Phishing—Country of Origin
98 Phishing—Country of Origin Trends
99 Phishing URLs—Country of Origin
100 Phishing URLs—Country of Origin Trends
100 Phishing—Most Popular Subject Lines
101 Phishing Targets
101 Phishing—Targets by Industry
103 Phishing—Financial Targets by Geography

4 IBM X-Force 2009 Trend and Risk Report IBM Security Solutions
Contributors
Producing the X-Force Trend and Risk Report is a true labor of love for us. We would like to thank the following individuals for their rapt attention and dedication to the publication of this report.
About the X-Force
The IBM X-Force® research and development teams study and monitor the latest threat trends including vulnerabilities, exploits and active attacks, viruses and other malware, spam, phishing, and malicious Web content. In addition to advising customers and the general public on how to respond to emerging and critical threats, the X-Force also delivers security content to protect IBM customers from these threats.Contributor
Colin Bell
Chris Stevens
Dan Holden
Holly Stewart
Jon Larimer
Marc Noske
Michelle Alvarez
Ralf Iffert
Robert Freeman
Ryan McNulty
Scott Moore
Tom Cross
Vernon Jackson
Title
Principal Consultant, IBM Rational
AppScan onDemand Premium
Software Engineer/Architect,
Virus Prevention System
X-Force Product Manager
X-Force Threat Response Manager &
Trending Queen
X-Force Advanced Research, Malware
Database Administration, Content Security
Analyst, X-Force Threat Analysis Service
(and aka Eagle Eyes)
Manager, Content Security Filter Quality
Senior Technologist & Web Exploit Watchman
IBM Managed Security Services & SQL
Querier Extraordinaire
X-Force Software Developer and X-Force
Database Team Lead
Manager, X-Force Advanced Research
Manager, X-Force Virus Prevention System,
Common Assessment Module, and
X-Force Database

5 IBM X-Force 2009 Trend and Risk Report IBM Security Solutions
Overview
The Threat Landscape Lifecycle
The threat landscape continues to change at a rapid pace with perhaps a better understanding by both the attacker and security professional. More technology, better automation, and a more manageable user experience sums up the tools being used on either side in this day and age. As many things have changed, and some have stayed the same, there is one trend that has become obvious—from the attacker’s perspective, leveraging a singular threat type is never enough. Vulnerabilities, malware, exploit obfuscation, spam, phishing, and malicious URLs are not the only tools in the tool box of the modern day attacker. The attacker now sees this multitude of threat types as one big multi-tool. In other words, modern day attackers are not always interested in just spam, or just malware. Instead, they leverage many aspects of the threat landscape to bring them better returns or closer to their goal of data theft in the form of information or intellectual property.
During the last four years, we have seen a massive increase in Web application vulnerabilities, so much so that these vulnerabilities make up more than half of the disclosed vulnerabilities since 2006. This trend has been important to attackers for several reasons. First is the near extinction of the classic worm and its usage of high-profile vulnerabilities. The IT and security industries both gave focus to and built processes around these types of vulnerabilities with the fear that they might lead to the next big worm. However, Web application vulnerabilities, at least from a Common Vulnerability Scoring System (CVSS) scoring perspective, do not typically rank as high or critical threats. They are generally closer to a medium-level threat. Attackers came to realize that IT and security professionals were on the lookout for and had deployed counter measures for the high-profile vulnerabilities that had served them so well between 2001-2005. There seemed to be a huge blind spot in regards to this new and burgeoning threat landscape.
While SQL injection has been around since late 1998, it was not until the summers of 2008 and 2009 that it really saw wide-scale use by attackers. Sure, SQL injection had been used to rip off usernames, passwords, and other valuable
information held in databases that drive today’s dynamic Web experience. But, never before had we seen botnets, such as Asprox, leverage SQL injection to grow to such a large-scale in place of the same old linear spam/malware model. Drive-by SQL injection had not only come of age, but did so quickly with highly automated tools to help accomplish theft and silent, but financially-lucrative defacement.
In late 2008, we finally saw the worm return but not in the same form as we had known before—no this was a true converged threat, not a classic Blaster-type worm, and certainly not a classic piece of malware with simple known tricks up its sleeves. Conficker leveraged not only a high-profile vulnerability that was extremely new, but also relied upon tried and true malware features such as SMB path traversal and password guessing. It ultimately came equipped with a sophisticated peer-to-peer (P2P) update mechanism as well. This malware was no college student’s pastime hobby as had been the case many years before, but a very well thought out worm that now housed both a vulnerability and malware feature set—a converged threat for a converging threat landscape.
Recently APTs (Advanced Persistent Threats) have garnered a great deal of attention and for good reason. In many ways, APTs are a very old threat idea, almost reminiscent of the 1990 book, The Cuckoo’s Egg. In many cases with APT’s, the attacker is out for highly-sensitive information and intellectual property. At the attackers disposal is a toolbox filled with high-return threats such as spear phishing, 0-day vulnerabilities, and custom malware. While the idea of APTs might not be new, the ability for attackers to leverage multiple parts of the threat landscape in unison is something that continues to add a new twist.
In the end, you might receive an email with a URL or click on a malicious link that could be leveraging cross-site scripting (XSS), which could send you to a malicious site that will attempt to not only exploit a Web browser or browser plug-in vulnerability, but will also heavily obfuscate the exploit, dump malware on your system, and add you to the giant pool of zombies serving any number of botnets. And what will that host be used for once infected? Why, sending more spam of course, so that the new threat landscape lifecycle continues.

6 IBM X-Force 2009 Trend and Risk Report IBM Security Solutions
2009 Highlights
Vulnerabilities and Exploitation
Although Web application vulnerabilities are still the biggest •
category of vulnerabilities, the number of new disclosures are starting to decline as researchers and attackers run out of “low hanging fruit.” Although Web application vendors do well in providing •
patches to their base platforms, the plug-ins that are produced to add functionality to these platforms have a long way to travel. The majority of vulnerabilities affecting these platforms are in plug-ins and are often left without a fix. For client vulnerabilities, ActiveX signatures are continuing •
to decline while document format vulnerabilities still climb. Attackers have quickly shifted focus, creating automated toolkits that pump out malicious PDFs that are then hosted on Web sites and sent over by email in spam or targeted attacks. Three of the five most prevalent malicious Web site exploits •
of 2009 were PDFs, one was a Flash exploit, and the other was an ActiveX control that allows a user to view an Office document through Microsoft Internet Explorer. The use of obfuscation, an attempt to hide these exploits in •
documents and Web pages, has also increased in frequency and in the multitude of techniques in use. The number of high and critical multimedia vulnerabilities •
continue to increase. Unlike document readers, he number of affected products is immense and difficult to manage from a patching perspective Although attacks on multimedia are small in comparison to browser and document attacks, many multimedia components are as ubiquitous as the document readers attackers have most recently targeted.
Malware and the Malicious Web
7.5 percent of the Internet is considered “socially” •
unacceptable, unwanted, or flat out malicious. The number of anonymous proxies have tripled in the past •
two years, providing more opportunities for individuals to hide their browsing behavior. Malware continues to evolve, targeting social networking sites.•
The sheer number of new malware discovered year over year •
has made it difficult to use traditional categories like Trojan, virus, and worm to help users deal with these threats in a meaningful way.
Spam and Phishing
Spam and phishing came back with a vengeance in the second •
half of 2009. At the end of the year, the volume of spam had more than doubled in comparison to the volume seen before the McColo shutdown in late 2008. The majority of spam continues to be URL-based spam. •
Although most of those URLs are hosted in China, the senders of most spam are usually located in other countries, such as Brazil (the top sender in 2009), the US, India, and, new to the top sender’s list, Vietnam (whose spam volume has tripled over the past year). A new trend in URL spam is the use of links to legitimate •
Web sites. Spammers embed these links to legitimate Web sites within the spam Web page. Although this technique is currently used on a small scale, it is likely that it will increase in an attempt to evade reputation scoring. Brazil is also the top sender of phishing emails.•
Although phishers continue to target financial institutions, •
other categories like government organizations and credit cards are gaining ground. Financial phishing is diversifying as phishers trot around the globe from targets in North America, to Europe, then on to Oceania.

7 IBM X-Force 2009 Trend and Risk Report IBM Security Solutions
Vulnerabilities
2009 Vulnerability Disclosure Count
X-Force analyzed and documented a record number of vulnerabilities in 2009. The 6,601 new vulnerabilities represent 19 percent of all vulnerabilities chronicled since the inception of the X-Force Database more than ten years ago.
The rate of vulnerability disclosures in the past few years have reached a high plateau. In 2007, the vulnerability count dropped for the first time, but then in 2008, there was a new record high. The annual disclosure rate appears to be fluctuating between 6 to 7 thousand new disclosures each year.
Vulnerability Disclosures2000-2009
20012000
1,000
0
2,000
3,000
4,000
5,000
6,000
7,000
8,000
2002 2003 2004 2005 2006 2007 2008 2009
Source: IBM X-Force®Figure 1: Vulnerability Disclosures, 2000-2009
To avoid any ambiguity regarding the characterization of vulnerabilities, the IBM definition below is applied to this report:
Vulnerability—Any computer-related vulnerability, exposure, or configuration setting that may result in a weakening or breakdown of the confidentiality, integrity, or accessibility of the computing system. The slowing disclosure rate in 2009 was primarily driven by declines in some of the largest categories of vulnerabilities. Although vulnerabilities affecting Web applications continue to be the largest category of disclosure, major subcategories (SQL injection and file include) have declined, and one of the largest subcategories affecting client applications, ActiveX controls, has also declined.
See Web Application Threats and Vulnerabilities on page 19 and Client Threats and Vulnerabilities on page 28 for more details.

8 IBM X-Force 2009 Trend and Risk Report IBM Security Solutions
Vulnerability Disclosure Timing
In terms of vulnerability disclosure timing, some trends stayed the same in 2009 while changes in the vulnerability marketplace dramatically skewed other trends.
The busiest day of the week remains constant as it has for years, and that day is Tuesday as shown in Figure 2.
Vulnerability Disclosures by Day of Week2006-2009
2009 2008 2007 2006
1600
1800
1400
1200
1000
800
600
400
200
Sun Mon Tue Wed Thur Fri Sat
Source: IBM X-Force®Figure 2: Disclosures by Day of the Week, 2006-2009
The slowest and busiest months varied radically from previous years. This change was driven by a change of hands for one of the most well-known Web sites for vulnerability publication: Milw0rm.
In July of 2009, the owner of Milw0rm announced that he no longer had enough time to publish new vulnerability discoveries with the kind of timeliness he felt they deserved, and so he essentially stopped accepting vulnerability submissions through the Fall. Another group, Offensive Security (whose main initiative is to provide training to security professionals), worked with the owner and others to open up a new venue for these submissions. This operation appeared to be working in full force (and potentially with a backlog of submissions) in December of 2009, and was the main driver behind the surge in vulnerability disclosure activity.
800
700
600
500
400
300
200
100
0
Jan Feb Mar Apr May Jun Jul Aug Sep Oct Nov Dec
2008 2009
Vulnerability Disclosures by Month2008-2009
Source: IBM X-Force®Figure 3: Disclosures by Month, 2008-2009

9 IBM X-Force 2009 Trend and Risk Report IBM Security Solutions
The Criteria
Busiest Day
Slowest Day(s)
Busiest Month
Slowest Month
The Criteria
Tuesday. On average, 30 new vulnerabilities
were disclosed on Tuesdays.
The weekends. Sat and Sun were about the
same for disclosures—around 4 each day.
December. A new record with 745 vulnerability
disclosures. Although December has rarely
been a light month, the reestablishment of
Milw0rm was the primary driver for the marked
increase.
November. A rare low of 323 new
vulnerabilities that month. Again, the primary
driver for the decline was Milw0rm.
Table 1: Busiest and Slowest Days and Months for Vulnerability Disclosures
Vulnerability Disclosures by Severity
The Common Vulnerability Scoring System (CVSS) is the industry standard for rating vulnerability severity and risk based on metrics (base and temporal) and formulas. Base metrics are comprised of characteristics that generally do not change over time. Base metrics include access vector, complexity, authentication, and the impact bias. Temporal metrics are made up of characteristics of a particular vulnerability that can and often do change over time, and include the exploitability, remediation level, and report confidence.
Vulnerabilities identified as Critical by CVSS metrics are vulnerabilities that are installed by default, network-routable, do not require authentication to access and will allow an attacker to gain system or root level access.
Table 2 represents the severity level associated with both base and temporal CVSS scores.
CVSS Score
10
7.0-9.9
4.0-6.9
0.0-3.9
Severity Level
Critical
High
Medium
Low
Table 2: CVSS Score and Corresponding Severity Level
For more information about CVSS, a complete explanation of the system and its metrics are on the First.org Web site at http://www.first.org/cvss/.
CVSS Base Scores
In 2008, medium and low vulnerabilities saw a significant shift in base score percentages. The percentage of low vulnerabilities decreased and the percentage of medium vulnerabilities increased. The percentages in 2009 are relatively similar to 2008—no significant changes.
70%
60%
50%
40%
30%
20%
10%
0%20082007 2009
Medium HighLow Critical
Vulnerability Disclosures by Severity2007-2009
Source: IBM X-Force®Figure 4: CVSS Base Scores, 2007-2009

10 IBM X-Force 2009 Trend and Risk Report IBM Security Solutions
Exploitability Probability Quadrant
Although CVSS is a good mechanism for scoring the ease of exploitation and criticality of exploitation, it does not yet take into account the monetization, the attacker motivation, or the cost of exploiting a given vulnerability. The X-Force Exploitability Probability quadrant incorporates the ease of exploitation along with the benefits and costs from the attacker perspective. Some of the most critical (and/or hyped) vulnerabilities disclosed in the second half of 2009 along with those discovered by X-Force are mapped in Figure 5. These vulnerabilities are described in detail on the X-Force Alert and Advisory page at http://www.iss.net/threats/ThreatList.php.
IBM X-Force only published 11 alerts and advisories during the first half of 2009. During the second half we published 29—a clear indication that computer networks faced a more heightened and complicated threat environment during the later part of the year. Twenty two of those 29 vulnerabilities fit into the first quadrant of our exploitation matrix, which means that they are relatively easy to exploit and monetize, and they represent a large value to attackers. Many of these vulnerabilities can be leveraged with publicly-distributed exploit code. These attacks target popular products such as Adobe Acrobat, Adobe Flash, Microsoft Internet Explorer, and Mozilla Firefox, as well as a potentially “wormable” vulnerability affecting SMBv2. In some cases, exploits are only available in limited communities, although there are a few vulnerabilities for which no exploit is circulating as far as we know.
It is worth noting the difference in how we gauge the opportunity presented by the NSS Certificate Bypass vulnerability disclosed in August versus the Transport Layer Security handshake renegotiation issue disclosed in November. Both vulnerabilities require the attacker to use a man-in-the-middle attack on the victim’s internet connectivity, so they are both equally difficult to exploit. However, the NSS Certificate Bypass is far more valuable, because it allows the attacker to completely compromise the victim’s encrypted HTTPS session and observe the private data being communicated across it. The TLS handshake issue is of more limited value. In some cases, it merely allows an attack which is equivalent to cross-site request forgery. There are some more serious circumstances in which the attack can be used to steal authentication cookies or other more private information, but this vulnerability does not approach the breadth and impact of total certificate forgery.
We placed the Novell E-Directory Remote Code Execution vulnerability discovered by Chris Valasek and John McDonald of IBM X-Force squarely in the second quadrant, which is for vulnerabilities that are high value but difficult or expensive to exploit or monetize. For a detailed explanation of just how difficult this vulnerability was to exploit, read through Chris’s post on the X-Force blog (http://blogs.iss.net/archive/2009bhtalkexplained.html) and look at the talk Chris and John gave at Blackhat 2009 in Las Vegas. Their talk highlights just how challenging it has become to get remote code execution on modern operating systems, as software vendors have improved their built-in protections against exploitation.

11 IBM X-Force 2009 Trend and Risk Report IBM Security Solutions
EXPENSIVE CHEAP
LIT
TLE
LOTS
Monetization & Exploit Cost
Op
po
rtun
ity
13
14
3
51 2
18
17
19
9
16
12 1078
116
4
15
1 December 15, 2009
October 9, 2009
July 22, 2009
Adobe Acrobat and Acrobat Reader Remote Code Execution
Adobe Acrobat and Acrobat Reader Remote Code Execution
Adobe Acrobat and Adobe Flash Remote Code Execution
11 August 11, 2009 Microsoft WINS Replication Remote Code Execution Vulnerability
12 August 11, 2009
July 28, 2009
July 28, 2009
Microsoft Windows RDP Services Client ActiveX Control Remote Code Execution Vulnerability
Microsoft Internet Explorer ATL Killbit Evasion Vulnerability
Multiple Microsoft Visual Studio Active Template Remote Code Execution Vulnerabilities
13 November 9, 2009 Transport Layer Security (TLS) Handshake Renegotiation Vulnerability
14 August 11, 2009 ISC BIND dns_db_findrdataset() DoS Vulnerability
15 September 2, 2009 Microsoft Internet Information Services FTP Remote Code Execution Vulnerability
16 December 9, 2009 HP OpenView Network Node Manager Remote Code Execution Vulnerability
17 December 1, 2009 Novell eDirectory Remote Code Execution Vulnerability
18 July 14, 2009 ISC DHCP Client Buffer Overflow Vulnerability
19 October 13, 2009 Microsoft Internet Explorer Arguments Remote Code Execution Vulnerability
2 November 23, 2009
July 6, 2009
July 20, 2009
Microsoft Internet Explorer mshtml.dll RCE
Multiple Microsoft Video Control ActiveX Remote Code Execution Vulnerabilities
Microsoft Office Web Components Spreadsheet ActiveX Control RCE
3 September 10, 2009 Microsoft Windows SRV2.SYS Remote Code Execution Vulnerability
July 16, 2009 Mozilla Firefox Font HTML Tags Remote Code Execution Vulnerability
July 14, 2009 Multiple Microsoft DirectShow Remote Code Execution Vulnerabilities
November 10, 2009 Microsoft Windows WSDAPI Remote Code Execution Vulnerability
August 11, 2009 Network Security Services (NSS) Parser Remote Code Execution Vulnerability
August 11, 2009 Network Security Services (NSS) Certificate Security Bypass Vulnerability
10 October 13, 2009
August 11, 2009
November 10, 2009
July 14, 2009
Multiple Microsoft Windows GDI+ Image Remote Code Execution Vulnerabilities
Microsoft Windows AVI Remote Code Execution Vulnerability
Microsoft Windows Kernel Font Code Execution Vulnerability
Multiple Microsoft Windows Embedded OpenType Font Engine Remote Code Execution Vulnerabilities
7 October 13, 2009
September 8, 2009
Microsoft Windows Indexing Service ActiveX Control Remote Code Execution Vulnerability
Microsoft Windows JScript Remote Code Execution Vulnerability
4
5
6
8
9
Exploitability Probability
Source: IBM X-Force®Figure 5: X-Force Exploitability Probability Quadrant, 2009 H2

12 IBM X-Force 2009 Trend and Risk Report IBM Security Solutions
Vendors with the Most Vulnerability Disclosures
The IBM X-Force follows an industry standard called CPE™, or Common Platform Enumeration, to associate each vulnerability with affected platforms and vendors.
Common Platform Enumeration— “A structured naming scheme for information technology systems, platforms, and packages. Based upon the generic syntax for Uniform Resource Identifiers (URI), CPE includes a formal name format, a language for describing complex platforms, a method for checking names against a system, and a description format for binding text and tests to a name”—MITRE For more information, see : http://cpe.mitre.org Vulnerability disclosures for the top ten vendors in 2009 accounted for approximately 23.1 percent of all disclosed vulnerabilities, up nearly four percentage points over 2008. Table 3 reveals who the top ten vendors are and their percentages of vulnerabilities in 2009.
These statistics do not balance vulnerability disclosures with market share, number of products, or the lines of code that each vendor produces. In general, mass-produced and highly distributed or accessible software is likely to have more vulnerability disclosures.
25%
24%
23%
22%
21%
20%
19%
18%
17%
16%
15%
20082007 2009
Percentage of Vulnerability DisclosuresAttributed to Top Ten Vendors
2007-2009
Source: IBM X-Force®Figure 6: Percentage of Vulnerability Disclosures Attributed to Top Ten Vendors, 2007-2009
Changes in the Top Vendor List
A few changes in the top vendor list are notable. First is the position of Microsoft. After holding the top vendor spot for three years in a row (2006/3.1 percent, 2007/3.7 percent, 2008/3.16 percent), it has dropped down to number three. Apple has taken the number one slot, and Sun, who broke the top five for the first time in 2008, is in second place as the vendor with the most vulnerability disclosures for 2009.
The other significant change in this top ten list is the entrance of Adobe, who has taken a beating from attackers over the past one and a half years. After losing focus on operating systems and non-ActiveX related browser vulnerabilities, attackers have turned their attention to using malicious documents to surreptitiously infiltrate victims. Adobe has been busy organizing a robust incident response and update policy, instituting scheduled quarterly updates for Adobe Reader and Adobe Acrobat that coincide with the standard patch Tuesday put in place by Microsoft many years ago. For more information about the changing landscape of document vulnerabilities, see Document Reader and Editor Vulnerabilities on page 30.

13 IBM X-Force 2009 Trend and Risk Report IBM Security Solutions
Ranking
1.
2.
3.
4.
5.
6.
7.
8.
9.
10.
Vendor
Apple
Sun
Microsoft
IBM
Oracle
Mozilla
Linux
Cisco
Adobe
HP
Disclosures
3.8%
3.3%
3.2%
2.7%
2.2%
2.0%
1.7%
1.5%
1.4%
1.2%
Table 3: Vendors with the Most Vulnerability Disclosures, 2009
Top Ten Vendors: 23%
Others: 77%
Percentage of Vulnerability DisclosuresAttributed to Top Ten Vendors
2009
Source: IBM X-Force®
Figure 7: Percentage of Vulnerability Disclosures Attributed to Top Ten Vendors, 2009
Where Did the Web Application Vendors Go?
In the past few reports, X-Force has included several Web application vendors in the top ten vendor list. These Web application platforms reached the top ten list because we included in our totals the vulnerabilities in the base platform as well as vulnerabilities in the plug-ins that operate on that platform. However, many of the plug-ins associated with those Web application platform vulnerabilities were not produced by the vendor themselves. The plug-ins are oftentimes simply hosted on the vendor’s Web sites.
Part of the draw of these open-source projects is this diversity of plug-ins that broadens the utility of these platforms. However, these plug-ins fall victim to vulnerabilities like all software, and, without proper accountability, may not receive fixes or patches like software normally supported by commercial or open source vendors.
In this report, several new charts, shown in the Web Application Platforms with the Most Vulnerability Disclosures section on page 22, balance this need for accountability and also provide more clarity into the way these vulnerabilities are attributed to Web application vendors.

14 IBM X-Force 2009 Trend and Risk Report IBM Security Solutions
Availability of Vulnerability Fixes and Patches
At the end of 2009 (as was also the case at the end of 2008), over half (52 percent) of all vulnerabilities disclosed during the year had no vendor-supplied patches available to remedy the vulnerability. Vendors do not always go back to patch previous year’s vulnerabilities. Only an additional two percent of vulnerabilities left unpatched at the end of 2008 were patched in 2009, while 2006 and 2007 vulnerabilities each saw another one percent increase based on patches released in 2009 for vulnerabilities disclosed in those previous years.
Source: IBM X-Force®
65%
60%
55%
50%
45%
40%
2006 2007 2008 2009
65% 50% 52% 52%
46% 44% 52%
45% 43% 50% 52%
Vulnerability Disclosure Year
No patch during disclosure year
No patch at the end of 2008
No patch at the end of 2009
Percentage of Vulnerabilities with Vendor-SuppliedPatches by Vulnerability Disclosure Year
2006-2009
Figure 8: Percentage of Vulnerabilities with Vendor-Supplied Patches by Vulnerability Disclosure Year, 2006-2009
The top ten vendors with the most vulnerability disclosures did significantly better, with only 21 percent without patches, especially when compared to the remaining vendors that left 62 percent of their 2009 vulnerabilities without a patch.
These calculations take into account vendors that have publicly acknowledged a vulnerability and released a corresponding fix or patch. They do not take into account cases where a vendor silently fixes a vulnerability without an announcement, or when a patch is released by a third-party vendor.
Best and Worst Patchers
The following chart provides an analysis of vendors with twenty or more disclosures in 2009. Web application platforms (like Apache, WordPress, Joomla!, etc.) are excluded from this analysis. For more information about patches for those platforms, see Web Application Platforms with the Most Vulnerability Disclosures on page 22.

15 IBM X-Force 2009 Trend and Risk Report IBM Security Solutions
Several vendors had stellar records in 2009. Rim, Mozilla, GNU, Cisco, Adobe and HP left five percent or less of their critical and high vulnerabilities without patches by the end of 2009. Other vendors did not fare so well. The numbers in Table 4 speak for themselves.
Vendor
All Vendors–
2009 Average
Linux
Oracle
Novell
IBM
Apple
Microsoft
Sun
Symantec
HP
Adobe
Cisco
Opera
GNU
Mozilla
Rim
Percent of 2009 Disclosures with No Patch
52%
50%
40%
27%
25%
47%
14%
29%
7%
18%
16%
4%
11%
47%
33%
15%
14%
Percent of Critical & High 2009 Disclosures with No Patch
60%
53%
38%
31%
27%
25%
22%
15%
8%
7%
5%
4%
1%
0%
0%
0%
0%
Table 4: Best and Worst Patchers, 2009
Remotely Exploitable Vulnerabilities
The most significant vulnerabilities are those that can be exploited remotely, because they do not require physical access to a vulnerable system. Remote vulnerabilities can be exploited over the network or Internet, while local vulnerabilities need direct system access. Vulnerabilities falling into both remote and local categories are those that can be exploited by both vectors.
In the past four years, remotely exploitable vulnerabilities have grown from 85 percent to 92 percent of all vulnerability disclosures. Figure 9 shows the growth in remotely exploitable vulnerabilities year over year.
Percentage of Remotely Exploitable Vulnerabilities 2000-2009
100%
90%
80%
70%
60%
50%
40%
30%
20%
10%
0%2000 2001 2002 2003 2004 2005 2006 2007 2008 2009
Source: IBM X-Force®Figure 9: Percentage of Remotely Exploitable Vulnerabilities, 2000-2009

16 IBM X-Force 2009 Trend and Risk Report IBM Security Solutions
Consequences of Exploitation
X-Force categorizes vulnerabilities by the consequence of exploitation. This consequence is essentially the benefit that exploiting the vulnerability provides to the attacker. Table 5 describes each consequence.
Table 5: Definitions for Vulnerability Consequences
Consequence
Bypass Security
Data Manipulation
Denial of Service
File Manipulation
Gain Access
Gain Privileges
Obtain Information
Other
Definition
Circumvent security restrictions such as a firewall or proxy, and IDS system or a virus scanner
Manipulate data used or stored by the host associated with the service or application
Crash or disrupt a service or system to take down a network
Create, delete, read, modify, or overwrite files
Obtain local and remote access. This also includes vulnerabilities by which an attacker can execute
code or commands, because this usually allows the attacker to gain access to the system
Privileges can be gained on the local system only
Obtain information such as file and path names, source code, passwords, or server configuration details
Anything not covered by the other categories

17 IBM X-Force 2009 Trend and Risk Report IBM Security Solutions
The most prevalent primary consequence of vulnerability exploitation continues to be Gain Access. Gaining access to a system provides an attacker complete control over the affected system, which would allow them to steal data, manipulate the system, or launch other attacks from that system. Most other attack vectors also remain similar to previous years, with the exception of Data Manipulation, which practically doubled in 2008 due to the rise in SQL injection Web application vulnerabilities, as described in Web Application Threats and Vulnerabilities on page 19.
Vulnerability Consequences as a Percentage of Overall Disclosures
2006-2009
Source: IBM X-Force®
60%
50%
40%
30%
20%
10%
0%
2006 2007 2008 2009
Gain Access
Data Manipulation
Denial of Service
Obtain Information
Bypass Security
Gain Privileges
Other
File Manipulation
Figure 10: Vulnerability Consequences as a Percentage of Overall Disclosures, 2006-2009
Operating System Vulnerabilities
The following operating system analysis counts unique vulnerabilities reported for a single genre of operating system. For example, this analysis compares all vulnerabilities reported for Microsoft operating systems and compares them to all of the vulnerabilities reported for Apple operating systems in any given year. If a certain vulnerability applies to multiple versions of operating systems in that genre, it is only counted one time. For example, if a certain CVE applies to both Apple Mac OS X and also Apple Mac OS X Server, it is only counted one time for the Apple genre.
All Operating Systems Vulnerabilities
In the first half of this year, Sun Solaris leapt to the top (mostly likely due to a change in their vulnerability disclosure policy). However, in the second half of 2009, the number of new vulnerabilities released for Sun Solaris drastically declined, and those for the Linux core and Microsoft took a sharp turn upwards. Another change is that BSD is in the number five slot, replacing IBM AIX who was fifth in 2008.
Vulnerability Disclosures Affecting Operating Systems2005-2009
Source: IBM X-Force®
120
100
80
60
40
20
0
Apple Linux Sun Solaris Microsoft BSD
2005
H1 H2
2006
H1 H2
2007
H1 H2
2008
H1 H2
2009
H1 H2
Figure 11: Vulnerability Disclosures Affecting Operating Systems, 2005-2009

18 IBM X-Force 2009 Trend and Risk Report IBM Security Solutions
Critical and High Operating System Vulnerabilities
Focusing on critical and high vulnerabilities is another way to look at this issue. From a protection standpoint, these high-severity vulnerabilities are typically the ones we most worry about since they often lead to complete remote compromise, the prize possession of attackers. When you filter out the mediums and lows, Microsoft operating systems take first place in 2008 and in 2009. Apple is in second place. Sun Solaris and Linux are in a close race for third and fourth place, while BSD does show up, again, here in fifth place.
Source: IBM X-Force®
Critical and High Vulnerability DisclosuresAffecting Operating Systems
2005-2009
50
45
40
35
30
25
20
15
10
5
0
Apple Linux Sun SolarisMicrosoft BSD
2005
H1 H2
2006
H1 H2
2007
H1 H2
2008
H1 H2
2009
H1 H2
Figure 12: Critical and High Vulnerability Disclosures Affecting Operating Systems, 2005-2009
Why Not Use CPE to Count Operating Systems?
In our 2008 report, X-Force presented an analysis of operating systems with the most vulnerabilities. These vulnerabilities were counted according to how each vendor reports their platforms through the Common Platform Enumeration (or CPE). There are slight differences in how some vendors classify their platforms. For example, Linux has a platform called “Linux kernel,” but vulnerabilities reported for that “platform” may also
affect other Linux versions even though they may not be officially reported for that platform as it is reported in CPE. Other differences included the way that vendors classify a platform. Apple, for example, combines all versions of their Apple Mac OS X software into a single “platform” and only differentiates between the server and desktop versions of the software. Microsoft calls each of its major operating systems “platforms” even though some of these platforms may be considered by other individuals to be “versions” of Windows.
So, instead of counting vulnerabilities according to the named “platforms” in CPE, this report merges similar platforms together (all Windows, all Apple) and only counts a single vulnerability affecting multiple version of a particular genre of operating system one time.
How to Win the Operating System Religious War
The answer? Stop fighting, because operating systems are not the problem anymore.
Everyone loves to tout how their favorite operating system is so much faster, simpler, better and MORE SECURE than anyone else’s favorite operating system. The truth of the issue is operating systems are no longer the problem—it is the diverse array of applications that run on them that are the problem. Many core statistics elsewhere in this report attest to that fact. Vulnerability disclosures for operating systems represent about a fifth of all the vulnerabilities affecting clients over the past two years. For many years, organizations have been busy putting patch operations in place that ensure that operating systems are patched and protected as soon as possible. So, although the operating system is ubiquitous software, the previous two factors combined make them much more difficult to successfully attack. Other components, like the Web browser and malicious documents have pushed operating systems aside. For more about these new trends, see Client Threats and Vulnerabilities on page 28.

19 IBM X-Force 2009 Trend and Risk Report IBM Security Solutions
Web Application Threats and Vulnerabilities
The most prevalent type of vulnerability affecting servers today is unquestionably vulnerabilities related to Web applications.
Although the number of vulnerabilities affecting Web applications has grown at a staggering rate, the growth demonstrated in the first half of 2009 and continuing through the second half may indicate the start of a plateau, at least in standard (off-the-shelf) software applications for the Web. These figures do not include custom-developed Web applications or customized versions of these standard packages, which also introduce vulnerabilities.
20,000
18,000
16,000
14,000
12,000
10,000
8,000
6,000
4,000
2,000
0
1998 1999 2000 2001 2002 2003 2004 2005 2006 2007 2008 2009
Cumulative Count of Web Application Vulnerability Disclosures
1998-2009
Source: IBM X-Force®Figure 13: Cumulative Count of Web Application Vulnerability Disclosures, 1998-2009
Percentage of Vulnerability Disclosuresthat Affect Web Applications
2009
Others: 51%Web Applications: 49%
Source: IBM X-Force®Figure 14: Percentage of Vulnerability Disclosures that Affect Web Applications, 2009

20 IBM X-Force 2009 Trend and Risk Report IBM Security Solutions
Web Application Vulnerability Disclosures by Attack Categories
The predominate types of vulnerabilities affecting Web applications are cross-site scripting (XSS), SQL injection, and file include vulnerabilities. By the end of 2009 Cross-Site Scripting vulnerability disclosures had once again surpassed the number of SQL Injection disclosures, putting that category back in the number one spot.
Figure 15 shows how Cross-Site Scripting, SQL injection, and other major categories of Web application vulnerabilities have changed over the years, and Table 6 describes each category including the impact they can have on organizations and the customers they serve.
2004 2005 2006 2007 2008
Cross-Site Scripting SQL Injection Other File Include
2009
50%
45%
40%
35%
30%
25%
20%
15%
10%
5%
0%
Web Application Vulnerabilities by Attack Technique 2004-2009
Source: IBM X-Force®Figure 15: Web Application Vulnerabilities by Attack Technique, 2004-2009

21 IBM X-Force 2009 Trend and Risk Report IBM Security Solutions
Attack Technique
Cross-site Scripting
SQL Injection
File Include
Other
Description
Cross-site scripting vulnerabilities occur when Web applications do not properly validate user input from
form fields, the syntax of URLs, etc. These vulnerabilities allow attackers to embed their own script into a
page the user is visiting, manipulating the behavior or appearance of the page. These page changes can
be used to steal sensitive information, manipulate the Web application in a malicious way, or embed more
content on the page that exploits other vulnerabilities.
The attacker first has to create a specially-crafted Web link, and then entice the victim into clicking it
(through spam, user forums, etc.) The user is more likely to be tricked clicking the link, because the domain
name of the URL is a trusted or familiar company. The attack attempt may appear to the user to come from
the trusted organization itself, and not the attacker that compromised the organization’s vulnerability.
SQL injection vulnerabilities are also related to improper validation of user input, and they occur when
this input (from a form field, for example), is allowed to dynamically include SQL statements that are then
executed by a database. Access to a back-end database may allow attackers to read, delete, and modify
sensitive information, and in some cases, execute arbitrary code.
In addition to exposing confidential customer information (like credit card data), SQL injection
vulnerabilities can also allow attackers to embed other attacks inside the database that can then be used
against visitors to the Web site.
File include vulnerabilities (typically found in PHP applications) occur when the application retrieves code
from a remote source to be executed in the local application. Oftentimes, the remote source is not validated
for authenticity, which allows an attacker to use the Web application to remotely execute malicious code.
This category includes some denial-of-service attacks and miscellaneous techniques that allow attackers
to view or obtain unauthorized information, change files, directories, user information or other components
of Web applications.
Table 6: Description of the Most Prevalent Categories of Web Application Vulnerabilities

22 IBM X-Force 2009 Trend and Risk Report IBM Security Solutions
Web Application Platforms with the Most Vulnerability Disclosures
As mentioned in the Vendors with the Most Vulnerability Disclosures section on page 14, Web application platforms represent a special case when it comes to counting vulnerabilities. The utility of these platforms is extended by plug-ins to the base application. These plug-ins may or may not be produced by the Web application vendor themselves, which makes counting vulnerabilities affecting these platforms a bit tricky. In the past few years, several of these platforms have shown up in our top 10 vendor list because we were reporting platform and plug-in vulnerabilities. This year, we will report them separately in this section.
Web applications and Web development language platforms that had 20 or more vulnerability reports in 2009 are included in this analysis. The vulnerabilities reported for these platforms make up 8.3 percent of all the disclosures in 2009. As shown in Figure 16, 81 percent of these disclosures affect plug-ins and not the base platform.
Apache Wordpress PHP TYPO3 Joomla! Drupal
* Web Application platforms with 20 or more vulnerabilities in 2009
300
350
400
450
500
250
200
150
100
50
0Platforms Plug-Ins
Platforms:19%
Plug-ins:81%
Web Applications Platforms*Vulnerabilities in Plug-Ins Versus the Base Platform
2009
Source: IBM X-Force®Figure 16: Web Application Platform Vulnerabilities, Plug-ins Versus Platform Vulnerabilities, 2009
Table 5 demonstrates how many of these vendors originally started showing up on our top vendor list. When compared to Vendors with the Most Vulnerability Disclosures on page 12, the number of vulnerabilities affecting several of these platforms and their plug-ins (Drupal, Joomla!, and TYPO3 specifically) would have earned them enough credit to show up on the top vendor list.
Platform
Apache
Drupal
Joomla!
PHP
TYPO3
Wordpress
Base Platform
0.3%
0.2%
0.2%
0.4%
0.3%
0.2%
Plug-ins
0.1%
2.5%
2.5%
0.2%
1.2%
0.2%
Total
0.4%
2.7%
2.6%
0.6%
1.5%
0.4%
Percent of All Vulnerability Disclosures in 2009
Table 7: Percentage of Vulnerability Disclosures Attributed to Web Application Platforms and Their Plug-ins, 2009
When it comes to providing patches to fix these vulnerabilities, the base platforms for all of these vendors beat the 2009 average for all vendors (52 percent), and exceedingly surpass the average for Web application vulnerabilities (67 percent, a better average in comparison to 2008 when about three-fourths of Web application vulnerabilities were left without a patch.)

23 IBM X-Force 2009 Trend and Risk Report IBM Security Solutions
When it comes to plug-ins however, the sweet song sours, and plug-ins for some applications fare worse than others. Eighty percent or more of the vulnerabilities affecting plug-ins for Apache and Joomla!, for example, had no patch.
Platform
Apache
Drupal
Joomla!
PHP
TYPO3
Wordpress
Base Platform
23%
18%
8%
42%
5%
13%
Plug-ins
86%
13%
80%
15%
51%
57%
Percent of Vulnerabilities with No Patch
Table 8: Percentage of Web Application Platforms & Plug-in Vulnerability Disclosures without a Patch, 2009
Moral of the Story
Enough with the statistics—so what is the point? The point is that even though Web application vendors ultimately have very few vulnerabilities that are attributed to the code that they produce, if your organization is heavily reliant on the many plug-ins provided to support these applications, spend some time to investigate and remediate any disclosed vulnerabilities. Better yet, fully assess the finished product with a Web application scanner before deployment to ensure that no undisclosed vulnerabilities exist or were introduced during the development process. As the next section describes, 63 percent of real-world Web applications tested through the IBM Rational AppScan onDemand Premium service are likely to have one or more critical or high-severity Web application vulnerabilities. Ensuring that these applications are safe before they are deployed will help prevent your Web site from becoming a springboard for attackers.
Conclusions from Real-World Web Application Assessments
Methodology
IBM has collated real-world vulnerability data from 168 security tests conducted over the past three years from the IBM Rational AppScan onDemand Premium service.1 This service combines application security assessment results obtained from IBM Rational AppScan with manual security testing and verification. In all cases, false positives were removed from the results and the remaining vulnerabilities were categorized into one of the following:
Cross-Site Request Forgery•
Cross-Site Scripting•
Error Message Information Leak•
Improper Access Control•
Improper Application Deployment•
Improper Use of SSL•
Inadequate / Poor Input Control•
Information Disclosure•
Insufficient Web Server Configuration•
Non Standard Encryption•
SQL Injection•
For each of these categories, two core metrics were calculated for each category:
The percent chance of finding at least one vulnerability in 1. that category The average number of vulnerabilities that are likely to be 2. found in that category
In addition to these vulnerability categories, each of the application assessments was categorized into one of the following industry verticals:
Financials•
Health, Medical & Education•
Industrials•
Information Technology•
Retail & Logistics•
Telecommunications•
1 Special thanks to Colin Bell, Principal Consultant, IBM Rational AppScan onDemand Premium for providing this data.

24 IBM X-Force 2009 Trend and Risk Report IBM Security Solutions
Improvements Noted, but Additional Improvements Needed
Several conclusions can be derived from our application assessment data, many of which indicate trends in the susceptibility of Web sites to these vulnerabilities. Some vulnerability types have increased in number, while others have declined.
The number of Cross-Site Request Forgery (CRSF) vulnerabilities significantly increased. The likelihood of CRSF occurring in a 2007 assessment was 22 percent, but this percentage increased to 59 percent in 2009. This change is attributed to better detection techniques for this weakness and also a greater awareness of the risk.
70%
60%
50%
40%
30%
20%
10%
0%2007 2008 2009
Cross-Site Request Forgery Non Standard Encryption
Areas of Increasing Web Application RisksIBM Rational AppScan onDemand Premium Service
2007-2009
Source: IBM X-Force®Figure 17: Areas of Increasing Web Application Risks, IBM Rational AppScan onDemand Premium Service 2007-2009
SQL Injection vulnerabilities dropped considerably. The likelihood of finding a SQL injection finding in 2007 was 33 percent, however it dropped to 18 percent in 2009.
Cross-Site Scripting (XSS) vulnerabilities have also dropped, although they still remain one of the most prevalent vulnerabilities. In 2007, the likelihood of finding XSS was 83 percent, dropping to 64 percent in 2009. Inadequate Input control is the most prevalent developer-related issue, and it is directly attributed to XSS and SQL Injection findings. The likelihood of finding Inadequate Input Control in 2009 is almost 70 percent.
80%
70%
60%
50%
40%
30%
20%
10%
0%
90%
2007 2008 2009
Inadequate/PoorInput Control
Insufficient WebServer Configuration
ImproperAccess Control
SQL Injection Error MessageInformation Leak
Cross-SiteScripting
Web Application Security ImprovementsIBM Rational AppScan onDemand Premium Service
2007-2009
Source: IBM X-Force®Figure 18: Web Application Security Improvements, IBM Rational AppScan onDemand Premium Service 2007-2009

25 IBM X-Force 2009 Trend and Risk Report IBM Security Solutions
Most Prevalent Web Application Vulnerabilities by Industry
The following charts show which vulnerabilities were 50 percent or more likely to appear in a Web assessment for each industry.
Category
Cross-Site Scripting
Inadequate / Poor Input Control
Information Disclosure
Error Message Information Leak
Improper Application Deployment
Cross-Site Request Forgery
Avg # Vulns
91.5
94.7
30.1
45.5
3.1
5.3
% Likely to Occur
95%
95%
84%
79%
79%
74%
Telecommunications
Category
Inadequate / Poor Input Control
Cross-Site Scripting
Improper Application Deployment
Improper Access Control
Error Message Information Leak
Improper Use of SSL
Information Disclosure
Avg # Vulns
47.5
14.6
4.1
2.5
39.8
15.8
4.1
% Likely to Occur
95%
89%
84%
84%
74%
58%
58%
Information Technology
Category
Improper Use of SSL
Error Message Information Leak
Cross-Site Scripting
Inadequate / Poor Input Control
Information Disclosure
Insufficient Web Server Configuration
Avg # Vulns
26.8
15.0
21.2
22.9
5.1
5.6
% Likely to Occur
76%
74%
68%
63%
63%
55%
Retail and Logistics
Category
Cross-Site Scripting
Inadequate / Poor Input Control
Information Disclosure
Error Message Information Leak
Insufficient Web Server Configuration
Improper Use of SSL
Improper Application Deployment
Avg # Vulns
11.9
19.7
8.6
9.7
16.3
30.2
1.4
% Likely to Occur
91%
82%
82%
73%
64%
55%
55%
Health, Medical and Education

26 IBM X-Force 2009 Trend and Risk Report IBM Security Solutions
Some observations about this industry data are:
63% of the applications tested had at least one high or critical •
risk finding. CRSF findings are increasing in all verticals. However, they •
are the highest in Telecommunication sector applications at 74 percent and the lowest in retail & logistic applications at 16 percent. SQL Injection is much more likely to occur in Information •
Technology (including “dot com”) applications (37 percent) than in Financial Services applications (8 percent). Secure coding techniques attributed to input control is far •
more likely to occur in Telecommunications sector (95 percent) than in the Financial Services sector (61 percent) XSS findings differ greatly from one industry to another: •
Telecommunications is the highest at 95 percent and Financial Services is the lowest at 58 percent.
Recommendations
While the data indicates both increasing and decreasing prevalence of various vulnerabilities, it also demonstrates the continuing need for organizations to maintain or develop awareness of the risk from application vulnerabilities and to then employ strategies to mitigate that risk. At a minimum, organizations should engage consultants to assess their applications and enable them to address the vulnerabilities before the applications are deployed. From there, organizations should look to deploying automated testing solutions to identify and remediate the vulnerabilities themselves. To realize cost efficiencies, the scaling of security testing can be deployed into the development process to address security issues at the root cause—where the code is created. Alongside this type of proactive approach to application security, organizations can look to employ secure coding practices in an effort to eliminate the vulnerabilities being introduced in the first place.
Category
Improper Use of SSL
Improper Access Control
Error Message Information Leak
Inadequate / Poor Input Control
Cross-Site Scripting
Information Disclosure
Improper Application Deployment
Avg # Vulns
61.5
3.2
36.2
12.0
11.3
2.0
2.6
% Likely to Occur
84%
76%
71%
61%
58%
55%
50%
Financial Services
Category
Inadequate / Poor Input Control
Error Message Information Leak
Cross-Site Scripting
Information Disclosure
Cross-Site Request Forgery
Avg # Vulns
35.8
14.7
31.7
17.3
7.7
% Likely to Occur
72%
67%
65%
58%
58%
Industrials

27 IBM X-Force 2009 Trend and Risk Report IBM Security Solutions
Web Application Attacks
The IBM Managed Security Service (MSS) data also provides real-world insight into the most prevalent types of Web application vulnerabilities and their exploitation. Similar to vulnerability disclosures, cross-site scripting and injection attacks dominate the attack landscape.
The following chart provides an overview of the most prevalent types of Web application exploits as seen in our global MSS operations, and the table below it provides a definition for the attack categories. Unfortunately, many Web sites incorporate code that introduces vulnerabilities to support a feature or function, such as using SQL injection to get data from a Web form, so some legitimate usage may look like an attack attempt.
70,000,000
0
20,000,000
10,000,000
30,000,000
40,000,000
50,000,000
60,000,000
Jan Feb Mar Apr Jun May Jul Aug Sep Oct Nov Dec
2009
Cross-Site Scripting Injection Attacks Information Disclosure
Path Traversal Buffer Overflow Malicious File Execution
Web Applicaction Attacks by CategoryIBM Managed Security Service
2009
Source: IBM X-Force®Figure 19: Web Application Attacks by Category, IBM Managed Security Services 2009
Attack Category
Buffer Overflow attacks
Cross-site Scripting attacks
Information Disclosure attacks
Injection attacks
Malicious File Execution attacks
(also known as file include attacks)
Path Traversal attacks
Description
This type of attack overflows a buffer with excessive data, which allows an attacker to run remote shell
on the computer and gain the same system privileges granted to the application being attacked.
This type of attack exploits the trust relationship between a user and the Web sites they visit.
This type of attack is aimed at acquiring system specific information about a Web site including software
distribution, version numbers, and patch levels. The acquired information might also contain the location
of backup files or temporary files.
This type of attack allows an attacker to inject code into a program or query or inject malware onto a
computer in order to execute remote commands that can read or modify a database, or change data
on a Web site.
This type of attack allows an attacker to perform remote code execution, remote root kit installation,
complete system compromise, and internal system compromise (on Windows systems) through the
use of SMB file wrappers for the PHP scripting language.
This type of attack forces access to files, directories, and commands that are located outside the Web
document root directory or CGI root directory.
Table 9: Description of the Most Prevalent Categories of Web Application Attacks

28 IBM X-Force 2009 Trend and Risk Report IBM Security Solutions
Client Threats and Vulnerabilities
In 2009, client–side vulnerabilities declined by 5 percent in comparison to 2008. Still, these vulnerabilities, which affect personal computers, continue to represent the second-largest category of vulnerability disclosures after Web application vulnerabilities and represent about a fifth of all vulnerability disclosures.
Client-side vulnerabilities: Vulnerabilities affecting the operating system or applications running on personal computers. In addition to the core operating system, vulnerable components could include e-mail clients, Web browsers, document viewers, and multimedia applications. In 2009, medium priority vulnerabilities represent the majority (62 percent) of all disclosures affecting client-side software, and the number of vulnerabilities in this category increased by 10 percent in comparison to 2008. The number of high and critical vulnerabilities affecting client-side applications dramatically dropped by 19 percent. High and critical vulnerabilities are the most important for client security, because they are typically the simplest to exploit and provide full control over the user’s computer with little interaction, such as clicking a link or requiring no interaction at all.
1000
900
800
700
600
500
400
300
200
100
02005 2006 2007 2008 2009
MediumHigh LowCritical
Source: IBM X-Force®
Critical amd High Vulnerability Disclosures AffectingClient-Side Applications by Application Category
2005-2009
Figure 20: Critical and High Vulnerability Disclosures Affecting Client-Side Applications by Application Category, 2005-2009
Client Vulnerabilities by Category
The major types of vulnerabilities affecting clients continue to fall into one of four main categories shown in Table 10. These four categories represent 76 percent of all the client-side vulnerabilities disclosed in 2009.
Category
Browser
Document Reader
and Editor
Multimedia
Operating
System
Description
Client Web browser software and plug-ins.
Software that allows users to create or view
documents, spreadsheets, presentations, and other
types of files that are not images, music, or movies.
Software that allows users to view or create
music and movies.
The base operating system, excluding
applications that are in the other three categories.
Table 10: Key Vulnerability Categories Related to Client-Side Vulnerability Disclosures in 2009

29 IBM X-Force 2009 Trend and Risk Report IBM Security Solutions
Historically, much attention has been paid to the security of operating systems. However, in 2006, operating systems took a back seat to browser vulnerabilities. In the past few years, vulnerabilities affecting documents and multimedia applications have been on the rise. In 2009, both of these categories surpassed the operating system, bumping it further down to fourth place.
300
250
200
150
100
50
0
2005 2006 2007 2008 2009
Browser Document Reader or Editor OS Multimedia
Top Client Categories - Changes in Critical and High Client Software Vulnerabilitites
2005-2009
Source: IBM X-Force®Figure 21: Top Client Categories-Changes in Critical and High Client Software Vulnerabilities, 2005-2009
Most organizations have established processes in place to patch and secure operating systems. These trends in vulnerabilities and in exploitation discussed Client Exploitation Trends on page 34, however point to the need to ensure the security of a diverse ecosystem of applications on endpoints. The next few sections provide a breakdown of the applications that are mostly responsible for these categories of vulnerabilities.
Browser Vulnerabilities
The largest category of client-side vulnerabilities remains the browser category. This category includes not only the browsers themselves but the many plug-ins that can be installed on browsers. The most affected component is still the ever-pervasive ActiveX control. However, 2008 was a pivotal year for ActiveX. New disclosures affecting ActiveX are rapidly declining and leading the overall decline in the browser category.
2007
0
50
100
150
200
250
300
2008 2009
Total Vulnerabilities
ActiveX Firefox Internet Explorer Other Safari
Critical and High Client Vulnerability DisclosuresAffecting Browser-Related Software
2007-2009
Source: IBM X-Force®Figure 22: Critical and High Vulnerability Disclosures Affecting Browser-Related Software, 2005-2009

30 IBM X-Force 2009 Trend and Risk Report IBM Security Solutions
When it comes to critical and high vulnerabilities, Mozilla Firefox has twice the number of disclosed vulnerabilities as Microsoft Internet Explorer. The good news about Mozilla is that they set an incredible standard this year of leaving none of their 2009 critical or high client-side vulnerabilities without a security patch by the end of the year. See Affected Vendors and Availability of Patches on page 32 for details.
Document Reader and Editor Vulnerabilities
When it comes to document vulnerabilities, two predominant types of document vulnerabilities are evident: Office documents and Portable Document Format (PDF) documents.
Our Office category includes the normal suspects such as spreadsheets, documents, presentations, and some other file types. Although most associate Office documents with Microsoft Office applications and PDF documents with Adobe applications, non-Microsoft and non-Adobe readers and editors are also prevalent and frequently affected by these vulnerabilities. OpenOffice (Office docs) and Foxit (PDF docs) are two examples. Even so, the most frequently affected applications (at least, those that are publicly reported) are Microsoft Office and Adobe applications.
2007 2008 2009
Critical and High Vulnerability DisclosuresAffecting Document Readers and Editors
2007-2009
Source: IBM X-Force®
Microsoft Office Adobe Acrobat or Reader Other
80%
70%
60%
50%
40%
30%
20%
10%
0%
100
80
60
40
20
0
Per
cent
age
by
Cat
ego
ry
Total Num
ber of Vulnerab
ilities
Figure 23: Critical and High Vulnerability Disclosures Affecting Document Readers and Editors, 2007-2009
Figure 25 shows the percentage of critical and high document vulnerabilities affecting these applications along with the overall trend of critical and high vulnerabilities in this category.
120
100
80
60
40
20
0
2005 2006 2007 2008 2009
Office Formats Portable Document Format (PDF)
Vulnerability Disclosures Related to Document Format Issues
2005-2009
Source: IBM X-Force®Figure 24: Vulnerability Disclosures Related to Document Format Issues, 2005-2009
PDF-related disclosures continue to dominate the charts. The 2009 mid-year report provided data showing how the number of PDF-related vulnerabilities had skyrocketed. In addition to client applications, PDF and Office documents can affect more than the standard reader or editor. In some cases, formatting errors in the document can cause mail servers or browsers (using a plug-in to view the document) to crash. If you combine all of the affected platforms together and group by Office and PDF, it is evident that the total number of PDF-related vulnerabilities has far surpassed those affecting Office documents in this past year.

31 IBM X-Force 2009 Trend and Risk Report IBM Security Solutions
Multimedia Vulnerabilities
Although it’s fairly easy to pinpoint the categories and vendors associated with browser software, operating systems (see Operating System on page 17), and document readers and editors, multimedia software is not so simple. If only the critical and high vulnerabilities are considered, you are still left with 87 general applications that are affected over the past three years, which doesn’t include various versions and various subcomponents of these applications. Even if you only look at the top six, shown in Figure 25, they only account for 36 percent of all criticals and highs disclosed in 2009. The idea of keeping up with the sheer number of applications that might be in use within one corporation could be daunting. Additionally, this category of software vulnerability is one of the worst at providing patches for critical vulnerabilities.
The good news is that this diverse application set not only makes it difficult for the security administrator, but it also provides a difficult attack surface for attackers. Attackers have predominantly focused on using the Flash format as a vector, targeting one of the most ubiquitous media applications: Adobe Flash. For the security administrator and the end-user, the focus should remain on patching and protecting the most commonly installed components, such as those listed in Figure 25.
80%
70%
60%
50%
40%
30%
20%
10%
0%
90
70
80
60
50
40
30
20
10
0
2007 2008 2009
Other Multimedia Applications
Microsoft Multimedia Components
Apple QuicktimeAdobe Flash Cisco Webex
RealNetworks RealPlayer
Per
cent
age
by
Cat
ego
ry
Total Num
ber of Vulnerab
ilities
Source: IBM X-Force®
Critical and High Vulnerability DisclosuresAffecting Multimedia Software
2007-2009
Figure 25: Critical and High Vulnerability Disclosures Affecting Multimedia Software, 2007-2009
Availability of 0-Day Exploit Code
The availability of public exploit code, either proof-of-concept or fully-functioning, is a key indicator that a vulnerability will suffer active exploitation. The X-Force definition of “public exploit” follows the standard CVSS terminology.
Public exploit: Any proof-of-concept demonstrative code, partially or fully functional, or malicious mobile agent, such as malware, that is publicly available. Some researchers and research organizations will publish either proof-of-concept (PoC) code or enough details about the vulnerability so that another individual can quickly put together and publish a PoC. The public availability of PoC code increases the likelihood that the vulnerability will face live exploitation either through targeted attempts or through a mass distribution method, like in an exploit toolkit. Common outlets for these public exploits are testing tools like Metasploit and Canvas.
100%
80%
60%
40%
20%
0%
2005 2006 2007 2008 2009
Same Day After Disclosure Before Disclosure
Client-Side Proof-of-Concept Exploit Code Publication Timing
2005-2009
Source: IBM X-Force®Figure 26: Client-Side Proof-of-Concept Exploit Code Publication Timing, 2005-2009

32 IBM X-Force 2009 Trend and Risk Report IBM Security Solutions
In 2009, client applications were less likely to have public PoCs published in comparison to 2008, and if there was a PoC published, it was slightly less likely that it would be published on the same day as the vulnerability itself, which means life is marginally easier for vendors and incident responders who are charged with patching and protecting against these threats. Figure 26 shows the changes in detail over the past few years.
60%
50%
40%
30%
20%
10%
0%
2005 2006 2007 2008 2009
Browser Multimedia OS Document Reader or Editor
Percent of Critical and High Client-Side Vulnerabilitieswith Public PoC Exploit Code
2005-2009
Source: IBM X-Force®Figure 27: Percent of Critical and High Client-Side Vulnerabilities with Public Proof-of-Concept Exploit Code,
Although the trends show that most major categories were less likely to be affected by PoC exploit code in 2009 in comparison to 2008, one category stands out: Multimedia vulnerabilities. In 2009, researchers published exploit code for 54 percent of all critical and high vulnerabilities in this category, a new record surpassing the height of PoCs published for browser vulnerabilities in 2008.
Affected Vendors and Availability of Patches
In 2009, four major vendors were associated with over half (54 percent) of all the critical and high vulnerabilities affecting client applications. These vendors are shown in Figure 28.
Making patches available for these vulnerabilities is a critical component of insuring that customers are able to maintain a secure code base and prevent exploitation.
Source: IBM X-Force®
Apple:3%
Mozilla:8%
Adobe: 14%
Others: 46%
Microsoft: 29%
Percent of Critical and High Client-Side Vulnerabilities by Affected Vendor
2009
Figure 28: Percent of Critical and High Client-Side Vulnerabilities by Affected Vendor in 2009

33 IBM X-Force 2009 Trend and Risk Report IBM Security Solutions
Figure 29 shows how well these vendors are providing patches for the most important vulnerabilities. On average, vendors provided patches for 66 percent of these vulnerabilities. Taking a look at the top vendors in this category, most of them beat the vendor average, with the exception of Apple, who left 38 percent of these vulnerabilities without an official patch. The vendor deserving a gold star is Mozilla, who provided patches for all of their critical and high client-side vulnerabilities by the end of the year.
45%
40%
35%
30%
25%
20%
15%
10%
5%
0%
Apple Microsoft Adobe Mozilla VendorAverage
Patch Availability for Critical and High Client-Side Vulnerabilities Top Vendors in Comparison to the Vendor Average
2009
Source: IBM X-Force®Figure 29: Patch Availability for Critical and High Client-Side Vulnerabilities, Top Vendors in Comparison to the Vendor Average in 2009
Although leaving 30 percent or more critical and high vulnerabilities left unpatched may sound like a lot, this average certainly beats the average for Web application vulnerabilities and has significantly improved over the past year. Going back a few years in the data clearly shows the improvements, although vendors of browsers, browser plug-ins and multimedia applications have some room to improve to reach the low levels of operating systems and document readers and editors. See Figure 30 for details.
Critical and High Vulnerabilities with No Patch2006-2009
100%
80%
40%
20%
0%
2006 20082007 2009
Source: IBM X-Force®
Multimedia Browser OS Document Reader or Editor
Figure 30: Percent of Critical and High Client-Side Vulnerabilities with No Patch by Category, 2006-2009

34 IBM X-Force 2009 Trend and Risk Report IBM Security Solutions
Client Exploitation Trends
X-Force monitors client exploits through several projects and services.
IBM Managed Security Services (MSS), responsible for •
monitoring exploits related not only to endpoints, but also servers (including Web servers) and general network infrastructure. This data tracks exploits delivered over the Web in addition to other vectors like email and instant message. Our “Whiro” crawlers, which combine alert data from MSS, •
our “C-Force”, and independent analysis to monitor exploitation from Web-based sources. Whiro uses specialized technology to identify exploits used even in the most obfuscated cases including where toolkits attempt multiple exploits. Our Content team, who independently scour and categorize •
the Web through crawling, independent discoveries, and through the feeds provided by MSS and Whiro.
Most Prevalent Exploit Categories
The IBM Managed Security Services (MSS) provides a view into the most frequently seen types of attacks that leverage client vulnerabilities. MSS offers comprehensive outsourced solutions for real-time security management, including system monitoring, emergency response and 24x7x365 protection. These services cover a variety of platforms and operating systems for networks, servers, desktops and wireless applications and provide event monitoring including:
8 Security Operation Centers•
133 countries•
20k+ devices•
3700+ customers•
Between 400-800 million events per day•
Over 150 million intrusion attempts per day•
MSS provides a balanced look at overall attack activity across the Internet. Client attacks are monitored from multiple vectors. For example, malicious documents may be delivered over email or instant messenger, or end-users may click malicious links leading to a browser exploit or a malicious document.

35 IBM X-Force 2009 Trend and Risk Report IBM Security Solutions
Browser and PDF ExploitationSource: IBM Managed Security Services
2008-2009
350,000
400,000
450,000
500,000
300,000
250,000
200,000
150,000
100,00
50,000
0
2008 2009
Source: IBM X-Force®
Jan Feb Mar Apr May Jun Jul Aug Sep Oct Nov Dec Jan Feb Mar Apr May Jun Jul Aug Sep Oct Nov Dec
ActiveX
Internet Explorer
Firefox0
10,000
20,000
30,000Detailed View
2008 2009
Figure 31 shows the number of monthly attacks falling into these categories. From a browser perspective, it is clear that core browser vulnerabilities have taken a back seat to malicious PDFs
Figure 31: Browser and PDF Exploitation, 2008-2009
and ActiveX vulnerabilities. Although, many of these ActiveX “exploits” are actually good Web sites who are continuing to call these outdated and known-vulnerable controls.

36 IBM X-Force 2009 Trend and Risk Report IBM Security Solutions
Exploits from Malicious Websites
In 2009 as in previous years, the vast majority of Web-based exploitation centered around Web exploit toolkits in contrast to purpose-built lone sources. The most significant case of a lone exploit observed in the wild in 2009 was the ATL COM bug (CVE-2009-2493)—a bug that also happened to be reported by X-Force Research prior to our discovery of it in the wild on a seemingly dormant Web site. This URL was discovered using our Whiro Web browser exploit crawler’s advanced “0-day” detection technologies.
After notifying Microsoft of our discovery, we continued to monitor the situation closely. This lone exploit site remained in the wild for a month before the exploit was copied, incorporated into Web exploit toolkits, and finally exploded into mass exploitation. Interestingly, the site in question was missing a critical part of the exploit preventing any actual infections from that Web site. Initially, it was unclear if it was the same CVE we had reported, but what was clear was that the vulnerability was related to the ATL COM bug class that we had already reported to Microsoft. The site in question never actually appeared to go “live,” but strong code similarities with fully functional exploit sites a month later gives us the confidence to associate this initial site that we discovered.
Just as lone Web browser exploit sites in the wild are dying and exploit toolkits and groups are taking the forefront of Web browser exploitation, we are seeing some disturbing new possibilities in anti-analysis (defensive technologies put in place by attackers to avoid discovery and detection).
Exploit kits in the wild are increasingly being built to avoid serving content more than once to a particular Internet Protocol (IP) address. This feature has two obvious practical benefits to the attacker:
The infection only happens once to avoid potential 1. destabilization of the victim, and It hinders analysis.2.
In fact, attackers are taking this one step further in some cases by blocking and trading IP addresses and IP block ranges that are known or suspected to be used by researchers (the good guys) for analysis—one might say that it’s their own sort of IP reputation system. Sudden drops in automated tool inspection results could indicate to a researcher the need to change IP addresses, but a casual drop-off might not be incredibly evident in inspection results, especially if content is only served on the first visit to the URL. When considering potential trends that may emerge in 2010, IP blocking could take off—if for no other reason than code reuse and piracy.
Rank
1.
2.
3.
4.
5.
2009
Microsoft Office Web Components
Spreadsheet ActiveX (CVE-2009-1136)
Adobe Acrobat and Reader
Collab.CollectEmailInfo (CVE-2007-5659)
Adobe Acrobat and Reader util.printf() (CVE-2008-2992)
Adobe Acrobat and Reader GetIcon() (CVE-2009-0927)
Adobe Flash Player SWF Scene Count (CVE-2007-0071)
Top Five Web-Based Exploits
Table 11: Top Five Web-Based Exploits, 2009 Source: IBM X-Force Whiro Crawler

37 IBM X-Force 2009 Trend and Risk Report IBM Security Solutions
The prevalence of Gumblar definitely helped secure top positions for Adobe products in both our second half and full-year results for most popular exploits. These exploits were also very popular irrespective of Gumblar.
Compared with our mid-year report, only PDF Collab.CollectEmailInfo (CVE-2007-5659) remains on the list. Additionally, it moves up a spot from third place to second. The dominance of Adobe products in the top five marks a turning point for attackers. However, upon consideration of a few factors, this change should not come as a shock.
The ubiquity of Adobe products allows attackers to target multiple browsers with the same exploit. Users and administrators, whose previous patching focus had been operating systems and browsers, may less frequently update Adobe products. Additionally, Adobe, although recently incorporating a new quarterly patching process for Adobe Acrobat and Adobe Reader, still offers a less aggressive patching regime than most browsers. Similarly, the inclusion of Adobe exploits in exploit toolkits combined with enhancements in obfuscation is helping to drive this increase.
Compared with our full-year 2008 report, the top five exploit list is completely brand new. Interestingly, it is also identical to our second half results for 2009. This year has marked the first time that dramatic changes have affected both of our top five lists. Finally, the MDAC vulnerability seems to be “breathing its last breath” after years of popularity in the wild. As recently as the first half of 2009, it was still the most popular Web browser exploit.
The use of malicious PDFs for exploitation has seen a dramatic increase this year and it is quite common for multiple exploits to be present in a single PDF delivered by a malicious site. In fact, the three PDF vulnerabilities on our list are the most commonly observed combination. We will surely see this trend continue into the future; at least as long as new PDF vulnerabilities trickle out into the wild while patch speed and adoption could be better. In 2010, Adobe products are likely to continue to have a presence on our future most popular exploits list, although it is difficult to predict if it will be the “year of PDF” or the “year of Flash.” Adobe Acrobat/PDF has the lead for now.
Rank
1.
2.
3.
4.
5.
2009 (Full Year)
Gumblar
CuteQQ
Phoenix
zoPack
JustExploit
Top Five Web Exploit Toolkits
2009 H2 (Second Half)
Gumblar
CuteQQ
JustExploit
Nuclear
Elenore
Table 12: Top Five Web Exploit Toolkits, 2009 Source: IBM X-Force Whiro Crawler
Compared with our mid-year report, the CuteQQ group/kit dropped from the top spot to second place and three new kits took the remaining slots. Interestingly, the two unnamed kits that occupied the third and fourth slots in our last report are not equivalent to any of these three new kits. These changes indicate that there is a lot of churn in kit, which may itself emerge as a trend in the future. The number of exploit toolkits in the wild continues to increase—currently X-Force is monitoring for 39 different exploit kits with some specific variants. When we applied our current exploit kit heuristics updated for the second half of the year with the content we cached from the first half, we discovered that the top exploit kits list from the first half of 2009 changed.

38 IBM X-Force 2009 Trend and Risk Report IBM Security Solutions
Curiously, for full-year results, only the CuteQQ group/kit remains from our mid-year report. The volume of sites infected with Gumblar elevated it into first place and the JustExploit kit that occupies the third spot on our second half results finishes the year in fifth place. Our list is complicated by the fact that we did not have identification for the Phoenix and zoPack kits in place when creating our mid-year report. Upon revision, we discovered that they were quite popular in the first half. For the first half of 2009, Phoenix should have occupied the second spot, with zoPack occupying the third spot. However, the volume of JustExploit kits in the second half of the year exceeded that of Tornado kits from the first half; bumping it off the full-year list. As discussed in our reports over time, there are many challenges in tabulating exploit kit prevalence. The longstanding issue of code similarity and kit branches with unique obfuscation can be challenging. Our approach to determining prevalence is based on heuristics applied to primarily de-obfuscated malicious content. X-Force will continue to innovate better identification heuristics and techniques for trending and protection.
Obfuscation
Throughout 2008, X-Force observed a reduction in malicious script obfuscation that did not continue into the first half of 2009. In the second half of 2009, we remained at very high levels of obfuscation. Exploit toolkit packages have started to include both malicious Adobe Flash and PDF files as well as developing obfuscations specific to these formats. In most cases, the obfuscation code is borrowed from earlier JavaScript-based implementations.
Obfuscated Web Pages and FilesSource: IBM Managed Security Services
2008-2009
8,000,000
6,000,000
4,000,000
0
2,000,000
2008 2009
Source: IBM X-Force®
Q1 Q2 Q3 Q4 Q1 Q2 Q3 Q4
Figure 32: Obfuscated Web Pages and Files, 2008-2009
Flash
It might be surprising that Flash movies would require additional obfuscation considering that, unlike PDF, they use a byte code virtual machine for scripting. The most common Flash obfuscation technique involves determining the version of Flash that is running and selecting an encrypted array to decrypt and execute. Yes, Flash provides the ability to load and execute a buffer-based Flash movie provided it is properly formatted. A more recent variation on this is to do the Flash version checking in JavaScript in order to set a variable that will be referenced in the Flash movie script. Without a known string, no decoding or malicious activity occurs. This means that automated analysis systems without the ability to cause interaction between the JavaScript and Flash subsystems like a real browser are likely to miss the malicious content and are stuck with identifying byte code in the Flash movie that appears to indicate a known Flash exploit toolkit (instead of the actual vulnerability).

39 IBM X-Force 2009 Trend and Risk Report IBM Security Solutions
PDFs
Adobe PDF files saw increases in obfuscation complexity throughout 2009. Earlier in 2009, it was quite typical to see PDF ActionScript obfuscated with only the same decoding routines popular with HTML-based malicious JavaScript. Some of these PDFs started to use the PDF encryption feature with a default key (which does not need to be entered or verified by the viewer). While it is very expensive for IPS technologies to do the decryption on the wire, it is trivial for analysis tools. Today, it is becoming quite popular to hide encoded script in some element of the PDF which can be referenced in ActionScript, decoded and executed. This approach is identical to hiding script in DIV or TEXTAREA tags with HTML and JavaScript or Visual Basic Script (VBScript/VBS). However, the document model is different with PDF and full PDF processing support is cumbersome as a one-time development cost for automated analysis. Interestingly, some new additions to the PDF format include the ability to embed entire PDF documents and multimedia such as Flash movies. So now a malicious PDF might actually be a malicious Flash movie. It is quite critical that organizations and individuals update their Adobe products whenever a newer version is offered and if possible use the auto-update facility. In addition, unless you want or need the ability to run script or watch movies inside a PDF document, you should disable these features in the program options.
PDF AttacksSource: IBM Managed Security Services
2008-2009
350,000
250,000
0
150,000
400,000
300,000
200,000
100,000
50,000
2008 2009
Q1 Q2 Q3 Q4 Q1 Q2 Q3 Q4
Source: IBM X-Force®
Figure 33: PDF Attacks, 2008-2009
Visual Basic Obfuscation
With respect to Visual Basic Script (VBS) utilization as an obfuscation approach, its use is down significantly from the first half of 2009. In the first half, we noted 20 percent utilization; however, in researching our samples from the second half of the year we have observed only .05 percent utilization in the wild! This change is quite a swing and one that dramatically reduces the overall prevalence of VBS use to a tiny 3.6 percent for the entire year. To put this into perspective, consider that VBS has traditionally been a useful obfuscation approach for attackers, because it is a scripting library exclusive among browsers to Internet Explorer. Considering that there are not many open source projects geared towards interpreting, translating, or otherwise emulating VBS, it could be an effective way to stymie automated analysis. In terms of what to expect in the future for VBS in malicious scripts, it is hard to say because we were wrong about our previous prediction of its continued presence in the second half of the year. Perhaps, it is best to consider VBS a cyclical fad.
Other Obfuscation Techniques
Another observed obfuscation technique is the use of string replacements using regular expressions to clean up heavy string obfuscation. An interesting and potentially emerging trend is the use of code comments to foul up detection heuristics and visually obfuscate the code. For example, attackers will commonly put a comment string inside of a function call parameter when employing this technique.
In any case, X-Force will continue to monitor, report, and develop protection measures for whatever the state-of-the-art brings in terms of Web browser exploit obfuscation.

40 IBM X-Force 2009 Trend and Risk Report IBM Security Solutions
Web Content Trends
This section summarizes the amount and distribution of “bad” Web content that is typically unwanted by businesses based on social principles and corporate policy. Unwanted or “bad” Internet content is associated with three types of Web sites: adult, social deviance and criminal. Table 13 lists the IBM Web filter categories that correspond with these types of sites.
The Web filter categories are defined in detail at: http://www.ibm.com/services/us/index.wss/detail/iss/a1029077?cntxt=a1027244
Web Site Type
Adult
Social Deviance
Criminal
Description & Web Filter Category
Pornography
Erotic / Sex
Political Extreme / Hate / Discrimination
Sects
Anonymous Proxies
Computer Crime / Hacking
Illegal Activities
Illegal Drugs
Malware
Violence / Extreme
Warez / Software Piracy
Table 13: Web Filter Categories Associated with Unwanted Web Content
This section provides analysis for:
Percent and distribution of Web content that is considered •
bad, unwanted, or undesirable Increase in the amount of anonymous proxies•
Malware URLs: Hosting Countries and Linkage•
Analysis Methodology
X-Force captured information about the content distribution on the Internet by counting the hosts categorized in the IBM Web filter database. Counting hosts is an accepted method for determining content distribution and provides the most realistic assessment. When using other methodologies—like counting Web pages/sub pages—results may differ.
The IBM Content data center is constantly reviewing and analyzing new Web content data. The IBM Content data center:
Analyzes 150 million new Web pages and images each month•
Has analyzed 11 billion Web pages and images since 1999•
The IBM Web Filter Database has:
68 filter categories•
63• 2 million entries 150,000 new or updated entries added each day•
2 The number of entries decreased significantly in comparison previous reports, because spammers stopped using plentiful hosts on domains in
the summer of 2009. Thus, the number of entries in the category “Spam URLs” decreased considerably, even though the number of entries in all
other categories increased.
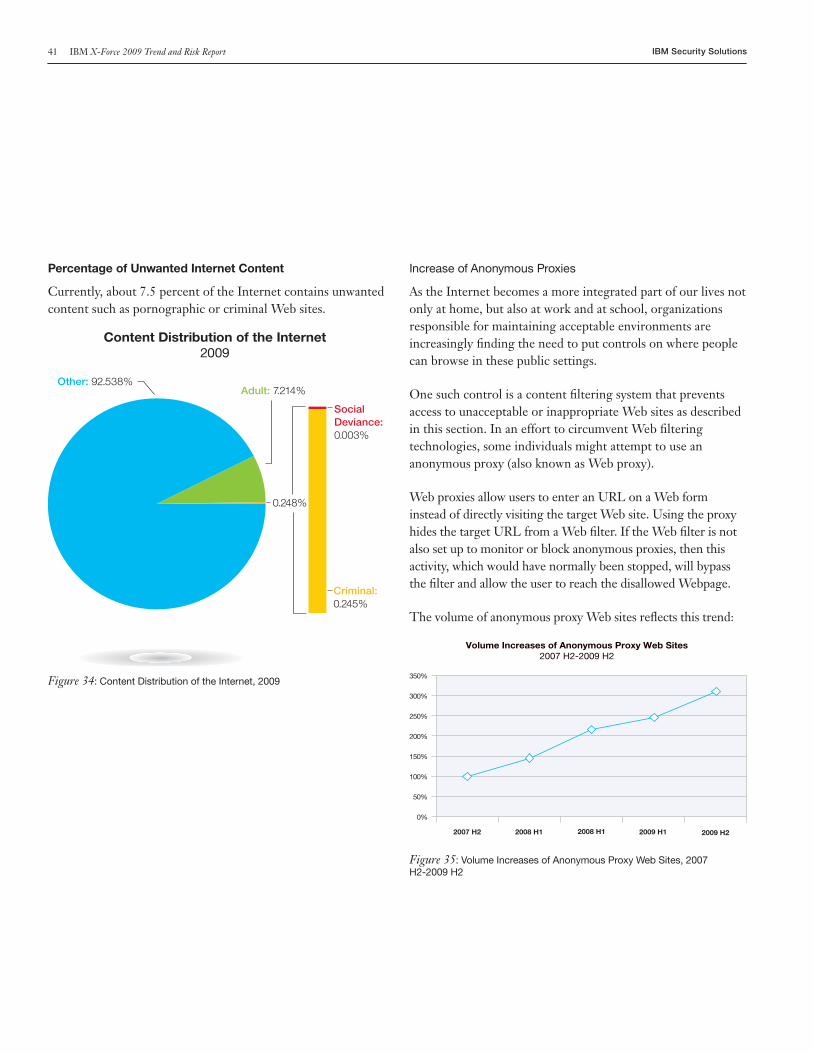
41 IBM X-Force 2009 Trend and Risk Report IBM Security Solutions
Percentage of Unwanted Internet Content
Currently, about 7.5 percent of the Internet contains unwanted content such as pornographic or criminal Web sites.
Other: 92.538%Adult: 7.214%
SocialDeviance:0.003%
Criminal:0.245%
0.248%
Content Distribution of the Internet 2009
Source: IBM X-Force®Figure 34: Content Distribution of the Internet, 2009
Increase of Anonymous Proxies
As the Internet becomes a more integrated part of our lives not only at home, but also at work and at school, organizations responsible for maintaining acceptable environments are increasingly finding the need to put controls on where people can browse in these public settings.
One such control is a content filtering system that prevents access to unacceptable or inappropriate Web sites as described in this section. In an effort to circumvent Web filtering technologies, some individuals might attempt to use an anonymous proxy (also known as Web proxy).
Web proxies allow users to enter an URL on a Web form instead of directly visiting the target Web site. Using the proxy hides the target URL from a Web filter. If the Web filter is not also set up to monitor or block anonymous proxies, then this activity, which would have normally been stopped, will bypass the filter and allow the user to reach the disallowed Webpage.
The volume of anonymous proxy Web sites reflects this trend:
Volume Increases of Anonymous Proxy Web Sites2007 H2-2009 H2
350%
300%
250%
200%
150%
100%
50%
0%
2007 H2 2008 H12008 H1 2009 H1 2009 H2
Figure 35: Volume Increases of Anonymous Proxy Web Sites, 2007 H2-2009 H2

42 IBM X-Force 2009 Trend and Risk Report IBM Security Solutions
In the past two years, anonymous proxies have steadily increased, more than tripling in number.
Anonymous proxies are an incredibly important type of Web site to track because of the growth and the ease at which they allow people to hide potentially malicious intent. The following data provides an analysis of these sites and where they are hosted.
Top Level Domains of Anonymous Proxies
The first chart shows the Top Level Domains of the newly registered anonymous proxies.
Top Level Domains of Newly-RegisteredAnonymous Proxy Web Sites
2006-2009
70%
60%
50%
40%
30%
20%
10%
0%
2006 2007 2008 2009
Q1 Q2 Q3 Q4 Q1 Q2 Q3 Q4 Q1 Q2 Q3 Q4 Q1 Q2 Q3 Q4
com ccinfo net orgcn li ch
Source: IBM X-Force®Figure 36: Top Level Domains of Newly-Registered Anonymous Proxy Web Sites, 2006-2009
In 2006, more than 60 percent of all newly-registered anonymous proxies were .com domains, but since the middle of 2007, .info has been at the top for the most part. A few exceptions to this rule exist. At the beginning of 2008, for example, the Top Level Domains of neighboring countries Switzerland and Liechtenstein together reached about 30 percent of the newly registered anonymous proxies. In the fourth quarter of 2008, the Top Level Domain of China reached nearly 30 percent of the newly registered anonymous proxies. 2009 was dominated by .info and .com but, by the end of the year, .cc reached 16.6 percent of all new registered anonymous proxies.
In any case, it is curious that both .info and, at the end of the year, also .cc are the predominant anonymous proxy domains. A reason could be that .com is running out of names. In the past, anonymous proxy Web sites were named something like proxy4u.info or unblockit.info and so on. In the meantime, names are chosen that do not easily give away the fact that the domain is an anonymous proxy domain, such as [anyword].info. Independent from using “prox” in the name or not, within .com, most domains using [anyword].com are already registered (in many cases they are parked). Thus, it is much easier now to register a catchy domain in the .info Top Level Domain.
The same might be true for the .cc Top Level Domain. This is the Domain of Cocos (Keeling) Islands, an Australian territory. The domain is administered by VeriSign. Nearly all .cc anonymous proxies Web sites are registered on the domain co.cc. It is free of charge to register a domain anything.co.cc (see http://www.co.cc/?lang=en), thus, it is very cheap and attractive to install new anonymous proxies there.

43 IBM X-Force 2009 Trend and Risk Report IBM Security Solutions
Country Hosts of Anonymous Proxy Web Sites
Countries Where Newly-Registered Anonymous Proxy Web Sites are Hosted
USA vs. Other Countries, 2006-2009
70%
80%
90%
100%
60%
50%
40%
30%
20%
10%
0%
2006 2007 2008 2009Q1 Q2 Q3 Q4 Q1 Q2 Q3 Q4 Q1 Q2 Q3 Q4 Q1 Q2 Q3 Q4
OthersUSA
Source: IBM X-Force®Figure 37: Countries Where Newly-Registered Anonymous Proxy Web Sites are Hosted—United States Versus Other Countries, 2006-2009
For anonymous proxy hosting countries, the United States has held the top position for years—more than 70 percent of all newly-registered anonymous proxies have been hosted in the US over the past three and a half years. In the past 18 months, their share has climbed to more than 80 percent. All other countries host less than 10 percent of anonymous proxies, with the exception of Canada, which hosted 16.2 percent of all newly-registered anonymous proxies at the beginning of 2008.
Countries Where Newly-Registered Anonymous Proxy Web Sites are Hosted Other Countries, 2006-2009
12%
14%
16%
18%
10%
8%
6%
4%
2%
0%
2006 2007 2008 2009
Q1 Q2 Q3 Q4 Q1 Q2 Q3 Q4 Q1 Q2 Q3 Q4 Q1 Q2 Q3 Q4
CanadaGermany Netherlands AustraliaUK China France
Source: IBM X-Force®
Figure 38: Countries Where Newly-Registered Anonymous Proxy Web Sites Are Hosted –Other Countries, 2006-2009
Malicious Web Sites
The number of new malicious Web links discovered in the second half of 2009 decreased in comparison to the first half. However, the number of new Web links discovered in 2009 increased by 345 percent in comparison to the number discovered in 2008. Exploits from Malicious Websites on page 46 talks about the Web exploit toolkits involved in the majority of these malicious Web sites. This section discusses the countries responsible for hosting these malicious links along with the types of Web sites that most often link back to these malicious Web sites.

44 IBM X-Force 2009 Trend and Risk Report IBM Security Solutions
Geographical Location of Malicious Web Links
The United States and China continue to reign as the top hosters for malicious links. In the first half of 2009, Japan appeared on our top-tier hosting country chart, but by the end of 2009, the country hosted less than two percent of all the malicious URLs in our database pushing them off even the second tier country list.
Countries Hostsing the Most Malicious URLsSource: IBM Cobion Crawler
2006-2009
80%
70%
60%
50%
40%
30%
20%
10%
0%
2006 20082007 2009
China United States Other
Source: IBM X-Force®Figure 39: Countries Hosting the Most Malicious URLs, 2006–2009
The second-tier countries have also shifted, and, most significantly, many more countries seem to be jumping in on the game. The number of distinct countries hosting at least one malicious Web site nearly doubled from 2008 to 2009.
Second-Tier Countries that Host Two Percent or More of All Malicious URLs
2006-2009
5%
6%
4%
3%
2%
1%
0%
2006 2007 2008 2009
Great Britain Germany Canada Australia France
Source: IBM X-Force®Figure 40: Second-Tier Countries that Host Two Percent or More of All Malicious URLs, 2006–2009

45 IBM X-Force 2009 Trend and Risk Report IBM Security Solutions
Good Web Sites with Bad Links
As described in Web Application Threats and Vulnerabilities on page 19 and in Common Domains in URL Spam on page 58, attackers are focusing more and more on using the good name of trusted Web sites to lower the guard of end users and attempt to obfuscate their attempts from protection technologies. The use of malicious Web content is no different. The following analysis provides a glimpse into the types of Web sites that most frequently contain links to known, malicious Web sites.
Some of the top categories might not be surprising. For example, one might expect pornography to top the list (it does, and it has gotten worse over the past half year). However, the second tier candidates fall into the more “trusted” category.
Personal Web sites, search engines, blogs, bulletin boards, education, online magazines and news sites fall into this second-tier category. Most of these Web sites allow users to upload content or design their own Web site, such as personal content on a university’s site or comments about a “purchase” on a shopping Web site. In other words, it is unlikely that these types of Web sites are intentionally hosting malicious links. The distribution is probably more representative of the types of Web sites that attackers like to frequent in hopes of finding a loop-hole (like a vulnerability or an area that allows user-supplied content) in which they can incorporate these malicious links in hopes of compromising an unsuspecting victim.
The following chart shows the most common types of Web sites that host at least one link that points back to a known malicious Web site:
“Personal Homepages” or “ Communication Services” Sites
“Pornography” or “Erotic/Sex” Sites
“Blogs/Bulletin Boards” Sites
“Gambling/Lottery” Sites
“Education” Sites
“Shopping” Sites
“News/Magazines” Sites
“Computer Games” Sites
“Illegal Drugs” Sites
“Dating” Sites
“Anonymous Proxies” Sites
Other
“Search Engines/Web Catalogs/Portals” Sites
0% 5% 10% 15% 20% 25% 30%
Top Web Site Categories Containing at Least One Malicious Link 2009 H2
Source: IBM X-Force®Figure 41: Top Web Site Categories Containing at Least One Malicious Link, 2009 H2

46 IBM X-Force 2009 Trend and Risk Report IBM Security Solutions
When comparing this data with the data six months ago, two interesting trends appear. Professional “bad” Web sites like pornography, gambling, or illegal drugs Web sites have increased their links to malware, making it appear even more likely that “professionals” are improving their efforts to distribute malware systematically.
Blogs and bulletin boards, too, have seen increases in malware links. However, this is likely due to increased infiltration by attackers taking advantage of inadequate controls set in place by blog and bulletin board owners.
Top Web Site Categories Containing at Least One Malicious Link: Gainers
2009
20%
25%
15%
10%
5%
0%
2009 H22009 H1
“Pornography” or “Erotic/Sex” Sites
“Blogs/Bulletin Boards” Sites
“Gambling/Lottery” Sites“Education” Sites
“Dating” Sites
“Illegal Drugs” Sites
“Anonymous Proxies” Sites
Source: IBM X-Force®Figure 42: Top Web Site Categories Containing at Least One Malicious Link: Gainers, 2009
Some categories, such as personal homepages, have declined on a percentage basis since the first half of 2009. However, the total number of these sites has increased over that same time period. These categories simply aren’t growing as quickly as the categories that are gaining on a percentage basis, and they end up representing a smaller portion of the overall total than previously documented. With the number of malicious links quickly increasing across the board, the web is becoming a more dangerous place.
Top Web Site Categories Containing at Least One Malicious Link: Decliners
2009
40%
50%
60%
30%
20%
10%
0%2009 H22009 H1
“Personal Homepages” or “Communication Service” Sites
“Search Engines/Web Catalogs/Portals” Sites
“News/Magazines” Sites
“Shopping” Sites
“Computer Games” Sites
Source: IBM X-Force®Figure 43: Top Web Site Categories Containing at Least One Malicious Link: Decliners, 2009

47 IBM X-Force 2009 Trend and Risk Report IBM Security Solutions
Another way to look at this problem is to examine Web sites that appear to be hosting an extraordinary number of links back to malicious Web sites. When you analyze those sites that host ten or more links back, another story emerges—one that might imply that some of these Web site owners may be taking financial advantage of this type of compromise. From the categories of Web sites that host ten or more of these links, pornography accounts for nearly 27 percent and gambling accounts for more than 16 percent. One might suspect that these kinds of Web sites are knowingly using these links for profit. Some of these Web sites appear as if these links were placed systematically throughout the site.
Compared to the data six months ago, the values in most categories have changed by 2 percent or less. Only “Illegal Drugs” and “Dating” Web sites have experienced significant gains, while “News / Magazine” sites have declined.
Figure 44: Top Web Site Categories Containing Ten or More Malicious Links, 2009 H2
Top Web Site Categories Containing Ten or More Malicious Links 2009 H2
0% 5% 10% 15% 20% 25% 30%
Source: IBM X-Force®
“Pornography” or “Erotic/Sex” Sites
“Gambling/Lottery” Sites
“Search Engines/Web Catalogs/Portals” Sites
“Blogs/Bulletin Boards” Sites
“Illegal Drugs” Sites
“News/Magazines” Sites
“Dating” Sites
“Anonymous Proxies” Sites
“Computer Games” Sites
Other
“Personal Homepages” or “ Communication Services” Sites

48 IBM X-Force 2009 Trend and Risk Report IBM Security Solutions
Malware
What’s in a Name?
In examining our malware collection as well as data provided by Av-Test.org,3 X-Force noticed that antivirus (AV) vendors are increasingly avoiding specific names for new malware. Instead they are using generic names to cover variants and even multiple families. The chart below shows the percentage of malware names that are generic versus the percentage of families that are given more specific names. Some examples of generic names include “trojan”, “backdoor” and“downloader”. This data comes from a cross-reference list that covers 34 different anti-virus products for over 24 million malware samples collected by AV-Test.org since 2005.
Malware Naming Trends2005-2009
70%
80%
90%
60%
50%
40%
30%
20%
10%
0%
2005 2006 2007 2008 2009Q1 Q2 Q3 Q4 Q1 Q2 Q3 Q4 Q1 Q2 Q3 Q4 Q1 Q2 Q3 Q4 Q1 Q2 Q3 Q4
Specific Name Generic Name Unknown Name
Source: IBM X-Force®Figure 45: Malware Naming Trends, 2005-2009
There is also overlap in how samples are classified. What one vendor calls a trojan, another may call a backdoor. What one vendor calls a worm, another may call a virus. This inconsistency alludes to the fact that the traditional categorizations of malware threats (trojan, backdoor, virus, worm, potentially unwanted program) are not as useful as they once were. For example, in this sample set, 86% of all malware samples were classified as a trojan by at least one AV vendor—but what does that really say to the user? The classic definition of a trojan is software that pretends to be something it is not.
Trying to define what these trojans appear to be (such as game enhancement) and then also what it really does (such as, stealing your game login credentials) would be more useful in providing users with guidance on how to be more aware of the threats that might affect them.
Figure 46 shows how the application of multiple generic names to one unique piece of malware might confuse matters further. This chart shows the percentage of malware in 2009 that was labeled with a generic category by at least one vendor. The bars add up to much more than 100 percent, meaning many viruses are not only labeled as something generic, but labeled with multiple generic names.
Malware Sample Classification Totals2009
70%
80%
90%
60%
50%
40%
30%
20%
10%
0%
100%
Trojan Virus PUP Worm Backdoor
Figure 46: Malware Sample Classification Totals, 20093 http://www.av-test.org/

49 IBM X-Force 2009 Trend and Risk Report IBM Security Solutions
Double, Triple, Quad—Categories and Names to the Nth Degree
Only 25 percent of all malware in our sample set from 2009 are consistently labeled with only one generic category (predominantly viruses and trojans). In short, it is rare that the predominant AV vendors will agree on the general category (much less the name) of a virus.
Some combinations of names indicate that several generic categories are perhaps too similar to be distinct from one another. For example, most samples collected in 2009 were considered to be both trojans and potentially unwanted programs as shown in Figure 47.
Malware Sample Classifications2009
18%
16%
14%
10%
12%
8%
6%
4%
2%
0%
TrojanPUP
Trojan TrojanVirusPUP
Virus TrojanWorm
TrojanBackdoor
TrojanVirus
TrojanVirusWorm
TrojanBackdoor
VirusPUP
Figure 47: Malware Sample Classifications, 2009
Viruses and worms exhibit the same issue. Out of all the samples that were classified as either a worm or a virus by different AV vendors, 13 percent of them were classified as both.
Generic naming and improper categorizing are not the only issue we have in classifying malware threats—there is minimal consistency even when there are specific names given to malware families. For example, the following list shows names given to a single malware sample from different AV vendors:
Mal/Frethog-B
Worm:Win32/Taterf.B
Win32/PSW.OnLineGames.
NMY trojan
TrojanGameThief.Magania.amio
Packer.Win32.Agent.bk
[Suspicious]
Mal/Frethog-B
Trojan.Packed.NsAnti
Mal_Nsanti-9
Worm.Taterf.BY
W32/Onlinegames.BWO
Win32:Kavos [Trj]
Worm/AutoRun.EQ
Trojan.PWS.Onlinegames.AAGT
Win32/Frethog.COL
Trojan.Magania-9041
Trojan.PWS.Wsgame.4983
W32/Krap.B
Generic PWS.ak (trojan)
Note the variety of classifications: worm, trojan, password stealer, suspiciously packed file. In addition the lack of consistent family names—OnlineGames, Krap, Kavos, AutoRun, Frethog, Magania, Taterf—makes cataloging malware problematic.

50 IBM X-Force 2009 Trend and Risk Report IBM Security Solutions
How Did We Get Here?
Before moving on to how we might apply better labels to malware, it is appropriate to examine how the antivirus got here—just why exactly have we moved away from specific names? The problem arose as a response to three major issues:
Exponential increase of new, unique malware samples•
Blended threats•
Multi-component threats •
Number of New Samples
Just a few years ago, antivirus companies were able to thoroughly analyze new samples to create a name and classification that fit the purpose of the malware. Backdoors were classified as backdoors. Worms were classified as worms.
Due to the sheer number of new malware samples appearing daily—some companies are reporting 55,000 new samples per day,4 it’s nearly impossible (and certainly not cost-effective) to manually analyze these files as was done in the past.
Blended Threats
Within the past couple of years, new samples of malware have been found to be increasingly complex and contain a variety of capabilities. A single sample could contain a rootkit, a backdoor, a downloader and dropper, a data stealing component, and then spread like a worm, which can make that single sample very difficult to classify.
More useful statistics on malware trends can potentially be gathered by classifying samples based on behaviors—a task that X-Force has been researching for quite a while. Since each sample can have multiple behaviors, and there are so many samples, it is necessary to have an automated way to classify behaviors in order to come up with more useful trend data, and possibly even more useful and meaningful names.
Multi-Component Threats
It is also difficult to name and classify samples that are part of a larger malware ecosystem. For example, the Koobface family of malware is generally accepted to be a worm. The Koobface worm can spread autonomously, but there is no single component that spreads by itself. For example, the Facebook component will post links that cause the main Koobface downloader component to be installed, but the Facebook component does not directly spread itself in the same way as a normal worm or virus.
A single Koobface infection can have five or more separate components installed, each with a different purpose. However, each component is almost universally detected as a Koobface worm variant—even those that do not specifically exhibit worm-like behavior.
Next Generation Malware Labeling
One could argue that getting the name, the family, and even the generic category correct should not matter to consumers. As long as the AV product prevents the malware from infecting the user (or cleans it up after it is already there), why should the user care? There is certainly merit to that statement and if the user really wants to know what that malware does, perhaps the answer would be found in the detailed description on the vendor’s Web site.
However, there is something to be said for first impressions. Imagine a user’s reaction to an alert with the name W32/Onlinegames.BWO. The name “onlinegames” does not sound very frightening. Now imagine an alert called “PasswordStealer-World of Warcraft”. Now that name might get a little more attention.
4 http://www.pandasecurity.com/img/enc/Annual_Report_Pandalabs_2009.pdf

51 IBM X-Force 2009 Trend and Risk Report IBM Security Solutions
Malware naming is also important for many corporations and enterprises. Corporate espionage has been in the news in 2009 and even more so in 2010. When a company finds malware on a PC with potentially sensitive information, it can be vitally important to know the capabilities of the malware. Some companies are even employing full-time malware analysts on staff to deal with these threats.
Without more granularity, it is nearly impossible to track important changes in the malware landscape. Names like Trojan, Worm, and Virus are virtually meaningless. What is really important is what malware is targeting (which banks, what games, which personal information, which social media Websites) and how it is attempting to do so (vectors, social-engineering tricks). Having consistent naming and categorization will empower the security industry to communicate more effectively with customers and to analyze how emerging threats affect specific user or industry segments.
Malicious Attacks of 2009
Out of the many socially-engineered malware attacks that occurred during 2009, several attacks seem especially representative of what is happening in the threat landscape today:
Antivirus 2009, which lures users into downloading a fake •
AV product The Koobface Worm which infiltrated Facebook, Myspace, •
and other social networking sites The Jahlav Trojan which used Twitter to infect Mac users •
These attacks demonstrate just how determined cybercriminals are to infiltrate various computer systems. Even Mac users, who have been relatively safe from malware, are now being actively targeted.
While many of these attacks are not new to 2009, they are significant because the attacks are ongoing and increasing in intensity. Social networks represent a vehicle for malware authors to distribute their programs in ways that are not easily blocked. Social networking sites also offer a pool of users that malware authors do not have to obtain or create—instead they publish links on these sites and use lures to get unsuspecting users to click them. Attacking social networks also allows cybercriminals to exploit trust relationships between members of the sites, similar to how the first e-mail worms spread in the late 1990s. Of interest this year was the amount of high profile news events which were used to distribute malware including Michael Jackson’s death, H1N1 influenza, and Barak Obama’s election as the U.S. President.
The Koobface Worm: An In-Depth Look
One of the big social attacks of 2009 was the infection of Facebook users by the Koobface worm. The infection starts when the potential victim clicks a link on a message from a social networking site. For example, in Facebook, it could be either a direct message from an infected friend or a wall post. The messages usually say something like “check out this video!” with misspellings. Poor spelling is actually an attempt to evade detection—every post can be different.
Figure 48: Malicious message sent on facebook by the koobface worm. The poor spelling is a deliberate attempt to evade detection by security

52 IBM X-Force 2009 Trend and Risk Report IBM Security Solutions
Clicking the link follows a series of redirections and eventually the victim sees what appears to be a video site that is pretending to be youtube.com. A dialog box is displayed suggesting that the Adobe Flash player is out of date and a new version needs to be installed, giving the victim a chance to download an executable file. This executable is the initial part of the Koobface infection: the dropper. After downloading the purported Adobe update, the Web browser is immediately redirected to another page which warns that the victim’s computer is infected with a virus—this is a standard fake antivirus page that tries to convince the victim to download yet another malicious executable.
Figure 49: Fake video site which koobface worm redirects users to in order to install more damaging
After the Koobface executable is launched, it drops several files on the computer’s hard drive and configures itself to start automatically when the system boots up. The dropper then starts the main Koobface component and deletes itself.
The first thing the main Koobface component does is register itself with a command and control (C&C) server. The list of command and control servers is stored internally in the executable file and is frequently updated. Communication with the C&C server uses the HTTP protocol and in many cases the C&C servers are legitimate Web sites that have been hacked. After registering with a unique ID, the C&C server directs Koobface to download and install additional components.
Koobface will check the browser cookies to determine which sites the victim visits and then the malware requests additional components from the C&C server. For example, if there is a Twitter cookie, a Twitter component is downloaded and installed. The Twitter component uses the Twitter cookie to log in and post messages imploring people to check Koobface-infected links and spam links.
The components for the other social networking sites work the same. They all use the victim’s account credentials to log in to the site and send public and private messages containing links to Koobface distribution sites or to spam sites.
The messages and links that get spammed are determined by the C&C server. The component will send a message to a C&C server with a request and receivesa reply that contains a link and message suitable for whatever service is getting spammed. Some of these replies contain links to Koobface distribution sites and some contain links to affiliate sites that the Koobface handlers use to generate revenue.
Some social network sites have started introducing countermeasures against worms like Koobface. For example, Facebook will block messages containing known malicious URLs and the Bit.ly link shortening service is working with antivirus vendors to detect and remove malicious links. Bit.ly is currently the preferred method for Koobface to obfuscate its links in messages, but that could easily change in the future.
Another interesting aspect of Koobface is its ability to upgrade individual components. For example, when Facebook rolled out new privacy settings in December, it required all users to acknowledge the changes by clicking a button on the Web site. Within a couple of days, the Koobface operators pushed out an update to the Facebook component that programmatically clicked this button so it could continue spreading.
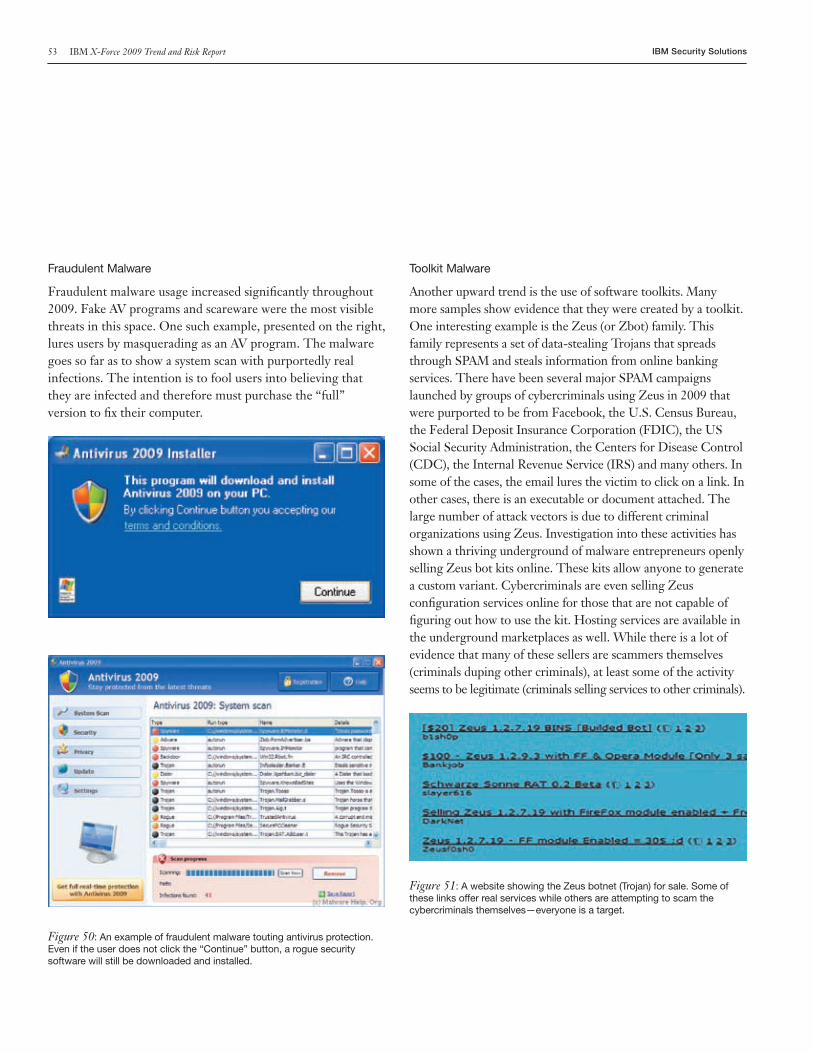
53 IBM X-Force 2009 Trend and Risk Report IBM Security Solutions
Fraudulent Malware
Fraudulent malware usage increased significantly throughout 2009. Fake AV programs and scareware were the most visible threats in this space. One such example, presented on the right, lures users by masquerading as an AV program. The malware goes so far as to show a system scan with purportedly real infections. The intention is to fool users into believing that they are infected and therefore must purchase the “full” version to fix their computer.
Figure 50: An example of fraudulent malware touting antivirus protection. Even if the user does not click the “Continue” button, a rogue security software will still be downloaded and installed.
Toolkit Malware
Another upward trend is the use of software toolkits. Many more samples show evidence that they were created by a toolkit. One interesting example is the Zeus (or Zbot) family. This family represents a set of data-stealing Trojans that spreads through SPAM and steals information from online banking services. There have been several major SPAM campaigns launched by groups of cybercriminals using Zeus in 2009 that were purported to be from Facebook, the U.S. Census Bureau, the Federal Deposit Insurance Corporation (FDIC), the US Social Security Administration, the Centers for Disease Control (CDC), the Internal Revenue Service (IRS) and many others. In some of the cases, the email lures the victim to click on a link. In other cases, there is an executable or document attached. The large number of attack vectors is due to different criminal organizations using Zeus. Investigation into these activities has shown a thriving underground of malware entrepreneurs openly selling Zeus bot kits online. These kits allow anyone to generate a custom variant. Cybercriminals are even selling Zeus configuration services online for those that are not capable of figuring out how to use the kit. Hosting services are available in the underground marketplaces as well. While there is a lot of evidence that many of these sellers are scammers themselves (criminals duping other criminals), at least some of the activity seems to be legitimate (criminals selling services to other criminals).
Figure 51: A website showing the Zeus botnet (Trojan) for sale. Some of these links offer real services while others are attempting to scam the cybercriminals themselves—everyone is a target.

54 IBM X-Force 2009 Trend and Risk Report IBM Security Solutions
The Zeus botnet kit comes with the bot-generation tool and the PHP scripts that run the administration Website. The administration scripts allow the attackers to control the computers infected by their bot as well as provide an upload site to gather information that their Zeus botnet collects.
Figure 52: A Screenshot of the Zeus botnet builder. These programs offer an easy way to quickly generate a unique botnet that offers a variety of features.
When the Zeus infection agent is executed on a PC, it will monitor Web traffic for a set of specific URLs specified in the configuration file that the attacker used to generate the bot. When the malware detects that the user is going to one of the configured URLs, it injects some malicious HTML and JavaScript into the page. This code is designed to collect the user’s credentials and submit them to the bot owner’s server. The attacker can then log into the site to view all of the captured credentials that are stored in a database.
Zeus infections can be difficult to detect because each version generated by the Zeus Builder is unique. Some attackers will make it even more difficult to catch by packing or “crypting” (obfuscating) the resulting executable. There are commercial Crypters available that add new abilities to the bot that allow it to evade detection and analysis attempts. There are even services available that will allow an attacker to submit the resulting binary for analysis by all major AV product engines to ensure that it will not be detected. Some Crypter services perform this test in advance as part of their price, although they may not directly give their testing tool to attackers.

55 IBM X-Force 2009 Trend and Risk Report IBM Security Solutions
Conclusion
After examining the malware collected in 2009, it is clear that the number of distinct malware samples will continue to increase at an alarming rate. AV-Test reported earlier this year5 that it has collected over 22 million samples—almost double what it had seen in the previous year. The amount of malware in existence today is troublesome. Now more than ever, security is needed—not only at the endpoint—but at every place in-between. Security, however, is only the first step. Educating users to the dangers of the Internet and teaching them how to surf safely is of paramount importance. The following guidelines can help reduce the chance of infection, especially when confronted by social engineering attacks:
Use AV software from a reputable vendor and always keep it •
updated. Ensure that it has features that will protect from e-mail and Web threats. Do not reply to or click links embedded in messages from an •
unknown source and consider deleting these messages. This guidance applies to email messages, instant messages, and messages on social networking and forum sites. Be wary of links within messages. For links that might be •
heavily targeted by attackers, such as banks, games, or other sites that require you to log in using credentials, save these important links as bookmarks on your computer or type them into your Web browser manually. Embedded links in malicious messages often mask the true URL by using misleading text and hiding the real link. Messages with poor spelling, poor grammar, or those that •
seem out of context for the user, group, or business should be viewed skeptically. If the source is unknown, consider deleting the message immediately to avoid accidental visitation of any embedded links.
Be skeptical of downloading or accepting software that •
presents itself as free—especially if such a claim is made from an advertisement. If in doubt about the reputability of free software, do research to ensure the source is trusted. Thoroughly scan any downloaded software if you cannot verify the source. Be skeptical of Web advertisements (or scareware) that •
announce that you have an infection or some other problem with your computer, especially if you already have AV software installed. If in doubt, use a trusted 3rd party tool to perform the advertised activity—such as scanning your computer for infections. Consider upgrading workstation operating systems to a 64-bit •
platform. While 64-bit malware does exist, it is still exceedingly rare in the wild. Also, most 64-bit operating systems have better inherent protections making them more difficult to infect.
5 http://www.sophos.com/blogs/gc/g/2009/07/24/avtestorgs-malware-count-exceeds-22-million/

56 IBM X-Force 2009 Trend and Risk Report IBM Security Solutions
Spam
The IBM premier content filtering services provide a world-encompassing view of spam and phishing attacks. With millions of e-mail addresses being actively monitored, the content team has identified numerous advances in the spam and phishing technologies attackers use.
Currently, the spam filter database contains more than 40 million relevant spam signatures (every spam is broken into several logical parts [sentences, paragraphs, etc.], and a unique 128-bit signature is computed for each part) and millions of spam URLs. Each day there are one million new, updated, or deleted signatures for the spam filter database.
The topics of this section are:
New trends around spam types•
Most popular domains used in spam•
Most popular Top Level Domains (TLDs) used in spam and •
why the top domains are so popular Spam’s country• 6 of origin trends, including spam Web pages (URLs) Changes in the average byte size of spam•
Most popular subject lines of spam•
Continued shifts in the aftermath of the McColo takedown•
Spam Volume
The spam volume has not evolved and expanded as in years past. Instead of a steady increase, spam flattened out near the middle of 2008 with a significant drop in November due to the McColo takedown. In the beginning of 2009, spam volume stagnated for a couple of months, and then started to increase in May, finally reaching (and surpassing) the spam level seen just before the McColo shutdown. In the fourth quarter of 2009, spammers started a year-end rally. In November, they sent out twice as much spam than before the McColo shutdown.
FEBAPR
0%
50%
100%
150%
200%
250%
APRJUN AUG OCT DEC
2008 2009
JUN AUG OCT DEC
Changes in Spam VolumeApril 2008-December 2009
Figure 53: Changes in Spam Volume since April, 2008-December 2009
6 The statistics in this report for spam, phishing, and URLs use the IP-to-Country Database provided by WebHosting.Info (http://www.webhosting.info),
available from http://ip-to-country.webhosting.info. The geographical distribution was determined by requesting the IP addresses of the hosts
(in the case of the content distribution) or of the sending mail server (in the case of spam and phishing) to the IP-to-Country Database.

57 IBM X-Force 2009 Trend and Risk Report IBM Security Solutions
Types of Spam
In 2008, spammers focused on using the most unsuspicious type of email: HTML-based spam without attachments. The chart below shows a significant increase in this type of spam. In the second quarter of 2009, single, plain-text spam (without other email parts or attachments) remained flat and we witnessed the rebirth of image-based spam. However, in the second half of 2009, image-based spam declined yet again and HTML-based spam recovered:
60%
70%
80%
90%
100%
50%
40%
30%
20%
10%
0%
2008 2009
Q1 Q2 Q3 Q4 Q1 Q2 Q3 Q4
Image Plain Text HTML
Types of Spam2008-2009
Source: IBM X-Force®Figure 54: Types of Spam, 2008-2009
The Rebirth of Image-Based Spam and a Short Guest Performance of MP3 Spam
Image-based spam boomed in 2006 and 2007, but practically disappeared in 2008 until October of that year. Shortly before the McColo shutdown, image-based spam made a brief appearance then stopped after the shutdown in November of 2008 took its toll.
Image spam was down another four months, but then in March of this year, spammers started several new runs of image-based spam. The biggest one at the end of April pushed image-based spam to more than 20 percent of the total spam traffic for a few days:
Image-Based Spam 2009 H1
25%
30%
20%
15%
10%
5%
0%
2009
JAN 1 JAN 15 JAN 29 FEB 12 FEB 26 MAR 12 MAR 26 APR 9 APR 23 MAY 7 MAY 21 JUN 4 JUN 18
Figure 55: Image-Based Spam, 2009 H1

58 IBM X-Force 2009 Trend and Risk Report IBM Security Solutions
In the second half of 2009, image spam once again declined. Peaks of activity became shorter and only lasted 1 to 3 days in comparison to the major peaks in first half of the year, which lasted several days. In the fourth quarter of 2009, image spam was below 4 percent, except on November 11th, when it reached 5.7 percent of all spam This was remarkable because it marked the one year anniversary of the McColo shutdown. One last hurrah, perhaps?
Image-Based Spam 2009 H2
25%
30%
20%
15%
10%
5%
0%
2009
JUL 1 JUL 15 JUL 29 AUG 12 AUG 26 SEP 9 SEP 23 OCT 7 OCT 21 NOV 4 NOV 18 DEC 2 DEC 16 DEC 30
Figure 56: Image-Based Spam, 2009 H2
So the question arises, why are there still (short) peaks although the image spam volume declines? Are there some spam bots running amok and sending “old styled image spam” instead of current spam? Or is it just a small additive like a pinch of salt in the soup?
Technically, there were no new techniques in this spam. Thus, most anti-spam filters should block them, for example, by using fingerprints (like IBM Proventia Network Mail Security System and IBM Lotus Protector for Mail Security do).
In the middle of 2009, the spam we saw was eerily reminiscent of spam from our former lives—what next, we thought, an attempt at MP3 spam, again? The spammers did not disappoint.
In the middle of December, MP3 spam returned for two days and reached a percentage of 0.15 percent of all spam on December 16th and 17th marking the first occurrence in two years. In the previous MP3 spam, a speaker touted penny stocks. This time, a speaker advised the listener to visit a special URL that contained pharmaceutical advertising. Two years ago we had MP3 stock spam, and now we have medical MP3 spam.
Common Domains in URL Spam
The vast majority of spam, 80 percent, is still classified as URL spam—spam messages that include URLs that a person clicks to view the spam contents:
URL Spam 2006 Q3-2009 Q4
10%
20%
30%
40%
50%
60%
70%
80%
90%
100%
0%
200820072006 2009
Q1 Q2 Q3 Q4Q1 Q2 Q3 Q4Q3 Q4 Q1 Q2 Q3 Q4
Figure 57: URL Spam, 2006 Q3-2009 Q4

59 IBM X-Force 2009 Trend and Risk Report IBM Security Solutions
gucci.com
notdune.com
hereidea.com
live.com
heatdark.com
namenot.com
idolreplicas.com
davavkos.com
vutovlaf.com
conemain.com
live.com
tubdyqwenqe.com
eurocasinokd.com
stop-fl0p.net
bbc.co.uk
hop-m0p.com
t1p-top.com
eurocasinokg.com
n1cewomen7.com
sexymodels123.net
livefilestore.com
live.com
el1te-russ1an-g1rls.com
myrusfriend.net
yellowpages.com
livechatfreex.com
googlegroups.com
cazinosostermor.com
777-models-777.com
cazinomonste.com
livefilestore.com
imageshack.us
beroyal.info
forformisskasino.com
totalwrite.com
cazinoyoumeyou.com
casinonewtrip.com
csinomonster.com
beroyal.mobi
beroyal.org
cnn.net
cnn.com
msn.com
msnbc.com
imageshack.us
reoisk.com
google.com
soieuu.com
royalfirsteuro.info
royalfirsteuro.mobi
livefilestore.com
smellshort.com
elementdepend.com
opera.com
grayany.com
creasehappiness.com
msn.com
boceph.com
alizedup.com
augsid.com
dogpile.com
kewww.com.cn
ynnsuue.com
wpoellk.com
movecontinent.com
moptesoft.com
varygas.com
earexcept.com
fullrow.com
colonytop.com
doubleclick.net
livefilestore.com
maddris.com
nubteku.com
moieiaus.com
coridez.net
zimpleq.com
misllie.com
pogieamdo.com
poskeij.com
crazeben.com
manninst.com
hyuaien.com
pobueitah.com
congratym.com
timeminute.com
camethank.com
wroteleast.com
writecotton.com
saveany.com
blogspot.com
powref.com
nuelig.com
gelsedde.com
mewlegos.com
findmilk.com
marketthen.com
seatbar.com
believeagree.com
somelisten.com
blogspot.com
81.222.138.69
goldsmallman.com
fastmansilver.com
dotoneauto.com
dedeiooss.com
geocities.com
hotripefruit.com
topstopcool.com
fastpetsilver.com
googlepages.com
sarahkverok.com
magnarx.com
nesoeteaok.com
lifefreeart.com
sgmykrtrewt.com
qualiveok.com
nightboylost.com
northmanestimate.com
geocities.com
Hence, it is worthwhile to take a closer look at the most frequently used domain names in URL spam. The following tables show the top 10 domains per month throughout 2008, with a few key domains highlighted.
June 2008Rank May 2008April 2008March 2008February 2008January 2008
1.
2.
3.
4.
5.
6.
7.
8.
9.
10.
Table 14: Most Common Domains in URL Spam, 2008 H1
Table 15: Most Common Domains in URL Spam, 2008 H2
December 2008Rank November 2008October 2008September 2008August 2008July 2008
1.
2.
3.
4.
5.
6.
7.
8.
9.
10.

60 IBM X-Force 2009 Trend and Risk Report IBM Security Solutions
Although the majority of URL spam is hosted on domains that were obviously registered for spam purposes, the amount of URL spam using well-known and trusted domain names has continued to increase. In the first half of 2008, these well-known domains made our monthly top ten list only 8 times. In the second half of 2008, this count more than doubled with 19 spots filled with well-known names. In the first half of 2009, 31 spots were filled, and in the second half, this number rose to 40.
Top Ten Domains Used In SpamSpam Domains Versus Trusted Domains
2008-2009
60%
70%
80%
90%
100%
50%
40%
30%
20%
10%
0%
2008 2009H1 H2 H1 H2
Spam Domains Trusted Domains
Figure 58: Top Ten Domains Used in Spam, Spam Domains Versus Trusted Domains, 2008-2009

61 IBM X-Force 2009 Trend and Risk Report IBM Security Solutions
imageshack.us
flickr.com
yahoo.com
photolava.com
pixfarm.net
mediapix.ru
live.com
webmd.com
picturebay.net
pixiurl.com
mediapix.ru
4freeimagehost.com
imagechicken.com
ipicture.ru
topmiddle.com
imageshack.us
inselpix.com
flickr.com
commoncatch.com
yahoo.com
mediapix.ru
yahoo.com
cmeqoher.cn
webmd.com
google.com
icontact.com
fuxehmg.cn
blingdisc.com
by.ru
groundmons.com
magshine.com
yahoo.com
google.com
webmd.com
magcloude.com
magroof.com
maghat.com
cmeqoher.cn
nyavekep.cn
ally.com
yahoo.com
blurblow.com
nyavekep.cn
blurpack.com
blurnight.com
blurgreat.com
by.ru
livefilestore.com
ally.com
bankofamerica.com
yahoo.com
webmd.com
wallmotion.com
nyavekep.cn
msn.com
pfizerhelpfulanswers.com
akamaitech.net
icontact.com
livefilestore.com
skyeclean.com
yahoo.com
googlegroups.com
webmd.com
icontact.com
mansellgroup.net
ranmooon.com
signgras.com
rannew.com
blueheav.com
rangreat.com
yahoo.com
menshealth.com
icontact.com
webmd.com
earlytorise.com
doctorspreferred.com
mansellgroup.net
healthcentral.com
menshealth.fr
trendsmag.com
interia.pl
akamaitech.net
menshealth.com
ask.com
webmd.com
rodale.com
go.com
yahoo.com
yimg.com
behaviorright.com
rodale.com
menshealth.com
webmd.com
mkt41.net
interia.pl
icontact.com
akamaitech.net
msn.com
about.com
rodalenews.com
sexyhardy.com
aspirationask.com
shoprespect.com
msn.com
yulesearching.com
wordobservant.com
assistingoriginal.com
tarecahol.cn
integrityprove.com
approvaltruthful.com
chat.ru
thuspattern.com
powerinstrument.com
cbsnews.com
hereidea.com
notdune.com
methoddegree.com
chithigh.com
chitlink.com
boughtprosperity.com
The following two tables highlight the well-known domains falling in the top ten list for 2009. In March and April, 8 and 9 of the top 10 used domains in spam were well-known domains. In November and December, 8 and even all 10 were well-known domains.
June 2009May 2009April 2009March 2009February 2009January 2009
Table 16: Most Common Domains in URL Spam, 2009 H1
December 2009November 2009October 2009September 2009August 2009July 2009
Table 17: Most Common Domains in URL Spam, 2009 H2

62 IBM X-Force 2009 Trend and Risk Report IBM Security Solutions
Some of the well-known Websites are:
• about.com (Online source for original information and advice, owned by The New York Times Company) • akamaitech.net (Web site of Akamai Technologies) • ally.com (Official Web site of Ally Bank) • ask.com (Internet search engine) • bankofamerica.com (Official Web site of Bank of America) by.ru• (Russian Web hoster) • cnn.com (Official Web site of the Cable News Network, owned by Time Warner) • go.com (Web portal, operated by the Walt Disney Internet Group) google.com• (Major Internet search engine) googlegroups.com • (Free service from Google where groups of people have discussions about common interests) healthcentral.com• (Official Web site of The HealthCentral Network, medical information portal) i• contact.com (Email marketing offering company) interia.pl • (Large Polish Web portal) live.com• (A Windows Live service that allows users to create a personalized homepage) • livefilestore.com (Microsoft’s Web Storage service) • mansellgroup.net (Official Web Site of Mansell group, a marketing services company) • menshealth.com (Official Web Site of Men’s Health Magazine, published by Rodale Inc.) • msn.com (A joint venture between NBC Universal and Microsoft for online news) pfizerhelpfulanswers.com • (Information Web Site of Pfizer, a pharmaceutical company) • rodale.com (Official Web Site of Rodale Inc., publishes health and wellness magazines, books, and digital properties) webmd.com• (Official Web Site of WebMD Health Corporation, an American provider of health information services) • yahoo.com (Major Internet search engine)
In August and September, two bank Web sites made the top 10 because of major phishing attacks (ally.com and bankofamerica.com).
Major targeted image-hosting Web sites were:
• flickr.com (Official Web Site of Flickr) imageshack.us • (Official Web Site of ImageShack)
And there are also some smaller and medium-sized image-hosting Web sites:
4freeimagehost.com•
imagechicken.com•
inselpix.com•
ipicture.ru•
mediapix.ru•
photolava.com•
pixfarm.net•
picturebay.net•
pixiurl.com•
Particularly in the last quarter of 2009, image-hosting Web sites were a focus for spammers.
Not only do these legitimate Web sites provide a recognizable (and trustworthy) Web link to the end user, but spam messages using them may also successfully evade some anti-spam technology because they only use legitimate links in their spam e-mails.

63 IBM X-Force 2009 Trend and Risk Report IBM Security Solutions
Common Top Level Domains in URL Spam
The Top Level Domain .com dominates the domain table in the previous section. However, the analysis of Top Level Domains reveals another story of what sparks the interest of spammers. The following tables show the five most frequently used Top Level Domains used in spam by month:
June 2009
com
cn (China)
org
net
ru (Russia)
Rank May 2009April 2009March 2009February 2009January 2009
1.
2.
3.
4.
5.
com
cn (China)
org
net
ru (Russia)
com
cn (China)
pl (Poland)
net
org
com
cn (China)
org
net
pl (Poland)
com
cn (China)
org
ru (Russia)
net
com
cn (China)
org
ru (Russia)
net
Table 18: Most Common Top Level Domains in Spam, 2009 H1
December 2009
com
cn (China)
net
us (USA)
ru (Russia)
Rank November 2009October 2009September 2009August 2009July 2009
1.
2.
3.
4.
5.
cn (China)
com
net
ru (Russia)
us (USA)
cn (China)
com
net
ru (Russia)
pl (Poland)
cn (China)
com
net
ru (Russia)
eu (European Union)
com
cn (China)
net
ru (Russia)
info
com
cn (China)
net
info
ru (Russia)
Table 19: Most Common Top Level Domains in Spam, 2009 H2

64 IBM X-Force 2009 Trend and Risk Report IBM Security Solutions
These tables show the Top Level Domains used in spam independent from the availability of the corresponding Web sites. When considering only the Top Level Domains of those URLs that really host spam content then we have:
June 2009
cn (China)
com
net
ru (Russia)
org
Rank May 2009April 2009March 2009February 2009January 2009
1.
2.
3.
4.
5.
cn (China)
com
ru (Russia)
net
fr (France)
com
cn (China)
at (Austria)
in (India)
org
cn (China)
com
ru (Russia)
net
at (Austria)
com
cn (China)
ru (Russia)
net
es (Spain)
com
cn (China)
ru (Russia)
net
es (Spain)
Table 20: Most Common Top Level Domains with real Spam content, 2009 H1
December 2009
cn (China)
com
net
uk (United Kingdom)
ru (Russia)
Rank November 2009October 2009September 2009August 2009July 2009
1.
2.
3.
4.
5.
cn (China)
com
net
ru (Russia)
eu (European Union)
cn (China)
com
net
ru (Russia)
eu (European Union)
cn (China)
com
net
ru (Russia)
eu (European Union)
cn (China)
com
net
info
ru (Russia)
cn (China)
com
net
info
org
Table 21: Most Common Top Level Domains with real Spam content, 2009 H2
The—maybe surprising—result is most spam content is not hosted on .com domains but on .cn domains, at least in March, and since May for the rest of 2009. As in previous years, the main purpose of including .com domains (which were typically randomly-generated and not even accessible or functioning URLs anyway) in spam is to make them look more legitimate. Using .com URLs in spam is the most unsuspicious type of URL because 55 percent of all domains used on the Internet are .com domains (source: IBM Security Solutions data center, see Web Content Trends on page 40 for more details).

65 IBM X-Force 2009 Trend and Risk Report IBM Security Solutions
Country Code Top Level Domains (like .cn, .ru, .es) are not used randomly. Nearly 100 percent of those URLs do really host spam content (or redirect to spam content automatically) if they are used in a spam message, which is different for the Generic Top Level Domains (like .com and .net). The following chart shows TLDs that most frequently use random domains (without hosting spam content).
Percentage of URLs per TLD that Host Real Spam Content
2009
20%
40%
60%
80%
100%
0%
Jan Feb Mar Apr May Jun Jul Aug Sep Oct Nov Dec
netcom
Figure 59: Percentage of URLs per TLD that Host Real Spam Content, 2009
As the chart shows, .net URLs found in spam emails were typically these randomly-generated, fake URLs throughout the spring and summer of 2009. But since August, the use of random .net URLs stopped almost completely, although random .com URLs were used through the entire year. In most cases, only 60-80 percent of them do really host spam content.
Do Spam URLs Link Back to the Internet?
Almost all spam URLs are from newly-registered domains, so it is rare to find a URL that was previously known by crawling the Internet. Another way to look at the problem is to check whether spam pages link to other parts of the Internet—a reputation score of sorts. The following chart shows what percentage of spam URLs contain links to other URLs:
Percentage of Spam Web Pages (URLs) with Links to other URLs
2007-2009
7%
6%
5%
4%
3%
2%
1%
0%
2007 2008 2009
Q1 Q2 Q3 Q4 Q1 Q2 Q3 Q4 Q1 Q2 Q3 Q4
Source: IBM X-Force®Figure 60: Percentage of Spam Web Pages (URLs) with Links to Other URLs, 2007-2009
As the chart shows, spammers do not tend to link to other parts of the Internet. In the first half of 2008, about 6 percent of all spam URLs contained links, but before and after that time, less than 2 percent of spam URLs linked to other parts of the Web.

66 IBM X-Force 2009 Trend and Risk Report IBM Security Solutions
Throughout 2009, however, spammers slowly increased the percentage of spam URLs with other links, so it is worthwhile to take a closer look at what kinds of URLs they are linking to.
The next chart breaks up these URLs into two categories: good categories (e.g. General Business, Shopping, Software / Hardware etc.) and bad categories (like Pornography, Malware, Anonymous Proxies etc.):
Spam URL Link, Tendency to Link to “Good” Web Sites or “Bad” Web Sites
2007-2009
70%
80%
90%
100%
60%
50%
40%
30%
20%
10%
0%
200920082007Q1 Q2 Q3 Q4 Q1 Q2 Q3 Q4 Q1 Q2 Q3 Q4
Bad Links of Spam URLs Good Links of Spam URLs
Figure 61: Spam URLs Link, Tendency to Link to “Good” Web sites or “Bad” Ones, 2007-2009
The majority of links point to good URLs. It is likely that spammers are attempting to obtain a good reputation score for their spam URLs. In any case, it is important to remember that (currently) less than 2 percent of spam URLs contain any links at all.
Types of Web Sites Linked to Spam URLs
Although our analysis has concluded that most spam URLs, when they do link to the Internet, tend to link to traditionally “good” Web sites, when you break down the data into categories (currently, 68 of them), the most frequented type of Web site is actually in the “bad” Web site category: Pornography. The following chart shows the percentage of pornography links in comparison to other links. It is interesting to note that the single category of pornography once outpaced good Web sites in totality (back in the first half of 2007).
Pornography – Most Prevalent Types of Links in Spam URLs 2007-2009
80%
100%
60%
40%
20%
0%
200920082007
Q1 Q2 Q3 Q4 Q1 Q2 Q3 Q4 Q1 Q2 Q3 Q4
Pornography Links of Spam URLs Other Links of Spam URLs
Figure 62: Pornography—Most Prevalent Types of Links in Spam URLs, 2007-2009

67 IBM X-Force 2009 Trend and Risk Report IBM Security Solutions
The other major categories are good categories: General Business, Software/Hardware, Social Networking, and Shopping. At the end of 2008, Social Networking played a major role for the first time taking up a huge percentage—more than 18 percent of all linked URLs. Although Social Networking links declined in the first half of 2009, they did increase slightly, reaching nearly 2 percent at the end of 2009.
Other Prevalent Categories of Links Found in Spam URLs 2007-2009
8%
10%
12%
14%
16%
18%
20%
6%
4%
2%
0%
200920082007Q1 Q2 Q3 Q4 Q1 Q2 Q3 Q4 Q1 Q2 Q3 Q4
General BusinessSoftware/Hardware
Social NetworkingShopping
Figure 63: Other Prevalent Categories of Links Found in Spam URLs, 2007-2009

68 IBM X-Force 2009 Trend and Risk Report IBM Security Solutions
Spam—Country of Origin
The following map shows the origination point7 for spam globally in 2009.
Brazil, the U.S., and India account for about 30 percent of worldwide spam.
China 3.1%
Columbia 2.8%
U.S.A. 9.1%
Brazil 13.7%
Turkey 3.4%India 6.7%
Vietnam 6.1%
South Korea 5.5%
Russia 4.3%
Poland 3.9%
Geographical Distribution of Spam Senders
Source: IBM X-Force®Figure 64: Geographical Distribution of Spam Senders. 2009
When looking at shorter time frames, a new star in the spam heaven becomes visible. In the second half of the year, Vietnam is a runner-up of the spam-sending countries. Aside from Brazil in the fourth quarter of 2009, Vietnam is the only country that sends out more than 9 percent of all spam at the end of 2009. On the other side, the US, Russia, and Turkey have become much less important as spam-sending countries.
Spam Origins 2009 per Quarter
8%
10%
12%
14%
16%
6%
4%
2%
0%
2009
Q1 Q2 Q3 Q4
Brazil India Russia South Korea
USATurkey Vietnam
Source: IBM X-Force®Figure 65: Spam Origins 2009 per Quarter
7 The country of origin indicates the location of the server that sent the spam e-mail. X-Force believes that most spam e-mail is sent by bot networks.
Since bots can be controlled from anywhere, the nationality of the actual attackers behind a spam e-mail may not be the same as the country from
which the spam originated.

69 IBM X-Force 2009 Trend and Risk Report IBM Security Solutions
Spam—Country of Origin Trends
There are two newcomers in the top four countries from which spam originates: India and Vietnam. After the McColo shutdown, India was one of the countries that bounced back the fastest, surpassing their original quantity of spam before the end of 2008. Obviously, their “success” has continued bringing them to third place.
Spam Origins Over Time: Long Term Gainers and Sustainers
2006-2009
8%
10%
12%
14%
16%
6%
4%
2%
0% 2006 2007 2008 2009
Brazil
India
Russia
South Korea Ukraine
Turkey USA
Vietnam
Source: IBM X-Force®Figure 66: Spam Origins Over Time: Long Term Gainers and Sustainers, 2006-2009
In contrast, several countries have declined.
Spam Origins Over Time: Long Term Decliners 2006-2009
8%
10%
12%
6%
4%
2%
0%2006 2007 2008 2009
China
France
Germany
Italy Spain
Poland United Kingdom
Source: IBM X-Force®Figure 67: Spam Origins Over Time: Long Term Decliners, 2006-2009
Particularly the decline of China may be a surprise, because we know that URLs with the Chinese Top Level Domain .cn are the most frequently used Spam URLs. The conclusion is that spam with .cn URLs could be sent from anywhere, but are much less likely to have actually come from China.
Growth in BRIC Countries
Brazil and India, as the third and the forth BRIC8 country, have shown rapid growth in the spam and phishing industries. The other two BRIC countries, Russia and China, have not been complacent in this regard. Russia is in the top three countries for the origin of Phishing emails, and China is the top hosting country for Spam URLs. For BRICS, spam and phishing are two industries that are experiencing rapid growth alongside many other industries in these countries.
8 BRIC is an acronym representing the rapidly growing economies of Brazil, Russian, India, and China.

70 IBM X-Force 2009 Trend and Risk Report IBM Security Solutions
Spam URLs—Country of Origin
The following map shows where the spam URLs are hosted.
France 1.6%
Poland 1.5%
U.S.A. 11.2%
China 43.3%
Argentina 1.6%Romania 6.5%
Hungary 5.6%
South Korea 4.6%
Russia 4.3%
Latvia 2.5%
Geographical Distribution of Spam URLs
Source: IBM X-Force®Figure 68: Geographical distribution of Spam URLs, 2009
Spam URLs—Country of Origin Trends
Over the last three years, spam URLs hosted on servers in China has increased. All other countries have stagnated or declined, particularly the US.
Spam URL Hoster Over Time 2006-2009
2006 2007 2008 2009
50%
45%
40%
35%
30%
25%
20%
15%
10%
5%
0%
China
Hungary
Romania
Russia
France
USA
South Korea
Czech Republic
Hong Kong
Source: IBM X-Force®Figure 69: Spam URL Hoster Over Time, 2006-2009
Although most spam does not originate from servers located in China, many of them contain .cn URLs and other types of links that are hosted on servers in China.

71 IBM X-Force 2009 Trend and Risk Report IBM Security Solutions
Spam—Average Byte Size
The most significant change in the average byte size of spam happened at the end of 2007 and corresponded with the decline of image-based spam. In 2008, byte size began to rise ever so slightly up until the McColo takedown later in the year. With the resurgence of image-based spam, the last few months in 2009 saw a resurgence in the average size of spam, too. In Summer 2009, the average size exceeded 5 kilobytes for the first time in one and a half years. In the second half of 2009, it declined below 4 kilobytes.
Average Byte Size of Spam2005-2009
10
12
8
6
4
2
0
Kilo
byt
es
2005 2006 2007 2008 2009
Q1 Q2 Q3 Q4 Q1 Q2 Q3 Q4 Q1 Q2 Q3 Q4 Q1 Q2 Q3 Q4 Q1 Q2 Q3 Q4
Source: IBM X-Force®Figure 70: Average Byte Size of Spam since 2005
Spam—Most Popular Subject Lines
While spam subject lines became more and more granular from 2007 to 2008 this trend is stagnating in 2009. The top ten subject lines in 2009 make up about 2.6 percent of all spam subject lines, a bit less than 3 percent in 2008, but significantly down from the 20 percent figure recorded in 2007.
As shopping on the Internet becomes more and more popular, spammers use subjects about a purchase confirmation to attract the user’s interest. Furthermore, the offer of replica watches is very often used to attract the user’s attention. Moreover, subjects that masquerade bounced emails (Non Delivery Reports—NDR’s) have come into vogue.
The following table shows the most popular spam subject lines in 2009:
%Subject Line
0.32%
0.30%
0.30%
0.29%
0.29%
0.28%
0.22%
0.21%
0.18%
0.17%
You’ve received an answer to your question
Hi
Swiss Branded Watches
Customer Receipt/Purchase Confirmation
Email Handling Opinion Needed
Replica Watches
You’ve received a greeting ecard
Return mail
Great Finds
Exquisite Replica
Table 22: Most Popular Spam Subject Lines, 2009

72 IBM X-Force 2009 Trend and Risk Report IBM Security Solutions
Continued Changes After the McColo Takedown—Up and Coming Spammers in New Countries
After the takedown of the California-based Web hoster McColo in November of last year, the spam volume dropped to around 25 percent of previous levels. The sudden and extreme volume and country distribution changes observed after the shutdown demonstrated that McColo was the base operator of spam bots all around the world.
Changes in International Distribution of Spam
The United States has, for years, maintained a top spot in the spam origin list. Six days before the takedown, it was in the number one spot. Six days after the takedown, spam production coming out of the US was reduced to a mere 14 percent of its original capacity. So, it was not a terrible surprise when the US finally lost its top spot on the sixth day after the takedown.
So, has the US has recovered from the McColo takedown? Almost. In 2009, Brazil was the top spam sender, and the US held the second position. While Brazil increased its overall percentage and the distance from the third “competitor”, the US may loose its second position next year to India, or—the new star in spam heaven—Vietnam.
But why Vietnam and Brazil? There may be two main conditions that have to be fulfilled to get to the top of the list of spam sending countries:
Significant growth of the Internet using population•
Significant number of inhabitants•
Both conditions are fulfilled by Brazil and Vietnam. In Brazil, 34 percent of the 199 million inhabitants use the Internet. This number increased by 1,250 percent in the last nine years.9 In Vietnam, 25 percent of the 89 million inhabitants use the Internet. This number increased by 10,882 percent in the last nine years.10 These increases lead to a huge amount of inexperienced people using PCs, which may be less patched, protected, or prone to socially-engineered beguilement, making them more vulnerable to malware that could turn them into botnet drones.
2009 H22009 H1End of 2008Just AfterJust Before
USA
Russia
Turkey
Spain
Brazil
Top Spammers Before and After the McColo Takedown
14.2%
11.0%
7.4%
5.9%
4.8%
China
Russia
USA
South Korea
Brazil
12.7%
11.4%
8.0%
6.2%
5.8%
Brazil
USA
China
Turkey
Russia
11.7%
8.1%
6.6%
5.7%
5.7%
Brazil
Vietnam
USA
India
South Korea
14.4%
8.5%
8.3%
6.9%
6.0%
12.7%
11.6%
6.3%
5.5%
5.0%
Brazil
USA
India
Turkey
Russia
Table 23: Top Spammers Before and After the McColo Takedown as well as 2009
9 http://www.internetworldstats.com/stats15.htm10 http://www.internetworldstats.com/stats3.htm

73 IBM X-Force 2009 Trend and Risk Report IBM Security Solutions
Phishing
This section covers the following topics:
Phishing as a percentage of spam•
Phishing country of origin trends, including phishing •
Web pages (URLs) Most popular subject lines and targets of phishing•
Phishing targets (by industry and by geography)•
Phishing Volume
Throughout 2008, phishing volume was, on average, 0.5 percent of the overall spam volume. In the first half of 2009, phishing attacks decreased dramatically to only 0.1 percent of the spam volume. We thought that criminal networks behind phishing might be leaning towards other methods for identity theft other than sending out a simple email that looks like a legitimate email coming from a bank. Far from it.
Contrary to what we witnessed in the first half of 2009, phishers came back with a vengeance in the third quarter. In June 2009, we saw a tiny uptick in volume. By August, however, the volume of phishing reached the volume seen in the most active months of 2008, and the volume seen in September completely surpassed the volume seen during any one month of 2008. We were not the only ones who noticed—several other research organizations talked about the change. At the end of the year, phishing slowed down to volumes similar to last year’s end, but it was still significantly above the volume in the first half of 2009 and slightly increased in December.
Phishing VolumeApril 2008-December 2009
250%
200%
150%
100%
50%
0%
2008 2009
May Jul Sep Nov Jan Mar May Jul Sep Nov
Source: IBM X-Force®Figure 71: Phishing Volume, April 2008-Dec 2009

74 IBM X-Force 2009 Trend and Risk Report IBM Security Solutions
Phishing—Country of Origin
Along with the dramatic changes in phishing volume come other dramatic changes, like the country of origin. Spain and Italy took slots one and two in 2008, but both have completely dropped from the top ten for 2009. The top sender now is Brazil, runner-up is the USA and third place goes to Russia, who was not even in the top ten last year. Other changes include the addition of Turkey, India, Colombia, and Chile and also the disappearance of Israel, France, and Germany, who were smaller players in 2008.
The following map highlights the major countries of origin for phishing emails in 2009.
Turkey 2.6%
Chile 2.2%
U.S.A. 10.4%
Brazil 23.9%
Columbia 3.4%Russia 8.9%
India 5.1%
South Korea 4.8%
Argentina 4.3%
Poland 3.8%
Geographical Distribution of Phishing Senders
Source: IBM X-Force®Figure 72: Geographical Distribution of Phishing Senders
Phishing—Country of Origin Trends
Many of the leading phishing senders of 2006, 2007, and 2008 have declined significantly in 2009. Particularly Spain, Italy, and South Korea have lost their top position.
Phishing Origins Over Time: Previous Major Contributors Decline
2006-2009
8%
10%
12%
14%
16%
18%
6%
4%
2%
0%
2006 2007 2008 2009
France
Germany
Israel
Italy South Korea
Poland Spain
Source: IBM X-Force®Figure 73: Phishing Origins Over Time: Previous Major Contributors Decline, 2006-2009

75 IBM X-Force 2009 Trend and Risk Report IBM Security Solutions
The new leading phishing senders now are Brazil, the USA, Russia, and India. Nearly half of all phishing emails are sent from computers located in these four countries.
Phishing Origins Over Time: Long Term Gainers
2006-2009
20%
25%
30%
15%
10%
5%
0%
2006 2007 2008 2009
Argentina
Brazil
Colombia
India Turkey
Russia USA
Source: IBM X-Force®Figure 74: Phishing Origins Over Time: Long Term Gainers, 2006-2009
Phishing URLs—Country of Origin
The following map shows where the phishing URLs are hosted. Most of the top players have not changed in comparison to 2008 (except Singapore and Thailand, which are no longer in the top 10), although their place has changed slightly in some cases. Romania gained significantly, capturing the pole position. Similarly, China moved up from ninth place to third place. In the ninth and tenth positions, Spain and Poland are newcomers.
Spain 2.6%
Poland 2.6%
U.S.A. 16.1%
Romania 16.8%
Russia 3.6%China 13.0%
South Korea 11.9%
United Kingdom 6.2%
Canada 4.9%
Japan 3.9%
Source: IBM X-Force®
Geographical Distribution of Phishing URLs
Figure 75: Geographical Distribution of Phishing URLs

76 IBM X-Force 2009 Trend and Risk Report IBM Security Solutions
Phishing URLs—Country of Origin Trends
Over the last four years, there have been many changes in the major phishing URL hosting countries. At one time, the US dominated the scene, hosting more than 50 percent of all phishing sites in 2006. In 2009, less than one-sixth of all phishing URLs are located in the US, finally losing first place to Romania. China and South Korea are not far behind.
40%
50%
60%
30%
20%
10%
0%
2006 2007 2008 2009
Canada
China
Japan
Romania Singapore
USARussia South Korea
Thailand United Kingdom
Phishing URL Hosters Over Time2006-2009
Source: IBM X-Force®Figure 76: Phishing URL Hosters Over Time, 2006-2009
Phishing—Most Popular Subject Lines
One of the biggest changes in 2008 was that popular subject lines were not so popular anymore. In 2007, the most popular subject lines represented more than 40 percent of all phishing emails. In 2008, the most popular subject lines made up only 6 percent of all phishing subject lines. Thus, phishers became more granular in their targets in 2008, essentially with a greater variance of subject lines than in 2007.
In 2009, the trend was reversed completely when it comes to phishing subject lines: The top 10 most popular subject lines represent more than 38 percent of all phishing emails.
The most used subject line “Notice of Underreported Income” belongs to a phishing threat that we have seen over weeks and months in the second half of 2009 and is related to a US tax Web site. Besides the French PayPal subject in the second position, subject lines contained general topics related to various financial phishing. Notably, half of the top 10 subject lines are related to Ally Bank (a former GMAC Bank). Obviously, phishers saw the official name change of GMAC Bank to Ally Bank as a big opportunity to lure users into a trap.
The following table shows the most popular phishing subject lines in 2009:
%Subject Line
17.09%
4.28%
3.78%
2.57%
2.27%
2.27%
2.26%
2.03%
1.25%
0.68%
Notice of Underreported Income
Attention! Votre compte PayPal a ete limite!
Update Your Account
GMAC Bank is now Ally Bank
Ally Bank (former GMAC Bank) customer form
Instructions for Ally Bank (former GMAC Bank) customer
For attention of Ally Bank (former GMAC Bank) customer
New version of Ally Bank (former GMAC bank) customer
form has been released
Important Information Regarding Your Limited Account.
American Express Online Form
Table 24: Most Popular Phishing Subject Lines 2009

77 IBM X-Force 2009 Trend and Risk Report IBM Security Solutions
Phishing Targets
Phishing—Targets by Industry
In 2008, financial institutions were unquestionably the dominant target of phishing emails. More than 88 percent targeted these institutions. In 2009, financial institutions remained the number one target. Along with the decline in phishing in the first half of 2009 and the change in phishing origins, the targets have changed significantly, too. Financial institutions now only represent 60.9 percent of the targets. The industries that have filled the gap are Governmental Organizations (20.4 percent), Auctions (7.3 percent), Online Payment institutions (6.7 percent), and Credit Cards (3.8 percent).
The other 0.9 percent of phishing targets is comprised of other industries such as communication services and online stores:
Auctions: 7.3%
Others: 0.9%
Online Payment: 6.7%
Credit Cards:3.8%
Financial Institutions:60.9%
GovernmentalOrganizations:20.4%
Phishing Targets by Industry 2009
Source: IBM X-Force®Figure 77: Phishing Targets by Industry, 2009
The percentages in Figure 77 represent major changes in the distribution of targets within the year. Figure 78 trends these changes. Over 2009, Financial Institutions were the predominant industry targeted by phishing emails. In the first half of 2009, Online Payment organizations were a significant target of phishing emails. However, in the second half of the year, we saw many more emails targeting government institutions (predominantly a US tax-related Web site), Credit Cards, and Auctions. At the same time, the percentage of phishing targeting Online Payment organizations declined.
Phishing Targets by Industry 2009 per Quarter
70%
80%
90%
100%
60%
50%
40%
30%
20%
10%
0%
2009Q1 Q2 Q3 Q4
Credit Cards
Financial InstitutionsAuctions
Governmental Organizations
Online Payment
Other
Source: IBM X-Force®Figure 78: Phishing Targets by Industry, 2009 per Quarter
Why did phishers target government institutions (in this case: a US tax-related Web site) instead of banks? One reason may be that banking phishing emails are received by everyone, whether that person is a customer of the targeted bank or not. With taxes, phishers have a broader target. Everybody has to pay taxes and there is one single institution to which legal workers in the US must pay. Hence, each single phishing email reaches a “customer” of the tax authorities.

78 IBM X-Force 2009 Trend and Risk Report IBM Security Solutions
Phishing—Financial Targets by Geography
Phishing emails targeted to tax authorities were seen almost exclusively in the US over the entire year. In financial phishing, there is also a trend towards a US target. Over 95 percent of all financial phishing targets in 2009 are located in North America.
Europe: 4.7%
Other: 0.1%North America:95.2%
Source: IBM X-Force®
Financial Phishingby Geographical Location
2009
Figure 79: Financial Phishing by Geographical Location, 2009
However, after taking a closer look using shorter time frames, dramatic changes become more apparent. The following chart shows the shift in geographical location that happened over the course of 2009. During the peak level of the financial crisis at the beginning of 2009, more than 60 percent of all financial phishing targets were located in Europe. Over the last nine months, phishers have turned towards the US nearly
exclusively. At the end of the year, phishers started to put more attention to those living down under—in the fourth quarter 0.3 percent of all financial phishing emails were targeted to Australia or New Zealand, making them bigger targets than all of Europe (0.2%). Hence, the phishers are making their way around the world Europe—America—Oceania. It will be interesting to watch phishers in 2010 to see if they continue to run around the globe to graze at financial institutions, region by region.
Financial Phishing by Geographical Location2008-2009 Q4
120%
100%
80%
60%
40%
20%
0%
2008 2009
Q1 Q2 Q3 Q4
Europe OceaniaNorth America
Source: IBM X-Force®Figure 80: Financial Phishing by Geographical Location, 2008-2009 Q4

© Copyright IBM Corporation 2010
IBM Global Services Route 100 Somers, NY 10589 U.S.A.
Produced in the United States of America February 2010 All Rights Reserved
IBM, the IBM logo, ibm.com and X-Force are trademarks or registered trademarks of International Business Machines Corporation in the United States, other countries, or both.
Other company, product and service names may be trademarks or service marks of others.
The use of third-party data, studies and/or quoted material does not represent an endorsement by IBM of the publishing organization, nor does it necessarily represent the viewpoint of IBM.
References in this publication to IBM products or services do not imply that IBM intends to make them available in all countries in which IBM operates.
U.S. Patent No. 7,093,239
Please Recycle
TIL14001-USEN-00