iasa-r-2504-p title firal pfpopt for tftf pfpiir 1979-12
TRANSCRIPT
IASA-R-2504-P
TITLE
Design and use of concrete pads for the cal ibrat ionof radiometric survey instrumentation
FirAL PFPOPT FOR TfTF PFPIir
1979-12-15 - 1984-07-31
Leif L/vborg
INRTTTUTE
Riso National LaboratoryElectronics DepartmentRoskildeDenmark
TKTEFI:ATTO?:AL ATOMIC EP.TPCY ACFTCY
LATE _0ato.ber 198d_._

i
CO
Rlse-M-2456
the Calibration of Portable andAiYborne Gamma-Ray Spectrometers- Theory, Problems, and Facilities
Laif Levborg
Ris» National Laboratory, DK-4000 Rotkilde, DenmarkOctober 1084
Rise National Laboratory Ris0-M-
I
V)
Title and author(s)
THE CALIBRATION OF PORTABLE AND
AIRBORNE GAMMA-RAY SPECTROMETERS
- THEORY, PROBLEMS, AND FACILITIES
Leif Lovborg
130 pages + 27 tables + 50 illustrations
Date October 1984
Department or
Nuclear Geophysic
Group's own registrationumber<s
152-36-34
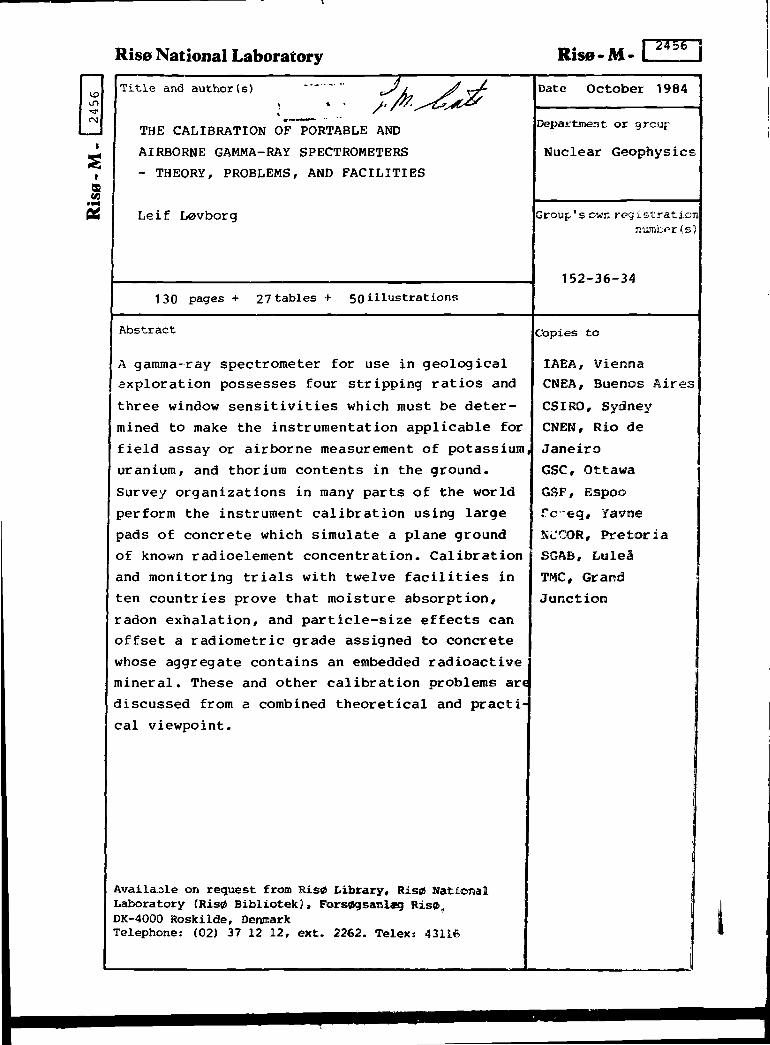
Abstract
A gamma-ray spectrometer for use in geological
exploration possesses four stripping ratios and
three window sensitivities which must be deter-
mined to make the instrumentation applicable for
field assay or airborne measurement of potassium,
uranium, and thorium contents in the ground.
Survey organizations in many parts of the world
perform the instrument calibration using large
pads of concrete which simulate a plane ground
of known radioelement concentration. Calibration
and monitoring trials with twelve facilities in
ten countries prove that moisture absorption,
radon exhalation, and particle-size effects can
offset a radiometric grade assigned to concrete
whose aggregate contains an embedded radioactive
mineral. These and other calibration problems ar«
discussed from a combined theoretical and practi-
cal viewpoint.
Copies to
IAEA, Vienna
CNEA, Buenos Aire
CSIRO, Sydney
CNEN, Rio de
Jane i ro
GSC, Ottawa
GSF, Espoo
Tc'-eg, Yavne
S L"COR, Pr e tor i a
SGAB, Luleä
TMC, Grand
Junct ion
Available on request from Risu Library, Ris0 NationalLaboratory (RisO Bibliotek?, Forsogsanlsg Rise,DK-4000 Roskilde, DenmarkTelephone: (02) 37 12 12, ext. 2262. Telex: 43116
- 2 -
This work was done under research contract 2504/RB between the
International Atomic Energy Agency and Rise National Laboratory.
The contract was signed in December 1979 and was renewed three
times so as to cover the period from January 1980 to August
1984. This document is the final report on che research project
for which the author has the full scientific responsibility.
ISBN 87-550-1043-1
ISSN 0418-6435
Riso repro 1984
- 3 -
RIS0-M-2456 October 1984
THE CALIBRATION OF PORTABLE AND AIRBORNE GAMMA-RAY SPECTROMETERS
- THEORY, PROBLEMS, AND FACILITIES
Leif Lovborg
Ris0 National Laboratory
Postbox 49
DK-4000 Roskilde
Denmark
SUMMARY
Portable and airborne gamma-ray spectrometers are used for map-
ping the natural concentrations of potassium, uranium (radium),
and thorium in the surface of geological formations. Although
the surveyed ground may not be plane, it is often permissible to
assume a 2» measuring geometry on rock outcrops and in aerial
scanning heights of typically 50 to 125 m. Accordingly, to get
the equipment calibrated as a radiometric assay tool, the survey
operator must have access to large and plane slab sources of
known radioelement concentrations. Over the past several years,
survey organizations in more than ten countries have built cali-
bration pads which are up to 100 m2 large and consist of con-
crete with evenly dispersed aggregate particles of orthoclase
(K feldspar), pitchblende, thorite, or other radioactive mineral.
Twelve of these pads facilities were monitored with a portable
spectrometer to estimate the calibration performance obtained
with concrete slab sources and to identify the possible problems
associated with the manufacture and use of such sources. The ex-
perimental data plus various calculations in combination with
information in the literature made it possible to reach the fol-
lowing ten main conclusions: 1) An adequate calibration facility
-A-
is formed by three concrete pads spiked with a predominant con-
tent of either potassium, uranium, or thorium. An additional pad
of low radioelement content must be included to eliminate the
background contribution from the surroundings. 2) Uranium and
thorium pads of the required radioactive purity and homogeneity
is best manufactured by mixing powdered high-grade ore into
quartz or silica sand of about 3 mm maximum particle size. It is
very important to select a uranium ore of negligible radon emana-
tion power, and it may be advisable to strain off particles which
are less than 75 Mm across to limit the specific surface of the
admixture. 3) Calibration pads for portable spectrometers are
conveniently constructed by placing the wet mixes in circular
metal containers, approximately 2 m in diameter and 50 cm deep.
The uranium pad grade should not exceed 400 ppm to avoid pulse
pile-up effects; grades of 100 ppm eU and 200 ppm eTh are useful
calibration levels for field assays in general. 4) Designers of
airport pads should make use of the IAEA recommendation from
1976 (minimum calibration surfaces of 50 m^ and grades of 20 ppm
eU and 40 ppm eTh). 5) Concrete (mortar) based on fine aggregate
must be expected to be 20% porous and absorp up to 10% moisture
in an outdoor environment. It is the most relevant to include the
average pad moisture in the calibration grades and incorporate
the seasonal moisture variation of perhaps ±3% as a grade un-
certainty. 6) In-situ pad grades can be estimated quite well by
gamma-ray analysis of freshly cured concrete in sealed sample
cans. 7) The thorium reference materials presently available for
assigning grades to pads are not satisfactory because their
radium contents are unspecified. 8) Spectrometer counts recorded
on calibration pads are conveniently processed by means of
weighted, three-dimensional regression analysis. 9) Simple
working expressions make it possible to include calibration un-
certainty and counting statistics on the assay spot in the stan-
dard deviations of radioelement concentrations measured with a
portable spectrometer. 10) An airborne spectrometer can be cali-
brated reasonably well by combining a calibration trial on pads
with a theoretical correction for atmospheric gamma-ray at-
tenuation. The normal practice of determining the window sensi-
tivities from a flight over a test range presupposes a ground of
moderate moisture content and little radon exhalation.

- 5 -
CONTENTS
Page
1. INTRODUCTION 7
1.1. Subject and background of the research 7
1.2. Outline of the report 9
2. SPECTROMETER WINDOW COUNTING 12
2.1. Portable spectrometers 12
2.2. The generation of window counts 13
2.3. Stripping ratios and window sensitivities 15
2.4. Field assays 18
2.5. Background counts . 21
2.6. Precision of measurement . 23
2.7. Airborne gamma-ray surveys 28
3. BASIC CALIBRATION PROBLEMS 31
3.1. General considerations 31
3.2. Counting and calibration geometries 36
3.3. Gamma-ray mass attenuation « 40
3.4. Moisture effect 43
3.5. Radioelement depth variations 46
4. CALIBRATION FACILITIES BASED ON CONCRETE PADS 50
4.1. Calibration equations 50
4.2. Existing calibration systems 54
4.3. Physical dimensions involved 55
4.4. Homogeneity characteristics of radioactive con-
crete 59
4.5. Criteria for the selection of mix ingredients .... 64
4.6. The manufacture of calibration pads 68
5. ASSAY AND USE OF PAD RADIOELEMENT CONCENTRATIONS 72
5.1. Pad moisture - an intricate problem 72
5.2. Sealed-can gamma-ray counting 76
5.3. Radiation monitoring of calibration pads 82
5.4. The processing of calibration counts 85
5.5. Theoretical accuracy of field determinations 88
- 6 -
Page
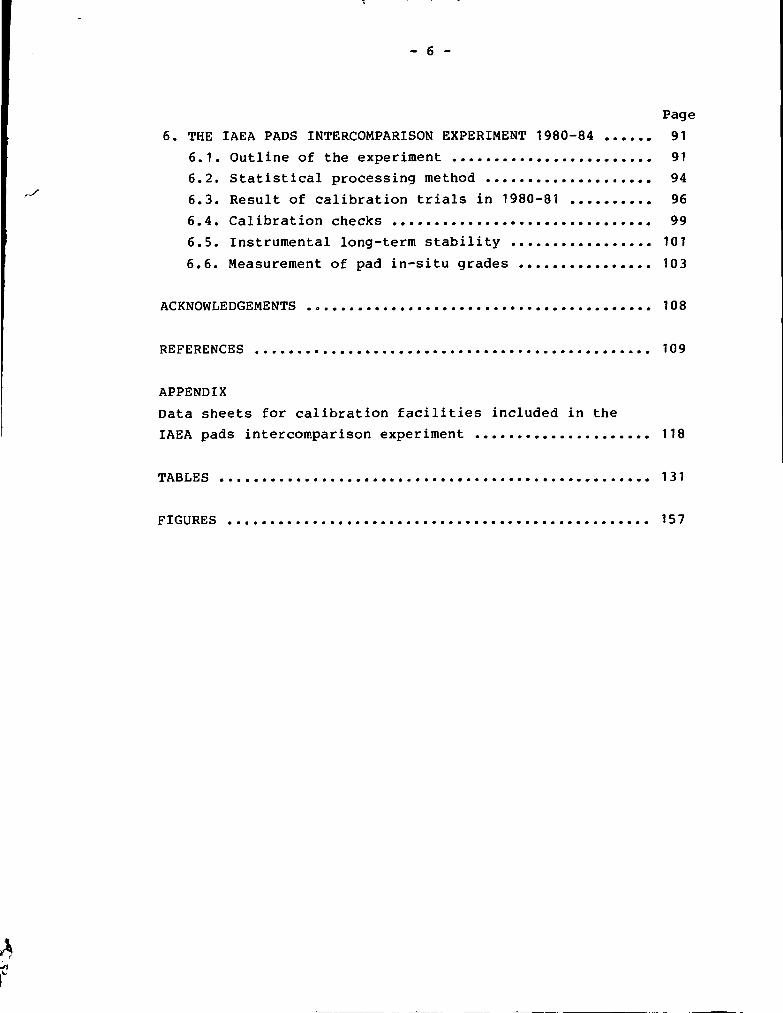
6. THE IAEA PADS INTERCOMPARISON EXPERIMENT 1980-84 91
6.1. Outline of the experiment 91
6.2. Statistical processing method 94
6.3. Result of calibration trials in 1980-81 96
6.4. Calibration checks 99
6.5. Instrumental long-term stability 101
6.6. Measurement of pad in-situ grades 103
ACKNOWLEDGEMENTS ., 108
REFERENCES 109
APPENDIX
Data sheets for calibration facilities included in the
IAEA pads intercomparison experiment 118
TABLES 131
FIGURES 157
- 7 -
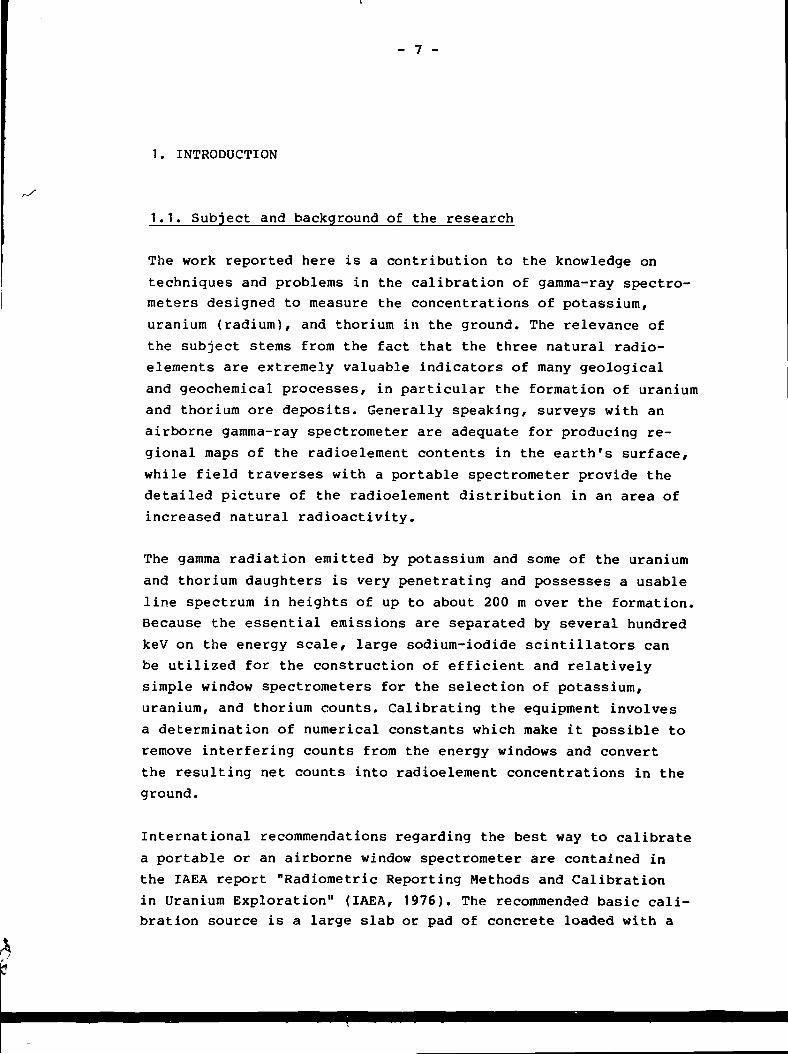
1. INTRODUCTION
1.1. Subject and background of the research
The work reported here is a contribution to the knowledge on
techniques and problems in the calibration of gamma-ray spectro-
meters designed to measure the concentrations of potassium,
uranium (radium), and thorium in the ground. The relevance of
the subject stems from the fact that the three natural radio-
elements are extremely valuable indicators of many geological
and geochemical processes, in particular the formation of uranium
and thorium ore deposits. Generally speaking, surveys with an
airborne gamma-ray spectrometer are adequate for producing re-
gional maps of the radioelement contents in the earth's surface,
while field traverses with a portable spectrometer provide the
detailed picture of the radioelement distribution in an area of
increased natural radioactivity.
The gamma radiation emitted by potassium and some of the uranium
and thorium daughters is very penetrating and possesses a usable
line spectrum in heights of up to about 200 m over the formation.
Because the essential emissions are separated by several hundred
keV on the energy scale, large sodium-iodide scintillators can
be utilized for the construction of efficient and relatively
simple window spectrometers for the selection of potassium,
uranium, and thorium counts. Calibrating the equipment involves
a determination of numerical constants which make it possible to
remove interfering counts from the energy windows and convert
the resulting net counts into radioelement concentrations in the
ground.
International recommendations regarding the best way to calibrate
a portable or an airborne window spectrometer are contained in
the IAEA report "Radiometric Reporting Methods and Calibration
in Uranium Exploration" (IAEA, 1976). The recommended basic cali-
bration source is a large slab or pad of concrete loaded with a
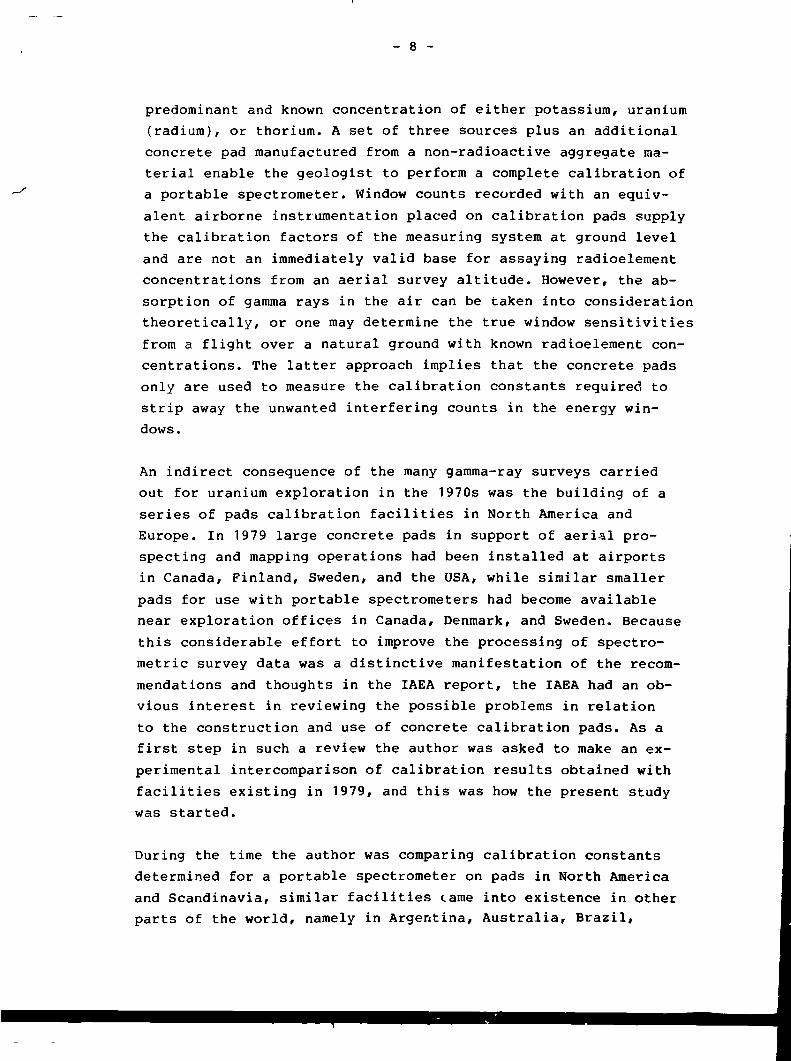
- 8 -
predominant and known concentration of either potassium, uranium
(radium), or thorium. A set of three sources plus an additional
concrete pad manufactured from a non-radioactive aggregate ma-
terial enable the geologist to perform a complete calibration of
a portable spectrometer. Window counts recorded with an equiv-
alent airborne instrumentation placed on calibration pads supply
the calibration factors of the measuring system at ground level
and are not an immediately valid base for assaying radioelement
concentrations from an aerial survey altitude. However, the ab-
sorption of gamma rays in the air can be taken into consideration
theoretically, or one may determine the true window sensitivities
from a flight over a natural ground with known radioelement con-
centrations. The latter approach implies that the concrete pads
only are used to measure the calibration constants required to
strip away the unwanted interfering counts in the energy win-
dows.
An indirect consequence of the many gamma-ray surveys carried
out for uranium exploration in the 1970s was the building of a
series of pads calibration facilities in North America and
Europe. In 1979 large concrete pads in support of aerial pro-
specting and mapping operations had been installed at airports
in Canada, Finland, Sweden, and the USA, while similar smaller
pads for use with portable spectrometers had become available
near exploration offices in Canada, Denmark, and Sweden. Because
this considerable effort to improve the processing of spectro-
metric survey data was a distinctive manifestation of the recom-
mendations and thoughts in the IAEA report, the IAEA had an ob-
vious interest in reviewing the possible problems in relation
to the construction and use of concrete calibration pads. As a
first step in such a review the author was asked to make an ex-
perimental intercomparison of calibration results obtained with
facilities existing in 1979, and this was how the present study
was started.
During the time the author was comparing calibration constants
determined for a portable spectrometer on pads in North America
and Scandinavia, similar facilities came into existence in other
parts of the world, namely in Argentina, Australia, Brazil,
- 9 -
Israel, and South Africa. (The latter country actually took steps
to construct a series of small pads in the early 1970s; an air-
port calibration facility was added in 1981). This was an op-
portunity to collect additional monitoring data so as to make
the IAEA intercomparison experiment more comprehensive and con-
clusive. Observed discrepancies between laboratory-analysed pad
radioelement concentrations on the one hand and monitoring re~
suits on the other prompted a detailed study of the possible
causes of such discrepancies. It was found that moisture absorp-
tion, radon exhalation, and grain-size effects may offset a pad
calibration grade from the assigned reference vjlue. Problems
like these were not foreseen in the IAEA calibration report which
was based on experience with the limited number of pads facili-
ties constructed before 1976. In reporting the observations made
during four years of calibration and monitoring trials plus
various follow-up investigations, the author found it relevant
to present the material in the form of an exhaustive paper which
is meant as a supplement to "Radiometric Reporting Methods and
Calibration in Uranium Exploration".
1.2. Outline of the report
It has not been an easy job trying to describe the properties of
a number of actually established calibration facilities while at.
the same time presenting information which proves that several of
the facilities would have given more accurate calibrations if
greater care had been exerted in selecting the radioactive ad-
mixtures for the pads. Nevertheless, the author thinks he has an
obligation to be critical in view of the fact that he himself is
among those who added uranium ore to concrete without thoroughly
checking the emanation power of the ore particles. Another dif-
ficulty in writing up the present report was the wish to combine
specialist information with a discussion of the calibration prob-
lems in general, including their relation to field uncertainties
such as counting statistics, geometry effect, and moisture in the
ground.
Chapter 2 is an attempt to highlight the basic principles and
technicalities for executing a spectrometric in-situ assay or a

- 10 -
series of similar measurements along a flight line. Host of tlhese
topics were dealt with in greater detail in the IAEA reports
"Recommended Instrumentation for Uranium and Thorium Exploration*1
(IAEA, 1974) and "Gamma-Ray Surveys in Uranium Exploration"
(IAEA, 1979). It should here be mentioned that the IAEA also
published "Borehole Logging for Uranium Exploration - A Manual."
(IAEA, 1982) in which the reader will find extensive information)
on the use of gamma-ray spectrometry in subsurface geophysics»
Other comprehensive reviews of relevance to the matters discussed
in chapter 2 and later were presented by Oarnley (1973), Kogan et
al. (1976), Wollenberg (1977), Darnley (1977), Grasty «1979J,
Killeen (1979), Vavilin et al., (1982J, and Bristow (1983}.
It might be asked why the present author did not make allowance
for potassium counts in the uranium and thorium windows in set-
ting up the "stripping equations" for a spectrometer. The answer
is, as far as the author sees the problem, that if such counts
occur (because of poo*, sodium-iodide detector energy resolution},
one may just as well use the complete 3 * 3 matrix equation K in-
troduced in chapter 5) for calculating the tadioelement concen-
trations in the ground. The reader might also object that the
author omits any processing of counts recorded in the total-count
window. However, an attempt to discuss the conversion of total
gamma-ray counts into equivalent "units of radioelement concen-
tration" or "Ur" would not fit the objective of a report specifi-
cally devoted cc gamma-ray spectrometry. In the author's opinion
the "Ur" (IAEA, 1976; OECD, 1981) has its greatest justification
in the reporting of measurements executed with scintillation
counters held over exposed radioactive mineralization. A last
omission that some readers might regret is the role of atmos-
pheric radon in airborne gamma-ray surveys and the associated
use of an upward-looking detector for removing the resulting ad-
ditional background in the uranium window. Regarding the involved
calibration problem, the reader must consult other sources of
information, for example Aviv and Vulkan (1983). The important
new result presented in chapter 2 is the working expressions for
calculating signal precision and a priori detection limits in
radioelement assaying with a portable spectrometer. In fact» 9
method to estimate the effect of counting statistics on measured

- 1 1 -
radioelement concentrations is just as important as the avail-
ability of a calibration facility.
Chapter 3 is to a large extent theoretical and has been included
especially to assess the counting geometry on a circular or
rectangular calibration pad and to study the expected effects of
moisture and radon diffusion in porous source media in general.
In chapter 4 the design of a calibration facility is discussed
using existing facilities to exemplify the factors which govern
the choice of pad dimensions, the spacing of pads, and the radio-
metric pad grades. It is furthermore discussed how the fineness
and spatial dilution of radioactive ore particles in concrete
affect the volume of mix required to analyse a reliable pad
grade. The chapter also contains recommendations regarding the
selection of suitable ore materials and the use of these for
manufacturing concrete of a satisfactory radioactive homogeneity
and tightness. Chapter 5 deals with the problem of assigning pad
grades which include moisture absorbed in the concrete porespaces.
The use of sealed-can gamma-ray analysis is explained and cur-
rently available uranium-radium and thorium reference materials
are mentioned. Readers who are especially interested in knowing
how assigned radioelement concentrations and their estimated un-
certainties are used in calibration trials on pads will find the
desired information in this chapter.
The pads intercomparison experiment carried out on behalf of the
IAEA is described in chapter 6. Six airport facilities and six
other calibration sites in ten countries were incorporated in the
experiment which lasted from February 1980 to August 1984. It has
been attempted to use pads visited during 1980-81 for calibrating
the monitoring spectrometer, while data recorded later have been
utilized to test pad radioelement concentrations estimated from
laboratory assays. The Appendix included after the list of refer-
ences gives the details of each facility, including the assigned
or monitored pad grades. This compilation of data sheets enables
the reader to obtain an overview of the majority of spectrometer
calibration sites established up to the present. Existing facili-
ties not reported on here comprise: 1) Eleven smaller pads at the
Pelindaba research centre of the Nuclear Development Corporation
- 25 -

- 12 -
of South Africa (Corner et al., 1979). Several of these pads
were actually monitored by the author in October 1982, but their
tradiometric grades were considered too high for being exploited
in the intercomparison. 2) A Czechoslovak facility for portable
spectrometers at Bratkovice near Pribram (Rojko, 1976). 3) Seven
sites for calibrating portable spectrometers in the USA (George
and Knight, 1982; George et al., 1984). 4) An airport facility
in Teheran, Iran (Killeen, 1979). 5) A series of four 8 * 8 m
pads constructed in 1984 at U-Tapao airfield, 120 km south of
Bangkok, Thailand (R.L. Grasty, personal communication).
It might be added that concrete blocks designed for the calibra-
tion of hand-held scintillation counters are available in Den-
mark and Greece (L0vborg, 1983) plus several places in the USA
(Mathews and Kosanke, 1978).
2. SPECTROMETER WINDOW COUNTING
2.1. Portable spectrometers
Exploration geologists are typically becoming acquainted with
the recording of gamma-ray window counts through the purchase
of a portable spectrometer. Figure 1 shows a Geometries model
GR-410 portable spectrometer placed for counting on a granite
outcrop. The bottom of the vertically positioned detector unit
houses a 76 * 76 mm sodium-iodide crystal (thallium activated)
in optical contact with a photomultiplier. A flexible cable
feeds the detector pulses into a recording unit placed in the
leather carrying case for the equipment. Assay of the radio-
element contents in the outcrop is performed by switching the
recording unit into the counting mode for a preselected time.
Gamma-ray counts are then registered in three energy windows
which select characteristic emissions at 1.46 MeV (potassium),
1.73 to 1.85 MeV (uranium), and 2.61 MeV (thorium). Table 1
shows the decay events producing these emissions as well as

- 13 -
the energy intervals used for window counting with a GR-410.
The selected isotopes 214Bi and 208x1 are, respectively, radio-
active daughters of 238U and 232Th, while 40K is a natural
potassium radioisotope emitting 3.31 ± 0.03 photons/s per gram
of potassium (Endt and Van der Leun, 1973).
The window settings of the GR-410 recording unit are provided
through a permanent adjustment of internal turn dials. The set-
tings in Table 1 are recommended in the GR-410 manual and cor-
respond to the use of a constant relative window width of 12%.
A supplementary total-count window with a lower energy limit of
0.5 MeV is available to make the instrument applicable for rapid
selection of representative assay spots on the rock surface. As-
says are terminated by initiating a readout cycle that displays
the total counts and the high-energy counts in slow succession
on a four-digit LED panel. A GR-410 spectrometer was used for
executing the measurements reported in chapter 6. Portable spec-
trometers supplied by most other manufacturers of geophysical in-
strumentation are based on similar design concepts and operated
with more or less identical window settings.
One of the most recent instrument developments is the Czechoslovak
GS-256 spectrometer which is a compact multichannel device per-
mitting energy windows to be set up as regions of interest. This
new unit, manufactured by Geofyzika in Brno, can be connected to
a desk calculator such as the HP-85 for the processing of cali-
bration spectra and storage of the resulting window calibration
factors in the memory of the spectrometer. A microprocessor in
the latter makes it possible to get the field readings displayed
in final form, i.e. as radioelement concentrations in the ground.
(J. Bartosek, personal communication).
2.2. The generation of window counts
Gamma-ray energy distributions produced at the surface of a plane
and infinite rock medium are presented in Figs. 2 to 4. These
spectra of the radiation input to an assay device like a port-
able spectrometer were calculated by means of photon transport
- 27 -

- 14 -
codes which simulate the scattering and absorption of gamma ra-
diation in the ground and the air (Kirkegaard and Lovborg, 1979;
Kirkegaard and Lovborg, 1980). Figures 3 and 4 include essen-
tially all photon emissions associated with the decay series of
uranium and thorium and are based on up-to-date emission data in
the Evaluated Nuclear Structure Data File (ENSDF) (Ewbank, 1980;
Kocher, 1981). It can be seen that each radioelement generates a
discrete flux spectrum superimposing a continuum with energies
up to the maximum energy of the photons emitted by the radioele-
ment. The discrete flux components represent directly transmitted
gamma rays, while the continuously distributed flux is due to
single and multiple Compton scattering along the transmission
paths through the rock medium.
Figures 3 and 4 demonstrate that the potassium window of a field
spectrometer (window 1) is sensitive to uranium and thorium. De-
tected along with the primarily selected 1.46 MeV photons from
^0K are several emissions around 1.5 MeV from 21^Bi and 228Ac
(another thorium daughter) plus scattered radiation from uranium
and thorium emitters with energies exceeding the upper limit of
the potassium window. From Fig. 4 it can be seen that there is a
similar influx of thorium radiation into the uranium window (win-
dow 2). This undesirable sensitivity of an energy window to more
than one radioelement is enhanced by the response of a sodium-
iodide scintillator to a flux of terrestrial gamma radiation.
Gamma rays of any energy detected with a sodium-iodide crystal
produce a full-energy peak which is accompanied by a Compton
continuum arising from a partial outscatter of the incident ra-
diation. If the gamma-ray energy is greater than 1.022 MeV, po-
sitron-electron pairs are created in the crystal. The unstable
positrons annihilate into two oppositely directed 0.511 MeV
photons whose escape from the crystal is responsible for the
occurrence of two satellite peaks in the resulting pulse spec-
trum. These annihilation escape peaks are positioned 0.511 and
1.022 MeV below the full-energy peak. Scintillation-detector
energy resolution is commonly expressed in terms of the relative
width at half maximum (rwhm) of the full-energy peak obtained
with the 0.662 MeV photons from a ^^Cs source. Further details
- I S -
on the response characteristics of inorganic scintillators are
given in a recommendable textbook by Croutamel (1970).
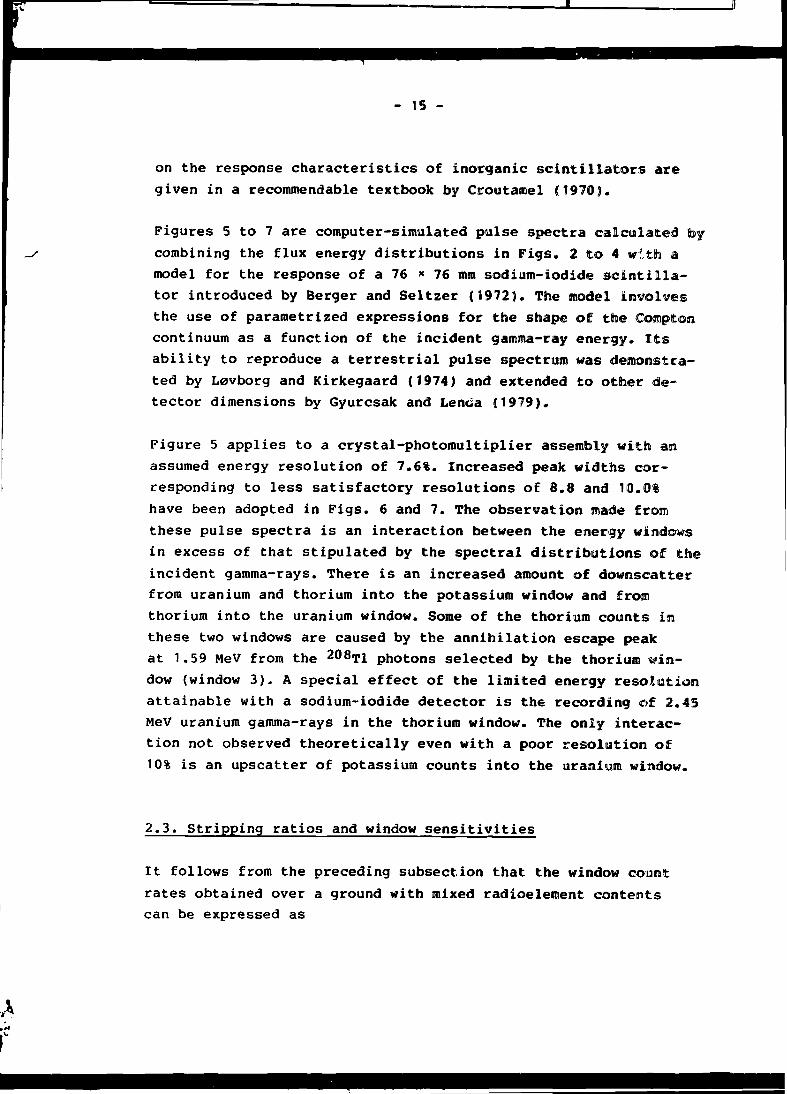
Figures 5 to 7 are computer-simulated pulse spectra calculated by
combining the flux energy distributions in Figs. 2 to 4 with a
model for the response of a 76 * 76 mm sodium-iodide scintilla-
tor introduced by Berger and Seltzer (1972). The model involves
the use of parametrized expressions for the shape of the Comptoro
continuum as a function of the incident gamma-ray energy. Its
ability to reproduce a terrestrial pulse spectrum was demonstra-
ted by Lovborg and Kirkegaard (1974) and extended to other de-
tector dimensions by Gyurcsak and Lenua (1979).
Figure 5 applies to a crystal-photomultiplier assembly with an
assumed energy resolution of 7.6%. Increased peak widths cor-
responding to less satisfactory resolutions of 8.8 and 10.0%
have been adopted in Figs. 6 and 7. The observation made from
these pulse spectra is an interaction between the energy windows
in excess of that stipulated by the spectral distributions of the
incident gamma-rays. There is an increased amount of downscatter
from uranium and thorium into the potassium window and from
thorium into the uranium window. Some of the thorium counts in
these two windows are caused by the annihilation escape peak
at 1.59 MeV from the 208.pi photons selected by the thorium win-
dow (window 3). A special effect of the limited energy resolution
attainable with a sodium-iodide detector is the recording of 2.45
MeV uranium gamma-rays in the thorium window. The only interac-
tion not observed theoretically even with a poor resolution of
10% is an upscatter of potassium counts into the uranium window.
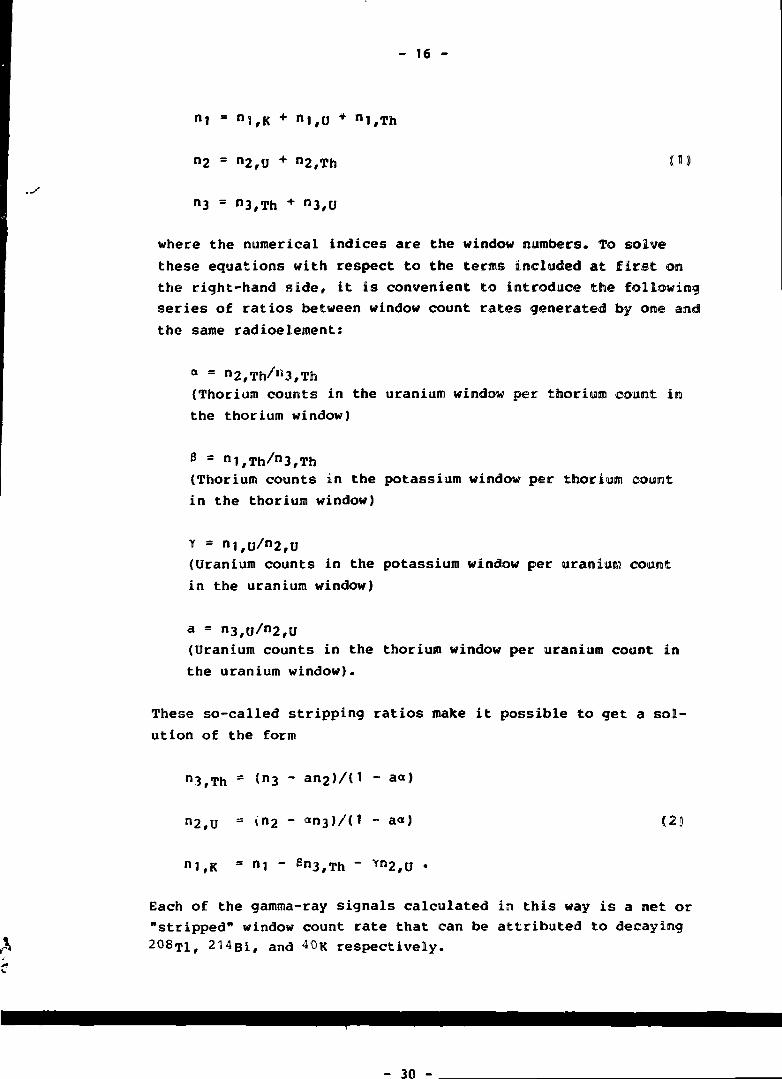
2.3. Stripping ratios and window sensitivities
It follows from the preceding subsection that the window count
rates obtained over a ground with mixed radioelement contents
can be expressed as
- 16 -
n1 " 1M,K + n1,U * n1,Th
n2 = n2,U + n2,Th HJ
n3 " n3,Th + n3,U
where the numerical indices are the window numbers. To solve
these equations with respect to the terns included at first on
the right-hand side, it is convenient to introduce the following
series of ratios between window count rates generated by one and
the same radioelement:
a = n2,Th/R3,Th(Thorium counts in the uranium window per thorium count in
the thorium window)
B " n1,Th/n3,Th(Thorium counts in the potassium window per thorium count
in the thorium window)
Y = n1f(j/n2,u(Uranium counts in the potassium window per uranium count
in the uranium window)
a = n3f(j/n2rö(Uranium counts in the thorium window per uranium count in
the uranium window).
These so-called stripping ratios make it possible to get a sol-
ution of the form
n3,Th =
n2,U =
n1,K = n1 " Sn3,Th ~
12}
Each of the gamma-ray signals calculated in this way is a net or
"stripped" window count rate that can be attributed to decaying
208Tif 214Bi, and 40K respectively.
- 30 -

- 17 -
A geologically informative assay result is obtained by express-
ing the activities of these radioisotopes as equivalent concen-
trations of thorium, uranium, and potassium. The reporting of
experimental ^ K activity as a weight percentage of potassium
does not have any associated ambiguity, provided it can be as-
sumed that the potassium in rocks and has a constant isotopic
composition. Equivalent uranium and thorium concentrations, on
the other hand, are imaginary reporting quantities which can
only be interpreted as chemical concentrations for ground ma-
terial in which 214gi an<j 208^2 a r e in radioactive equilibrium
with their respective parents, 238u and 232«ph. Disequilibrium
in the 2^8U decay chain is a very common phenomenon in geological
environments (Ivanovich and Harmon, 1982) and is a frequent cause
of discrepancies between equivalent and chemical uranium concen-
trations. Uranium and thorium concentration equivalents are de-
noted by the letter "e" and conveniently stated in units of ppm
eU and ppm eTh (IAEA, 1976) (1 ppm = 1 mg/g).
The step of calculating a spectrometer assay result is accom-
plished by dividing the stripped window count rates by a set of
window sensitivities, s<pnr S(j, SR, chosen as follows:
sTh = count rate in window 3 per ppm eTh
S(j = count rate in window 2 per ppm ell
SK = count rate in window 1 per % R.
The determination of these three calibration constants plus the
four stripping ratios, a, 3, Y, and a, is the objective of the
instrument calibration required to make a field spectrometer ap-
plicable as an assay tool. Without such a calibration, a spec-
trometer can provide no more than a crude discrimination between
ground concentrations of thorium, uranium, and potassium.
An impression of the stripping ratios and window sensitivities
of a portable spectrometer can be obtained by integrating the
computer-simulated spectra for a 76 * 76 mm detector between the
energy limits of the spectrometer windows. This has been done for
the spectra in Figs. 5 to 7 with their added energy windows of a
Geometries GR-410. Tables 2 and 3 show the resulting theoretical
- 18 -
calibration constants and their variation with the energy resol-
ution assumed for the detector unit. In chapter 6 the data are
compared with a set of experimentally determined calibration con-
stants. It is seen that the stripping ratios a and 3 and the win-
dow sensitivities Sg and S(j are significantly influenced by the
resolution performance of the crystal-photomultiplier assembly.
This is because of the counts excluded from the flanks of the
full-energy peaks selected by the potassium and the uranium win-
dow. Reduced energy resolution with time, as expressed by an in-
creased percent resolution, is encountered in practice due to a
gradual loss of optical contact between the crystal and the
photomultiplier. The initial contact between the two detector
components may be prolonged by storing an unused detector probe
in an upright position (J. Volny, personal communication).
2.4. Field assays
A spectrometer set-up like that in Figure 1 offers the advantage
of providing a large sampling volume in the ground material. The
window counts are contributed by a bowl-shaped region with a
surface extension of a few meters and a depth extension below
the assay spot of about 35 cm (Lovborg et al., 1969). Since the
gamma-ray emitters contained in a volume of rock are detected
less efficiently with increasing distances between the volume
element and the assay spot, the geostatistical significance of
the counts are small outside a surface radius of half a meter and
below a depth of 15 cm. An associated effective sample can be
calculated from the assumption that the radioelements have a
random spatial distribution in the ground. The effective sample
is geostatistically equivalent to a similar mass of excavated
material and amounts to 40-50 kg in assays of uranium and thorium
(Lovborg et al.r 1971).
Most of the published assay data recorded with field spectro-
meters are from the days when it became possible to build
equipment of the required portability and low power consumption,
but when adequate calibration facilities had not become avail-
able yet (Richardson, 1964; Doig, 1968, Levborg et al., 1969;
- 19 -
Killeen and Carmichaei, 1970; Lovborg et al., 1971). These
older reportings illustrate the geological relevance of the
in-situ method and might prompt a number of similar applications
based on the many pads calibration facilities constructed after
1970 (Appendix).
One application of great current interest in connection with
environmental monitoring and remedial actions is the conversion
of recorded ground radioelement concentrations into correspond-
ing gamma-ray exposure rates and resulting population doses.
Experimental work with portable spectrometers in this scientific
area has been executed over soil and bedrock (Lovborg et al.,
1979) and over massive occurrences of exposed uranium-thorium
mineralization (Lovborg et al., 1980). Table 4 shows two sets
of conversion factors that have been estimated from photon
transport calculations applied to an infinite and plane soil
medium. The data set from the work of Lovborg et al. (1979) is
based on an older compilation of the photon emissions in the
decay chains of 2 3 8U and 232Th (Beck, 1972). The other data
set was calculated from the line intensities, with associated
uncertainties, in the 1981 version of the Evaluated Nuclear
Structure Data File. From the last result it can be seen that
the thorium exposure rate is less accurately known than the
exposure rates from potassium and uranium. This is because the
intensities of the photon emissions from 228Ac have large ex-
perimental uncertainties (Kocher, 1981). The factors for con-
verting natural radioelement concentrations into radiation ex-
posure are nearly identical for rocks and soils and are only
slightly affected by the small contents of iron and other
gamma-ray absorbers in common geological materials (Kirkegaard
and Lovborg, 1980).
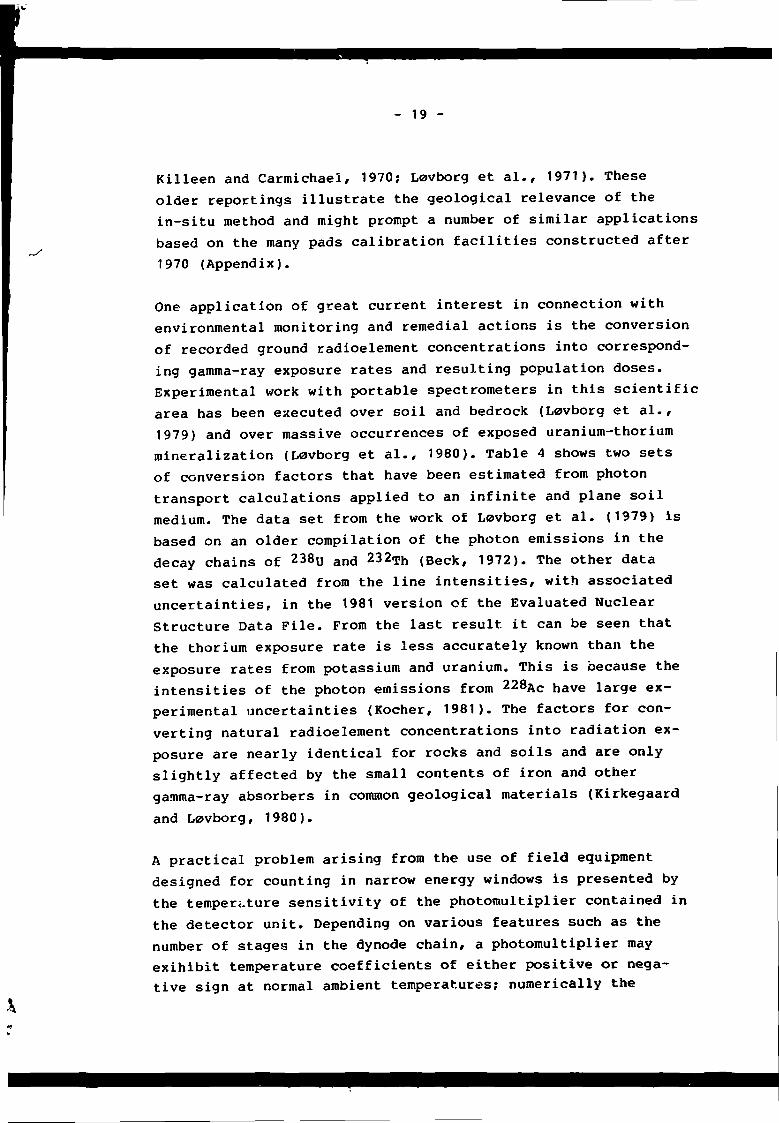
A practical problem arising from the use of field equipment
designed for counting in narrow energy windows is presented by
the temperature sensitivity of the photomultiplier contained in
the detector unit. Depending on various features such as the
number of stages in the dynode chain, a photomultiplier may
exihibit temperature coefficients of either positive or nega-
tive sign at normal ambient temperatures; numerically the
- 20 -
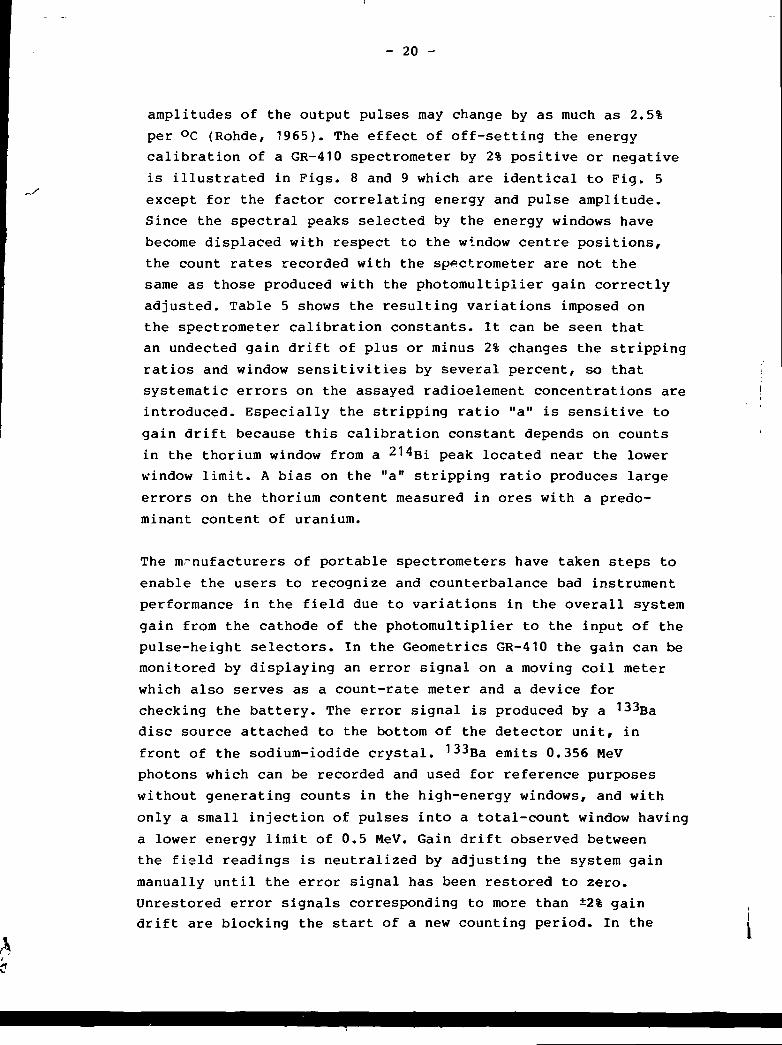
amplitudes of the output pulses may change by as much as 2.5%
per 0C (Rohde, 1965). The effect of off-setting the energy
calibration of a GR-410 spectrometer by 2% positive or negative
is illustrated in Figs. 8 and 9 which are identical to Fig. 5
except for the factor correlating energy and pulse amplitude.
Since the spectral peaks selected by the energy windows have
become displaced with respect to the window centre positions,
the count rates recorded with the spectrometer are not the
same as those produced with the photomultiplier gain correctly
adjusted. Table 5 shows the resulting variations imposed on
the spectrometer calibration constants. It can be seen that
an undected gain drift of plus or minus 2% changes the stripping
ratios and window sensitivities by several percent, so that
systematic errors on the assayed radioelement concentrations are
introduced. Especially the stripping ratio "a" is sensitive to
gain drift because this calibration constant depends on counts
in the thorium window from a 214gi peak located near the lower
window limit. A bias on the "a" stripping ratio produces large
errors on the thorium content measured in ores with a predo-
minant content of uranium.
The manufacturers of portable spectrometers have taken steps to
enable the users to recognize and counterbalance bad instrument
performance in the field due to variations in the overall system
gain from the cathode of the photomultiplier to the input of the
pulse-height selectors. In the Geometries GR-410 the gain can be
monitored by displaying an error signal on a moving coil meter
which also serves as a count-rate meter and a device for
checking the battery. The error signal is produced by a *33gadisc source attached to the bottom of the detector unit, in
front of the sodium-iodide crystal. ^3g a emits 0.356 MeV
photons which can be recorded and used for reference purposes
without generating counts in the high-energy windows, and with
only a small injection of pulses into a total-count window having
a lower energy limit of 0.5 MeV. Gain drift observed between
the field readings is neutralized by adjusting the system gain
manually until the error signal has been restored to zero.
Unrestored error signals corresponding to more than ±2% gain
drift are blocking the start of a new counting period. In the

- 21 -
GAD-6 spectrometer, manufactured by Scintrex, it is possible to
include the error signal in a feed-back loop that automatically
keeps the energy calibration of the equipment on a constant
value.
The achievement of reliable assay results is more or less im-
possible on rock whose content of uranium or thorium is large
enough to distort the shape of the scintillation spectrum.
Geologists involved in gamma-ray borehole logging are familiar
with the use of dead-time corrections which compensate for the
counting losses introduced at gross count rates of several
thousand counts per second. A dead-time correction applied to
spectrometer window counts is of doubtful relevance due to the
onset of spectral pile-up effects long before the dead time of
the counting registers has to be taken into consideration. For
example, a 76 * 76 mm detector placed on mineralization con-
taining 2000 ppm eU produces a count rate of about 700 counts/s
in the uranium window, while the full range of pulse amplitudes
represents a count rate of nearly 120,000 counts/s. This corres-
ponds to an average time interval of 8 us between the detector
pulses. Since the arrival times of the pulses are governed by
Poisson statistics, there is a big chance that a new pulse ar-
rives before the preceding one has died away (a process that
takes 9 us with the linear amplifier used in a GR-410). Pulses
destined for the uranium window may therefore get their effective
amplitudes increased and thus become lost or registered in the
thorium window. This pile-up effect gives rise to an increase in
the "a" stripping ratio. It sets in at a gross count rate of
about 20,000 counts/s and excludes accurate determinations of
small thorium contents in uranium ore containing more than a few
hundred ppm eU. There is a similar upper limit for the use of a
76 x 76 mm detector over thorium mineralization, and it can be
estimated that 1000 ppm eTh produces the same amount of pulse
pile-up as 400 ppm eU.
2.5. Background counts
Before the equations (2} are used for the calculation of assay
results, an estimated set of background count rates must be sub-

- 22 -
tracted from the recorded window signals, n-|, ni, and n3. Spec-
trometer background counts are generated by cosmic rays and in-
ternal detector radioactivity, especially 40K in the glass en-
velope of the photomultiplier, In the uranium window there may
be an additional and variable contribution from airborne 214Bi
produced by atmospheric 222Rn, the gaseous decay product in the238U decay chain. Table 6 shows five background determinations
performed over water with the GR-410 used in the present study
(chapter 6). The background readings were taken by accumulating
window counts during one hour or more. In the Helsinki Bay area
and on the lakes in Sweden and Colorado the instrument was oper-
ated on board light boats carrying very little natural radioacti-
vity. The background recorded on Roskilde Fjord is from a cruise
with a tourist steamer whose wooden materials may account for the
greater number of potassium counts observed in this particular
trial. The highest uranium and thorium background readings are
those from Highline Lake near Grand Junction in Colorado. The
high thorium reading probably reflects the increased cosmic-ray
intensity in an altitude of 1433 m. In the uranium window the
background measured in Colorado is enhanced by a factor of two,
a likely effect of the concentration of 2 2 2R n in continental air
masses (Larson and Bressan, 1980).
A peculiar rise in the background in the uranium window may
occur due to 214Bi deposited on the ground by rainfall. Figure
10 shows uranium and thorium counts recorded on two consecutive
days in a GR-410 monitoring trial on the low-radioactivity "B"
pad of the calibration facility at Mala, Sweden (Appendix). On
the second day it began to rein after a long period of dry
weather. In the course of a few hours after the onset of the
rainfail the count rate in the uranium window rised to over 250%
of the value recorded on the preceding day. When the counting
was resumed in the afternoon, after the rain had ceased, the
uranium count rate had returned to the value recorded the day
before. This is an example of the washout and subsequent decay
of airborne radon daughters (Hinato, 1980). The reason for the
short duration of the phenomenon is the short half-lives of 214Bi
and its immediate precursor, 214Pb (26.8 m and 19.8 m respect-
ively). Since the temporary increase in the uranium background
- 23 -
may pass unnoticed, it is not advisable to begin field assays at
the upcoming of new rain.
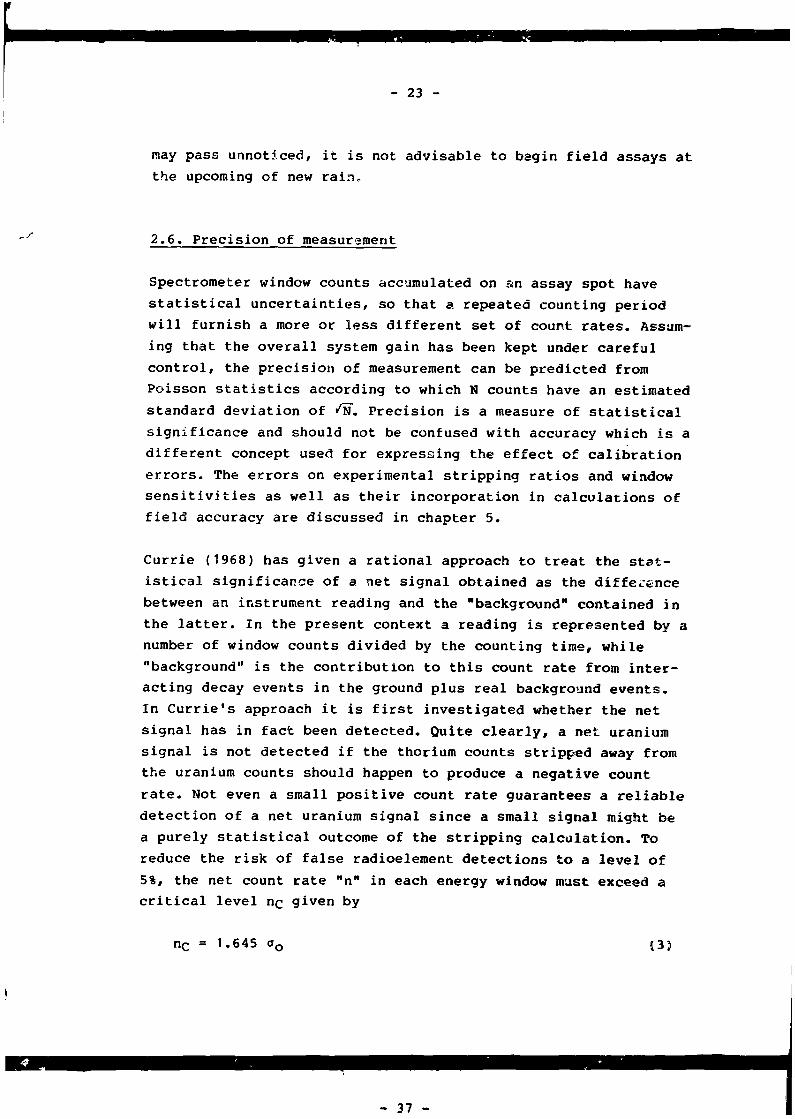
2.6. Precision of measurement
Spectrometer window counts accumulated on an assay spot have
statistical uncertainties, so that a repeated counting period
will furnish a more or less different set of count rates. Assum-
ing that the overall system gain has been kept under careful
control, the precision of measurement can be predicted from
Poisson statistics according to which N counts have an estimated
standard deviation of SH. Precision is a measure of statistical
significance and should not be confused with accuracy which is a
different concept used for expressing the effect of calibration
errors. The errors on experimental stripping ratios and window
sensitivities as well as their incorporation in calculations of
field accuracy are discussed in chapter 5.
Currie (1968) has given a rational approach to treat the stat-
istical significance of a net signal obtained as the difference
between an instrument reading and the "background" contained in
the latter. In the present context a reading is represented by a
number of window counts divided by the counting time, while
"background" is the contribution to this count rate from inter-
acting decay events in the ground plus real background events.
In Currie's approach it is first investigated whether the net
signal has in fact been detected. Quite clearly, a net uranium
signal is not detected if the thorium counts stripped away from
the uranium counts should happen to produce a negative count
rate. Not even a small positive count rate guarantees a reliable
detection of a net uranium signal since a small signal might be
a purely statistical outcome of the stripping calculation. To
reduce the risk of false radioelement detections to a level of
5%, the net count rate "n" in each energy window must exceed a
critical level nc given by
= 1.645 (3)

- 24 -
where ° o is the standard deviation of n when n is zero. One
point in Currie's suggestion for the reporting of assav- results
is the use of an upper limit for the content of an undetected
substance. Such an upper limit may be estimated from the ob-
served net signal by increasing the signal with two times its
calculated standard deviation.
The statistics of net signals recorded with a portable spectro-
meter is evaluated by first rewriting the stripping equations
[2) on the complete form
n3,Th =1-aoL
n2,u =1-aa
14)
n1,K = - Yn2,u " bl
where (bj,b2*b3) and their standard deviations (a^j ,0^2,
are supposed to have been estimated from background measurements
over water or other non-radioactive material. The expressions
for n3/Th and n2,u are direct functions of recorded counts, and
it is quite easy to write down the associated standard devi-
ations, in doing so, one uses the fact that a count rate n re-
corded by counting in t seconds has an estimated variance of
°n = n/t . fS)
Furthermore, for a linear combination of statistically inde-
pendent terms.
z = g • x + h * y . 165
a resulting variance is calculated as
= g2
- 25 -
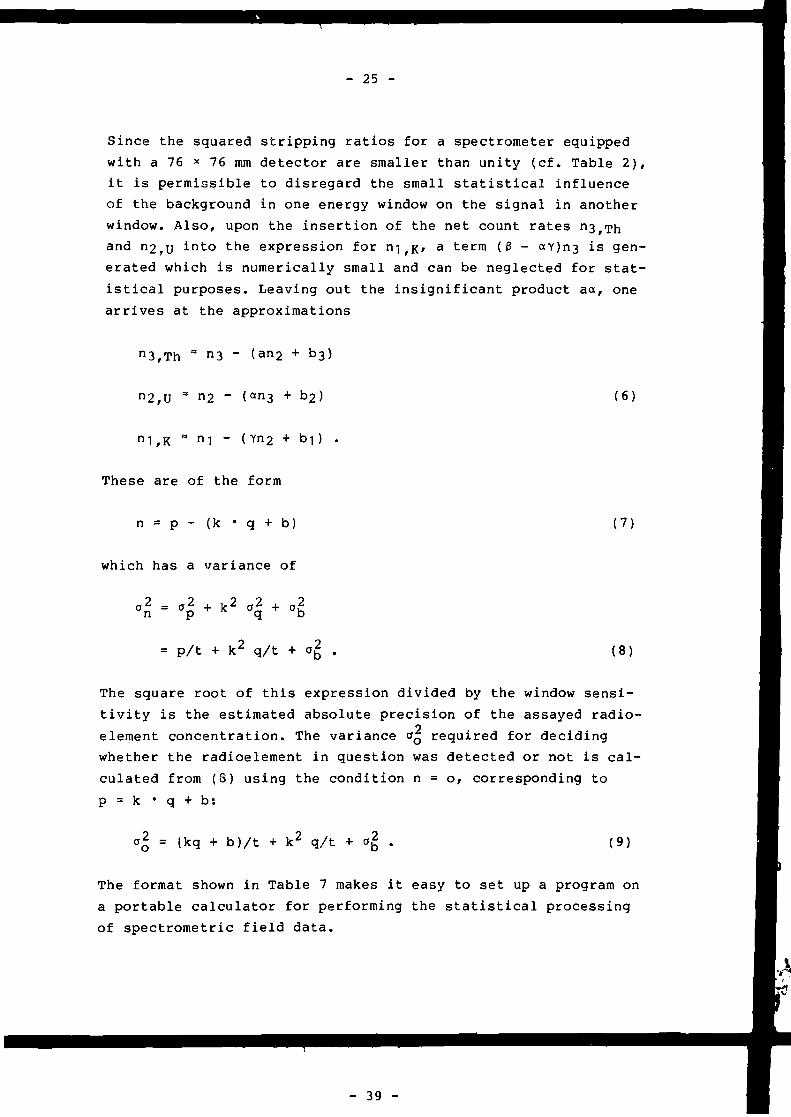
Since the squared stripping ratios for a spectrometer equipped
with a 76 x 76 mm detector are smaller than unity (cf. Table 2),
it is permissible to disregard the small statistical influence
of the background in one energy window on the signal in another
window. Also, upon the insertion of the net count rates n3fTn
and n2,u into the expression for n^K, a term (3 - ctY)n3 is gen-
erated which is numerically small and can be neglected for stat-
istical purposes. Leaving out the insignificant product aa, one
arrives at the approximations
"3,Th - (an2 + b3)
n2,U * n2 " b2) (6)
n1,K ra n1 "
These are of the form
n = p - (k • q + b) (7)
which has a variance of
.* - .* + ,2 „2 + „2
= p/t + k^ q/t + (8)
The square root of this expression divided by the window sensi-
tivity is the estimated absolute precision of the assayed radio-
element concentration. The variance o£ required for deciding
whether the radioelement in question was detected or not is cal-
culated from (S) using the condition n = o, corresponding to
p = k • q + b:
= (kq + b)/t ^2 q/t + °2 (9)
The format shown in Table 7 makes it easy to set up a program on
a portable calculator for performing the statistical processing
of spectrometric field data.

- 26 -
Critical levels and precision calculated from recorded counts
are a posteriori estimates going with an actual field assay. It
has also interest to determine with what precision a radioele-
ment can be assayed, given the counting time and the concentra-
tions of the two other radioelements. For this a priori problem
it is convenient first to introduce a detection limit, again
based on a critical level which ensures that less than 5% of
the insignificant signals are accepted. Since a fraction of the
signals with a mean value equal to the detection limit may not
exceed the critical level, it is relevant to build in the ad-
ditional protection that less than 5% of the significant sig-
nals are rejected. Currie showed that with this double choice
of a 5% risk level, a net count rate n with an associated
standard deviation of aQ for n = 0 has an a priori detection
limit of
nD = 2.71/t + 3.29 o( (10)
where t as before is the counting time. To get ao and hence
nD for a spectrometer window, one replaces the product k • q
in (7) with the known count rate "r" produced by the two other
radioelements. In analogy with formula (S) one obtains
p/t + r/t + (11)
and consequently
(2r + b)/t (12)
Another a priori quantity useful in the planning of field
measurements is the determination limit for a radioelement, i.e.
the least concentration that can be determined with a prescribed
precision. In terms of net signal, Currie derived the following
formula for the determination limit DQ when a precision of 10%
is wanted:
= 50 <7 + V h + 2T } • (13)
_ An _
- 27 -
In Table 8 no and nQ are written explicitely as functions of the
interfering contributions and background in spectrometer energy
windows. To express a detection or determination limit in radio-
element concentration units, one has to divide the calculated
signal by the proper window sensitivity.
Determination limits for the GR-410 spectrometer used in the pre-
sent study can be read from the curves in Figs. 11 to 13. These
data are based on experimental calibration constants determined
for the unit (chapter 6), and they incorporate the likely back-
ground count rates stated at the bottom of Table 6. The curves
illustrate the advantages offered by increasing the counting time
from 1 to 20 minutes, the probable maximum time one would be
willing to spend on a single assay.
Consider for example Fig. 11, thorium. For accompanying uranium
concentrations of less than about 10 ppm eU it is possible to
make a 10% precise assay of 15 ppm eTh in 1 min, while a similar
precision on 2.5 ppm eTh would require a counting time of 20 min.
Most of the statistical uncertainty is here contributed by counts
supplied by thorium and background in the thorium window. On
ground containing tens or hundreds of ppm eU there is an addi-
tional statistical influence from uranium counts delivered into
the thorium window through the "a" stripping ratio. It can be
seen that a 10% precise assay of 5 ppm eTh in 150 ppm eU cannot
be made in less than 20 minutes. Figure 12 shows that the deter-
mination of 5 ppm eU in 150 ppm eTh would also require 20 min of
counting time.
The potassium determination limits in Fig. 13 are plotted against
the sum contents of uranium and thorium in the ground assuming a
typical abundance ratio of Th/U = 3. If one requires a 10% pre-
cision in the measurement of 0.5% K, the counting time cannot be
smaller than 2 min in any case, and there must be less than 120
ppm (eU + eTh) in the ground even when the counting is extended
to 20 min. It should be stressed that these statements apply to
a particular instrument whose background readings are as sug-
gested by the experimental data in Table 6. The conclusions ob-
tained for other portable spectrometers might be slightly dif-
- 28 -
ferent, but would still dictate counting times of around 20 mi-
nutes for measuring a content of, say, 5 ppm eTh in 150 ppm eU
with a precision of 10%.
2.7. Airborne gamma-ray surveys
The obvious step of mounting a window spectrometer on a flying
survey platform was effectuated in the 1960s by several re-
search groups and geophysical companies. Experiments done by
a group at Rice University in Houston demonstrated that airborne
measurement of the radioelement concentrations in the ground is
possible with a moderately sized sodium-iodide detector (292 *
102 mm) flown at low speed close to the terrain surface
(Schwarzer and Adams, 1973). The advantages offered by a compact
survey system that can be installed in a light helicopter such
as the Bell Jet Ranger have been confirmed from uranium recon-
naissance carried out by Riso over the past several years in
mountaineous areas in Greenland and Turkey. These operations are
normally performed with 7,400 cm-* of sodium-iodide scintillator
using a nominal terrain clearance of 50 meters. A portable GAD-6
spectrometer interfaced to a microprocessor and a digital car-
tridge tape-unit makes up the system for getting a continuous
recording of window counts along the survey tracks. Figures 14
and 15 show the equipment.
In 1968 the Geological Survey of Canada (GSC) introduced a high-
sensitivity survey system based on the use of about 50,000 cm^
of sodium iodide (Darnley et al., 1969). This is the approximate
detector volume needed for efficient spectrometric mapping of
large and relatively flat areas that favour the choice of a
fixed-wing survey aircraft operated in a height of about 125 m
with a speed of 50 to 60 m/s. The GSC survey system is flown in
a Skyvan aircraft and has been used for the production of radio-
metric profiles and maps for more than a decade (see, for ex-
ample, Darnley and Grasty (1971)). Like most other similar equip-
ment developed over the years, the GSC spectrometer has been
upgraded into a 256-channel recording system used in conjunction
with an array of square-prismatic sodium-iodide detectors that
- 42 -
- 29 -
can be closely packed and require only one photomultiplier per
detector (Bristow, 1983). The two adjacent containers in Fig. 16
provide thermal and electrical shielding for twelve prismatic
detectors, each having a cross-section of 102 * 102 mm and a
length of 406 mm. Figure 17 shows the associated data acquisition
panel which incorporates a NOVA minicomputer for the recording
and analysis of 256-channel spectra. The availability of detailed
spectral information point by point along a flight line makes it
possible to monitor the position of the 40« full-energy peak at
1.46 MeV for keeping the spectrometer energy-calibrated at all
times. Another aspect of accumulating counts with a multichannel
spectrometer is the use of a coherent and wider spectral region
than that selected by three separate energy windows. The improved
measuring performance obtainable with fitting techniques and
other spectrum processing methods with built-in redundancy were
described by Linden and Akerblom (1977) and Grasty (1982).
Insight into the generation of normal spectrometer window counts
at aerial survey altitudes can be gathered by first considering
the atmospheric perturbation of the gamma-ray flux from the
ground. Figures 18 to 20 are theoretical flux energy spectra
calculated with the photon transport codes of Kirkegaard and
L0vborg (1979) for a survey height of 125 m. Corresponding tabu-
lated flux data based on energy steps of 0.05 MeV and covering
the height interval from 0 to 200 m in steps of 25 m were pre-
sented by Levborg and Kirkegaard (1975). A comparison of Figures
18 to 20 with the corresponding flux spectra at ground level
(Figs. 2 to 4) shows that the discrete flux components detected
in normally set energy windows (1, 2 and 3) are attenuated more
than twice by 125 m of air. This attenuation reduces the window
sensitivities by a similar factor. Another characteristic fea-
ture of the spectra at 125 m is an increased ratio between con-
tinuous (scattered) and discrete flux components. The relatively
greater amount of scattered thorium radiation detected in the
uranium window (window 2) corresponds to an increase in the
stripping ratio a with increasing survey heights. Grasty (1975a)
estimated the magnitude of this effect and showed that uranium
determinations made by airborne gamma-ray spectrometry can be
significantly in error if not the height dependence of a is taken

- 30 -
into consideration. Lovborg et al. (1976) derived the influence
of the survey height on the two other primary stripping ratios,
8 and Y. Linear working expressions for the stripping-ratio in-
crements per meter of standard air were presented by IAEA (1979),
Predictions of window sensitivities for airborne spectrometers
are hampered by the extensive Monte Carlo calculations required
for setting up a response-function model as detailed as that
used to describe the terrestrial spectra produced by a 76 * 76
mm detector in a portable spectrometer (subsection 2.2). Lovborg
et al. (1976) suggested the use of simplified spectrum calcula-
tions in which only the full-energy peaks (and the annihilation
escape peak from 2.61 MeV photons) are evaluated by means of
Monte Carlo techniques. The Compton continuum associated with
each peak is established by neglecting the modest amount of cur-
vature in the continuum generated by a large scintillator. This
method provided theoretical window sensitivities (and stripping
ratios) for 102 mm thick, cylindrical sodium-iodide crystals at
ground level and in survey iltitudes of 50 and 125 m (Lovborg et
al., 1978). The estimated K, U, and Th sensitivities are plotted
in Figures 21 to 23 from which it may be concluded that a window
sensitivity increases in a proportional manner with the detector
volume. A subsequent plot of the window sensitivities against
the reference heights of 0, 50, and 125 m furnishes an exponen-
tial height attenuation factor for each energy window. The ap-
proximate exponential height dependence of window count rates
recorded over an infinite ground were observed experimentally
by Darnley et al. (1969). It is therefore possible to predict a
spectrometer window sensitivity from an expression of the form
S = s exp(- Uh) (14)
where v is the detector volume and h the survey height, while s
and u are suggested numerical constants.
Table 9 shows the theoretical values of s and u for 102 mm thick
detector crystals. It should be noted that u is specified for
standard air of the density 0.001293 g/cm3, and that another air
- 31 -
condition can be accommodated from the proportionality between
density and attenuation coefficient. The v values reported re-
present a best fit of the decreasing window sensitivities from 0
to 125 m; the coefficients required to remove the effect of minor
departures from the nominal survey altitude are smaller (Grasty,
1976; Lovborg et al., 1978). Factors that influence the overall
drop-off of the thorium count rate with increasing distances to
the ground were discussed by Grasty (1975b).
The application of formula (14) co the 50,000 cm3 of sodium-iod-
ide volume contained in the GSC spectrometer system is illus-
trated in Table 10 which also shows the corresponding experimen-
tal window sensitivities recorded with the system over the
Breckenridge test strip near Ottawa. For both the cylindrical
and prismatic detectors, the calculated and experimental data
are in agreement to within ± 20% or better. Formula (14), used
in conjunction with the numerical values in Table 9, is accord-
ingly usable for rough estimation of spectrometer sensitivities.
A calculation based on the parameters for Rise's helicopter
spectrometer (v = 7,400 cm3, h = 50 m) shows that this system is
three to four times less sensitive than the GSC survey system.
However, while the Canadian Skyvan aircraft is flown at a speed
of typically 60 m/s, the survey speed used by Riso is only about
30 m/s. In terms of counts per unit distance, a relatively modest
helicopter spectrometer flown slowly in low altitude may produce
survey data of a quality comparable to that obtainable with a
fast high-sensitivity system.
3. BASIC CALIBRATION PROBLEMS
3.1. General considerations
The early applications of field gamma-ray spectrometry were
based on calibration trials over ground whose radioelement con-
centrations were known from- sampling or drilling with subsequent

- 32 -
laboratory determinations. Killeen and Carmichael (1970) were
successful in getting the calibration constants of a portable
spectrometer from a statistical analysis of field and laboratory
data for more than one hundred experimental sites in the Blind
River uranium region of Ontario. A similar attempt by Levborg
et al. (1969) to determine uranium and thorium calibration fac-
tors from a series of calibration measurements on the Kvanefjeld
U-Th deposit, South Greenland, did not produce a reliable
uranium calibration because the deposit has a predominant abun-
dance of thorium (Nielsen, 1981). In general a system of natural
calibration stations must possess a diversity of radioelement
concentrations to permit a sound statistical evaluation of the
four stripping ratios and three window sensitivities.
The first artifical spectrometer calibration facility was estab-
lished by the Geological Survey of Canada in 1968 (Grasty and
Darnley, 1971). It is situated at Uplands airport, Ottawa, and
consists of five slabs or pads of concrete which are 7.6 * 7.6
m across and 46 cm thick. These sources have known and evenly
distributed radioelement concentrations and make up a system
of five calibration platforms which are replacing a much larger
system of natural calibration sites. The dimensions and radio-
metric grades of the pads at Uplands airport accomodate cali-
bration trials with high-sensitivity equipment such as that
contained in the GSC Skyvan aircraft. Over the past decade
similar facilities have become available at airports in five
other western countries (Appendix). Figure 24 shows two survey
aircraft in calibration positions on pads installed by Swedish
Geological at Borlänge airport, central Sweden. Calibration
pads for portable spectrometers do not require similar large
dimensions since the desired counting geometry of nearly 2ir
can be obtained by placing the detector units in contact with
the pads. Pads facilities for portable spectrometers have become
available in eight countries on five continents. Figure 25 shows
the GR-410 spectrometer of the present study on a removable pad
which is 1 m in diameter and 50 cm thick and belongs to a fa-
cility established at Villa 25 de Mayo in the Mendoza province,
Argentina.
- 33 -
Calibration sources prepared from radioactively loaded concrete
mixes simulate a rock medium and imitates the gamma-ray trans-
port in such a medium. The use of concrete as a source material
is justified by the low cost of the mix ingredients and the
large amount of expertise available on mix design and manufac-
turing processes. Concrete is a composite material that has
many properties in common with sandstones. It consists of ag-
gregate particles held together by hardened cement paste. In a
calibration pad a smaller or larger fraction of the concrete ag-
gregate is substituted by material of increased natural radio-
activity, for example pitchblende (U), monazite or thorite (Th),
and potassium feldspar (K). The greatest problems in establishing
a calibration facility are associated with the procurement of
suitable radioactive admixtures and with the assignment of re-
liable reference concentrations to the pads.
A calibration pad which is at least one meter in diameter
generates spatially uniform radiation in a region around the
surface centre, so that the exact positioning of the equipment
is rather unimportant. Wormald and Clayton (1976) argued that
the fixed planar and semi-infinite calibration geometry may be
a poor representation of the geological reality and suggested
a calibration system based on a granular fluid bed. Such a
system might consist of a large sand box in which a point source
can be placed in various positions for determining the effect
of distance and depth on window counts recorded above the sand
surface. By applying the resultant data to models of the field
geometry, it is possible to derive the optimum calibration fac-
tors for use on narrow veins and other small exploration targets.
Attenuation introduced by thin overburden (up to 20 cm) or curved
terrain may also be taken into consideration. This "variable pad"
concept deserves attention as a means of simulating non-uniform
field geometries, but it would hardly be useful for routine cali-
brations which generally require a minimum of effort. Field
measurements on heterogeneous ground material may be executed
with a lead-collimated detector which improves the assay re-
liability and eliminates the need of specially adapted cali-
bration sources (Adams and Fryer, 1964; Lovborg et al.f 1971).

- 34 -
While a portable spectrometer placed on a concrete pad is an
easily comprehensive imitation of counting with the instrument
on the outcrop, it is not so obvious that experiments with air-
craft parked on pads can provide the calibration constants needed
in an airborne gamma-ray survey. Calibration trials like those in
Pig. 25 furnish the stripping ratios and window sensitivities at
ground level for the survey systems; these calibration data in-
clude the slight gamma-ray attenuation exerted by the aircraft
materials. In chapter 2 it was mentioned that linear expressions
are available for estimating the increments shown by the strip-
ping ratios with increasing survey heights. Since these in-
crements are quite small (about 1% per 10 m), it is not a problem
to get the stripping ratios at an aerial survey altitude from
surface measurements on pads. A window sensitivity, on the other
hand, decreases more or less exponentially with increasing dis-
stances to the ground, and even a small error on the estimated
height attenuation coefficient (v in formula (14)} might jeopard-
ize the reliability of an exponential correction applied to a
window sensitivity measured on pads. In spite of the consider-
able number of airport calibration facilities installed over the
years, the majority of survey organizations actually abstain
from using their pads for the estimation of in-flight sensitivity
factors. Instead it has become the practice to get these cali-
bration constants from the stripped window count rates recorded
in flights over selected test ranges.
A test range may be represented by a strip of ground, between
2 and 10 km long, whose radioelement concentrations have been
determined by intense sampling or from grid-assays with port-
able spectrometers. Test ranges are available in Canada CGrasty
and Charbonneau, 1974), Finland (Multala, 1981), Israel JAviv
and Vulkan, 1983), and the USA (Foote, 1978). Recent experiments
over the Canadian Breckenridge strip near Ottawa show that an
area covered by soil may produce seasonally varying window
count rates (Grasty, 1984). The Breckenridge strip is formed
by clay soil. In the spring, when the soil is still frozen, the
uranium count rate is high, because there is very little leakage
of 222Rn from the ground. Later in the season the radon seal
represented by soil moisture is weakened due to evaporation, so
- 35 -
that insufficient cadon becomes available Cor sustaining the
equilibrium content of 214Bi in the ground. As a result the
uranium count rate over the area shows an overall decrease of
about 30% between March and July. In the two other energy win-
dows, thorium and potassium, the reduced soil moisture has the
adverse effect of increasing the count rates by SO to 60% because
there are fewer water molecules to attenuate the gamma-ray flux.
Calibration conditions like these are far from ideal and serve
as a warning against an uncritical use of test ranges.
A likely method to determine the airborne window sensitivities
from calibration measurements with pads may evoke from a study
of Dickson et al. (1981) who placed a package of four prismatic
sodium-iodide detectors on plywood sheets and recorded the
spectra from the airport pads in Grand Junction, Colorado !Appen-
dix). By varying the number of sheets and converting the total
plywood thicknesses into equivalent columns of air, it was pos-
sible to simulate aerial survey heights of up to 112 m. The pur-
pose of this experiment was to perform a mathematical analysis of
the spectral shape as a function of the detector-source distance
in air. Similar measurements with standard geophysical detector
packages might be effectuated routinely for calibration purposes.
Such a technique would involve a summation of the window sensi-
tivities recorded for the individual detector packages of a high-
sensitivity spectrometer system. It would also be necessary to
measure the attenuation from installing the equipment behind an
aircraft structure.
Rise's helicopter spectrometer (Figs. 14 and 15) is calibrated
at intervals by placing the detector units successively on cali-
bration pads that are only 3 m in diameter. Figure 26 shows such
a calibration trial, executed directly on the pad surface without
inserted sheets of plywood to simulate the gamma-ray absorption
in the air. The window sensitivities determined in this way are
adapted to a nominal survey height of 50 m by means of exponen-
tial correction factors similar to those calculated with formula
(14) and stated in Table 23 of the IAEA report "Gamma-Ray Surveys
in Uranium Exploration" (IAEA, 1979). This simplified calibration
technique was tested from a flight along a 1.5 km long survey
- 36 -
line traversing exposed mineralization on the plateau formed by
the Kvanefjeld U-Th deposit, South Greenland. The area had pre-
viously been surveyed in detail with portable spectrometers
(L0vborg et al., 1980), and the resulting uranium contour map was
used for estimating the U surface concentrations along the air-
borne track. Five fiducial markers from the test flight made it
possible to obtain ground and airborne estimates of the average
0 concentrations in four sectors of the flight line. These esti-
mates are plotted against each other in Fig. 27. The regression
line for the data suggests that the uranium calibration of the
helicopter spectrometer (as expressed by the stripping ratio a
and the window sensitivity sg) is giving reasonable field re-
sults. Airborne uranium measurements based on direct pad cali-
brations and a subsequent theoretical height correction may ap-
parently be less than about 15% in error.
3.2. Counting and calibration geometries
The tens of meters of detector elevation in an airborne gamma-ray
survey make the window count rates insensitive to a surface re-
lief of several meters and justify instrument calibrations in
planar geometry. In field work with a portable spectrometer the
detector unit is placed on the terrain surface, and there is no
other elevation than that represented by the distance from the
assay spot to the centre of the sodium-iodide crystal. For the
76 * 76 mm detector used with GR-410 spectrometers this distance
amounts to 70 mm. An elevation this small is of the same magni-
tude as the relief of even a rather smooth and plane natural rock
face. Many of the outcrops assayed in a typical grid survey would
probably have reliefs of several hundred millimeters.
To justify the calibration of portable spectrometers on smooth
and plane concrete pads, consider Fig. 28 in which P is a detec-
tor point above a homogeneous and uniformly radioactive rock me-
dium that crops out between Pj and P2. An arbitrarily oriented
spherical co-ordinate system (r, ©,<)>) is used to describe the en-
velope of the medium and the transport of gamma rays from an
emitter point to P. Useful information which can be expressed in
- 37 -
simple mathematical form is obtained from the introduction of
three additional model assumptions: 1) The envelope of the rock
medium is of the functional form r = r(9,4>), i.e. no line drawn
from P can intersect the rock surface more than once; 2) the
overburden is a 100% effective gamma-ray absorber; and 3) there
is no absorption of gamma rays in the air between P and the out-
crop.
It is relevant to start the mathematical treatment by introducing
the small solid angle dö = sinö d8 d<J> defined by small displace-
ments do and d4> from a fixed spatial direction (®,4>). To get the
flux of photons at P from a small rock volume dV = R2 d^dR with
co-ordinates (R, 9,4»), one has to place a unit area normally to
(9,4>) in P. Since the photons from dV are evenly distributed on
all directions, the fraction directed against such a unit area
equals 1/4TTR2. Some of the photons in the beam from dV to P are
scattered or absorbed along the travelling length R-r in the rock
medium. The corresponding attenuation factor is given by
exp[-n(R-r)] where M is the total linear attenuation coefficient
of the medium for gamma-rays of the energy considered. This quan-
tity should not be confused with the w in formula (14) which is
an empirical height attenuation coefficient for use in airborne
gamma-ray surveys. Assuming that each cm3 of the rock medium
emits just one gamma photon per second, the desired flux contri-
bution becomes
1/ exp[-M(R-r)]dV
77/ exp[-u(R-r)]dR (15)
This result shows that d$/dQ is constant and independent of r,
i.e. the angular flux density is the same in all directions from
P towards the exposed rock surface, regardless of the relief
- 38 -
shown by the latter. The total photon flux in P is consequently
given by
. _ " (16)
where Q is the solid angle in which the outcrop is viewed from
P. A window sensitivity for this geometry would be identical to
the sensitivity recorded over a plane calibration source ir. a
solid angle of «.
As indicated in the preceding subsection, the reference geometry
adopted in the use of calibration pads is not only planar, but
also semi-infinite. When the envelope of the rock n>edium in Fig.
28 degenerates into an infinite surface without overburden, the
calculation of « takes the simple form
2*Q = J / sine = 2*
i.e.
2* (16)
The associated geometry factor.
(19)
is not particularly relevant in the field where it is difficult
to make a reliable estimate of «. Fg is however the figure needed
for expressing how closely a 2K measuring geometry is reproduced
in recording calibration counts on a pad. Many of the calibration
facilities established up to the present are based on pads which
are either circular or approximate circular sources. Lovborg et
al. (1972) presented an expression for calculating the geometry
factor centrally above a cylindrical source cylinder of arbitrary
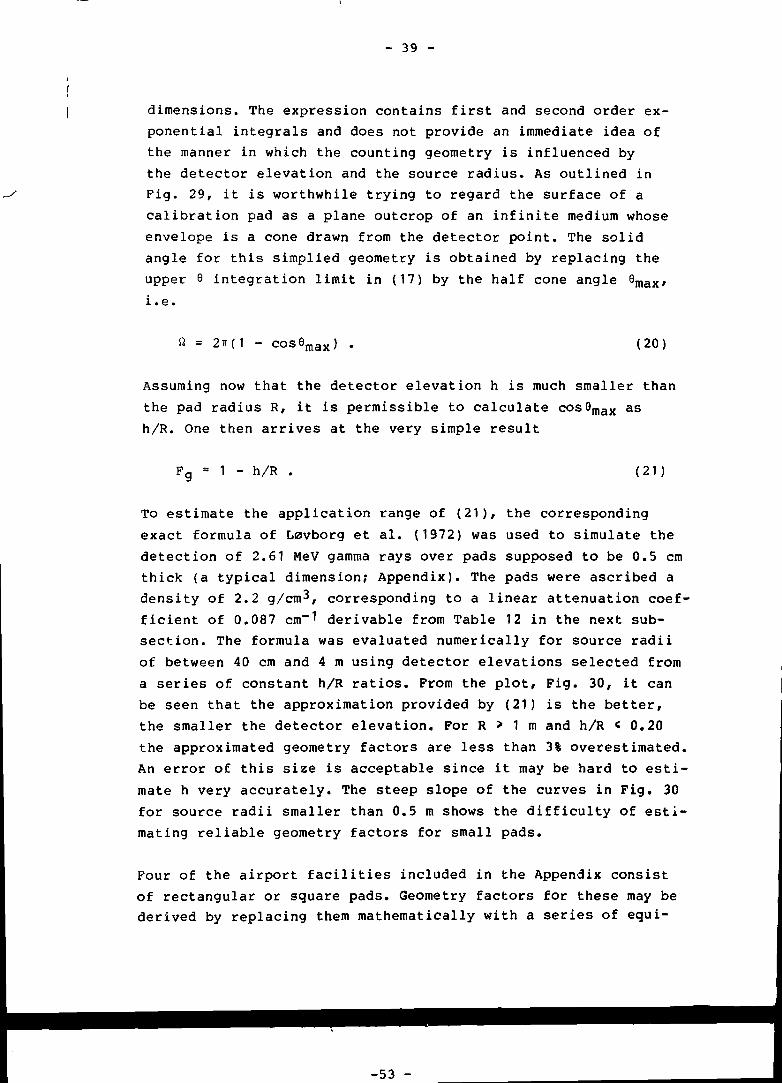
- 39 -
dimensions. The expression contains first and second order ex-
ponential integrals and does not provide an immediate idea of
the manner in which the counting geometry is influenced by
the detector elevation and the source radius. As outlined in
Fig. 29, it is worthwhile trying to regard the surface of a
calibration pad as a plane outcrop of an infinite medium whose
envelope is a cone drawn from the detector point. The solid
angle for this simplied geometry is obtained by replacing the
upper 9 integration limit in (17) by the half cone angle 8max,
i.e.
Q = 2ir(1 - cosemax) (20)
Assuming now that the detector elevation h is much smaller than
the pad radius R, it is permissible to calculate cos9max as
h/R. One then arrives at the very simple result
1 - h/R (21)
To estimate the application range of (21), the corresponding
exact formula of Lavborg et al. (1972) was used to simulate the
detection of 2.61 MeV gamma rays over pads supposed to be 0.5 cm
thick (a typical dimension; Appendix). The pads were ascribed a
density of 2.2 g/cm^, corresponding to a linear attenuation coef-
ficient of 0.087 cm~1 derivable from Table 12 in the next sub-
section. The formula was evaluated numerically for source radii
of between 40 cm and 4 m using detector elevations selected from
a series of constant h/R ratios. Prom the plot, Fig. 30, it can
be seen that the approximation provided by (21) is the better,
the smaller the detector elevation. For R > 1 m and h/R < 0.20
the approximated geometry factors are less than 3% overestimated.
An error of this size is acceptable since it may be hard to esti-
mate h very accurately. The steep slope of the curves in Fig. 30
for source radii smaller than 0.5 m shows the difficulty of esti-
mating reliable geometry factors for small pads.
Four of the airport facilities included in the Appendix consist
of rectangular or square pads. Geometry factors for these may be
derived by replacing them mathematically with a series of equi-
-53 -
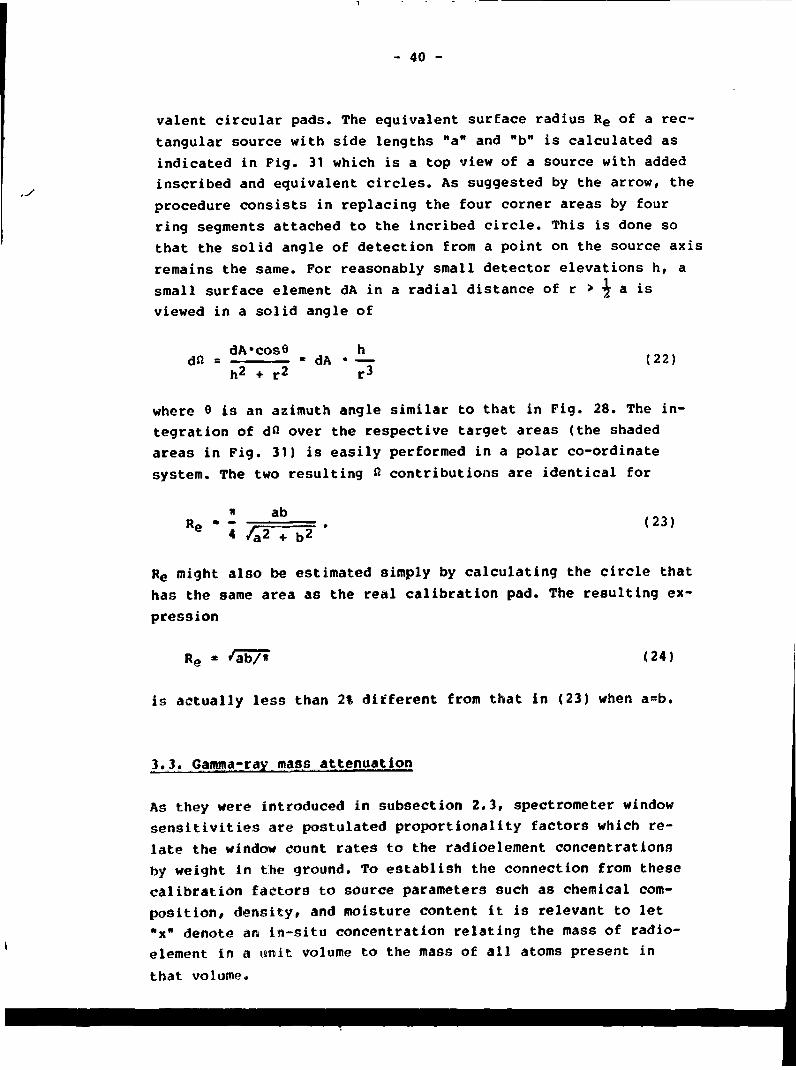
- 40 -
valent circular pads. The equivalent surface radius Re of a rec-
tangular source with side lengths "a" and "b" is calculated as
indicated in Fig. 31 which is a top view of a source with added
inscribed and equivalent circles. As suggested by the arrow, the
procedure consists in replacing the four corner areas by four
ring segments attached to the incribed circle. This is done so
that the solid angle of detection from a point on the source axis
remains the same. For reasonably small detector elevations hr a
small surface element dA in a radial distance of r > Jr a is
viewed in a solid angle of
dA*cos9
h2 + r2
hdA • —
3
(22)
where 0 is an azimuth angle similar to that in Fig. 28. The in-
tegration of d« over the respective target areas (the shaded
areas in Fig. 31) is easily performed in a polar co-ordinate
system. The two resulting n contributions are identical for
ir
4
ab (23)
Re might also be estimated simply by calculating the circle that
has the same area as the real calibration pad. The resulting ex-
pression
(24)
is actually less than 2% different from that in (23) when a=b.
3.3. Gamma-ray mags attenuation
As they were introduced in subsection 2.3, spectrometer window
sensitivities are postulated proportionality factors which re-
late the window count rates to the radioelement concentrations
by weight in the ground. To establish the connection from these
calibration factors to source parameters such as chemical com-
position, density* and moisture content it is relevant to let
"x" denote an in-situ concentration relating the mass of radio-
element in a unit volume to the mass of all atoms present in
that volume.

- 41 -
With this definition of x, the gamma-ray emission from a unitvolume becomes proportional to X*P where P is the bulk densityof the source medium. It then follows from (18) and (19) thatthe flux input to a spectrometer window can be represented bythe expression
CM/P
(25)
where C contains the geometry factor and the photon yield of the
radioelement. The physical and chemical properties of the source
is contained in the term U/P which is the mass attenuation coef-
ficient of the source material and is measured in units of cm2/g.
Gamma-ray attenuation is principally an overall effect of Compton
scattering, photoelectric effect, and pair production (tne last
process starting at a photon energy of 1.022 MeV). Table 11 shows
the contributions to U/P from these processes in SiO2 (quartz) at
photon energies of 1.46, 1.76, and 2.61 MeV. These data are from
a library of evaluated photon interaction cross-sections based on
a compilation by the Lawrence Livermore Laboratory and available
from the NEA Data Bank at Gif sur Yvette, France. A similar up-
to-date tabulation of total mass attenuation coefficients for 40
elements was published by Hubbell (1982). Table 11 shows that
Compton scattering (incoherent scattering) is the only really
important interaction process between 1.5 and 3 MeV in a chemical
constituent like SiO2 which is more than 40% abundant in most
earth materials. The same applies to the other standard oxides
used for expressing the concentrations of major elements in ana-
lysed sample material.
tn a Compton scattering event the incident gamma-ray photon in-
teracts with an orbital electron to which a fraction of the pho-
ton energy is imparted. The fundamental relations giving the
energy loss and change of direction for the photon are presented
and explained in, for example, a classical textbook of Evans
(1955). Assuming that the electrons of the scattering medium can
be regarded as unbound, and neglecting the small probabilities
of photoelectric effect and pair production, the linear attenu-
ation coefficient u becomes proportional to £ne, the total number
of electrons per unit volume ofc the medium. An element with
- 55 -

- 42 -
atomic number Z, atomic weight A, and mass abundance w contri-
butes
pWn s —— M » 7Q ^^^ "O (26)
electrons per cmJ where N 0 = 6.025 * 1 0 " atoms per mole is
Avogadro's number. Consequently, by introducing an energy-depen-
dent proportionality factor k one may write
P/P = k • I Wj — (27)
in which the summation is extended over all elements present in
the substance. If the latter is thought of as a rock medium or
the concrete of a calibration pad, it can be seen that the chemi-
cal effect associated with field gamma-ray spectrometry depends
on the average ratio Z/A for the elements contained in the
sources. Over the range of atomic numbers from Z = 2 to Z =30
the number of protons and neutrons in the nuclei is approximately
the same, corresponding to Z/A = 0.5 (Evans, 1955). This obser-
vation suggests that the elements from helium to zink have com-
parable mass attenuation coefficients at the energies for which
scattering is the predominant interaction mode. Hydrogen is the
only element whose nuclei do not contain neutrons, so that Z/A =
1. The hydrogen supplied to a source material in the form of
absorbed moisture generates surplus gamma-ray attenuation which
is specially dealt with in the following subsection.
Formula (27) has the advantage that it makes it possible to cal-
culate the thickness of one material tnat will produce the same
gamma-ray attenuation as a known thickness of another material.
For example, 1 cm of aluminium metal (P * 2.7 g/cm3, Z/A * 0.482)
is equivalent to 20.17 m of standard air (p * 0.001293 g/cm3,
Z/A s 0.499). Such a conversion can be used in airborne gamma-ray
surveys to incorporate the aircraft floor and detector container
as an equivalent additional survey height (Grasty, 1975b; Lavborg
and Kirkegaard, 1975).
Table 12 contains a set of mass attenuation coefficients derived
for standard chemical rock constituents by means of the Lawrence
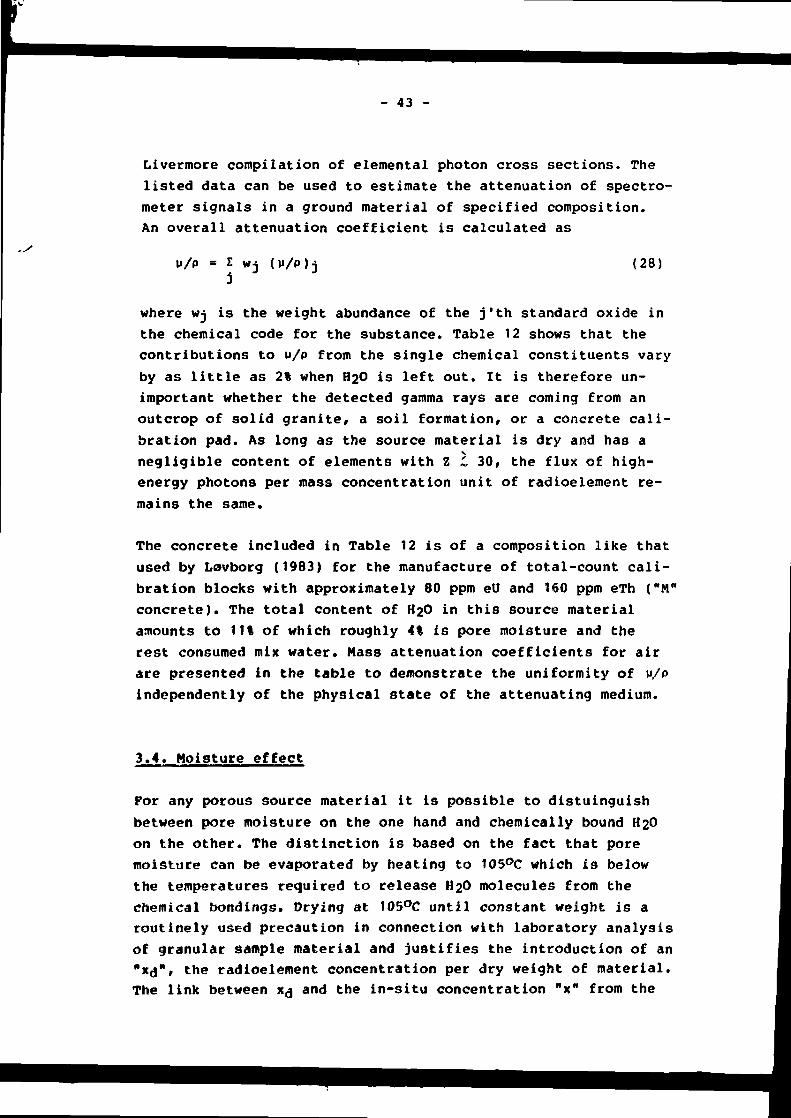
- 43 -
Livermore compilation of elemental photon cross sections. The
listed data can be used to estimate the attenuation of spectro-
meter signals in a ground material of specified composition.
An overall attenuation coefficient is calculated as
y/p = E Wj (p/P)j
j(28)
where WJ is the weight abundance of the j'th standard oxide in
the chemical code for the substance. Table 12 shows that the
contributions to U/P from the single chemical constituents vary
by as little as 2% when H2O is left out. It is therefore un-
important whether the detected gamma rays are coming from an
outcrop of solid granite, a soil formation, or a concrete cali-
bration pad. As long as the source material is dry and has a
negligible content of elements with Z 1 30, the flux of high-
energy photons per mass concentration unit of radioelement re-
mains the same.
The concrete included in Table 12 is of a composition like that
used by Lavborg (1983) for the manufacture of total-count cali-
bration blocks with approximately 80 ppm eU and 160 ppm eTh ("M"
concrete). The total content of H2O in this source material
amounts to lit of which roughly 4% is pore moisture and the
rest consumed mix water. Mass attenuation coefficients for air
are presented in the table to demonstrate the uniformity of M/P
independently of the physical state of the attenuating medium.
3.4. Moisture effect
For any porous source material it is possible to distuinguishbetween pore moisture on the one hand and chemically bound H2Oon the other. The distinction is based on the fact that poremoisture can be evaporated by heating to 1050C which is belowthe temperatures required to release M2O molecules from thechemical bondings. Drying at 1050C until constant weight is aroutinely used precaution in connection with laboratory analysisof granular sample material and justifies the introduction of an"X(j", the radioelement concentration per dry weight of material.The link between x<j and the in-situ concentration

- 44 -
preceding subsection is provided by the evaporable moisture con-
tent of the field target or calibration pad in question.
It is the most appropriate to describe an evaporable moisture
content "w" by dividing the weight of solid material contained
in a source volume into the weight of the pore moisture absorbed
in that volume. This definition of w corresponds to the relation
x = xd/(1 + w) (29)
To get the largest possible deviation between x and x^, one has
to estimate the maximum moisture absorption in the source. For a
coherent material like rock or concrete, w m a x is given by
where p is the porosity and Pj the average density of thesource constituents in g/cm3.
dry"
In a "wet" source the pore moisture has an abundance of w/(1+w).
While the ratio Z/A equals 0.555 for water, the solid source ma-
terial can be ascribed a Z/A of 0.50 (assuming a negligible ef-
fect of the chemically bound H2O). Formula (27) accordingly sug-
gests a resulting value of
0.50 + 0.555 w
1 + w
* 0.51 + 1.11 w
1 + w(31)
By combining (29) and (31) with (25) and (27) it can be seen that
the gamma-ray emission (flux) from a source containing pore
moisture is governed by an expression of the form
•i,d*d
1 4 1.11 W(32)
where
- 45 -
represents the emission from a dry source containing
one unit of radioelement concentration.
Formula (32) supplies the information for answering the question
whether the calibration of a field spectrometer should be based
on "wet" or "dry" reference concentrations. A calibration pad
whose radioelement concentration has been estimated from assays
of crushed and dried concrete (as described in chapter 5) might
simply be assigned a reference concentration of x^ followed by
an attempt to measure the concentration by dry weight, y^, in a
field target. The error Ay^ associated with such a procedure de-
pends on the moisture contents wx and Wy of calibration pad and
target material respectively. It is easily shown that the rela-
tive magnitude of this error is
1 + 1.11(33)
Alternatively, the in-situ concentration "x" of the calibration
pad might be evaluated and used as a reference value for
measuring the similar concentration "y" in the field target.
This "wet-to-wet" experimental approach has an associated re-
lative error of
(1 + 1.11 WX)(1 +Wy)
(1 + 1.11 wy)(1 + W x )- 1. (34)
In Fig. 32 the two error expressions are plotted for source
moisture contents of up to 30%. The calibration pad is assumed
to contain 5% pore moisture, so that a ground of this moisture
content is assayed without error for both "dry" and "wet" cali-
bration conditions. From the curve labelled "dry calibration" it
is seen that the direct use of radioelement concentration per dry
weight of material is inappropriate when there is an unknown dif-
ference of several percent between the moisture contents of field
target and calibration pad. In other words, a field gamma-ray
spectrometer cannot provide a set of normal analytical K-eU-eTh
concentrations for characterizing the radioactivity of an earth
material. Conversely, the use of in-situ, or "wet", radioelement
- 46 -
concentrations reduces the assay error to 2% even for a moisture
difference of 30% between the target material and the pad.
Experimental in-situ radioelement concentrations are of immediate
relevance in calculations of exposure rates from spectrometric
survey data (cf. the conversion factors in Table 4). Grasty et
al. (1984) were recently involved in estimating the ground-level
exposures in 33 areas of Canada that have been surveyed from the
air with the GSC high-sensitivity spectrometer system. This study
demonstrated the large seasonal soil moisture variations which
occur in a climate like that in Canada. For example, the soil
forming the Breckenridge test strip of the GSC has an average
moisture content of typically 27% in the summer, while about 40%
moisture is representative for samples collected in the autumn.
These and other observations of soil moisture suggest that it may
be advisable to combine the use of a portable spectrometer in
soil-covered areas with the collection of material for moisture
assay. Once the moisture has been estimated, the recorded in-situ
concentrations may be converted into normal concentrations by dry
weight of soil for use in geochemical interpretations.
3.5. Radioelement depth variations
For field targets in general one must expect at least some vari-
ation of the radioelement content down through the upper ~ 35 cm
of the ground material. The extreme case is presented by a layer
of overburden whose natural radioactivity is negligible compared
to the radioactivity of the underlying mineralization. Such a
layer attenuates the window count rates in the same way as do the
air masses involved in airborne gamma-ray surveys. For example,
10 cm of soil with a bulk density of 1.6 g/cm^ can be represented
by ~ 125 m of standard air which in turn reduces the count rate
in the thorium window by approximately a factor of 3. A cover of
water or snow produces a similar effect. Given the water or snow
thickness, the equivalent air column in g/cm^ is 11% greater
than the H2O surface density in g/cm . In subsection 2.7 it was
mentioned that increasing aerial survey altitudes cause a spec-
tral shift in which the continuous part of the flux energy spec-
trum is increased relative to the discrete flux components. Con-
- 47 -
sequently, it is theoretically possible to estimate an overburden
effect by forming the ratio between two data regions selecting
different proportions of scattered and direct radiation. Dickson
et al. (1979) showed experimentally that go~d contrast of measure-
ment can be obtained by combining a total-count threshold of 0.18
MeV with an energy window from 0.66 to 1.01 MeV. Field use of a
76 x 76 mm detector should make it possible to assess up to 60
g/cm2 of overburden on uranium mineralization with a grade of
0.25% U3O8. Thus, a five-channel portable spectrometer, or even
better: a multichannel spectrum-recording device like the
Czechoslovak GS-256, seem to have potential for extending the ap-
plication of in-situ radioelement assays. Calibration pads used
in conjunction with a plywood cover would provide the factors
required to overcome the effect of shallow overburden.
A more difficult problem occurs when a natural gamma-ray emitter
becomes progressively depleted with decreasing distances in the
source material to the air-ground interface. Negative concentration
gradients in the direction of the interface are exhibited by
214gj deposited by diffusing 222Rn (radon) in dry soil. The re-
sulting diminuation of the photon flux at 1.76 MeV can be esti-
mated computationally from the emanation power P and the effec-
tive diffusion coefficient D* describing, respectively, the
amount and mobility of the radon in the voids between the soil
particles. It can be shown that the sum content of bound and mo-
bile radon has an exponential depth distribution given by
q(z) = q - P exp(- z (35)
where z is the vertical depth, q« the radon concentration at
infinite depth, and A = 2.10 * 10~6 s~1 the decay constant of
222R 0 # since formula (35) also governs the vertical distribution
of the 214gi emitters in the ground, the resulting gamma-ray flux
at the surface can be obtained by placing a usual spherical co-
ordinate system in a detector point above a plane soil medium of
exponentially increasing radioactivity. By normalizing the result
to the result for a source with uniformly distributed 214gj (for-
mula (18)), it is possible to derive the relative flux dimin-
uation over soil containing diffusing radon. The expression for
the radiation loss turns out to be

- 48 -
— = p • M/D*/* • ln(1 + - 'VD*). «36)
Since the 214Bi radiation is detected by window counting at 1.76
NeV, the v in (36) would be taken as the product of the soil den-
sity and an estimated mass attenuation coefficient of 0.048 cm2/i
(Table 12).
The first observation made from (36) is a proportional relation
between the radiation loss and the emanation power P which is
the ratio between escape and production of radon for the soil
particles. According to Barretto et al. (1972), calcareous soils
and alluvium are particularly strong emanators yielding P values
of 20 to almost 60%. Clay soil emanates between 20 and 35%,
while sandy soil comes at the bottom with P in the range from 10
to 20%. These differences in emanation power are related to the
residence mode of the 226R 3 which is the immediate source of222Rn production. The stronger emanation of clay soil relative
to sandy soil can be explained by the large emanating surface
formed by clay particles with a radium coating orginating from
adsorbed uranium.
To illustrate the significance of the effective diffusion coef-
ficient D*, consider Fig. 33 in which the curve for P = 1.4 g/cm3
is supposed to represent dry soil of 100% emanation power.
Schroeder et al. (1965) measured D* = 0.036 cm^/s in dry and
sandy alluvium; a value amounting to as much as 0.10 cm2/s was
recorded for very dry and powdery soil without any appreciable
cover. Diffusion coefficients greater than about 0.01 cm2/s are
typical of granular materials with little or no moisture in the
porespaces (Tanner, 1964). Figure 33 shows that the associated
loss of gamma radiation at the surface exceeds 0.9 P and con-
sequently may run as high as ~ 55% over certain soil formations.
Concrete, on the other hand, is a compact material offering a
considerable resistance to the migration of radon in the pore
spaces. Culot et al. (1976) found a relaxation distance of around
10 cm for radon diffusing across a concrete wall, corresponding
to a diffusion coefficient of about 2 * 10~5 cm2/s. This value
used in conjunction with the curve for P = 2.2 g/cm3 in Fig. 33

- 49 -
suggests a radiation loss of 0.45 P on the surface of a cali-
bration pad loaded with uranium ore of P% emanation power. Since
the similar figure for uranium ore intermixed with unconsolidated
sand would be approximately 0.9 P, there is a net advantage of
embedding the particles in a cement paste for reducing the radon
diffusion speed.
Absorbed moisture has a retarding influence on the migration of
radon in a porous source medium. Water in itself has a radon dif-
fusion coefficient of 1.13 x 10~5 cm^/s, but in a saturated
medium there is virtually no radon migration since the diffusion
is confined to porespaces rather than to a uniform volume of
water (Tanner, 1964). Uranium counts recorded over initially
saturated soil are negatively affected by the radon exhalation
caused by moisture evaporation, while there is an adverse in-
fluence of the reduced gamma-ray attenuation in unsaturated ma-
terial. One can get a quantitative impression of the resulting
overall effect in the uranium window by considering a typical
clay soil with a saturation moisture content of 40% and an ema-
nation power of 30%. Assuming that the soil particles contain
1 ppm eU (xd = 1 ppm), the spectrometer would record 0.69 ppm eU
with the soil in the saturated state and no occurrence of radon
migration (use of formula (32) for a "dry" spectrometer c^Tibra-
tion). In the completely dry state of the soil one would have a
radon diffusion coefficient of around 10~2 cm^/s, which corre-
sponds to a radiation loss of 27% and a recorded concentration of
1-0.27 = 0.73 ppm eU. These numerical data for uranium as»ays
under saturated and dry soil moisture conditions suggest a re-
sulting increase of 6% in the uranium count rate during a hypo-
thetical phase of complete moisture evaporation. The similar in-
crease shown by the thorium count rate would only be governed by
the reduced gamma-ray attenuation which amounts to 44%.
The above example does not fit the decrease of 30% shown by the
airborne uranium data collected between spring and summer over
the clay soil of the Canadian Breckenridge test strip (subsection
3.1). In fact, several mechanisms are active in causing a de-
pleted radon content in soil surfaces subject to drying or in a
dry state. Tanner (1980) discussed the enhanced emanation power

- 50 -
of mineral grains surrounded by a water film in which recoiling222Rn atoms from the alpha decay of 226Ra are entrapped. This
radon becomes mobile when evaporation begins and is an additional
source of gamma radiation losses as long as there is any moisture
left in the porespaces. Another factor to be considered is the
soaking action of atmospheric pressure drops on the soil gas in
unsaturated pore systems. Not only soil, but also a number of
common rock types and uranium ores have emanation powers exceed-
ing 10% (Barretto, 1972; Austin, 1975). The use of an ore of low
emanation power is obviously an urgent necessity in the construc-
tion of a uranium-loaded calibration pad.
4. CALIBRATION FACILITIES BASED ON CONCRETE PADS
4.1. Calibration equations
The first question that arises in the planning of a spectrometer
calibration facility is the number of sources required and the
radioelement concentrations to be contained in the sources. A
theoretical approach to the problem can be made by setting up a
linear expression for the count rate n recorded over a cali-
bration pad in an arbitrarily selected spectral region. Such
an expression is of the form
n - 9K + 9u * XU + 9Th + b (37)
where xK, xu» and x T n are the pad concentrations in %K, ppm eU,
and ppm eTh. The "g" factors represent radioelement sensitivity
in the considered energy interval (gR = 0 if the interval is
placed above the potassium window), "b" is an extended back-
ground term which may include a terrestrial contribution from
the area chosen as a calibration site. To facilitate the formula-
tion of (37) for a series of P pads, the radioelements are con-
veniently numbered from 1 to 3, so that "1" denotes potassium,
"2" uranium, and "3" thorium. In assigning numbers to the pads.
- 51 -
it is adequate to progress from 0 to P-1 with pad 0 taken as the
source that produces the smallest count rate. Using these num-
bering conventions, the system of P linear equations can be re-
presented by the single matrix equation
{gK, gUr g T h} + B (38)
with
X =
x02
X13
-1,1 XP-1,2 *P-1,3
and
B =
bP-1
If the pads are going to serve as reliable calibration sources,
they must be placed in an area of low and uniform natural radio-
activity. Assuming thus that the "background" is the same on all
the pads, i.e. bo = bi = ••• = bp.j, we can eliminate the B term
in (38) by subtracting the equation for pad 0 from all the other
equations contained in (38). The new equations generated by this
subtraction can be written in the compact matrix form
19KI 9U» 9ThJ (39)
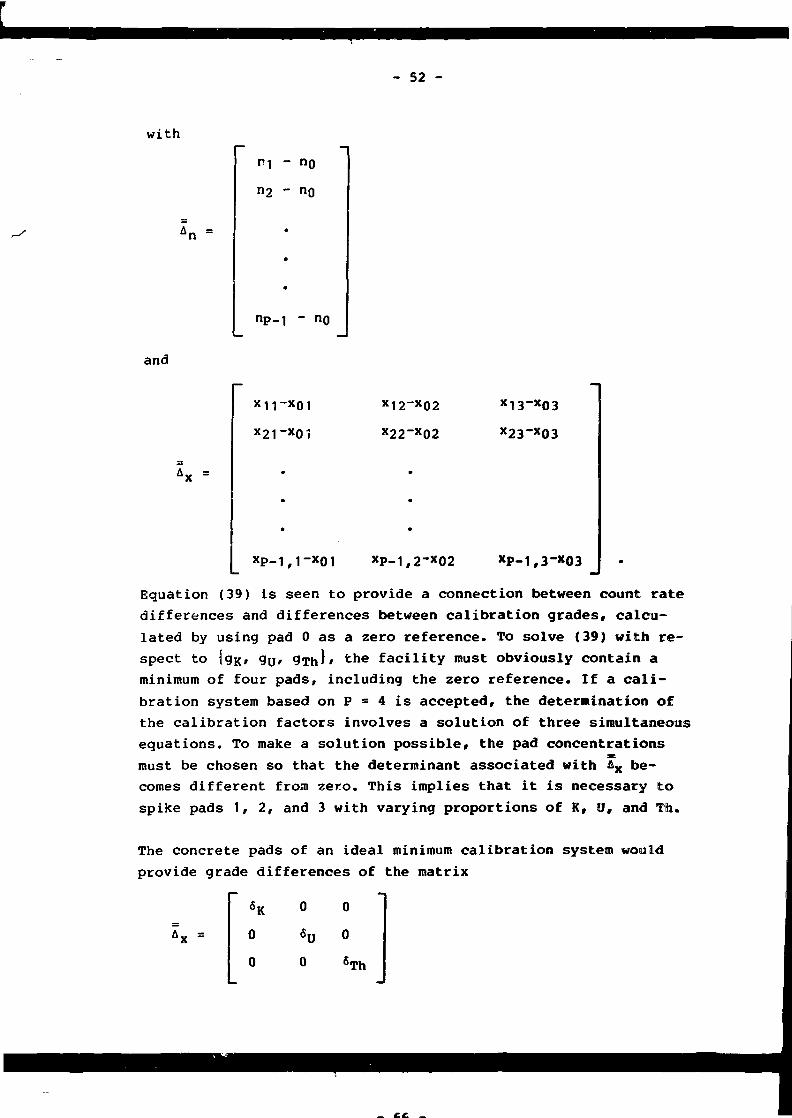
- 52 -
with
H1 - n0
n2 - no
-i - n 0
and
A» =
x11"xO1
x21"x0?
x12"x02
x22"x02
x13"x03
x23"x03
xP-1,2"x02 XP-1,3"*O3
Equation (39) is seen to provide a connection between count rate
differences and differences between calibration grades, calcu-
lated by using pad 0 as a zero reference. To solve (39) with re-
spect to igK» 9[j, 9ThJ' fche facility must obviously contain a
minimum of four pads, including the zero reference. If a cali-
bration system based on P - 4 is accepted, the determination of
the calibration factors involves a solution of three simultaneous
equations. To make a solution possible, the pad concentrations
must be chosen so that the determinant associated with Ax be-
comes different from zero. This implies that it is necessary to
spike pads 1, 2, and 3 with varying proportions of K, U, and Th.
The concrete pads of an ideal minimum calibration system would
provide grade differences of the matrix
0
0
O
O
0
0
5Th
-53 -
which makes it possible to measure an instrumental response to
a particular radioelement on a particular pad. According to IAEA
(1976), the primary sources for the calibration of portable spec-
trometers should be spiked with concentrations of SR = 5% K,
Sy = 20 ppm eU, and 6Tn = 40 ppm eTh. Identical uranium and
thorium calibration grades are specified in the IAEA recommen-
dation for the pads required to determine the stripping ratios
of an airborne spectrometer at the surface. In practice it is not
possible to manufacture a source which is exclusively enriched in
a single radioelement. Potassium presents the greatest problem
since the K feldspar typically needed to obtain a pad concen-
tration of 5% K may contain several ppm more uranium and thorium
than the low-radioactivity material selected for the zero refer-
ence. It may also be necessary to accept an unwanted concen-
tration of U or Th in the raw materials available for the pre-
paration of uranium and thorium concrete mixes.
There are two reasons why it may be desirable to expand a basic
system of three calibration sources plus a zero reference.
Firstly, the inclusion of extra sources offers some security
against calibration inaccuracy due to an error on the calibra-
tion grade assigned to a single source. Such an error might oc-
cur because a pad is less homogeneous than believed, or it could
result from radon exhaled from the pad surface. Secondly, a
series of pads that have been spiked with a whole range of
uranium and thorium contents makes it possible to select the
combination of sources that best accomodates the radioactivity
levels to be dealt with in the field. This latter consideration
is relevant in the design of facilities for portable instruments
whose main application is ore grade estimation. When more than
four pads are involved in a calibration trial, it is the most
expedient to estimate the wanted calibration factors from the
application of least-square techniques to the Eq. (38)
(chapter 5).
- 67 -
that volume.
- 54 -
4.2. Existing calibration systems
The tabulations in the Appendix contain information on the
source configurations and calibration grades for pads facilities
visited in the present study. The data show that there are dif-
ferent preferences behind the calibration systems implemented
in different parts of the world. A key for describing such a
system in condensed form has been introduced by assigning letters
to pads of various radioactive compositions. Pads with a prefer-
ential enrichment in potassium, uranium» or thorium are identi-
fied by the letters K, U, and T respectively. If a pad loaded
with uranium or»» contains thorium in a proportion corresponding
to Th/0 > 0.3» the letter M is used for classifying the pad ao
"twixedT. A pad serving ass a t**ro reference is characterized by
the l«?lter B which stands for "background" or "blank". The
further use of a numerical index to deocribe the occurrence of
mm>j than one pad of a particular type makes it possible to de-
scribe a calibration system by a simple compound code.
The existing airport calibration facilities are based on a con-
figuration öf four or five large pads. The older installation at
uplairtdls airport» Ottawa» represents a T2M2B calibration system
whose potasslm» concentrations differ by leoa than 0.7* K. Such
a system dlöH»s not, permit an accurate determination of K window
sensitivities. The facilities at Helsinki» Sore* (Israel),
kawseria {South Africa!» Borlänge (Sweden)» and 0-Tapao
{ThaiIandJ are off a «ore recent design and exemplify the basic
KOTB configuration. At Walker Field airport in Grand Junction»
Colorado» a KWfHB systew has been chosen. The uranium and tho-
tium «grades associated with five of these facilities do not ex-
ceed OT ppm etu and 50 ppw eTh» in fair agreement with the IAEA
tetfoftsendatioJ» of 20 and 40 pp.* respectively. Two facilities
f the ones at Helsinki attd Lansetiaf possess grades of 50 to
60 ppft eO and over 100 ppw eTh. A high-^sensitivity airborne
spectro»eter syste» exposed to radioactive concentrations
of this »agnittide way easily be overloaded with a high rate
of detector palses. Aviv and Vmlkan (1983) found that the con-
tientration of 30 ppii e¥h in the T pad at Soretj was sufficient
to produce a pulse pile-up effect of 4« in the thorium window of

- 55 -
a spectrometer in which ten prismatic detectors were coupled
together to provide a total sodiurn-iodide volume of 42,000 cm3.
Therefore, even when the radioelement spikings of airport pads
arc modest, it may be necessary to calibrate the detectors in
the aircraft individually or in pairs.
Calibration systems for portable spectrometers offer the possi-
bility of using multiple source configurations by virtue of the
relatively low cost associated with the manufacture of small con-
crete pads. The facilities included in the Appendix contain from
five to as much as ten sources. The ten pads at Bell Corners near
Ottawa form a K3U3T3B configuration designed for calibration
trials at levels of (I, 10, 10), (1.5, 40, 80), and (3, 500, 400)
where the nutsbets represent approximate calibration grades in %K,
ppn eO, and ppm eTh. Sources spiked with several thousand ppm
uranium or thorium are available at Pelindaba (South Africa) and
Villa 2S 4c Mayo (Argentina). These sources are too hot for being
incorporated in the calibration of an instrument like the Geo-
«etricB GR-410, whereas they may serve as useful reference tar-
gets for total-count scintillometers or GM counters.
Fro» the Appendix it is obvious that the laboratories in general
have loaded their pads for portable spectrometers more heavily
than specified in the IAEA recommendation. This is mainly because
of the long tine needed for counting on a source with 20 ppm eW>
or 4Q pjMi eTfo. With a Ot-410 unit it would take half an hour to
get a precision of 1* on the window counts recorded on such a
source. The Australian facility at the CSIRO Institute of Energy
aihid Earth Resource!? are based on U and Th calibration grades of
90 and 160 ppm respectively and permits a reliable measurement
of U and and Tb calibration constants in about two times 10 mi-
nutes. Spikimg levels of 100 pp* eU and 200 ppm eTh should per-
haps be the accepted standard in the future.
4« 3. Physical diagftaiona-involved
Nufcetieal calculations sistlar to those used for getting the un-
apptonimated geowetry factors plotted in Pig. 30 suggest that the
effect of increasing the thickness of a gamma-ray source is very
- 69 -
- 56 -
limited beyond a mass per unit area of 70 g/cm2. About 35 cm of
normally dense concrete are sufficient to produce 99% of the
radiation that would have been obtained with a much thicker
source. Pads listed in the Appendix are between 25 and 60 cm
thick, a thickness of about 50 cm being the most common. Half a
meter of concrete mix is sufficient to furnish the strength re-
quired for supporting a folly loaded geophysical aircraft and is
also suited for being deposited in a sheet metal compartment or
other frame.
According to IAEA {1976), calibration sources for airborne spec-
troaeters should be at least 8 m in diameter, while a minimum
source diameter of 2 m is recommended for calibrating a port-
able spectrometer. When a survey aircraft is parked on a large
pad for the recording of calibration counts, there are tens of
centimeters between the detector system and the pad surface.
Assuming that the calibration trial is characterized by an ef-
fective detector elevation of 80 cm, a pad diameter of 8 m would
produce a geometry factor of 0.80 (formula (21)). The pads re-
quired to get an i«|pr©ved geometry factor of 0.90 would have
to be 16 m in diafteter* corresponding to a very large concrete
eonsuittption of 100 »3 peC pa,j. Manufacturing cost Ie also a rel-
evant consideration in the design of small pads. With a pad di-
ameter of 2 m, the geometry factors that can be obtained in
heights of up to 1® cm above the pad surface are greater than
0.99. By increasing the pad diameter to 3 m it is possible to
calibrate a detector probe in a geometry that amounts to at
least 93% of 2», but this improvement would raise the concrete
from 1.5 to 3.S m^.
An experiaertt like that in Pig. 26, in which a rather voluminous
detector unit belonging to an airborne spectrometer is placed for
calibration on a small pad, cannot be justified if there is a
significant drop-off in the radiation intensity with increasing
distances to the central calibration point. The decreasing count-
ing geometry along source radials of constant elevation "h" can
be estimated by integrating the flux contributed by a unit source
volusie i« points displaced a distance of "d" with respect to the
source axis. Figure 34 shows two curves that can be used to de-
- 57 -
teraine the source radius R needed to get an almost constant ge-
o»ctry factor Fg within a given distance from the source centre.
The carves are based on a spatial numerical integration of the
2.61 NeV elux produced by cylindrical sources of R • 1 m and
R « 4 n. These two computational cases gave almost the same re-
sults when the elevation and displacement were normalized against
R. For h/R « 0.20, Fg has decreased to 951 of its central value
in a distance of d « 0.45 R. A source with a diameter of 3 m
therefore makes it possible to obtain a 135 cm wide and 30 cm
high calibration space in which the radiation intensity varies by
less than 51. Close to the source surface (h/R * 0.05) the radi-
ation dininuation is smaller than 51 for radial displacements of
up to d * 0.65 R.
There is no particular advantage connected with the use of cir-
cular calibration sources apart from the fact that they make it
easier to perform a flux calculation such as that mentioned
above. Concrete pads of large horizontal dimensions are most
conveniently Manufactured by depositing the mixes in a rectangu-
lar or square for». Figure 35 is an outline of the facility at
Wainter Field airport in Grand Junction. The five pads are 9.1 *
12.2 m large with an associated effective diameter of 11.5 m
(formula «23)). An asphalt track in flush with the pad surfaces
allows planes to taxi through the area and return to the air-
field, in Finland and Israel the airport calibration facilities
are based on pad dimensions of 8 * 8 m which corresponds to an
effective source diameter of roughly 9 m. The pads at Lanseria
airport at<e circular with a diameter of 8 m and consist of coher-
ent concrete, while the almost circular sources at Borlange air-
port (Pig. 24» are composed of stacked layers of interlocking
concrete bricks which are loaded with radioactive admixtures.
Most of the anallet pads constructed for use with portable in-
struments are concrete cylinders with or without a metallic
cladding; their diameters ramte from 1 to 3 m. A sketch of the
K-2TN4B configuration at the tnstituto de Radloprotecao e Dosi-
•etrica ft.R.D.), Rio de Janeiro» is shown in Pig. 36. The eight
sources are 3 «1 in diameter and spaced along the circumference
of a circular area on which quartz sand has been deposited up
to the level formed by the calibration surfaces. The facility
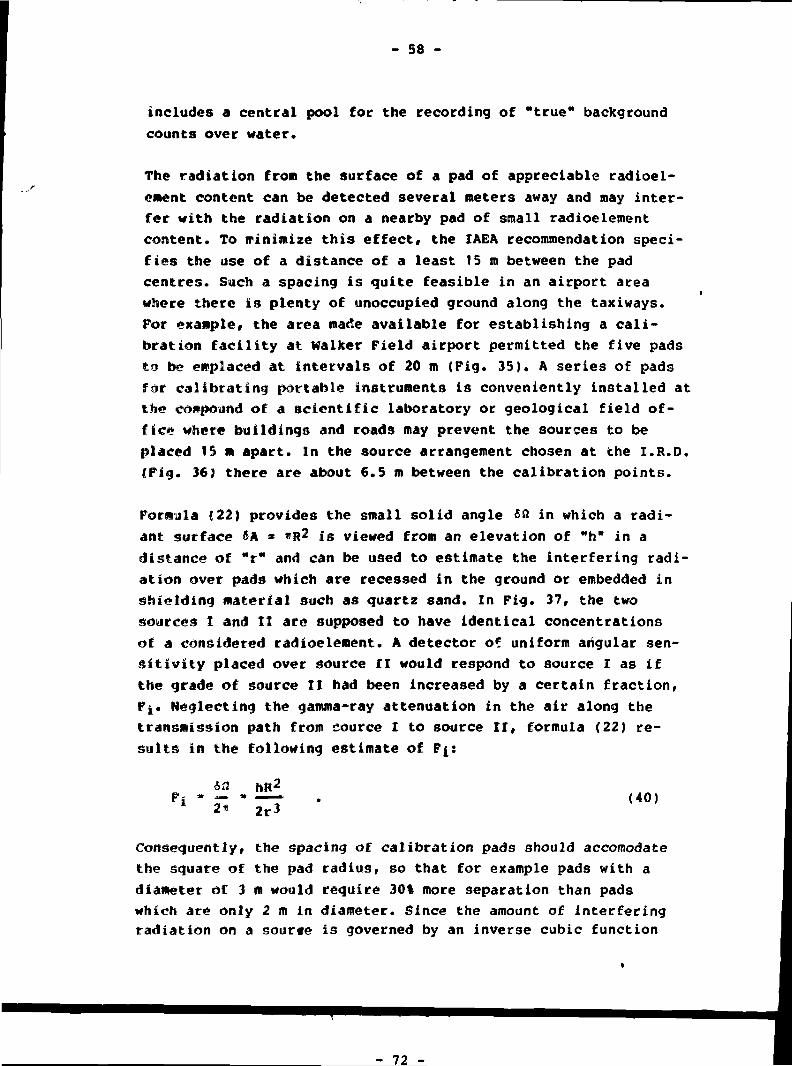
- 58 -
includes a central pool for the recording of "true" background
counts over water.
The radiation from the surface of a pad of appreciable radioel-
eaent content can be detected several meters away and may inter-
fer with the radiation on a nearby pad of small radioelement
content. To minimize this effect, the IAEA recommendation speci-
fies the use of a distance of a least 15 m between the pad
centres. Such a spacing is quite feasible in an airport area
where there is plenty of unoccupied ground along the taxiways.
For example, the area made available for establishing a cali-
bration facility at Walker Field airport permitted the five pads
to be empiaced at intervals of 20 m (Fig. 35). A series of pads
for calibrating portable instruments is conveniently installed at
the compound of a scientific laboratory or geological field of-
fice where buildings and roads may prevent the sources to be
placed 15 a apart. In the source arrangement chosen at the I.R.D.
36) there are about 6.5 m between the calibration points.
Formula (22) provides the small solid angle 6® in which a radi-
ant surface 5A * »R2 is viewed from an elevation of "hH in a
distance of "r" and can be used to estimate the interfering radi
ation over pads which are recessed in the ground or embedded in
shielding material such as quartz sand. In Pig. 37, the two
sources I and IX are supposed to have identical concentrations
of a considered radioelement. A detector of uniform angular sen-
sitivity placed over source II would respond to source I as if
the grade of source II had been increased by a certain fraction,
Fj. Neglecting the gamma-ray attenuation in the air along the
transmission path from source I to source II, formula (22) re-
sults in the following estimate of Fj:
«a hR2
2r3(40)
Consequently, the spacing of calibration pads should accomodate
the square of the pad radius, so that for example pads with a
diatteter of 3 m would require 30% more separation than pads
which are only 2 m in diameter. Since the amount of interfering
radiation on a sourte is governed by an inverse cubic function
- 72 -

- 59 -
of the distance to the neighbouring sources, it may not be a
problem to place the sources less than 15 m apart. With the
spacing of ~ 6.5 m used in the facility at the I.R.D., an ef-
fective detector elevation of 70 mm would produce an inter-
ference factor of 3 x 10"^. On the B pad a contribution of
0.05 ppm eTh should therefore be expected from the content of
about 170 ppm eTh in an adjoining T pad. Since the B pad con-
tains 1.5 ppm eTh, the resulting offset of the thorium zero
level is negligible.
4.4. Homogeneity characteristics of radioactive concrete
Concrete mixes manufactured for construction purposes consist
of water, cement, fine aggregate, and coarse aggregate in a
weight proportion of typically 0.5:1:2:3. Coarse aggregate is
formed by particles which are from 5 to about 20-40 mm large and
is included to reduce the cost of a required quantum of mix and
to supply strength and density to the finished concrete struc-
ture. Fine aggregate or "sand" consists of particles of size
from less than 0.3 mm to about 4 mm. In mixing concrete the
cement paste and the fine aggregate combine into a mortar which
fills in the space between the coarse particles and provides
the mix with the necessary plasticity. Cement paste cures into a
binder material for the aggregate particles and is the weakest
constituent of hardened concrete due to its content of pores
and air voids (Troxell et al., 1968; Neville, 1981).
In proportioning mixes for the manufacture of calibration pads,
one has to decide in which form the radioactive materials should
be added, coarse or fine. The use of large particles is in prin-
ciple undersirable since the goal is to produce sources of the
greatest possible radioactive homogeneity. On the other hand,
mixes entirely based on fine aggregate require more cement paste
per m3, are not very workable, and do not solidify into material
of the strength and compactness obtained with usual concrete
mixes. Tf the raw material selected for a pad is uniformly radio-
active and possesses a radioelement concentration that suits
the calibration trials, the material may be crushed to furnish
- 60 -
a usable combination of fine and coarse aggregate. Lovborg (1983)
described the construction of total-count calibration blocks
using ore which had been crushed to supply a maximum particle
size of 6 mm. The associated range of particle dimensions made
it possible to vibrate the mixes into compact and homogeneous
source materials.
There are two considerations which speak against the use of ag-
gregate exclusively formed by crushed ore material. Firstly, the
angular and more or less fissured particles delivered by a rock
crusher are a source of unwanted additional concrete porosity
(Lovborg, 1983). Secondly, uranium ores of the low grade typi-
cally required in the determination of eU calibration factors
are potential carriers of thorium which is an unwanted radio-
element in the manufacture of U pads. Consequently, it may be
the best choice to let the bulk of the aggregate consist of natu-
ral granular material of low radioactivity while adding to the
mix a small amount of high-grade ore of the desired radioactive
purity. This manufacturing technique also makes it possible to
utilize monazite or thorite of high thorium content and low
uranium content for the construction of T pads.
A radioelement concentration provided by ore particles dispersed
in concrete cannot be reliably estimated unless sufficiently
many particles are included in the laboratory assay required for
assigning a calibration grade to the pad. Quite obviously, the
amount of mix that has to be sampled is the greater, the fewer
particles there are per unit volume of mix. A simplified theor-
etical approach to the sampling problem can be made by consider-
ing a concrete batch prepared by mixing Ni radioactive particles
together with N2 neutral aggregate particles. If the cement
paste holding the particles together is disregarded, the ratio
N1
(41)
represents the dilution of an ore grade into a pad radioelement
concentration. Assuming a constant probability of p that a par-
ticle selected at random from the mix is radioactive, the prob-
ability of finding ni radioactive particles in a sample consist-
- 61 -
ing of n particles is given by a binomial distribution of mean
value u = np and variance o^ = np(1-p). This corresponds to a
relative standard deviation of
a (42)
on the radioelement concentration analysed in the sample. One
can make a very rough estimate of the sample volume "v" required
to provide a sample of n particles by setting v = nd^ where "d"
is a dimension representative of the particle size. In a real
mix the particles are not closely packed since they are sur-
rounded by cement paste, and because the particle density is
overestimated, there is no justification for the term (1-p) in
(42). The sampling error is therefore estimated as
(43)
Thus, to assay a pad radioelement concentration with a given
precision, the amount of mix collected for analysis should be
increased in proportion to the dilution of ore grade into cali-
bration grade. The decrease of the sampling error with the square
root of the sampling volume is characteristic of randomly dis-
persed elemental abundance and represents a limiting case in the
theory of regionalized variables (Matheron, 1963).
The T pad at Riso National Laboratory contains 150 ppm eTh and
was manufactured by mixing 17.4 kg of monazite sand of 6% thorium
content into 6900 kg of cement mortar whose aggregate consisted
of beach sand of 0.3 mm average particle size. While the batches
were deposited in the framework for the pad, 305 mix samples were
collected in 170 ml cans for thorium analysis by gamma-ray count-
ing. A relative standard deviation of 2% was recorded for the
thorium contents measured in this trial (Lovborg et al., 1972),
while the standard deviation suggested by formula (43) only
amounts to 0.8% (d = 0.03 cm, p = 0.0025, v = 170 cm 3). This
example shows that the use of an average particle size may under-
estimate the sampling error. Ninety-five percent of the aggregate
used in the example was finer than 0.6 mm which happens to be the
particle size providing the observed standard deviation of 2%.

- 62 -
Perhaps, therefore, the "d" in formula (43) should be the maximum
size rather than the average size of the aggregate particles.
Results obtained with the formula for mixes which are based on
coarse aggregate are illustrated by considering the U pad of the
facility at Lanseria airport. The pad was manufactured from a mix
of uranium ore and neutral aggregate, both materials in a nominal
particle size of 20 mm (Corner and Smit, 1983). The ore contained
approximately 170 ppm eU, while 57 ppm eö is the reference con-
centration adopted for the pad. With p = 57/170 = 0.34 and a
wanted <Jr of less than 2%, the calculated quantity of mix that
should be analysed for such a calibration source amounts to 59
liters, or about 130 kg. In good agreement with this suggested
sample size, the South African personnel took 59 grab samples of
2 kg each during placement of the mix.
Calibration pads which are loaded with a small fraction of ore
particles (p << 1) can be regarded as systems of randomly dis-
tributed point sources in a radiation absorbing matrix. The capa-
bility of such a pad to simulate a uniformly radioactive source
medium is the better, the less the ore particles are spaced and
the higher the calibration point is positioned. In principle
there is no uncertainty associated with the radiation intensity
in any calibration point since the sources are fixed. However, if
another pad of the same ore content were manufactured, the radio-
active particles would assume a new configuration, while their
average spacing would remain the same. It is therefore possible
to assign a standard deviation to radiation intensities produced
by discrete and random source distributions. The calibration er-
ror represented by this standard deviation can be estimated from
a source model in which a calibration pad is formed by adjoining
cubic cells of the side length "a" (Fig. 38). By letting the
radioelement contents of the cells fluctuate independently of
each other, one can generate a resulting frequence distribution
for the photon flux <t> in a central detector point P of elevation
h. Assuming a particle size of "d" and an overall fraction of "p"
radioactive particles in the real pad, the relative standard de-
viation or on <(> is conveniently stated in terms of a dimen-
sionless factor F chosen as
- 63 -
= F
with (44)
- /(d/a)3/p
The suggested Monte Carlo technique was applied to a 50 cm thick
source of the surface dimensions 8 * 8 m. A unit cell size of
a = 2 cm was adopted, and the computer program was written so as
provide F directly, independently of d and p. Ascribing a linear
attenuation coefficient of 0.9 cm"* to the source, the results
obtained became representative of the uncertainties on uranium
and thorium count rates produced by discrete source radioac-
tivity. In a large elevation of h = 1 m, a value of F = 0.0017
was recorded, while setting h equal to 70 mm increased F to
0.015. Consequently, a large pad of the homogeneity sufficient
for calibrating elevated detector systems may not be homogeneous
enough for the recording of calibration counts on the surface.
Calibration error due to source inhomogeneity was estimated for
the U pad of the facility at Walker Field airport. In this pad
the ore particles are up to 2 mm large and embedded in an aggre-
gate of masonry sand, likewise of the maximum particle size d =
2 mm (Ward, 1978). The pad is characterized by an ore-to-mix
ratio of p = 0.001. One can make a coarse estimate of the as-
sociated spacing "s" of the ore particles by assuming that there
are n1 = p/d^ ore particles per unit volume of the pad. This cor-
responds to a spacing of
s = (45)
or 2 cm. If the fluctuations shown by "s" are distributed on
cells of the size a = 2 cm, the relative standard deviation on
the radioelement content in a single cell is estimated to be
Ox- = 1, or 100%. Since the F factors presented above were evalu-
ated for a source that was somewhat smaller than the Walker Field
pads, calibration error based on these factors is slightly over-
estimated. The value of F = 0.015 for h = 70 mm suggests an
r.m.s. error of less than 1.5% on U window sensitivities deter-
- 64 -
mined for portable spectrometers placed on the pad. Stromswold
(1978) scanned the surface of the U pad using a large sodium-
iodide detector (292 x 102 mm) mounted within a thermally insu-
lated container. His map of uranium window counts recorded more
than 3 m from the edges of the pad corresponds to an experimen-
tal standard deviation of 1.0% on the radiation flux approxi-
mately 18 cm above the pad surface.
4.5. Criteria for the selection of mix ingredients
In making preparations for the construction of a calibration fa-
cility, it is natural to search for qualified concrete aggregate
materials and admixtures among available domestic supplies. Since
the sand and stony material utilized by the concrete industry
often derive from granitic or volcanic rocks, an effort may be
required to find s neutral aggregate of the desired low radio-
activity. Table 13 shows the approximate radiometric grades of B
pads manufactured from various geologic materials. The beaches
south of Tel Aviv and Rio de Janeiro are examples of places where
natural aggregates containing less than 0.3% K, 1 ppm eU, and 2
ppm eTh are available. Sand and gravel not predominantly formed
by quartz carry over 1% potassium and several ppm uranium and
thorium in the typical case and are conveniently replaced by
crushed low-radioactivity rock, such as done in South Africa anJ
Sweden. It should be noted that ordinary Portland cement can be
a radioactive contaminant in the manufacture of calibration pads.
Wollenberg and Smith (1966a) investigated the radioactivities of
cements from 147 producers in the OS and Canada and estimated av-
erage contents of about 0.4% K, 3 ppm eU, and 4 ppm eTh. Alumina
and silica used for the production of cement clinkers were shown
to be the main contributors of uranium and thorium; depending on
the geological source of these raw materials, the cement manufac-
tured by some plants may contain as much as 10 ppm of uranium or
thorium. Therefore, neither the aggregate or the cement for a B
pad should be purchased without checking the radioelement con-
tents of these materials (using sealed-can gamma-ray analysis,
as described in the next chapter).
- 65 -
K pads do not present a difficult raw materials problem since
potassium feldspar of ~10% K is quarried or available as a com-
mercial product in most countries with a ceramics industry.
Nepheline syenite without uranium and thorium bearing accessory
minerals is another source of potassium which came into appli-
cation for loading the K pads at Bells Corners, Canada. The
radiometric grades for K pads constructed up to the present de-
monstrate that such pads must be expected to contain several ppm
eU and eTh supplied by the potassium aggregate which normally
is used unblended with sand to obtain a K calibration grade of 4
to 7%.
Uranium admixtures for U and M pads can be obtained from many
sources and are easily procured in countries in which there are
operating uranium mines. Table 14 gives an impression of the
mines and deposits that have delivered the uranium for a broad
selection of existing calibration facilities. If an U pad con-
tained no thorium, it would permit a direct measurement of
uranium window sensitivities and uranium stripping ratios, Y and
"a". It is therefore relevant to search for a uranium admixture
whose thorium content is small. The data shown in Table 15 sug-
gest that a pad loaded with ore of low uranium grade (< 0.1% U)
cannot be expected to possess a Th/U ratio below 0.10. High-
grade ore diluted by a suitable amount of neutral aggregate
seems to be the best choice, provided the neutral aggregate is
of sufficiently low thorium content.
By far the most important property determining whether or not a
uranium ore is a usable source material is the emanation power,
P, of the ore. Since the gamma radiation detected on a pad is
diminished by roughly 0.5% when the amount of radon available
for diffusion in the concrete is increased by 1% (subsection
3.5), it seems reasonable to select the uranium admixture among
ores that emanate less than about 2% radon. If a laboratory
gamma-ray spectrometer is available, it is an easy matter to
test the emanation power of an ore sample by sealing the sample
in a metal can and recording the build-up of 214Bi activity from
an initial count and a final count performed one or more radon
half-lives later (Ty/2 = 3.82 days for 2 2 2Rn). Using this tecfo-
- 79 -
- 66 -
nique, Austin (1975) found that the emanation associated with
the uranium deposits in the western United States can vary from
about 1% to as much as 90%. Ores carrying uranium in the form of
millimeter or centimeter large particles of massive uraninite
(pitchblende) were identified as the weakest emanators (P = 1 to
12%), while ore samples in which the uranium was supplied by
sand grains with a coating of uraninite or coffinite typically
emanated about 70% radon. Pereira (1980) studied emanation shown
by the uranium-bearing alkaline rocks of the Pogos de Caldas
massif, Brazil, and was able to relate strong emanation (P ~ 5(0%$
to surplus 226R 3 originating from a suggested isotopic reraobili-
zation mechanism in the deposit.
It is probably the safest to spike U and H calibration pads with
an admixture prepared by crushing large and unaltered crystals of
a primary uranium mineral which does not retain the internal ra-
diation damage caused by the alpha particles in the uranium de-
cay series. Minerals having reached the metamiot state are un-
qualified because they are strong emanators (Barretto, 19751.
Crushing an ore into very fine powder increases the specific sur-
face with a resulting increase of the emanation power due to re-
coil effect in the alpha decay of 226Ra (Tanner, 1980). There is
consequently a conflict in choosing the particle size into which
the ore should be crushed. The U pad of the spectrometer cali-
bration facility at Rise is spiked with Saskatchewan pitchblende
ore of 0.5 mm maximum particle size; about 30% of the ore par-
ticles are smaller than 40 urn. An emanation test performed with
hardened and powdered samples of the concrete mix suggested that
roughly one fifth of the radon produced by the uranium admixtare
collects in the concrete porespaces through which it nay migrate
and escape from the pad surface (Lovborg, 1983). The radiation
loss on the pad is greatest in dry and warm weather and stay cor-
respond to a decrease in the radiometric pad grade front 23(0 to
150 ppm eU, or 35% (Lovborg et al., 1978; Levborg, 1983}. The
example emphasizes the necessity to check the radon emanation of
a powered ore sample before using the material as an admixture.
It may be an advantage to strain off particles which are less
than ~ 75 vm across by the use of a 200 mesh sieve; this was
in manufacturing the U pad of the recently established airport;
- 80 -
- 67 -
calibration facility in Thailand (R.L. Grasty, personal communi-
cation).
The most important criterion in selecting the thorium admixture
for a T pad is the amount of uranium that can be accepted in such
a pad. A low ratio between the ell and eTh calibration grades is
in particular desirable for facilities which are based on the
combined use of T and H pads for getting a set of thorium and
uranium calibration factors. In principle this is effectuated by
recording the thorium window sensitivity S^n and the stripping
ratio a on a T pad, after which the uranium sensitivity sy is
obtained on an M pad by stripping away the thorium contribution
to the uranium window counts. (The "a" stripping ratio cannot toe
reliably measured with a facility in which there is no U pad),
it is easy to show that an error e on the U/Th ratio estimated
for the T pad results in the following error, ••{,, on the strip-
ping ratio a:
u• e • K46
s TFor a portable spectrometer with Su/s^h " 2.5 and a • 0.6, *
would be overestimated by 20% on a T pad supposed to contain no
uranium, but actually having a U/Th ratio of COS. This example
shows that a minor pad radioelement concentration can have a
significant influence on the outcome of a calibration trial and
therefore either should be avoided or determined rather accu-
rately.
From Table 16 it can be seen that thorium admixtures based on
monazite or thorite typically produce U/Th calibration grade
ratios of 0.03 to 0.07. Monazite sand is a commercial product
derived from placer deposits in, for example, Australia and
Malaysia. The diorite used in Sweden for spiking the bricks of
the T pad at Borlänge gave the bricks a U/Th ratio of 0,0t,
while a ratio of 0.11 resulted from loading the T pad at
Helsinki-Vantaa airport with thorium-rich granitic rock. Thorium
oxide, a chemical compound applied in the construction of the
Canadian facility at Bells Corners, must be regarded a less
suitable admixture unless the material is sufficiently old to
- 81 -
- 68 -
« I M *
a par**»nailf-tiv*s
r ad ioac t i ve e q u i l i b r i a * . Th«? ingrowth o f 208x1 i n<r.<wwp©-andi i s «!«verned toy the 6.7 ye and 1.9 y r
IKD«? it**?» In termedia !^ decay prodtictSt 22flfta andns1» i s not **t$t<atfne«J tint I ) «bout 4'S years? a f t e r
and tiasparini» 1970 D.
^tar»li«m pads
Su iis wad !him it!h«» «cope 1^t titan* ptcÄcnt r«|>ort t ofrs» |5*r«cauti©«s and st**pa
f ä f o r a s»
s Bw
Jjici'H-il'OW «JJ » t t a if aI
by War'4 (((I*?*)1), »ead^r» wtiof prof «»is»; ii on* 11ii'.orj iim Hf)*? pr*»vis
a» 3 UUeVa 3 3» ((Infill-), The var i * -
* * * • • > by»i t * " . im ((TIf 7«:)B1 '51Jt-W f/i'ilSr ani #<i$$i»§li*}ti8
wfovm V and Th
'!) tfi'stl& of a !hiSg^ fitef^frerait 1*11
(Lh»
iw «•ji»-.»-*iiiiuiii
L stL»f in ^ f p ?siZ* fv* the r.^^tt/al SJW.4 aoot-evjat». Th is i s dörte by
that the ÄJ^PJI t » J i "»active pat t i d e s »Ihoulid not J>eaceJ (by llaj-aiet sa?vJ gtalws# Fot imse än a ttumetica 1
*©!*? ä(L '•"'*/ be w»M s one J that the ca^wtetciaS Stcurtazit» «aNdIuseJ f c t the 1I1 paJ a t »is® was cfelävetedl i*D a qitadirtgi so tha t
o t t?:e p a t t i c l e s we*e foetweeM ö.fl aiftidl 0.3 *fti late|e«
- 82 -
- 69 -
iftat radioactive Material of th is fineness i s blended with 1000as mac% sand of the sa*e fineness* one *ould expect to findpart ies* at I to 3 mm interval» throughout the mixture
H* D S. Ttai» example s ^ e s t t an «upper l imit of about 3f®r ffet part IeBe s i t e of the neutral a^re^ate . Figure 39
^ e part i c l e «radinf* ror the beach sand and the masonry.»«*.«, respect ive ly , for constructing the cal ibrat ion f a c i l i -at fttitsj «n4 Mal*«r PieSd. It can be «seen that beach sand may
to» a Safter a^re^ate than mecesssary due to a very snai l fraction•i>* ,pirdi«eS(** wdtia *i*e« above o.S am. The grading curve for thepsil*sää«i«i tel4spat in tfee K pad at His* i s a i * ö «hoi»» in r i g . 39.!•hi!» ***.-rä#3 w«s suppti«d as <t d o t a t i o n product and «akea up«>• »-n)»#j ,*||t^|at-> ff^r 1I^e |»4« The very «i«iJ*r grtdln
r<g<dBi|9ir Mak<* ih« pads or thegin »eg*** I-Ö 4«n»Uy and
«f ore «ills ton* of §and intote «itteritJ can he dane teatchwise
the ]|ob. I t »ay be advisable«•n) «B,»..^!»» f*.», ,ö|y»taiLsi©}D il «s tw.® »tagieii involving» respectively»an *'-yJ«ii»'j frjBeftaawd! wf ©re awd sand in a rat io of about is 100a'."? * Tiir)*y fo3etj*än)di f u» tes<AUn9 «irtiiare witn sand CorJälNiilttgi i»« ©*• fcy * ftftther Uctor of 1«. S;ueh a procedure «assU-JlIH 'juK9 fa «.».** ««?stts«.t4ieti«w» of tfee net» airp^rt: pad» in Thailand\(PV*.-» *S*.»sty, pfttaisflafl «•«MNitJiiNd«-«ti nn tn rotating a -dry *i*ture•5f s»*.<•! *-j* «*«. !»»tiLicji^ !»•»»« ,« « rig* ^r gravity «eparation
*»<i pi lento! ende are 2 to 3of ^iri«, An e*tre»ely loo^
ii*e pet Sal of ^tawwlar «ateriaJ may therefore not be** s is-»tell*. ?*ie spalke'J A^ire^ate* for the1 psdls at Walker f i e l d*»*»•«: |ite|:*«-«J iw tfce föt# of tefti lo t* per pad» each lot eoppris-•Or..? *JJ »^ a?" »»iLtg-saa fc*Je*»ae^ for 10 ftjinutes. nty-bimnSing op-
a (ti*e ilwfore the <?osse»retifi |ob can be am»aiwd radioftettric analysis to jud^e whether the
be »otated mote or i» s t i f f ie lent lyfor b*c<o»i»3 !«-»niÄferredl to storagie barrels .
Irs tfte acit-jaB paJ »«Mfacturitsgi operation» a^re^ate Material»*«'aiter ate rotated to produce a Coherent concrete
- 83 -
- 70 -
thai can be placed with as high a degree of compaction
as possible in the framework or container used to give the pad
iit 3 t**qwir*t<A sjhape and dimensions. Each batch of concrete is
«fisu riisu ted over ihe surface formed by the mass of already de-
}>f$*;;Bft«* concrete and is united with this mass using hand ramming
pröteabJy better» the force excerted by an immersion vibrator.
Ttoe purpose off ramming or vibration is to remove the air bubbles
entrapped in Ote added portion of mix. Very strong and lasting
i»ec!hianijcal action cannot be used due to the risk of getting the
ore particles segregated. It is therefore important that the
Haas a consistency that Makes it amenable to compaction by a
öf external force. Consistency» or workability» is
maawte4 in a so-called :ilu»p test in which a metal
Ig iWB il tfit pt®4i»<e:"imn a 3© c» high truncated cone of freshly
ifr nti N. The stump of the mix in the vertical oettling
ihe lest. &me, h nix exhibitino a slump ot lean than f»0
%*< is ri«|ii<>i to wark with» and one should aim at a slump of about
IS mm ff r pioducing a sufficiently workable mix. Workability is
JIT »war»'Jy «ronttrolled by the grading of the aggregate particles
the iwmumt of cement paste available as a lubricant for these
When no coarse aggregate ia incorporated» it can be
that (the Mix should be based on a sand**cetnent ratio
off ?st. fhisi rstiio was used in «anufacturing the airport pads
at Watfeet: field and in Thailand.
is a gyspeneiön of cement particles in water.
paste «fares #«dl hardens into ceifient gel by hydration and
rei|jite's appro*iniateiy 0.2S weight parts of water per weight part
of ee*«M to hydrate completely. TO become workable» a mix must
a water-ee*ertt ratio of at least 0.4. It is not advisable to
this ratio above 0.5 since surplus mix water produces
a hardened paste of high porosity and low strength. With an ex-
pected nix density of about 2000 kg/a3» a suggested mix compo-
sition might be:
Fine aggregateCeisetttTap water
1350 Jtg/n3
450 •200 " (approx imately).

- 71 -
It nay be an advantage to produce the paste from a mixture ofPortland cement and a pozzolanic material in the form of finelydivided silica. In the wet mix a pozzolan provides a lubricatingaction; during the curing period it reacts with the lime con-stituents of the cement so that the hardened paste becomes moredense. The mixes for the total-count calibration blocks describedby Lsvbsrg «1983J were supplied with 8 kg of silicate dust per100 kq of cement. The use of fly-ash as a pozzalan is not recom-mended since fly-ash may contain radium.
A water-reducing agent in the form of a superpiastlcizer is veryefF'eetive for manufacturing nixes of extremely good coherency
plasticity at low water-cement ratios. Superplasticizers areproducts which are based on lignosulphonates or sul-
for»»i«lehyd*» condensates and act by dispersing thee#n*»nt particles In a mix through ionic repulsion. They are typi-cally added in amounts of about 2 kg per 100 kg of cement.
Figure 40 shows superplasticized concrete (mortar) mixed andpoured for one of the calibration pads of the CSIRO facility inSydney. It can be seen that such a mix is very little rigid andtherefore easy to place. Another useful admixture is an air-entraining agent whose action is to introduce a large number oftiny sir bubbles in the mix. It may seem a paradox to increasethe porosity of concrete by adding air to it, typically around10« by voluffe for mixes prepared from fine aggregate. However,air entrainment produces concrete of a non-coherent pore struc-ture and is the proper means of making a calibration pad resist-ant to freezing and thawing. The total-count calibration blocksat ftisa are air-entrained; the resulting pore structure is shownon microscope-pictures in the documentation report (Levborg,1983).
- 72 -
S. ASSAV AND USE OP PAD RAOIOELEMENT CONCENTRATIONS
S.I. Pad »oisture - an intricate problem
In subsection 3.4 it was shown that spectrometer calibrations
should be based on the in-situ or "wet" radioelement concen-
trations of the pads in the facility. The problem is that pad
moisture is a variable quantity, so that the use of "wet" pad
concentrations as calibration grades has an associated uncer-
tainty which adds to the other uncertainties involved in a cali-
bration trial, tt is also a problem to plan the sampling and
assay procedure for fixing the calibration grades in such a
manner that the most likely value of the pad moisture can be in-
corporated in the assay results, either directly or through a
separate moisture determination performed on drill core.
The quantity of sample material needed for a statistically re-
liable estimate of pad radioelement concentrations is con-
veniently collected in the form of mix lumps from the batches
deposited in the framework or container for the pad. Figure 40
shows how the sampling may be done. Assuming a mix manufactured
from 1 nun particles of which one out of thousand is radioactive,
it is necessary to collect about 10 liters of mix for reducing
the sampling error to It (formula (43)). One can either let the
mix lumps cure in plastic bags, or it may be decided to clamp
the material into metal cans for gamma-ray analysis without any
any further sample preparation. In both cases one ends up with
cured concrete in the course of a few hours. To describe the
curing process, it is useful to write down the following equation
for the involved masses of aggregate (A), cement (C), and mix
water (W):
M * A + C + Wh + Wr . (47)
Wh is the water that has reacted with the cement at a given time
and therefore is chemically bound in cement gel. The remaining

- 73 -
part of the mix water, Wc, is housed in capillary pores and inextremely small gel pores which are the centres of gel formation.It is customary to assume that fully hydrated cement binds 25%of water per dry weight of cement, so that Wh can be estimatedas
Wh = 0.25 X-C (48)
where A is the actual degree of hydration. By furthermore in-troducing the A/C ratio of 3 typically chosen for the manufac-ture of cement mortars, the hydrated (dry) mass of concrete iscalculated to be
Md - A + C + Wh
(49)- (4 + 0.25 X)«c
It should here be noted that it lasts many months until a con-
crete mass is fully hydrated. Cured mix lumps will normally not
be stored very long before they are crushed, and it is obvious
that some uncombined mix water will be lost in the grinding
process. In the typical case a composite sample is manufactured
by carefully mixing sample powders together, and the radioelement
assay is performed with splits that have been dried at 1050C un-
til constant weight. The "dry" assay value obtained in this way
is given by
<50>
where xo is the radioelement concentration of the particle mix-ture used as an aggregate.
The "wet" radioelement concentration of the calibration pad mayalso be stated in terms of xo. This is done by introducing thepreviously defined moisture fraction
Wp*«~ (51,
- 74 -
where W p is the pore moisture in M^ grams of cured pad concrete
Assuming that the pad is sufficiently old to have become fully
hydrated (*=1), formula (29) used in conjunction with formula
(50) leads to the estimate
0.71X = X° * (52)
The moisture in an old pad is controlled by an exchange of pore
water between the pad and the surroundings. By having the pad
contained in a metal cylinder or lined with asphalt or plastic,
the moisture transport is limited to take place through the cali-
bration surface. By furthermore keeping the surface protected
from rain and snow between the calibration trials, one only has
to consider the absorption and desorption of water vapour in the
concrete pores. Herholdt et al. (1979) presented the amount of
hygroscopic water in old cement paste as a function of the air
humidity. According to these data, concrete manufactured from a
mix of A/C = 3 can be expected to contain 2 to 3% moisture when
stored in air of 20% relative humidity. For a humidity of 100%
the moisture absorption is almost as large as the absorption in
concrete immersed in water. The relation between the saturation
absorption and the total porosity of the concrete was presented
in formula (30). Concrete containing no coarse aggregate is in-
deed a porous and therefore hygroscopic source material even when
great care has been exercized to reduce the W/C ratio for the mix
to about 0.4. The average porosity determined for the five pads
of the CSIRO facility in Sydney amounts to 21.2% (B.L. Dickson,
personal communication). Assuming a solid density of 2.65 g/cm3
for the aggregate material and hardened cement paste, formula
(30) suggests that these pads may absorp up to 10.2% moisture.
This predicted absorption is in excellent agreement with a satu-
ration experiment (performed with drill core) which gave an esti-
mated absorption of 10.0% when differences between the concretes
were averaged out. For comparison it may be mentioned that the
"H" total-count calibration blocks at Risa were found to be 19-
23% porous with a corresponding saturation absorption of 9-11%
(LBvborg, 1983).

- 75 -
Consequently, it seems reasonable to assume that the moisture
in a calibration pad adjusts itself on values of between 2 and
10%. A pad moisture as small as 2% can only be expected with
facilities situated in extremely hot and dry climates, and the
other extreme of 10% moisture would probably rarely occur even
in a moist climate. Lovborg et al. (1981) measured the water
content in drill-core from several of the spectrometer cali-
bration pads at Riso and arrived at an estimated pad moisture of
6 ± 1 percent. The following theoretical comparison of radio-
metric in-situ grades and laboratory-assayed pad radioelement
concentrations is based on pad moistures of 2, 6, and 10% to
cover one "normal" and two extreme moisture situations. The first
column of Table 17 shows the corresponding ratios x^/x calculated
by means of (50) and (52). It has been assumed that the cured mix
lumps were 33% hydrated when they were crushed and dried (X =
0.33). This is a typical degree of hydration in concrete that has
been manufactured from a rapid Portland cement and cures for 2
days at 15°C (Herholdt et al., 1979). The second column of Table
17 pertains to a laboratory assay of wet mix that has been sealed
in the sample cans since the beginning of the curing period. In
this case the mass of sample material includes the mix water, W =
Wh + Wr. It has been assumed that the mix is of W/C = 0.45, cor-
responding to an assayed "wet" radioelement concentration of
3Cxo= 0.67 xo . (53)3C+C+0.45C
One can see that a pad calibration grade based on "dry" assays
invariably is overestimated and should be reduced by about 10%
to accomodate a typical pad moisture of 6%. By instead performing
the assays with the mix water retained one gets a much more re-
alistic estimate of the pad grade. Grade assignment based on na-
tural mix samples is tedious because it involves many single as-
says to reduce the overall sampling error to an acceptable level.
Grades were assigned to the pads of the Walker Field facility
using 70 wet mix samples per pad. However, the sample cans were
not sealed until after their contents had cured, so that some of
the initial mix water were allowed to evaporate. The resulting
grades as well as the radioelement concentrations determined in
dried concrete powders were presented by Stromswold and Kosanke

- 76 -
(1978). For the major radioelements in the pads the "dry-to-wet"
concentration ratio amounts to 1.13 ± 0.03, in fair agreement
with the ratio of 1.10 estimated from Table 17. The experimental
moisture determinations for the Walker Field pads range from 4.0
to 7.5% (Ward, 1978).
5.2. Sealed-can gamma-ray counting
If large composite samples of finely divided concrete powders
have been prepared, it is lays near at hand to analyse the ma-
terials for potassium, uranium, and thorium using standard wet-
chemical or instrumental analytical procedures. For example,
X-ray fluorescence analysis may come into question as the primary
means of ascribing potassium grades to calibration pads, while
neutron activation analysis might be considered a good choice
for determining a wide range of uranium and thorium pad concen-
trations. For pads containing no chemically processed thorium it
is safe to set 1 ppm Th = 1 ppm eTh. A similar translation of U
concentrations into eU calibration grades may not be valid, as
explained in a moment. It is a severe problem that usual elemen-
tal assays are performed with typically a few hundred milligrams
of sample material. Large composite samples of pad mixes loaded
with small amounts of high-grade ore must therefore be extremely
well homogeneized before splits are taken for analysis. Random
and systematic assay errors can be kept under control by distri-
buting sub-samples among various analytical laboratories, but it
may be quite difficult to combine the data into pad grades of the
desired small standard deviations. This is demonstrated by the
interlaboratory determinations executed in South Africa for pro-
viding the grades of the pads at Pelindaba and Lanseria (Corner
et al., 1979; Corner and Smit, 1982).
At this point it must be stated that the concentrations of ele-
mental uranium in spectrometer calibration pads in principle are
irrelevant quantities. Since all gamma radiation associated with
uranium, in the MeV region, originates from 2 1 4Bi, one has to
assay the element which can sustain 2"• 4Bi radioactivity over a
time span of years without support from uranium. This element is
- 77 -
radium (226R 3) which has a half-life of 1600 yr and therefore
can maintain a gamma-ray flux which decreases by less than 1% in
20 years. The relation between a concentration of radium and the
resulting equivalent uranium grade is calculated by considering
a system in which 226R 3 JS in radioactive equilibrium with its
parent 238u, i.e. the decay rates of the two isotopes are sup-
posed to be the same. By including the current uncertainties on
the 226Ra an<3 238Ö half-lives, 1600 ± 7 yr and (4.468 ± 0.005) *
109 yr respectively, one arrives at the correspondance:
1 ppm eU = (3.376 ± 0.015) x ]Q-1 g Ra/g . (54)
(For the derivation of the main term, see Dickson et al. (1982)).
Although the radium and uranium in calibration pads do not need
to be in radioactive equilibrium, it is always advisable to
check the equilibrium state by combining the necessary radium
assay with a uranium assay. Surplus radium is indicative of en-
hanced radon emanation since this radium may occur as particle
coatings rather than as atoms in the interior of crystals (sub-
section 4.5). Equilibrium is desirable whenever it might come
into question to use a uranium loaded pad for the calibration of
total-count scintillometers in units of counts/s per Ur (1 Ur =
1 ppm U in equilibrium). The reason is that nearly 4% of a gross
uranium count rate are contributed by low-energy gamma rays emit-
ted by 235U (L0vborg, 1983).
The determination of the radium in a pad mix, in terms of an eU
calibration grade, is conveniently done by three-channel window
counting, so that the pad concentrations of K and eTh are
measured along with the eU concentration. The procedure is based
on the use of metal cans which contain several hundred grams of
dry or wet mix sample and remain sealed from 3 to 4 weeks before
the counting is started. A gas-tight seal is necessary to warrant
the equilibrium in the system 226R 3 _ 222Rn _ 214gi when the
counting is performed. Since the requested pad grades are
measured simultaneously in samples consisting of hundreds of times
as much material as the splits used for a chemical assay, a lab-
oratory gamma-ray spectrometer is far the best tool to use for
grade assignment. A suitable counting system may comprise a large
- 78 -
sodium-iodide detector mounted inside a background shield of
steel or lead and operated in conjunction with a multichannel
analyser. The performance requirements in regard to photomulti-
plier gain stability, pulse pile-up effect, and counting stat-
istics is the same for such a laboratory instrumentation as de-
scribed for portable spectrometers in chapter 2. It is in general
easier to perform a gamma-ray assay in the laboratory than in the
field since the background shield provides thermal insulation for
the detector. Also, the counting geometry does not vary, and it
is possible to accumulate sample and background counts over very
long periods of time.
Figure 41 shows a spectrometer counting facility at the CSIRO
Institute of Energy and Earth Resources in Sydney. The sample
cans are here exchanged manually by hoisting a plug which forms
the upper part of the lead shield. The spectrometer shown in
Fig. 42 is sited at Ris0 National Laboratory and has an attached
sample changer, so that night and weeekend hours may be utilized
for counting a series of samples. In both these counting systems
the multichannel analyser is used to define three more or less
wide energy windows in the spectral interval from 1.3 to 3 MeV.
A background correction and a subsequent calculation of
"stripped" window count rates are carried out precisely as in a
field assay with a portable spectrometer. In a laboratory assay
a stripped window signal is assumed to be proportional to the
total mass of radioelement contained in the sample. The use of
normal window sensitivities, i.e. count rates per radioelement
concentration unit, must therefore be preceded by a normaliz-
ation of all recorded count rates to a common reference sample
weight. The sample cans used with the Riso spectrometer are
7 5 mm in diameter and 39 mm deep and can be packed with between
200 and 300 g of material, depending on the density and size of
the particles. A reference weight of 250 g has accordingly been
adopted in this assay system.
Radiometric pad grades provided by means of a laboratory spec-
trometer are linked up with the quoted or calculated radioelement
concentrations in reference materials used to calibrate the in-
strumentation. A potassium salt which contains no chemically
- 79 -
bound H2O is an obvious K calibration standard since the weight
percentage of potassium directly follows from the chemical
formula. Figure 43 shows the result of calibrating the Rise spec-
trometer with ten potassium salts which were dried for 2 days at
1050C before they were packed and sealed in sample cans. If the
count rate in the potassium window had been strictly proportional
to the amount of potassium contained in a sample/ the normalized
sensitivity
250sK,norm = SK * —7-
W
would be independent of the sample weight W. From Fig. 43 it is
obvious that SR norm decreases with W, and this effect must be
ascribed to self-absorption in the 39 mm thick layer of sample
material. Since all experimental points except the point for
K2CO3 seem to fit a straight line, it is natural to use this line
in calculating the values of SR obtained with different sample
weights. The resulting expression is added in Fig. 43. The plot
suggests that K2CO3 (potassium carbonate) may be an unreliabe
reference material; this salt is actually very hygroscopic and
therefore difficult to dry properly.
Nearly all users of laboratory gamma-ray analysis prepare their
radium and thorium counting standards from analysed radioactive
ores. The Geological Survey of Canada is an exceptional example
of a laboratory where primary counting standards have been pre-
pared using a certified radium solution and a thorium salt manu-
factured in 1906 (Grasty et al., 1982). Thorium of this age is
in equilibrium with 224R 3 which is the analogous isotope in the
232rph decay chain to 226R 9 in the 238JJ decay chain. A number of
other laboratories base the analysis of eU and eTh on reference
ores prepared by the New Brunswick Laboratory (NBL) of the US
Department of Energy. Various series of NBL reference ores have
been emitted since the 1950s, and it has generally been assumed
that the uranium standards are in radioactive equilibrium by vir-
tue of a stated Ra/U ratio of 3.44 * 10~7 for the pitchblende
selected as a master material in the preparation of the stan-
dards. Since no information was available on the uncertainty of
this ratio, many analysts felt uneasy about using the NBL refer-
- 80 -
ence materials as counting standards. A single of the older 0
standards (NBL-I03) has been found to contain more uranimm than
quoted in the NBL certificate (Dickson et al., 1982; Grasty et
al., 1982). The new so-called 100-A series of NBL reference ma-
terials has been subjected to a US interlaboratory measurement
program described by Trahey et al. (1982). This series was manu-
factured by diluting pitchblende and monazite with silica
S1O2) to provide reference grades of approximately 10,1
500, 100, and 10 ppm U or Th. Grades of between 100 and
are suitable for calibrating a typical laboratory spectrometer.
The radium content of the pitchblende ore was assayed by NBL plus
the National Bureau of Standards and Argonne National Laboratory.
From these 3 determinations the U standards (101-A to 105-A)) are
estimated to possess a Ra/U ratio of (3.40 * 0.06) * 1Q~7. This
estimate suggests that the certified U concentrations can be re-
placed by identical eU concentrations, cf. formula (54). The
greatest remaining problem in the use of NBL reference materials
as counting standards is the missing information on the 226Ra
contents of the thorium series, 106-A to 110-A. The monazite used
to produce this series has a U/Th ratio of 0.040, so that a set
of a reliable eTh calibration factors cannot be obtained without
executing a correction for the associated eU concentrations.
Another supply of uranium reference material is the Canada Centre
for Mineral and Energy Technology (CANHET). The most versatile
CANMBT standard is the BL-5 which is an ore concentrate from
Beaverlodge, Saskatchewan, certified to contain 7.09% ID with a
95% confidence interval of ± 0.03% U (Faye et al., 1979). By di-
luting a quantity of BL-5 with silica powder the user can manu-
facture a counting standard o* any desired reference grade.
Interlaboratory measurements of 226R 3 have shown that BL-5 amd
other of the CANMET standards can be assumed to be in radioactive
equilibrium (Smith and Steger, 1983). Uranium reference ores of
known radium contents have also been prepared by the Bureau of
Uranium Geology in Beijing, China (Yang Zhenzhou and Liu Xiefoem,
1983).
In calibrating the U and Th energy windows of a laboratory spec-
trometer there is a self-absorption effect similar to that ob-
- 81 -
served in the K window when potassium salts of different densi-
ties are used as counting standards. To assess the effect it is
necessary to prepare eU and eTh calibration standards of dif-
ferent weights. Grasty et al. (1982) diluted their primary
thorium reference material with silica, flour, and a cellulose
patching-compound in various proportions and measured a decrease
of 0.028% in the normalized thorium sensitivity per gram increase
in sample weight. The corresponding coefficient for the uranium
window was determined by interpolation between the values re-
corded in the K and Th windows. At Riso the eU and eTh assay er-
rors associated with self-absorption in the samples are taken
into consideration in the form of fixed relative standard devi-
ations of 2% and 1.5% respectively. These uncertainties include
the estimated errors on the eU and eTh reference grades and have
been assessed from calibration trials with NBL standards having
a matrix of either dunite (the 70 and 80 scries) or silica (the
100 series) (Levborg, 1983).
The analytical agreement between counting laboratories involved
with the assignment of radiometric grades to calibration pads or
borehole models was checked in an intercomparison organized in
1981 by Dr. David George of the Technical Measurements Center at
the Grand Junction Area Office of the US Department of Energy.
Six laboratories analysed 3 powdered materials prepared by load-
ing a concrete mix with two uranium grades and one thorium grade.
Table 18 shows the results of this experiment, including for
Soreq (Israel) only the data recorded with a 152 * 102 mm sodium-
iodide detector, tt should be noted that the results obtained by
the TMC include splits that were taken after the other labora-
tories had received their splits for analysis. Since the TMC as-
say values are the largest ones recorded, the master mixtures may
not have been blended to the stage where the radioactive par-
ticles are completely randomly distributed (D.C. George, personal
doftÄuhicatioM. "She experiment indicates a good agreement between
eI3 assay values provided by the participating laboratories, while
the thoriu» reseat aust be regarded slightly discouraging.
lira sjpeetroseter assays of siinor pad radioelement concentrations
^t is the backgtojftd rather than the reference materials that de-
<»f tl»« <tet«tm4n«<tton». Tttoie
«tt>«* Rlse spec-
J i« latele 18.
f .an ? siito iffl*fi ®*wpS?f«sf« 4 s*wijäl«« r>UTO i.# 4.n&ttlat#dl. The t»bll« serves as
it «s 4l > U w fet|,uir dl t<& .*s**y fhe radlioelement contents
^i ?mäK«*!S IUSKMJ for tihe i»aniafa«tmre of B pads. While a
s ti mg J» sample ^t n nitt, <®f I pp» «is and 7 ppw eTh can toe assayed
with tl(Q)i pt«cäSB«BM i» ©ne Sadar» stuteen hoars of counting time
are? WCt-JcJ t© «stotaim a sSiSiiiar preciöäiön öfä mix contents of 0.8
ppsi eO amJ 2 ppM «-Th. It is iml**t«*Btltog to note that a small con-
«s? 2 ppm **?fa in e%tmse4 rode <ea« be assayed! Jmst as pte-
miäM<jii»si toy »eaKis of a portable spectrometer {Fig,
nn I).
4ält<f*r«nee in assay speed for Held and labora-
pr;ieiro»eters is a cosisequence of reducing the effective
* tmasiD frö» 40-S0 leg on the outcrop (subsection 2.4) to a
few hundred graas is» the laboratory. The net count rate produced
by 2 pp» efts in the Msa spectroMeter only amounts to 17% of the
count rate in the thorium window. Most of this back-
originates from thorium in the concrete walls of the
too». Wollenberg and Smith (1966b) showed that it may be
profitable to wake use of a low-radioactivity aggregate in the
construction of concrete enclosures for gamma-ray counting. They
were able to reduce the overall background by a factor of two by
installing their spectrometer behind concrete manufactured from
specially procured serpentinized ultramafic rock.
S,»_3._Jjadiation monitoring of calibration pads
ln-situ pad radioelement concentrations estimated from wet mix
samples or from a "dry" assay plus a moisture correction are not
reliable calibration grades until the errors on these grades due
to moisture variations and radon exhalation have been determined.
Such a determination involves a monitoring of the radiation from
the pads over a long period of time, preferably several years so
that the possible seasonal variation pattern is fully disclosed

- 83 -
a ta J «ram !*•• talt n into consideration «is an additional calibration.ijira nt «amity. The airport pads at Walker Field have been monitorednrn)r« sy $ft «»Matt ica fitly than any other existing facility, and the re-
®t (i(hiis **ff<a>rt clearly illustrate that a calibration pro-
*nmi3>t tee ffix«d forever in the moment the mix analyses are
r «rev S W d tt®m ft Jim» laboratory.
Tto# (HKjnik«riim«j of the Walter Field pads was started in 1977,
one year after the facility had been constructed. The
e has been that to accumulate window counts at intervals
one to two months using a large and thermally insulated sod i urn-
detector positioned centrally over each of the five pads.
Measurements carried out up to the end of 1978 were reported by
Stro*awold f 1978Ji who noted a significant increase in the el) con-
centrations of the Ui and H pads between October 1977 and April
1978. The tenporariiy increased ell values seen during the winter
months reminded of the observations previously made for the U
pad at Riato (Ltsvborg ct al., 1978), although the seasonal vari-
ation detected at Walker Field only amounted to ± 5% as opposed
to a variation of * 20% shown by the Rise pad. That this was
another example of a radon effect was supported by data from the
Walker Field weather office: There was a clear positive corre-
lation between the relative air humidity and the recorded eU
concentrations, so that a high output of 214ei radiation could
be explained by absorbed pad moisture acting as an internal radon
barrier.
Continued monitoring of the Walker Field pads over the years
1979, 1980, and 1981, executed by TMC staff, has revealed an an-
nual periodicity in all the pad concentrations (B.N. Key, per-
sonal communication). The cyclic variation shown by the radiation
from the pads is a consequence of the regular climate in Grand
Junction where the relative humidity exhibits a strong negative
correlation with the air temperature. The seasonal temperature
variation is essentially sinusoidal with a low of ~ 00C in
January and a high of ~ 36°C in July; the pad grades are accord-
ingly found to oscillate in a sinusoidal manner. While the in-
creased pad moisture in the winter produces the greatest eU con-
centrations, the same moisture attenuates the calibration radi-

- 84 -
at ion so that the K and eTh reference grades are reduced. This
situation is reversed in the summer when the pads have a depleted
Boisture content. Data recorded since Hay 1980 are based on a
very well temperature-stabilized detector contained in a monitor-
Ing vehicle 'nd suggest an annual variation of * 3% on the eU
calibration grades and a corresponding variation of between * 0.6
and * 1.91 on the K and eTh calibration grades. There is a direct
negative correlation between the air temperature and the eU
grades, while the R and eTh grades show a phase lag of one to two
months with respect to the temperature cycle. This may be taken
as evidence that the radon barrier is formed by easily evaporable
pad surface moisture. Gamma-ray attenuation, on the other hand,
is controlled by a more slow exchange of moisture between the air
and greater parts of the pads volumes.
In conjunction with the IAEA intercomparison experiment reported
in the next chapter, the spectrometer calibration pads at Rise
were monitored 27 times with a portable GR-410 between March
1980 and August 1984. Most of the readings were taken during the
period from spring to autumn which is the normal time for exe-
cuting routine instrument calibrations. The relative standard
deviations shown by the GR-410 window sensitivities recorded
over this monitoring period were 2.1% (K), 2.8% (eU), and 1.9%
(eTh). The highest sensitivities were measured in dry and warm
weather. It should be mentioned that the radon exhalation from
the U pad is without influence on these observations because the
uranium sensitivity is obtained from the count rates on two M
pads which do not exhibit a seasonal radon effect (Lovborg et
al., 1981).
A diminuation of a potassium or thorium calibration grade by 1%
corresponds to an absorption of 0.9% additional pad moisture
(formula (32)). One might ask if it would be possible to seal a
pad in order to prevent the pad from exchanging moisture with
the air or releasing radon present in the concrete pore spaces.
Silicone water-proofers exist which can be introduced as a mix
ingredient or applied as a surface coating (Rixom, 1978). It is
however unsafe how durable the sealing action will be over a
time span of years. Calibration pads might alternatively be
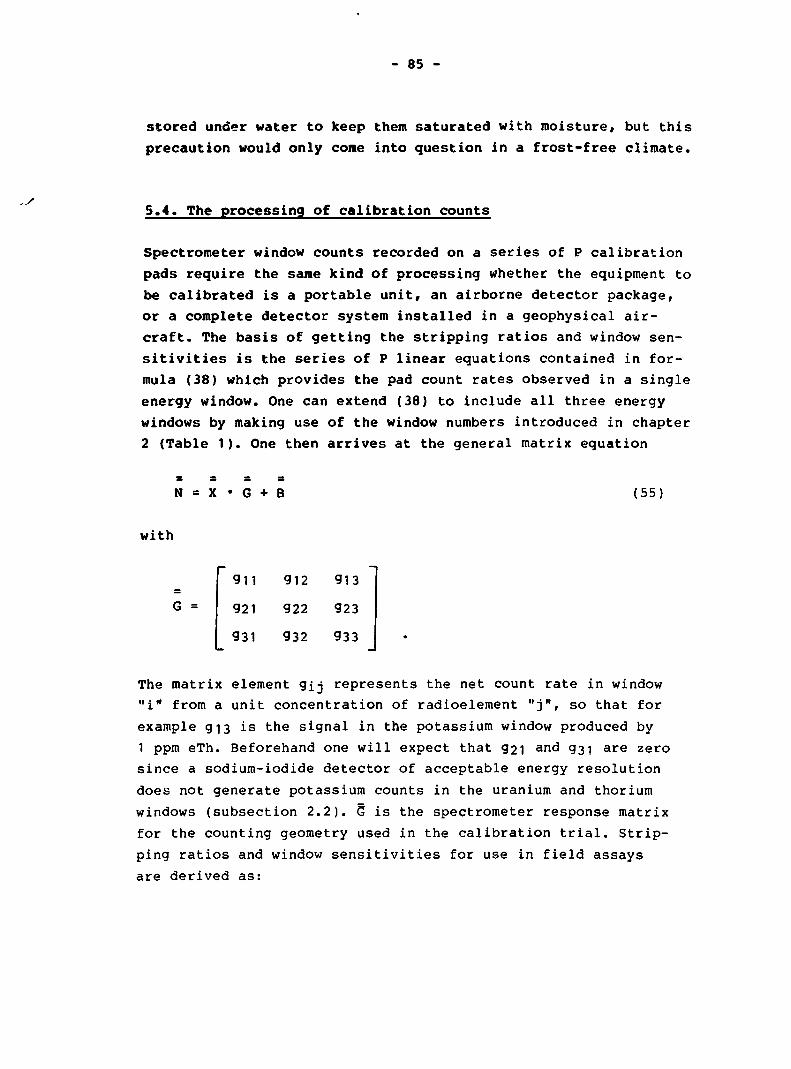
- 85 -
stored under water to keep them saturated with moisture, but this
precaution would only come into question in a frost-free climate.
5.4. The processing of calibration counts
Spectrometer window counts recorded on a series of P calibration
pads require the same kind of processing whether the equipment to
be calibrated is a portable unit, an airborne detector package,
or a complete detector system installed in a geophysical air-
craft. The basis of getting the stripping ratios and window sen-
sitivities is the series of P linear equations contained in for-
mula (38) which provides the pad count rates observed in a single
energy window. One can extend (38) to include all three energy
windows by making use of the window numbers introduced in chapter
2 (Table 1). One then arrives at the general matrix equation
N = X • G + B (55)
with
911
921
931
912
g22
932
913
923
933
G =
The matrix element gij represents the net count rate in window
"i" from a unit concentration of radioelement " j " , so that for
example gi3 is the signal in the potassium window produced by
1 ppm eTh. Beforehand one will expect that g2i and g3i are zero
since a sodium-iodide detector of acceptable energy resolution
does not generate potassium counts in the uranium and thorium
windows (subsection 2.2). 5 is the spectrometer response matrix
for the counting geometry used in the calibration trial. Strip-
ping ratios and window sensitivities for use in field assays
are derived as:

- 86 -
a - 923/933
B = 913/933
Y = 912/922
a - 932/g22
SR s
s T n «
• g 11/Fg
' 922/Fg
• 933/Fg
where Pg is the geometry factor estimated for the calibration
trial. Consequently, to perform a spectrometer calibration is
essentially a question of solving the Eq. (55) with respect
to G.
"or a calibration facility based on four pads, typically a KUTB
configuration, it may be decided to eliminate the B term as de-
scribed in subsection 4.1. The resulting 3><3 matrix equation
is
= = S
An = Ax • G (56)
which is analogous to formula (39) and has the solution
G = A-1 • An . (57)
The elements of G are here obtained by successive row-column
multiplications of the inverse matrix of pad concentration dif-
ferences and the associated matrix of count rate differences.
The B pad of the facility is used as a base in calculating these
differences. Such a procedure is used to process calibration
counts recorded with the five pads of the Walker Field facility.
Since only four sets of calibration counts can be processed at a
time, the calculation is performed for each of the combinations
KUTB, MUTB, KMTB, and KUMB. Stromswold and Kosanke (1978) incor-
porated the estimated errors on the pad grades and the statisti-
cal errors on the count rates and demonstrated how sub-sets of
calibration constants can be weighted together into a final cali-
bration result of known standard deviations.

- 87 -
A more sophisticated and generally applicable solution method is
based on the least squares principle applied directly to the Bq.
(55). In this approach the elements of G and B with accompanying
uncertainties are estimated through a weighted regression analy-
sis in three dimensions (one dimension per radioelement). It is
beyond the scope of this report to give a comprehensive presen-
tation of the associated mathematics, whereas the essential fea-
tures of the technique can be highlighted by considering the cor-
responding one-dimensional case in which there is only one inde-
pendent variable. This case is approximated in the recording of
thorium window counts on a series of T pads. The problem of fit-
ting a line to experimental points with uncertainties on both
co-ordinates was recently discussed by Zijp (1984). Since the
same problem occurs in another context in the following chapter,
it is relevant to discuss the general case of N points (xi,yjj
with the regression line
y = a + bx . (58)
The weight factor Wi expressing the statistical significance of
(Xj. ,yi.) in the regression of y on x must include all variance
associated with (xi,yi) in the y direction. This variance is the
square sum of <Jyj and b*oxi where Oyj and Ox^ are the stan-
dard deviations of yi and X£. Since the resulting weight factor
W1 = (a2. + b2 . CJ^1)-1 (59)
contains the unknown regression slope b, it is necessary to make
an initial guess of b and then to perform a series of regressions
until b does not show an appreciable change any longer. The for-
mulas for executing this iteration are presented in Table 20
which can be used to set up a program on a calculator such as the
HP-41. (The "i" index is omitted in Table 20). It is convenient
to guess a start value of b from an unweighted regression of Wi
= 1.
The inequality of regression slopes obtained from weighted and
unweighted linear fits is demonstrated in Fig. 44 which is a plot
of thorium count rates recorded with two hypothetical T pads
- 88 -
plus a B pad. The eTh reference grades are supposed to be 40,
80, and 10 ppm with standard deviations of 1, 3, and 0.5 ppm
respectively. It has furthermore been assumed that these grades
produced count rates of 5.1, 10.9, and 1.45 counts/s with stan-
dard deviations of 0.1, 0.4, and 0.05 counts/s due to counting
statistics. In the plot the uncertainties on the abscissa and
ordinate of each data point is shown as a resulting elliptical
68% confidence area. Since the data point for the most active
pad (the T-2) is ascribed the smallest statistical weight, the
weighted regression line is mainly controlled by the positions
of the two other data points. In this example the weighted and
the unweighted regression slopes, which represent experimental
thorium sensitivities, are not significantly different from each
other (this is seen from their estimated standard deviations).
That the weighted regression line is the one to be preferred
follows from the fact that its intercept with the ordinate axis,
i.e. the background count rate, is of the expected positive sign.
The three-dimensional regression case can be handled with the
computer program PADWIN developed by Dr. P. Kirkegaard of Riso
National Laboratory (Lovborg et al.f 1981). Unlike several simi-
lar programs used other places for the processing of calibration
counts, PADWIN provides a set of deterministic stripping ratios
and window sensitivities which do not depend on a random number
generator for simulating the effects of counting statistics and
uncertainties on the calibration grades. PADWIN is available in
Fortran-77 and has been installed on various computers at the
I.R.D. (Rio de Janeiro), Soreq (Israel), the CSIRO Division of
Mineral Physics (Sydney), and the GSC (Ottawa).
5.5. Theoretical accuracy of field determinations
Suppose that a recording of counts with a portable spectrometer
on a set of calibration pads has resulted in the stripping
ratios a, 3, Y, a and window sensitivities s^, su, s-rh with ac-
companying standard deviations. The spectrometer is now used in
a field assay where window count rates of n-|, n2, r>3 are re-
corded. Assuming that the corresponding background count rates
i
- 89 -
bi, b2# 03 have been determined, the Eq. (4) are used for cal-
culating three stripped count rates nifK, n2,U' n3,Th* These are
then divided by SR, Sy, Sfn to furnish the radioelement concen-
trations in the ground, XR, XJJ, x^h* What are the estimated stan-
dard deviations of these concentrations?
A partial answer to this problem was given in subsection 2.6
where experimental precision was discussed in terms of the sta-
tistical fluctuations shown by a background-corrected and strip-
ped window count rate. A few modest approximations made it pos-
sible to write niR, n2,U' a n d n3,Th ^" t n e common form
n « p - (k • q + b) (60)
where the meaning of the individual symbols were explained in
Table 7. The variance <J resulting from the counting statistics
of p, q, and b was given in formula (8). It follows from the lat
ter that a measured radioelement concentration x = n/s has an
absolute precision of
px - Jp/t + k2 q/t + a2 (61)
where s is the window sensitivity and t the counting time on the
assay spot. In this derivation the main stripping ratio "k" is
regarded as a fixed number of zero error.
The subject now is to estimate the accuracy of x, i.e. the devi-
ation between the true radioelement concentration of the ground
and the concentration recorded as an average of a large number of
repeat measurements. Accuracy may be stated as a standard devi-
ation Ax which represents a systematic error originating from the
uncertainties of the calibration constants required for the de-
termination of x. When Ax is known, it may be combined with the
standard deviation Px due to counting statistics so as to provide
an overall experimental standard deviation of
ax = 1^x + Ax * < 6 2 )

- 90 -
To calculate the A x associated with a particular energy window
one must know the standard deviations ag and a^ of the window
sensitivity and the stripping ratio k which is identical to "a"
in the thorium window, "a" in the uranium window, and "Y" in the
potassium window ("B" is of negligible statistical importance as
explained in subsection 2.6). With x = n/s and n given by formula
(60) one obtains the estimate
A v = x • S(QnZn)* + (cr/s) z (63)A Il o
where
"n = q * ak • (64)
A useful working expression is provided by replacing the inter-
fering count rate q*k by the known count rate "r" produced by
the two other assayed radioelements. The same substitution was
done in subsection 2.6 in deriving a priori detection and de-
termination limits, and the calculation of "r" in each energy
window was shown in Table 8. One can then get the accuracy of x
from the formula
A x = x • /(F • <>k/k)2 + (a g/s)
2
with (65)
F =s *x
The procedure for calculating A x in each spectrometer window is
summarized in Table 21. It should be noticed that (65) is an ap-
proximative formula which disregards the possible covariances of
the calibration constants. With a calibration facility that in-
cludes at least one pure T pad and one pure U pad the errors on
the stripping ratios can be reduced to any desired level by ac-
cumulating calibration counts for a sufficiently long time. For
such a calibration, formula (65) gives the simple result that
the relative error on an assayed radioelement concentration
equals the relative error on the window sensitivity used in the
assay. It would be very convenient if field accuracy could be
- 91 -
estimated in this manner in a number of practical situations,
and it is therefore relevant to investigate under which circum-
stances the first term under the square root sign in (65) may
be disregarded.
If one demands that
ak CTsF - — < 0.5 — , (66)
k s
then one commits a maximum error of 11% in setting Ax/x = os/s.
The intercomparison experiment reported in the next chapter in-
dicates that, in practice, the relative standard deviations of
stripping ratios and window sensitivities do not differ substan-
tially from each other, so that (66) can be reduced into the
condition: P < 0.5. For a portable GR-410 spectrometer with strip-
ping ratios a = 0.6 and a = 0.03 and a ratio of 2.5 between the
uranium and thorium sensitivities one finds that the Th/U ratio
of the assayed formation must be between 0.2 and 2. Therefore,
in a typical granitic environment of Th/U - 3 or greater, the
estimated eU concentrations will be less accurate than suggested
by the relative error on the uranium sensitivity. One should
consequently not omit the "F" term in the calculation of field
accuracy.
6. THE IAEA PADS INTERCOMPARISON EXPERIMENT 1980-84
6.1. Outline of the experiment
As stated in the Introduction, the present investigation was
started with the primary objective of executing calibration
trials with pads facilities available in 1979 in order to see to
what extent stripping ratios and window sensitivities recorded
with these facilities were in agreement with each other. If
highly consistent calibration results could be provided, then
there would be rather strong evidence that the radiometric grades
- 92 -
adopted at each facility are reliable. The instrument chosen for
the recording of calibration counts was a Geometries GR-410 pur-
chased by Ris0 National Laboratory in 1977. This particular unit
had been used for many field assays in Greenland and Denmark
without ever showing any electronic malfunctioning or failure.
It should therefore be qualified for use in an experiment that
would involve several air travels to pads facilities abroad.
Calibration counts taken on the spectrometer pads at Ris0 before
and after each visit to a facility in another country would be a
means of controlling whether it should be possible to avoid that
the calibration constants of the instrument changed during the
experiment. Such changes might be expected since the GR-410
carrying case was too voluminous to be brought along as hand bag-
gage on international flights and therefore would be exposed to
unavoidable bumps in airport baggage areas.
This originally planned exercise with calibration pads incorpor-
ated the airport facilities in Borlänge, Helsinki, Ottawa, and
Grand Junction plus the series of smaller pads in Mala and at
Bells Corners. These older calibration sites were visited with
the portable GR-410 between February 1980 and June 1981, and
the recorded stripping ratios and window sensitivities were pre-
sented at the OECD/NEA Symposium on Uranium Exploration Methods
held in Paris in June 1982 (L0vborg, 1982). Calibration results
from the pads at Bells Corners were not available at that time
since the Geological Survey of Canada had not finished the evalu-
ation of the pad grades when the symposium paper was written.
The Risa pads were included in this first processing of the ex-
perimental data. However, in the final report on the Ris0 fa-
cility it was noticed that the eU grades for the two M pads
of the facility were 18% greaiier than the grades suggested
by the average uranium sensitivity determined for the GR-410
spectrometer (L0vborg et al., '98I). In view of this observation
the idea arose to use the internationaliy calibrated GR-410 as a
tool for testing the reliability of pad radioelement concen-
trations. The data recorded with the instrument on the Rise pads
were actually used to revise the complete series of K, eU, and
eTh reference levels in these pads, so that the Rise facility
from now on can be regarded as a secondary calibration site

- 93 -
where the grades are tied to facilities in Canada, Finland,
Sweden, and the USA.
A further opportunity to use the GR-410 as a testing and grade-
assignment device became actual in the period from October 1982
to March 1984 during which time the facilities at Rio de Janeiro,
Villa 25 de Mayo, Lanseria, Soreq, and Sydney either were com-
pleted or were in the stage of being assigned radioelement con-
centrations based on laboratory assays. The pads here plus three
new pads added to the facility in Mala were all visited with the
instrument while rigorously using the Riso pads to verify that
the calibration constants of the instrument remained the same as
recorded during the preceding calibration phase. As illustrated
in subsection 6.6, it has been attempted to test a facility by
plotting the "dry" pad concentrations measured by sealed-can
gamma-ray counting against the concentrations determined with
the GR-410 spectrometer. In view of the more or less pronounced
seasonal dependence exhibited by in-situ pad grades (subsection
5.3), it is quite obvious that the observed regression slopes
can be no more than a crude test of the grades suggested by lab-
oratory determinations. On the other hand, the experiment has
given a fair idea of what a "normal" regression slope should be,
and in one particular case (the U pad at Lanseria) the in-situ
assay with the GR-410 turned out to give the answer to a grade-
assignment problem caused by inconsistent laboratory results
(Corner and Smit, 1983).
In both the calibration phase and the assay part of the exper-
iment it was attempted to perform the counting on the pads in a
geometry corresponding to 90% of 2 T or greater. Pads for port-
able spectrometers were counted with the GR-410 detector probe
standing centrally as illustrated in Pig. 25 in the case of the
pads at Villa 25 de Mayo. The various airport pads were most
often counted with the detector in a slightly elevated position
in order to enhance the signal from the more distant parts of
the pad surfaces. The elevation was provided by placing the de-
tector on a cardboard box or by suspending it on a tripod {Fig.
45). In all measurements a geometry factor was estimated by means
of formula (21) with "h" taken as the distance from the pad sur-
- 94 -
face to the centre of the sodium-iodide crystal. It lasted one or
two days to perform a counting trial with a facility, depending
on the number of pads to be counted and the grades of the pads.
Each pad was counted repeatedly using manual adjustments of the
spectrometer gain between the readings whenever such adjustments
were prompted by the error signal from the ^ 3 g a source attached
to the detector (subsection 2.4). Readings taken on K, U, T, and
M pads were not stopped until between 10,000 and 20,000 counts
had been accumulated in the relevant energy window. A survey of
the entire experimental program is presented in Table 22.
6.2. Statistical processing method
When several facilities are used for calibrating a spectrometer,
one is faced with the problem that the individually recorded
calibration factors have different uncertainties, mainly because
the concentration matrix X in Eq. (55) varies from one facility
to another with respect to size, internal structure, and stan-
dard deviations on the matrix elements. In the subsequent appli-
cation of the spectrometer for establishing a "normal" corre-
lation between monitored and analysed pad grades there is the
similar problerr. that the regression slopes obtained with the
tested facilities have statistical errors which vary in accord-
ance with the goodness of the linear fit. These problems are
solved by forming a weighted average of the involved experimen-
tal data and by using a variance test to decide how an associ-
ated standard deviation should be calculated. The procedure was
summarized by Lovborg (1982) and is explained here in somewhat
greater detail.
Let (x-|, X2,..., xN) represent N observations of estimated stan-
dard deviations (o-|, 02,..., °N)« Jt i-s assumed that a histogram
of x would furnish a normal distribution for N •* °°, and the task
is to assess the mean value x and the standard deviation 0 by
which the normal distribution is defined. In calculating these
two parameters, a single observation is ascribed a weight factor
of
W1 = \/a\ (67)
- 108 -
- 95 -
which is the inverse variance of the observation (cf. formula
(59)). The mean value is obtained as
x = (68)
while an estimate of <J2 may be provided in two different ways:
1) As a variance Vi describing the actual dispersion of the ob-
servations around x; 2) as an expected variance V2 suggested
by the known variances o^. The weighted expressions for the
calculation of Vi and V2 are
V1N
N-I{- - x2 (69)
and
V5 =^ Swi
(70)
If Vi comes out smaller than V2, the reason may be that the
standard deviations ((J-), o2,..., 0N) contain a fixed uncertainty
which did not show up as dispersion on the recorded data. Such
an uncertainty might be represented by a laboratory assay error
in repeat calibrations with one and the same pad facility. In
general a small observed variance V-) cannot be taken as evidence
that a then must be small, so it is the V2 variance which is
adopted to begin with. Only if Vi is significantly greater than
V2, in the statistical sense, one is forced to skip V2 in favour
of Vi since the experiment disclosed variability not included in
(a1t °2»•••' 0 N ) •
The test of Vi against V2 is performed in terms of the ratio
F = (71)
whose nominator and denominator are characterized by N-1 and N
degrees of freedom respectively. In the present study the null
hypothesis "Vj is not significantly greater than V2'1 is tested
_ 1 fiQ _
- 96 -
at a confidence level of 90%, i.e. there is a 10% chance of ac-
cepting the null hypothesis when it is actually false. The cor-
responding critical level F-|Q (N-1, N) is taken from a standard
tabulation, for example that presented by Koch and Link (1970).
Whenever P < F-|o (N-1, N) o is estimated as /V2, otherwise it is
estimated as
6.3. Result of calibration trials in 1980-81
The grades assigned to the pads used for calibrating the GR-410
spectrometer are shown on the relevant data sheets in the Ap-
pendix. For two of the facilities, Bells Corners and Walker
Field, the pad grades are based on assays of cured and sealed
mix samples, suggesting that the resulting window sensitivities
essentially represent count rate per unit of "wet" radioelement
concentration (subsection 5.1). The grades available for the pads
of the four other facilities (Uplands airport, Helsinki-Vantaa,
Borlänge, and Malä) originate from assays of powdered sample ma-
terial and would consequently be expected to produce window sen-
sitivities slightly greater than those recorded at Bells Corners
and Walker Field. Therefore, it was not beforehand anticipated
that the data generated in the experiment would result in an un-
ambiguous calibration of the instrument.
GR-410 window counts recorded in each performed calibration trial
were processed using the computer program PADWIN, so that the
stated uncertainties on the pad grades were taken into consider-
ation as described in subsection 5.4. The geometry factor esti-
mated in each trial was used for normalizing the set of calcu-
lated window sensitivities into 2v measuring geometry. It can be
seen from Table 22 that the Walker Field pads were visited twice,
in February and August 1980. The two counting dates nearly coin-
cide with the times of the year where the pad concentrations
reach their extreme values in the seasonal cycle established for
the facility (subsection 5.3). The expected radon exhalation from
the U and M pads in August manifested itself as a uranium window
sensitivity that was 6% smaller than the value measured in Feb-
ruary. The smaller gamma-ray attenuation due to the evaporation
- 110 -

- 97 -
of pad moisture in the summertime was also noticed, namely as 4
to 5% increased potassium and thorium window sensitivities from
the first to the second calibration trial. However, when the
variance test was applied to the two single trials, neither the
stripping ratios or the window sensitivities were found to vary
more than suggested by the standard deviations on the pad grades.
Consequently, it was possible to combine each pair of experimen-
tal calibration constants into an average value whose standard
deviation was taken as the square root of the calculated V2 vari-
ance.
The calibration performed in Sweden included two trials with the
airport pads in Borlänge and one trial with the original version
of the Mala facility. Since the four older pads at Mala were con-
structed from the supply of concrete bricks used for making the
Borlänge pads and therefore possess the same grades as the Iatt3r,
the trial at Mala was regarded as a repeat of the calibrations
done at Borlänge. In merging the three sets of data into a single
set of calibration constants the variance test gave statistical
significance on the stripping ratio a and the normalized uranium
sensitivity S(j. The standard deviations of these two calibration
constants were accordingly chosen as the square root of the V^
variance.
Having combined the repeat calibrations in the USA and Sweden,
the recorded spectrometer counts produced five calibration re-
sults obtained in four countries. The series of experimental
stripping ratios and window sensitivities are presented in
Tables 23 and 24 respectively. Because the pad grades of the
facilities at Uplands airport and Bells Corners are based on
different laboratory reference materials, the two Canadian re-
sults have not been merged together. As opposed to what was ex-
pected beforehand, the window sensitivities recorded at Bells
Corners and Walker Field are not consistently smaller than the
sensitivities measured with the other facilities. This result
shows that the distinction between "wet" and "dry" pad grades
may be obscured by experimental uncertainties, in particular
laboratory assay error and errors on the estimated geometry
factors. The bottom of each table shows the estimated mean
- 111 -
- 98 -
calibration constants with associated standard deviations ^
and /V2 and variance ratio F. Since none of the F ratios exceed
the critical value FIQ stipulated by the number of single ob-
servations, o is estimated as AF2 in all cases. It therefore
appears that the errors ascribed to the pad grades used for cali-
brating the instrument are realistic, i.e. they have not been
appreciably underestimated. (This statement may not be valid for
the error of * 0.5 ppm eU assumed for the U pads in Sweden). The
most valuable information is contained in the recorded window
sensitivities SR, Sy, and s^h because these calibration constants
are referencing absolute radiometric concentration levels. Table
24 shows that the window sensitivities measured with the Walker
Field facility are the least uncertain (except for the s^ result
obtained in Sweden), so that this facility is given a strong
weight in ascribing a representative set of average sensitivities
to the spectrometer. Since the reference grades for the Walker
Field pads include the effect of pad moisture, the trials pre-
sumably resulted in a calibration that can be classified as "wet".
The five single calibration results can be assumed to be com-
pletely independent of each other because they are provided by
pad grades which have been estimated by procedures and reference
materials that were not the same from one calibration to the next
It therefore makes sense to regard the data as the outcome of an
experiment in which all the uncertainty is due to random error
sources. In an experiment of this kind it is permissible to esti-
mate the standard deviation of x as a/*^, and this has been done
for each determined calibration constant in Tables 23 and 24
where <J//N is given both absolutely and in percent of x. It can
be seen that the window sensitivities and main stripping ratios
determined for the spectrometer are 1 to 2% uncertain. The ques-
tion is whether it would be safe to adopt these small calibration
uncertainties in the monitoring program executed after the cali-
bration period. This problem is dealt with in subsection 6.5.
- 112 -
- 99 -
6.4. Calibration checks
Chapter 2 included a description of computer-simulated pulse
spectra which were based on the combined use of terrestrial flux
calculations and a detector response model providing the spec-
tral components generated by a 76 * 76 mm sodium-iodide scintil-
lator {full-energy peak, annihilation escape peaks, and Compton
continuum). Such spectra were used to predict the stripping
ratios and window sensitivities of a GR-410 spectrometer whose
detector was ascribed an energy resolution of 7.6, 8.8, or 10.0
percent. These theoretical data, listed in Tables 2 and 3, may
serve as a check on the experimental GR-410 calibration constants
evaluated in the preceding subsection. As far as the stripping
ratios are concerned, the measured values of 6 and Y are con-
siderably smaller than their calculated counterparts. This ob-
servation may suggest that the potassium window of the instrument
was narrower than the 0.21 MeV aimed at by the manufacturer when
he adjusted the voltages which control the window widths. The
calculated values of a, on the other hand, are in the range from
0.577 to 0.595 which is in very good agreement with the exper-
imental mean value of 0.583 ± 0.009. Assuming an intermediate
energy resolution of 8.8% for the calibrated detector probe, the
ratios between calculated and experimental window sensitivities
amount to 1.18 (K window), 1.14 (U window), and 1.13 (Th window).
One would expect a set of slightly overestimated theoretical win-
dow sensitivities because the gamma-ray absorption in the metal
sheath and other parts of the detector unit was disregarded in
the spectrum calculations. It is very satisfactory that the ex-
periment indicated a ratio of 2.54 ± 0.06 between the U and Th
sensitivities since this value is completely consistent with a
theoretical ratio of between 2.52 (10.0% resolution) and 2.59
(7.6% resolution).
An entirely different kind of check was performed by measuring
the gamma-ray exposure rates on the pads of two of the used cali-
bration facilities, namely those at Walker Field and Borlänge.
Table 4 showed factors for calculating the exposure rates one
meter above an infinite soil medium of known radioelement con-
centrations. If similar factors were available for calibration
- 113 -
- 100 -
pads of various dimensions, it would be possible to get an idea
of the validity of the pad grades from monitoring trials with
radiological instruments or radiation dosimeters. A gamma-ray
transport calculation for the finite geometry on a calibration
pad is more complicated than the corresponding calculation for
infinite sources. The exposure rates per radioelement concen-
tration unit shown in Table 25 are based on the Monte-Carlo
transport code GAMO used to get the theoretical exposure rates
for the pads at Riso (Lavborg et a]., 1981). It should be noted
that large calibration pads (2R = 8 to 10 m) produce surface ex-
pose rates that are about 15% smaller than the exposure rates
from an infinite source at 1 m. This is because the atmospheric
backscatter contribution of low-energy gamma rays is distributed
over a very large area, independently of the source dimensions,
so that this contribution remains undetected when the source is
less than several tens of meters across (Lovborg et al., 1980).
The exposure rates on the pads at Walker Field and Borlänge were
recorded with Reuter-Stokes high-pressure argon ionization
chambers placed centrally on the pad surfaces. These instruments
are based on a design developed by the former US Health and
Safety Laboratory and permit a reliable determination of en-
vironmental exposure rates down to a few microroentgens per hour
(DeCampo et al., 1972). Both chambers used were 25 cm in di-
ameter and mounted in 30 * 30 x 30 cm aluminium boxes so that
the readings should be comparable to the exposure rates at 15 cm
suggested by the dimensions and radioelement concentrations of
the pads. Each chamber was calibrated by means of platinum-
encapsulated 226R 3 sources of certified activity and an estimated
gamma-ray constant of 0.825 R#m2>h~1*g~1 (Nachtigall, 1969). In
the Walker Field experiment this was done using the "shadow-
shield" method, while the calibration performed in conjunction
with the Borlänge trial was based on the flux of direct and
ground-scattered gamma rays obtained with the radium source
supported by a thin pole. The two calibration techniques were
discussed by B0tter-Jensen (1982). In using these calibrations
for measuring the exposure rates on concrete pads, it is rel-
evant to correct the ionization-chamber readings by +3% on K
pads and by -2% on U, T, and M pads. These corrections are sug-
gested from runs with the GAMO code in which the slightly en-
- 114 -
- 101 -
hanced energy response of the chambers between 0.06 and 0.3 MeV
was taken into consideration.
The exposure rates on the Walker Field pads were measured three
times between February and July 1980, while only one measurement
was performed with the Borlänge facility. The result of these
experiments is shown in Table 26 where calculated and experi-
mental exposure rates are stated as difference values with re-
spect to the B pads of the two facilities. Calculated exposure
rates include the standard deviations on the pad grades as well
as Monte Carlo statistics and uncertainties on the gamma-ray
emissions from the radioelements. The experimental data for the
Walker Field facility are averages of the three single determi-
nations; no result is given for the K pad because this result
was very imprecise and therefore contained no usable information.
From the ratios given in the last column of the table it can be
seen that, when the uncertainties are taken into consideration,
the calculated and measured exposure rates do not deviate sig-
nificantly from each other. This observation supports the val-
idity of the grades ascribed to the six pads tested in the trial.
However, it cannot be denied that the calculated average values
systematically exceed their experimental counterparts by several
percent. A deviation like this would be expected if the pad
grades did not include all the moisture present in the pads, and
it might be suggested that the experiment was on the point of
revealing an unnoticed additional moisture content in the Walker
Field pads.
6.5, Instrumental long-term stability
Figure 46 is a plot of the thorium window sensitivity and "y"
stripping ratio recorded with the GR-410 spectrometer in the 27
control calibrations executed on the Riso pads in the course of
the entire experiment. Calibration constants measured in these
trials are based on the revised pad grades obtained by processing
the first 13 control measurements (tho^^fTom 1980-81) with the
evaluated calibration data in Tables 23 and 24. The revised
grades for the Riso facility v/ere presented by Lovborg (1983);
- 115 -
- 102 -
they include the uncertainties due to the varying amount of pad
moistute over the year and the associated variable radon exha-
lation from the U pad. The use of Sj n ("sT" in Fig. 46) and Y to
give a visual impression of the instrumental long-term stability
stems from the fact that these two calibration constants are
positively correlated with the photomultiplier gain (Table 5).
Accordingly, if the gain monitoring circuit of the instrument
should begin to offset the energy calibration in the positive or
negative direction, S^n and y should both reflect such a mal-
function by changing their values in the same direction. From
the plot of Y it is not possible to see any systematic variation
in the data. In fact, the fluctuations shown by the three main
stripping ratios were not greater than suggested by counting
statistics and the standard deviations assigned to the pad con-
centrations. Only the small "a" stripping ratio showed a surplus
variability which may be explained by the radon effect in the U
pad and therefore is inconclusive.
For the thorium window sensitivity it is possible to distinguish
a seasonal influence, especially over the coherent data-recording
period from mid 1982 to mid 1983. The first data point in 1983
(recorded on 11 February) corresponds to an almost 6% reduction
of the thorium sensitivity typically measured in the summer
months. This is an example of how much an instrument calibration
can be biassed when the readings are taken with the pad surfaces
exposed to an outdoor moisture such as that existing in Denmark
in the winter months. In the present context the task is to
assess the maximum variability exhibited by the thorium sensi-
tivity due to instrumental factors. From Fig. 46 it appears that
the summer readings taken with the instrument in the years from
1980 to 1983 have a high degree of consistency. The resulting 14
data points were analysed for dispersion using the assumption
that the calculated V-| variance could be explained by counting
statistics alone, i.e. the uncertainties on the pad grades were
not included in estimating the V2 variance. The variance test
was not significant, and it was concluded that the relative stan-
dard deviation on s h from sources other than counting statistics
was smaller than 0.5%. This contribution is insignificant as com-
pared to the relative error of 1.2% adopted for the thorium win-
dow sensitivity of the instrument (Table 24).
- 116 -

- 103 -
In total the test calibrations undertaken from the beginning of
the experiment and up to August 1983 have not revealed any change
in the performance of the monitoring instrument. It is actually
surprising that a portable spectrometer can maintain its cali-
bration characteristics during more than four years of repeated
airline transport between destinations where the climatic con-
ditions often were extremely different from each other. Such a
calibration cannot of course last forever. From Fig. 46 one ob-
serves that the last determination of thorium sensitivity, from
August 1984, did not give the expected value of about 0.129
counts/s per ppm eTh, but rather suggested a 2% lower value of
0.126 counts/s per ppm eTh. This break in the pattern from the
preceding years might be a first indication of an irreversible
change in the instrument performance (possibly reduced energy
resolution), but it could also be an indirect effect of the moist
Danish summer in 1984.
6.6. Measurement of pad in-situ grades
In using the GR-410 as a tool for measuring pad radioelement
concentrations, the B pad of each monitored facility was ascribed
concentrations of zero. Counts recorded on e B pad were accord-
ingly regarded as background signals, so that the concentrations
measured in the other pads were derived relatively to the con-
centrations in the B pad. This way of stating pad grades corre-
sponds to specifying the basic Ax matrix of the facility (sub-
section 4.1). The precision and accuracy of each in-situ assay
were evaluated using the working expressions in Tables ~< ana 21
and were then combined into overall standard deviation on the
measured grades by means of formula (62). No attempt was made to
estimate the accuracy of the geometry factors used for calculat-
ing the 2w window sensitivities of the instrument back into
actual pad geometries. The recorded concentration differences
are shown on the relevant data sheets in the Appendix together
with the corresponding absolute grades suggested by sealed-can
gamma-ray counting of powdered pad material. Grade differences
stated for the Riso facility are based on the 13 monitoring
trials executed in 1980-81, i.e. during the period when the in-
- 117 -

- 104 -
strument was calibrated. Uncertainties on these grade differ-
ences are either represented by /v j or ^V2 , depending on the
outcome of the associated variance test. The F ratio for the eU
concentrations of the U pad was highly significant as one could
expect from the strong seasonal radon effect established for
this particular source.
The result of applying weighted, linear regression fits to the
series of experimental in-situ grades and laboratory grades is
presented in Table 27. Associated K, eU, and eTh regression
plots are shown in Figs. 47 to 49 using the data from the CSIRO
facility in Sydney as examples. Since the calibration of the
GR-410 is believed to reference "wet" pad radioelement concen-
trations, the monitored grades should include the moisture con-
tents in the pads under test. Furthermore, for all facilities
with the possible exception of Soreq and Lanseria the laboratory
assays were performed with concrete powder that had been dried
for 24 hours at 105 to 1100C. A calculated regression slope,
i.e. the ratio between analysed and monitored pad grades, should
therefore provide the ratio
1 + w (72)
where w is the absorbed pad moisture (subsection 3.4). In sub-
section 5.1 it was argued that the extreme limits for moisture
absorption in concrete of ~ 20% porosity amount to 2% (low) and
10% (high). Consequently, one would expect experimental dry-to-
wet concentration ratios of between 1.02 and 1.10.
Many of the ratios reported in Table 27 match the predicted
variation range, but there are several noticeable exceptions
from the general pattern. The fact that some of the U and Th
dry-to-wet ratios are smaller than unity shows that the varia-
bility of the data cannot be explained from the moisture hypoth-
esis alone. It must rather be concluded that the uncertainties
contributed by analytical sampling and assay error as well as
error on the estimated geometry factors tend to obscure the
plain moisture effect. Also, as intimated by the calibration
checks in subsection 6.4, it cannot be guaranteed that the GR-
- 118 -

- 105 -
410 was truly calibrated in terms of "wet" pad radioelement
concentrations. One can easily imagine that the combined effect
of the experimental uncertainties may push a recorded dry-to-wet
ratio upwards, although it is hard to believe that this is the
reason why a few of the ratios are considerably greater than
1.10.
To obtain an identification of the real outsiders in the data
material, the variance test was applied iteratively to the ratios
provided by each radioelement. This was done so that the most
suspicious ratio was left out in a test prompted by a preceding
test which revealed statistical significance. The procedure re-
sulted in the mean dry-to-wet concentration ratios presented at
the bottom of Table 27. In view of the error sources involved
one cannot use these results to assess the average moisture con-
tents in the tested pads, whereas it is quite possible to es-
tablish an upper limit of about 1.10 for the ratio between
an analysed and a monitored pad grade. Consequently, facilities
characterized by a ratio which exceeds ~ 1.10 must contain pads
of either overestimated laboratory grades or underestimated
in-situ grades.
The greatest diverging concentration ratios are observed for
the facility at Villa 25 de Mayo. This is the only example of
unsually large potassium and thorium dry-to-wet ratios derived
from the experiment. One can explain the results for these two
radioelements as a geometry error on the estimated in-situ
grades. The Argentine pads are only one meter in diameter which
is the smallest source dimension involved in the monitoring ex-
periment. They were monitored using a geometry factor of 0.86
which is the value obtained from formula (21) with "h" taken as
the distance of 70 mm from the bottom face of the GR-410 detec-
tor unit to the centre of the sodium-iodide crystal. In subsec-
tion 3.2 it was pointed out that formula (21) is inadequate for
estimating geometry factors over sources whose radii are equal
to ~ 0.5 m or smaller. The availability of the curves in Fig. 30
makes it possible to estimate an improved geometry factor of
0.80 for the monitoring of the Villa 25 de Mayo facility (using
a value of h/R = 0.14 and interpolating between the curves for
- 119 -

- 106 -
h/R =0.10 and h/R = 0.15). This correction step reduces the
dry-to-wet concentration ratios for potassium, uranium, and
thorium to 1.15 ± 0.05, 1.70 ± 0.03, and 1.08 ± 0.02, respect-
ively. At least the thorium result is now consistent with the
observations from the other facilities.
The interesting outcome of the test are three uranium concen-
tration ratios which exceed the suggested upper limit of 1.10.
The first anomalous U result is the corrected ratio of 1.70 ±
0.03 obtained for the pads at Villa 25 de Mayo. The two ad-
ditional high U ratios are recorded for the facilities at Ris0
and Rio de Janeiro; they amount, respectively, to 1.25 ± 0.03
and 1.14 ± 0.03. A ratio of 1.14 is not conspicuously high.
However, a plot of the laboratory eU grades for the eight
Brazilian pads against the measured in-situ grades makes it
possible to identify two of the M pads, number 3 and 5 (Fig.
36), as producers of anomalously low U radiation with an associ-
ated dry-to-wet ratio of 1.25 ± 0.03. As far as the Risa fa-
cility is concerned, the U concentration ratio is provided by
two M pads plus a U pad of seasonally varying radon exhalation.
In the 13 monitoring trials performed with the Riso pads in
1980-81, the eU grade of the U pad varied between 131 to 194
ppm, corresponding to a relative grade fluctuation of ± 19%.
Over the same period the eU grades of the M pads showed a varia-
bility of less than ± 4%. The U pad therefore had a much smaller
statistical weight than the M pads in calculating the regression
slope used for estimating an average dry-to-wet uranium ratio
for the facility.
It layfi near at hand to conclude that a radon effect has been
detected for the 0 pads at Villa 25 de Mayo and the M pads at
Rio de Janeiro and Riso. One can make a conservative estimate of
the suggested exhalation by calculating a relative radiation
loss of
Ai, b - 1.10(73)
- 120 -

- 107 -
where "b" is the dry-to-wet ratio (regression slope) recorded
for the eU pad grades. Based on this expression, the monitoring
revealed an exhalation of 35% for the Argentine U pads. Pads M-3
and M-5 at Rio de Janeiro and pads M-1 and M-2 at i:iso similarly
appear to exhibit an exhalation of 12%.
Having been presented to the result for the facility at Villa 25
de Mayo, staff of the C.N.E.A. in Mendoza flooded a similar U pad
with water and noticed that the gamma radiation from the pad in-
creased by 34% over a period of four weeks (F.J. Muniz, per-
sonal communication). The moisture supplied to the pad in the
experiment was estimated to be 12%, corresponding to a gamma-ray
attenuation factor of 1.13 for the pad in the soaked condition
(formula (32)). Consequently, the pad became 38% rather than 34%
more radioactive when the radon flow through the pad surface was
stopped by water in the concrete porespaces. This increase sug-
gests an exhalation of 38/138 = 28%, in reasonable agreement
with the monitored exhalation of 35%.
The applicability of U or M pads which emanate radon all depends
on the seasonal variability of the exhalation. The U pad at Riso
is only applicable for determining "a" and Y stripping ratios
because of the variable radiation output from it, while the two
M pads of the facility permit a reliable determination of uranium
window sensitivities by virtue of essentially constant eU cali-
bration grades which include the radiation diminuation due to
radon exhalation. A nearly constant exhalation rate probably re-
sults from a partly permeable radon barrier formed by excessive
concrete surface moisture which is sustained all the year round
by air humidity.
- 108 -
ACKNOWLEDGEMENTS
During the visits to calibration facilities abroad the author
was met with great hospitality/ scientific enthusiasm, and
willingness to help and supply information. It is impossible to
thank all the individuals who contributed to the success of the
pads intercomparison experiment. Their respective organizations
are or were: Comision Nacional de Energia Atömica (Argentina);
CSIRO Institute of Energy and Earth Resources (Australia);
Comissao Nacional de Energia Nuclear (Brazil); Geological Survey
of Canada; Geological Survey of Finland; Israel Atomic Energy
Commission; Nuclear Development Corporation of South Africa;
Swedish Geological; US Department of Energy; and Bendix Field
Engineering Corporation (USA). Special thanks are due to Robert
L. Grasty of the Geological Survey of Canada for a very inspiring
exchange of views and information at meetings and by correspon-
dence. The author is furthermore grateful to his colleagues in
the Nuclear Geophysics Group, in particular Erik Mose, for their
assistance in this research project. The exposure rate measure-
ments on the Borlänge pads were performed by Lars Batter-Jensen
of Risa's Health Physics Department. Sam Marutzky of Bendix
Field Engineering Corporation monitored the exposure rates on the
airport pads in Grand Junction. Lis Vang Christensen typed the
manuscript with assistance from Kirsten Hansen, and Tora Skov,
Agnete Michelsen, and Anna Taboryska made the drawings. The
International Atomic Energy Agency was al./ays very responsive and
flexible in negotiating the renewal contracts.

- 109 -
REFERENCES
ADAMS, J.A.S. and FRYER, G.E. (1964). Portable Y-ray spectro-
meter for field determination of thorium, uranium, and
potassium. The Natural Radiation Environment (Univ. Chicago
Press, Chicago) 577-596.
ADAMS, J.A.S. and GASPARINI, P. (1970). Gamma-Ray Spectrometry
of Rocks (Elsevier, Amsterdam) 295 pp.
AUSTIN, S.R. (1975). A laboratory study of radon emanation from
domestic uranium ores. Radon in Uranium Mining (International
Atomic Energy Agency, Vienna) 151-163.
AVIV, R. and VULKAN, U. (1983). Airborne gamma-ray survey over
Israel: The methodology of the calibration of the airborne
system. Rep. No. Z.D. 58/82 (Soreq Nuclear Research Center)
65 pp.
BARRETTO, P.M.C, CLARK, R.B., and ADAMS, J.A.S. (1972).
Physical characteristics of radon-222 emanation from rocks,
soils and minerals: Its relation to temperature and alpha
dose. The Natural Environment II (USERDA, Springfield,
Virginia) vol. 2, 731-740.
BECK, H.L. (1972). The absolute intensities of gamma rays from
the decay of 238U and 232Th. HASL-262 (US Atomic Energy
Comm.) 14 pp.
BERGER, M.J. and SELTZER, S.M. (1972). Response functions for
sodium iodide scintillation detectors. Nucl. Instrum. Meth.
104, 317-332.
B0TTER-JENSEN, L. (1982). Calibration and standardization of in-
struments for background radiation monitoring. Proc. Third
Int. Symp. on Radiation Protection - Advances in Theory and
Practice (Society for Radiological Protection, Inverness,
Scotland, 6-11 June 1982) 685-690.
BRISTOW, Q. (1983). Airborne Y-ray spectrometry in uranium ex-
ploration. Principles and current practice. Int. J. Appl.
Rad. and Isot. 34, 199-229.
ruary. The smaller gamma-ray
- 110 -
CORNER, B., TOENS, P.D., RICHARDS, D.J., VAN AS, D., and
VLEGGAAR, C M . (1979). The Pelindaba facility for
calibrating radiometric field instruments. Atomic Energy
Board, Pretoria, Rep. PEL-268, 23 pp.
CORNER, B. and SMIT, C.B.J. (1983). The construction of a radio-
metric calibration facility at Lanseria airport, Republic
of South Africa. Nucl. Develop. Corp. South Africa, Rep.
PER-77, 24 pp.
CROUTAMEL, C E . (1970). Applied Gamma-Ray Spectrometry. Second
revised and enlarged edition by F. Adams and R. Dams
(Pergamon, Oxford) 753 pp.
CULOT, M.V.J., OLSON, H.G., and SCHIAGER, K.J. (1976). Effective
diffusion coefficient of radon in concrete, theory and method
for field measurements. Health Phys. 29./ 263-270.
CURRIE, L.A. (1968). Limits for qualitative detection and quanti-
tative determination - application to radiochemistry. Ana-
lytical Chemistry 4_£, 586-593.
DARNLEY, A.G., BRISTOW, Q., and DONHOPFER, D.K. (1969). Air-
borne gamma-ray spectrometer experiments over the Canadian
shield. Nuclear Techniques and Mineral Resources (Inter-
national Atomic Energy Agency, Vienna) 163-186.
DARNLEY, A.G. and GRASTY, R.L. (1971). Mapping from the air by
gamma-ray spectrometry. Geochemical Exploration (The Canadian
Institute of Mining and Metallurgy, special volume 11)
485-500.
DARNLEYr A.G. (1973). Airborne gamma-ray survey techniques -
present and future. Uranium Exploration Methods (Inter-
national Atomic Energy Agency, Vienna) 67-108.
DARNLEY, A.G. (1977). The advantages of standardizing radiometric
exploration measurements, and how to do it. Can. Min.
Metallurg. Bull., February 1977, 1-5.
DECAMPO, J.A., BECK, H.L., and RAFT, P.D. (1972). High pressure
argon ionization chamber systems for the measurement of en-
vironmental exposure rates. HASL-260 (US Atomic Energy
Comm.) 69 pp.
DICKSON, B.H., BAILEY, R.C, and GRASTY, R.L. (1981). Utilizing
multi-channel airborne gamma-ray spectra. Can. J. Earth Sci.
18, 1793-1801.

- 111 -
DICKSON, B.L., CLARK, G.J., and McGREGOR, B.J. (1979). Technique
for correcting for overburden effects in ground level radio-
metric surveys of uranium ore bodies. Geophys. £4_, 89-98.
DICKSON, B.L., CHRISTIANSEN, E.M., and L0VBORG, L. (1982). Re-
ference materials for calibration of laboratory gamma-ray
analyses. Uranium Exploration Methods (OECD, Paris) 687-698.
DICKSON, B.L. and L0VBORG, L. (1984). An Australian facility for
the calibration of portable gamma-ray spectrometers.
Bull. Aust. Soc. Explor. Geophys. (in press).
DOIG, R. (1968). The natural gamma-ray flux: in-situ analysis.
Geophys. 3_3_, 311-328.
ENDT, P.M. and VAN DER LEUN, C. (1973). Energy levels of A = 21-44
nuclei (V). Nucl. Phys. A214, p. 436.
EVANS, R.D. (1955). The Atomic Nucleus (McGraw-Hill, New York)
972 pp.
EWBANK, W.B. (1980). Status of transactinium nuclear data in the
Evaluated Nuclear Structure Data File. IAEA-TECDOC-232 (In-
ternational Atomic Energy Agency, Vienna) 109-141.
FAYE, G.H., BOWMAN, W.S., and SUTARNO, R. (1979). Uranium ore
BL-5 - a certified reference material. CANMET Report 79-4,
11 pp.
FOOTE, R.S. (1978). Development of a USERDA calibration range
for airborne gamma radiation surveys. Aerial Techniques for
Environmental Monitoring (Am. Nucl. Soc, La Grange Park,
Illinois) 158-174.
GEORGE, D.C. and KNIGHT, L. (1982). Field calibration facilities
for environmental measurement of radium, thorium, and
potassium. GJ/TMC-01(82), UC-70A (US Department of Energy,
Technical Measurements Center, Grand Junction Area Office)
10 pp. + Appendix.
GEORGE, D.C, NOVAK, E.F., and PRICE, R.K. (1984). Calibration-
pad parameter assignments for in-situ gamma-ray measurements
of radium, thorium and potassium. GJ/TMC-17, UC-70A (US
Department of Energy, Technical Measurements Center, Grand
Junction Area Office) 105 pp.
GRASTY, R.L. and DARNLEY, A.G. (1971). The calibration of gamma-
ray spectrometers for ground and airborne use. Geol. Surv.
Canada, Paper 71-17, 27 pp.
- 112 -
GRASTY, R.L. and CHARBONNEAU, B.W. (1974). Gamma-ray spectrometer
calibration facilities. Geol. Surv. Canada, Paper 74-1B,
69-71.
GRASTY, R.L. (1975a). Uranium measurement by airborne gamma-ray
spectrometry. Geophys. 4_0_, 503-519.
GRASTY, R.L. (1975b). Atmospheric absorption of 2.62 MeV gamma-
ray photons emitted from the ground. Geophys. ££, 1058-1065.
GRASTY, R.L. (1976). A calibration procedure for an airborne
gamma-ray spectrometer. Geol. Surv. Canada, Paper 76-16,
9 pp.
GRASTY, R.L. (1979). Gamma ray spectrometric methods in uranium
exploration - theory and operational procedures. Geophysics
and Geochemistry in the Search for Metallic Ores (P.J. Hood,
ed.; Geol. Surv. Canada, Econ. Geol. Rep. 31) 147-161.
GRASTY, R.L. (1982). Utilizing experimentally derived multi-chan-
nel gamma-ray spectra for the analysis of airborne data.
Uranium Exploration Methods (OECD, Paris) 653-669.
GRASTY, R.L., BRISTOW1 Q., CAMERON, G.W., DYCK, W., GRANT, J.A.,
and KILLEEN, P.G. (1982). Primary calibration of a laboratory
gamma-ray spectrometer for the measurement of potassium,
uranium and thorium. Uranium Exploration Methods (OECD,
Paris) 699-712.
GRASTY, R.L. (1984). Airborne gamma-ray surveys and radon
emanation. Newsletter on R & D in Uranium Exploration
Techniques (OECD Nuclear Energy Agency, Paris) No. 5, 16-18.
GRASTY, R.L., CARSON, J.M., CHARBONNEAU, B.W., and HOLMAN, P.B.
(1984). Natural background radiation in Canada. Geol. Surv.
Canada, Bull. 360, 39 pp.
GYURCSAK, J. and LENDA, A. (1979). On the response functions of
NaI(Tl) detectors to terrestrial gamma-radiation. Int. J.
Appi. Rad. and Isot. 3\_, 169-177.
HERHOLDT, A.D., JUSTESEN, C.F.P., NEPPER-CHRISTENSEN, P., and
NIELSEN, A. (1979). Beton-Bogen (Aalborg Portland) 719 pp
(in Danish).
HUBBELL, J.H. (1982). Photon mass attenuation and energy-absorp-
tion coefficients from 1 keV to 20 MeV. Int. J. Appi. Rad.
and Isot. 33, 1269-1290.

- 113 -
IAEA (1974). Recommended instrumentation for uranium and thorium
exploration. Techn. Rep. Ser. No. 158 (International Atomic
Energy Agency, Vienna) 93 pp.
IAEA (1976). Radiometric reporting methods and calibration in
uranium exploration. Techn. Rep. Ser. No. 174 (International
Atomic Energy Agency, Vienna) 57 pp.
IAEA (1979). Gamma-ray surveys in uranium exploration. Techn.
Rep. Ser. No. 186 (International Atomic Energy Agency,
Vienna) 90 pp.
IAEA (1982). Borehole logging for uranium exploration - a manual.
Techn. Rep. Ser. No. 212 (International Atomic Energy Agency,
Vienna) 275 pp.
IVANOVICH, M. and HARMON, R.S. (1982). Uranium Series Disequi-
libriums Applications to Environmental Problems (Clarendon,
Oxford) 571 pp.
KILLEEN, P.G. and CARMICHAEL, CM. (1970). Gamma-ray spectrometer
calibration for field analysis of thorium, uranium and potas-
sium. Can. J. Earth Sci. 1_, 1093-1098.
KILLEEN, P.G. (1978). Gamma-ray spectrometer calibration fa-
cilities - a preliminary report. Geol. Surv. Canada, Paper
78-1A, 243-247.
KILLEEN, P.G. (1979). Gamma ray spectrometric methods in uranium
exploration - application and interpretation. Geophysics and
Geochemistry in the Search for Metallic Ores (P.J. Hood, ed.;
Geol. Surv. Canada, Econ. Geol. Rep. 31) 163-229.
KIRKEGAARD, P. and L0VBORG, L. (1979). Program system for compu-
tation of the terrestrial gamma-radiation field. Ris0-R-492,
31 pp.
KIRKEGAARD, P. and L0VBORG, L. (1980). Transport of terrestrial
Y radiation in plane semi-infinite geometry. J. Comput. Phys.
3±, 20-34.
KOCH, G.S. and LINK, R.F. (1970). Statistical Analysis of Geo-
logical Data (Wiley, New York) 375 pp.
KOCHER, D.C. (1981). Radioactive decay data tables (Technical
Information Center, US Department of Energy) 221 pp.
KOGAN, R.M., NAZAROV, I.M., and FRIDMAN, Sh.D. (1976). Funda-
mentals of Gamma Spectrometry of Natural Media (Atomizdat,
Moscow) 368 pp (in Russian).
gested from runs with tne UAMU coae in
- 114 -
LARSON, R.E. and BRESSAN, D.J. (1980). Radon-222 as an indicator
of continental air masses and air mass boundaries over ocean
areas. Natural Radiation Environment III (Technical Infor-
mation Center, US Department of Energy) vol. 1, 308-326.
LINDEN, A.H. and ÄKERBLOM, G. (1977). Method of detecting small
or indistinct radioactive sources by airborne gamma-ray spec-
trometry. Geology, Mining and Extractive Processing of
Uranium (Inst. of Mining and Metallurgy, London) 113-120.
L0VBORG, L., KUNZENDORP, H., and HANSEN, J. (1969). Use of field
gamma-spectrometry in the exploration of uranium and thorium
deposits in South Greenland. Nuclear Techniques and Mineral
Resources (International Atomic Energy Agency, Vienna)
197-211.
L0VBORG, L., WOLLENBERG, H., S0RENSEN, P., and HANSEN, J. (1971).
Field determination of uranium and thorium by gamma-ray
spectrometry, exemplified by measurements in the Ilimaussaq
alkaline intrusion, South Greenland. Econ. Geol. 6_6, 368-384.
L0VBORG, L., KIRKEGAARD, P., and ROSE-HANSEN, J. (1972). Quanti-
tative interpretation of the gamma-ray spectra from geologic
formations. The Natural Radiation Environment II (USERDA,
Springfield, Virginia) vol. 1, 155-180.
L0VBORG, L. and KIRKEGAARD, P. (1974). Response of 3" * 3"
NaI(Tl) detectors to terrestrial gamma radiation. Nucl.
Instrum. Meth. 121, 239-251.
L0VBORG, L. and KIRKEGAARD, P. (1975). Numerical evaluation of
the natural gamma radiation field at aerial survey heights.
Risa Report No. 317, 52 pp.
L0VBORG, L., KIRKEGAARD, P., and CHRISTIANSEN, E.M. (1976).
Design of NaI(Tl) scintillation detectors for use in gamma-
ray surveys of geological sources. Exploration for Uranium
Ore Deposits (International Atomic Energy Agency, Vienna)
127-148.
L0VBORG, L., B0TTER-JENSEN, L., and KIRKEGAARD, P. (1978). Ex-
periences with concrete calibration sources for radio.netric
field instruments. Geophys. 43_, 543-549.
L0VBORG, L., GRASTY, R.L., and KIRKEGAARD, P. (1978). A guide to
the calibration constants for aerial gamma-ray surveys in
geoexploration. Aerial Techniques for Environmental Monitor-
ing (Am. Nucl. Soc, La Grange Park, Illinois) 193-206.
- 115 -
L0VBORG, L., B0TTER-JENSEN, L., KIRKEGAARD, P., and CHRISTIANSEN,
E.M. (1979). Monitoring of natural soil radioactivity with
portable gamma-ray spectrometers. Nucl. Instrum. Meth. 167,
341-348.
L0VBORG, L., B0TTER-JENSEN, L., CHRISTIANSEN, E.M., and NIELSEN,
B.L. (1980). Gamma-ray measurements in an area of high natu-
ral radioactivity. Natural Radiation Environment III (Tech-
nical Information Center, US Department of Energy) vol. 2,
912-926.
L0VBORG, L. (1982). Error analysis of calibration and field
trials with spectrometers and counters. Uranium Exploration
Methods (OECD, Paris) 671-680.
L0VBORG, L. (1983). Total-count calibration blocks for use in
uranium exploration. Ris0-R-49O, 47 pp.
MATHERON, G. (1963). Principles of geostatistics. Econ. Geol. 58,
1246-1266.
MATHEWS, M.W. and KOSANKE, K.L. (1978). Gross gamma-ray cali-
bration blocks. GJBX-59(78) (Bendix Field Eng. Corp.) 89 pp.
MINATO, S. (1980). Some observations of the variations in natural
gamma radiation due to rainfall. Natural Radiation Environ-
ment III (Technical Information Center, US Department of
Energy) vol. 1, 370-382.
MULTALA, J. (1981). The construction of gamma-ray spectrometer
calibration pads. Geoexpl. Jj9.r 33-46.
NACHTIGALL, D. (1969). Table of specific gamma-ray constants
(Karl Thiemig Verlag, Miinchen) 98 pp.
NEVILLE, A.M. (1981). Properties of Concrete (Pitman, London)
779 pp.
NIELSEN, B.L. (1981). Exploration of the Kvanefjeld uranium
deposit, Ilimaussag intrusion, South Greenland. Uranium Ex-
ploration Case Histories (International Atomic Energy Agency,
Vienna) 353-388.
OECD (1981). Reporting and calibration of total-count gamma
radiation measurements. Newsletter on R&D in Uranium Ex-
ploration Techniques (OECD Nuclear Energy Agency, Paris)
No. 3, 16-19.

aow sensitivity or tne insctuiueia
- 116-
PEREIRA, E-B. (1980). Reconnaissance of radon emanation power of
Pocos de Caldas, Brazil, uranium ore and associated rocks.
Natural Radiation Environment III (Technical Information
Center, US Department of Energy) vol. 1, 117-123.
RICHARDSON, K.A. (1964). Thorium, uranium, and potassium in the
Conway granite, New Hampshire, U.S.A. The Natural Radiation
Environment (Univ. Chicago Press, Chicago) 39-50.
RIXOM, M.R. (1978). Chemical Admixtures for Concrete (Spon Ltd.,
London) 234 pp.
ROHDE, R.E. (1965). Gain vs temperature effects in NaI(Tl) photo-
multiplier scintillation detectors using 10 and 14 stage
tubes. IEEE Trans. Nucl. Sci. NS-12 (1), 16-23.
ROJKO, R. (1976). Calibration centre for field gamma spectro-
meters. Geol. Pruzkum J_8, 336-339 (in Czech).
SCHROEDER, G.L., KRANER, H.W., and EVANS, R.D. (1965). Diffusion
of radon in several naturally occuring soil types.
J. Geophys. Res. 7_0_, 471-474.
SCHWARZER, T.F. and ADAMS, J.A.S. (1973). Rock and soil dis-
crimination by low altitude airborne gamma-ray spectrometry
in Payne Country, Oklahoma. Econ. Geol. 6£, 1297-1312.
SMITH, C W . and STEGER, H.F. (1983). Radium-226 in certified
uranium reference ores DL-Ia, BL-4a, DH-Ia and BL-5. CANMET
Report 83-9E, 8 pp + appendices.
STROMSWOLD, D.C. (1978). Monitoring of the airport calibration
pads at Walker Field, Grand Junction, Colorado for long-term
radiation variations. GJBX-99(78) (Bendix Field Eng.
Corp.) 35 pp.
STROMSWOLD, D.C. and KOSANKE, K.L. (1978). Calibration and error
analysis for spectral radiation detectors. IEEE Trans. Nucl.
Sci. NS-25, 782-786.
TANNER, A.B. (1964). Radon migration in the ground: A review.
The Natural Radiation Environment (Univ. Chicago Press,
Chicago) 161-190.
TANNER, A.B. (1980). Radon migration in the ground: A supplement-
ary review. Natural Radiation Environment III (Technical
Information Center, US Department of Energy) vol. 1, 5-56.
- 117 -
TRAHEY, N.M., VOEKS, A.M., and SORIANO, M.D. (1982). Grand
Junction/New Brunswick Laboratory interlaboratory measurement
program, part I: Evaluation, part II: Methods manual. US
Department of Energy (Argonne, Illinois) 189 pp.
TROXELL, E.G., DAVIS, H.E., and KELLY, J.W. (1968). Composition
and Properties of Concrete (McGraw-Hill, New York) 529 pp.
VAVILIN, L.N., VOROB'EV, V.P., EFIMOV, A.V., ZKLENETSKIJ, D.S.
et al. (1982). Aerogamma Spectrometry in Geology ("Nedra",
Leningrad) 271 pp (in Russian).
WARD, D.L. (1978). Construction of calibration pads facility
Walker Field, Grand Junction, Colorado. GJBX-37(78)
(Bendix Field Eng. Corp.) 16 pp + appendices.
WOLLENBERG, H.A. and SMITH, A.R. (1966a). Radioactivity of cement
raw materials. Proc. 2nd Forum on Geology of Industrial
Minerals (Indiana Univ., Bloomington) 129-147.
WOLLENBERG, H.A. and SMITH, A.R. (1966b). A concrete low-back-
ground counting enclosure. Health Phys. \2_, 53-60.
WOLLENBERG, H.A. (1977). Radiometric methods. Nuclear Methods
in Mineral Exploration and Production (J.G. Morse, ed.;
Elsevier, Amsterdam) 5-36.
WORMALD, M.R. and CLAYTON, C G . (1976). Observations on the ac-
curacy of gamma spectrometry in uranium prospecting. Ex-
ploration for Uranium Ore Deposits (International Atomic
Energy Agency, Vienna) 149-171.
YANG ZHENZHOU and LIU XICHEN (1983). Seven standard ore samples
of uranium, thorium and radium prepared by the Bureau of
Uranium Geology (China). Geostandards Newsletter 1_, 251-260.
ZIJP, W.L. (1984). Generalized least squares principle for
straight line fitting. Rep. ECN-154 (Netherlands Energy
Research Foundation, Petten) 38 pp.
- 118 -
APPENDIX
DATA SHEETS FOR CALIBRATION FACILITIES INCLUDED IN THE IAEA
INTERCOMPARISON EXPERIMENT
The radioelement concentrations of pads used for calibrating
the portable GR-410 spectrometer are listed under the heading
"Assigned calibration grades". Pads tested in the experiment are
described by two sets of radioelement concentrations:
"Laboratory-assayed grades" which refer to powdered, dry pad
material and "Monitored in-situ grades" which are relative to
the B pad of the facility in question and believed to include
most of the free moisture in the pads. Missing assay or monitor-
ing results indicate that a grade determination was not at-
tempted because of a highly probable spectral pile-up effect.
The calibration pads are labelled using the letter code intro-
duced in subsection 4.2. For facilities in which the pads are
numbered, the literal descriptor and the pad number are used
hyphenated.
The global distribution of the visited pad facilities is shown
in Fig. 50.
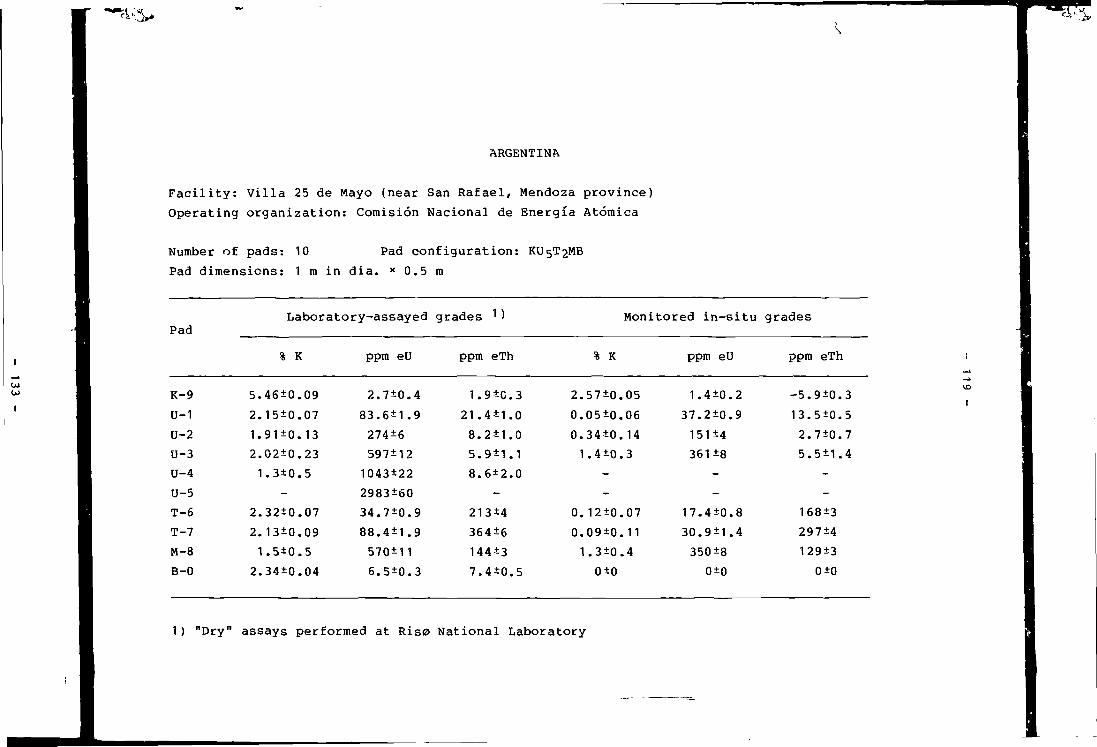
ARGENTINA
Facility: Villa 25 de Mayo (near San Rafael, Mendoza province)
Operating organization: Comision Nacional de Energia Atömica
Number of pads: 10 Pad configuration: KU5T2MB
Pad dimensions: 1 m in dia. x 0.5 m
Pad
K-9
U-1
U-2
U-3
U-4
U-5
T-6
T-7
M-8
B-O
Laboratory-assayed
% K
5.46±0.09
2.15±0.07
1.91±0.13
2.02±0.23
1.3±0.5
-
2.32*0.07
2.13±0.09
1.5±0.5
2.34±0.04
ppm eU
2.7±0.4
83.6±1.9
274±6
597±12
1043±22
2983±60
34.7±0.9
88.4±1.9
570±11
6.5±0.3
grades 1 )
ppm eTh
1.9±C.
21.4±1.
8.2±1.
5.9±1.
8.6±2.
-
213±4
364±6
144±3
7.4±0.
3
0
0
1
0
5
Monitored in-situ
% K
2.57±0.05
0.05±0.06
0.34±0.14
1.4±0.3
-
-
0.12±0.07
0.09±0.11
1.3±0.4
0±0
ppm eU
1.4±0.2
37.2±0.9
151 ±4
361 ±8
-
-
17.4±0.8
30.9±1.4
350±8
0±0
grades
ppm eTh
-5.9±0.
13.5±0.
2.7±0.
5.5±1.
-
-
168±3
297±4
129±3
0±0
3
5
7
4
1) "Dry" assays performed at Ris0 National Laboratory
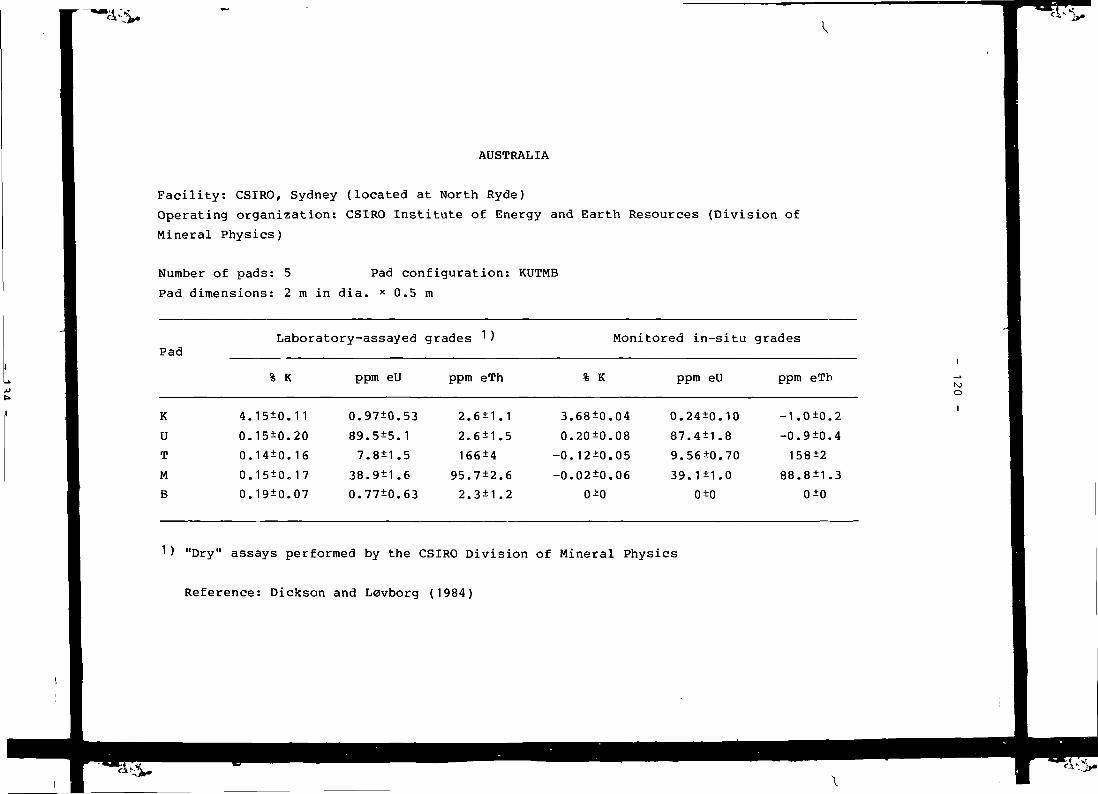
AUSTRALIA
Facility: CSIRO, Sydney (located at North Ryde)
Operating organization: CSIRO Institute of Energy and Earth Resources (Division of
Mineral Physics)
Number of pads: 5 Pad configuration: KUTMB
Pad dimensions: 2 m in dia. x 0.5 m
Pad
K
U
T
M
B
Laboratory-assayed
% K
4.15±0.11
0.15±0.20
0.14±0.16
0.15*0.17
0.19±0.07
ppm eU
0.97±0.53
89.5±5.1
7.8±1.5
38.9±1.6
0.77±0.63
grades 1)
ppm eTh
2.6±1.1
2.6±1.5
166±4
95.7±2.6
2.3±1.2
3
0
-0
-0
% K
.68±0
.20±0
. 12±0
.02±0
OiO
Monitored in-situ
.04
.08
.05
.06
ppm eU
0.24±0.10
87.4±1.8
9.56±0.70
39.1±1.0
0±0
grades
ppm eTh
-1.0±0.
-0.9±0.
158±2
88.8±1.
0±0
2
4
3
K)O
1) "Dry" assays performed by the CSIRO Division of Mineral Physics
Reference: Dickson and Levborg (1984)
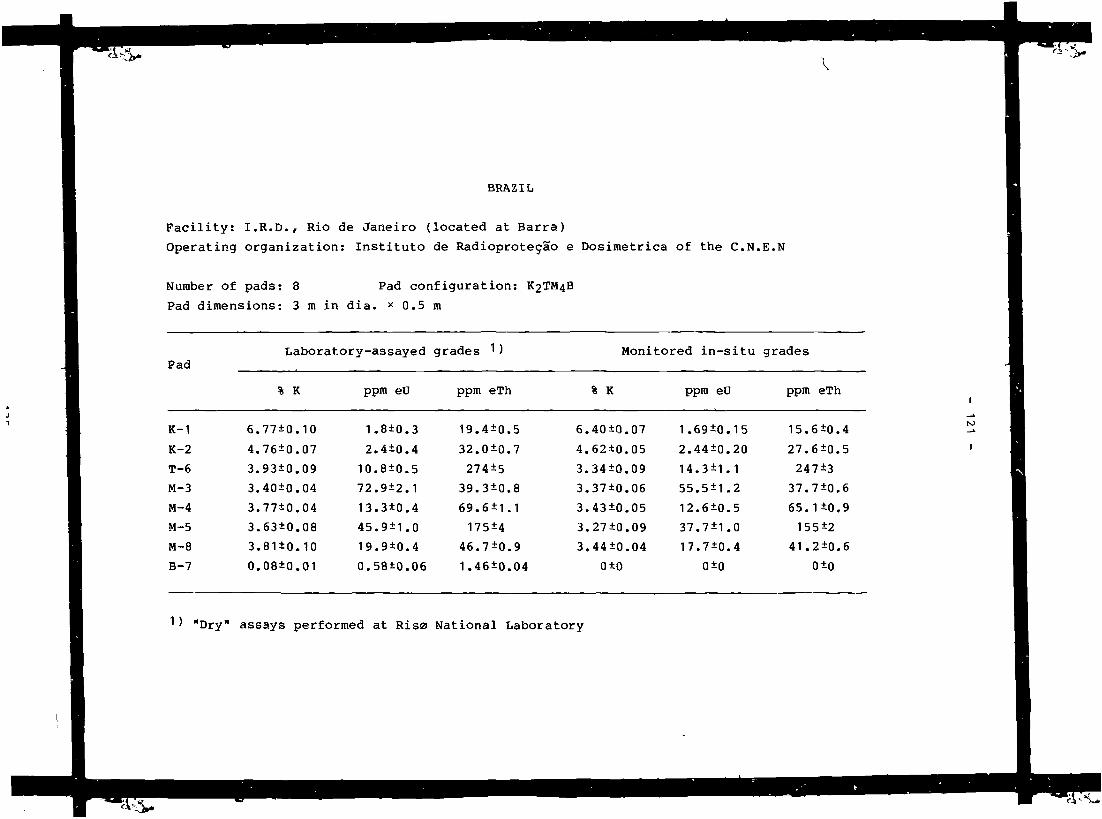
\
BRAZIL
Facility: I.R.D., Rio de Janeiro (located at Barra)
Operating organization: Instituto de Radioprotecao e Dosimetrica of the C.N.E.N
Number of pads: 8 Pad configuration: K2TM4B
Pad dimensions: 3 m in dia. * 0.5 m
Pad
K-1
K-2
T-6
M-3
M-4
M-5
M-8
B-7
Laboratory-assayed
% K
6.77±0.10
4.76±0.07
3.93±0.09
3.40±0.04
3.77±0.04
3.63±0.08
3.8U0.10
0.08*0.01
ppm eU
1.8±0.3
2.4±0.4
10.8±0.5
72.9±2.1
13.3±0.4
45.9±1.0
19.9±0.4
0.58±0.06
grades ^ )
ppm eTh
19.4±0.5
32.0±0.7
274±5
39.3±0.8
69.6±1.1
175±4
46.7±0.9
1.46±0.04
Monitored in-situ
% K
6.40±0.07
4.62±0.05
3.34±0.09
3.37±0.06
3.43±0.05
3.27±0.09
3.44±0.04
0±0
ppm eU
1.69±0.15
2.44±0.20
14.3±1.1
55.5±1.2
12.6±0.5
37.7±1.0
17.7±0.4
0±0
grades
ppm eTh
15.6±0.4
27.6±0.5
247±3
37.7±0.6
65.1±0.9
155±2
41.2±0.6
0±0
I
IO
I
) "Dry" assays performed at Risa National Laboratory
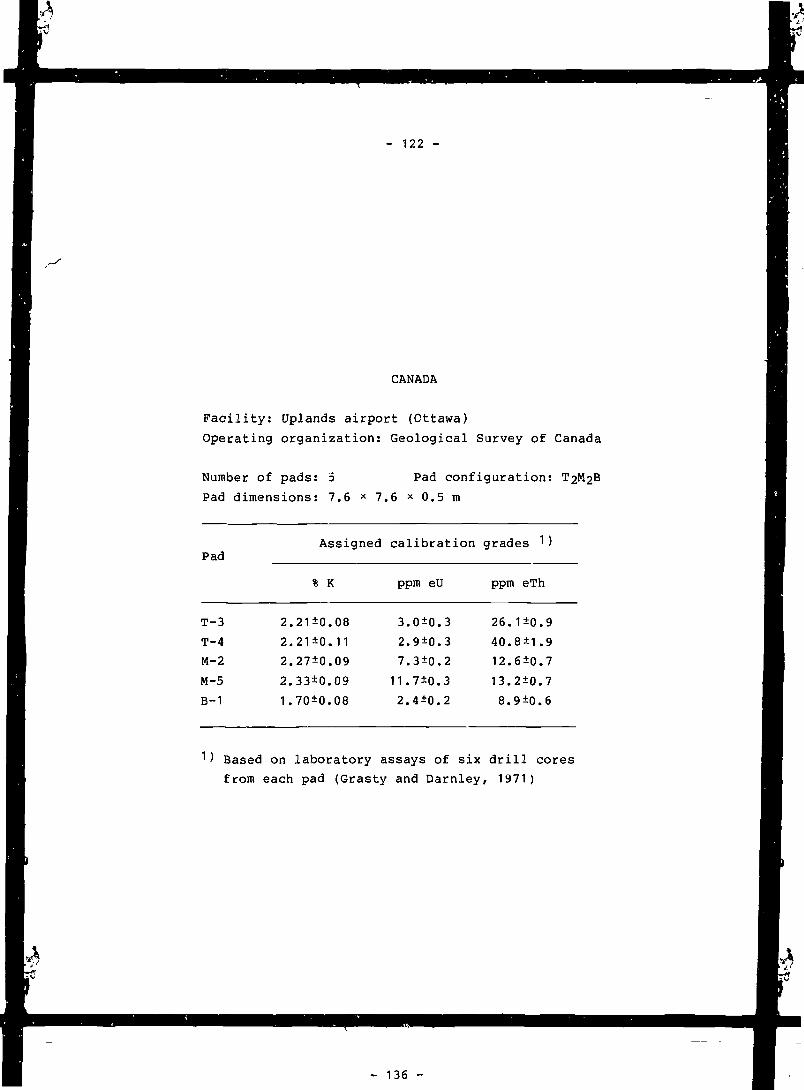
- 122 -
CANADA
Facility: Uplands airport (Ottawa)
Operating organization: Geological Survey of Canada
Number of pads: 5 Pad configuration:
Pad dimensions: 7.6 * 7.6 * 0.5 m
Pad
T-3
T-4
M-2
M-5
B-1
2.
2.
2.
2.
1.
Assigned
% K
21±0.08
21±0.11
27±0.09
33±0.09
70±0.08
calibration
ppm e U
3.0±0,
2.9±0,
7.3±0.
11.7±0.
2.4±0.
.3
.3
.2
,3
,2
grades 1
ppm eTh
26.
40.
12,
13.
8.
. 1±0.
.8±1.
.6±0.
,2±0.
9±0.
)
9
9
7
7
6
Based on laboratory assays of six drill cores
from each pad (Grasty and Darnley, 1971)
te
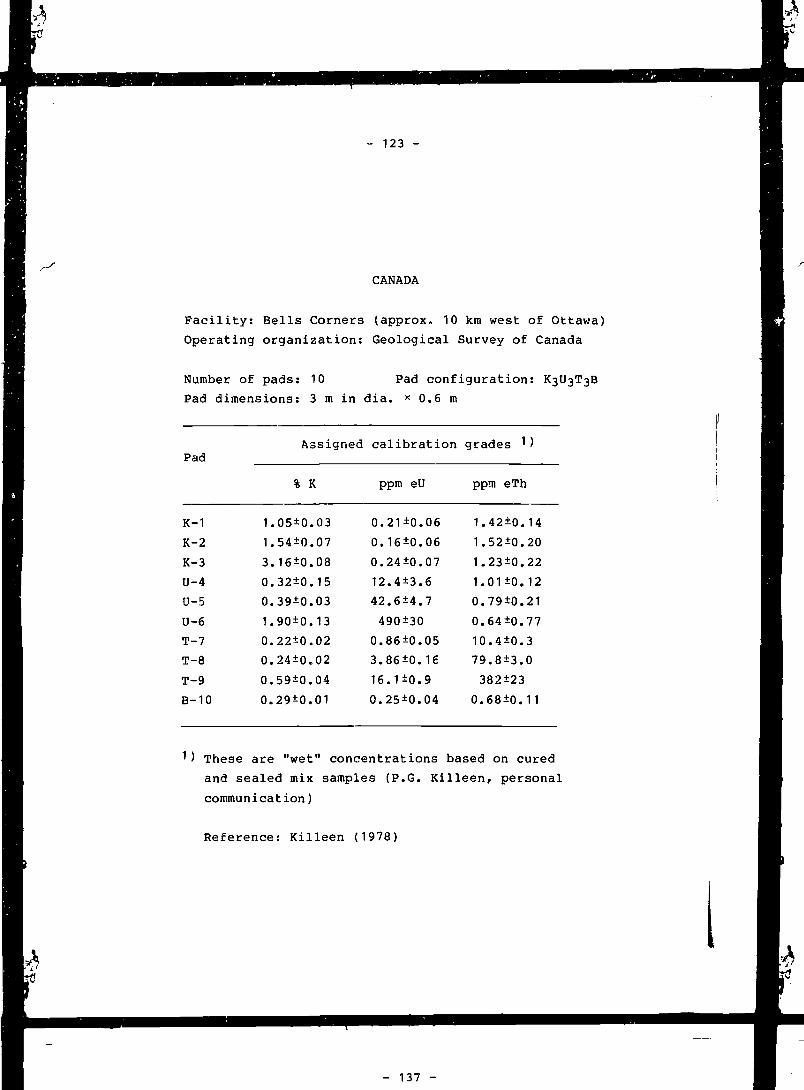
- 123 -
CANADA
Facility: Bells Corners (approx, 10 km west of Ottawa)
Operating organization: Geological Survey of Canada
Number of pads: 10 Pad configuration: K3U3T3B
Pad dimensions: 3 m in dia. x 0.6 m
Pad
K-1
K-2
K-3
U-4
U-5
U-6
T-7
T-8
T-9
B-IO
Assigned
% K
1.05±0.03
1.54±0.07
3.16±0.08
0.32±0.15
0.39±0.03
1.90±0.13
0.22±0.02
0.24±0.02
0.59±0.04
0.29±0.01
calibration
ppm eU
0.21±0.06
0.16±0.06
0.24±0.07
12.4±3.6
42.6±4.7
490±30
0.86±0.05
3.86±0.16
16.1±0.9
0.25±0.04
grades 1)
ppm eTh
1.42±0.14
1.52±0.20
1.23±0.22
1.01±0.12
0.79±0.21
0.64±0.77
10.4±0.3
79.8±3.0
382±23
0.68±0.11
) These are "wet" concentrations based on cured
and sealed mix samples (P.G. Killeen, personal
communication)
Reference: Killeen (1978)
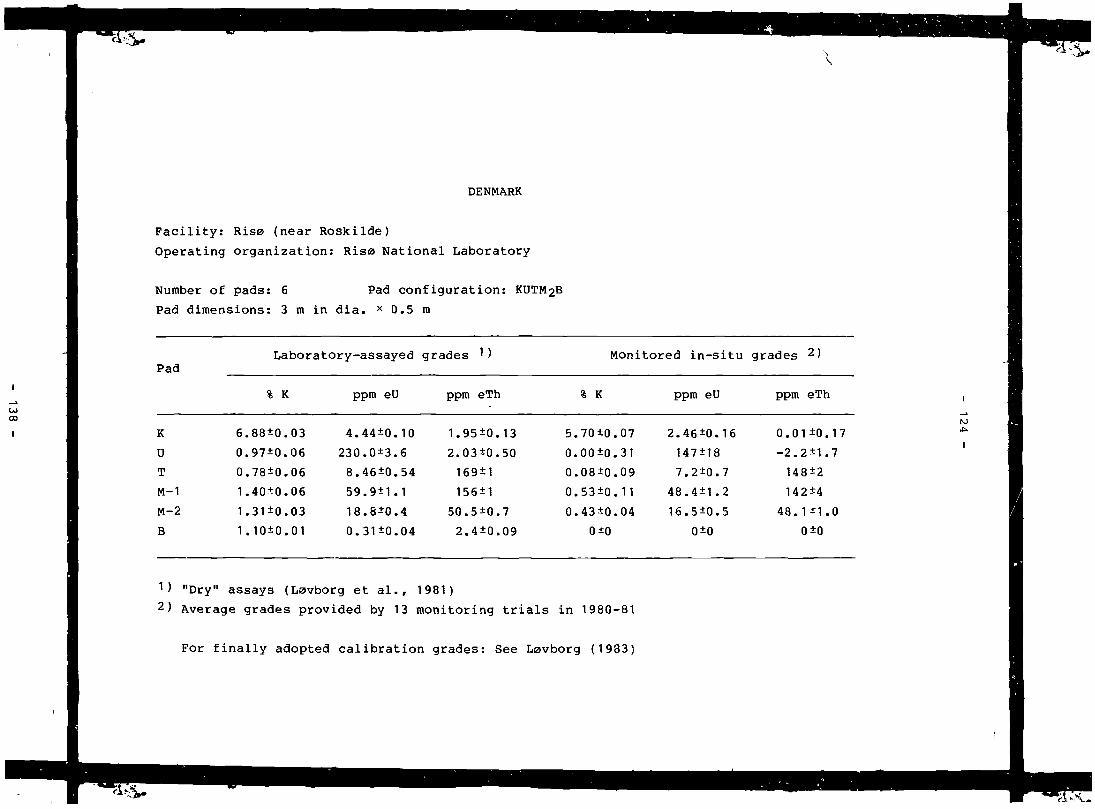
CD
I
\
DENMARK
Facility: Ris0 (near Roskilde)
Operating organization: Rise National Laboratory
Number of pads: 6 Pad configuration: KUTM2B
Pad dimensions: 3 m in dia. * 0.5 m
Pad
K
U
T
M-1
M-2
B
Laboratory-assayed
% K
6.88*0.03
0.97±0.06
0.78±0.06
1.40±0.06
1.31±0.03
1.10*0.01
ppm eU
4.44±0.10
230.0*3.6
8.46±0.54
59.9±1.1
18.8±0.4
0.31*0.04
grades 1 )
ppm eTh
1.95±0.13
2.03*0.50
169±1
156±1
50.5*0.7
2.4*0.09
Monitored in - s i tu
% K
5.70±0.07
0.00±0.31
0.08±0.09
0.53±0.11
0.43±0.04
0±0
ppm eU
2.46±0.16
147±18
7.2±0.7
48.4±1.2
16.5±0.5
0±0
grades 2)
ppm eTh
0.01±0.
- 2 . 2 ± 1 .
148±2
142±4
48-1±1.
0±0
17
7
0
1) "Dry" assays (Lavborg et al., 1981)
2) Average grades provided by 13 monitoring trials in 1980-81
For finally adopted calibration grades: See Lovborg (1983)
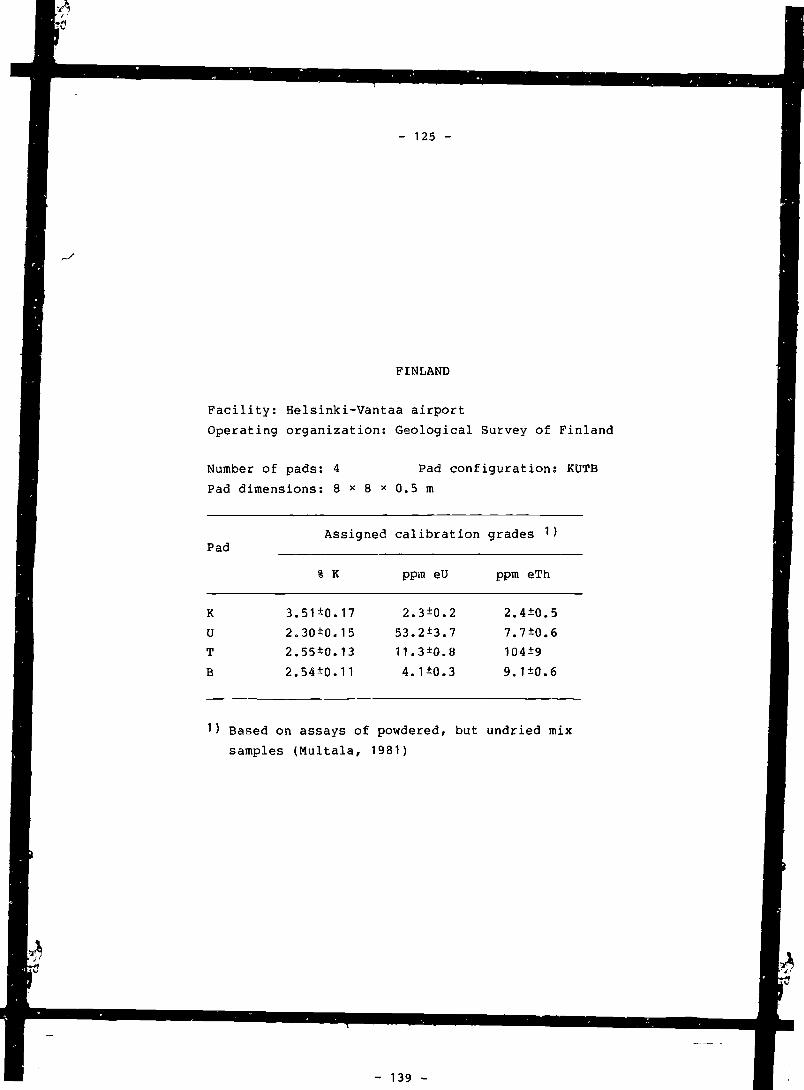
- 125 -
FINLAND
Facility: Helsinki-Vantaa airport
Operating organization: Geological Survey of Finland
Number of pads: 4 Pad configuration: KUTB
Pad dimensions: 8 * 8 * n.5 m
Pad
K
U
T
B
Assigned
% K
3.51*0.17
2.30*0.15
2.55*0.13
2.54*0.11
calibration
ppm eU
2.3*0.2
53.2*3.7
11.3*0.8
4.1*0.3
grades 1)
ppm eTh
2.4*0.5
7.7*0.6
104*9
9.1*0.6
Based on assays of powdered, but undried mix
samples (Multala, 1981)

ISRAEL
Faci l i ty : Soreq (the pads are located at a mili tary a i r f ie ld)
Operating organization: Soreq Nuclear Research Center
Number of pads: 4 (5) Pad configuration: KUTB(2)
Pad dimensions: 8 x 8 > < 0 . 4 m
Pad
K
U
T
B
Laboratory-assayed
% K
0 . 5 8 ± 0 . 0 1
0 . 0 3 ± 0 . 0 1
0 . 0 0 ± 0 . 0 1
0 . 1 7 ± 0 . 0 1
ppm eU
1 .04±0.03
12.77±0.05
0.72±0.05
0.55±0.03
grades 1)
ppm eTh
3.79±0.05
1 .88±0.05
34.1±0.1
0.86±0.03
0
- 0
- 0
%
.410
.160
.159
0
1
K
±0
±0
±0
±0
Monitored i n - s i t u
.010
.015
.013
ppm et
0.50±0.
12 .8 ±0.
1.18+0.
0±0
I
.06
.3
.15
grades
ppm eTh
2.74±0.
-0.33±0.
33.2 ±0.
0±0
10
09
5
1) Assays performed at Soreq Nuclear Research Center
CT)
Reference: Aviv and Vulkan (1983)
^ -
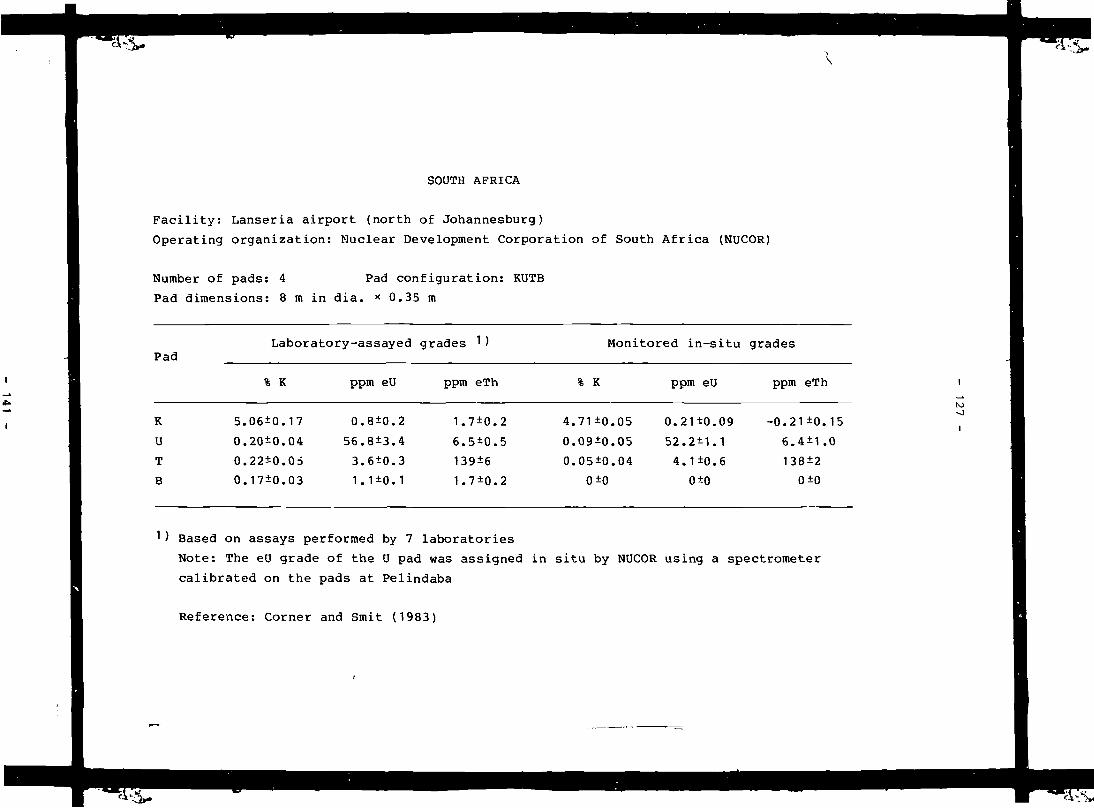
SOUTH AFRICA
Facility: Lanseria airport (north of Johannesburg)
Operating organization: Nuclear Development Corporation of South Africa (NUCOR)
Number of pads: 4 Pad configuration: KUTB
Pad dimensions: 8 m in dia. * 0.35 m
Pad
K
U
T
B
Laboratory-assayed
% K
5.06±0.17
0.20±0.04
0.22±0.05
0.17±0.03
ppm eU
0.
56.
3.
1.
.8±0.
.8±3.
.6±0.
.1±0.
2
4
3
1
grades ^)
ppm eTh
1.7±0.
6.5±0.
139±6
1.7±0.
2
5
2
4
0
0
Monitored in-situ
% K
.71±0.
.09±0.
.05±0.
0±0
05
0504
ppm el
0.21±0.
52.2±1.
4.1±0.
0±0
J
.09
.1
.6
grades
ppm eTh
-0.21±0.
6.4±1.
138±2
0±0
15
0
) Based on assays performed by 7 laboratories
Note: The eU grade of the U pad was assigned in situ by NUCOR using a spectrometer
calibrated on the pads at Pelindaba
Reference: Corner and Smit (1983)
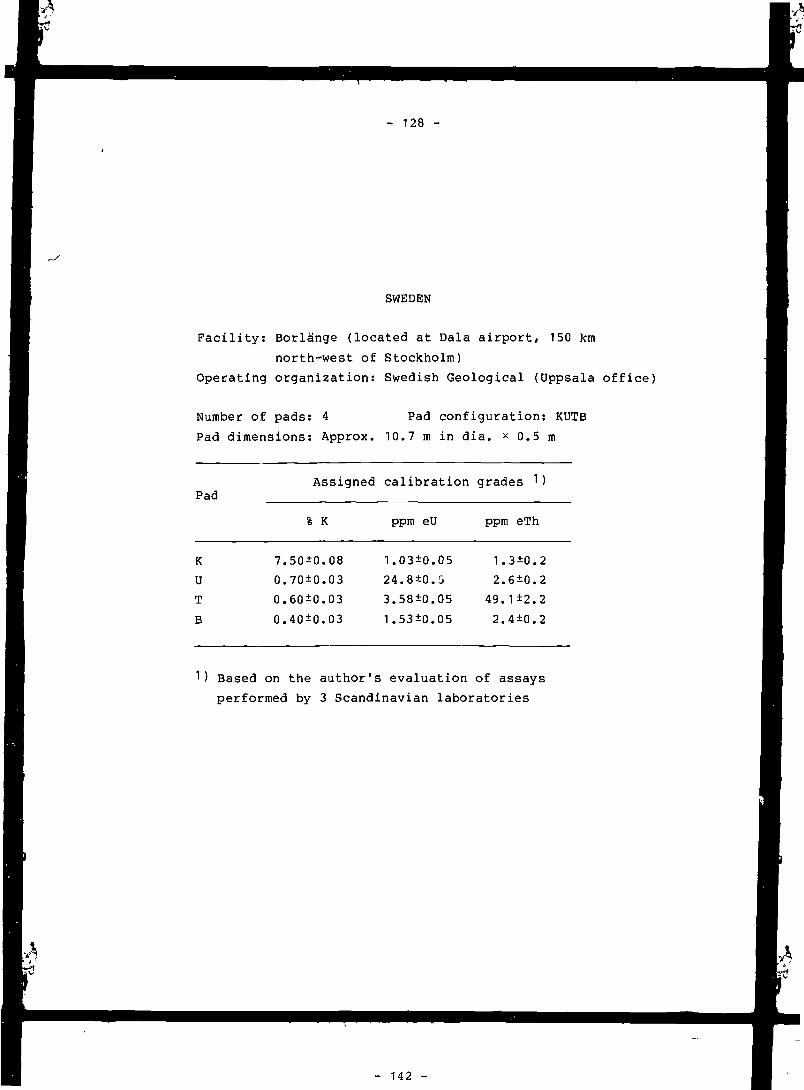
- 128 -
SWEDEN
Facility: Borlänge (located at DaIa airport, 150 km
north-west of Stockholm)
Operating organization: Swedish Geological (Uppsala office)
Number of pads: 4 Pad configuration: KUTB
Pad dimensions: Approx. 10.7 m in dia. * 0.5 m
Pad
KU
T
B
Assigned
% K
7.50±0.08
0.70±0.03
0.60±0.03
0.40±0.03
calibration
ppm eU
1.03*0.05
24.8±0.5
3.58±0.05
1.53±0.05
grades 1 )
ppm eTh
1.3±0.2
2.6±0.2
49.1±2.2
2.4±0.2
Based on the author's evaluation of assays
performed by 3 Scandinavian laboratories
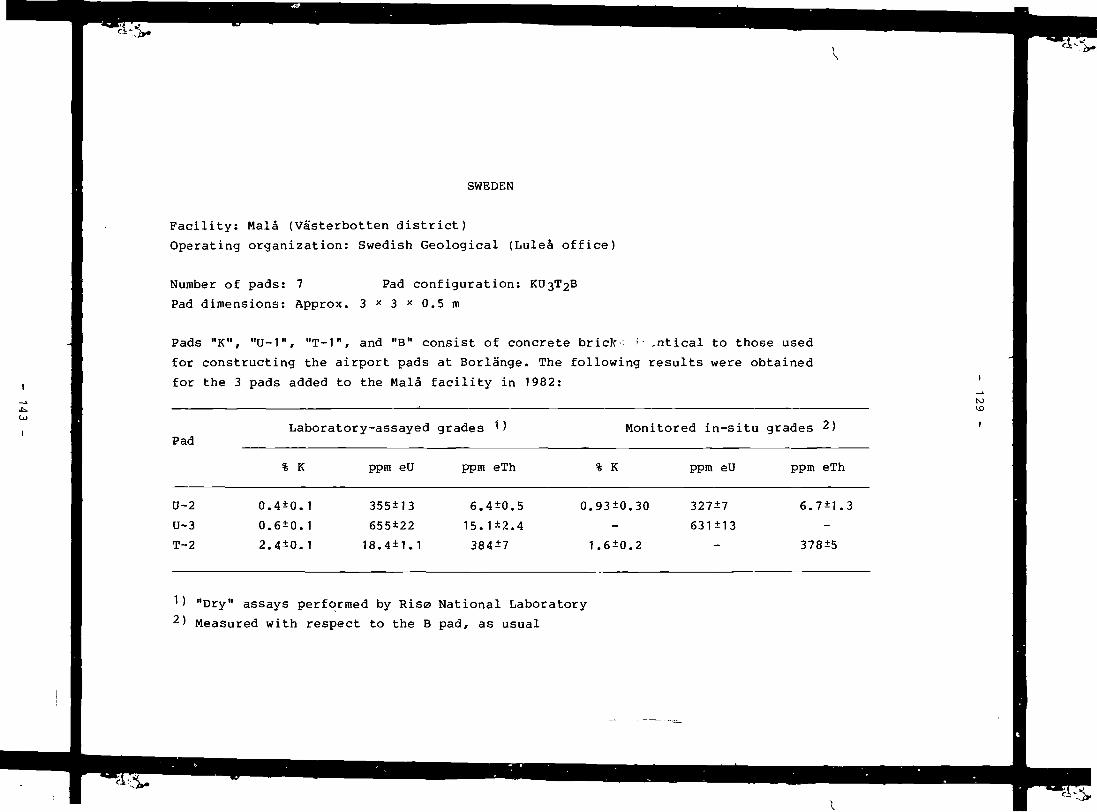
SWEDEN
Facility: Malä (Vasterbotten district)
Operating organization: Swedish Geological (Luleä office)
Number of pads: 7 Pad configuration: KU3T2B
Pad dimensions: Approx. 3 x 3 x 0.5 m
Pads "K", "U-1", "T-I", and "B" consist of concrete briclr > .ntical to those used
for constructing the airport pads at Borlänge. The following results were obtained
for the 3 pads added to the Malä facility in 1982:
PadLaboratory-assayed grades Monitored in-situ grades 2)
% K ppm eU ppm eTh % K ppm eU ppm eTh
K)VO
U-2
U-3
T-2
0.
0.
2.
4±0.
6±0.
4±0.
1
1
1
355±13
655±22
18.4±1.1
6.4±0.
15.1±2,
384±7
5
40.93±0.
-
1.6±0.
30
2
327±7
631±13
6.7±1.3
378±5
1) "Dry" assays performed by Risa National Laboratory
2) Measured with respect to the B pad, as usual

- 130 -
USA
Facility: Walker Field airport (Grand Junction, Colorado)
Operating organization: Technical Measurements Center at the
Grand Junction Area Office of the
US Department of Energy
Number of pads: 5Pad dimensions: 9.1 * 1
Pad
K-2
U-4
T-3
M-5
B-1
5.
2.
2.
4.
1.
Assigned
% K
,14*0.045
,03*0.025
,01*0.02
,11*0.03
,45*0.005
2.Pad
2 x 0 .configuration: KU5 m
calibration
5
30
5
20
2
ppm eU
.09*0.
.29*0.
.14*0.
.39*0.
.19*0.
17
80
11
64
04
grades
ppm eTh
8.
9.
45.
17.
6.
.48*0
,19*0
,33*0
,52*0
,26*0
.13
.14
.37
.17
.07
) These are "wet" concentrations based on cured
and sealed mix samples. The standard deviations
equal half the 95% confidence ranges stated by
Stromswold and Kosanke (1978)
Additional reference: Ward (1978)
- 131 -
TABLES
- 145 -
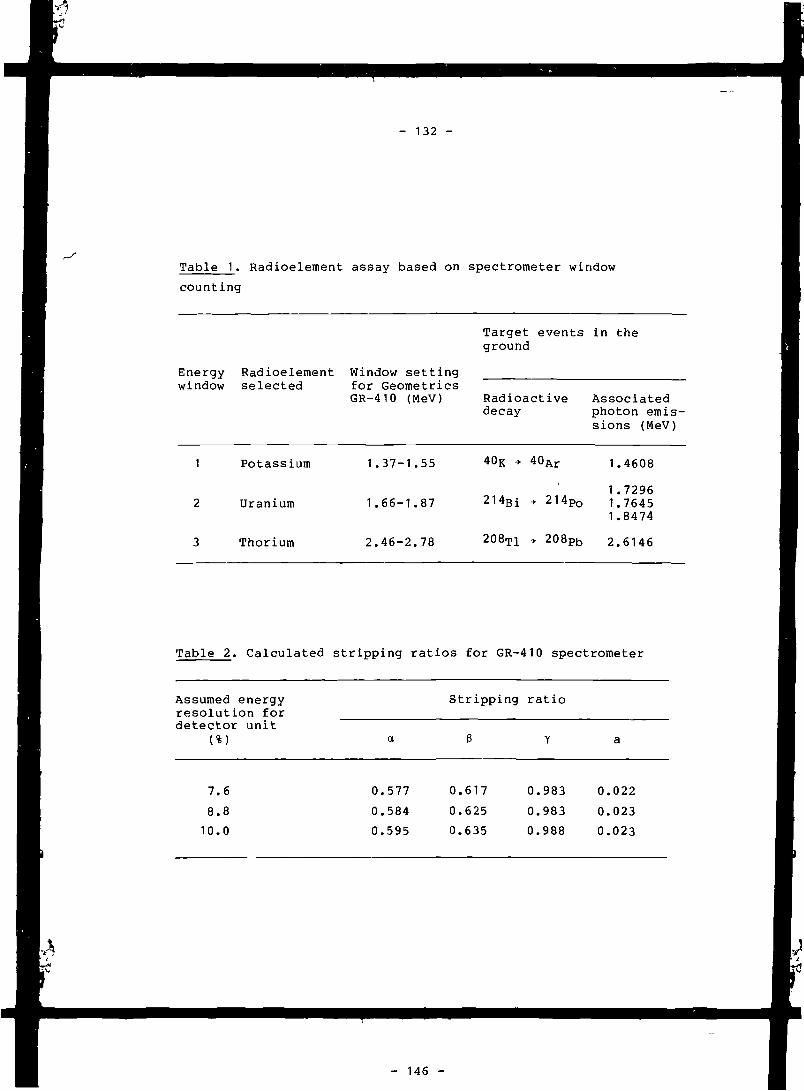
- 132 -
Table 1. Radioeleraent assay based on spectrometer window
counting
Energy Radioelement Window settingwindow selected for Geometries
GR-410 (MeV)
Target events in theground
Radioactive Associateddecay photon emis-
sions (MeV)
1 Potassium
2 Uranium
3 Thorium
1.37-1.55 40K * 40Ar 1.4608
1.72961.66-1.87 214Bi -> 214Po 1.7645
1.8474
2.46-2.78 208T1 + 208Pb 2.6146
Table 2. Calculated stripping ratios for GR-410 spectrometer
Assumed energyresolution fordetector unit
Stripping ratio
7.6
8.8
10.0
0
0
0
.577
.584
.595
0
0
0
.617
.625
.635
0
0
0
.983
.983
.988
0
0
0
.022
.023
.023
- 146 -
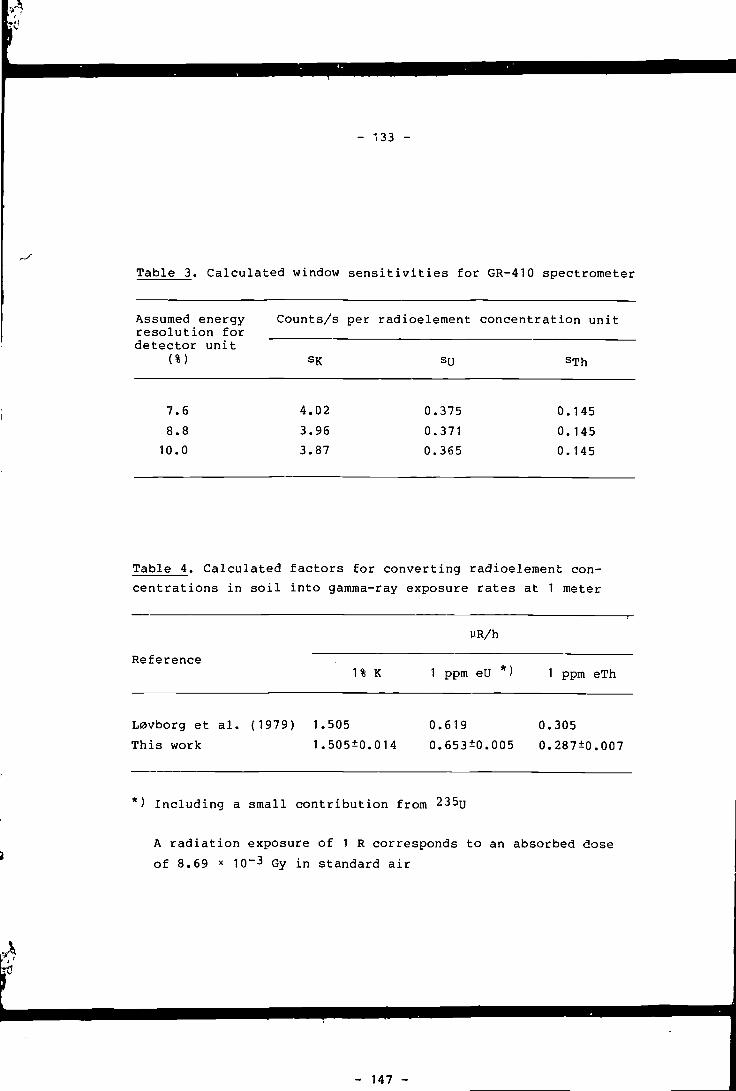
- 133 -
Table 3. Calculated window sensitivities for GR-410 spectrometer
Assumed energyresolution fordetector unit
(%)
7.6
8.8
10.0
Counts/s per
SR
4.02
3.96
3.87
radioelement
su
0.375
0.371
0.365
concentration unit
s T h
0.145
0.145
0.145
Table 4. Calculated factors for converting radioelement con-
centrations in soil into gamma-ray exposure rates at 1 meter
vR/h
Reference1% K 1 ppm eU *) 1 ppm eTh
Lavborg et al. (1979) 1.505 0.619 0.305
This work 1.505±0.014 0.653±0.005 0.287*0.007
) Including a small contribution from 235u
A radiation exposure of 1 R corresponds to an absorbed dose
of 8.69 * 10~3 Gy in standard air
- 147 -
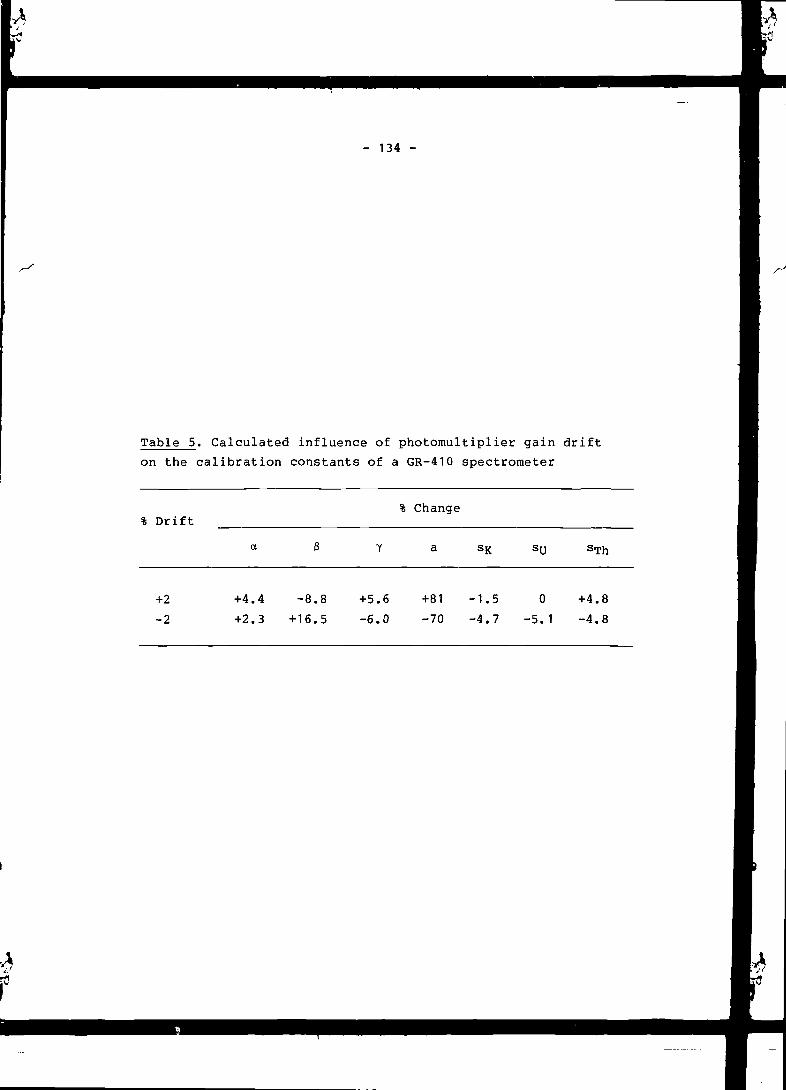
- 134 -
Table 5. Calculated influence of photomultiplier gain drift
on the
% Drift
+2
-2
calibration
a
+4.4
+2.3
constants of a
I
-8.
+ 16.
3
,8
,5
Y
+5.6
-6.0
GR-410
h Change
a
+81
-70
spectrometer
SK sa
-1.5 0
-4.7 -5.1
sTh
+4.8
-4.8
4

- 135 -
Table 6. Background count rates recorded with GR-410 spectro-
meter over water
Counts/s
Place Elevation(m) Window 1
(K)Window 2
(U)Window 3
(Th)
Roskilde Fjord
Denmark
0 . 5 4 6 ± 0 . 0 0 9 0 . 1 6 0 ± 0 . 0 0 5 0 . 1 0 8 ± 0 . 0 0 4
Hornavan Lake
N. Sweden
425 0.378±0.014 0.199±0.011 0.136±0.009
St. Umevattnet 520
N. Sweden
0.435±0.010 0.201±0.007 0.137±0.006
Helsinki Bay
Finland
0.420*0.011 0.233±0.008 0.139±0.006
Hig:iline Lake
Colorado, USA
1433 0.446±0.010 0.412±0.010 0.158±0.006
Average values 0.46 ± 0.06 0.21 ± 0.08 0.13 ± 0.02
Standard deviations on the single determinations are calculated
from counting statistics
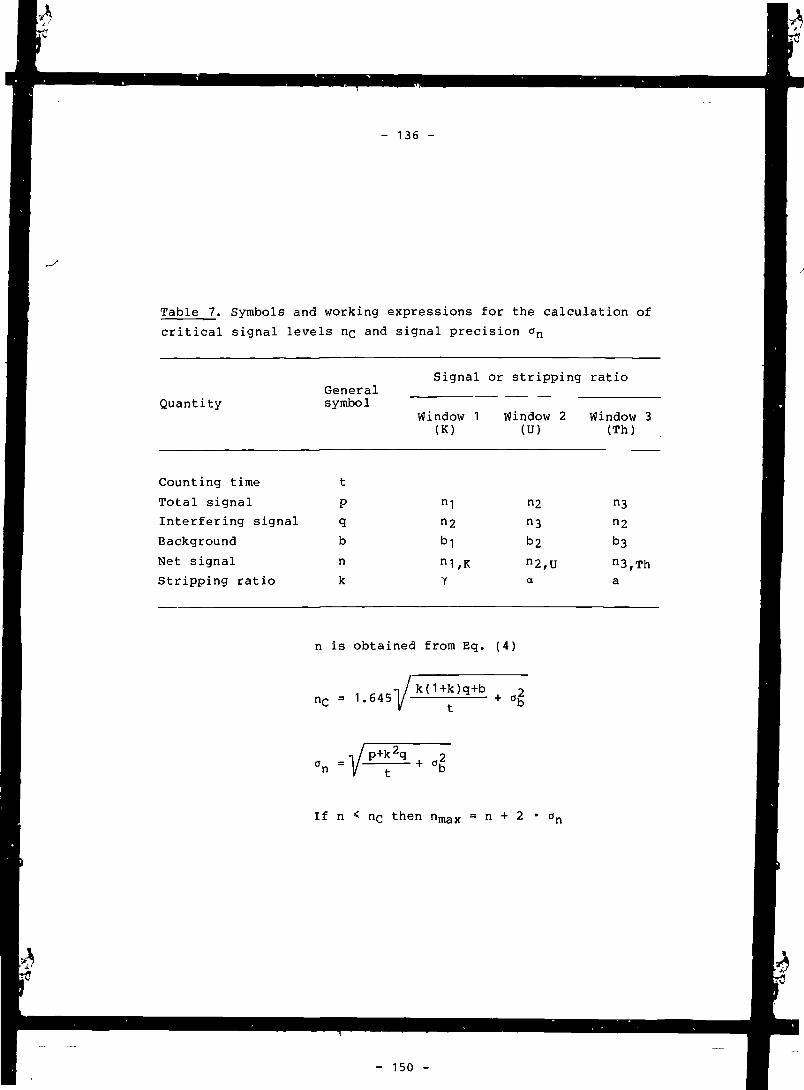
- 136 -
ti
Table 7. Symbols and working expressions for the calculation of
critical signal levels nc and
Quantity
Counting time
Total signal
Interfering signal
Background
Net signal
Stripping ratio
Generalsymbol
t
Pq
b
n
k
signal precision on
Signal or stripping
Window 1(K)
"1n2
bin1,KY
Window 2(U)
"2n3
b 2
n2,Ua
ratio
Window 3(Th)
n3
"2
b3n3,Tha
n is obtained from Eq. (4)
1 r.A-.lf k < 1 + k ) q + b . „2nc = 1.645 I/ + ag
If n < nc then n m a x = n + 2 • an

Table 8. Symbols and working expressions for the calculation of a priori signal
detection limits no and determination limits nQ
Quantity Symbol
Counting time t
Interfering con-tribution r
Background b
Net signal n
Signal
Window 1(K)
3s T h - :
n>1,K
Window 2(U)
#xTh
"2,U
nD = 2.71/t + 3.29 /(2r + b ) / t + (J
, L (2r + b) / t +nn = 50 { — + ] / — +
W t I/ «-2 25
Window 3(Th)
b 3
n3,Th
i
OJ
I
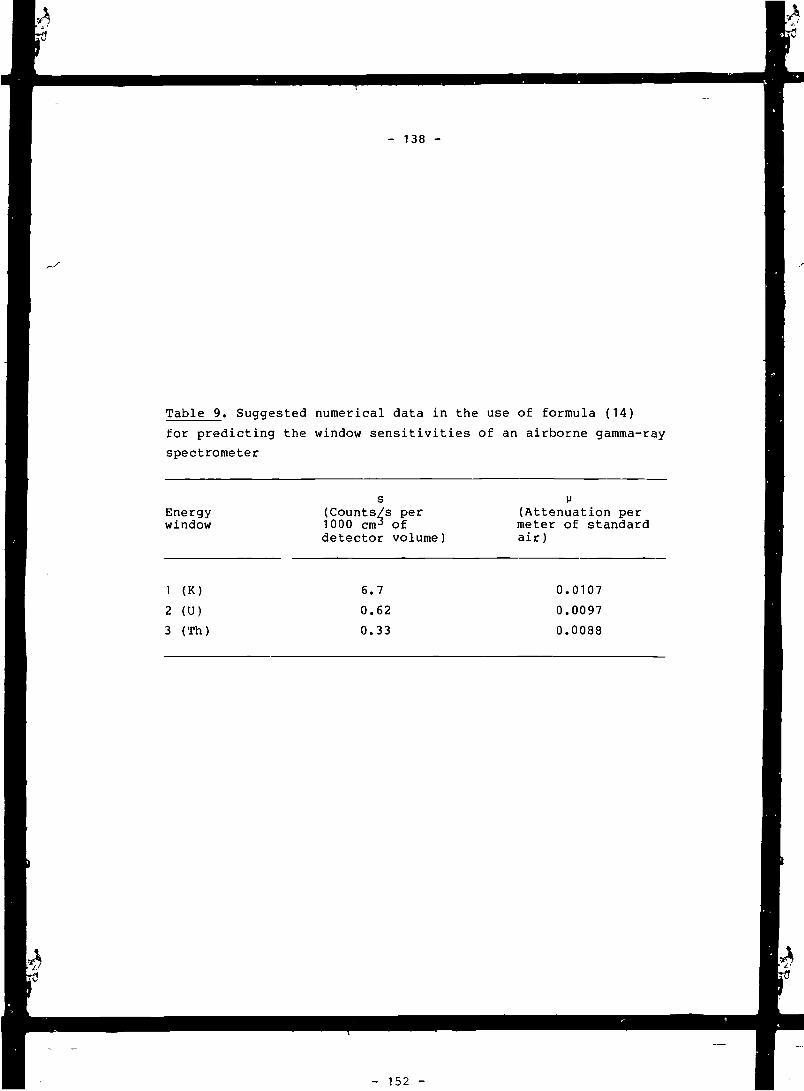
- 138 -
Table 9. Suggested numerical data in the use of formula (14)
for predicting the window sensitivities of an airborne gamma-ray
spectrometer
Energywindow
1 (K)
2 (U)
3 (Th)
S(Counts/s per1000 ciiW ofdetector volume)
6.7
0.62
0.33
(Attenuation permeter of standardair)
0.0107
0.0097
0.0088

- 139 -
Table 10. Experimental and calculated window sensitivities forthe GSC airborne gamma-ray spectrometer
Detectorsystem
Surveyheight(m)
Counts/s per concentration unit
Th
D
2)
125
122
a
b
a
b
75
88
91
92
.6
.7
.0
.1
8.
9.
9.
9.
6
3
1
6
6.3
5.5
7.0
5.7
1) Twelve 229 * 102 mm cylindrical detectors
Experimental data from Lavborg et al. (1978)
2) Twelve 102 x 102 * 406 mm prismatic detectors
Experimental data from Bristow (1983)
experimental b = calculated from formula (14)

- 140 -
Table 11. Contributions to the mass attenuation coefficients of
SiO2 at the photon energies selected by a field spectrometer
Interactionprocess
1.46 MeV
(cm2/g)
1.76 MeV 2.61 MeV
Comptonscattering 0.05235
Photoelectricabsorption 0.00001
Pair production 0.00007
0.04729
0.00001
0.00031
0.03765
0.00117
Total 0.05243 0.04761 0.03882

- 141 -
Table 12, Total mass attenuation coefficients for chemical rock
constituents
Substance
SiO2
TiO2
Al2O3
Fe2O3
MnO
MgO
CaO
Na2O
K2O
H2O
Concrete
Air
plus concrete and air
1.46 MeV
0.0525
0.0503
0.0516
0.0503
0.0492
0.0522
0.0526
0.0509
0.0515
0.0583
0.0530
0.0524
v/p (cm2/g)
1.76 MeV
0.0477
0.0458
0.0468
0.0459
0.0450
0.0474
0.0479
0.0462
0.0469
0.0529
0.0482
0.0476
2.61 MeV
0.0390
0.0379
0.0383
0.0384
0.0376
0.0387
0.0397
0.0377
0.0389
0.0428
0.0394
0.0386
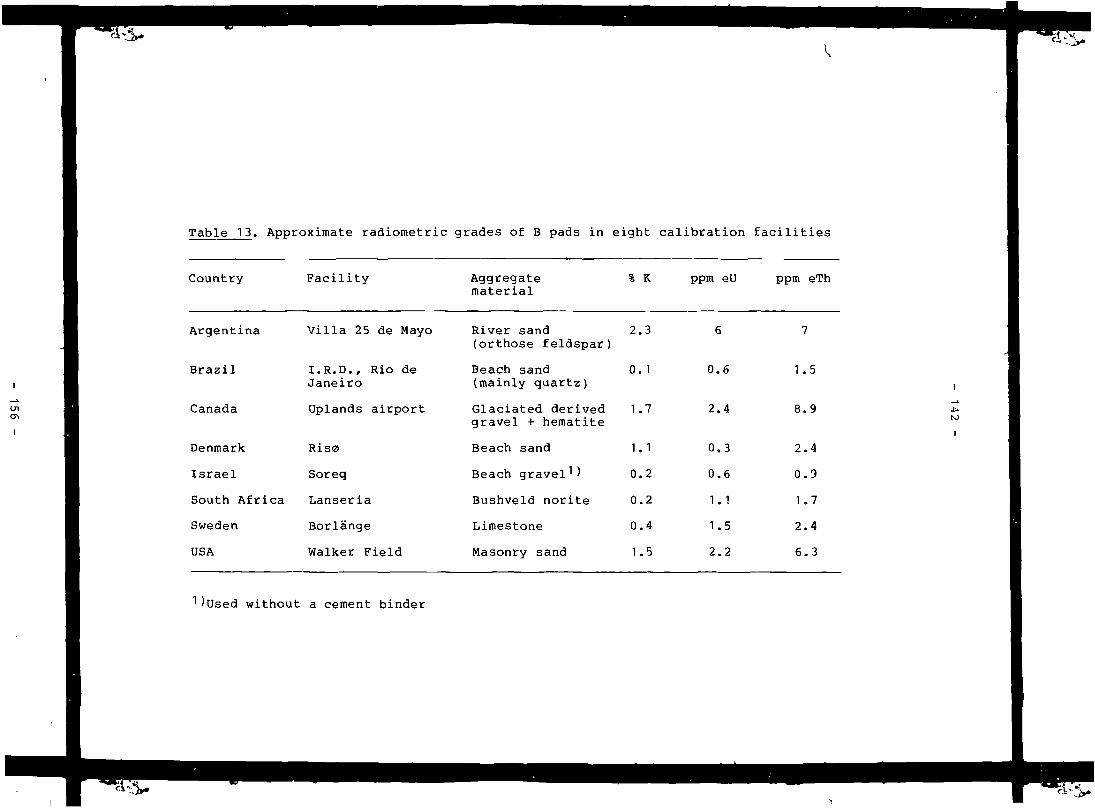
Table 13. Approximate radiometric grades of B pads in eight calibration facilities
Country
Argentina
Brazil
Canada
Denmark
Israel
South Africa
Sweden
USA
Facility
Villa 25 de Mayo
I.R.D., Rio deJaneiro
Uplands airport
Ris0
Soreq
Lanseria
Borlänge
Walker Field
Aggregatematerial
River sand(orthose feldspar)
Beach sand(mainly quartz)
Glaciated derivedgravel + hematite
Beach sand
Beach gravel *)
Bushveld norite
Limestone
Masonry sand
% K
2.3
0.1
1.7
1.1
0.2
0.2
0.4
1.5
ppm
6
0.
2.
0.
0.
1.
1.
2.
eU
6
4
3
6
1
5
2
ppm
7
1.
8.
2.
0.
1.
2.
6.
eTh
5
9
4
9
7
4
3
)used without a cement binder
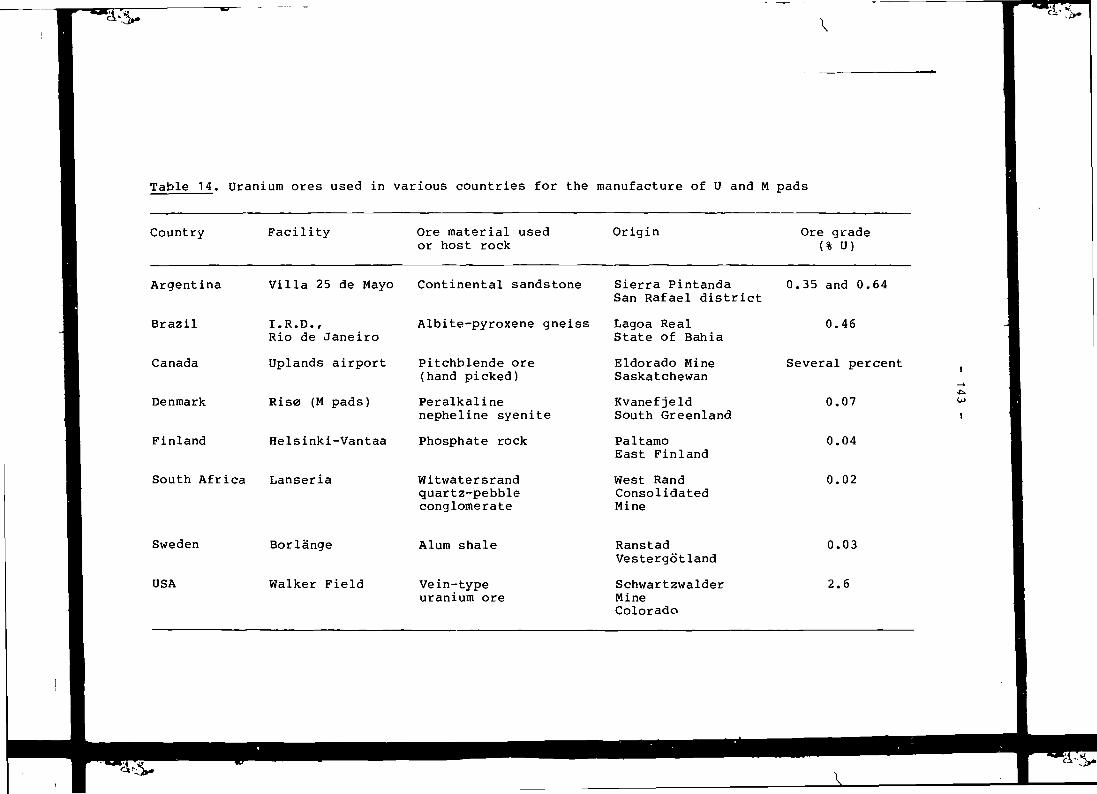
Table 14. Uranium ores used in various countries for the manufacture of U and M pads
Country Facility Ore material usedor host rock
Origin Ore grade(% U)
Argentina
Brazil
Canada
Denmark
Finland
Villa 25 de Mayo Continental sandstone
I.R.D.,Rio de Janeiro
Uplands airport
Riso (M pads)
Albite-pyroxene gneiss
Pitchblende ore(hand picked)
Peralkalinenepheline syenite
Helsinki-Vantaa Phosphate rock
South Africa Lanseria Witwatersrandquartz-pebbleconglomerate
Sierra PintandaSan Rafael district
Lagoa RealState of Bahia
Eldorado MineSaskatchewan
KvanefjeldSouth Greenland
PaltamoEast Finland
West RandConsolidatedMine
0.35 and 0.64
0.46
Several percent
0.07
0.04
0.02
OJ
I
Sweden
USA
Borlänge
Walker Field
Alum shale
Vein-typeuranium ore
RanstadVestergotland
SchwartzwalderMineColorado
0.03
2.6
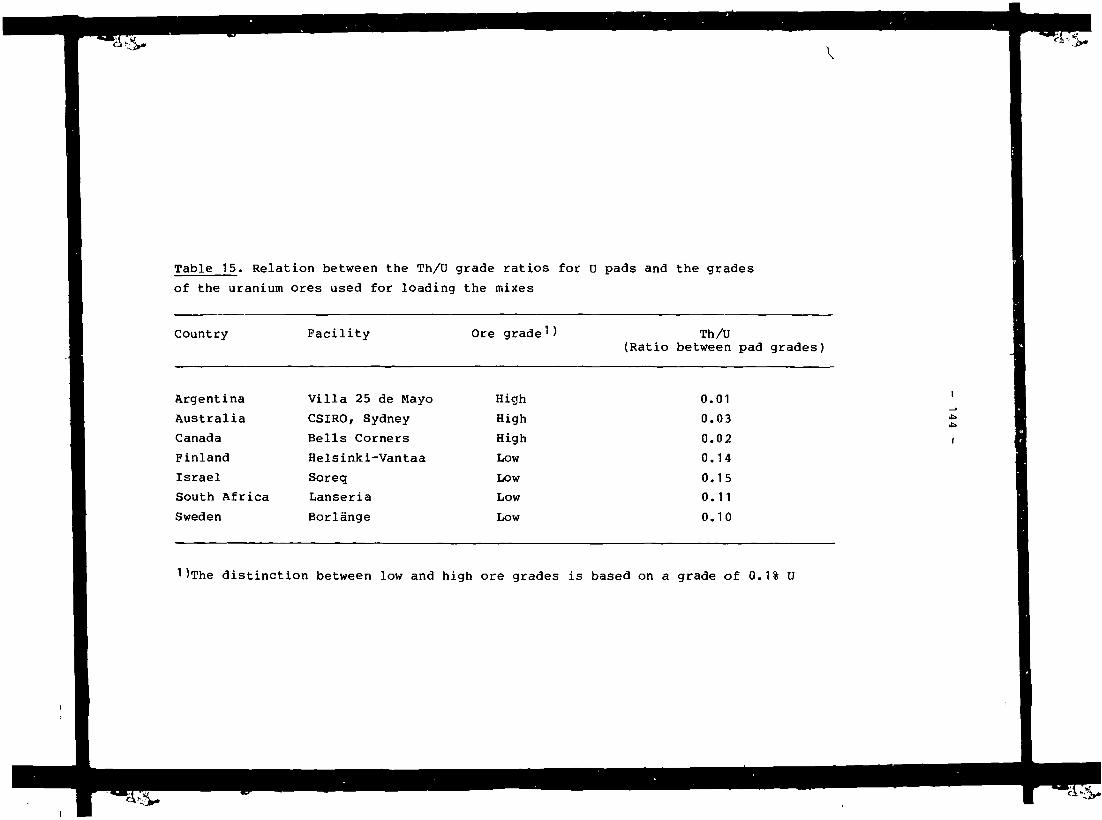
• • - & •
Table 15. Relation between the Th/U grade ratios for U pads and the grades
of the uranium ores used for loading the mixes
Country Facility Ore grade1 ) Th/U(Ratio between pad grades)
Argentina
Australia
Canada
Finland
Israel
South Africa
Sweden
Villa 25 de Mayo
CSIRO, Sydney
Bells Corners
Helsinki-Vantaa
Soreq
Lanseria
Borlänge
High
High
High
Low
LowLow
Low
0.01
0.03
0.02
0.14
0.15
0.11
0.10
)The distinction between low and high ore grades is based on a grade of 0.1% U

Table 16. Thorium admixtures and resulting U/Th grade ratios for T pads
Country Facility Thorium U/Thadmixture (Ratio between pad grades)
Australia
Brazil
Canada
Denmark
Finland
South Africa
Sweden
CSIRO, Sydney
I.R.D., Rio de Janeiro
Uplands airport
Bells Corners
Ris0
Helsinki-Vantaa
Lanseria
Borlänge
Monazite
Monazite
Thorite
Thorium oxide
Monazite
Granitic rock
Monazite
Diorite
0.05
0.04
0.07
0.04
0.05
0.11
0.03
0.07
Ul
i

- 146 -
Table 17. Calculated ratios between an analysed pad radioelement
concentration and the corresponding radiometric in-situ grade for
the pad
Ratio laboratory grade/in-situ grade
Pad moisture
Mix sample crushedand dried (x^/x)
Mix sample sealedin assay can (x'/x)
2
6
10
1.06
1.10
1.14
0.96
1.00
1.04
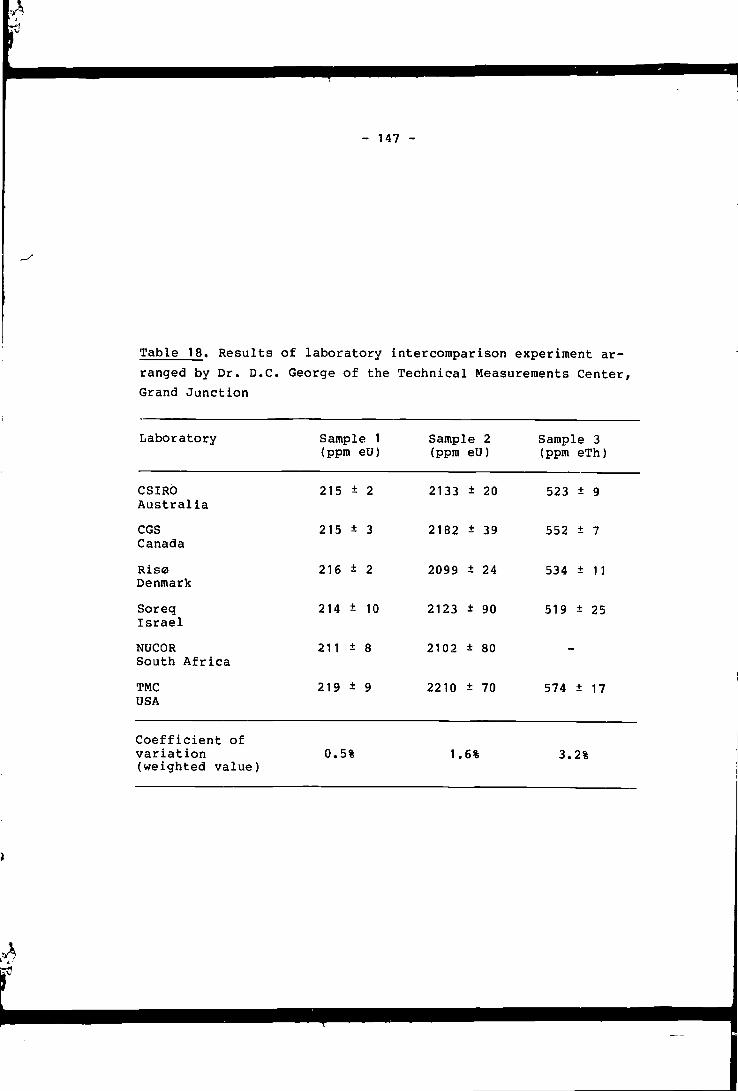
- 147 -
Table 18. Results of laboratory intercomparison experiment ar-
ranged by Dr. D.C. George of the Technical Measurements Center,
Grand Junction
Laboratory
CSIROAustralia
CGSCanada
RisoDenmark
SoreqIsrael
NUCORSouth Africa
TMCUSA
Coefficient ofvariation(weighted value)
Sample 1(ppm eU)
215 ± 2
215 ± 3
216 ± 2
214 ± 10
211 ± 8
219 ± 9
0.5%
Sample 2(ppm eU)
2133 ± 20
2182 ± 39
2099 ± 24
2123 ± 90
2102 ± 80
2210 ± 70
1.6%
Sample 3(ppm eTh)
523 ± 9
552 ± 7
534 ± 11
519 ± 25
-
574 ± 17
3.2%
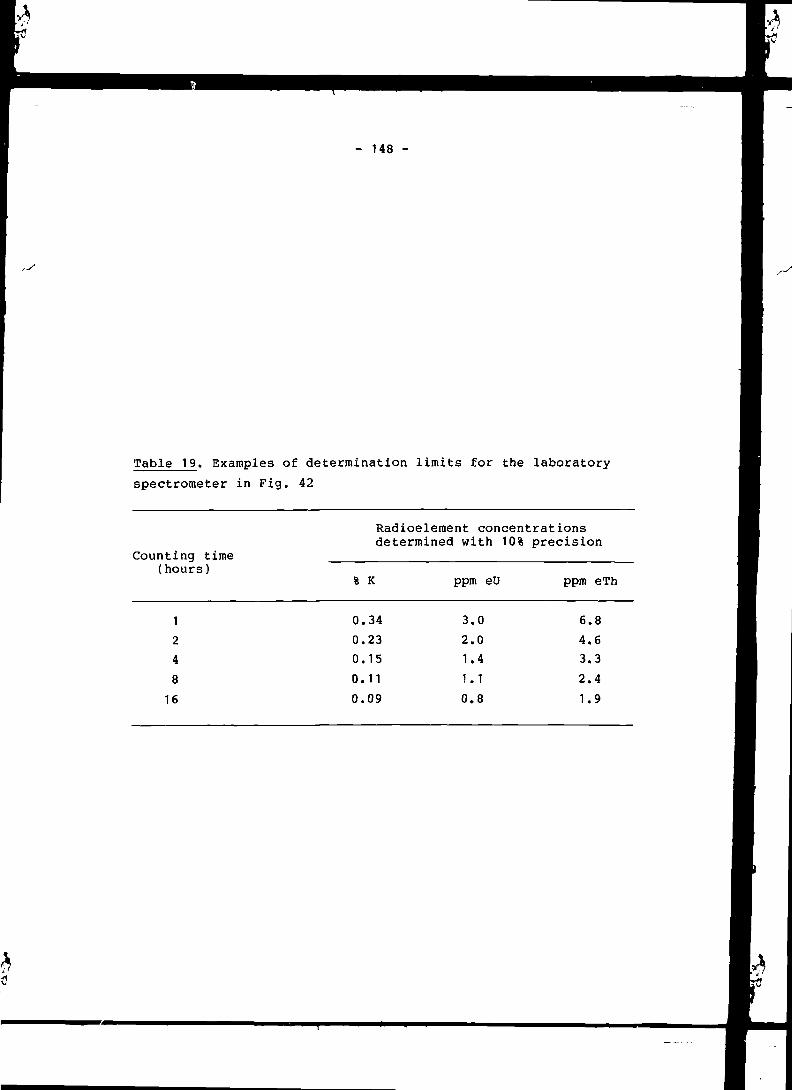
M
- 148 -
Table 19. Examples of determination limits for the laboratory
spectrometer in Fig. 42
Counting time(hours)
Radioelement concentrationsdetermined with 10% precision
% K ppm eU ppm eTh
1
2
4
8
16
0.340.230.15
0.11
0.09
3.0
2.0
1.4
1.1
0 .8
6.8
4 .6
3.3
2 .4
1.9
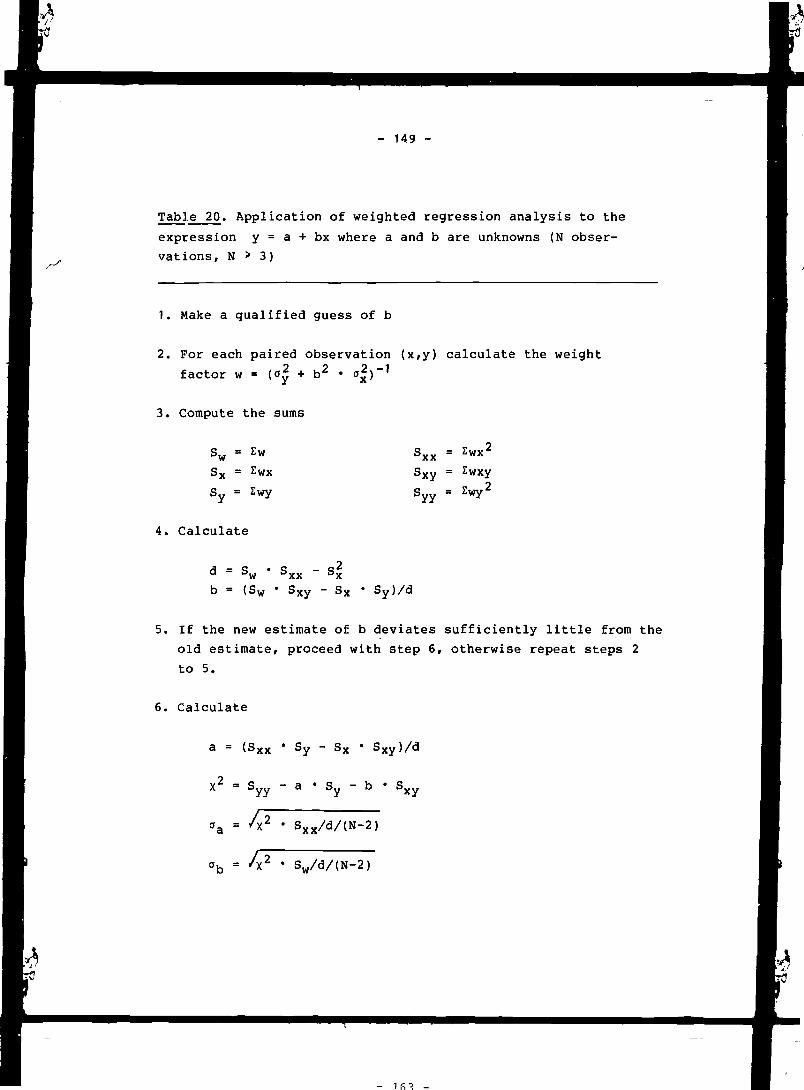
- 149 -
Table 20. Application of weighted regression analysis to the
expression y = a + bx where a and b are unknowns (N obser-
vations, N > 3)
1. Make a qualified guess of b
2. For each paired observation (x,y) calculate the weight
factor w = (<!„ + b • 0»)
3. Compute the sums
°WSx =
3Y "
S x y = Zwxy
pyy
4. Calculate
" faw bxx sxb = (Sw * SXy - S x • Sy)/d
5. If the new estimate of b deviates sufficiently little from the
old estimate, proceed with step 6, otherwise repeat steps 2
to 5.
6. Calculate
a = (Sxx • Sy - Sx • Sxy)/d
syy a ' sy b sxy
sxx/d/(N-2)
= A2 ' Sw/d/(N-2)
- 1
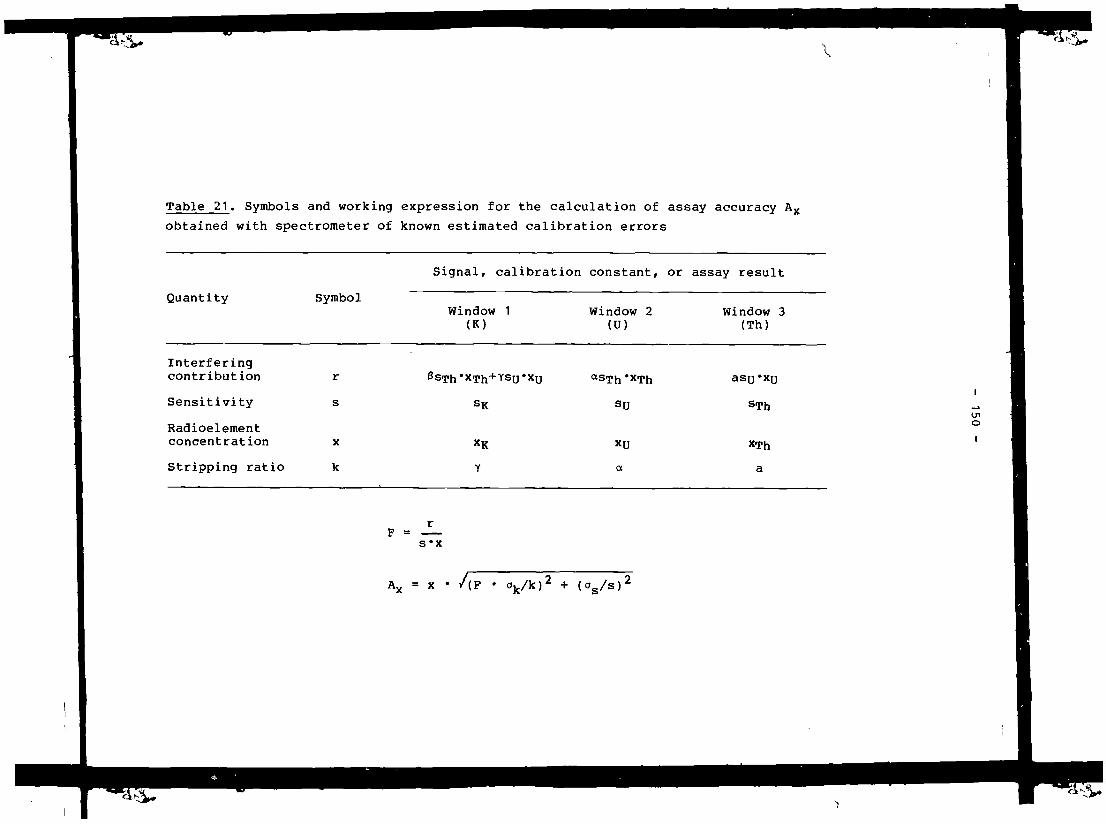
Table 21. Symbols and working expression for the calculation of assay accuracy Ax
obtained with spectrometer of known estimated calibration errors
Quantity Symbol
Signal, calibration constant, or assay result
Window 1(K)
Window 2(U)
Window 3(Th)
Interfering
contribution r
Sensitivity s
Radioelementconcentration xStripping ratio k
*XU
XU
a
O
S"X
Ax = x /( + (°s/sr
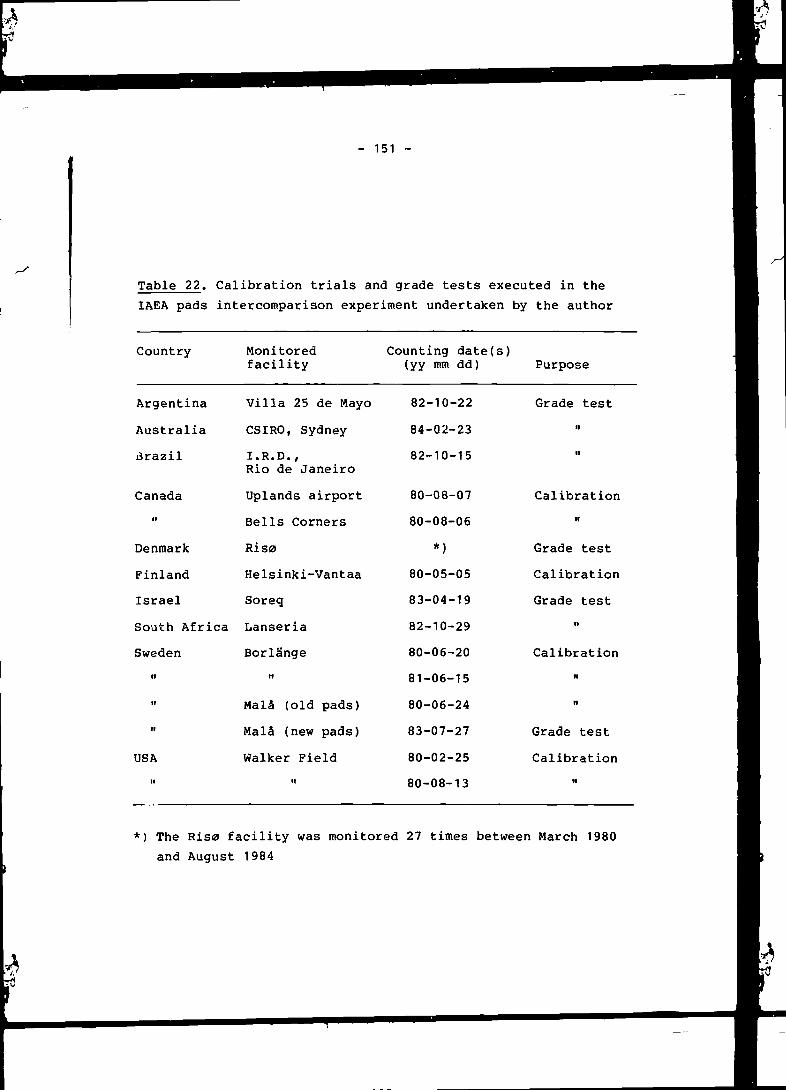
- 151 -
Table 22. Calibration trials and grade tests executed in the
IAEA pads intercomparison experiment undertaken by the author
Country Monitoredfacility
Counting date(s)(yy mm dd) Purpose
Argentina
Australia
Brazil
Canada
n
Denmark
Finland
Israel
South Africa
Sweden
USA
Villa 25 de Mayo
CSIRO, Sydney
I.R.D.,
Rio de Janeiro
Uplands airport
Bells Corners
Riso
Helsinki-Vantaa
Soreg
Lanseria
Borlänge
n
Malä (old pads)
Mala (new pads)
Walker Field
82-10-22
84-02-23
82-10-15
80-08-07
80-08-06
*)
80-05-05
83-04-19
82-10-29
80-06-20
81-06-15
80-06-24
83-07-27
80-02-25
80-08-13
Grade test
Calibration
n
Grade test
Calibration
Grade test
n
Calibration
Grade test
Calibration
*) The Ris0 facility was monitored 27 times between March 1980
and August 1984

\
Table 23. Experimental GR-410 stripping ratios and resulting mean values with
standard deviations *)
Country Facility used
Stripping ratio
Canada Uplands airport 0.661*0.053 0.618*0.12611 Bells Corners 0.561±0.013 0.468±0.014
Finland Helsinki-Vantaa 0.580*0.029 0.498*0.051
Sweden Borlänge and Mala 0.602±0.025 0.543*0.026
USA Walker Field 0.601*0.016 0.494*0.024
0.755±0.243
0.770±0.008
0.803*0.045
0.779*0.021
0.751*0.017
0.035*0.001
0.041*0.008
0.040*0.005
0.022*0.006
I
Ul
F
a
0.5830.026
0.020
1.72
0.020
0.009 (1.5%)
3.52
4.19
0.4880.0330.024
1.92
0.024
0.011 (2.3%)
0.7690.0110.015
0.48
0.015
0.007 (0.9%)
0.0350.011
0.002
1.87
0.002
0.001 (2.9%)
5 observations: F1Q (4,5)
4 " : F10 (3,4)
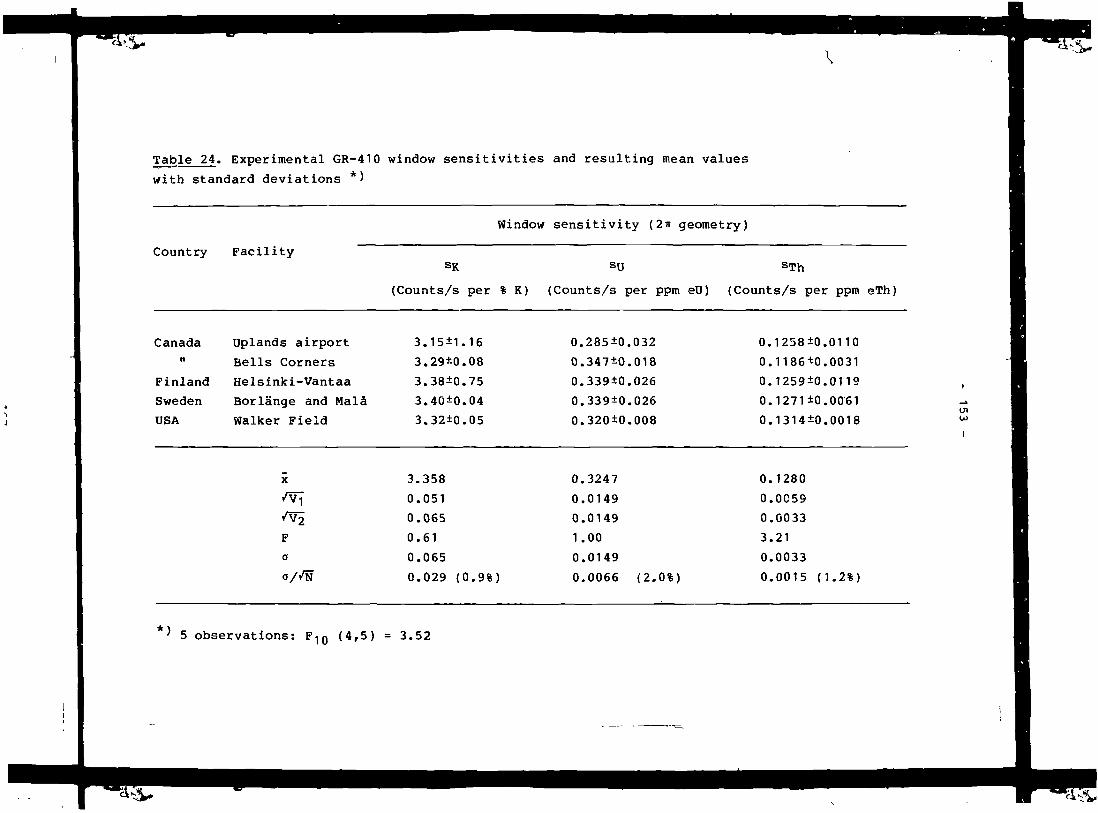
Table 24. Experimental GR-410 window sensitivities and resulting mean values
with standard deviations *)
Country Facility
Window sensitivity (2ir geometry)
sK SU s T n
(Counts/s per % K) (Counts/s per ppm eU) (Counts/s per ppm eTh)
Canada Uplands airport
" Bells Corners
Finland Helsinki-Vantaa
Sweden Borlänge and Mala
USA Walker Field
3.15±1.16
3.29*0.08
3.38±0.75
3.40±0.04
3.32±0.05
3.358
0.051
0.065
0.61
0.065
0.029 (0.9%)
0.285±0
0.347±0
0.339±0
0.339±0
0.320±0
0.3247
0.0149
0.0149
1.00
0.0149
0.0066
.032
.018
.026
.026
.008
(2.
0.1258*0.0110
0.1186*0.0031
0.1259*0.0119
0.1271±0.0061
0.1314*0.0018 U)
F
a
0.1280
0.0059
0.0033
3.21
0.0033
0.0015 (1.2%)
5 observations: F10 (4,5) = 3.52
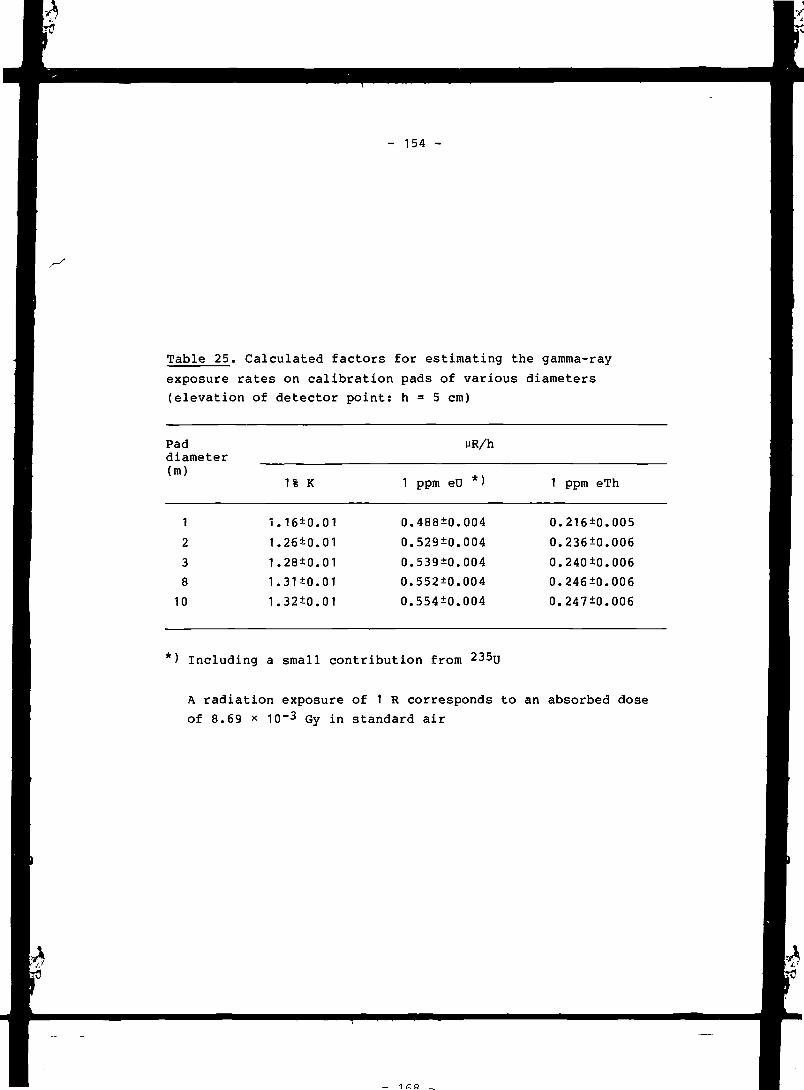
- 154 -
Table 25. Calculated factors for estimating the gamma-ray
exposure rates on calibration pads of various diameters
(elevation of detector point: h = 5 cm)
Paddiameter(m)
1
2
3
8
10
1% K
1.16*0.01
1.26±0.01
1.28±0.01
1.31±0.01
1.32*0.01
nR/h
1 ppm eU *)
0.488±0.004
0.529±0.004
0.539±0.004
0.552±0.004
0.554±0.004
1 ppm eTh
0.216*0.005
0.236±0.006
0.240±0.006
0.246*0.006
0.247±0.006
*) Including a small contribution from 235u
A radiation exposure of 1 R corresponds to an absorbed dose
of 8.69 x 10"3 Gy in standard air
U
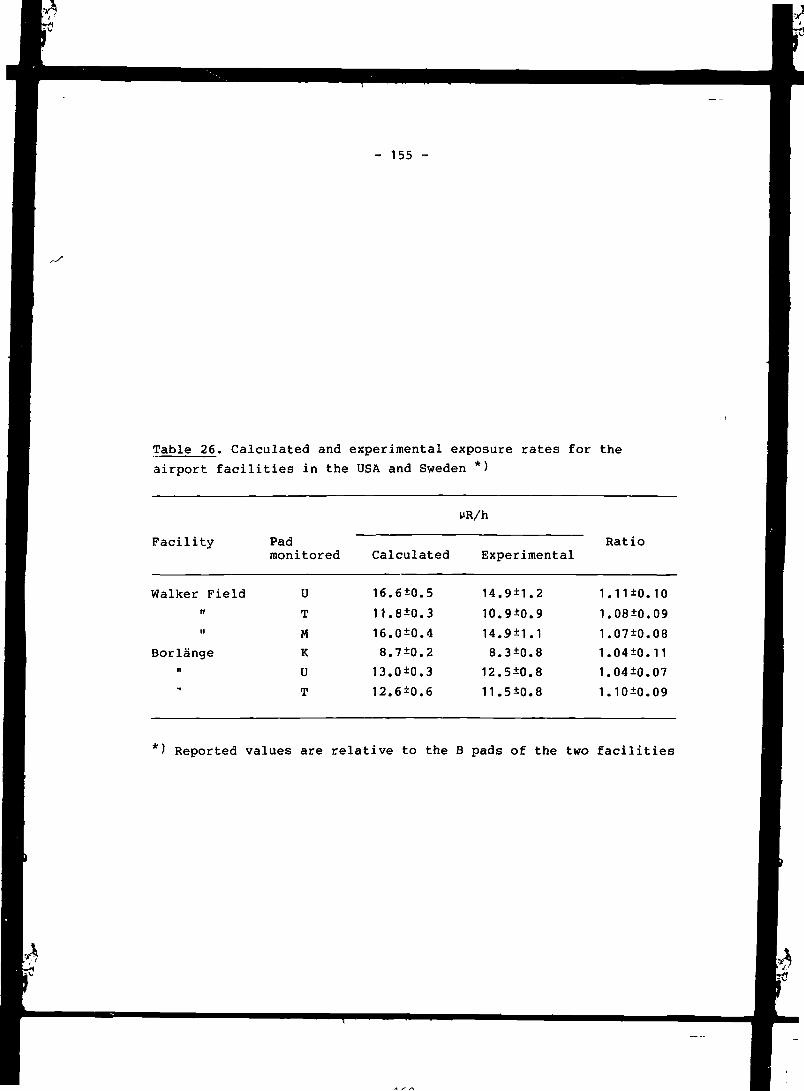
- 155 -
Table 26. Calculated and experimental exposure rates for the
airport facilities in the
Facility
Walker Fieldn
n
Borlängen
Padmonitored
U
T
M
K
U
T
USA and Sweden *)
Calculated
16.6±0.5
11.8*0.3
16.0±0.4
8.7±0.2
13.0±0.3
12.6*0.6
uR/h
Experimental
14.9±1.2
10.9±0.9
8.3±0.8
12.5*0.8
11.5±0.8
Ratio
1.11±0.10
1.08*0.09
1.07±0.08
1.04*0.11
1.04*0.07
1.10*0.09
r) Reported values are relative to the B pads of the two facilities
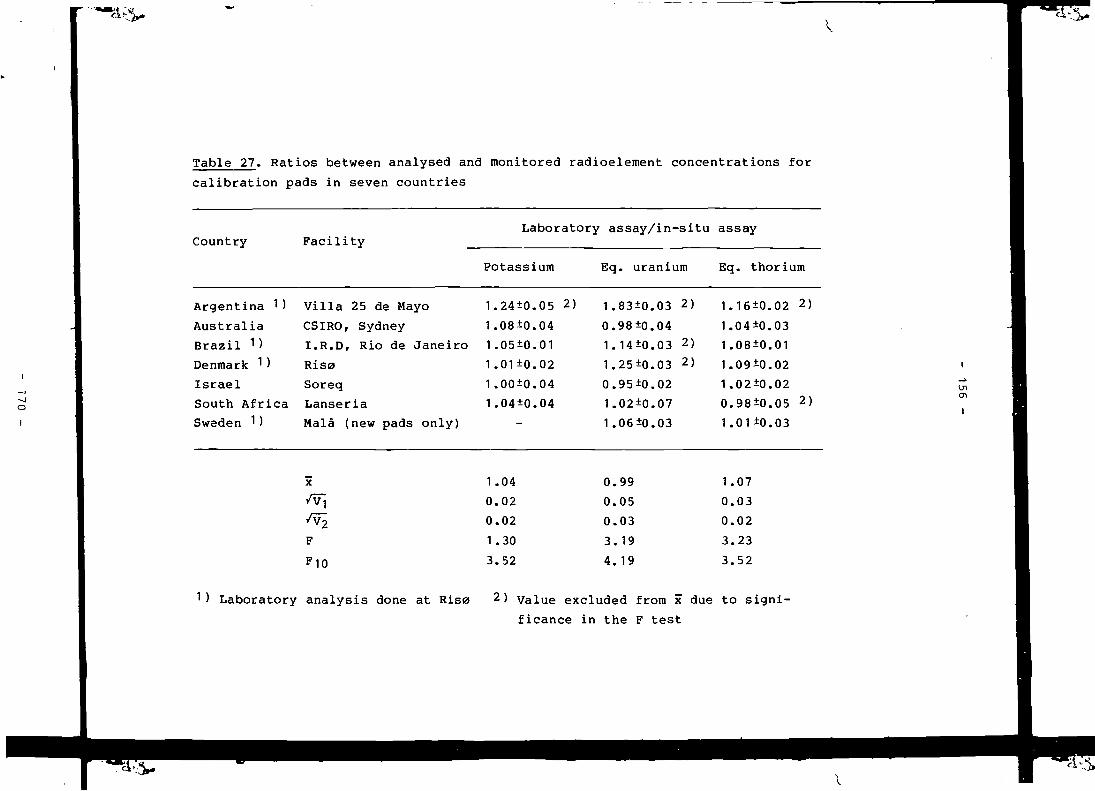
\
Table 27. Ratios between analysed and monitored radioelement concentrations for
calibration pads in seven countries
Country FacilityLaboratory assay/in-situ assay
Potassium Eq. uranium Eq. thorium
Argentina 1) Villa 25 de Mayo
O
I
Australia
Brazil 1)
Denmark 1)
Israel
South Africa
Sweden 1)
CSIRO, Sydney
I.R.D, Rio de Janeiro
Rise
Soreq
Lanseria
Mala (new pads only)
1.24±0.05 2)
1.08±0.04
1.05±0.01
1.01±0.02
1.00±0.04
1.04±0.04
1.83±0.03 2)
0.98*0.04
1.14±0.03 2)
1.25±0.03 2)
0.95±0.02
1.02±0.07
1.06±0.03
1.16±0.02 2)
1.04±0.03
1.08±0.01
1.09±0.02
1.02*0.02
0.98±0.05 2)
1.01±0.03
I
Ul
I
1) Laboratory analysis done at Riso
1 .
0 .
0 .
1 .
3 .
04
02
02
30
52
0.990.05
0.03
3.19
4.19
1.070.030.02
3.23
3.52
2) Value excluded from x due to signi-
ficance in the F test

- 157 -
FIGURES
- 171 -
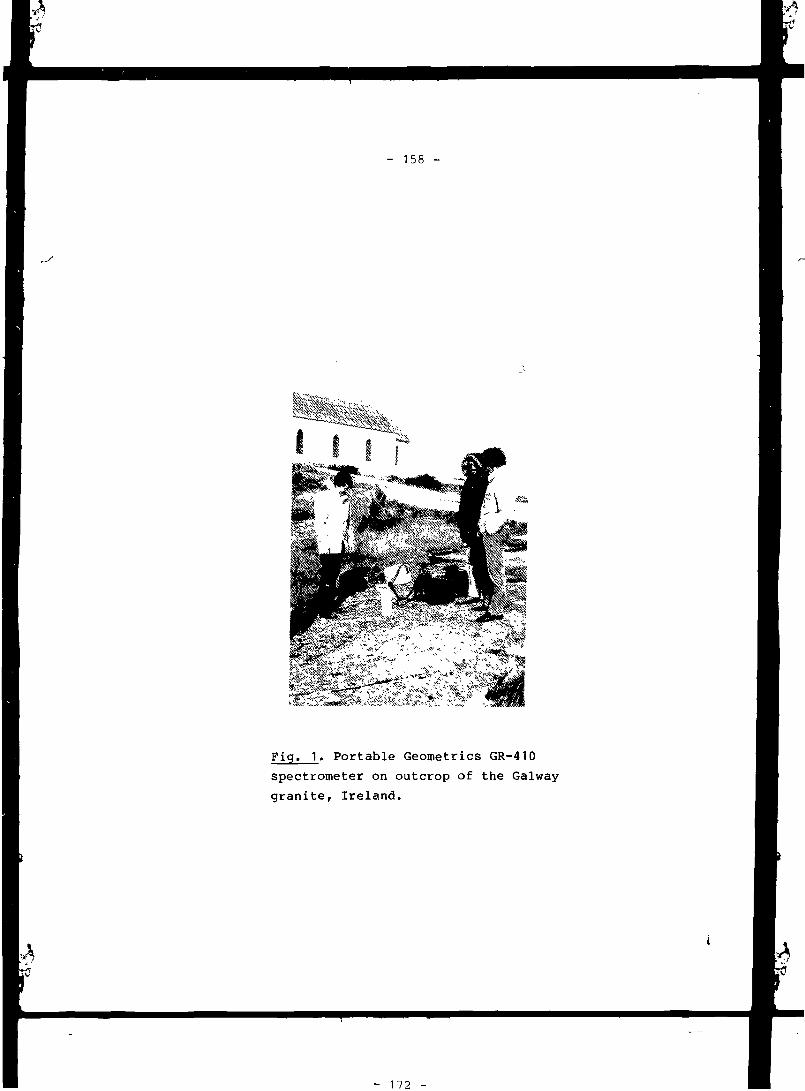
- 158 -
,* •«,:,*>«-
Pig. 1. Portable Geometries GR-410
spectrometer on outcrop of the Galway
granite, Ireland.
~ 172 -

- 159 -
0.0
Fig. 2. Energy distribution of potassium gamma radi-
ation on a ground with 1% K. The brace labelled "1"
shows the potassium window of a GR-410 spectrometer.

- 160 -
0.0
Fig. 3. Energy distribution of uranium (radium) gamma
radiation on a ground with 1 ppm eU. The brace label-
led "2" shows the uranium window of a GR-410 spectro-
meter.
- 174 -

- 161 -
Fig. 4. Energy distribution of thorium gamma radiation
on a ground with 1 ppm eTh. The brace labelled "3"
shows the thorium window of a GR-410 spectrometer.
- 175 -
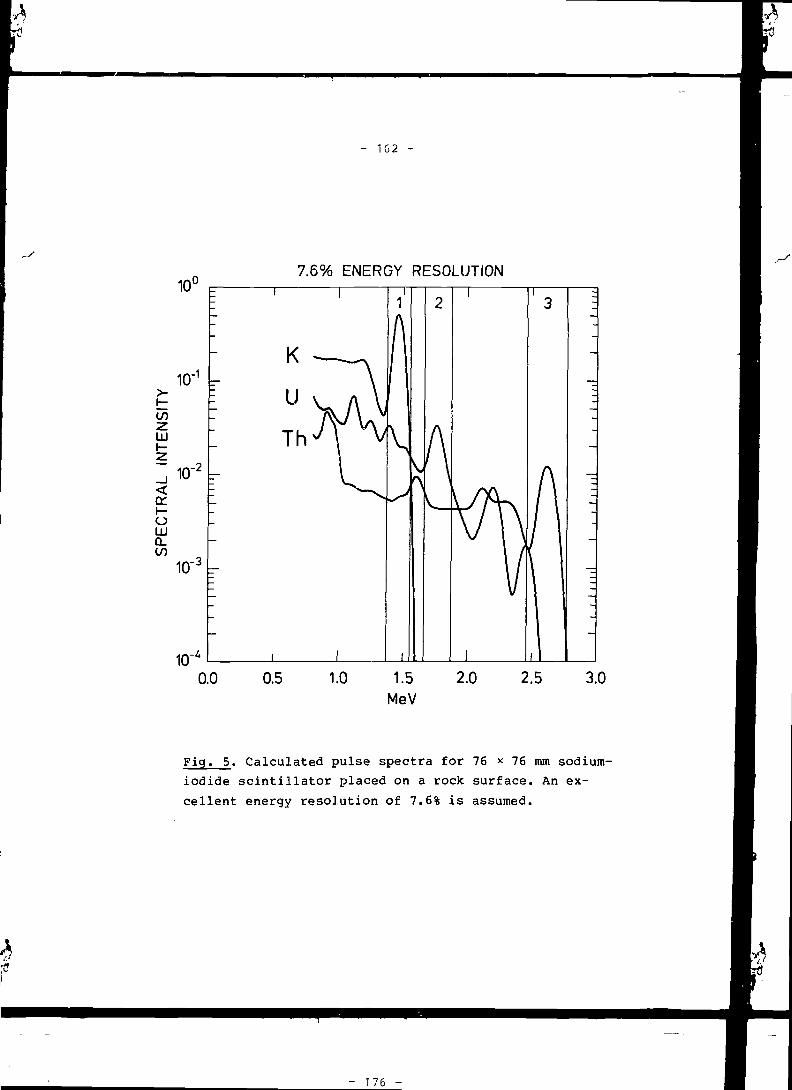
Ti*
- 1G2 -
7.6% ENERGY RESOLUTION
Fig. 5. Calculated pulse spectra for 76 * 76 mm sodium-
iodide scintillator placed on a rock surface. An ex-
cellent energy resolution of 7.6% is assumed.
- 176 -
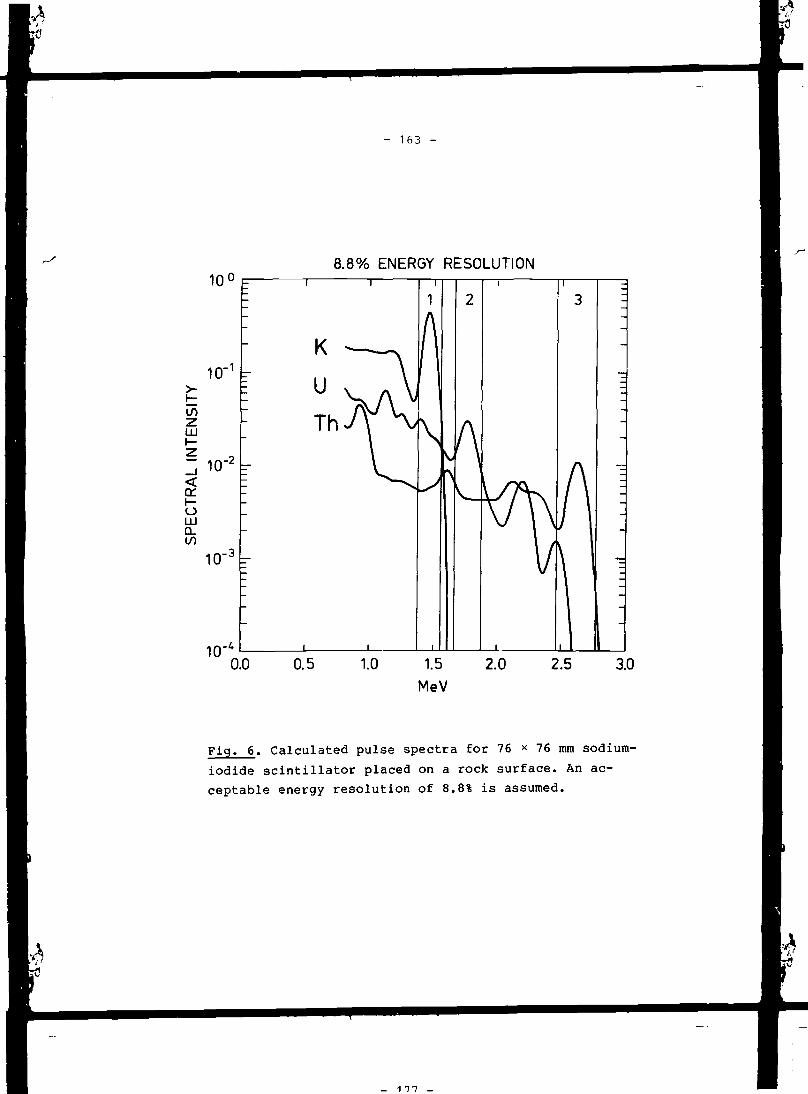
- 163 -
8.8% ENERGY RESOLUTION
10
Fig. 6. Calculated pulse spectra for 76 * 76 mm sodium-
iodide scintillator placed on a rock surface. An ac-
ceptable energy resolution of 8.8% is assumed.

- 164 -
10.0% ENERGY RESOLUTION
10-0.0 0.5 1.0 1.5 2.0
MeV
Fig. 7. Calculated pulse spectra for 76 * 76 mm
sodium-iodide scintillator placed on a rock surface.
A poor energy resolution of 10.0% is assumed.
- 178 -

- 165 -
+2% GAIN DRIFT
10
Fig. 3. Shifted peak positions in the energy windows
resulting from +2% photomultiplier gain drift.
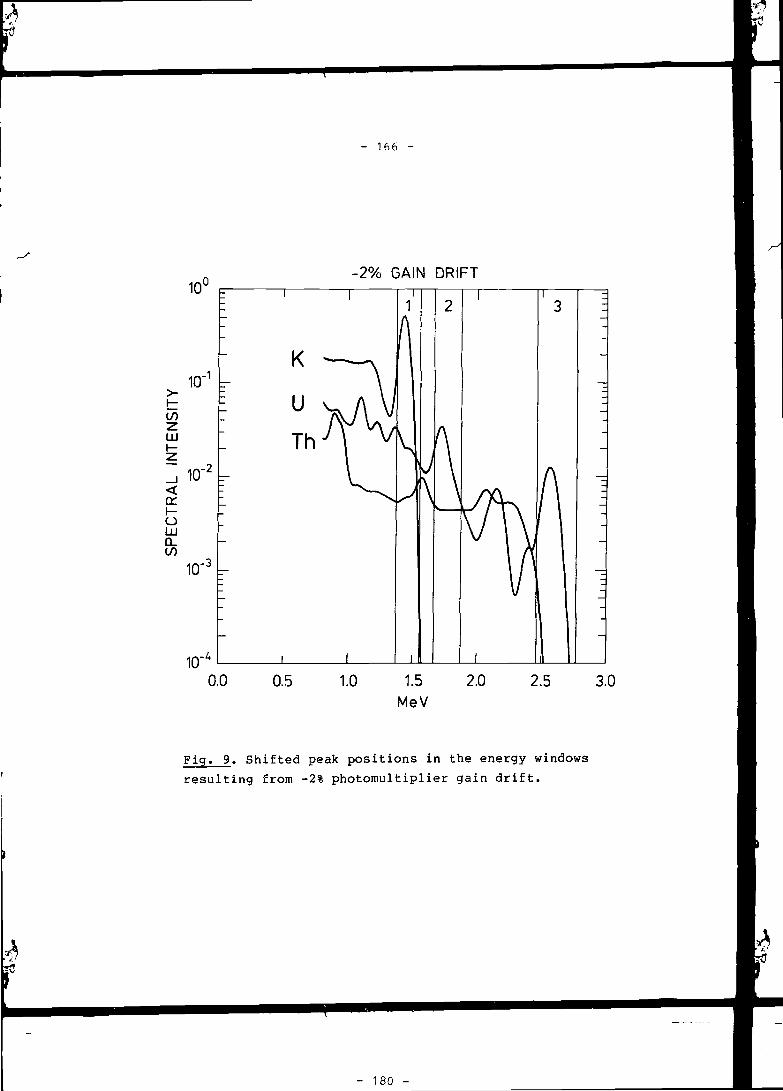
- 166 -
- 2 % GAIN DRIFT
1.5 2.0 2.5 3.010
0.0 0.5
Fig. 9. Shifted peak positions in the energy windows
resulting from -2% photomultiplier gain drift.
- 180 -

- 167 -
in
en
Z)OO
Rain
U window
Th window
12oo
JULY 27
100 12oo
JULY 28
"100
Fig. 10. Temporary increase in the uranium
count rate of GR-410 spectrometer placed
on "background" calibration pad at Mala,
Sweden. The effect is attributed to 214Bi
deposited on the pad surface by rain drops.
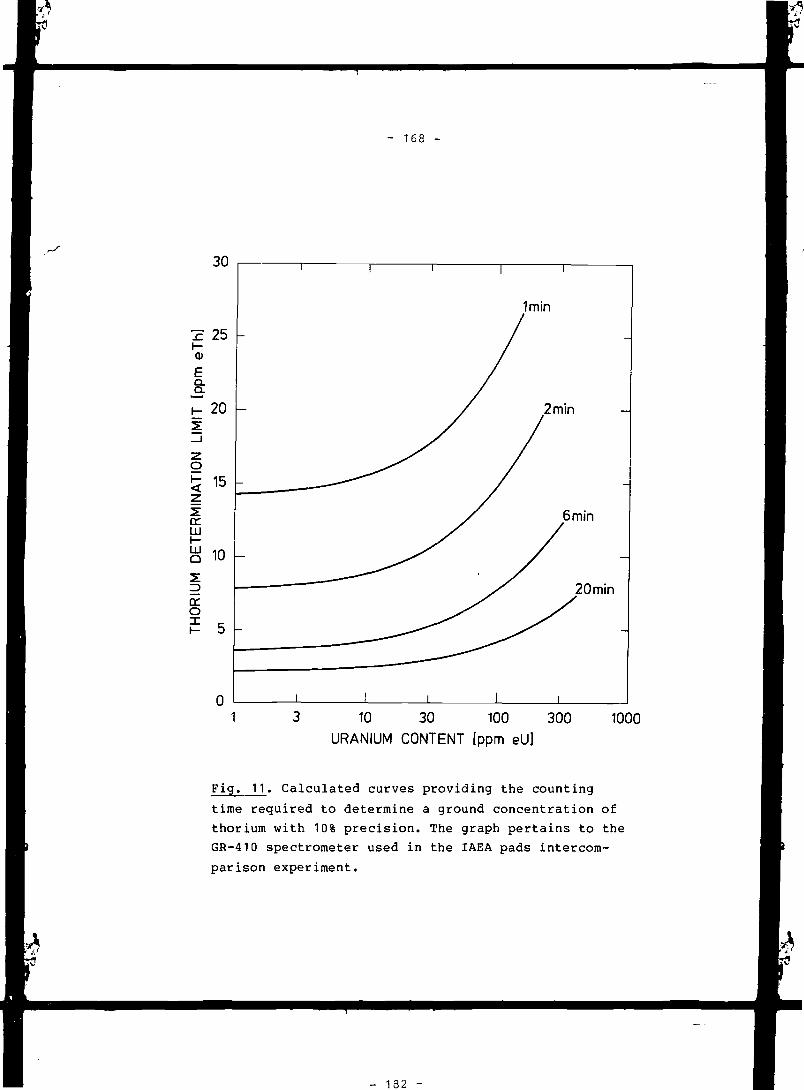
- 168 -
3 10 30 100 300URANIUM CONTENT [ppm eU]
1000
Fig. 11. Calculated curves providing the counting
time required to determine a ground concentration of
thorium with 10% precision. The graph pertains to the
GR-410 spectrometer used in the IAEA pads intercom-
parison experiment.
- 182 -
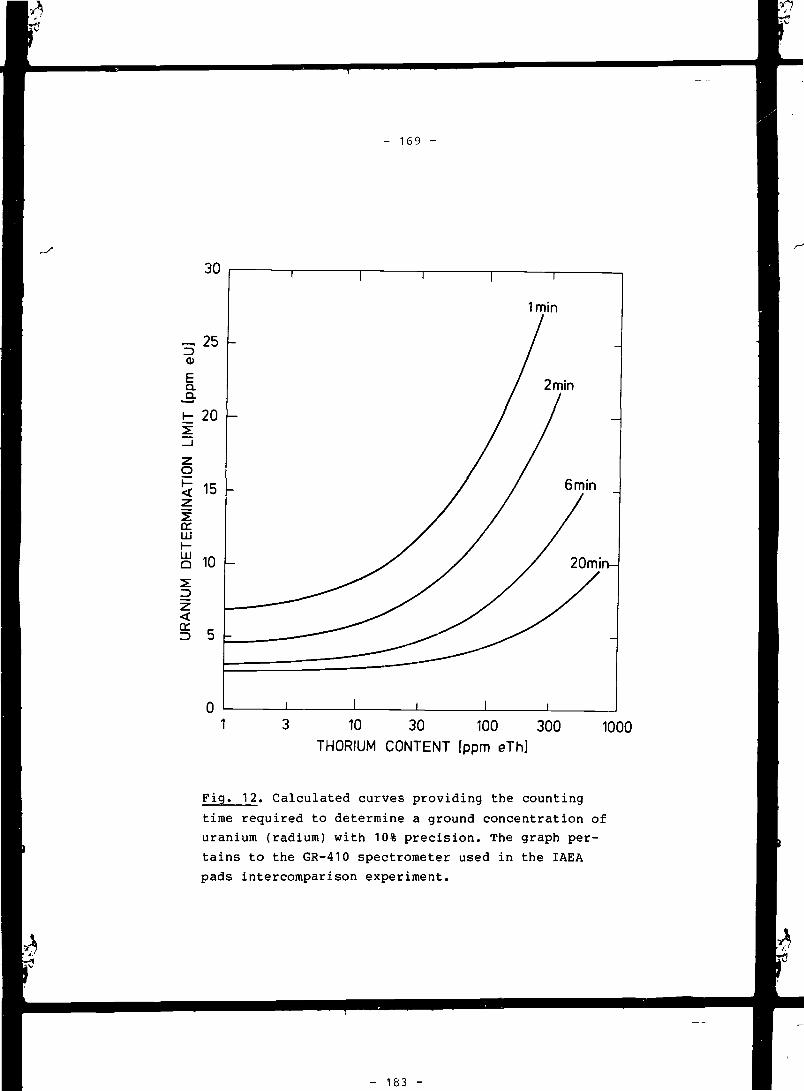
- 169 -
10 30 100 300THORIUM CONTENT [ppm eTh]
1000
Fig. 12. Calculated curves providing the counting
time required to determine a ground concentration of
uranium (radium) with 10% precision. The graph per-
tains to the GR-410 spectrometer used in the IAEA
pads intercomparison experiment.

- 170 -
3 10
CONTENT OF
30
URANIUM
100 300
+ THORIUM [ppm]1000
Fig. 13. Calculated curves providing the counting
time required to determine a ground concentration of
potassium with 10% precision. A thorium/uranium con-
centration ratio of 3 is assumed for the ground ma-
terial. The graph pertains to the GR-410 spectrometer
used in the IAEA pads intercomparison experiment.
U

- 171 -
Fig. 14. Light airborne gamma-ray spectrometer
designed by Risa National Laboratory and in-
stalled in Jet Ranger helicopter. Window counts
are recorded with a Scintrex GAD-6 portable
spectrometer.
M
- 185 -
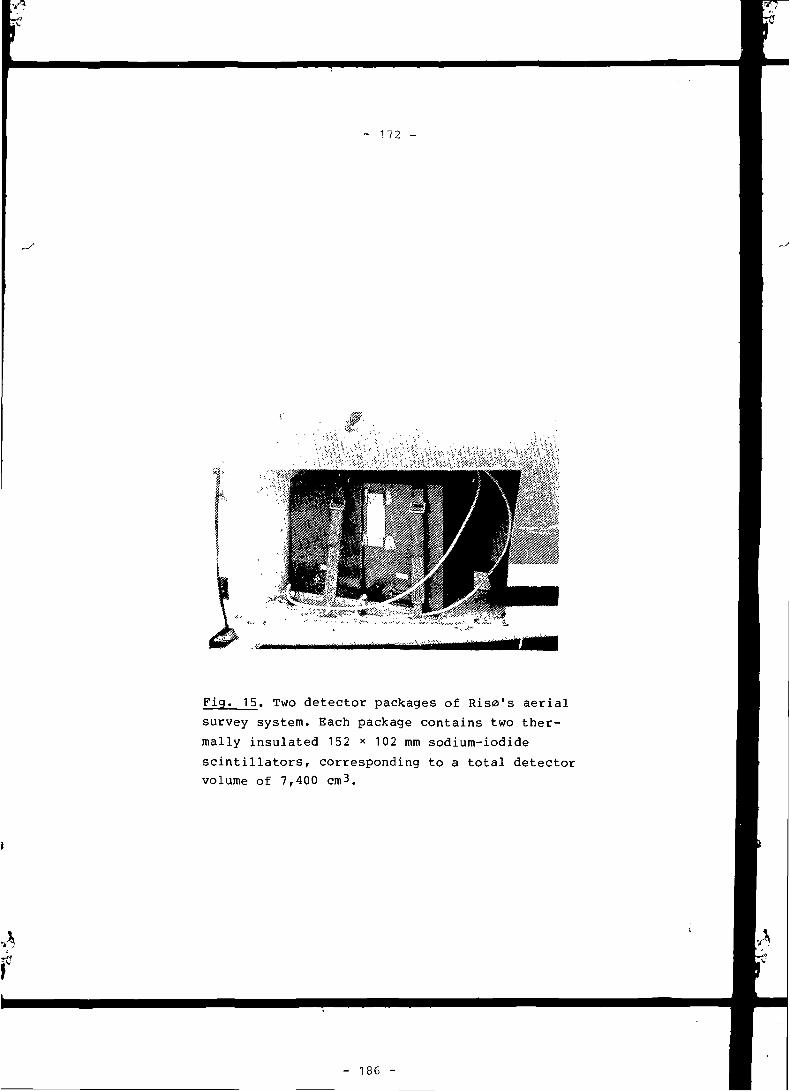
- 172 -
Fig. 15. Two detector packages of Riso's aerial
survey system. Each package contains two ther-
mally insulated 152 * 102 mm sodium-iodide
scintillators, corresponding to a total detector
volume of 7,400 cm3.
M
- 186 -
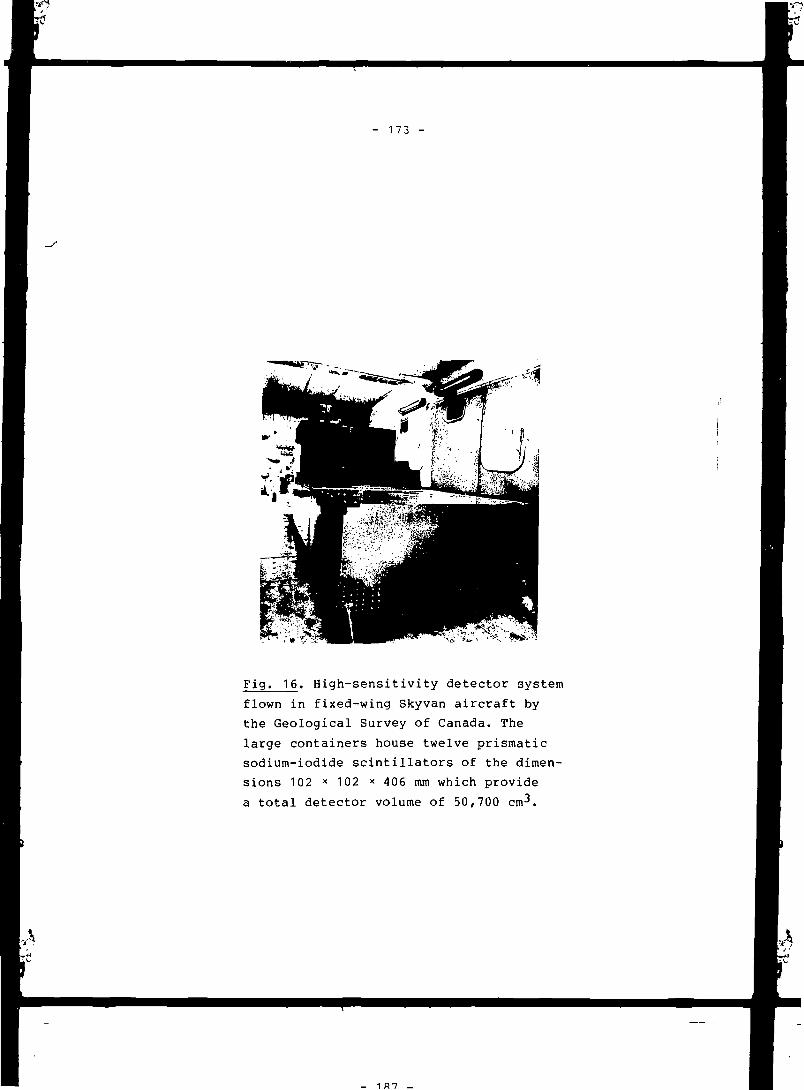
- 173 -
Fig. 16. High-sensitivity detector system
flown in fixed-wing Skyvan aircraft by
the Geological Survey of Canada. The
large containers house twelve prismatic
sodium-iodide scintillators of the dimen-
sions 102 x 102 x 406 mm which provide
a total detector volume of 50,700 cm-*.
- 1 «7 _
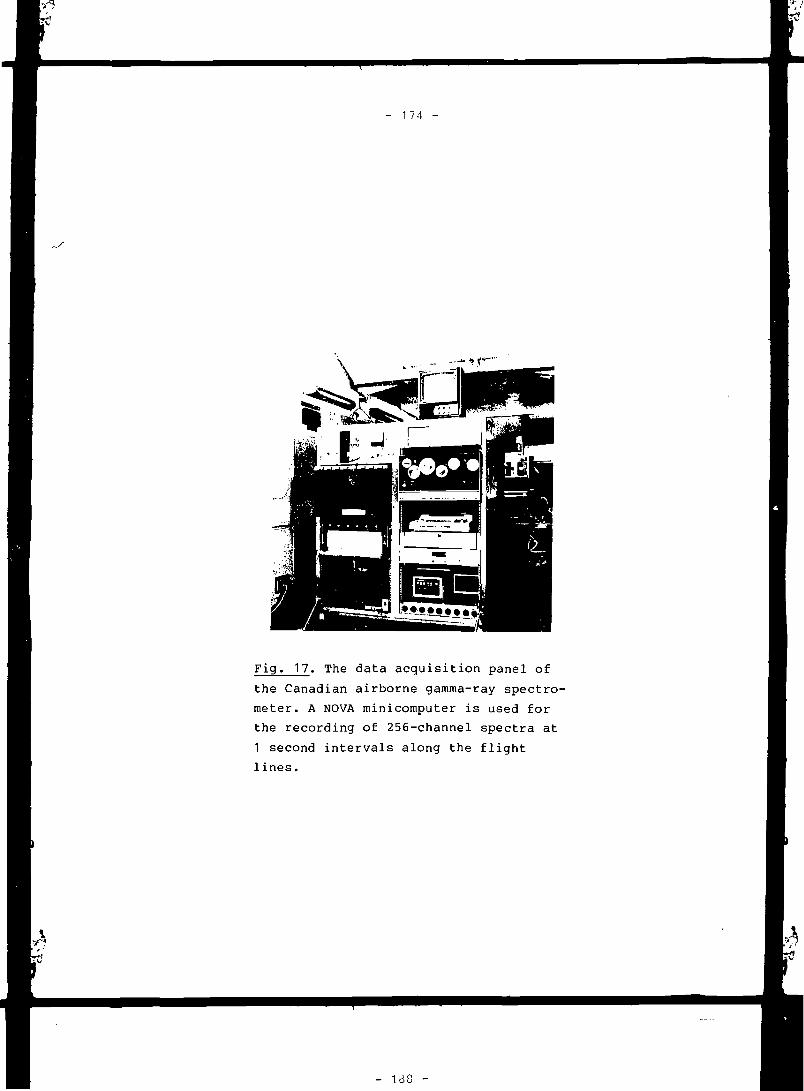
- 174 -
Fig. 17. The data acquisition panel of
the Canadian airborne gamma-ray spectro-
meter. A NOVA minicomputer is used for
the recording of 256-channel spectra at
1 second intervals along the flight
lines.
- 1 i

- 175 -
1.5 2.0 2.5 3.00.0 0.5
Fig. 18. Energy distribution of potassium gamma radi-
ation 125 m over a ground with 1% K.
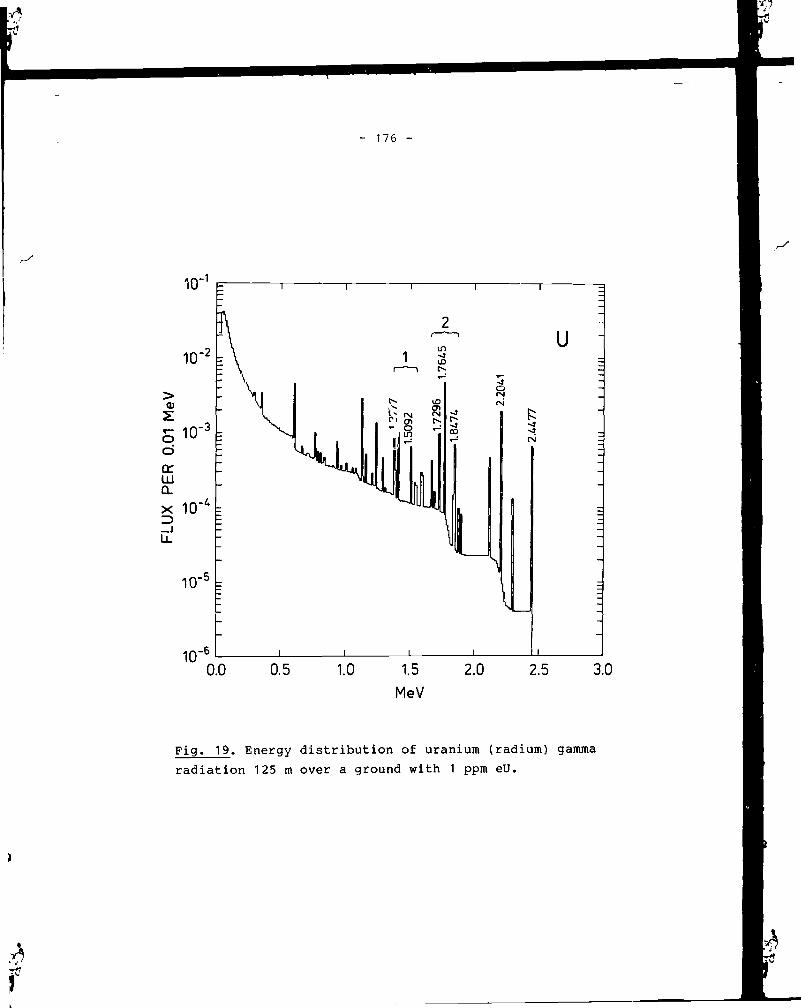
- 176 -
Fig» 19. Energy distribution of uranium (radium) gamma
radiation 125 m over a ground with 1 ppm eU.
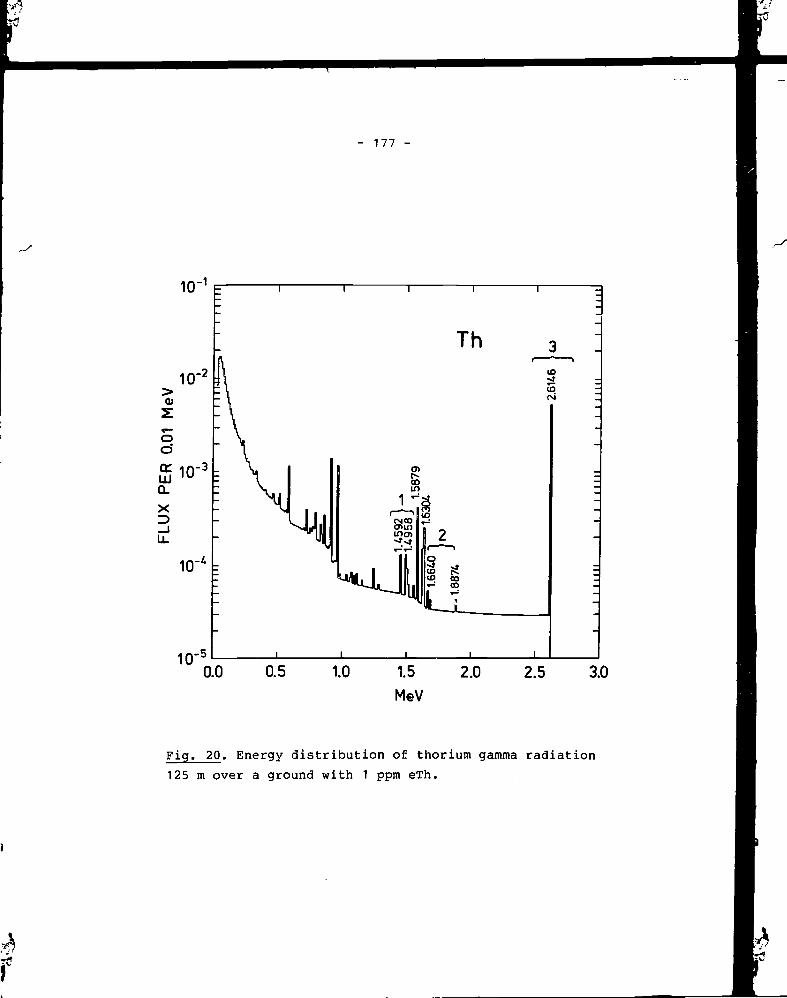
- 177 -
Fig. 20. Energy distribution of thorium gamma radiation
125 m over a ground with 1 ppm eTh.

- 178 -
2000 4000DETECTOR VOLUME
6000 8000
Fig. 21. Theoretical potassium window sensi-
tivities for 102 mm thick sodium-iodide de-
tectors in survey heights of 0, 50, and 125 m.
te
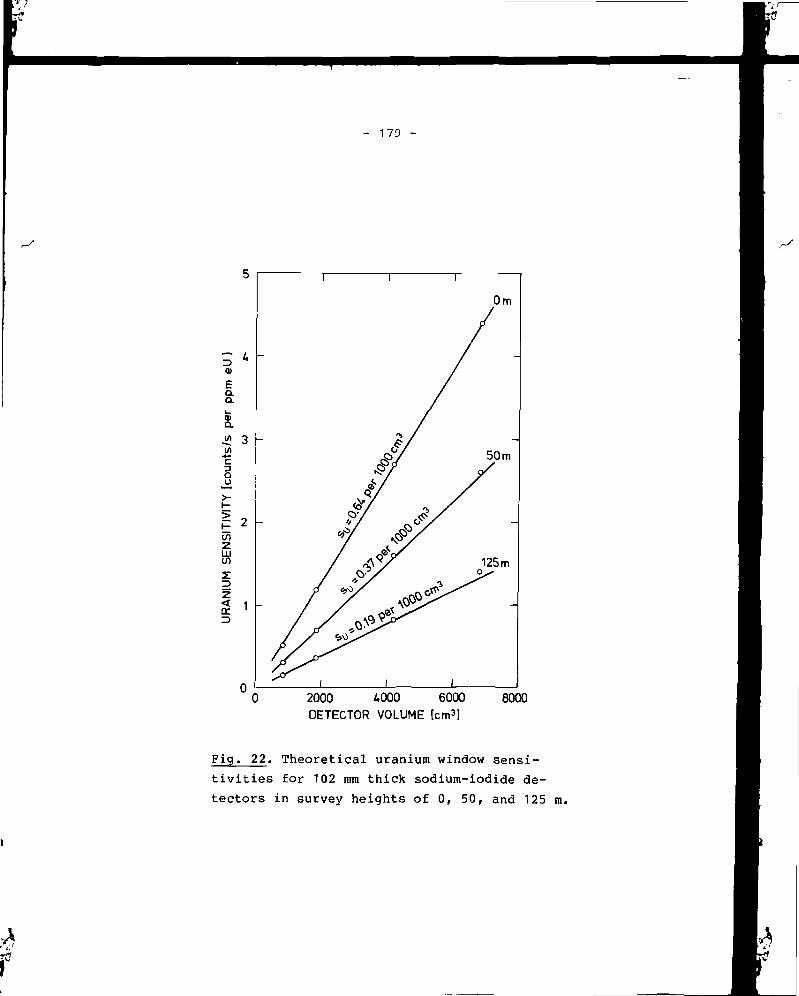
- 179 -
2000 AOOO 6000
DETECTOR VOLUME [cm 3 ]8000
Fig. 22. Theoretical uranium window sensi-
tivities for 102 mm thick sodium-iodide de-
tectors in survey heights of 0, 50, and 125 m.
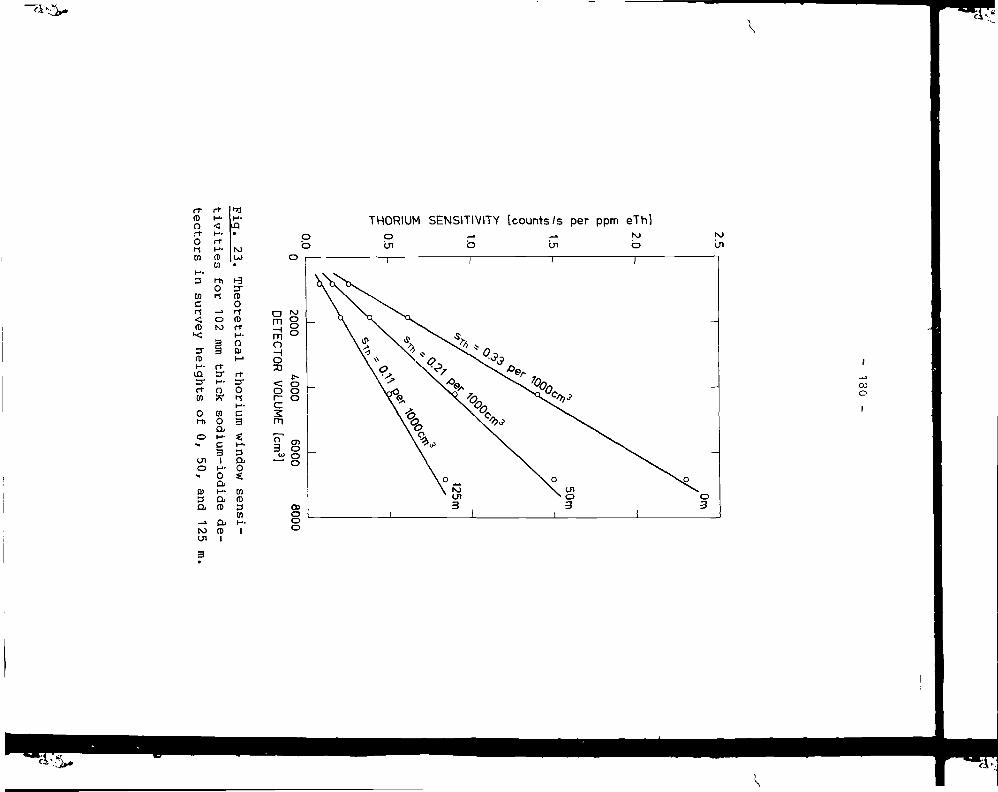
(DO
br(tn
3
COCrt<(D
3*(DH -ID3"n-O)
Oi-ti
O
U IO
••
O)3a
to
rtH-<
rrH-(Dtn
rhO
OM
3£3
rr3*H -O
COO
aH -C3I
H -OO.UiH-Q i(D
Qi(DI
^gH -ID
to
•
3"(DOr j(DrrI — ' •
OQ)M
rr3"OrsH-C3
H -3aO
CD(D3COHI
THORIUM SENSITIVITY [counts/s per ppm eTh]
CX)O
-.&•
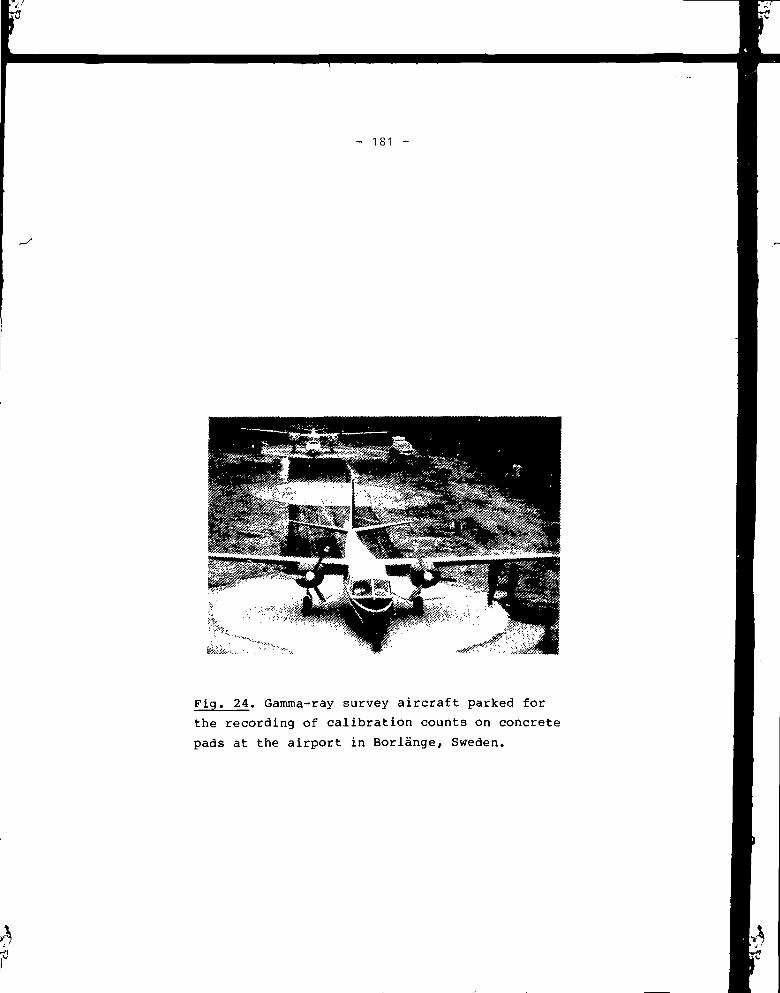
- 181 -
Fig. 24. Gamma-ray survey aircraft parked for
the recording of calibration counts on concrete
pads at the airport in Boriange, Sweden.
to
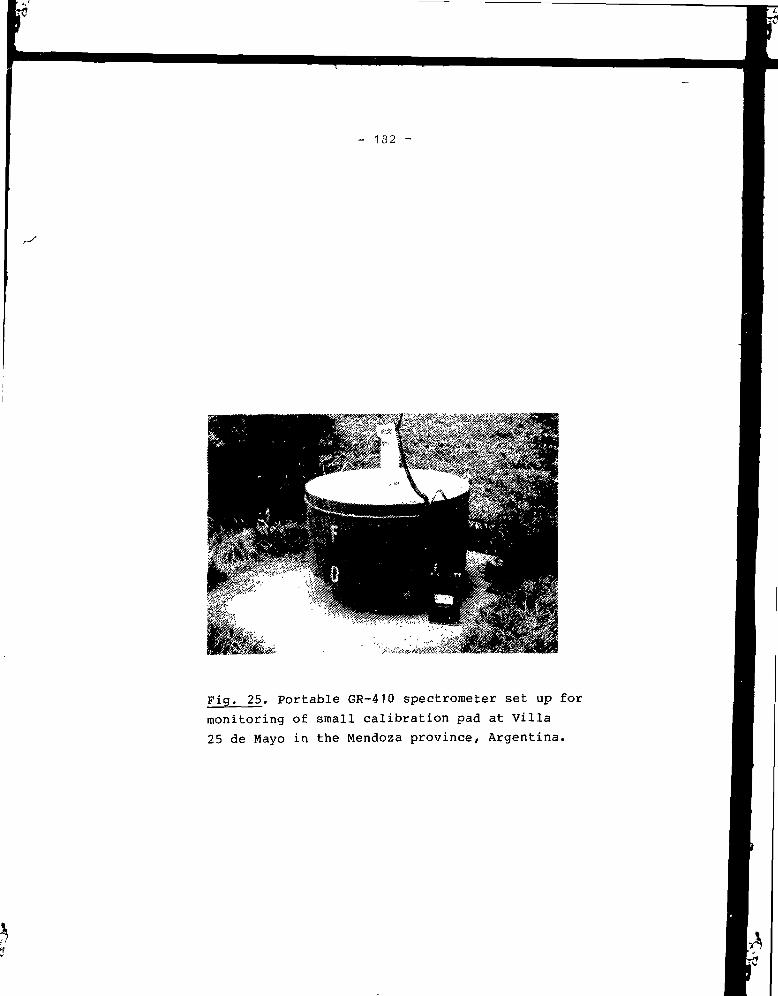
- 132 -
Fig. 25. Portable GR-410 spectrometer set up for
monitoring of small calibration pad at Villa
25 de Mayo in the Mendoza province, Argentina.
W

- 183 -
Fig. 26. Calibration of airborne detector package
using pads available at Risa National Laboratory.
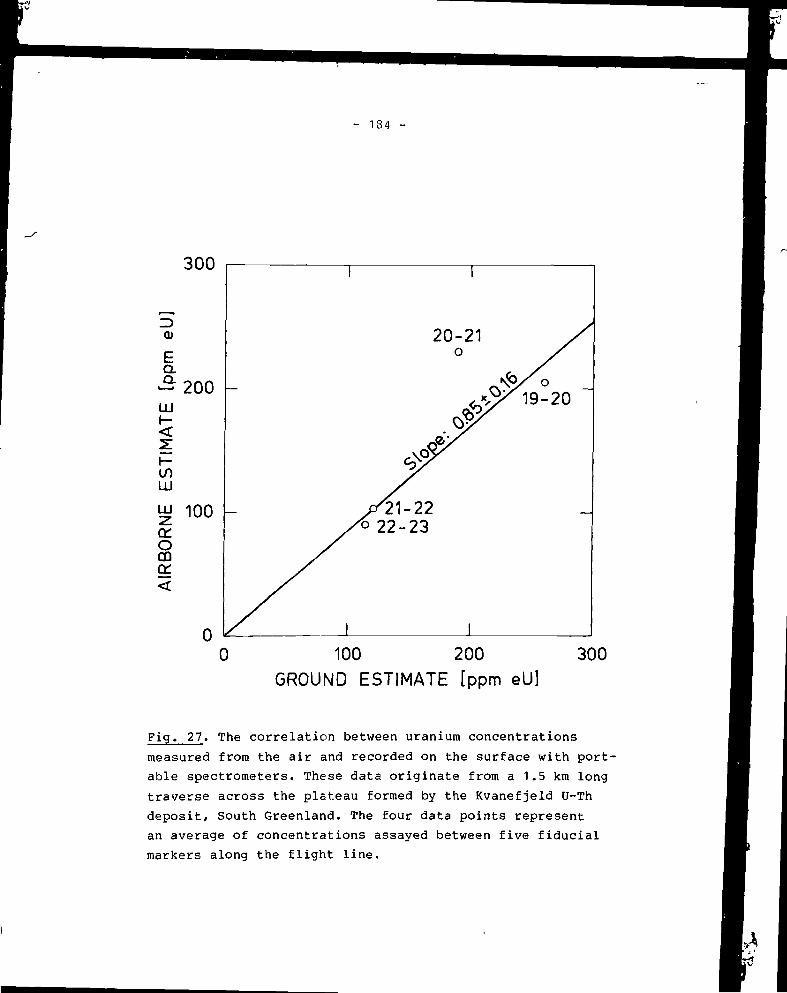
- 184 -
E>Q)
E
- 2 0 0LUh-
5 :
ST
II
LU
LjJ 100CCOCQ
AIR
D
I I
20-21O
/
jn.\-27A 22-23
//
/ I I
/
x*s o^19-20
_
0 100 200GROUND ESTIMATE [ppm eU]
300
Fig. 27. The correlation between uranium concentrations
measured from the air and recorded on the surface with port-
able spectrometers. These data originate from a 1.5 km long
traverse across the plateau formed by the Kvanefjeld U-Th
deposit, South Greenland. The four data points represent
an average of concentrations assayed between five fiducial
markers along the flight line.
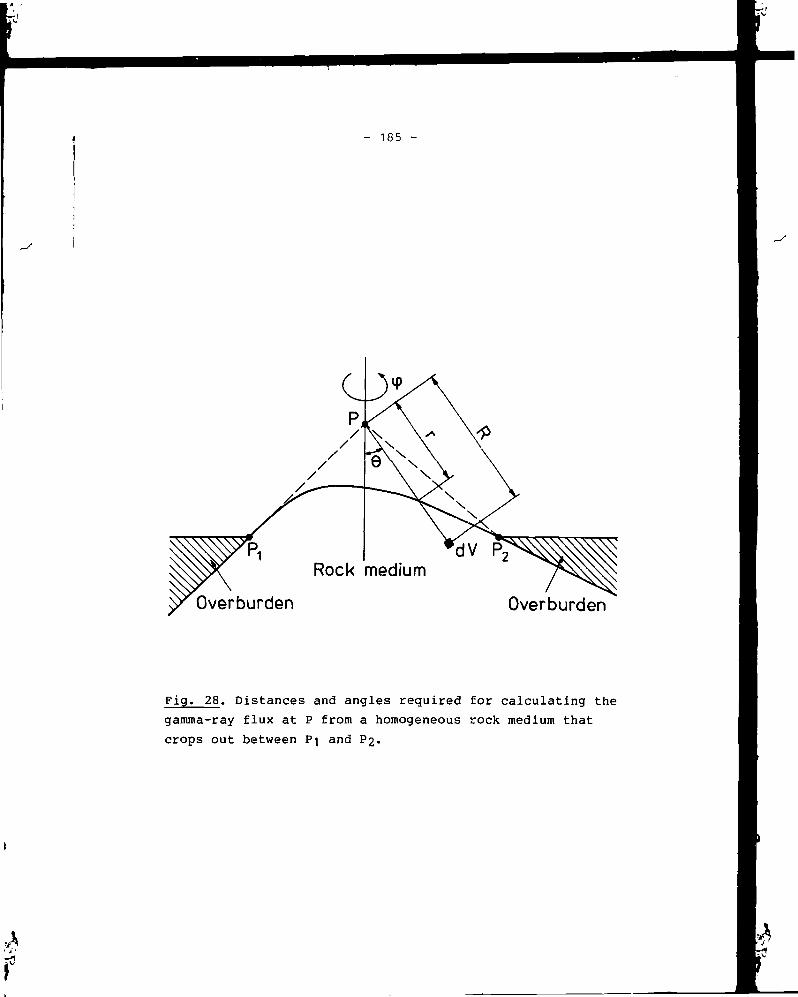
- 185 -
dV P2
Rock medium
Overburden Overburden
Fig. 28. Distances and angles required for calculating the
gamma-ray flux at P from a homogeneous rock medium that
crops out between Pi and P2.

- 186 -
'max
R
Fig. 29. Simplified representation of the counting geometry
on a circular calibration pad. When h << R it is permissible
to calculate the solid detection angle at P as 2Tt(1-h/R).
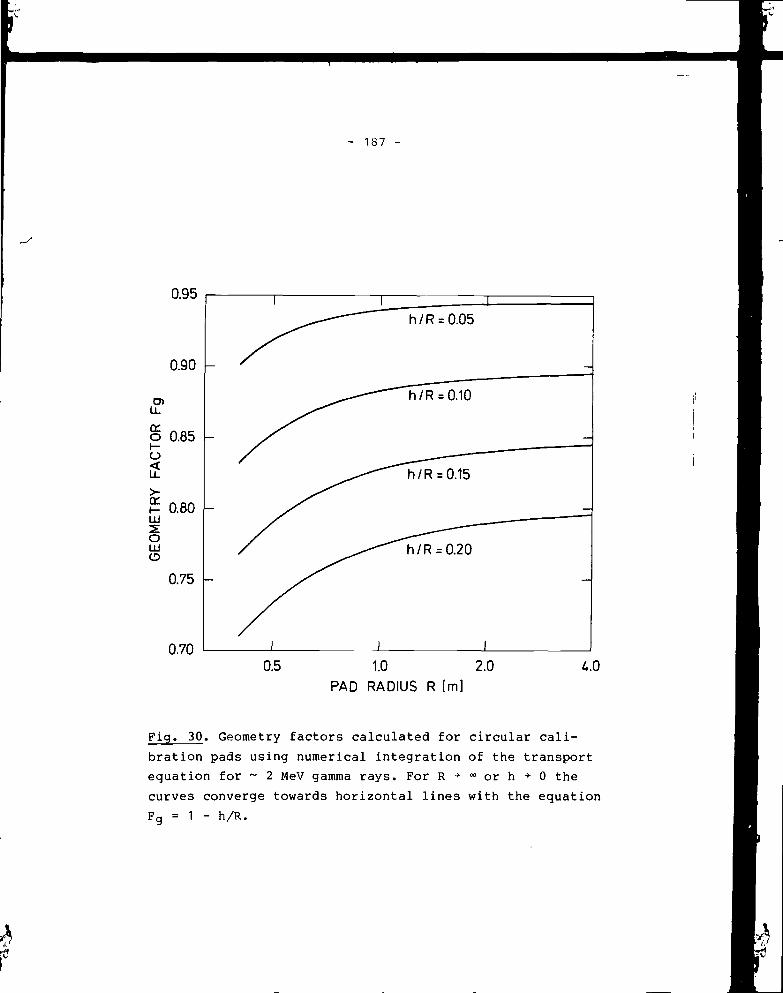
- 187 -
0.95
0.701.0 2.0
PAD RADIUS R [m]4.0
Fig. 30. Geometry factors calculated for circular cali-
bration pads using numerical integration of the transport
equation for ~ 2 MeV gamma rays. For R •* °° or h + 0 the
curves converge towards horizontal lines with the equation
F0 = 1 " h/R.
i U
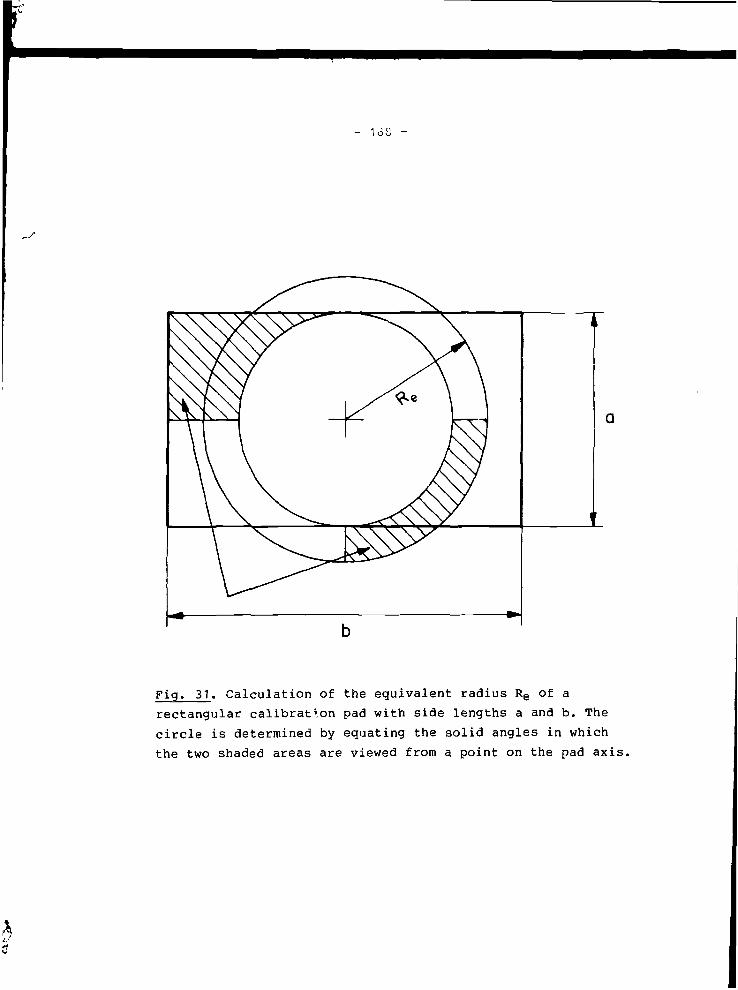
- 1 «
1t3
^
I
V
Fig, 31. Calculation of the equivalent radius Re of a
rectangular calibration pad with side lengths a and b. The
circle is determined by equating the solid angles in which
the two shaded areas are viewed from a point on the pad axis,
b

- 189 -
c>
OdOOdOdLU
>
tn
<
5
O
-5
-10
-15
•20
i
\
Pad moisture
I
i I i
^ -
\
I I I
0 5 10 15 20 25SOURCE MOISTURE [%]
30
Fig. 32. Field assay errors on sources of various moisture
contents. The error may be large if it is attempted to measure
the radioelement content per dry weight of the ground material
using a calibration against "dry" pad grades. By calibrating
the spectrometer in terms of "wet" or "in-situ" pad grades,
the radioelement content per wet weight of rock or soil is
almost measured correctly.

- 190 -
LUCU
0.2
0.0
Dry soi l _(min. value)
-310~5 10'* 10"° 10""* 10EFFECTIVE RADON DIFFUSION COEFFICIENT
[cm2 /s]
-1
Fig. 33. Calculated radiation losses at 1.76 MeV due to
radon exhalation from the source medium. The data are normal-
ized to an emanation power of 100% for the uranium (radium)
contained in the medium, and capillary diffusion is the only
considered exhalation mechanism.

- 191 -
0.0d/R
Fig. 34. Calculated decrease of the geometry factor with
increasing distances to the axis of a circular calibration
pad.
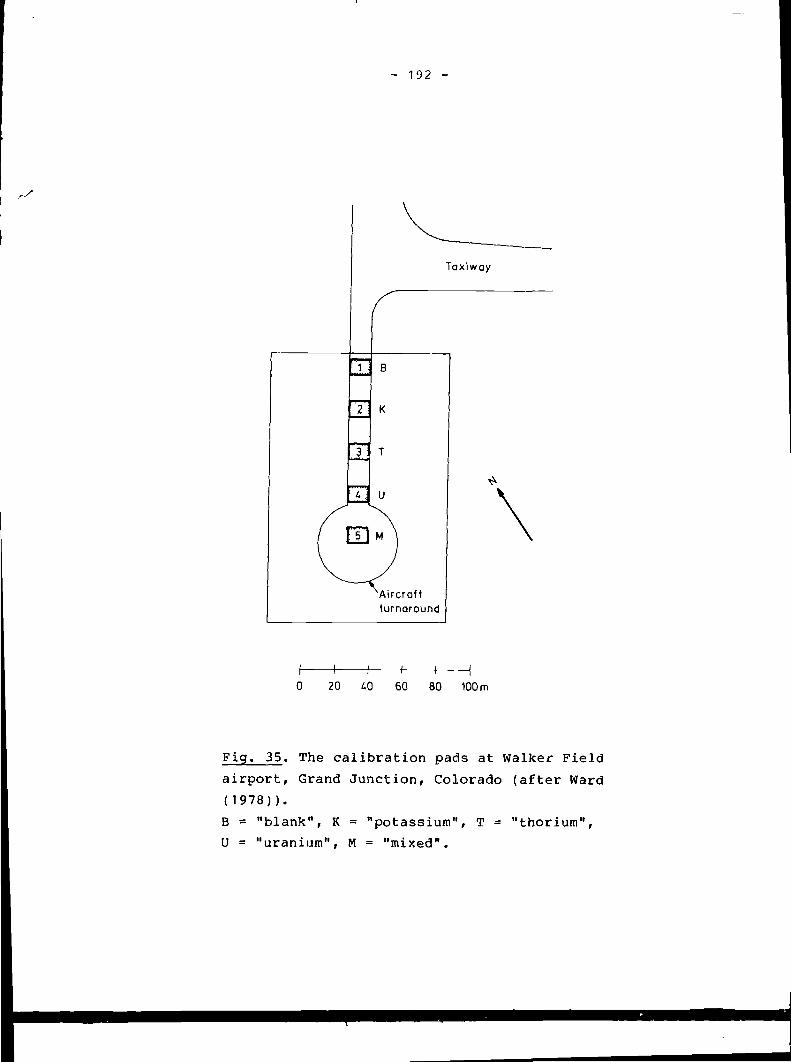
- 192 -
Taxlway
xAircraf1turnaround
I 1 1 1 f (
0 20 (.0 60 80 100 m
Fig. 35. The calibration pads at Walker Field
airport, Grand Junction, Colorado (after Ward
(1978)).
B = "blank", K = "potassium", T = "thorium",
U = "uranium", M = "mixed".

- 193 -
Entry
O 2 U 6 8 10 m
Fig. 36. The calibration pads at the Instituto de Radio-
protecao e Dosimetrica south of Rio de Janeiro, Brazil.
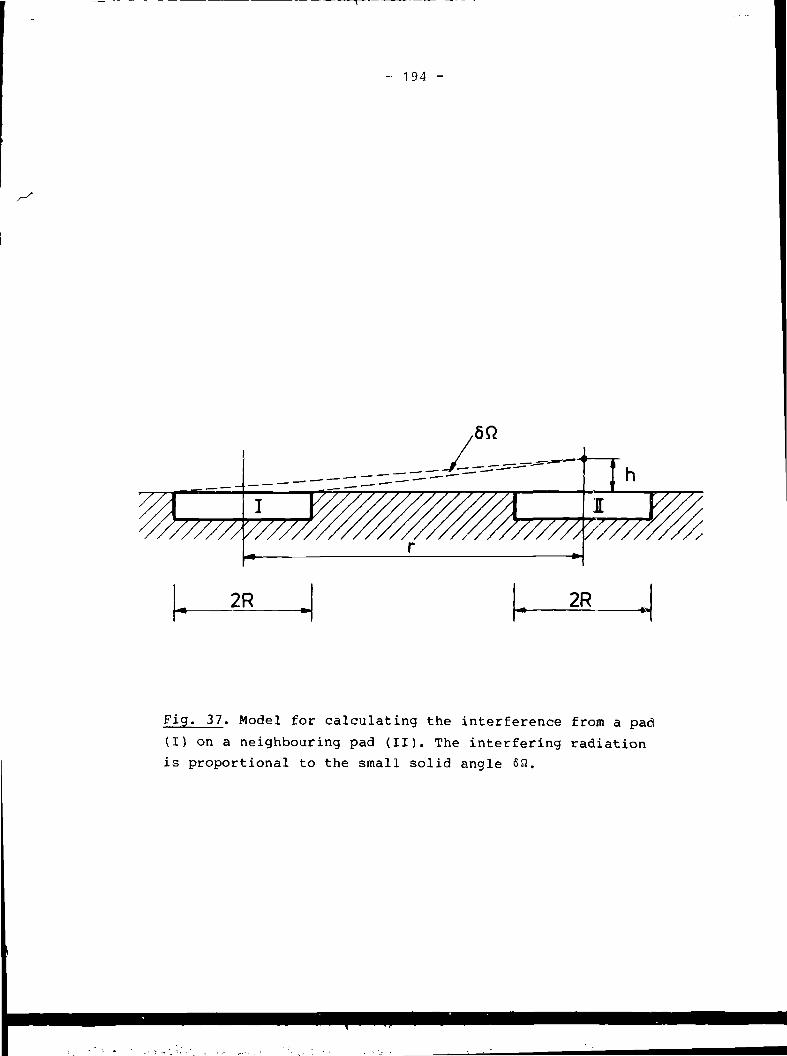
- 194 -
2R 2R -I
Fig. 37. Model for calculating the interference from a pad
(I) on a neighbouring pad (II). The interfering radiation
is proportional to the small solid angle 6n.
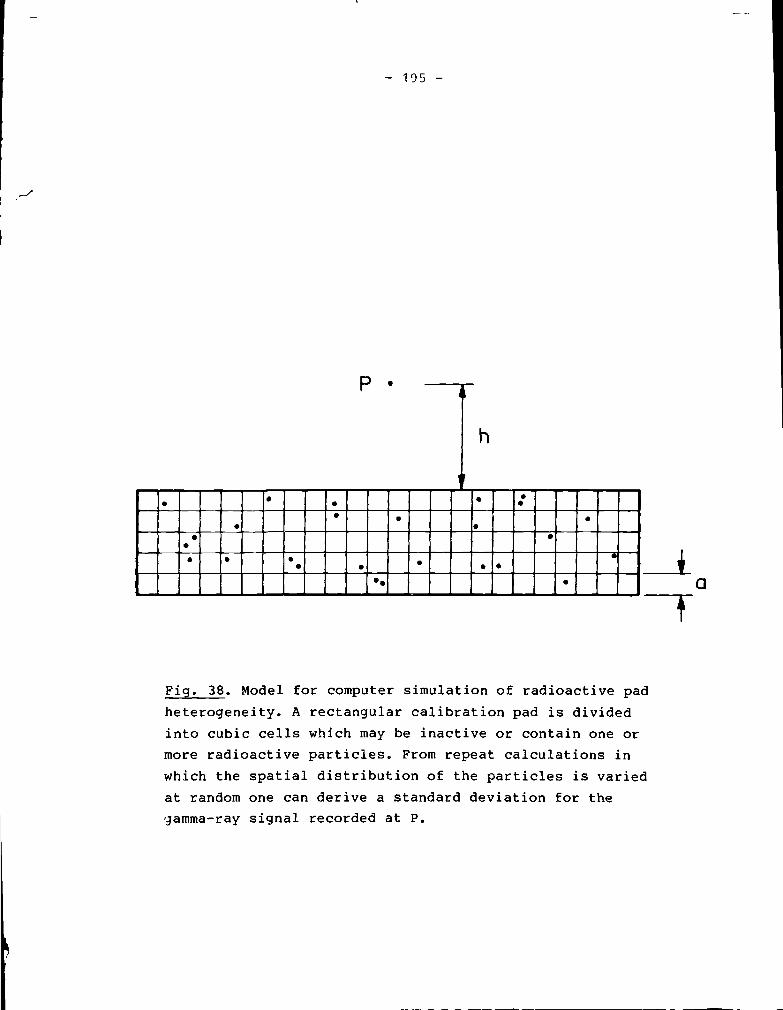
- 195 -
• •
• ••
•••
•
ft
•
•
•
•
•
a
Fig. 38. Model for computer simulation of radioactive pad
heterogeneity. A rectangular calibration pad is divided
into cubic cells which may be inactive or contain one or
more radioactive particles. From repeat calculations in
which the spatial distribution of the particles is varied
at random one can derive a standard deviation for the
•gamma-ray signal recorded at P.

- 130 -
100
COCO
LUO
K-
LUOCCLUCL
80
60
20
0
Potassium feldspar
Beach sand
-Q"
Masonry sand
0.03 0.1 0.3 1SIEVE SIZE [mm]
Fig. 39. Grading curves for aggregate particles used in the
construction of calibration pads at Walker Field airport
(masonry sand) and Riso National Laboratory (beach sand and
potassium feldspar).

- 197 -
Fig. 40. Manufacture of calibration pad
at the CSIRO Institute of Energy and
Earth Resources in Sydney (North Ryde),
Australia. Samples of the wet concrete
mix are taken for the later preparation
of powdered assay material.
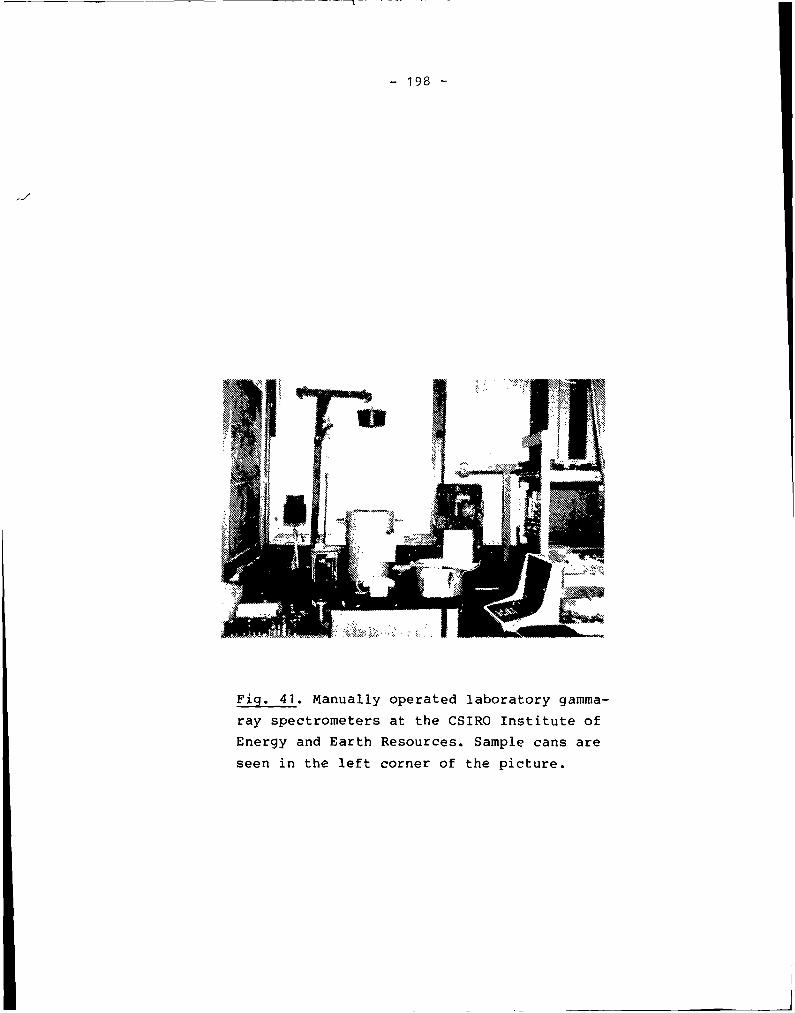
- 198 -
Fig. 41. Manually operated laboratory gamma-
ray spectrometers at the CSIRO Institute of
Energy and Earth Resources. Sample cans are
seen in the left corner of the picture.
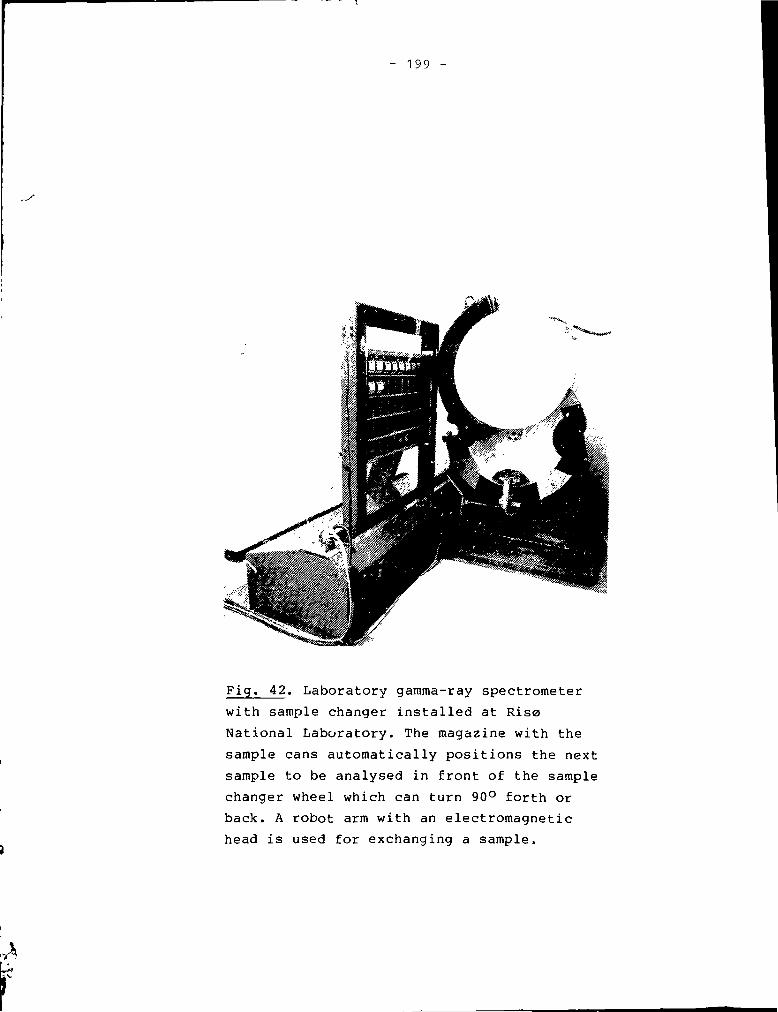
- 199 -
Fig. 42. Laboratory gamma-ray spectrometer
with sample changer installed at Riso
National Laboratory. The magazine with the
sample cans automatically positions the next
sample to be analysed in front of the sample
changer wheel which can turn 90° forth or
back. A robot arm with an electromagnetic
head is used for exchanging a sample.

- 200 -
0.45 -
0.44 -
0 s
L-
Q)CL
U)
U)"cOO
0.43 -
Sb(Nil
XU)
0.42 -
0.41 -
0.40100 150 200 250 300
Sample weight W [g]350
Fig. 43. Potassium calibration line for the laboratory
spectrometer at Rise. For sach potassium salt used a
potassium window sensitivity has been calculated from the
K concentration suggested by the chemical formula for the
salt. The low sensitivity recorded with K2CO3 is ascribed
to residual, chemically bound water.

- 201 -
12
10
W)
U)
C
O
c>
LU
CC
OO
QLOX
8
O
Unweighted fit(sTh = 0.136± 0.008)
Weighted fit(sTh = 0.127 ±0.007)
0 20 AO 60 80PAD GRADE [ppm eTh]
100
Fig. 44. Hypothetical thorium calibration lines for portable spec-
trometer calibrated on two T pads and one B pad. The most reliable
linear fit is obtained by the use of weight factors which contain
the variance associated with counting statistics and uncertainty
on the pad grades.

- 202 -
Fig. 45. Monitoring of the radioeleinent
concentrations in calibration pad at
Lanseria airport, Republic of South
Africa. The facility includes four pads
recessed into a disused runway section.
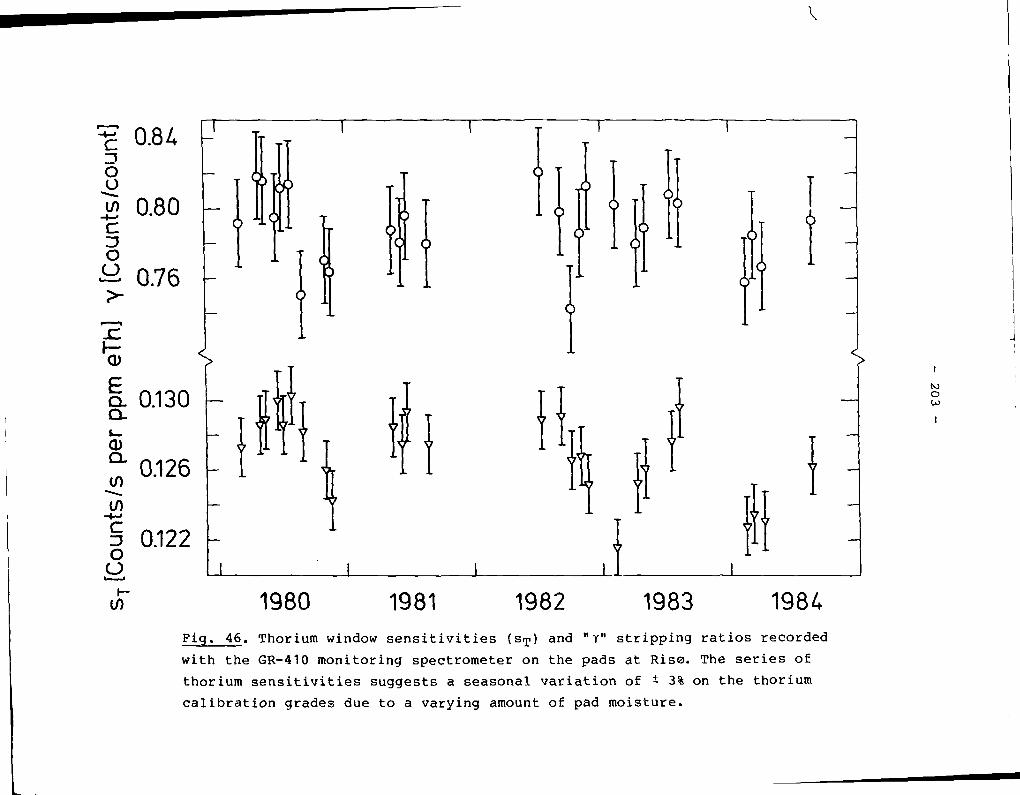
OOJ
1980 1981 1982 1983 1984Fig. 46. Thorium window sensitivities (sT) and "Y" stripping ratios recorded
with the GR-410 monitoring spectrometer on the pads at Ris0. The series of
thorium sensitivities suggests a seasonal variation of ± 3% on the thorium
calibration grades due to a varying amount of pad moisture.
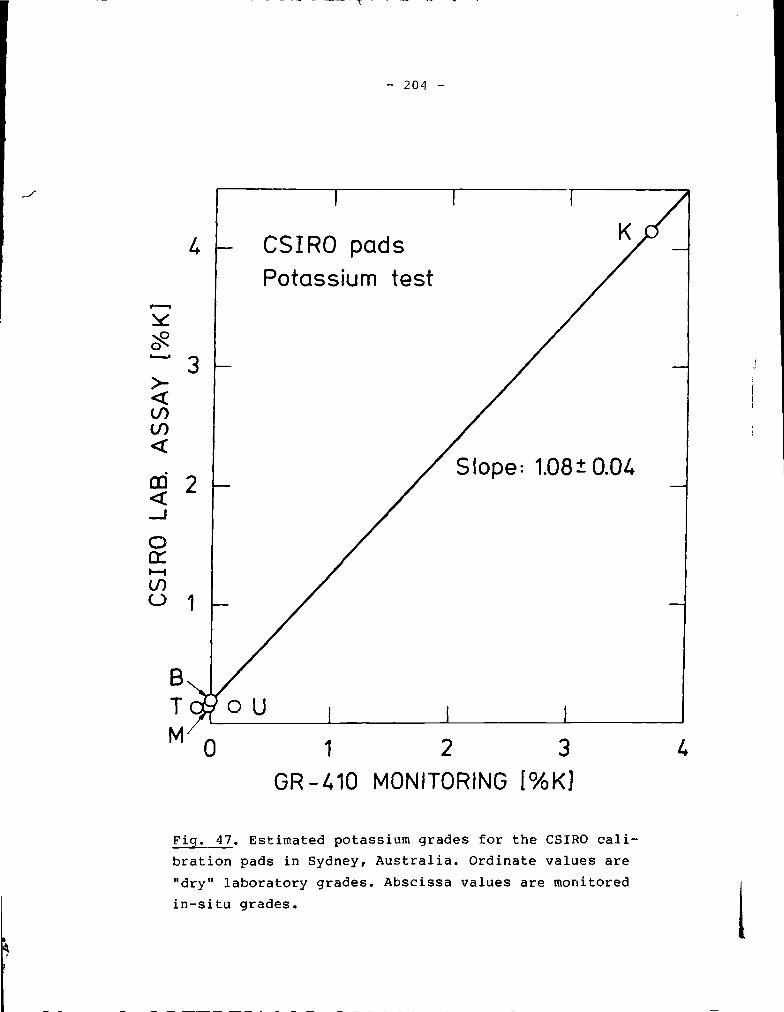
- 204 -
<LOCO
3 -
2 -
Oo:»—ILOO
BTM-
I
- CSIRO padsPotassium test
— /
You ,
I
J
Slope:
I
I
/
1.08 ±
I
V-/
0.04
0 1 2 3
GR-410 MONITORING [%K]
Fig. 47. Estimated potassium grades for the CSIRO cali-
bration pads in Sydney, Australia. Ordinate values are
"dry" laboratory grades. Abscissa values are monitored
in-situ grades.
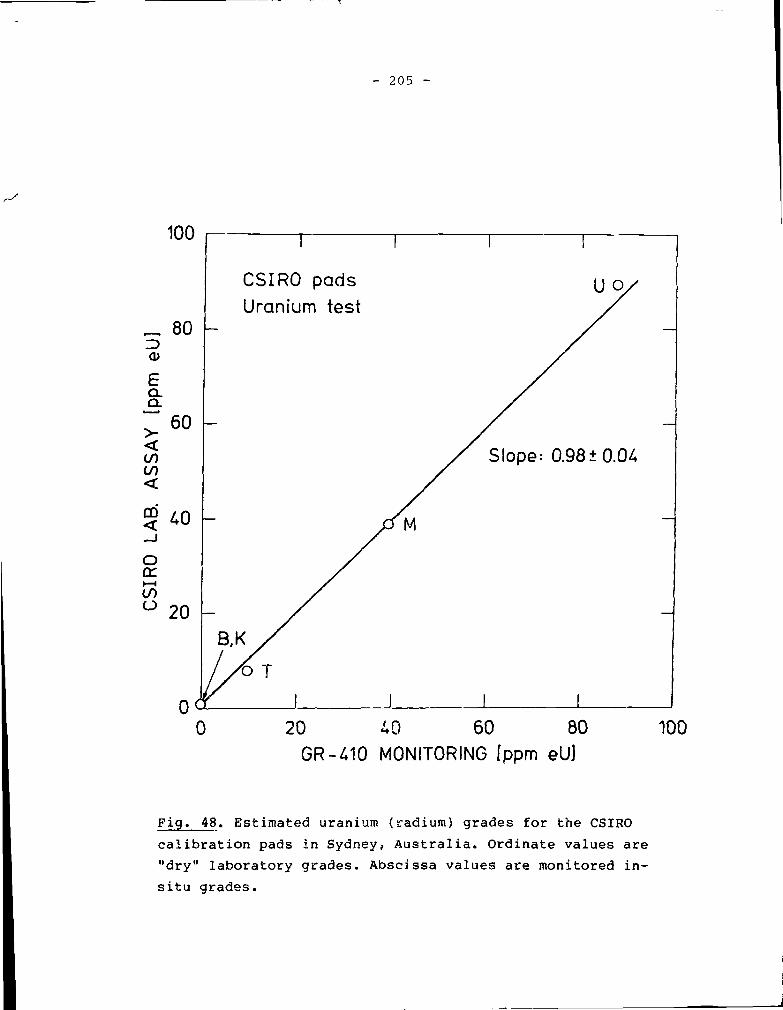
- 205 -
100
„ 80(D
ECLC
<U)t/7
Ocrt—tCOO
60 -
20 -
I
CSIRO padsUranium test
— .
S3 M
B.K/
/XTY i i i
/
Slope:
I
Uo/
0.98 + 0.0 U
—
—
0 20 40 60 80GR-410 MONITORING [ppm eU]
100
Fig. 48. Estimated uranium (radium) grades for the CSIRO
calibration pads in Sydney, Australia. Ordinate values are
"dry" laboratory grades. Abscissa values are monitored in-
situ grades.

- 206 -
200
150OL)
EQLQ.
$100
m
oCZt—iCOO
CSIRO padsThorium test T
Slope: 1.04 + 0.03
B
50 100 150GR-410 MONITORING [ppm eTh]
200
Fig. 49. Estimated thorium grades for the CSIRO calibration
pads in Sydney, Australia. Ordinate values are "dry" labora-
tory grades. Abscissa values are monitored in-situ grades.

O
' Airport facility • Facility for porUbl* «p«ctrom»t»ii
Fig. 50. Locations of the spectrometer calibration facilities included in the
IAEA pads intercomparison experiment.
Available on request from.Aisa Library,Rte« National Laboratory, P.O. Box 49,DK-4000 Roskild*, DenmarkPhon* (02) 371212 ext. 22
ISBN 87-550-1O43^tISSN 0418-6435