ian's senior thesis draft 030415
TRANSCRIPT
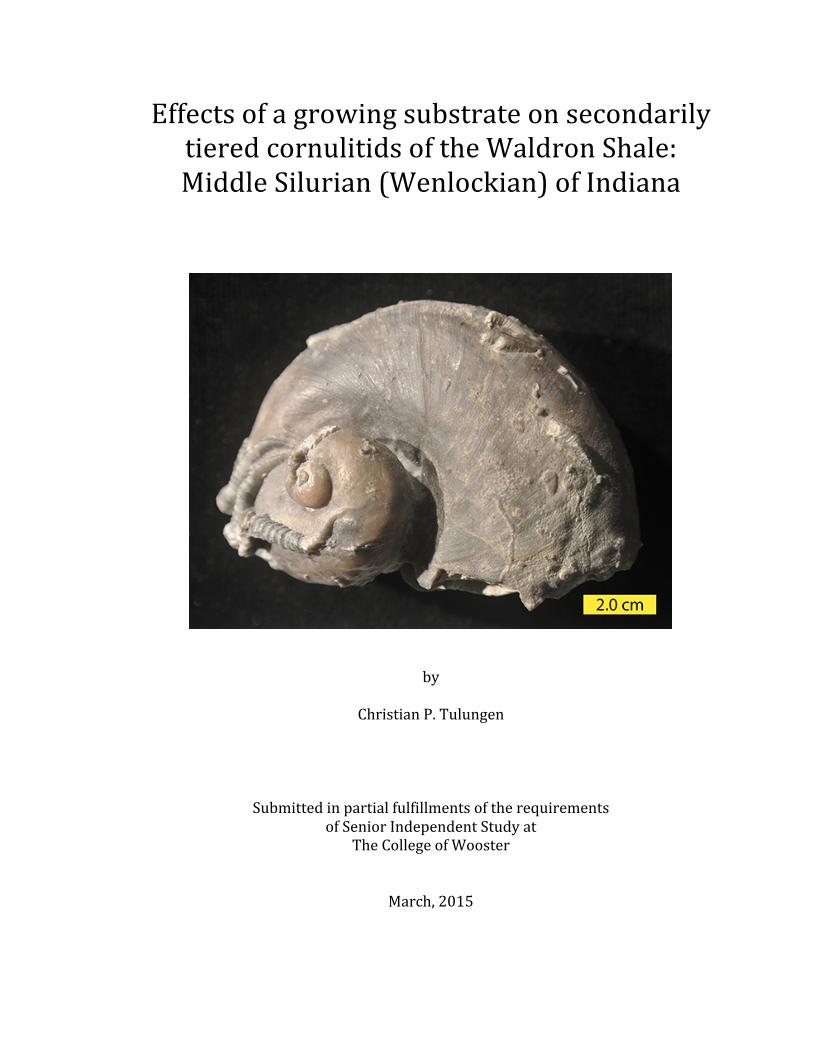
Effects of a growing substrate on secondarily tiered cornulitids of the Waldron Shale: Middle Silurian (Wenlockian) of Indiana
by
Christian P. Tulungen
Submitted in partial fulfillments of the requirements of Senior Independent Study at
The College of Wooster
March, 2015

i
Abstract
Cornulitids are filter-‐feeding worm-‐like organisms with a hard tube-‐shaped
shell that have been known to encrust hard substrates such as the shells of
brachiopods and gastropods from the Ordovician through the Carboniferous.
Cornulites proprius is found in the Waldron Shale (Middle Silurian) and frequently
are sclerobionts that encrust the platyceratid gastropod Platystoma niagarense.
This study looks at the interaction between these two organisms. The cornulitids
were counted and categorized into zones representing where on the platyceratid
they encrusted. This is analogous to a study done by Morris and Felton (1993) on
Ordovician examples. The result showed that the cornulitids encrusted during the
life span of the platyceratid. The cornulitids also had no preference on the size of
the platyceratid they encrust, and it seems that with age a platyceratid did not
accumulate additional cornulitids. Results show that the population of encrusting
cornulitids is dominated by juveniles and more than 50% of the population never
reached a length greater than 5 millimeters. My hypothesis is that the juvenile
population did not live long enough to be affected by the growth of the platyceratid.
Yet, there were specimens found measuring less than 5 millimeters that still curved.
The results of this study show that the cornulitid behavior was random and the
growth of platyceratid shell they were encrusting had no affect on them.

ii
iii
Acknowledgements
I would like to thank my parents Catherine and Johnnes Tulungen and my
brother Paul who listened to me talk about my thesis and told me when they didn’t
understand something. Thank you for forcing me to explain everything, which in
turn helped me understand my topic even better. I would like to thank the members
of Xi Chi Psi who frequently reminded me that completion of this thesis was more
important than hanging out with them, yet continued to request my presence in
section. I would like to thank Chris Scimecca, Brian Maddock, and Elliot
Wainwright. The constant updates on the progress of their projects kept me
motivated and made me work more efficiently on my own project. I would like to
thank Coleman Fitch and the other Geology students for our conversations and
frequent comparisons between our projects that helped me realize the quality of my
work. Special thanks go out to Samantha Muther who kept telling me that I had
done enough work for this project and calming me down whenever I was stressed. I
would like to thank Dr. Meagan Pollock who helped me kick off this project during
Junior Independent Study and teaching me the basics of research in the geologic
field. A very big thanks to Ken Karns and Brian Bade who collected the specimens
used in this project, for without them this project could not have been possible.
Finally, I would like to thank my ever so patient advisor Dr. Mark Wilson. His humor
and light attitude along with stern encouragement helped me get through this
stressful and enlightening process.

iv
v
Effects of a growing substrate on secondarily tiered cornulitids of the Waldron Shale: Middle Silurian
(Wenlockian) of Indiana
Table of Contents
ABSTRACT ................................................................................................................................................. I
ACKNOWLEDGEMENTS ...................................................................................................................... III
INTRODUCTION ...................................................................................................................................... 1
THE WALDRON SHALE FORMATION ................................................................................................ 3
STRATIGRAPHY ........................................................................................................................................................... 3
PALEOENVIRONMENT ............................................................................................................................................... 8
PALEOECOLOGY OF PLATYCERATIDS .......................................................................................... 11
SHELL MORPHOLOGY AND EARLY LIFE .............................................................................................................. 11
PLATYCERATID/CRINOID RELATIONSHIP .......................................................................................................... 12
PALEOECOLOGY OF CORNULITIDS ................................................................................................ 17
SYSTEMATICS ....................................................................................................................................... 23
METHODS ............................................................................................................................................... 25
RESULTS ................................................................................................................................................. 29
DISCUSSION ........................................................................................................................................... 39
CONCLUSIONS ....................................................................................................................................... 45

vi
APPENDIX ............................................................................................................................................... 47
REFERENCES CITED ............................................................................................................................ 57
1
Introduction
Cornulitids, of the class Tentaculita, are hard substrate encrusters found in
marine sediments from the Ordovician to Carboniferous. Often these encrusters are
found on the shells of other organisms. In the Silurian, cornulitids were found
encrusted on brachiopods, crinoids, and gastropods. This study is focused mainly
on specimens recovered from the Waldron Shale (Wenlockian) of Indiana, and
primarily observes samples of platyceratid gastropods with encrusting cornulitids.
The relationship between the platyceratids and the cornulitids is unusual due
to the fact that platyceratids are encrusters and attach near or directly on top of the
calyces of crinoids. This particular phenomenon is known as secondary tiering,
which is when organisms are positioned above (or below) the sediment water
surface as epizoans on a primary tier organism (Peters and Bork, 1998). This put
the cornulitids in a different environment where suspended food particles were
much more abundant. This study examines two aspects of the cornulitid –
platyceratid relationship. First, the study will attempt to determine whether or not
the cornulitids encrusted juvenile platyceratids. Second, this study will show
whether or not the cornulitids reacted to the spiral growth of the platyceratid shell.
A systematic analysis was also done on the samples from the Waldron Shale that
were used.

2
3
The Waldron Shale Formation
Stratigraphy The Waldron Shale was first discovered in 1860 by Professor David Christy
of Cincinnati and named after the nearby town of Waldron, Indiana (Hall, 1881).
Stratigraphically, it is positioned above the Laurel Formation of the upper
Salamonie Dolomites and is a part of the Pleasant Mills Formation of the Middle
Silurian (Figure 1) (Droste and Shaver, 1982; Brett et al., 2012). The formation can
be separated into 3 ecological facies (A, B, and C) and a fourth diagenetic facies (D)
originally described by Feldman (1989). Additionally he ordered the 3 ecological
facies chronologically with A being the oldest presumed facie and C being the
youngest. Figure 2 shows the relationship between the facies, excluding facies D.

4
Figure 1: Accepted stratigraphic correlation of the Niagaran and Cayugan groups (North American Series) or the Wenlockian, Ludlovian, and Pridolian groups (European Series) of northern, central, southwestern, and south-‐central Indiana. Arrow Shows Stratigraphic position of the Waldron Formation (Droste and Shaver, 1982).

5
Figure 2: An ideal cross-‐section of the Waldron Shale Formation showing Facies A, B, and C. Facies D is not shown due to its proposed difference in origin. The Graphs on the right show the evolution of the depositional conditions through the facies. The ‘d’ means deep and ‘s’ means shallow in the graph showing depth development. The dotted line labeled ‘swb’ indicates the position of the storm wave base (Feldman, 1989). The oldest facies of the Waldron Formation is facies A, or the Biohermal
community facies as termed by Peters and Bork (1999). Identified as the most
fossiliferous of the facies within the Waldron, facies A is a massive, gray, dolomitic,
and fossiliferous shale with common occurrences of thin shell beds (Feldman,
1989). Many of the fossils found in this facies are commonly fragmented and
corroded. This is due to a combination of corrosion and abrasion through biological
and physical processes. The few fossils found in growth positions are situated in
small reef-‐like masses, often referred to as microbioherms. These benthic villages
are unique due to the large amount of sessile benthic epifaunal fauna found on them.
6
The size of these bioherms ranged from a few centimeters to about 2 meters in
diameter, and could be up to 50 centimeters thick. Additionally, many thin shell
beds ranging between 1-‐3 centimeters thick can be found in facies A. They are
primarily composed of sand and granule sized fossil debris. These specimens are
typically oriented parallel to bedding with reoriented geopetal structures. Due to
the thickness and orientation of the specimens, these shell beds are interpreted as
tempestites. Exposure affects are more readily found in facies A. This can be seen
through examples of specimens that are corroded, disarticulated, and sometimes
colonized. This is due to the absence of a slow deposition process (Feldman, 1989).
Chronologically, the next facies of the Waldron is facies B that is typically the
thickest facie of the formation. It is a dolomitic shale dominated by thin and
laterally continuous mudstone beds that alternate with less resistant shale beds.
There are fewer fossils in facies B and the shell beds are rarer, discontinuous, and
thinner, maxing out at about ½ centimeter thick. Tempestites that were a common
occurrence in facies A are not found in facies B. Instead, the death assemblages and
fossil beds are defined as distal tempestites. Due to the lack of microbioherms seen
in this facies, this facies is referred to as the Inter-‐reef community (Feldman, 1989;
Peters and Bork, 1999). Fossils are rarely present in this facies but when found they
are well preserved.
The Deep Platform community or facies C is very similar to facies B. Like
Facies B, it is dominated by thin and laterally continuous mudstone beds that
alternate with less resistant shale beds. Distal tempestites are also found in this
facies, as well as the dolomitic shale found in the other facies. The distinguishing
7
factor of facies C would be the low abundance of both macrofossils and microfossils.
Of the few fossils found in this facies, most are pyritized or dolomitized. Fossils that
are carbonaceous can only be found in this facies. Bedding in facies C differs slightly
from B. Instead of the preservation alternating between light and colored beds, the
bedding reflects varying concentrations of pyrite (Feldman, 1989).
The last facies is the diagenetic facies D. It is characterized by the presence
of argillaceous dolomite, along with the typical dolomitic shale found in the rest of
the Waldron Formation. Feldman (1989) describes this facies as a product of
dolomitization that occurred to parts of facies B (Inter-‐reef) and C (Deep Platform).
As a result, Feldman assumes that this facies is present due to diagenesis instead of
deposition.
8
Paleoenvironment
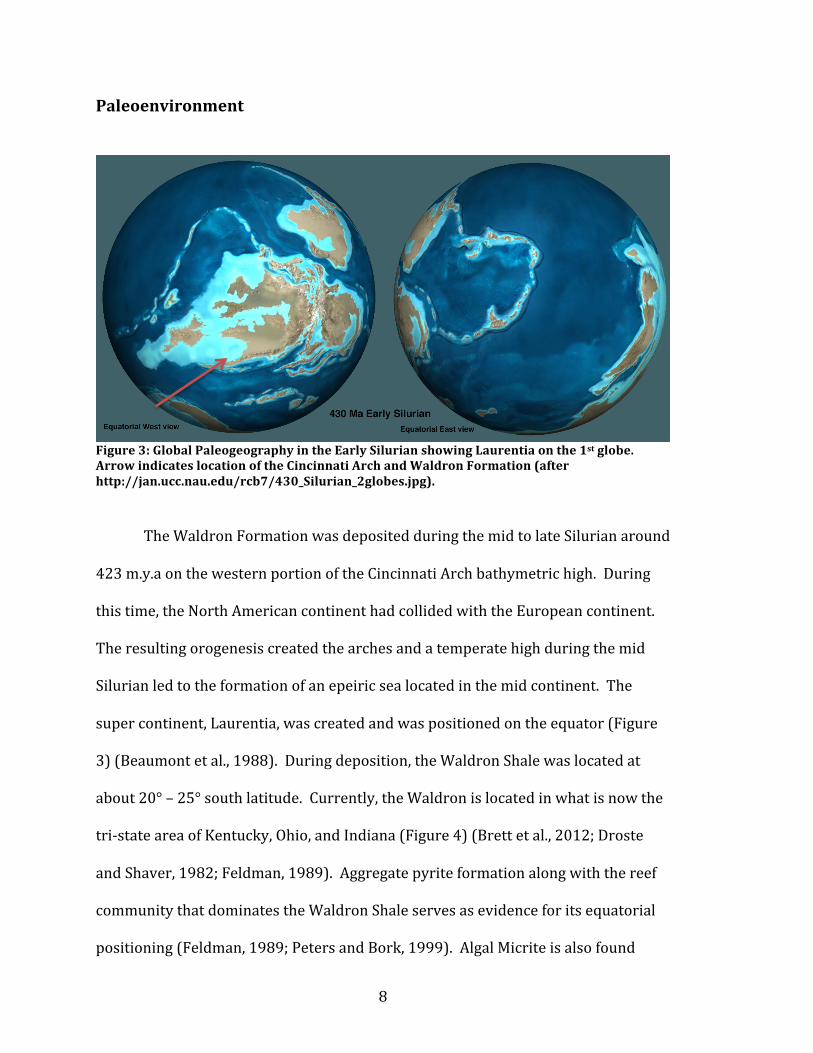
Figure 3: Global Paleogeography in the Early Silurian showing Laurentia on the 1st globe. Arrow indicates location of the Cincinnati Arch and Waldron Formation (after http://jan.ucc.nau.edu/rcb7/430_Silurian_2globes.jpg). The Waldron Formation was deposited during the mid to late Silurian around
423 m.y.a on the western portion of the Cincinnati Arch bathymetric high. During
this time, the North American continent had collided with the European continent.
The resulting orogenesis created the arches and a temperate high during the mid
Silurian led to the formation of an epeiric sea located in the mid continent. The
super continent, Laurentia, was created and was positioned on the equator (Figure
3) (Beaumont et al., 1988). During deposition, the Waldron Shale was located at
about 20° – 25° south latitude. Currently, the Waldron is located in what is now the
tri-‐state area of Kentucky, Ohio, and Indiana (Figure 4) (Brett et al., 2012; Droste
and Shaver, 1982; Feldman, 1989). Aggregate pyrite formation along with the reef
community that dominates the Waldron Shale serves as evidence for its equatorial
positioning (Feldman, 1989; Peters and Bork, 1999). Algal Micrite is also found
9
throughout the shale and its presence, along with the presence of pyrite, shows
deposition occurring in the photic zone (Feldman, 1989). Deposition of the Waldron
can also be assumed to have occurred between normal and storm wave bases
(Facies A), and just below storm wave base (Facies B and C). Evidence for this is the
presence of thin shell beds found in Facies A and their gradual decline in numbers as
deposition continues to B and C. The shell beds can also be used to interpret the
depth at which deposition occurs, as well as the rate of deposition in each facies.
Evidence shows that when moving from Facies A to C there is a gradual increase in
depth. This is due to the decline in numbers of tempestites which indicates less
turbated waters that are not close to the surface (Feldman, 1989; Peters and Bork,
1999).
10
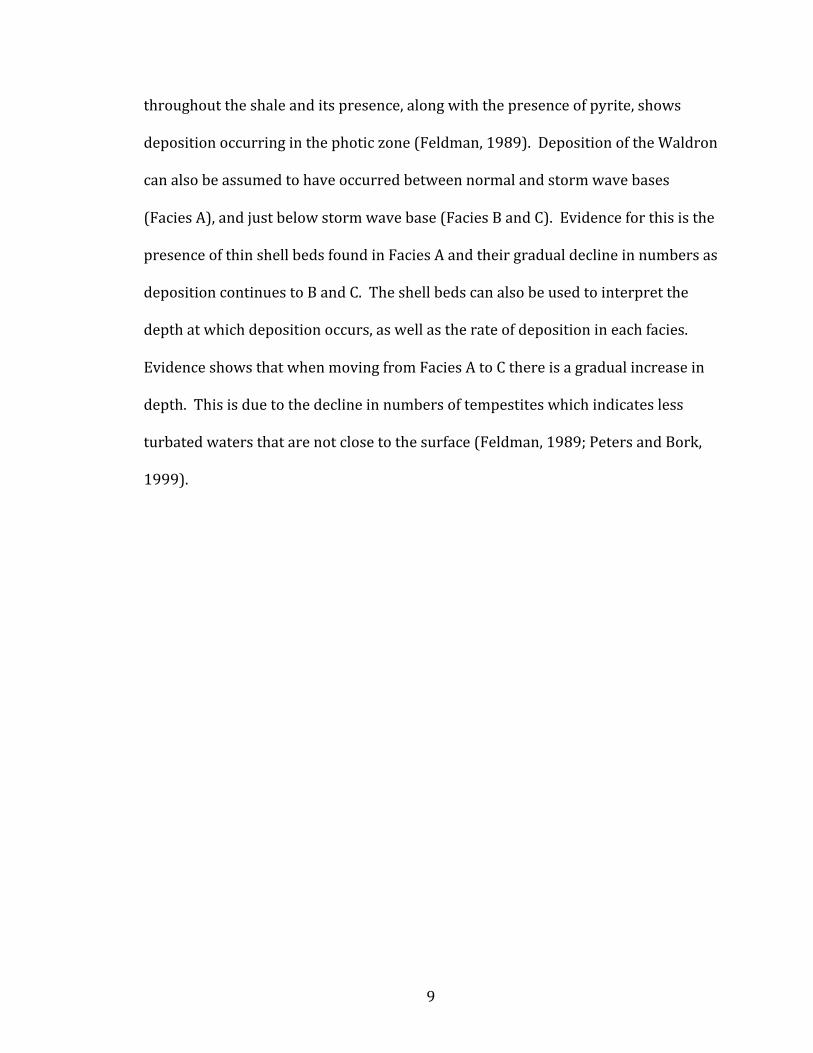
Figure 4: The location of the Cincinnati Arch Area during the Mid Silurian (Wenlockian). Paleogeographic position of Laurentia (A), the relative paleobathymetry of the area at the time (B), with the map of the state of Ohio (C), and a county map of the Tri-‐state area showing important localities and type sections of Silurian lithostratigraphic units (D) (Brett et al., 2012).
11
Paleoecology of Platyceratids
Shell Morphology and Early Life of Platyceratids Platyceratid gastropods are stratigraphically found from the Middle
Ordovician to the Late Permian spanning about 250 million years. They are widely
recognized as sessile benthic organisms and are classified as sclerobionts. A
sclerobiont is an organism that is living in or on any kind of hard substrate (Taylor
and Wilson, 2003). The Middle Silurian Platystoma niagarense is a platyceratid
gastropod with a slightly trochospiral, almost planispiral involute, dextral shell. The
apex of the shell is visible if it has not been taphonomically destroyed. Only
examples of platyceratids that have fallen off of the hard substrate it was encrusting,
allow the inside of the aperture to be seen. The apertures of platyceratid gastropods
are typically an irregular shape and in Platystoma niagarense the aperture is very
wide and often found broken. In very well preserved examples of Platystoma
niagarense, growth lines are visible on their thick calcitic shells. This indicates that
the shells grew in a helical pattern by accretion (Bowsher, 1955; Fryda et al., 2009;
Morris and Felton, 1993; Sutton et al., 2006).
Studies on the protoconchs or larval shells of platyceratids show that there
are two types of protoconch. The first and most widely known and found
12
protoconch are very unusual; they are open coiled with a fish-‐hook like morphology
that can be seen in examples throughout all platyceratids. This protoconch is called
the cyrtoneritimorph protoconch because it may represent ancestral links to
neritimorph gastropods. The second protoconch type is found to be a very tightly
coiled but not convolute, orthostrophic protoconch. This means that the protoconch
has no space between the whorls but the shell does not overgrow itself.
Additionally, this protoconch grows its whorls out equally. This second protoconch
can only be found in Silurian Platyceras sp. specimens, which means that the
Platystoma niagarense has this second type of protoconch. Furthermore, the small
size and shape of the Platyceras sp. indicates that there is an absence of
cyrtoneritimorph protoconchs (Fryda et al., 2009).
Platyceratid/Crinoid Relationship
The interpretations of lifestyles of platyceratid gastropods have been
recently changed. Originally when these gastropods were first found inside the
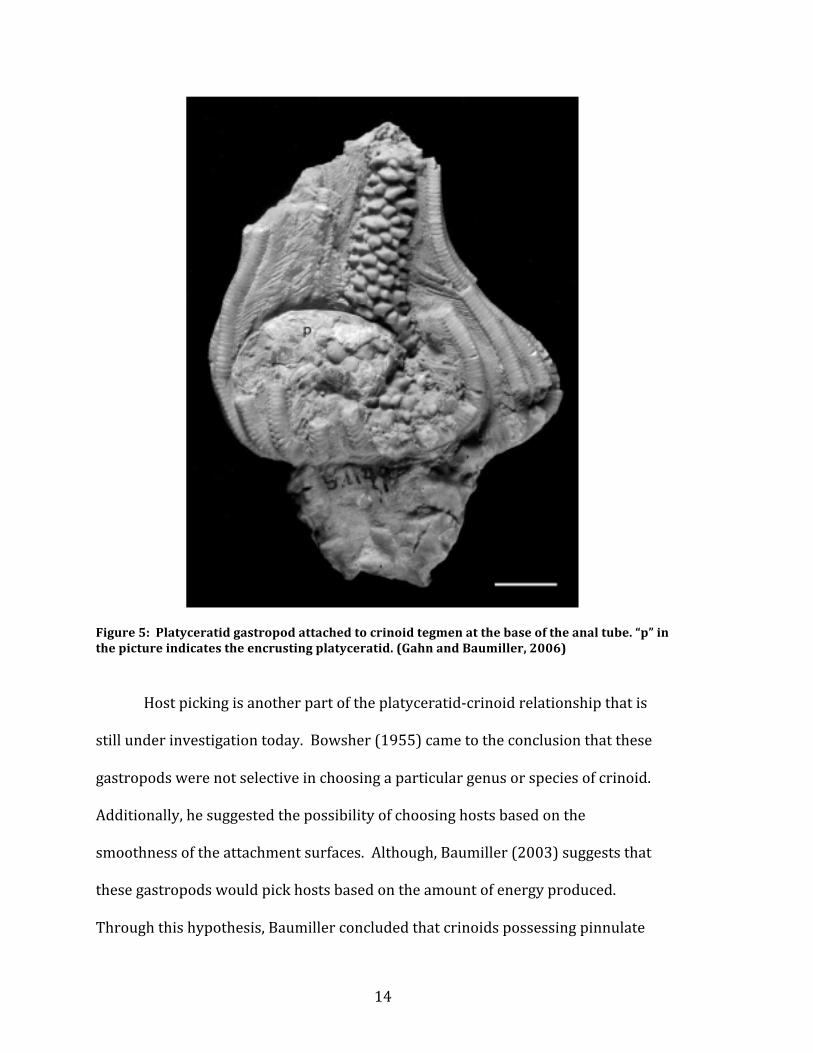
arms of Crinoids, they were interpreted to be the prey. Figure 5 shows a picture of
the relationship. This interpretation then changed to the complete opposite, pitting
the gastropods as the predator. Currently, the most widely accepted theory is the
sedentary coprophagus platyceratid (Baumiller and Gahn, 2002; Bowsher, 1955).
This means that the gastropod would encrust onto the calyces and tegmen of
crinoids and cystoids to feed on their waste products (Bowsher, 1955). This
13
conclusion was reached because of the irregularly shaped aperture that would allow
the mantle cavity to cover the anal vent of the crinoid and conform to its shape.
Research suggest that this behavior was possibly established during the Middle
Silurian around the time of the Waldron (Baumiller, 2003; Baumiller and Gahn,
2002; Bowsher, 1955). Even with the overwhelming support for coprophagy of
platyceratids, the same evidence could support gametophagy, or feeding on the
young produced by the host.
The major difference between these two theories is the effect of the
gastropod on its host. One is neutral to the host and sometimes beneficial
(coprophagous), while the other is detrimental to the hosts reproductive abillities
(gametophagous) (Baumiller, 2003; Baumiller and Gahn, 2002). However, the
proposed amount of detrimentality caused by the gastropod varies. Bowsher
(1955) claims that the gastropods were probably not ‘suctorial.’ This suggests that
the gastropod would wait to be served by the crinoid. On the other hand it is also
possible that the gastropods would be Kleptoparasitic and steal undigested material
and nutrients from its host (Gahn et al., 2003). Overall, researchers have agreed
that when these gastropods are present, they interfere with normal alimentary
functions of the crinoid (Baumiller, 2003; Baumiller and Gahn, 2002).
14
Figure 5: Platyceratid gastropod attached to crinoid tegmen at the base of the anal tube. “p” in the picture indicates the encrusting platyceratid. (Gahn and Baumiller, 2006)
Host picking is another part of the platyceratid-‐crinoid relationship that is
still under investigation today. Bowsher (1955) came to the conclusion that these
gastropods were not selective in choosing a particular genus or species of crinoid.
Additionally, he suggested the possibility of choosing hosts based on the
smoothness of the attachment surfaces. Although, Baumiller (2003) suggests that
these gastropods would pick hosts based on the amount of energy produced.
Through this hypothesis, Baumiller concluded that crinoids possessing pinnulate
15
arms, or arms with large dense filters, could capture more food and therefore
produce more energy. Typically there is only one gastropod per crinoid, but there
are a few instances where a crinoid is multi-‐infested. In those few cases, the largest
gastropod would be the one positioned over the anal vent (Baumiller and Gahn,
2002). Baumiller (2003) also concluded that even the smaller crinoids could sustain
life and satisfy metabolic needs for both the epibiont and the host. Even gastropods
larger than the height of the crinoid can be supported, but on average, the infested
crinoids are smaller than those not infested (Baumiller and Gahn, 2002; Baumiller,
2003).

16
17
Paleoecology of Cornulitids
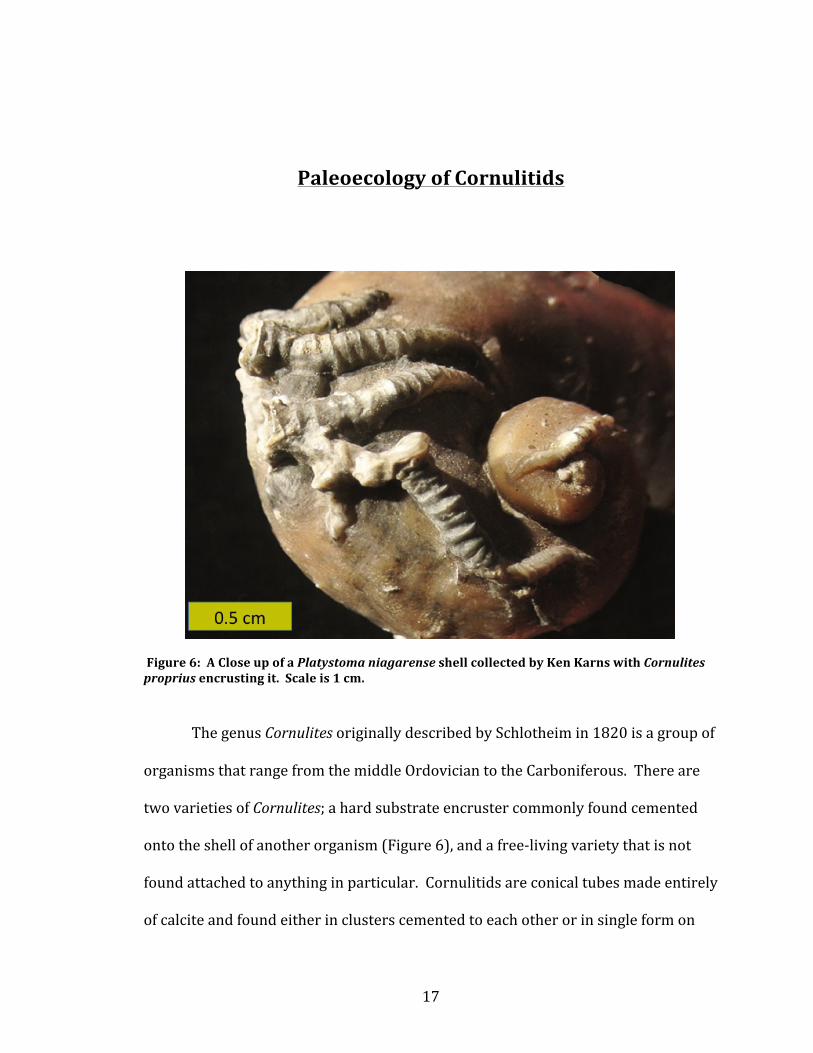
Figure 6: A Close up of a Platystoma niagarense shell collected by Ken Karns with Cornulites proprius encrusting it. Scale is 1 cm.
The genus Cornulites originally described by Schlotheim in 1820 is a group of
organisms that range from the middle Ordovician to the Carboniferous. There are
two varieties of Cornulites; a hard substrate encruster commonly found cemented
onto the shell of another organism (Figure 6), and a free-‐living variety that is not
found attached to anything in particular. Cornulitids are conical tubes made entirely
of calcite and found either in clusters cemented to each other or in single form on
18
hard substrates (Vinn and Mutvei, 2005). Encrustations of cornulitids are more
commonly found on shells and other hard parts of organisms in the Waldron Shale
(Peters and Bork, 1999). The life mode of these conical organisms has been debated
ever since their discovery. The most widely accepted theory is that these organisms
acted like tubeworms and were filter feeding sessile benthic epizoans that used
their calcareous outer shell to protect their vulnerable soft bodies (Herringshaw et
al., 2007; Vinn and Mutvei, 2005; Vinn and Wilson, 2013).
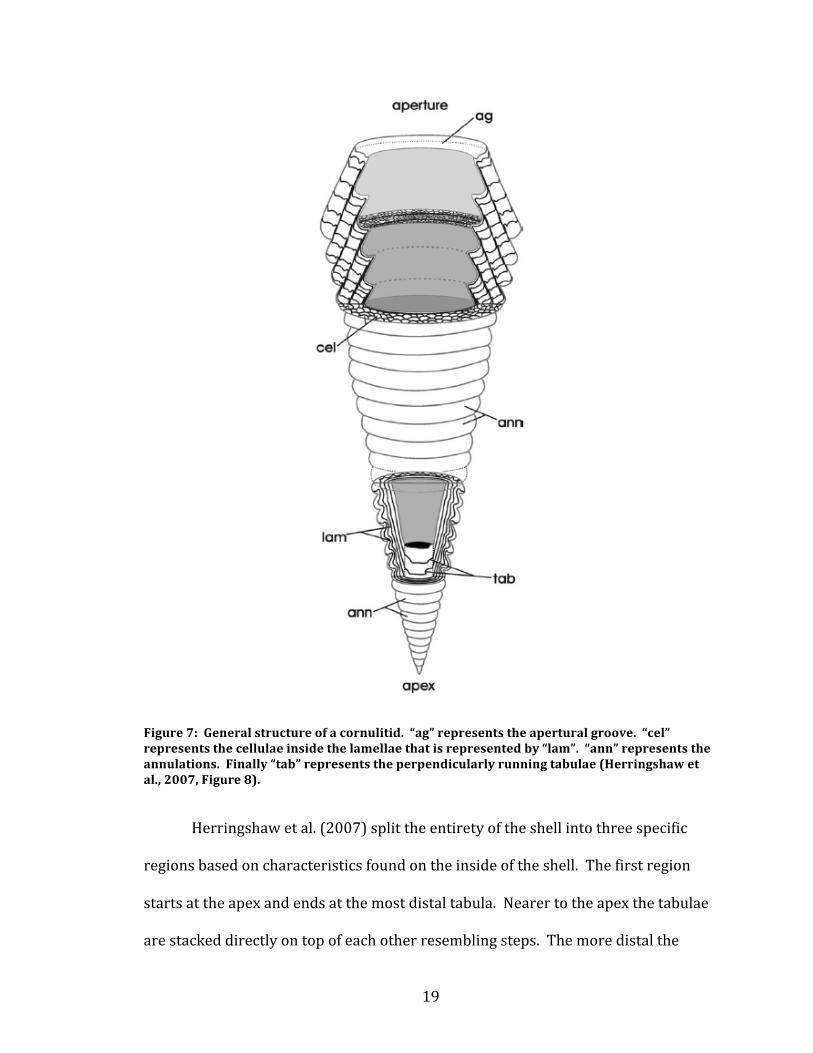
Morphologically, all species of Cornulites have laminar calcitic walls (Vinn
and Mutvei, 2005). The lamellae of cornulitids are characterized as layers of calcite
that make up the entirety of the wall and run around the interior of the organism.
The walls themselves are composed of cellulae, sometimes referred to as vesicles.
These vesicles are small vacant spaces between each lamellae that occur most
commonly towards the aperture of the shell. Internally, near the apex of the shell,
there can be found small layers of calcite that mark the beginning of the lamellae
called tabulae. The tabulae run at about right angles to the lamellae and the empty
spaces that separate them are called camera. Externally, undulations running
parallel to the aperture can be seen all along the shell. These are called annulations
and are interpreted as growth lines. Perpendicular to these annulations are rib like
lines known as costae (Herringshaw et al., 2007). Figure 7 shows the general
structure of a cornulitid.
19
Figure 7: General structure of a cornulitid. “ag” represents the apertural groove. “cel” represents the cellulae inside the lamellae that is represented by “lam”. “ann” represents the annulations. Finally “tab” represents the perpendicularly running tabulae (Herringshaw et al., 2007, Figure 8).
Herringshaw et al. (2007) split the entirety of the shell into three specific
regions based on characteristics found on the inside of the shell. The first region
starts at the apex and ends at the most distal tabula. Nearer to the apex the tabulae
are stacked directly on top of each other resembling steps. The more distal the
20
tabula, the farther apart they are. The most apertural part of the apical section is
where camerae are visible. This region is where the concept that cornulitid shells
have cone-‐in-‐cone like structures originated. The mid-‐region begins where the
apical region ends, at the most distal tabula and ends at the first undulation on the
internal shell wall. This part of the shell is approximately where cellulae begin to
appear. Finally, the apertural region, begins at the first undulation on the interior
and ends at the aperture. The interior of the shell in this region seems to be
annulated similarly to the exterior, making it indistinguishable (Herringshaw et al.,
2007; Vinn and Mutvei, 2005).
It is theorized by Vinn and Mutvei (2005) that life for cornulitids began with
a larval stage that was most likely pelagic. Once attached to the substrate, the
embryonic shell, sometimes visible at the apex, begins to form. This indicates that
cornulitids must have gone through a metamorphosis between attachment and shell
secretion. Unfortunately the embryonic shells are not preserved in larger
specimens, so initial morphology and the earliest stages of life for cornulitids are
largely unknown (Herringshaw et al., 2007).
Once metamorphosis was complete, shell secretion would begin. Vinn and
Mutvei (2005) theorized that a shell-‐secreting epithelium must have covered the
entire body of the cornulitid. The formation of the shell itself was accretionary and
started from the internal of the apex to the aperture (Herringshaw et al., 2007).
This explains the cone-‐in-‐cone pattern the lamellae take. This pattern of shell
secretion indicates that the shell initially grew on the inside of the shell until it
reached the previous layer’s apertural groove. Once there, the shell would continue
21
on the hard substrate or freely in the water. With each lamellae overgrowing the
previous apertural groove and closing it off, annulations therefore represent
previous positions of the aperture. Additionally, if each tabula marks the start of
each lamella, then the tabulae indicate the starting point of shell secretion as well as
the location where soft tissue begins. This also means that the camera are
indications of the soft tissue being lifted away from the last tabula before the start of
the secretion of the next tabulae and lamellae.

22
23
Systematics
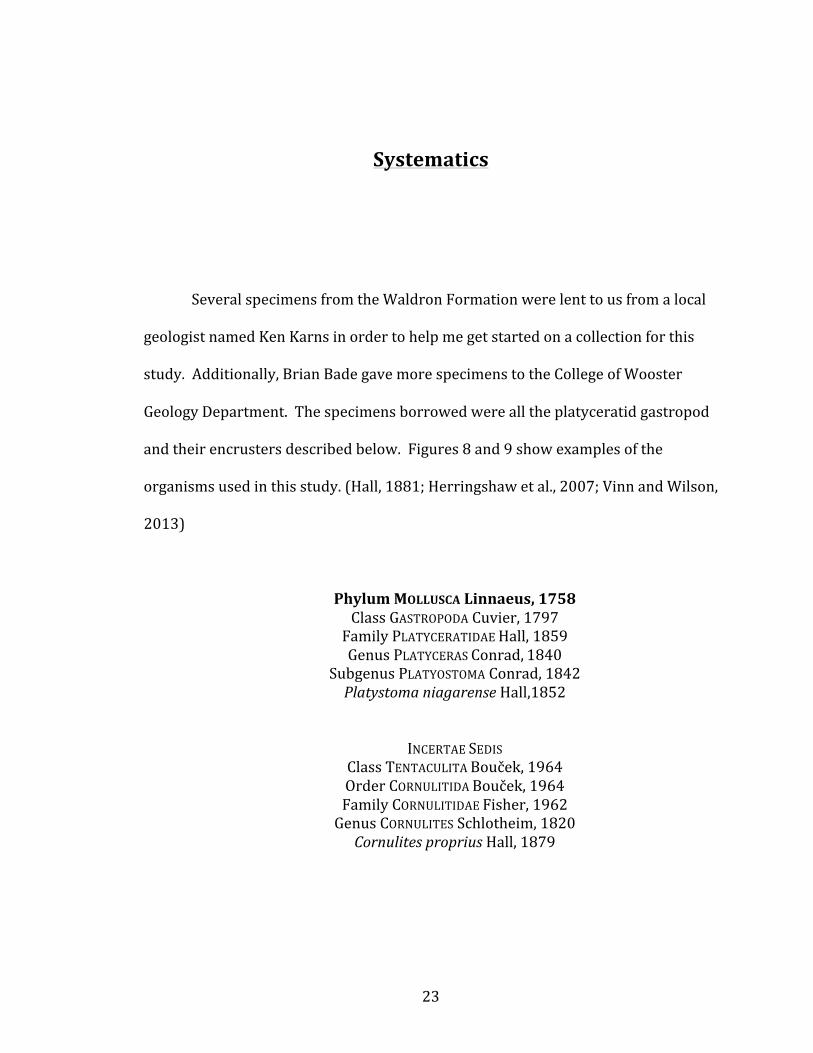
Several specimens from the Waldron Formation were lent to us from a local
geologist named Ken Karns in order to help me get started on a collection for this
study. Additionally, Brian Bade gave more specimens to the College of Wooster
Geology Department. The specimens borrowed were all the platyceratid gastropod
and their encrusters described below. Figures 8 and 9 show examples of the
organisms used in this study. (Hall, 1881; Herringshaw et al., 2007; Vinn and Wilson,
2013)
Phylum MOLLUSCA Linnaeus, 1758 Class GASTROPODA Cuvier, 1797 Family PLATYCERATIDAE Hall, 1859 Genus PLATYCERAS Conrad, 1840
Subgenus PLATYOSTOMA Conrad, 1842 Platystoma niagarense Hall,1852
INCERTAE SEDIS Class TENTACULITA Bouček, 1964 Order CORNULITIDA Bouček, 1964 Family CORNULITIDAE Fisher, 1962 Genus CORNULITES Schlotheim, 1820 Cornulites proprius Hall, 1879
24
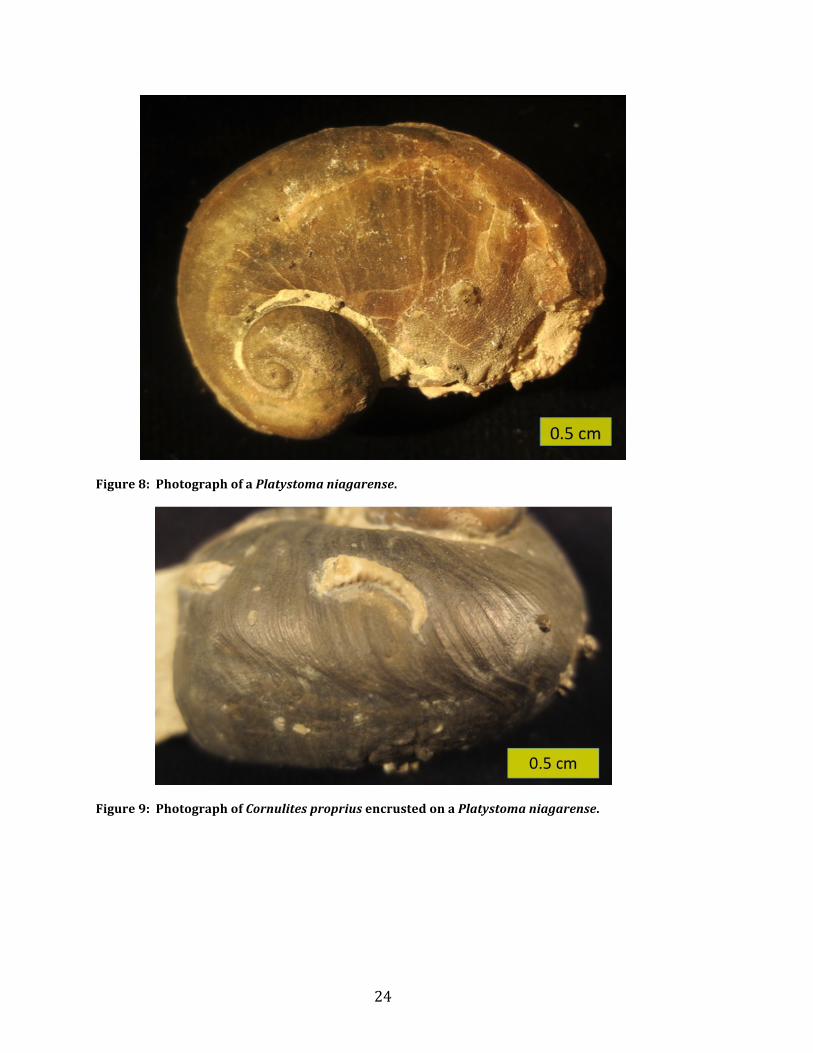
Figure 8: Photograph of a Platystoma niagarense.
Figure 9: Photograph of Cornulites proprius encrusted on a Platystoma niagarense.
25
Methods
Analysis of the specimens began by counting and categorizing cornulitids
depending on where they are attached to the platyceratid. A previous study done by
Morris and Felton (1993) details a specific way to divide the shell surface of a
platyceratid into 3 separate zones and a fourth special category to describe the
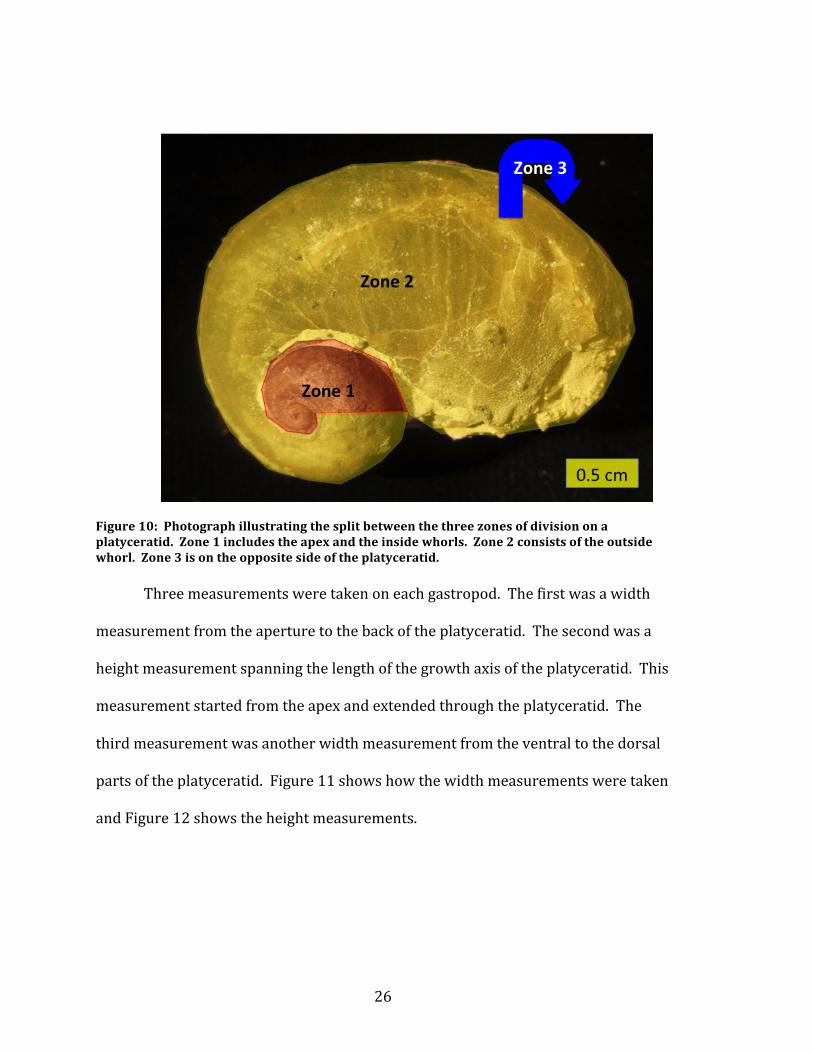
distribution of the encrusting cornulitids. The zones are illustrated in Figure 10.
The first zone is on the apex side of the shell; it consists of the area that can be seen
starting from the apex until the start of the outer most whorl. The second zone is
also on the apex side and consists of the entirety of the outside whorl. The third
zone is on the entire opposite side of the apex. The fourth special category is the
‘overgrowth’ category. These cornulitids are counted in this category because the
whorls of the host platyceratid overgrew the cornulitid (Morris and Felton, 1993).
26
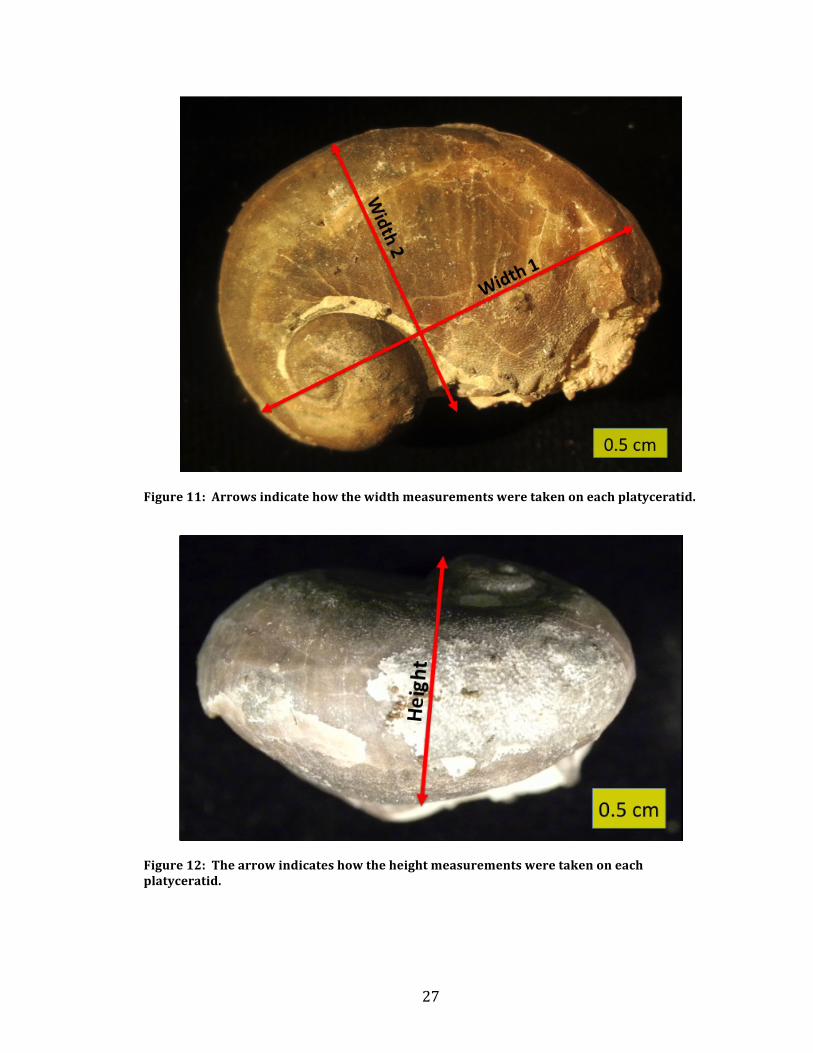
Figure 10: Photograph illustrating the split between the three zones of division on a platyceratid. Zone 1 includes the apex and the inside whorls. Zone 2 consists of the outside whorl. Zone 3 is on the opposite side of the platyceratid. Three measurements were taken on each gastropod. The first was a width
measurement from the aperture to the back of the platyceratid. The second was a
height measurement spanning the length of the growth axis of the platyceratid. This
measurement started from the apex and extended through the platyceratid. The
third measurement was another width measurement from the ventral to the dorsal
parts of the platyceratid. Figure 11 shows how the width measurements were taken
and Figure 12 shows the height measurements.
27
Figure 11: Arrows indicate how the width measurements were taken on each platyceratid.
Figure 12: The arrow indicates how the height measurements were taken on each platyceratid.
28
Length measurements of the cornulitids were also taken. Only those
cornulitids that could be completely measured were recorded. This means that
overgrown cornulitids were not measured. A string was used to measure those
cornulitids that had changing growth axes. The measurement spanned the length of
the growth axis of a cornulitid starting from the apex to the aperture.
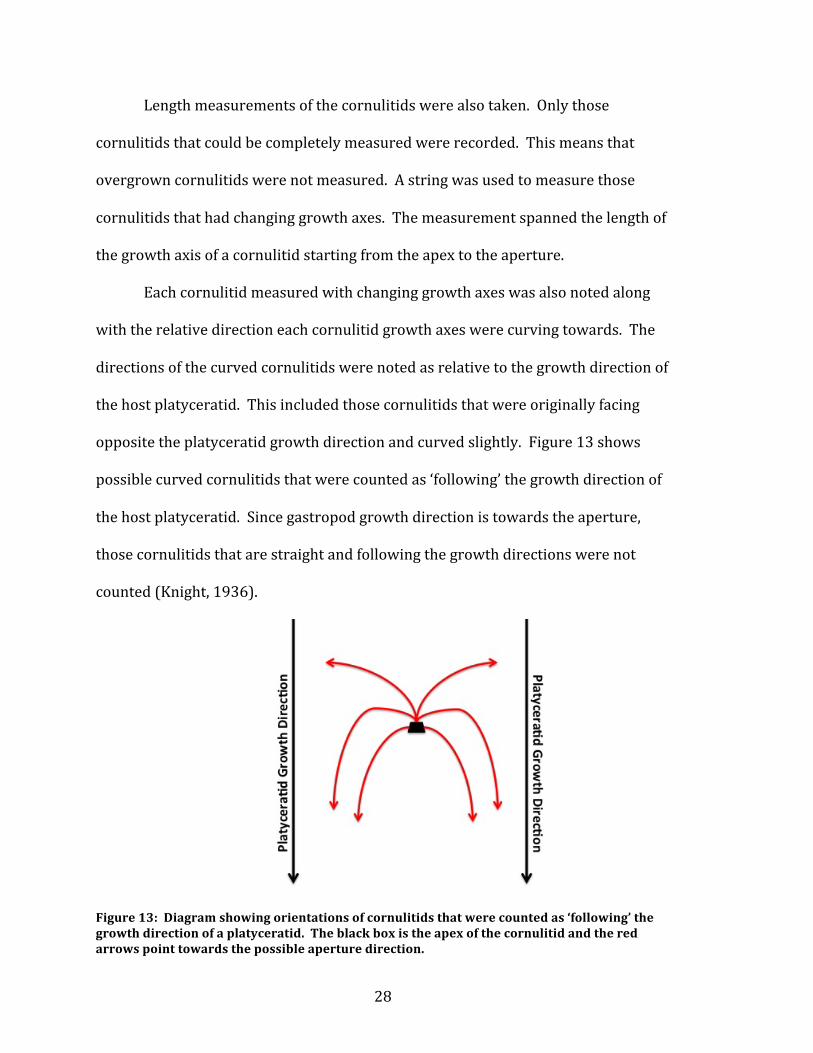
Each cornulitid measured with changing growth axes was also noted along
with the relative direction each cornulitid growth axes were curving towards. The
directions of the curved cornulitids were noted as relative to the growth direction of
the host platyceratid. This included those cornulitids that were originally facing
opposite the platyceratid growth direction and curved slightly. Figure 13 shows
possible curved cornulitids that were counted as ‘following’ the growth direction of
the host platyceratid. Since gastropod growth direction is towards the aperture,
those cornulitids that are straight and following the growth directions were not
counted (Knight, 1936).
Figure 13: Diagram showing orientations of cornulitids that were counted as ‘following’ the growth direction of a platyceratid. The black box is the apex of the cornulitid and the red arrows point towards the possible aperture direction.
29
Results
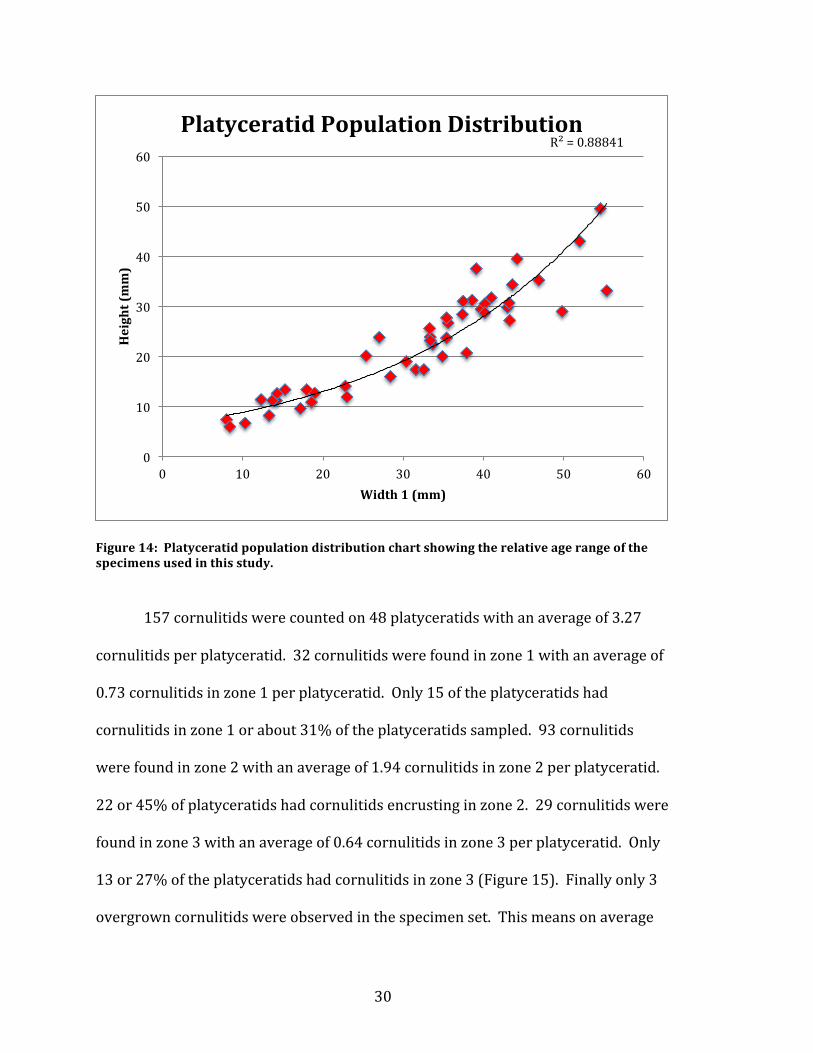
Data of the platyceratid measurements show that width 1 (Figure 11) of the
48 specimens used ranged from 8 millimeters in length to 55.4 millimeters in length.
The average width 1 length for this study is at 31.39 millimeters. The height (Figure
12) measured ranged from 6 millimeters to 49.5 millimeters in length with an
average of 22.67 millimeters. The range of the measured width 2 (Figure 11) is
from 6.1 millimeters to 42.9 millimeters with an average length of 24.08
millimeters. Width 1 measurements and height measurements were combined to
create a population distribution chart (Figure 14). This correlation resulted in the
relative age range of the platyceratids. The graph confirms that there is a healthy
normal population sampled ranging from small platyceratid being younger than
their larger counterparts.
30
Figure 14: Platyceratid population distribution chart showing the relative age range of the specimens used in this study.
157 cornulitids were counted on 48 platyceratids with an average of 3.27
cornulitids per platyceratid. 32 cornulitids were found in zone 1 with an average of
0.73 cornulitids in zone 1 per platyceratid. Only 15 of the platyceratids had
cornulitids in zone 1 or about 31% of the platyceratids sampled. 93 cornulitids
were found in zone 2 with an average of 1.94 cornulitids in zone 2 per platyceratid.
22 or 45% of platyceratids had cornulitids encrusting in zone 2. 29 cornulitids were
found in zone 3 with an average of 0.64 cornulitids in zone 3 per platyceratid. Only
13 or 27% of the platyceratids had cornulitids in zone 3 (Figure 15). Finally only 3
overgrown cornulitids were observed in the specimen set. This means on average
R² = 0.88841
0
10
20
30
40
50
60
0 10 20 30 40 50 60
Height (mm)
Width 1 (mm)
Platyceratid Population Distribution

31
there are 0.08 cornulitids overgrown per snail. These 3 cornulitids were found on 3
separate platyceratid specimens; this means 6% of platyceratids had an overgrown
cornulitid.
Zone #of Cornulitids Average per platyceratid
Percentage of platyceratids
1 32 0.73 31%
2 93 1.94 45%
3 29 0.64 27%
Figure 15: Table showing the statistics of how many cornulitids were in each zone and the platyceratids they encrusted. The last column of the table indicates the percentage of all the platyceratids that had cornulitids encrusting in that zone.
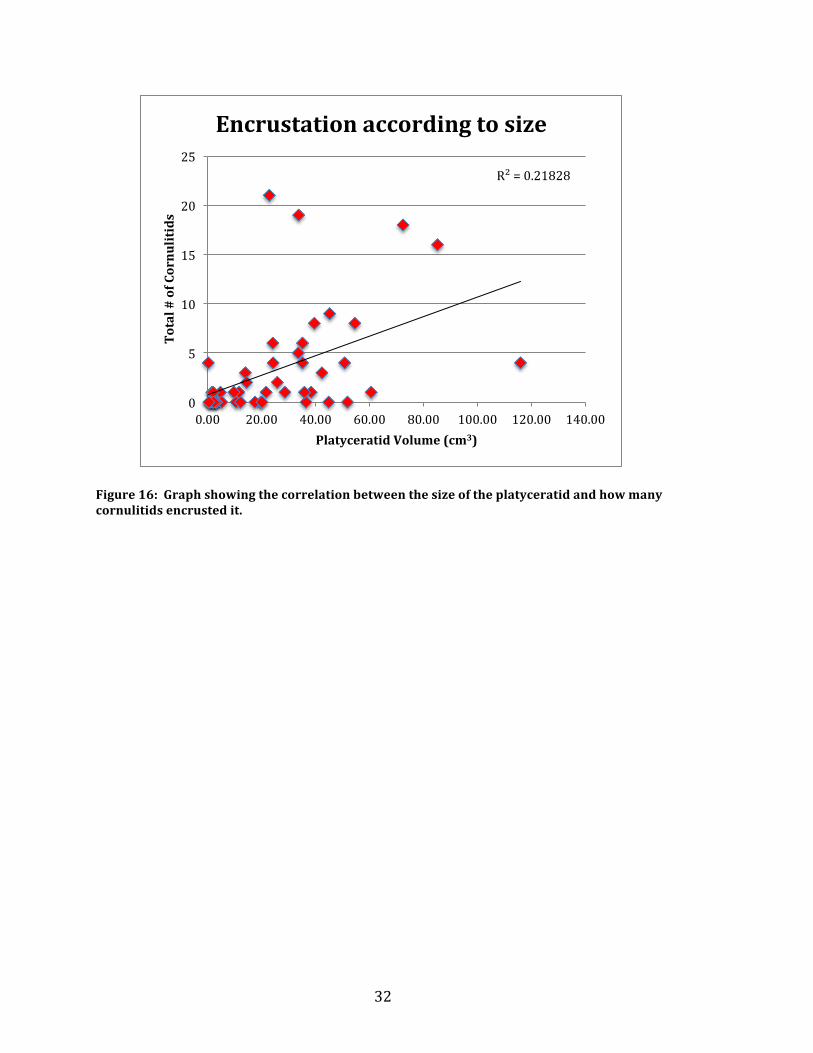
Cornulitid count data was combined with relative platyceratid volumetric
data found using all three measurements taken on each platyceratid. On average the
platyceratids had a volume of 25.46 cm3 and ranged from 0.31 cm3 to 115.95 cm3.
The combined data showed the tendency of cornulitid attachment. The Graph in
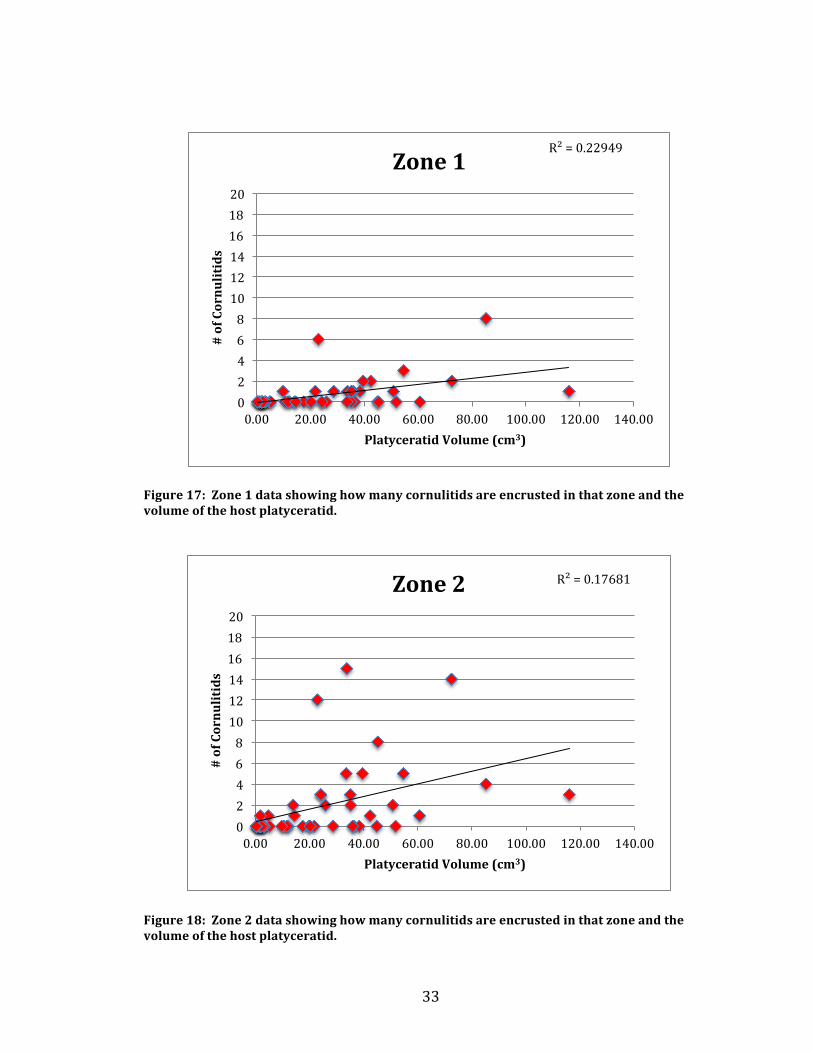
Figure 16 shows the correlation. Additionally the data of cornulitids encrusted in
each zone was correlated to the platyceratid volumetric data. Figures 17-‐19 shows
the correlations.
32
Figure 16: Graph showing the correlation between the size of the platyceratid and how many cornulitids encrusted it.
R² = 0.21828
0
5
10
15
20
25
0.00 20.00 40.00 60.00 80.00 100.00 120.00 140.00
Total # of Cornulitids
Platyceratid Volume (cm3)
Encrustation according to size
33
Figure 17: Zone 1 data showing how many cornulitids are encrusted in that zone and the volume of the host platyceratid.
Figure 18: Zone 2 data showing how many cornulitids are encrusted in that zone and the volume of the host platyceratid.
R² = 0.22949
0 2 4 6 8 10 12 14 16 18 20
0.00 20.00 40.00 60.00 80.00 100.00 120.00 140.00
# of Cornulitids
Platyceratid Volume (cm3)
Zone 1
R² = 0.17681
0 2 4 6 8 10 12 14 16 18 20
0.00 20.00 40.00 60.00 80.00 100.00 120.00 140.00
# of Cornulitids
Platyceratid Volume (cm3)
Zone 2
34
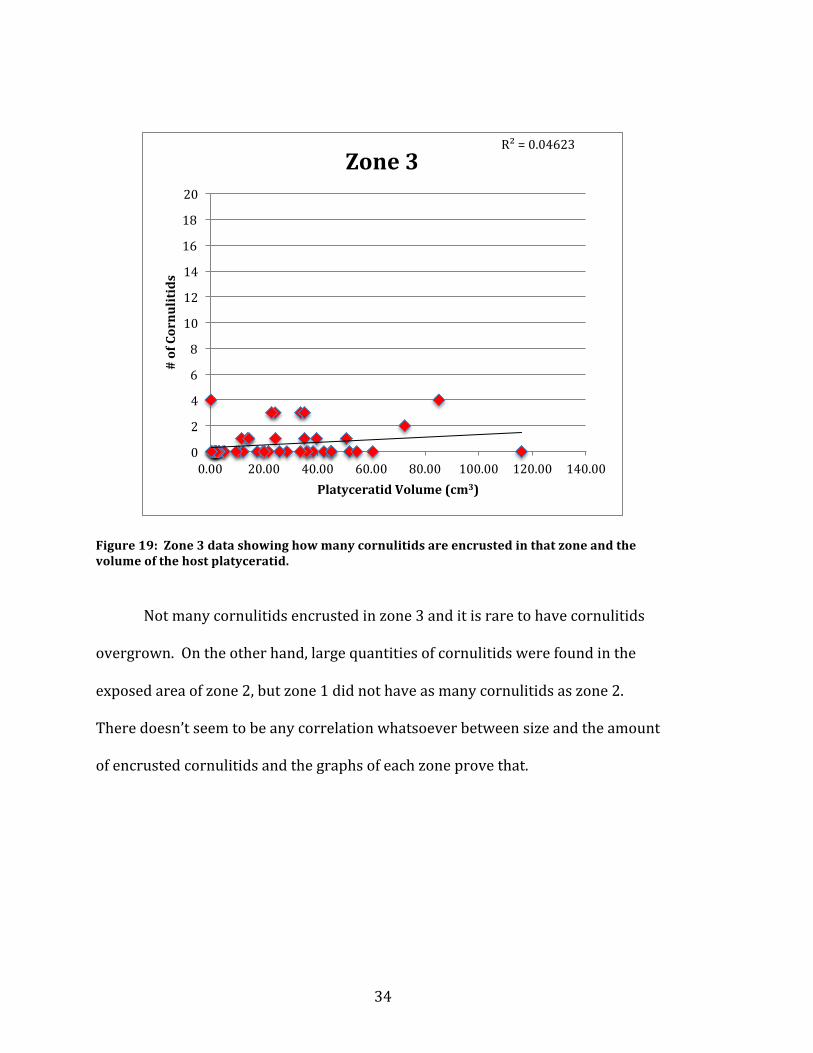
Figure 19: Zone 3 data showing how many cornulitids are encrusted in that zone and the volume of the host platyceratid.
Not many cornulitids encrusted in zone 3 and it is rare to have cornulitids
overgrown. On the other hand, large quantities of cornulitids were found in the
exposed area of zone 2, but zone 1 did not have as many cornulitids as zone 2.
There doesn’t seem to be any correlation whatsoever between size and the amount
of encrusted cornulitids and the graphs of each zone prove that.
R² = 0.04623
0
2
4
6
8
10
12
14
16
18
20
0.00 20.00 40.00 60.00 80.00 100.00 120.00 140.00
# of Cornulitids
Platyceratid Volume (cm3)
Zone 3
35
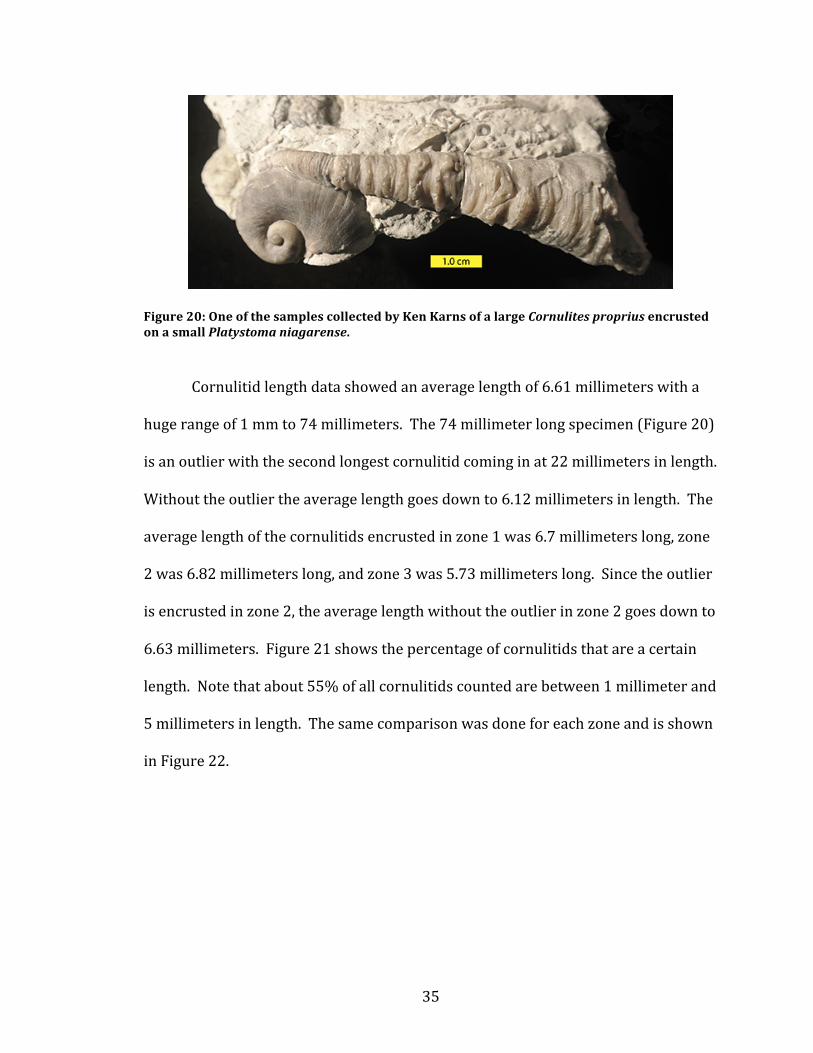
Figure 20: One of the samples collected by Ken Karns of a large Cornulites proprius encrusted on a small Platystoma niagarense.
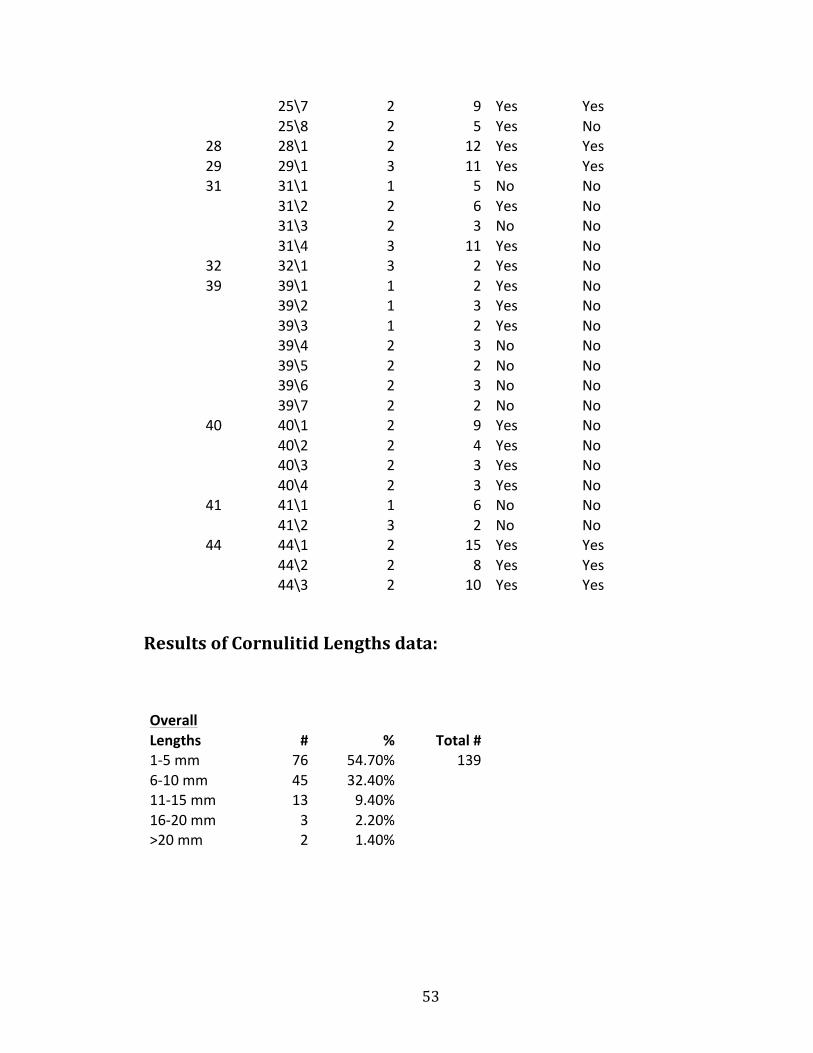
Cornulitid length data showed an average length of 6.61 millimeters with a
huge range of 1 mm to 74 millimeters. The 74 millimeter long specimen (Figure 20)
is an outlier with the second longest cornulitid coming in at 22 millimeters in length.
Without the outlier the average length goes down to 6.12 millimeters in length. The
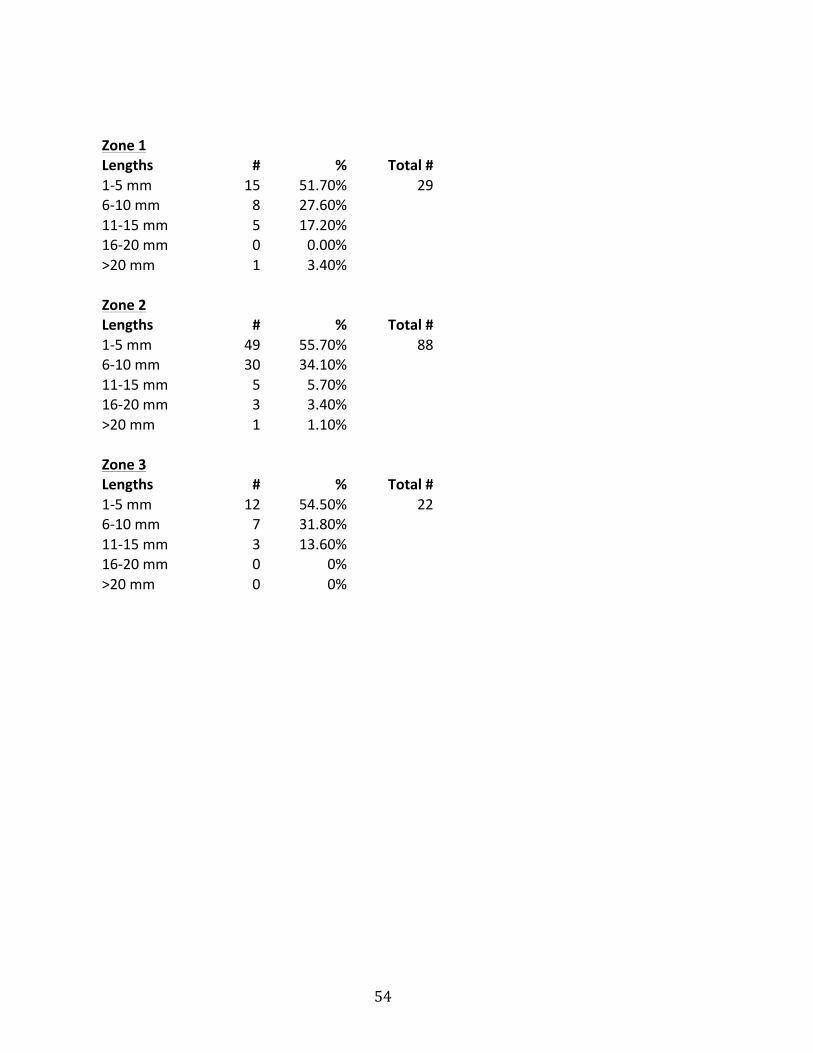
average length of the cornulitids encrusted in zone 1 was 6.7 millimeters long, zone
2 was 6.82 millimeters long, and zone 3 was 5.73 millimeters long. Since the outlier
is encrusted in zone 2, the average length without the outlier in zone 2 goes down to
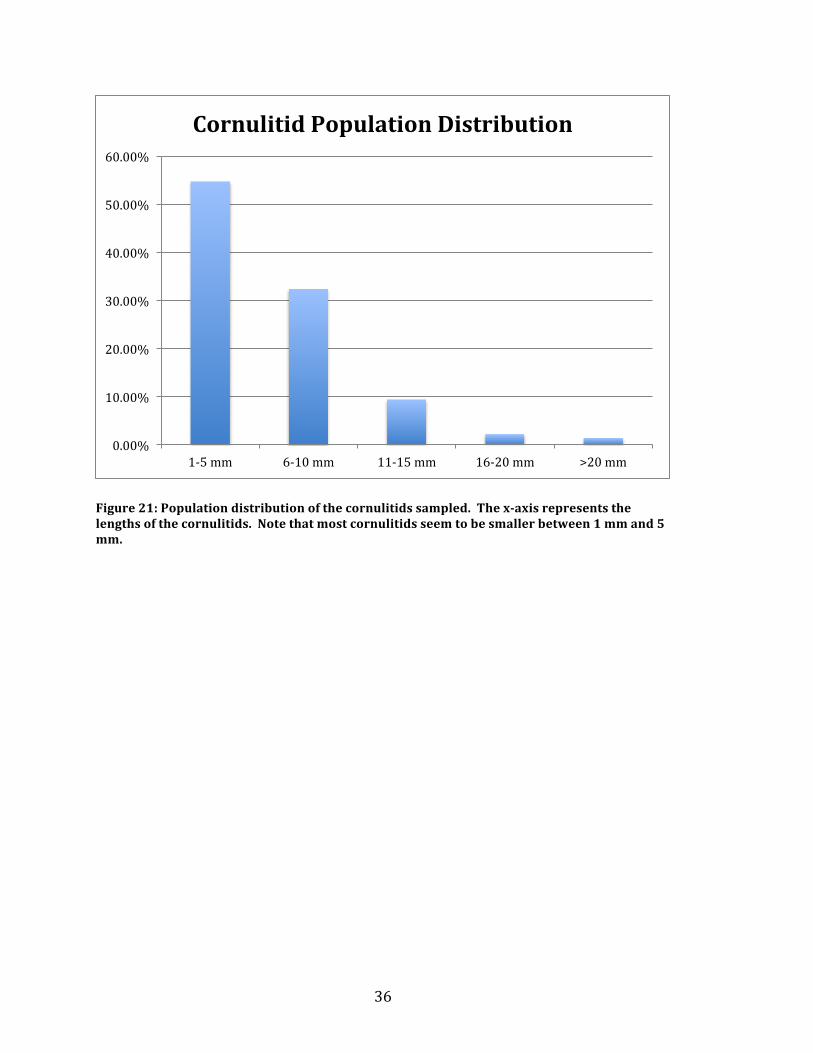
6.63 millimeters. Figure 21 shows the percentage of cornulitids that are a certain
length. Note that about 55% of all cornulitids counted are between 1 millimeter and
5 millimeters in length. The same comparison was done for each zone and is shown
in Figure 22.
36
Figure 21: Population distribution of the cornulitids sampled. The x-‐axis represents the lengths of the cornulitids. Note that most cornulitids seem to be smaller between 1 mm and 5 mm.
0.00%
10.00%
20.00%
30.00%
40.00%
50.00%
60.00%
1-‐5 mm 6-‐10 mm 11-‐15 mm 16-‐20 mm >20 mm
Cornulitid Population Distribution
37
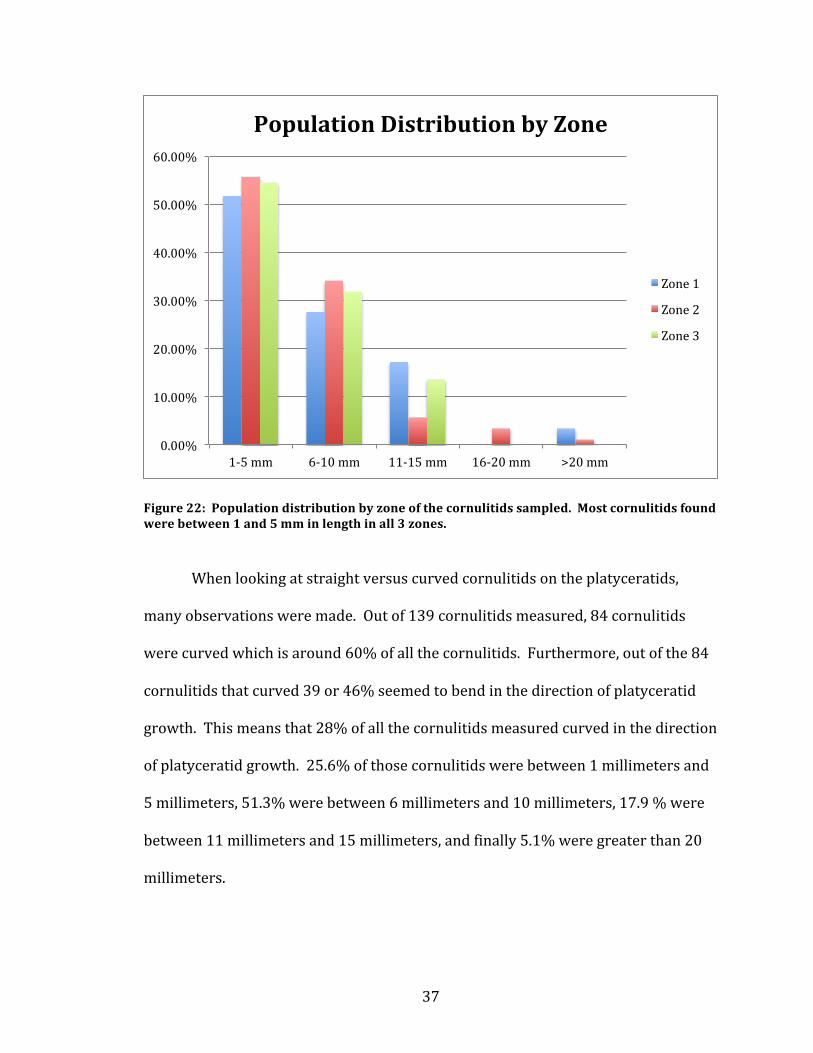
Figure 22: Population distribution by zone of the cornulitids sampled. Most cornulitids found were between 1 and 5 mm in length in all 3 zones.
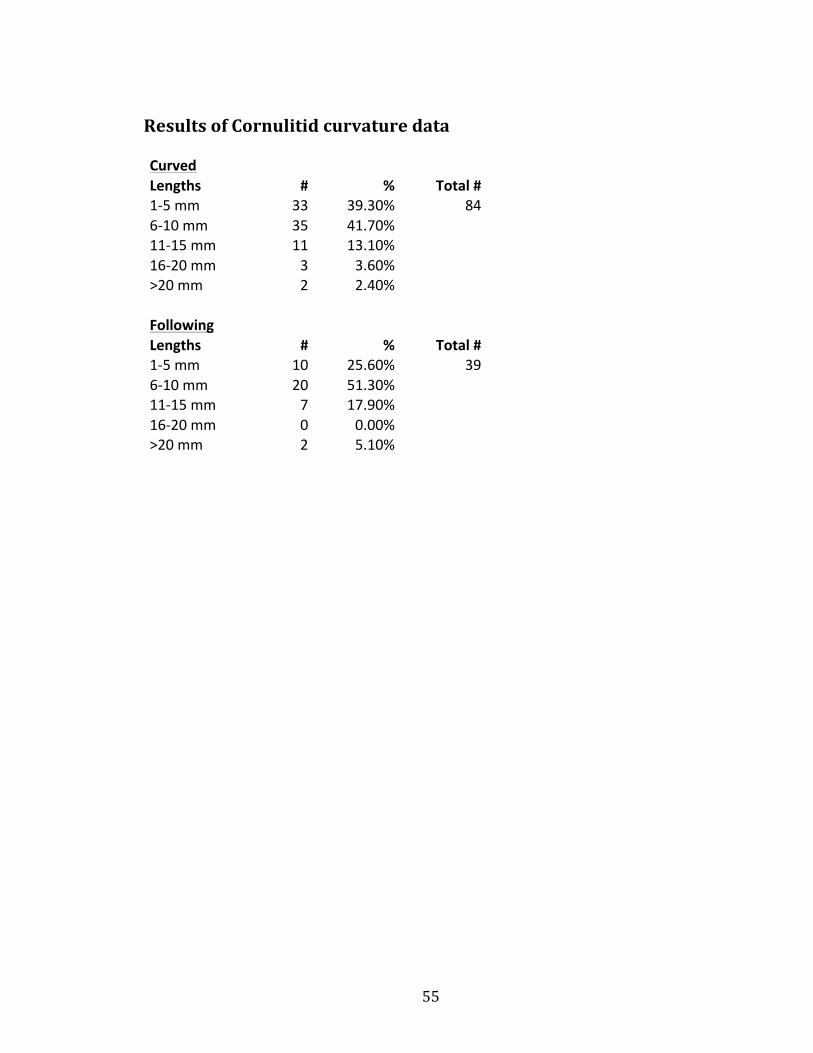
When looking at straight versus curved cornulitids on the platyceratids,
many observations were made. Out of 139 cornulitids measured, 84 cornulitids
were curved which is around 60% of all the cornulitids. Furthermore, out of the 84
cornulitids that curved 39 or 46% seemed to bend in the direction of platyceratid
growth. This means that 28% of all the cornulitids measured curved in the direction
of platyceratid growth. 25.6% of those cornulitids were between 1 millimeters and
5 millimeters, 51.3% were between 6 millimeters and 10 millimeters, 17.9 % were
between 11 millimeters and 15 millimeters, and finally 5.1% were greater than 20
millimeters.
0.00%
10.00%
20.00%
30.00%
40.00%
50.00%
60.00%
1-‐5 mm 6-‐10 mm 11-‐15 mm 16-‐20 mm >20 mm
Population Distribution by Zone
Zone 1
Zone 2
Zone 3

38
39
Discussion
To evaluate whether or not the cornulitids encrusted juvenile platyceratids, a
population distribution of the platyceratids themselves needs to be done. Figure 14
shows that the specimens studied had a normal population distribution, assuming
that the smaller specimens are juvenile and the larger specimens are mature.
Additionally the split in zones could be interpreted as the stages in the platyceratid
lifestyle; zones 1, 2, and 3 being juvenile, mature, and postmortem stages of the
platyceratid. Taking these assumptions into account, we should see an increasing
linear correlation between the size of the platyceratid and the number of cornulitids
attached to its shell. This would mean that as the platyceratid grows, more and
more cornulitids would encrust it. Yet as depicted in Figure 15, we do not see any
correlation between size of platyceratid and the number of encrusting cornulitids.
Figure 15 even showed a relatively medium sized platyceratid with a volume of
22.87 cm3 having 22 encrusting cornulitids on it. Another example is that the
largest platyceratid specimen only had 4 encrusting cornulitids. Immediately the
notion of size and age of platyceratid being a factor in cornulitid encrustation
behavior is ruled out. This conclusion is further supported by the distribution of
cornulitids in each zone (Figures 16 -‐18). If cornulitids were to encrust on juvenile
40
gastropods, then there should be a large number of cornulitids encrusted in zone 1
and growing out. On the contrary, it seems to be that most cornulitids were found to
be encrusting in zone 2. If we assume that zone 3 encrusted cornulitids most likely
encrusted after the death of the platyceratid, then we can conclude that the majority
attached themselves during the lifespan of the platyceratid. Furthermore, the
cornulitids seem to be clustered around the medium sized platyceratids in all three
zones, similar to the data for the encrusted cornulitids according to the size of
platyceratid.
Data comparison with the Ordovician examples done by Morris and Felton
(1993) only correlated on one part of their investigation. Morris and Felton found
that the distribution of cornulitids was concentrated on zone 2, meaning most
cornulitids were encrusted there. Similarly, they found that cornulitids would
rarely encrust zone 3. On the other hand, Morris and Felton found a correlation
between size and the number of cornulitids that attatched it. Their results show
that the bigger the platyceratid, the more cornulitids were found (Morris and Felton,
1993).
The cornulitid size distribution chart shows the characteristics of the
cornulitid population that encrusted the platyceratids. Figures 20 and 21 show that
more than 50% of the cornulitids counted are smaller and therefore juvenile. This
means that it is a juvenile dominated population of cornulitids that do not live long
and die young with the exception of the 74 millimeter long specimen. This could
mean that they possibly did not live long enough to be affected by the growth of the
41
platyceratid. Further support for this can be seen in Figure 21 where in every zone
more than 50% of the population is 1-‐5 millimeters long.
To check if the cornulitids lived long enough to be affected by the
platyceratid growth, the curve versus straight data was taken. The data shows that
60% of the cornulitids did curve in some manner. With this data, and the
knowledge that less than 50% of the cornulitids are larger than 5 millimeters in
length the conclusion that the cornulitids died before being effected by the growth
of the platyceratid is not supported. For that hypothesis to be supported, only the
larger cornulitids would curve and change their growth axes. This means only
about 40% of the cornulitids would be counted as such, however it did not
statistically follow. The range of the cornulitids that were counted as curved was
from 2 millimeters all the way up to the large 74 millimeters specimen. Although
the larger percentage of cornulitids (41.7%) that curved were 6-‐10 millimeters,
about 40% of the curved cornulitids were 1-‐5 millimeters in length. Additionally,
100% of those cornulitids that were larger than 16 millimeters curved.
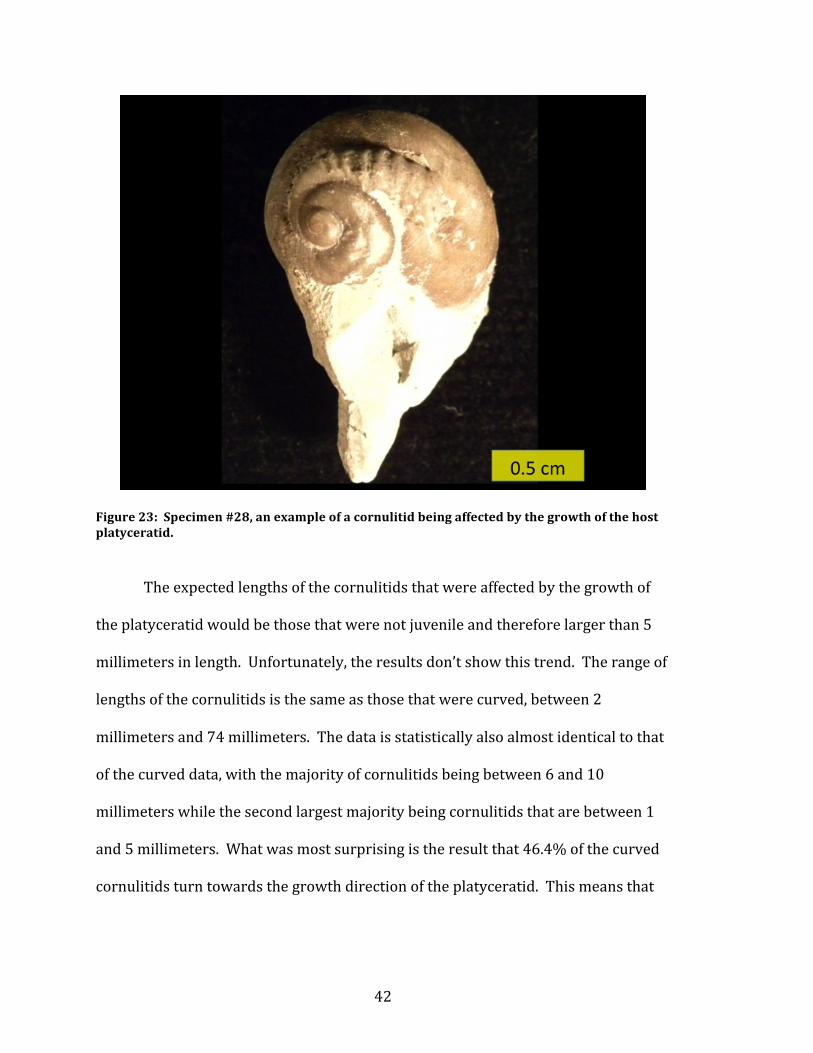
To further deduce if the cornulitids curved as a response to the growth of the
substrate that they were living on, the direction of their changing growth axes were
observed. Figure 23 is an example of what was expected of every cornulitid that
was growing on the platyceratid.
42
Figure 23: Specimen #28, an example of a cornulitid being affected by the growth of the host platyceratid.
The expected lengths of the cornulitids that were affected by the growth of
the platyceratid would be those that were not juvenile and therefore larger than 5
millimeters in length. Unfortunately, the results don’t show this trend. The range of
lengths of the cornulitids is the same as those that were curved, between 2
millimeters and 74 millimeters. The data is statistically also almost identical to that
of the curved data, with the majority of cornulitids being between 6 and 10
millimeters while the second largest majority being cornulitids that are between 1
and 5 millimeters. What was most surprising is the result that 46.4% of the curved
cornulitids turn towards the growth direction of the platyceratid. This means that
43
54.6% of the curved cornulitids did not. Therefore, the cornulitids actually were not
affected by the growth of the substrate that they are attached to.
Finally, the outlier cornulitid that is 74 millimeters long could not possibly
have grown so large during the lifetime of the host platyceratid. The 74 millimeter
long specimen was encrusted on specimen #4. This specimen has the volume of
about 4.76 cm3. The cornulitid was encrusted in zone 2 of the platyceratid meaning
that the platyceratid would have been fairly mature when the cornulitid attached.
Finally, due to the size difference it would be very hard for a living platyceratid to
hold such a large weight on its shell and therefore it would essentially fall off of the
crinoid that it was attached to.

44
45
Conclusions
Platyceratids of the Waldron Shale, specifically Platystoma niagarense, is
known to be an encruster on live crinoids of the Silurian. Furthermore cornulitids,
specifically Cornulites proprius, have been found encrusting the shells of the
platystoma niagrense. Data shows that there is no pattern to whether or not the
cornulitids encrusted on younger platyceratids or that more would be found
encrusted on larger platyceratids. This was not observed in the Ordovician
examples studied by Morris and Felton (1993). Additionally, there seems to be a
preference of encrusting zone 2 or the outside whorl of the platyceratid. Due to
most of the cornulitids being found in zones 1 and 2, and fewer found in zone 3, we
can conclude that most cornulitids encrusted the platyceratids while they were
alive. This is similar to the Ordovician examples studied by Morris and Felton
(1993). These cornulitids seem to be a juvenile dominated population that was
made up of a majority of smaller specimens, except for the 74 millimeter long
specimen observed.
Cornulitids that encrust these platyceratids seem to be also changing their
growth axes as they age on the growing substrate of the platyceratid shell. About
60% of the cornulitids measured were found to have changed their growth axes at
one point in their lifespan. The change in axis seems to be random and through
46
further analysis does not seem to follow any pattern. 46% of the curved cornulitids
turned towards the growth direction of the platyceratid and another 54% did not.
Therefore from the study done, the growth of the platyceratid shell does not seem to
affect the cornulitid.
Further studies should be done to incorporate the orientation of the
platyceratid on the crinoid itself. This would shed light on the direction of the
substrate the crinoid is on and what direction the food source of the cornulitids is
coming from. This research could better show the pattern in which the platyceratid
shell growth would affect the cornulitid growth direction.
47
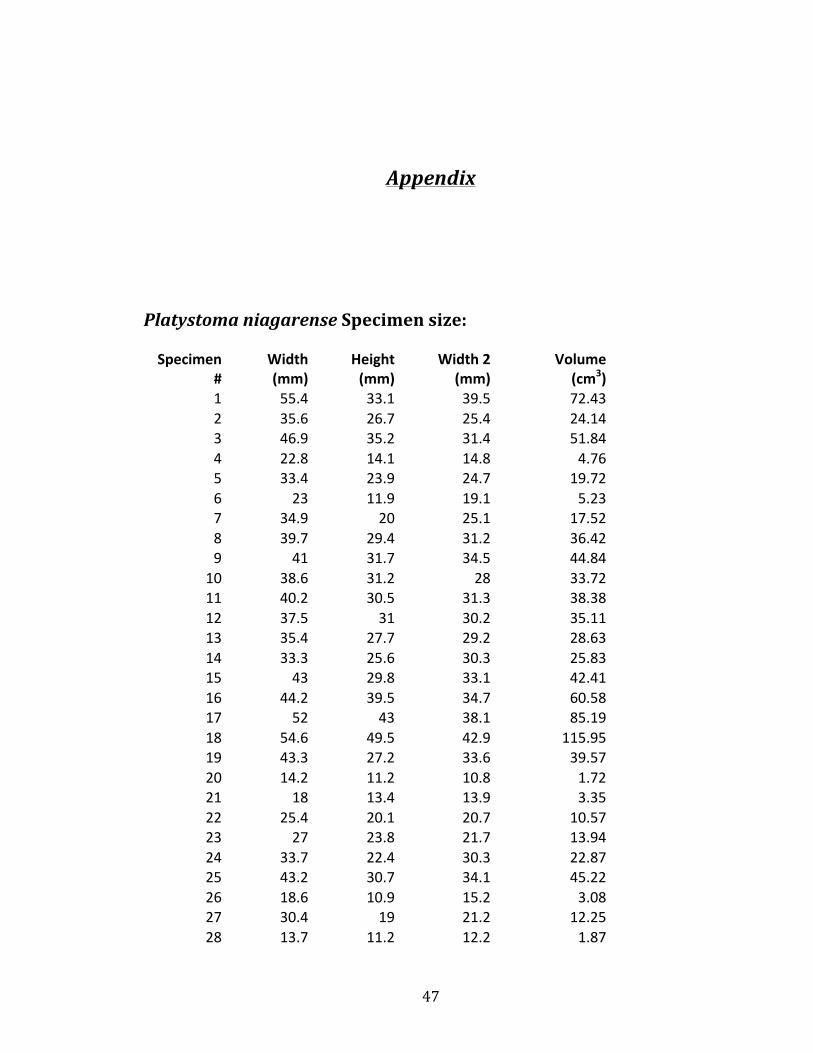
Appendix
Platystoma niagarense Specimen size: Specimen
# Width (mm)
Height (mm)
Width 2 (mm)
Volume (cm3)
1 55.4 33.1 39.5 72.43 2 35.6 26.7 25.4 24.14 3 46.9 35.2 31.4 51.84 4 22.8 14.1 14.8 4.76 5 33.4 23.9 24.7 19.72 6 23 11.9 19.1 5.23 7 34.9 20 25.1 17.52 8 39.7 29.4 31.2 36.42 9 41 31.7 34.5 44.84
10 38.6 31.2 28 33.72 11 40.2 30.5 31.3 38.38 12 37.5 31 30.2 35.11 13 35.4 27.7 29.2 28.63 14 33.3 25.6 30.3 25.83 15 43 29.8 33.1 42.41 16 44.2 39.5 34.7 60.58 17 52 43 38.1 85.19 18 54.6 49.5 42.9 115.95 19 43.3 27.2 33.6 39.57 20 14.2 11.2 10.8 1.72 21 18 13.4 13.9 3.35 22 25.4 20.1 20.7 10.57 23 27 23.8 21.7 13.94 24 33.7 22.4 30.3 22.87 25 43.2 30.7 34.1 45.22 26 18.6 10.9 15.2 3.08 27 30.4 19 21.2 12.25 28 13.7 11.2 12.2 1.87
48
29 31.6 17.4 21.2 11.66 30 14.3 12.6 11 1.98 31 39.1 37.5 34.6 50.73 32 32.6 17.4 25.5 14.46 33 12.3 11.4 11.2 1.57 34 28.4 16 21.4 9.72 35 19 12.7 12.4 2.99 36 10.3 6.7 8.1 0.56 37 17.2 9.6 12.6 2.08 38 37.4 28.4 33.8 35.90 39 49.8 29 37.8 54.59 40 40.2 28.7 29.1 33.57 41 43.6 34.3 23.5 35.14 42 37.9 20.7 27.7 21.73 43 33.4 23.2 26 20.15 44 35.4 23.7 28.9 24.25 45 13.3 8.2 9.2 1.00 46 15.3 13.4 11.2 2.30 47 8 7.4 7.5 0.44 48 8.4 6 6.1 0.31
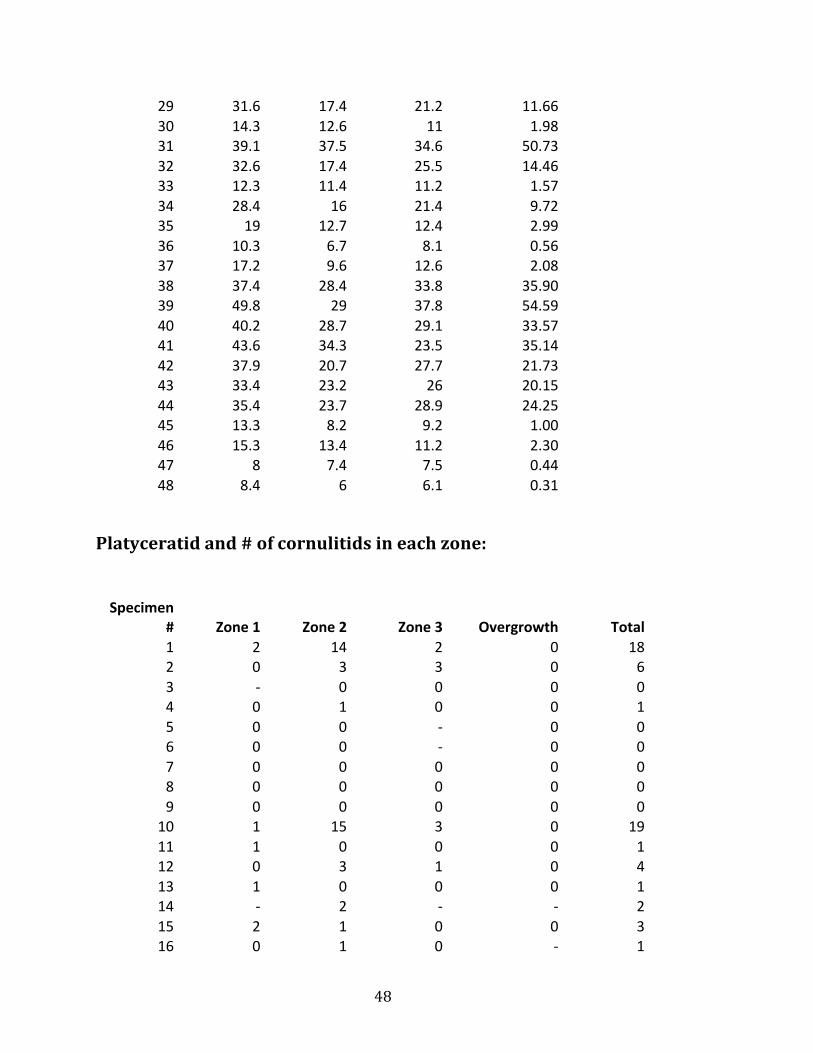
Platyceratid and # of cornulitids in each zone: Specimen
# Zone 1 Zone 2 Zone 3 Overgrowth Total 1 2 14 2 0 18 2 0 3 3 0 6 3 -‐ 0 0 0 0 4 0 1 0 0 1 5 0 0 -‐ 0 0 6 0 0 -‐ 0 0 7 0 0 0 0 0 8 0 0 0 0 0 9 0 0 0 0 0
10 1 15 3 0 19 11 1 0 0 0 1 12 0 3 1 0 4 13 1 0 0 0 1 14 -‐ 2 -‐ -‐ 2 15 2 1 0 0 3 16 0 1 0 -‐ 1
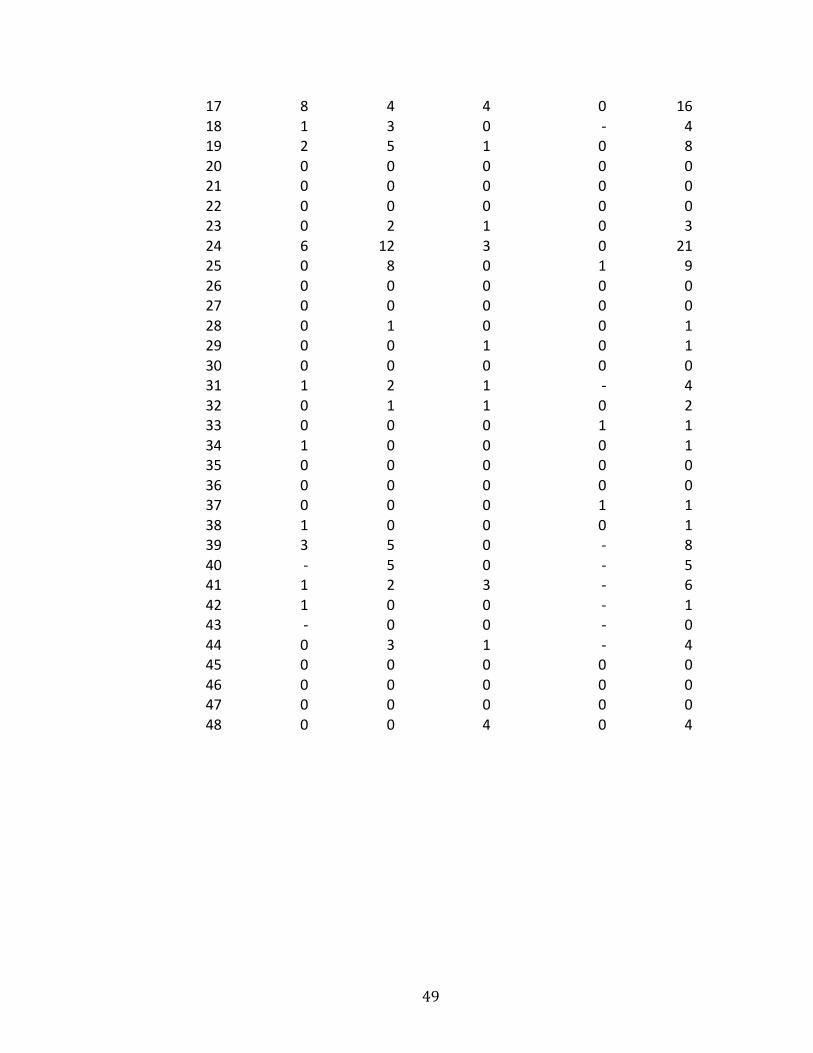
49
17 8 4 4 0 16 18 1 3 0 -‐ 4 19 2 5 1 0 8 20 0 0 0 0 0 21 0 0 0 0 0 22 0 0 0 0 0 23 0 2 1 0 3 24 6 12 3 0 21 25 0 8 0 1 9 26 0 0 0 0 0 27 0 0 0 0 0 28 0 1 0 0 1 29 0 0 1 0 1 30 0 0 0 0 0 31 1 2 1 -‐ 4 32 0 1 1 0 2 33 0 0 0 1 1 34 1 0 0 0 1 35 0 0 0 0 0 36 0 0 0 0 0 37 0 0 0 1 1 38 1 0 0 0 1 39 3 5 0 -‐ 8 40 -‐ 5 0 -‐ 5 41 1 2 3 -‐ 6 42 1 0 0 -‐ 1 43 -‐ 0 0 -‐ 0 44 0 3 1 -‐ 4 45 0 0 0 0 0 46 0 0 0 0 0 47 0 0 0 0 0 48 0 0 4 0 4
50
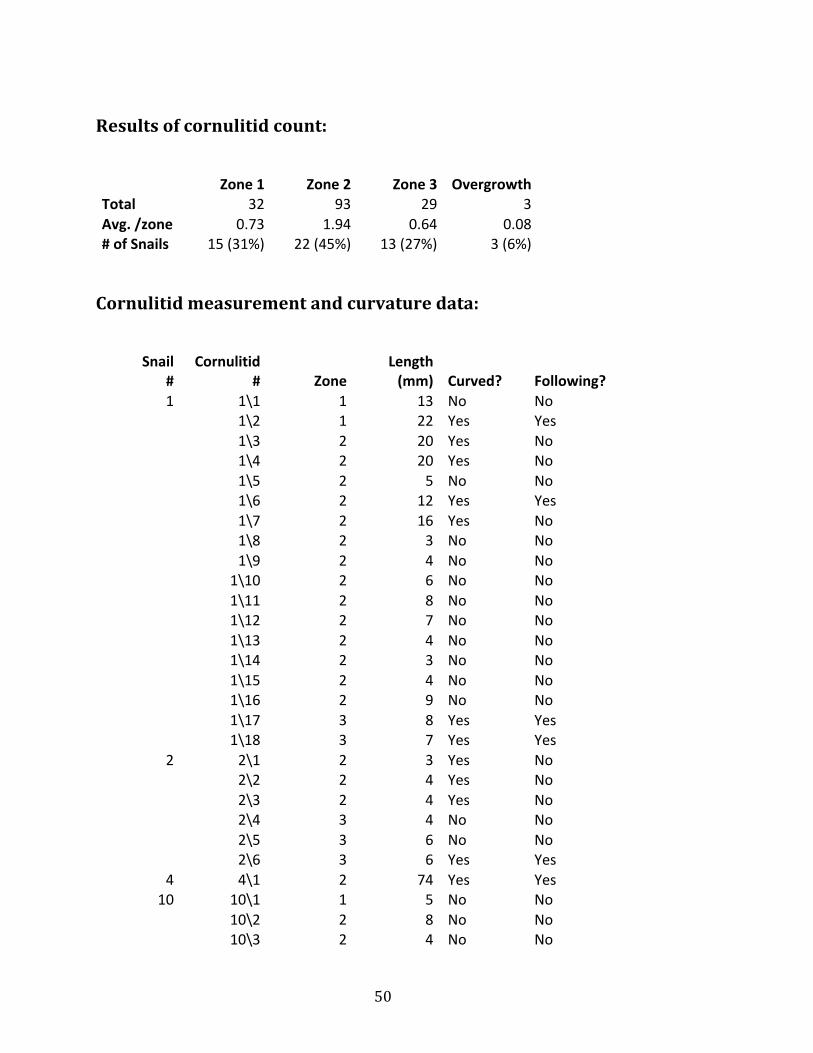
Results of cornulitid count:
Zone 1 Zone 2 Zone 3 Overgrowth
Total 32 93 29 3 Avg. /zone 0.73 1.94 0.64 0.08 # of Snails 15 (31%) 22 (45%) 13 (27%) 3 (6%) Cornulitid measurement and curvature data:
Snail #
Cornulitid # Zone
Length (mm) Curved? Following?
1 1\1 1 13 No No
1\2 1 22 Yes Yes
1\3 2 20 Yes No
1\4 2 20 Yes No
1\5 2 5 No No
1\6 2 12 Yes Yes
1\7 2 16 Yes No
1\8 2 3 No No
1\9 2 4 No No
1\10 2 6 No No
1\11 2 8 No No
1\12 2 7 No No
1\13 2 4 No No
1\14 2 3 No No
1\15 2 4 No No
1\16 2 9 No No
1\17 3 8 Yes Yes
1\18 3 7 Yes Yes
2 2\1 2 3 Yes No
2\2 2 4 Yes No
2\3 2 4 Yes No
2\4 3 4 No No
2\5 3 6 No No
2\6 3 6 Yes Yes
4 4\1 2 74 Yes Yes 10 10\1 1 5 No No
10\2 2 8 No No
10\3 2 4 No No
51
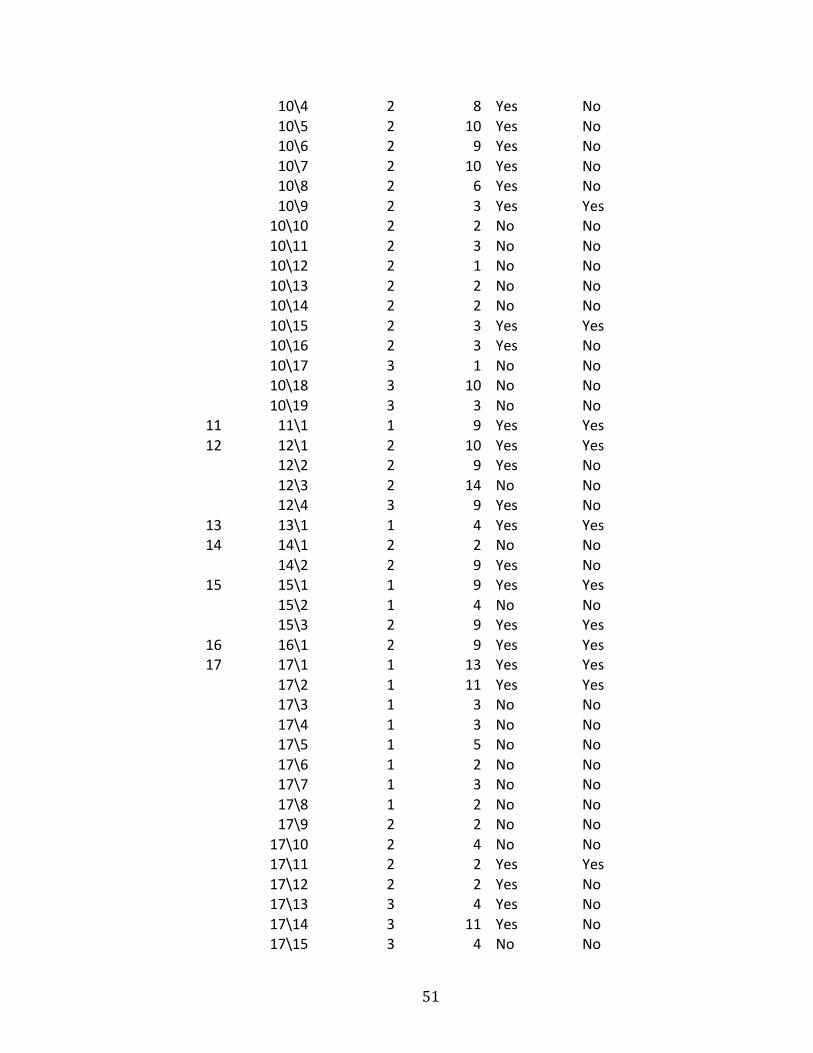
10\4 2 8 Yes No
10\5 2 10 Yes No
10\6 2 9 Yes No
10\7 2 10 Yes No
10\8 2 6 Yes No
10\9 2 3 Yes Yes
10\10 2 2 No No
10\11 2 3 No No
10\12 2 1 No No
10\13 2 2 No No
10\14 2 2 No No
10\15 2 3 Yes Yes
10\16 2 3 Yes No
10\17 3 1 No No
10\18 3 10 No No
10\19 3 3 No No
11 11\1 1 9 Yes Yes 12 12\1 2 10 Yes Yes
12\2 2 9 Yes No
12\3 2 14 No No
12\4 3 9 Yes No
13 13\1 1 4 Yes Yes 14 14\1 2 2 No No
14\2 2 9 Yes No
15 15\1 1 9 Yes Yes
15\2 1 4 No No
15\3 2 9 Yes Yes
16 16\1 2 9 Yes Yes 17 17\1 1 13 Yes Yes
17\2 1 11 Yes Yes
17\3 1 3 No No
17\4 1 3 No No
17\5 1 5 No No
17\6 1 2 No No
17\7 1 3 No No
17\8 1 2 No No
17\9 2 2 No No
17\10 2 4 No No
17\11 2 2 Yes Yes
17\12 2 2 Yes No
17\13 3 4 Yes No
17\14 3 11 Yes No
17\15 3 4 No No
52
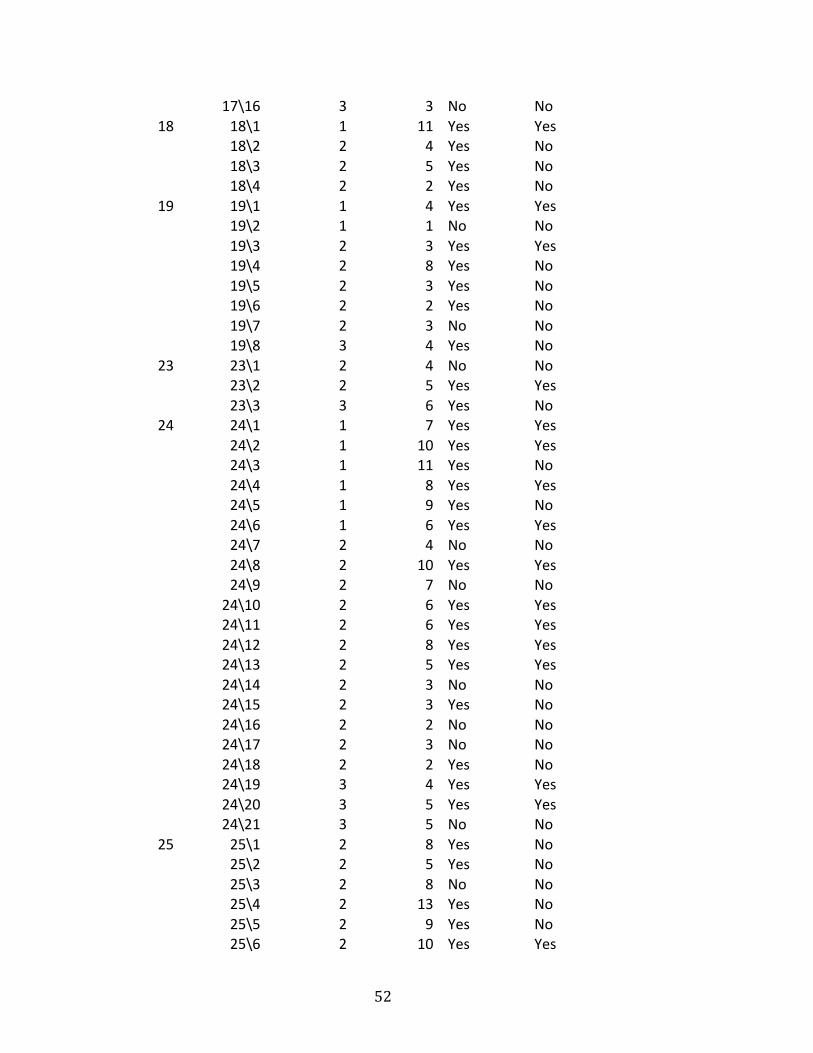
17\16 3 3 No No
18 18\1 1 11 Yes Yes
18\2 2 4 Yes No
18\3 2 5 Yes No
18\4 2 2 Yes No
19 19\1 1 4 Yes Yes
19\2 1 1 No No
19\3 2 3 Yes Yes
19\4 2 8 Yes No
19\5 2 3 Yes No
19\6 2 2 Yes No
19\7 2 3 No No
19\8 3 4 Yes No
23 23\1 2 4 No No
23\2 2 5 Yes Yes
23\3 3 6 Yes No
24 24\1 1 7 Yes Yes
24\2 1 10 Yes Yes
24\3 1 11 Yes No
24\4 1 8 Yes Yes
24\5 1 9 Yes No
24\6 1 6 Yes Yes
24\7 2 4 No No
24\8 2 10 Yes Yes
24\9 2 7 No No
24\10 2 6 Yes Yes
24\11 2 6 Yes Yes
24\12 2 8 Yes Yes
24\13 2 5 Yes Yes
24\14 2 3 No No
24\15 2 3 Yes No
24\16 2 2 No No
24\17 2 3 No No
24\18 2 2 Yes No
24\19 3 4 Yes Yes
24\20 3 5 Yes Yes
24\21 3 5 No No
25 25\1 2 8 Yes No
25\2 2 5 Yes No
25\3 2 8 No No
25\4 2 13 Yes No
25\5 2 9 Yes No
25\6 2 10 Yes Yes
53
25\7 2 9 Yes Yes
25\8 2 5 Yes No
28 28\1 2 12 Yes Yes 29 29\1 3 11 Yes Yes 31 31\1 1 5 No No
31\2 2 6 Yes No
31\3 2 3 No No
31\4 3 11 Yes No
32 32\1 3 2 Yes No 39 39\1 1 2 Yes No
39\2 1 3 Yes No
39\3 1 2 Yes No
39\4 2 3 No No
39\5 2 2 No No
39\6 2 3 No No
39\7 2 2 No No
40 40\1 2 9 Yes No
40\2 2 4 Yes No
40\3 2 3 Yes No
40\4 2 3 Yes No
41 41\1 1 6 No No
41\2 3 2 No No
44 44\1 2 15 Yes Yes
44\2 2 8 Yes Yes
44\3 2 10 Yes Yes
Results of Cornulitid Lengths data: Overall
Lengths # % Total # 1-‐5 mm 76 54.70% 139 6-‐10 mm 45 32.40%
11-‐15 mm 13 9.40% 16-‐20 mm 3 2.20% >20 mm 2 1.40%
54
Zone 1 Lengths # % Total #
1-‐5 mm 15 51.70% 29 6-‐10 mm 8 27.60%
11-‐15 mm 5 17.20% 16-‐20 mm 0 0.00% >20 mm 1 3.40%
Zone 2 Lengths # % Total #
1-‐5 mm 49 55.70% 88 6-‐10 mm 30 34.10%
11-‐15 mm 5 5.70% 16-‐20 mm 3 3.40% >20 mm 1 1.10%
Zone 3 Lengths # % Total #
1-‐5 mm 12 54.50% 22 6-‐10 mm 7 31.80%
11-‐15 mm 3 13.60% 16-‐20 mm 0 0% >20 mm 0 0%
55
Results of Cornulitid curvature data Curved
Lengths # % Total # 1-‐5 mm 33 39.30% 84 6-‐10 mm 35 41.70%
11-‐15 mm 11 13.10% 16-‐20 mm 3 3.60% >20 mm 2 2.40%
Following Lengths # % Total #
1-‐5 mm 10 25.60% 39 6-‐10 mm 20 51.30%
11-‐15 mm 7 17.90% 16-‐20 mm 0 0.00% >20 mm 2 5.10%

56
57
References Cited
Baumiller, T.K., 2003, Evaluating the interaction between platyceratid gastropods
and crinoids: a cost–benefit approach: Palaeogeography, Palaeoclimatology,
Palaeoecology, v. 201, p. 199–209, doi: 10.1016/S0031-‐0182(03)00625-‐4.
Baumiller, T.K., and Gahn, F.J., 2002, Fossil record of parasitism on marine
invertebrates with special emphasis on the platyceratid-‐crinoid interaction:
Paleontological Society Papers, v. 8, p. 195–210.
Beaumont, C., Quinlan, G., and Hamilton, J., 1988, Orogeny and stratigraphy:
Numerical models of the Paleozoic in the eastern interior of North America:
Tectonics, v. 7, p. 389–416, doi: 10.1029/TC007i003p00389.
Bowsher, A.L., 1955, Origin and adaptation of platyceratid gastropods: University of
kansas Paleontological Contributions, p. 1–11.
Brett, C.E., Cramer, B.D., McLaughlin, P.I., Kleffner, M.A., Showers, W.J., and Thomka,
J.R., 2012, Revised Telychian-‐Sheinwoodian (Silurian) stratigraphy of the
Laurentian mid-‐continent: building uniform nomenclature along the
Cincinnati Arch: Bulletin of Geosciences, v. 87, p. 733–753.
58
Droste, J., B., and Shaver, R., H., 1982, The Salina Group (Middle and Upper Silurian)
of Indiana: Indiana Geological Survey special report, p. 1–41.
Feldman, H.R., 1989, Taphonomic processes in the Waldron Shale, Silurian, Southern
Indiana: Palaios, v. 4, p. 144–156, doi: 10.2307/3514602.
Fryda, J., Racheboeuf, P.R., Frydova, B., Ferrova, L., Mergl, M., and Berkyova, S., 2009,
Platyceratid gastropods -‐ stem group of patellogastropods, neritimorphs or
something else? Bulletin of Geosciences, v. 84, p. 107–120, doi:
10.3140/bull.geosci.1125.
Gahn, F.J., and Baumiller, T.K., 2006, Using platyceratid gastropod behaviour to test
functional morphology: Historical Biology, v. 18, p. 397–404, doi:
10.1080/08912960600668524.
Gahn, F.J., Fabian, A., and Baumiller, T.K., 2003, Additional evidence for the drilling
behavior of Paleozoic gastropods: Acta Palaeontologica Polonica, v. 48, p.
156–156.
Hall, J., 1881, Descriptions of the species of fossils found in the Niagara group at
Waldron, Indiana, in Indiana Department of Geology and Natural Resources,
Eleventh Annual Report, Indiana Department of Geology and Natural
Resources, p. 217–345.
Herringshaw, L.G., Thomas, A.T., and Smith, M.P., 2007, Systematics, shell structure
and affinities of the Palaeozoic problematicum Cornulites: Zoological Journal
59
of the Linnean Society, v. 150, p. 681–699, doi: 10.1111/j.1096-‐
3642.2007.00300.x.
Knight, J.B., 1936, Notes on Paleozoic Gastropoda: Journal of Paleontology, v. 10, p.
520–534.
Morris, R.W., and Felton, S.H., 1993, Symbiotic association of crinoids, platyceratid
gastropods, and cornulites in the Upper Ordovician (Cincinnatian) of the
Cincinnati, Ohio Region: Palaios, v. 8, p. 465–476, doi: 10.2307/3515020.
Peters, S.E., and Bork, K.B., 1998, Secondary tiering on crinoids from the Waldron
Shale (Silurian: Wenlockian) of Indiana: Journal of Paleontology, v. 72, p.
887–893.
Peters, S.E., and Bork, K.B., 1999, Species-‐abundance models: An ecological approach
to inferring paleoenvironment and resolving paleoecological change in the
Waldron Shale (Silurian): Palaios, v. 14, p. 234–245, doi: 10.2307/3515436.
Sutton, M.D., Briggs, D.E.G., Siveter, D.J., and Siveter, D.J., 2006, Fossilized soft tissues
in a Silurian platyceratid gastropod: Proceedings of the Royal Society B:
Biological Sciences, v. 273, p. 1039–1044, doi: 10.1098/rspb.2005.3403.
Taylor, P.D., and Wilson, M.A., 2003, Palaeoecology and evolution of marine hard
substrate communities: Earth-‐Science Reviews, v. 62, p. 1–103, doi:
10.1016/S0012-‐8252(02)00131-‐9.
60
Vinn, O., and Mutvei, H., 2005, Observations on the morphology and affinities of
cornulitids from the Ordovician of Anticosti Island and the Silurian of
Gotland: Journal of Paleontology, v. 79, p. 726–737, doi: 10.1666/0022-‐
3360(2005)079[0726:OOTMAA]2.0.CO;2.
Vinn, O., and Wilson, M.A., 2013, Silurian cornulitids of Estonia (Baltica): Carnets de
Géologie [Notebooks on Geology], v. Article 2013/09 (CG2013_A09), p. 357–
368.