iagri program performance management plan · iagri program performance management plan ... pmu...
TRANSCRIPT

`
USAID TANZANIA
iAGRI PROGRAM
PERFORMANCE MANAGEMENT PLAN
FY 2011- FY 2016
October 2011
This publication was produced by Ohio State University and Virginia Polytechnic Institute and State University for
review by the United States Agency for International Development in Tanzania

`
INNOVATIVE AGRICULTURAL
RESEARCH INITIATIVE (iAGRI)
PERFORMANCE MANAGEMENT
PLAN (FY 2011- FY 2016)
Any opinions or statements contained in this document are those of the authors and do not necessarily express
the views of the United States Government or the United States for International Development.

`
ABBREVIATIONS AND ACRONYMS
ASDP Agricultural Sector Development Program System
CAADP Comprehensive Africa Agricultural Development Plan
CBO Community Based Organization
COP Chief of Party
CRG Collaborative Research Grant
CRSP Collaborative Research Support Program
DQA Data Quality Assessment
FTF Feed the Future, USG global and hunger and food security index
GDA Global Development Alliance
GIS Geographic Information System
GOT Government of Tanzania
HICD Human and Institutional Capacity Development
iAGRI Innovative Agricultural Research Initiative
ICT Information and Communication Technology
IR Intermediary Results
IARC International Agricultural Research Centers
IPTT Indicator Performance Tracking Table
ISU Iowa State University
MAFSC Ministry of Agriculture Food Security and Co-operatives
M&E Monitoring and Evaluation
MSU Michigan States University
MOU Memorandum of Understanding

`
NARS National Agricultural Research System
NGO Non-Governmental Organization
OSU Ohio State University
OSUC Ohio States University Consortium
PPP Public- Private Partnership
PMP Performance Management Plan
PMU Project Management Unit
RCT Randomized Control Trial
SUA Sokoine University of Agriculture
TMG The Mitchel Group
TU Tuskegee University
UF University of Florida
TFtF Tanzania Feed the Future
USAID U.S Agency for International Development
USG United States Government
SSUC South-South university cooperation
`
CONTENTS
USAID/iAGRI Results Framework………………………………………………………………....6
A. Background ……………………………………………………………………………....6
B. Components of iAGRI Results Framework…………………………………………….6
C. Linkages Between iAGRI Results Framework and Assistance Objective…………......7
D. Critical Assumptions……………………………………………………………………..7
E. Results Framework……………………………………………………………………….8
F. Intermediate Results……………………………………………………………………...9
G. Plan for Performance Monitoring ………………………………………………………11
1. Baseline Data and Targets……………………………………………………...11
2. Additional Data Planned for Collection………………………………………...11
3. Data Sources…………………………………………………………………....11
4. Data Collection methods and Frequencies……………………………………..11
5. Responsibilities for Monitoring Tasks…………………………………………12
6. Data Quality Assessments……………………………………………………...12
7. Data Organization and Maintenance …………………………………………..13
Annex 1: USAID/Tanzania FtF Results Framework………………………………………………...14
Annex 2: USAID/iAGRI Result Framework……………………………...…………………..…......15
Annex 3: USAID/iAGRI Focused Indicators…………………………………………………….....16
Annex 4: Performance Indicator Summary Table …………………………………………………...18
Annex 5: Performance Indicator Reference Sheets……………………………………………….....31
Annex 6: PMP Management Task Schedule……………………………………………………...…47
Annex 7: PMP Indicator Performance Tracking Table………………………………………….......48
Annex 8: Sample USAID/iAGRI Grant Report Form…………………………………………...….61

`
Results Framework Narrative
A: Background:
The Innovative Agricultural Research Initiative (iAGRI) project is being implemented by the
Ohio State University Consortium (OSUC), a partnership of leading U.S land-grant institutions
including Ohio State University, Michigan State University, Virginia Polytechnic Institute and
State University (Virginia Tech), University of Florida, Tuskegee University and Iowa State
University. USAID/ iAGRI is a five year project funded mainly by USAID/Tanzania. The
project started in 2011. The project is designed to strengthen the training and collaborative
research capacities of Sokoine University of Agriculture (SUA) and the Tanzanian National
Agricultural Research System (NARS), following the U.S. land-grant research and extension
model. The central goal of USAID/iAGRI is to develop human and institutional capacity in
agricultural teaching, research, training and outreach in order to serve the needs of the Tanzanian
public and private sectors. The project aims to strengthen institutional innovation to bring
training, research, extension into stronger and more functional relationship.
B: Linking the USAID/iAGRI Results Framework to Development Assistance Objective
The USAID/iAGRI objective of human and institutional capacity building supports the
USAID/Tanzania Feed the Future Initiative and the Government of Tanzania (GOT)
Comprehensive Africa Agricultural Development Programme Compact (CAADP) and
Agricultural Sector Development Support Programme (ADSP). The goals and objectives of FtF
align with the major objectives of the Compact and USAID. An important emphasis of both
CAADP and FtF is human and institutional capacity development to ensure the required
technical managerial, and intellectual leadership skills are in place to manage sector
interventions and guide agricultural sector growth. The iAGRI individual and institutional
capacity building, research development, policy research and dissemination activities under the
“Inclusive Agricultural Sector Growth “ objective will indirectly impact on the FtF goal of
“sustainably reduce global poverty and hunger.”
To achieve the Development Assistance Objective of Sustainably Reduce Global Poverty and
Hunger, USAID/iAGRI has four strategic objectives:
1. To establish a program of collaborative agricultural research with SUA and NARS;
2. To strengthen SUA’s technical and institutional capacity to provide long-term
undergraduate and graduate-level training in agriculture;
3. To strengthen research and extension at SUA; and
4. To promote cooperation between SUA, U.S universities and global south universities.
USAID/iAGRI will focus on achieving these objectives, which will enhance skills and improve
capabilities in farm productivity and management, as well as agribusiness and agro-
entrepreneurship that will lead to increased innovation, competitiveness and higher incomes.

`
In order to achieve the above four strategic objectives, iAGRI has been designed to implement
activities within three USAID/Tanzania FtF intermediate results (IR) components.
C: Components of the iAGRI Result Framework
The results framework of the iAGRI project has three agriculture intermediate results. Each IR is
measured through its own set of indicators (both standard and custom):
1) IR 1.0: Improved agricultural productivity
2) IR 3.0: Increased investments in agriculture and nutrition-related activities
3) IR 8.0: Improved enabling-policy environment for agriculture and nutrition
D: Critical Assumptions
The successes of this project will depend on the following critical assumptions:
1. Timely availability of funds from USAID/Tanzania;
2. Willingness of the management at SUA and the Ministry of Agriculture, Food Security,
and Cooperatives (MAFC) to cooperate with iAGRI in the project implementation;
3. Willingness of the management of SUA and MAFC to provide technical staff to iAGRI
for project planning, implementation and evaluation;
4. Macroeconomic policies and political climate that do not negatively impact on iAGRI
activities;
5. GOT will continue to provide budget support to SUA and NARS; and
6. No major disruption from internal or regional conflict.
iAGRI will be compromised if funding is not made available at adequate levels. Part of the
iAGRI budget is channeled through SUA. Willingness of SUA to hire qualified local staff is
critical to the success of the project.
A stable macroeconomic environment is required to provide the government with resources to
invest in development activities and public sector goods and services (such as health, education,
and research), to lower interest rates, and to encourage domestic and foreign investment that will
help the economy to grow.
Conflict in Tanzania or in the region will lead to distortions in markets. Conflict also results in
higher prices as risk factors are added to traders’ costs. Potential investors, domestic and foreign,
are reluctant to invest if conflict is an issue in a country or region.
E: Results Framework
Three higher-level intermediate results (IRs) and seven lower-level IRs will contribute to
achieving the “Inclusive Agricultural Sector Growth” objective. These are shown in the Results

`
Framework in Annex 2. In order to achieve “Inclusive Agricultural Sector growth”, iAGRI will
focus on three inter-related areas delineated by the following IRs:
IR 1.0: Increased Agricultural Productivity. Increasing productivity at the producer level is a
primary objective of inclusive agriculture sector growth objective for the basic reason that
without an increase in agriculture productivity there is little likelihood of increased food security,
improved nutritional status, or expansion of markets and trade. IR 1.0 is the keystone around
which the USAID/Tanzania Economic Growth program is structured. The IR will focus on new
knowledge, sustainable approaches, and increased innovation through improved agricultural
research and more effective institutions.
IR 3.0: Increased Investment in Agriculture and Nutrition Related Activities. These
investments will take place by improving productive linkages and collaboration between SUA
and other research institutions, including private sector companies and universities that conduct
problem-solving agricultural research of relevance to small farmers and agribusinesses. The
project will strengthen the Agricultural Development Fund mechanism for funding agriculture,
food and nutrition research that is complementary to the research funding through SUA from
public, private, bilateral and multilateral sources.
IR 8.0: Improved Enabling-Policy Environment for Agriculture and Nutrition: These
improvements will be brought about through research and analysis, dissemination and dialogue
on policies and advocacy to provide empirical information on policies and regulatory issues that
impact agriculture and nutrition.
Seven lower-level results will have to be achieved in order to realize the overall agriculture
sector objective of iAGRI.
F: Intermediate Results:
Intermediate Results 1.1: Capacity for Agricultural and Nutrition Research Strengthened. This IR will increase productivity by supplying the knowledge base for solutions, use of
sustainable approaches, adoption of improved technologies, increased use of inputs, increased
participation of the private sector and improved policy environment. Enhanced productivity and
output of quality products will result from demand-driven, market-led agricultural production
that focuses on those opportunities that generate income from production of agricultural
production and food products that have effective demand in Tanzania, the region, and global
markets.
IR1.2: New Technologies and Management Practices Introduced. This IR will increase the
development and dissemination of production technologies and improved management practices
to increase agricultural productivity. It will lead to increased availability, use and adoption of
improved technologies, including improved management practices. Farmers will have increased
yields without necessarily increasing area under cultivation. As farmers realize the potential for

`
increased incomes/profits from using cost effective technologies, they will shift out of
subsistence agriculture, raising the rate of transformation of Tanzania’s agricultural economy.
Sub IR 1.2.1: Improve Capacity to Address Climate Change. While increased agricultural
productivity is an important objective, it should not be achieved at the expense of the natural
resource base. This IR will ensure that productivity increases are achieved without undermining
the natural resource base through scientific contributions to understanding climate change and
how climate change affects agricultural productivity, as well as how farmers can adapt resiliently
to climate change. This will be achieved by providing science and knowledge-based information
to mitigate carbon emissions and to respond to threats posed by climate change.
IR 3.1: Increased Participation of the Private Sector in Delivery of Services. Increased
productivity will require a private-sector demand-driven agriculture orientation. This IR will
increase private sector participation through fostering collaborative scientific linkages between
SUA, NARS and the agribusiness/private sector and by ensuring that the research agenda
addresses the information and technology needs of the private sector. These linkages will
complement and stimulate private sector research on high value commodities (horticulture),
including those with potential for increased exports.
IR 3.2: Increased Capacity of Women to Participate in Agriculture and Nutrition. This IR
will ensure that women enjoy equal access to all iAGRI services, training opportunities,
technologies and research grants. This will result in increased ability of women to use and adopt
new practices, technologies, and information and to participate in markets. Increasing economic
opportunities for women will bring rapid agricultural productivity increases and will bring
alleviate poverty improve nutrition. Research on women’s nutritional status is expected to
improve women’s productivity, linking two strategic objectives of FtF.
IR 3.3: Enhanced Knowledge and External Ideas gained through Study Tours. This IR will
facilitate study tours and exchange programmes to include teaching or other administrative staff
from a participating institution who travel to an American University or center of education in
another country to receive specific training or exposure. The training will enhance the
participants institution to either improve instructional services, improve research and extension
capacity or to improve administrative function of the institution.
IR 8.1: Improved Capacity to Conduct Research and Analysis. This IR will strengthen the
capacity of Tanzanian research organizations to address policy and regulatory constraints that
inhibit producers from increasing agricultural productivity. Researchers will identify and
analyze policy solutions that are conducive to private sector participation, increased competition,
expansion of value-added and processing of new nutritious products and adherence to
international grades and standards. When research results are fully implemented, farmers will be
able to purchase improved inputs such as seed varieties appropriate to their agro-ecological

`
needs. Farmers will have higher returns and lowered costs of production as a result of better
policies governing inputs and pricing, land use policy and planning, and exports. Producers will
have more surplus for the market and will have more disposable income to buy nutritious foods.
IR 8.2: Public/Private Sector Dialogue on Policy Issues Increased. Through conferences,
workshops, seminars and briefings to communicate research findings and provide a forum for
open discussion among researchers and other professionals, university academicians, policy
analysts, policy advisors, policy makers and representatives of farmers, manufacturers, traders
and other stakeholders. Research findings will be published in proceedings, working papers,
professional journals and popular media to assure wide dissemination. Publication in these
venues will promote policy dialogue and advocacy among producers, consumers, civil society
organizations, private sector and policy makers that will contribute to a more inclusive policy
formulation process in Tanzania.
G:Plan for Performance Monitoring
The USAID/iAGRI results framework is a planning, communication, and management tool that
conveys the development hypothesis implicit in the project’s strategy and the cause-effect
relationship between Intermediate Results (IR), sub IRs and the project’s objective. The iAGRI
Results Framework represents graphically what we expect to deliver to USAID/Tanzania and to
the Tanzanian people by the end of the project.
Corresponding to the iAGRI Results Framework, FtF standard indicators and custom/project-
level indicators have been developed. We selected and designed indicators that directly measure
the specific results areas, and that align with the reporting requirements in the iAGRI
Cooperative Agreement and USAID/Tanzania FtF, CAADP, ASDP and National Nutrition
Strategy priorities and reporting requirements.
1. Baseline Data and Targets
The iAGRI project will establish baseline data against which project performance will be
compared. Beginning with a base year in FY 2010, iAGRI will establish FY 2011 as the first
year and make sure that each performance indicator is associated with a baseline value and a
series of annual target values. Target setting involved PMU team members. Annex 4 presents
the approximate baseline and target values for the indicators for the duration of the project.
2. Additional Data Planned for Collection
The iAGRI project will conduct an assessment of the needs for human institutional capacity
strengthening, long term training and collaborative research at SUA, the NARS and the
extension. A workshop of food-system stakeholders will set priorities for human and institutional
capacity development (HICD).

`
3. Data Sources
Data will come mainly from primary data sources. Some data will be obtained from iAGRI team
members while others will be obtained from partners and competitive grants recipients. Specific
data sources are comprehensively documented in the Performance Indicator Reference Sheets for
each indicator in Annex 5.
4. Data Collection Methods and Frequencies
Data collection will be accomplished through site visits, interviews, and review of records of
partners, competitive grant recipients, and PMU records. The local M&E Specialist will
complete institutional monitoring forms which are designed to consolidate indicator data on a
quarterly, semi annual or annual basis. Collaborative grant recipients will be required to
complete surveys of their outreach and extension activities relevant to the research and
dissemination of technologies and management practices, as well as documenting the numbers of
trainees by gender and other relevant categories. Project-level data on major indicators, such as
the number of individuals who have received USG short-term agricultural sector productivity
training, will be maintained using counts of participants/trainees/beneficiaries, their sex and new/
continuing beneficiary status each time an organized project activity is implemented.
The following data collection protocol will be applied:
As part of the registration process for each intervention, such as a training event, all
participants will provide personal identification data (name, title, organization, contact
information, region/zone, district, village/ward, sex and whether they are new or
continuing iAGRI project beneficiaries).
Field notes and activity reports will supplement these methods and provide for triangulation to
better interpret the significance and quality of the results achieved. Data summaries will include
tabulation of disaggregated data and graphs and diagrams for visual communications in reports
and presentations.
5. Responsibilities for Monitoring Tasks
Data collection will be supervised and coordinated by the project’s local M&E Specialist assisted
by experts from iAGRI partner institution, Virginia Tech. Project staff will be responsible for the
collection of data on an on-going basis and transferring that data to the PMU for tabulation,
analysis, assessment, and report preparation. Responsibilities for collaborative grants issued
through the PMU will be assumed through active and attentive collaboration between the local
M& E Specialist, and the M&E/Gender Advisor. Ultimate responsibility for timely data
collection, control and quality will be assumed by the COP. The M&E Specialist and
M&E/Gender Advisor will be responsible for verification and data collection procedures as well
as for providing overall guidance in data presentation and analysis.
6. Data Quality Assessment

`
To ensure that data and data sources related to the assessment of program performance are
objective and reliable, the USAID/iAGRI Project Management Unit (PMU) and TMG-ME will
develop and implement a data-quality control strategy. The local M&E Specialist, M&E/Gender
Advisor and COP will conduct site visits and review all reports, institutional records, and
monitoring forms. In addition, the M&E Specialist and the M&E/Gender Advisor will provide
periodic training to partners on proper data collection. Routine issues to be flagged include the
record-keeping practices of partner institutions and standard understanding of indicator
definitions and metrics. The initial data-quality assessment will occur in December 2011 and as
needed after that to ensure data quality. This study will analyze data quality based on its validity,
accuracy, reliability and appropriateness and will provide practical recommendations to improve
deficient processes.
7. Data Organization and Maintenance
The local M&E Specialist and M&E/Gender Advisor, along with the other project staff members
are responsible for the collection of USAID/iAGRI project-level data and the analysis and
aggregation of results into the PMP Indicator Performance Tracking Table (IPTT). The IPTT is
a performance management tool that assists not only in tracking data for the selected indicators
but also has provision for analyzing their performance on a quarterly, semi-annual and,
ultimately, an annual basis. This format will also be used to report the project data to USAID in
its on-line system at the end of each quarter. A template for this table is found in Annex 7.

`
Annex 1: USAID Tanzania FtF Results Framework:
First level objectives
Second level objectives linkages integrated nutrition flagship program
Value chain focus nutrition
Goal: Sustainably Reduce Global Poverty & Hunger
Inclusive Agricultural Sector Growth
Improved Nutritional Status (esp. of women
and children <5)
IR-1
Improved Agricultural Productivity
IR-2
Expanding Markets &
Trade
IR-3
Increased Investment
in Agriculture & Nutrition
Related Activities
IR-8
Improved Enabling
Policy Environment
for both Agriculture &Nutrition
IR – 4 Increased
Resilience of Vulnerable
Communities and
Households
IR-5 Improved
Access to Diverse &
Quality Foods
IR-6 Improved Nutrition Related
Behaviors
IR-7 Improved Utilization
of Maternal & Child
Health and Nutrition Services

`
Annex 2: USAID/iAGRI Results Framework
Obj: Inclusive Agricultural Sector Growth
IR 1.0
Improved Agricultural
Productivity
IR 2.0
Expanding Markets and
Trade
IR 3.0
Increased Investment in
Agriculture & Nutrition
Related Activities
IR 8.0
Improved Enabling
Policy Environment for
both Agriculture &
Nutrition
IR 1.1
Capacity for Agriculture &
Nutrition Research
Strengthened
IR 8.2
Public/Private Sector
Dialogue on Policy Issues
Increased
IR 3.2
Increased Capacity of Women
to participate in Agriculture &
Nutrition
IR 3.1
Increased Participation of the
Private Sector in the Delivery
of Services
IR 8.1
Improved Capacity to
Conduct Policy Research &
Analysis
IR 1.2
New Technologies &
Management Practices
Introduced
IR 1.2.1
Improved Capacity to
Address Climate Change
Cross- Cutting Indicators: Gender, Climate Change, Public Private Partnerships (PPP) and Policy
IR 3.3
Enhanced Knowledge and
external ideas gained through
study tours

`
Annex 3
USAID/iAGRI Focused Indicators
Objective: Inclusive Agricultural Sector Growth
IR 1.0: Improved Agricultural Productivity
IR 1.1: Capacity for Agricultural and Nutrition Research Strengthened
Percent change in productivity of Feed -the-Future commodities ( USAID/iAGRI
Outcome Indicator) (1)
Percent change in net farm income of households producing Feed-the-Future
commodities (USAID/iAGRI Outcome Indicator) (2)
Number of individuals who have received USG supported short-term training on food
security (FtF Output Indicator) (3)
Number of individuals who have received USG supported long-term training on food
security (FtF Output Indicator) (4).
Number of students assessed for graduate-level English competency (USAID/iAGRI
Output Indicator) (5).
Number of students trained for graduate-level English competency (USAID/iAGRI
Output Indicator) (6).
Number of researchers trained for Randomized Control Trials (RCTS) USAID/iAGRI
Output Indicator) (7).
Number of Randomized Control Trials conducted by trained researchers (USAID/iAGRI
Output Indicator) (8).
Number of research projects conducted which focus specifically on gender
(USAID/iAGRI Output Indicator) (9).
Number of students making use of improved ICT in classroom instruction
(USAID/iAGRI Output Indicator) (10).
IR 1.2: New Technologies and Management Practices Introduced
Number of new technologies or management practices under research (FtF Output
Indicator) (11).
Number of new technologies or management practices under field testing (FTF Output
Indicator) (12).
Sub IR 1.2.1: Improve Capacity to Address Climate Change.
Number of research projects that address adaptation to climate change (USAID/iAGRI
Output Indicator) (13).
.IR 3.0: Increased Investment in Agriculture and Nutrition Related Activities.
IR 3.1: Increased Participation of the Private Sector in the Delivery of
Services.
Number of public-private partnerships formed as a result of FtF assistance (FtF Output
Indicator) (14).

`
IR 3.2: Increased Capacity of Women to Participate in Agriculture and
Nutrition
Percentage change in female secondary school students applying for admission to
agricultural and science degree programs at Sokoine University (USAID/iAGRI Outcome
Indicator) (15)
Number of actions supportive of gender mainstreaming at Sokoine University of
Agriculture ( USAID/iAGRI Outcome Indicator (16)
Number of young female students participating in women-to-women mentorship program
(USAID/iAGRI Output Indicator) (17)
Number of high school girls provided with career guidance and counseling program
(USAID/iAGRI Output) (18).
IR 3.3: Enhanced Knowledge and external ideas gained through study tours
Number of study tours completed as a result of FtF assistance (USAID/iAGRI Output)
(19).
IR 8.0: Improved Enabling Policy Environment for both Agriculture and
Nutrition.
IR 8.1: Improved Capacity to Conduct Policy Research and Analysis
Number of policy issues in agriculture, natural resources and environment, climate
change and nutrition researched and analyzed as a result of FtF assistance (
USAID/iAGRI Output Indicator) (10).
IR 8.2: Public/Private Sector Dialogue on Policy Issues Increased
Number of USG- supported policy dialogue events held that are related to improving the
enabling policy environment for agriculture and nutrition (USAID/iAGRI Output
Indicator) (21).

`
ANNEX 4: PERFORMANCE INDICATOR SUMMARY TABLE
Description Indicator Definition and
Unit of Measure
Da
ta S
ou
rce
Baseline
Da
ta c
oll
ecti
on
Met
ho
ds
an
d F
req
uen
cy
Dis
ag
gre
ga
tio
n
FY
2011
FY
2012
FY
2013
FY
2014
FY
2015
FY
2016 Comments
Year Value
Ta
rget
Act
ua
l
Ta
rget
Act
ua
l
Ta
rget
Act
ua
l
Ta
rget
Act
ua
l
Ta
rget
Act
ua
l
Ta
rget
Act
ua
l
Sustainably Reduce Global Poverty & Hunger
Goal Level Indicators
1
Prevalence of
Poverty: % of
people living on less
than $1.25/day
National Level data and Unified Baseline
Survey
Unified Baseline
Survey(UBS) 2011 0
UN MDG
database National
2
Prevalence of
underweight
children under 5
(weight for age:
below -2 SD) % of
underweight
children under 5
National and regional level data from DHS,
district and below data from UBS and IP
surveys
DHS and Unified
Baseline Survey 2011 0
DHS
Survey Sex

`
Description Indicator Definition and
Unit of Measure
Da
ta S
ou
rce
Baseline
Da
ta C
oll
ecti
on
Met
ho
ds
an
d
Fre
qu
ency
Dis
ag
gre
ga
tio
n
FY
2011
FY
2012
FY
2013
FY
2014
FY
2015
FY
2016
Comm
ents
Yea
r
Va
lue
Ta
rget
Act
ua
l
Ta
rget
Act
ua
l
Ta
rget
Act
ua
l
Ta
rget
Act
ua
l
Ta
rget
Act
ua
l
Ta
rget
Act
ua
l
Objective: Inclusive Agricultural Sector
I.R 1.0 Improved Agricultural Productivity
IR 1.1 Capacity for Agricultural and Nutrition Research Strengthened
Intermediate-level Indicators
1 Percent change in
productivity of
Feed-the-Future
commodities
(USAID/iAGRI
Outcome Indicator)
(1)
Definition: This outcome indicator is the percent change in farm-level
productivity of land as a result of use of innovation packages introduced
in pilot-study areas. Land productivity is annual production divided by
acreage. An innovation bundle is a set of chemical, biological, or
management changes. Well -defined technology bundles will be
identified by iAGRI-sponsored research teams prior to measuring the
baseline. Feed-the-Future commodities are maize, rice and horticulture.
Households producing at least one of the Feed-the-Future commodities
will be included in this indicator.
Project
records
2011 0 Project
data
FtT
comm
odities
0 0 10
%
10% 10% 10% 10%
2 Percent change in
net farm income of
households
producing FtF
commodities
(USAID/iAGRI
Outcome Indicator)
(2)
Definition: This outcome indicator is the change in net farm income of
households that adopt innovation packages introduced in pilot-study
areas. Net farm income is defined as the cash value of marketed surplus
plus the imputed value of home consumption minus cash costs of
production. Net income defined in this way is equivalent to “gross
margin.” An innovation bundle is a set of chemical, biological, or
management changes. Well-defined technology bundles will be identified
by iAGRI-sponsored research teams prior to measuring the baseline.
Feed-the-Future commodities are maize, rice and horticulture.
Households producing at least one of the Feed-the-Future commodities
will be included in this indicator.
Project
records
2011 0 Survey FtT
Comm
odities
and
gender
0 10
%
10% 10% 10% 10%

`
3 Number of
individuals who have
received USG
supported short-term
training on food
security (FtF Output
indicator) (3).
Definition: The numbers of individuals to whom significant knowledge
or skills have been imparted through formal or informal means, in
country and off shore trainings are included. This includes primary sector
producers who receive a variety of best practices in productivity, post-
harvest management, linking to markets, etc. It also includes rural
entrepreneurs, processors, managers and traders, researchers, extension
workers, policymakers, climate risk analysts, adaptation, mitigation, and
vulnerability assessments. Knowledge or skills gained through technical
assistance activities is included. Individuals attending more than one
training are counted as many times as they attend training.
Unit of measure: Number of people.
Participant
training
register
2011 0 Training
register,
quarterly
Sex 0 0 100 150 150 50 0
4 Number of
individuals who have
received USG
supported long-term
training on food
security (FtF Output
Indicator) (4).
Definition: The number of people who are currently enrolled in or
graduated in the current fiscal year from Master’s or PhD program or are
currently participating in or have completed in the current fiscal year a
long-term (degree-seeking) advancing training programs such as a
fellowship program or post-doctoral studies program. A person
completing on long term training program in the fiscal year and currently
participating in another long term training program should not be counted
twice. An example is a USDA Borlaug Fellow.
Unit of measure: Number of people.
Project
reports
2011 0 Project
reports,
annually
Project
reports
6 55 35 24 0 0
`
Description Indicator Definition and
Unit of Measure
Da
ta S
ou
rce
Baseline
Da
ta C
oll
ecti
on
Met
ho
ds
an
d
Fre
qu
ency
Dis
ag
gre
ga
tio
n
FY
2011
FY
2012
FY
2013
FY
2014
FY
2015
FY
2016
Comme
nts
Yea
r
Va
lue
Ta
rget
Act
ua
l
Ta
rget
Act
ua
l
Ta
rget
Act
ua
l
Ta
rget
Act
ua
l
Ta
rget
Act
ua
l
Ta
rget
Act
ua
l
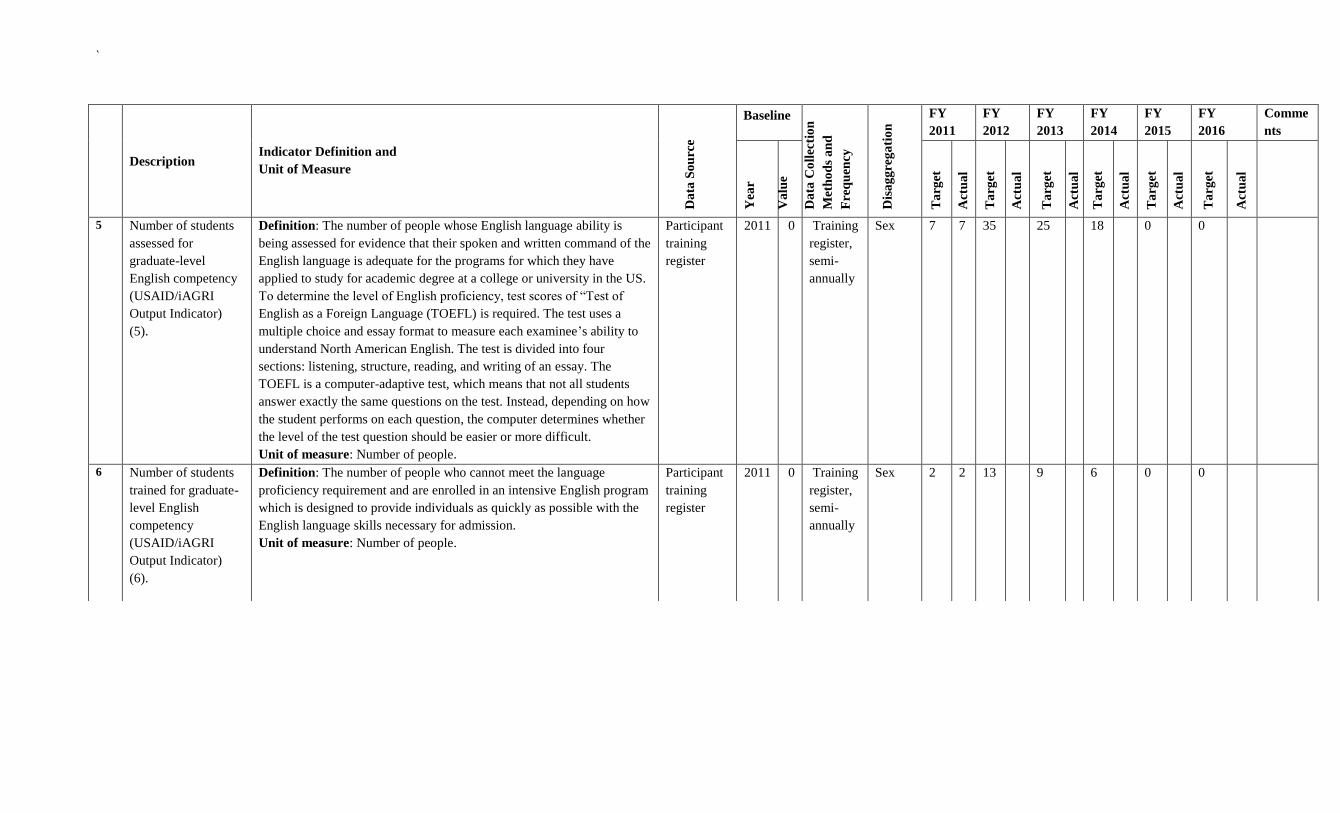
5 Number of students
assessed for
graduate-level
English competency
(USAID/iAGRI
Output Indicator)
(5).
Definition: The number of people whose English language ability is
being assessed for evidence that their spoken and written command of the
English language is adequate for the programs for which they have
applied to study for academic degree at a college or university in the US.
To determine the level of English proficiency, test scores of “Test of
English as a Foreign Language (TOEFL) is required. The test uses a
multiple choice and essay format to measure each examinee’s ability to
understand North American English. The test is divided into four
sections: listening, structure, reading, and writing of an essay. The
TOEFL is a computer-adaptive test, which means that not all students
answer exactly the same questions on the test. Instead, depending on how
the student performs on each question, the computer determines whether
the level of the test question should be easier or more difficult.
Unit of measure: Number of people.
Participant
training
register
2011 0 Training
register,
semi-
annually
Sex 7 7 35 25 18 0 0
6 Number of students
trained for graduate-
level English
competency
(USAID/iAGRI
Output Indicator)
(6).
Definition: The number of people who cannot meet the language
proficiency requirement and are enrolled in an intensive English program
which is designed to provide individuals as quickly as possible with the
English language skills necessary for admission.
Unit of measure: Number of people.
Participant
training
register
2011 0 Training
register,
semi-
annually
Sex 2 2 13 9 6 0 0

`
Description Indicator Definition and
Unit of Measure
Da
ta S
ou
rce
Baseline
Da
ta C
oll
ecti
on
Fre
qu
ency
Dis
ag
gre
ga
tio
n
FY
2011
FY
2012
FY
2013
FY
2014
FY
2015
FY
2016
Comme
nts
Yea
r
Va
lue
Ta
rget
Act
ua
l
Ta
rget
Act
ua
l
Ta
rget
Act
ua
l
Ta
rget
Act
ua
l
Ta
rget
Act
ua
l
Ta
rget
Act
ua
l
7 Number of
researchers trained
for Randomized
Control Trials
(RCTS)
USAID/iAGRI
Output Indicator)
(7).
Definition: The number of people to whom significant knowledge or skill
has been imparted through formal or informal means. In country and off
shore trainings are included. Knowledge or skills gained through technical
assistance activities is included. If the activity provided training to trainers,
and if the reporting unit can make a credible estimate of follow-on training
provided by those trainers, this estimate should be included. Individuals
attending more than one training are counted as many times as they attend
training.
Unit of measure: Number of people.
Participant
training
register
2011 0 Participan
t training
register,
semi-
annually
Sex 0 0 10 25 25 25 0
8 Number of
Randomized Control
Trials conducted by
trained researchers
(USAID/iAGRI
Output Indicator)
(8).
Definition: The number of Randomized Control Trials (RCT) hypothesis
testing completed using an iAGRI-provided methodology for randomized
controlled trials for the biological and social sciences. The methodology
will address trial design and how to conduct, analyze, interpret, and assess
the validity of results. The methodology will provide specifications for
preparing reports of trial findings, complete and transparent reporting,
reducing the influence of bias on results, and critical appraisal and
interpretation. The methodology will consist of a checklist and a work flow
diagram, along with description of steps. Only count those RCT conducted
during the reporting year.
Unit of measure: Number of RCTs.
Participant
training
register
2011 0 Participan
t training
register,
semi-
annually
Sex 0 0 10 20 20 20 0

`
Description Indicator Definition and
Unit of Measure
Da
ta S
ou
rce
Baseline
Da
ta C
oll
ecti
on
Met
ho
ds
an
d
Fre
qu
ency
Dis
ag
gre
ga
tio
n
FY
2011
FY
2012
FY
2013
FY
2014
FY
2015
FY
2016 Comments
Yea
r
Va
lue
Ta
rget
Act
ua
l
Ta
rget
Act
ua
l
Ta
rget
Act
ua
l
Ta
rget
Act
ua
l
Ta
rget
Act
ua
l
Ta
rget
Act
ua
l
9 Number of research
projects conducted
which focus
specifically on
gender
(USAID/iAGRI
Output Indicator)
(9).
Definition: The number of research projects on topical issues that affect
women. Research on gender and agricultural value chains to determine
where women are concentrated along the value chains and proposing ways
of increasing productivity and potentially upgrading them to higher value
segments is included. Research on labor-saving technologies to reduce
women’s labor burden in the agriculture sector should be included.
Similarly women’s technology adoption and practices assessed to identify
opportunities for increasing productivity adoption and diffusion among
women to expand their gains from agricultural productivity is included.
Unit of measure: Number of research project conducted.
Annual
report
2011 0 Project
annual
report,
annually
N/A 0 0 2 3 2 2 0
10 Number of students
making use of
improved ICT in
classroom instruction
(USAID/iAGRI
Output Indicator)
(10).
Definition: The number of people using improved information and
communications technology infrastructure and other types of equipment to
meet anticipated training needs. This will include computers and allied
equipment, communications equipment, laboratory equipment, and field
implements.
Unit of measure: Number of people.
Project
report
2011 0 Project
reports,
quarterly
N/A 0 0 750 1000 1250 1500 1750

`
Description Indicator Definition and
Unit of Measure
Da
ta S
ou
rce
Baselin
e
Da
ta C
oll
ecti
on
Met
ho
ds
an
d
Fre
qu
ency
Dis
ag
gre
ga
tio
n
FY
2011
FY
2012
FY
2013
FY
2014
FY
2015
FY
2016
Comme
nts
Yea
r
Va
lue
Ta
rget
Act
ua
l
Ta
rget
Act
ua
l
Ta
rget
Act
ua
l
Ta
rget
Act
ua
l
Ta
rget
Act
ua
l
Ta
rget
Act
ua
l
IR 1.2 New Technologies and Management Practices Introduced
Intermediate level indicators
11 Number of new
technologies or
management
practices under
research (FtF Output
Indicator) (11).
Definition :): Number of technologies, management practices, or products under
research/development. Technologies to be counted here are agriculture-related
technologies and innovations. Technologies may include improved management
practices such as sustainable land management. Significant improvements to existing
technologies should be counted; an improvement would by significant if it served a
new purpose or allowed a new class of users to employ it. Examples include a scaled-
down milk container that allows individuals to carry it easily, a new blend of
fertilizer for a particular soil, and tools modified to suit a particular management
practice. New technologies or management practices under research in a previous
year but not under research in the reporting year should not be included.
Technologies under research are as follows:
a) For biotech crop research: When technologies are under research, the
process is contained in a laboratory or greenhouse; once the possibility of
success is judged high enough, a permit is required to move to field testing.
The change of location from a contained laboratory or greenhouse to a
confined field and the receipt of a permit indicated that the research has
completed the “under research” stage.
b) For non-biotech crop research: When technologies are under research,
plant breeders work on developing new lines on research plots under
controlled conditions. All research should have a target, often expressed in
terms of traits to be combined into a specific cultivar or breed. When the
research achieves “proof of concept” (by accumulating technical
information and test results that indicate that the target is achievable), the
“under research” phase is completed. Note that for crops, much or all of
this phase might be conducted outdoors and in soil; these attributes do not
make this work “field testing.”
For non-crop research: “under research” signifies similarly research conducted under
ideal conditions to develop the product or process. USAID/iAGRI will target on-
station applied research themes applied to technologies and practices related to
sustainable cropping systems and food processing. The research activities of graduate
students trained through the project will also be included.
Unit of measure: Number of new technologies.
Annual
report
2011 0 Project
records,
annually
N/A 0 0 3 6 8 6 0

`
Description Indicator Definition and
Unit of Measure
Da
ta S
ou
rce
Baselin
e
Da
ta C
oll
ecti
on
Met
ho
ds
an
d
Fre
qu
ency
Dis
ag
gre
ga
tio
n
FY
2011
FY
2012
FY
2013
FY
2014
FY
2015
FY
2016
Comme
nts
Yea
r
Va
lue
Ta
rget
Act
ua
l
Ta
rget
Act
ua
l
Ta
rget
Act
ua
l
Ta
rget
Act
ua
l
Ta
rget
Act
ua
l
Ta
rget
Act
ua
l
12 Number of new
technologies or
management
practices under field
testing (FTF Output
Indicator) (12).
Definition: Number of technologies, management practices, or products under field
testing. Technologies to be counted here are agriculture-related technologies and
innovations, and may relate to any of the product at any point on the supply chain.
“Under field testing” means that research has moved from focused development to
broader testing and this testing is underway under conditions intended to duplicate
those encountered by potential users of the new technology. This might be in the
actual facilities (fields) of potential users, or it might be in a facility set up to
duplicate those conditions. More specifically:
a) For biotech crop research: Once a permit has been obtained and the
research moves to a confined field, the research is said to be “under field
testing.”
b) For non-biotech crop research: During this phase the development of the
product continues under end-user conditions in multi-location trails, which
might be conducted at a research station or on farmers’ fields or both. Note
that for crops, all of this phase would be conducted outdoors and in soil,
but this is not what makes this work “field testing.”
c) For non-crop research: “under field testing” signifies similarly research
conducted under user conditions to further test the product or process. In
the case of research to improve equipment, the endpoint of field testing
could be sales of equipment (when the tester is a commercial entity). In
other cases, it could be distribution of designs (when the tester is a
noncommercial entity) and also distribution of publications or other
information (on the force of the good results of field testing).
Significant improvements to existing technologies should also be counted; an
improvement would be significant if, among other reasons, it served a new purpose
or allowed a new class of users to employ it. Examples include a scaled-down milk
container that allows individuals to carry it easily, a new blend of fertilizer for a
particular soil, and tools modified to suit a particular management practice.
USAID/iAGRI will target on-farm applied research on improved technologies and
management practices. The applied research of graduate students will also be
included.
Unit of measure: Number of technologies.
Annual
report
2011 0 Project
records,
annually
N/A 0 0 2 4 6 5 0

`
Description Indicator Definition and
Unit of Measure
Da
ta S
ou
rce
Baselin
e
Da
ta C
oll
ecti
on
Met
ho
ds
an
d
Fre
qu
ency
Dis
ag
gre
ga
tio
n FY
2011
FY
2012
FY
2013
FY
2014
FY
2015
FY
2016
Comme
nts
Yea
r
Va
lue
Ta
rget
Act
ua
l
Ta
rget
Act
ua
l
Ta
rget
Act
ua
l
Ta
rget
Act
ua
l
Ta
rget
Act
ua
l
Ta
rget
Act
ua
l
I.R 1.2.1 Improve capacity to address climate change
Intermediate level indicators
13 Number of research
projects that address
adaptation to climate
change
(USAID/iAGRI
Output Indicator)
(13).
Definition: Technologies innovations and management practices that
address climate adaptation and mitigation. (Including carbon sequestration,
clean energy efficiency as related to agriculture). Increased use of climate
information for planning for disaster risk strategies in place, climate change
mitigation and energy efficiency, and natural resource management practices
that increases productivity and/or resiliency to climate change, IPM, ISFM,
and PHH as related to agriculture should be included as improved
technologies or management practices.
Unit of measure: Number of research projects.
Project
records
2011 0 Project
reports,
semi-
annually
Sex 0 0 1 5 5 3 0
I.R 3.0 Increased Investment in Agriculture and Nutrition Related Activities.
IR 3.1 Increased Participation of the Private Sector in the Delivery of Services
I ntermediate level Indicators
14 Number of public-
private partnerships
formed as a result of
FtF assistance (FtF
Output Indicator)
(14).
Definition: Number of public-private partnerships (PPP) in agriculture or
nutrition formed during the reporting year due to FtF intervention. A PPP is
considered formed when there is a clear agreement, written to work together
to achieve a common objective. There must be either a significant cash or in-
kind contribution to the effort by both a public and private entity.
USAID/contractors, for-profit enterprises, NGOs and CBOs and state-owned
enterprises are considered private. A public entity can be a national or sub-
national government or a donor-funded implementing partner. An
agricultural activity includes: supply of inputs, production methods,
agricultural processing or transportation. A nutrition activity includes any
activity focused on attempting to improve the nutritional content of
agricultural products provided to consumers, develop improved nutritional
products, increase support for nutrition service delivery, etc.Unit of
measure: Number of PPPs. Unit of Measure: Number of PPPs
Project
records
2011 Project
records,
semi-
annually
N/A 0 2 4 4 2 1

`
Description Indicator Definition and
Unit of Measure
Da
ta S
ou
rce
Baseline
Da
ta
Co
llec
tio
n
Met
ho
ds
an
d
Fre
qu
ency
Dis
ag
gre
ga
ti
on
FY
2011
FY
2012
FY
2013
FY
2014
FY
2015
FY
2016
Comment
s
Yea
r
Va
lue
Ta
rget
Act
ua
l
Ta
rget
Act
ua
l
Ta
rget
Act
ua
l
Ta
rget
Act
ua
l
Ta
rget
Act
ua
l
Ta
rget
Act
ua
l
IR 3.2 : Increasing the capacity of women to be involved in agriculture and nutrition
Intermediate level Indicators
15 Name of indicator Percent change in
female secondary-
school students
applying for
admission to
agriculture and
science degree
programs at Sokoine
University
(USAID/iAGRI
Outcome Indicator)
(15)
Definition: This outcome indicator measures the percentage change in the
number of female secondary students who apply for degree studies in
agricultural and science programs at Sokoine University. IAGRI-sponsored
activities aimed at increasing the interest of secondary-school girls in study
agriculture and science consist of presentations in secondary schools by
academic staff members of Sokoine University. Agricultural and science
degree programs include Agriculture General, Forestry, Home Economics
and Human Nutrition, Veterinary Medicine, Food Science and Technology,
Agricultural Engineering, Horticulture, Animal Science, Agronomy,
Agricultural Education and Extension, Agricultural Economics and
Agribusiness, Wildlife Management, Environmental Science Management,
Biotechnology and Laboratory Science, Aquaculture, and Rural
Development.
Unit of Measure: Completed applications by prospective female students
SUA
Admiss
ions
and
PMU
project
records
2011 0 counting Deg
ree
prog
ram
0 0 5 5 5 5 5
16 Number of actions
supportive of gender
mainstreaming at
Sokoine University
(USAID/iAGRI
Outcome Indicator)
(16)
Definition: Number of steps taken towards the realization of a particular
policy reform. Steps taken by stakeholders and partners to improve the
gender policy environment may include one or more of the following:
identification and analysis of the problem; elaboration of proposed
interventions to address the problem; dialogue, lobbying public discussions,
and validation of the problem; adoption through decree regulation,
legislation, or creation of an implementing team/unit; and implementation or
enforcement through concrete action. Results are annual and are not listed
cumulatively.
Unit of Measure: Number
iAGRI
project
files
2011 0 Counting N/A 0 4 4 4 4 4

`
17 Number of young
female students
participating in
women-to-women
mentorship
program
(USAID/iAGRI
Indicator) (17).
Definition: The number of young university female students currently
enrolled in a woman-to-woman mentorship program. Mentorship programs
may include: offering advice and support by introducing students to clubs
and organizations where they can make friends and pursue new and
continuing interests, providing information about courses in their major or
complimentary areas of study, acting as a sounding board and/ or working
through situations or issues that may arise, suggesting services that can
provide additional support or advice to assist with academics, career and
leadership development, or personal issues that may arise, accompanying
mentee to social and professional development activities organized for
mentees and mentors where students can enjoy and benefit from a diverse
community of women students pursuing a broad range of technological
programs of study, the mentor providing help to the mentee in finding
documentation that is related to her field, and Round Tables (including one
session showcasing local CEO in agriculture industry and one career session
with panel discussion featuring African women leaders in agriculture and
environment). A person completing a mentorship program in the fiscal year
and currently participating in another mentorship program should not be
counted twice.
Unit of measure: Number of female students in mentorship programs.
Project
records
2011 500 Project
records,
annually
N/A 0 0 50 150 450 350 250

`
Description Indicator Definition and
Unit of Measure
Da
ta S
ou
rce
Baseline
Da
ta C
oll
ecti
on
Met
ho
ds
an
d
Fre
qu
ency
Dis
ag
gre
ga
tio
n
FY
201
1
FY
2012
FY
2013
FY
2014
FY
2015
FY
2016
Comme
nts
Yea
r
Va
lue
Ta
rget
Act
ua
l
Ta
rget
Act
ua
l
Ta
rget
Act
ua
l
Ta
rget
Act
ua
l
Ta
rget
Act
ua
l
Ta
rget
Act
ua
l
18 Number of high
school girls
provided with
career guidance
and counseling
program
(USAID/iAGRI
Output) (18).
Definition: The number of high school girls being provided with career
guidance and counseling from partner high schools. The career guidance
program is to inform participants of career options in the agricultural
industry, the type of academic and occupational training needed to succeed
in the industry, and postsecondary opportunities that are associated with the
agriculture field. The program will provide teachers, administrators and
parents with information they can use to support students’ career exploration
and postsecondary education opportunities in the field of agriculture, a
career booklet which contains a list of degree programs in agriculture and
their cut off points.
Unit of measure: Number of high school girls.
Project
records
2011
500 Project
records,
quarterly
N/A 0 0 700 800 950 1000 700

`
Description Indicator Definition and
Unit of Measure
Da
ta S
ou
rce
Baselin
e
Da
ta C
oll
ecti
on
Met
ho
ds
an
d
Fre
qu
ency
Dis
ag
gre
ga
tio
n
FY
2011
FY
2012
FY
2013
FY
2014
FY
2015
FY
2016
Comme
nts
Yea
r
Va
lue
Ta
rget
Act
ua
l
Ta
rget
Act
ua
l
Ta
rget
Act
ua
l
Ta
rget
Act
ua
l
Ta
rget
Act
ua
l
Ta
rget
Act
ua
l
19 Number of study
tours completed as a
result of FtF
assistance
(USAID/iAGRI
Output) (19).
Definition: The numbers of individuals to whom significant knowledge or
skills have been imparted through formal or informal means, in-country and
off-shore trainings are included. This includes primary sector producers who
receive a variety of best practices in productivity, post-harvest management,
linking to markets, etc. It also includes rural entrepreneurs, processors,
managers and traders, researchers, extension workers, policymakers, climate
risk analysts, adaptation, mitigation, and vulnerability assessments.
Knowledge or skills gained through technical assistance activities is
included. Individuals attending more than one travel are counted as many
times as they attend training.
Unit of measure: Number of people.
Study tour
register
2011 0 Training
register,
quarterly
Sex 0 0 2 6 6 3 1

`
Description Indicator Definition and
Unit of Measure
Da
ta S
ou
rce
Baselin
e
Da
ta C
oll
ecti
on
Met
ho
ds
an
d
Fre
qu
ency
Dis
ag
gre
ga
tio
n FY
2011
FY
2012
FY
2013
FY
2014
FY
2015
FY
2016
Comme
nts
Yea
r
Va
lue
Ta
rget
Act
ua
l
Ta
rget
Act
ua
l
Ta
rget
Act
ua
l
Ta
rget
Act
ua
l
Ta
rget
Act
ua
l
Ta
rget
Act
ua
l
I.R 8.0 Improved Enabling Policy Environment for Agriculture and Nutrition
IR 8.1 Conduct Policy Research
Intermediate level Indicators
20 Number of policy
issues in agriculture,
natural resources and
environment, climate
change and nutrition
researched and
analyzed as a result
of FtF assistance (
USAID/iAGRI
Output Indicator)
(20).
Definition: The number of policies, regulations, in the areas of agricultural
resource, food market standards , nutrition, public investment, natural
resources or water management and climate change adaptation/mitigation as
it relates to agriculture that are researched and analyzed and generating
options for addressing cotemporary problems. Building of a data bank of
information that could be useful in agricultural policy analysis, formulation
and implementation should be included.
Unit Of measure: Number of policy issues.
Project
records
2011 0 Project
records,
semi-
annually
N/A 0 0 3 10 10 10 3
21 Number of USG-
supported policy
dialogue events held
that are related to
improving the
enabling policy
environment for
agriculture and
nutrition
(USAID/iAGRI
Output Indicator)
(21)
The number of events (including conferences, workshops, seminars, and
briefings) to communicate research findings and provide a forum for open
discussion among researchers and other professionals, university
academicians, policy analysts, policy advisors, policy makers, civil society
organizations and representatives of farmers, manufactures, traders and
other stakeholders. Publication of research works in proceedings, working
papers, professional journals and popular media should be included.
Strengthening of capacity building for policy research, analysis and
collaboration on research and exchange of information with institutions and
agencies with similar interests and engaged in similar work should be
included.
Unit of measure: Number of events/publications/papers and number of
people reached.
Project
reports
2011 0 Direct
counting
N/A
0 2 4 4 4 1

`
ANNEX 5: PERFROMANCE INDICATOR REFERENCE SHEET
PERFORMANCE INDICATOR REFERENCE SHEET
Name of Strategic Objective:
Name of Intermediate Result: IR 1.1: Capacity for Agricultural and Nutrition Research Strengthened
Name of indicator: Percent change in productivity of Feed-the-Future commodities (USAID/iAGRI Outcome
Indicator) (1)
Is this an annual Report Indicator: Yes to be reported in 2012-2016
DESCRIPTION
Precise Definition(s): This outcome indicator is the percent change in farm-level productivity of land as a result of use
of innovation packages introduced in pilot-study areas. Land productivity is annual production divided by acreage. An
innovation bundle is a set of chemical, biological, or management changes. Well -defined technology bundles will be
identified by iAGRI-sponsored research teams prior to measuring the baseline. Feed-the-Future commodities are maize,
rice and horticulture. Households producing at least one of the Feed-the-Future commodities will be included in this
indicator.
Unit of measure: Outputs will be measured on a kilogram basis, Land on acre basis
Disaggregated by: FtT commodities: maize, rice and horticulture
Justification/Management Utility: This indicator measures enhanced technology dissemination and management
practices.
PLAN FOR DATA ACQUISITION BY USAID
Data collection method: Project data
Data source: Project records
Method of data acquisition: Project records, survey or other applicable methods
Frequency and timing of data acquisition: Annually
Estimated cost of data acquisition: Costs are included in the existing contractor
Individuals(s) responsible at USAID: Kevin McCown
Individuals(s) responsible for providing data to USAID: Prof. David Kraybill
Location of data storage: USAID/iAGRI files, PMP data base
DATA QUALITY ISSUES
Date of Initial Data Quality Assessment: December 2011 ( as indicated in TMG/M&E calendar
Known Data Limitations and Significance (if any): None
Actions Taken or Planned to Address Data Limitations: N/A
Data of Future Data Quality Assessments: Annual December 2011
Procedures for Future Data Quality Assessments: site visits to villages/ participating farmers
PLAN FOR DATA ANALYSIS, REVIEW & REPORTING
Data Analysis: Data will be aggregated by FtF commodities
Presentation of Data: Assessment: Data will be presented in tabular and narrative forms
Review of Data: Data will be reviewed annually by PMU
Reporting of Data: Data will be reported to USAID on a annual basis
OTHER NOTES
Notes on baselines/Targets: Target setting will be done by PMU and partner institutions
Other notes:
PERFORMANCE INDICATOR VALUES
Year Target Actual Notes
2011 0 0
2012 10%
2013 10%
2014 10%
2015 10%
2016 10%
THE SHEET LAST UPDATED ON

`
PERFORMANCE INDICATOR REFERENCE SHEET
Name of Strategic Objective:
Name of Intermediate Result: IR 1.1: Capacity for Agricultural and Nutrition Research Strengthened
Name of indicator: Percent change in net farm income of households producing FtF commodities (USAID/iAGRI
Outcome Indicator) (2)
Is this an annual Report Indicator: Yes to be reported in 2012-2016
DESCRIPTION
Precise Definition(s): This outcome indicator is the change in net farm income of households that adopt innovation
packages introduced in pilot-study areas. Net farm income is defined as the cash value of marketed surplus plus the
imputed value of home consumption minus cash costs of production. Net income defined in this way is equivalent to
“gross margin.” An innovation bundle is a set of chemical, biological, or management changes. Well-defined
technology bundles will be identified by iAGRI-sponsored research teams prior to measuring the baseline. Feed-the-
Future commodities are maize, rice and horticulture. Households producing at least one of the Feed-the-Future
commodities will be included in this indicator.
Unit of measure: Actual and imputed incomes will be measured in Tanzanian shillings
Disaggregated by: FtT Commodities and gender
Justification/Management Utility: This indicator tracks increase income at the household level
PLAN FOR DATA ACQUISITION BY USAID
Data collection method: surveys, baselines
Data source: Implementing partners, PMU records
Method of data acquisition: price information from sales receipts or booking keeping records
Frequency and timing of data acquisition: Annual
Estimated cost of data acquisition: Cost included in the contractor budget
Individuals(s) responsible at USAID: Kevin McCown
Individuals(s) responsible for providing data to USAID: Prof. David Kraybill
Location of data storage: iAGRI PMU, researchers records
DATA QUALITY ISSUES
Date of Initial Data Quality Assessment: Known Data Limitations and Significance (if any): the isolation of a
technology from technology bundles or combination of practices is not always easy to discern.
Actions Taken or Planned to Address Data Limitations: Improve and standardize definition
Data of Future Data Quality Assessments: December 2012
Procedures for Future Data Quality Assessments: site visits, review of survey instrument
PLAN FOR DATA ANALYSIS, REVIEW & REPORTING
Data Analysis: Data will be disaggregated by commodity/research topics across USAID/iAGRI grant recipients
Presentation of Data: Assessment: Tabular and narrative forms
Review of Data: Data will be reviewed annually by PMU through activity reports and final reports
Reporting of Data: Annual
OTHER NOTES
Notes on baselines/Targets: Target setting will be done by PMU and partner institutions
Other notes:
PERFORMANCE INDICATOR VALUES
Year Target Actual Notes
2011 0 0
2012 10%
2013 10%
2014 10%
2015 10%
2016 10%
THE SHEET LAST UPDATED ON

`
PERFORMANCE INDICATOR REFERENCE SHEET
Name of Strategic Objective: Inclusive Agricultural Sector Growth
Name of Intermediate Result: IR 1.1: Capacity for Agricultural and Nutrition Research Strengthened
Name of indicator: Number of individuals who have received USG supported short-term training on food
security (FtF Output indicator) (3).
Is this an annual Report Indicator: Yes, to be reported in 2012-2016
DESCRIPTION
Precise Definition(s): The numbers of individuals to whom significant knowledge or skills have been imparted
through formal or informal means, in country and off shore trainings are included. This includes primary sector
producers who receive a variety of best practices in productivity, post-harvest management, linking to markets, etc. It
also includes rural entrepreneurs, processors, managers and traders, researchers, extension workers, policymakers,
climate risk analysts, adaptation, mitigation, and vulnerability assessments. Knowledge or skills gained through
technical assistance activities is included. Individuals attending more than one training are counted as many times as
they attend training.
Unit of measure: Number of people
.Method of calculation: N/A
Disaggregated by: Sex; Type of person: Farmers/CBOs/NGOs, Faculty and administration, processors,
entrepreneurs
Justification/Management Utility: Measures enhanced human capacity or technology and management
implementation as well as policy formulation and implementation which are key to transformational development.
PLAN FOR DATA ACQUISITION BY USAID
Data collection method: Direct counting of participants who attend the training
Data source: Training register
Method of data acquisition: Through quarterly and annual project reports
Frequency and timing of data acquisition: Quarterly and annually
Estimated cost of data acquisition: Costs are included in the existing contract
Individuals(s) responsible at USAID: Kevin McCown
Individuals(s) responsible for providing data to USAID: Prof. David Kraybill
Location of data storage: USAID/iAGRI files, iAGRI Public Folder PMP data file
DATA QUALITY ISSUES
Date of Initial Data Quality Assessment: December 2011(as indicated in calendar of TMG/M&E)
Known Data Limitations and Significance (if any): No
Actions Taken or Planned to Address Data limitations: N/A
Data of Future Data Quality Assessments: Annual December 2012
Procedures for Future Data Quality Assessments: site visits to partner departments/recipients and review records
PLAN FOR DATA ANALYSIS, REVIEW & REPORTING
Data Analysis: Data will be aggregated across grants and PMU-based training programs on a quarterly basis
Presentation of data: Data will be presented in tabular and narrative forms. Other illustrations( photographs)
Review of Data: Data will be reviewed by Project Management Unit (PMU) quarterly and annually through
quarterly and annual reports
Reporting of Data: Data will be reported to USAID on Quarterly and Annual basis
OTHER NOTES
Notes on baselines/Targets: Target setting was done by M&E Advisor in consultation with PMU team and partner
institutions
Other notes:
PERFORMANCE INDICATOR VALUES
Year Target Actual Notes
2011 0
2012 100
2013 150
2014 50
2015 50
2016 0
THE SHEET LAST UPDATED ON

`
PERFORMANCE INDICATOR REFERENCE SHEET
Name of Strategic Objective: Inclusive Agricultural Sector Growth
Name of Intermediate Result: IR 1.1: Capacity for Agricultural and Nutrition Research Strengthened
Name of indicator: Number of individuals who have received USG supported long-term training on food
security (FtF Output Indicator) (4).
Is this an annual Report Indicator: Yes to be reported in 2012-2016
DESCRIPTION
Precise Definition(s): The number of people who are currently enrolled in or graduated in the current fiscal year
from Master’s or PhD program or are currently participating in or have completed in the current fiscal year a long-
term (degree-seeking) advancing training programs such as a fellowship program or post-doctoral studies program. A
person completing on long term training program in the fiscal year and currently participating in another long term
training program should not be counted twice. An example is a USDA Borlaug Fellow.
Unit of measure: Number of people.
Disaggregated: Sex
Justification/Management Utility: Measures enhanced human capacity for technical and management capacities as
well as policy formulation which is key to transformational development.
PLAN FOR DATA ACQUISITION BY USAID
Data collection method: Direct counting of participants who attend the training
Data source: Training Register
Method of data acquisition: Through Quarterly & annual project reports
Frequency and timing of data acquisition: Quarterly and Annually
Estimated cost of data acquisition: Costs are included in the existing contractor
Individuals(s) responsible at USAID: Kevin McCown
Individuals(s) responsible for providing data to USAID: Prof. David Kraybill
Location of data storage: USAID/iAGRI files, iAGRI Public Folder PMP data file
DATA QUALITY ISSUES
Date of Initial Data Quality Assessment: Annual December 2011(as indicated in the calendar of TMG/M&E)
Known Data Limitations and Significance (if any):NO
Actions Taken or Planned to Address Data Limitations: None planned at this time.
Data of Future Data Quality Assessments: Annual December 2012
Procedures for Future Data Quality Assessments: conduct site visits, review reports and institutional records
PLAN FOR DATA ANALYSIS, REVIEW & REPORTING
Data Analysis: Data will be aggregated across partner institutions by gender
Presentation of Data: Data will be presented in tabular and narrative forms. Other illustrations( photographs)
Review of Data: Data will be reviewed by Project Management Unit (PMU) quarterly and annually through quarterly
and annual reports
Reporting of Data: Data will be reported to USAID on Quarterly and Annual basis
OTHER NOTES
Notes on baselines/Targets: Target setting was done by M&E Advisor in consultation with PMU team and partner
institutions
Other notes:
PERFORMANCE INDICATOR VALUES
Year Target Actual Notes
2011 7 6
2012 55
2013 35
2014 24
2015 0
2016 0
THE SHEET LAST UPDATED ON

`
PERFORMANCE INDICATOR REFERENCE SHEET
Name of Strategic Objective: Inclusive Agricultural Sector Growth
Name of Intermediate Result: IR 1.1: Capacity for Agricultural and Nutrition Research Strengthened
Name of indicator: Number of students assessed for graduate-level English competency (USAID/iAGRI
Output Indicator) (5)
Is this an annual Report Indicator: Yes to be reported in 2012-2016
DESCRIPTION
Precise Definition(s): The number of people whose English language ability is being assessed for evidence that
their spoken and written command of the English language is adequate for the programs for which they have applied
to study for academic degree at a college or university in the US. To determine the level of English proficiency, test
scores of “Test of English as a Foreign Language (TOEFL) is required. The test uses a multiple choice and essay
format to measure each examinee’s ability to understand North American English. The test is divided into four
sections: listening, structure, reading, and writing of an essay. The TOEFL is a computer-adaptive test, which means
that not all students answer exactly the same questions on the test. Instead, depending on how the student performs
on each question, the computer determines whether the level of the test question should be easier or more difficult.
Unit of measure: Number of people.
Disaggregated by: Sex
Justification/Management Utility: This indicator measures the degree to which institutions provide enhanced
educational services.
PLAN FOR DATA ACQUISITION BY USAID
Data collection method: Direct counting of participants who attend the training
Data source: Participant Register
Method of data acquisition: Through Quarterly & annual project reports
Frequency and timing of data acquisition: Quarterly and annually
Estimated cost of data acquisition: Costs are included in the existing contractor
Individuals(s) responsible at USAID: Kevin McCown
Individuals(s) responsible for providing data to USAID: Prof. David Kraybill
Location of data storage: USAID/iAGRI files, iAGRI Public Folder PMP data file
DATA QUALITY ISSUES
Date of Initial Data Quality Assessment: Annual December 2011 (as indicated in the calendar of TMG/M&E)
Known Data Limitations and Significance (if any): None
Actions Taken or Planned to Address Data Limitations: None planned at this time.
Data of Future Data Quality Assessments: Annual December 2012
Procedures for Future Data Quality Assessments: Classroom/ site visits, review reports and institutional records.
PLAN FOR DATA ANALYSIS, REVIEW & REPORTING
Data Analysis: Data will be aggregated across partner institutions by gender
Presentation of Data: Data will be presented in tabular and narrative forms. Other illustrations( photographs)
Review of Data: Data will be reviewed by Project Management Unit (PMU) quarterly and annually through
quarterly and annual reports
Reporting of Data: Data will be reported to USAID on Quarterly and Annual basis
OTHER NOTES
Notes on baselines/Targets: Target setting was done by M&E Advisor in consultation with PMU team and partner
institutions
Other notes:
PERFORMANCE INDICATOR VALUES
Year Target Actual Notes
2011 7 6
2012 35
2013 5
2014 18
2015 0
2016 0
THE SHEET LAST UPDATED ON
PERFORMANCE INDICATOR REFERENCE SHEET

`
Name of Strategic Objective: Inclusive Agricultural Sector Growth
Name of Intermediate Result: IR 1.1: Capacity for Agricultural and Nutrition Research Strengthened
Name of indicator: Number of students trained for graduate-level English competency (USAID/iAGRI
Output Indicator) (6)
Is this an annual Report Indicator: Yes to be reported in 2012-2016
DESCRIPTION
Precise Definitions: The number of people who cannot meet the language proficiency requirement and are enrolled
in an intensive English program which is designed to provide individuals as quickly as possible with the English
language skills necessary for admission.
Unit of measure: Number of people.
Disaggregated by: Sex
Justification/Management Utility: This indicator measures access to improved graduate-level English competency
necessary to enhance spoken and written English language.
PLAN FOR DATA ACQUISITION BY USAID
Data collection method: Direct counting of participants who attend the training
Data source: Participant Register
Method of data acquisition: Through Quarterly & annual project reports
Frequency and timing of data acquisition: Quarterly and annually
Estimated cost of data acquisition: Costs are included in the existing contractor
Individuals(s) responsible at USAID: Kevin McCown
Individuals(s) responsible for providing data to USAID: Prof. David Kraybill
Location of data storage: USAID/iAGRI files, iAGRI Public Folder PMP data file
DATA QUALITY ISSUES
Date of Initial Data Quality Assessment: Annual December 2011 (as indicated in the calendar of TMG/M&E).
Known Data Limitations and Significance (if any): None
Actions Taken or Planned to Address Data Limitations: None planned at this time.
Data of Future Data Quality Assessments: Annual December 2012
Procedures for Future Data Quality Assessments: Conduct site visits, review reports and PMU records.
PLAN FOR DATA ANALYSIS, REVIEW & REPORTING
Data Analysis: Data will be aggregated across SUA and NARS institutions by gender
Presentation of Data: Data will be presented in tabular and narrative forms. Other illustrations( photographs)
Review of Data: Data will be reviewed by Project Management Unit (PMU) quarterly and annually through
quarterly and annual reports
Reporting of Data: Data will be reported to USAID on Quarterly and Annual basis
OTHER NOTES
Notes on baselines/Targets:: Target setting was done by M&E Advisor in consultation with PMU team and
partner institutions
Other notes:
PERFORMANCE INDICATOR VALUES
Year Target Actual Notes
2011 2 2
2012 13
2013 9
2014 6
2015 0
2016 0
THE SHEET LAST UPDATED ON

`
PERFORMANCE INDICATOR REFERENCE SHEET
Name of Strategic Objective: Inclusive Agricultural Sector Growth
Name of Intermediate Result: IR 1.1: Capacity for Agricultural and Nutrition Research Strengthened
Name of indicator: Number of researchers trained for Randomized Control Trials (RCTS) USAID/iAGRI Output
Indicator) (7)
Is this an annual Report Indicator: Yes to be reported in 2012-2016
DESCRIPTION
Precise Definition(s): The number of Randomized Control Trials (RCT) hypothesis testing completed using an
iAGRI-provided methodology for randomized controlled trials for the biological and social sciences. The methodology
will address trial design and how to conduct, analyze, interpret, and assess the validity of results. The methodology will
provide specifications for preparing reports of trial findings, complete and transparent reporting, reducing the influence
of bias on results, and critical appraisal and interpretation. The methodology will consist of a checklist and a work flow
diagram, along with description of steps. Only count those RCT conducted during the reporting year.
Unit of measure: Number of RCTs.
Disaggregated by: Sex
Justification/Management Utility: This indicator measures the degree to which institutions are more capable of
delivering enhanced training in Randomized Control Trials(RCTs)
PLAN FOR DATA ACQUISITION BY USAID
Data collection method: Direct counting of participants who attend the training
Data source: Participant Register
Method of data acquisition: Through Quarterly & annual project reports
Frequency and timing of data acquisition: Quarterly and annually
Estimated cost of data acquisition: Costs are included in the existing contractor
Individuals(s) responsible at USAID: Kevin McCown
Individuals(s) responsible for providing data to USAID: Prof. David Kraybill
Location of data storage: USAID/iAGRI files, iAGRI Public Folder PMP data file
DATA QUALITY ISSUES
Date of Initial Data Quality Assessment: Annual December 2011(as indicated in the calendar of TMG/M&E
Known Data Limitations and Significance (if any): None
Actions Taken or Planned to Address Data Limitations: None planned at this time.
Data of Future Data Quality Assessments: Annual December 2012
Procedures for Future Data Quality Assessments: Conduct site visits, review reports and PMU records.
PLAN FOR DATA ANALYSIS, REVIEW & REPORTING
Data Analysis: Data will be aggregated across SUA and NARS institutions by gender
Presentation of Data: Data will be presented in tabular and narrative forms. Other illustrations( photographs)
Review of Data: Data will be reviewed by Project Management Unit((PMU)quarterly and annually through quarterly
and annual reports
Reporting of Data: Data will be reported to USAID on Quarterly and Annual basis
OTHER NOTES
Notes on baselines/Targets: Target setting was done by M&E Advisor in consultation with PMU team and partner
institutions
Other notes:
PERFORMANCE INDICATOR VALUES
Year Target Actual Notes
2011 0 0
2012 10
2013 25
2014 25
2015 25
2016 0
THE SHEET LAST UPDATED ON
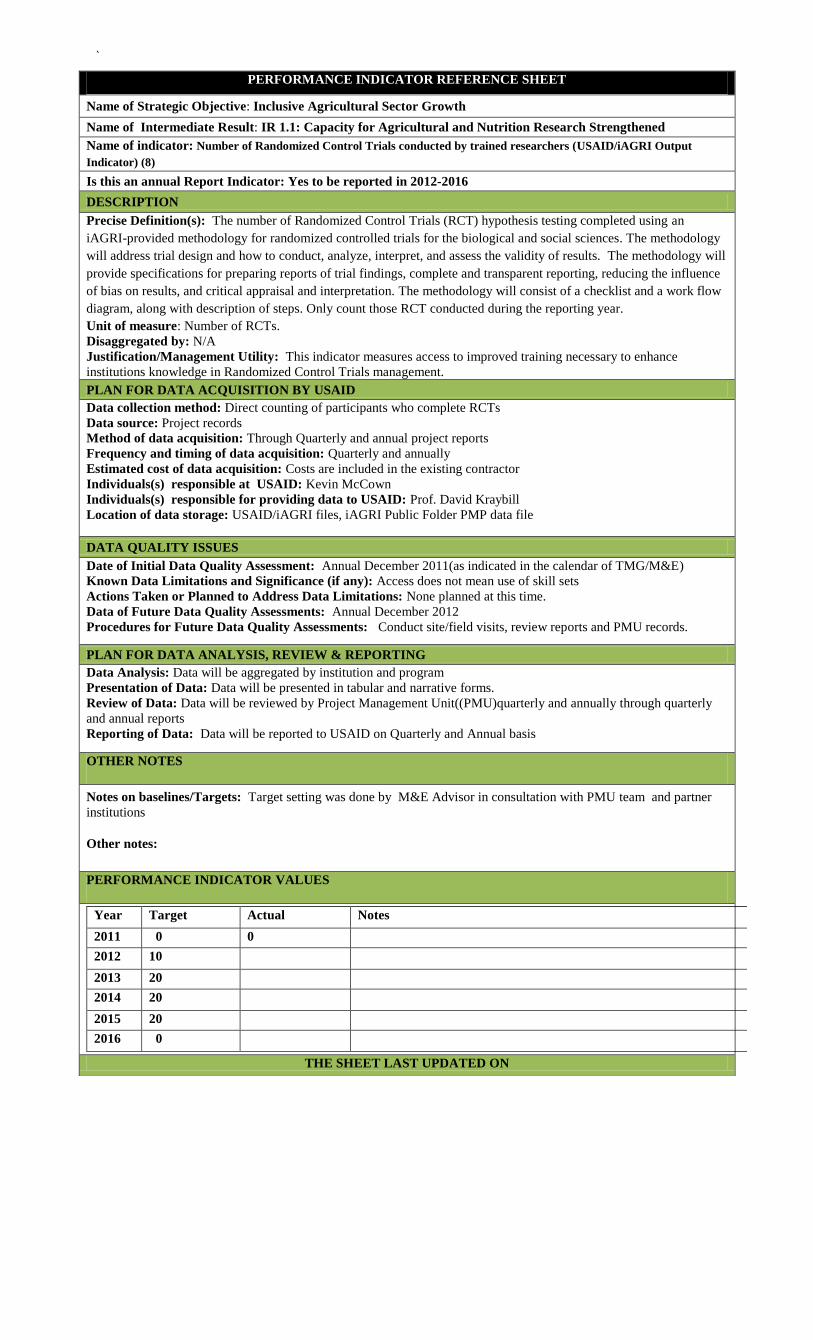
`
PERFORMANCE INDICATOR REFERENCE SHEET
Name of Strategic Objective: Inclusive Agricultural Sector Growth
Name of Intermediate Result: IR 1.1: Capacity for Agricultural and Nutrition Research Strengthened
Name of indicator: Number of Randomized Control Trials conducted by trained researchers (USAID/iAGRI Output
Indicator) (8)
Is this an annual Report Indicator: Yes to be reported in 2012-2016
DESCRIPTION
Precise Definition(s): The number of Randomized Control Trials (RCT) hypothesis testing completed using an
iAGRI-provided methodology for randomized controlled trials for the biological and social sciences. The methodology
will address trial design and how to conduct, analyze, interpret, and assess the validity of results. The methodology will
provide specifications for preparing reports of trial findings, complete and transparent reporting, reducing the influence
of bias on results, and critical appraisal and interpretation. The methodology will consist of a checklist and a work flow
diagram, along with description of steps. Only count those RCT conducted during the reporting year.
Unit of measure: Number of RCTs.
Disaggregated by: N/A
Justification/Management Utility: This indicator measures access to improved training necessary to enhance
institutions knowledge in Randomized Control Trials management.
PLAN FOR DATA ACQUISITION BY USAID
Data collection method: Direct counting of participants who complete RCTs
Data source: Project records
Method of data acquisition: Through Quarterly and annual project reports
Frequency and timing of data acquisition: Quarterly and annually
Estimated cost of data acquisition: Costs are included in the existing contractor
Individuals(s) responsible at USAID: Kevin McCown
Individuals(s) responsible for providing data to USAID: Prof. David Kraybill
Location of data storage: USAID/iAGRI files, iAGRI Public Folder PMP data file
DATA QUALITY ISSUES
Date of Initial Data Quality Assessment: Annual December 2011(as indicated in the calendar of TMG/M&E)
Known Data Limitations and Significance (if any): Access does not mean use of skill sets
Actions Taken or Planned to Address Data Limitations: None planned at this time.
Data of Future Data Quality Assessments: Annual December 2012
Procedures for Future Data Quality Assessments: Conduct site/field visits, review reports and PMU records.
PLAN FOR DATA ANALYSIS, REVIEW & REPORTING
Data Analysis: Data will be aggregated by institution and program
Presentation of Data: Data will be presented in tabular and narrative forms.
Review of Data: Data will be reviewed by Project Management Unit((PMU)quarterly and annually through quarterly
and annual reports
Reporting of Data: Data will be reported to USAID on Quarterly and Annual basis
OTHER NOTES
Notes on baselines/Targets: Target setting was done by M&E Advisor in consultation with PMU team and partner
institutions
Other notes:
PERFORMANCE INDICATOR VALUES
Year Target Actual Notes
2011 0 0
2012 10
2013 20
2014 20
2015 20
2016 0
THE SHEET LAST UPDATED ON

`
PERFORMANCE INDICATOR REFERENCE SHEET
Name of Strategic Objective: Inclusive Agricultural Sector Growth
Name of Intermediate Result: IR 1.1: Capacity for Agricultural and Nutrition Research Strengthened
Name of indicator Number of research projects conducted which focus specifically on gender (USAID/iAGRI
Output Indicator) (9)
Is this an annual Report Indicator: Yes to be reported in 2012-2016
DESCRIPTION
Precise Definition(s): The number of research projects on topical issues that affect women. Research on gender and
agricultural value chains to determine where women are concentrated along the value chains and proposing ways of
increasing productivity and potentially upgrading them to higher value segments is included. Research on labor-saving
technologies to reduce women’s labor burden in the agriculture sector should be included. Similarly women’s
technology adoption and practices assessed to identify opportunities for increasing productivity adoption and diffusion
among women to expand their gains from agricultural productivity is included.
Unit of measure: Number of research project conducted.
Disaggregated by: N/A
Justification/Management Utility: This indicator measures enhanced capacity of SUA and NARS to conduct research
on gender issues.
PLAN FOR DATA ACQUISITION BY USAID
Data collection method: Direct counting of research projects
Data source: Project records
Method of data acquisition: Through quarterly and annual project reports
Frequency and timing of data acquisition: Quarterly and annually
Estimated cost of data acquisition: Costs are included in the existing contractor
Individuals(s) responsible at USAID: Kevin McCown
Individuals(s) responsible for providing data to USAID: Prof. David Kraybill
Location of data storage: USAID/iAGRI files, iAGRI Public Folder PMP data file
DATA QUALITY ISSUES
Date of Initial Data Quality Assessment: Annual December 2011(as indicated in the calendar of TMG/M&E
Known Data Limitations and Significance (if any): None
Actions Taken or Planned to Address Data Limitations: None planned at this time.
Data of Future Data Quality Assessments: Annual December 2012
Procedures for Future Data Quality Assessments: conduct site/field visits, review reports and institutional records
PLAN FOR DATA ANALYSIS, REVIEW & REPORTING
Data Analysis: Data will be aggregated by partner institutions
Presentation of Data: Assessment: Data will be presented in tabular and narrative forms.
Review of Data: Data will be reviewed by Project Management Unit (PMU) quarterly and annually through quarterly
and annual reports
Reporting of Data: Data will be reported to USAID on Quarterly and Annual basis
OTHER NOTES
Notes on baselines/Targets: Target setting was done by M&E Advisor in consultation with PMU team and partner
institutions
Other notes:
PERFORMANCE INDICATOR VALUES
Year Target Actual Notes
2011 0 0
2012 2
2013 3
2014 2
2015 2
2016 0
THE SHEET LAST UPDATED ON

`
PERFORMANCE INDICATOR REFERENCE SHEET
Name of Strategic Objective: Inclusive Agricultural Sector Growth
Name of Intermediate Result: IR 1.1: Capacity for Agricultural and Nutrition Research Strengthened
Name of indicator: Number of students making use of improved ICT in classroom instruction (USAID/iAGRI
Output Indicator) (10)
Is this an annual Report Indicator: Yes to be reported in 2012-2016
DESCRIPTION
Precise Definition(s): The number of people using improved information and communications technology
infrastructure and other types of equipment to meet anticipated training needs. This will include computers and allied
equipment, communications equipment, laboratory equipment, and field implements.
Unit of measure: Number of people.
Disaggregated by: Sex
Justification and Management Utility This indicator measures the degree to which institutions are more capable of
delivering enhanced educational services with planned improved ICT physical infrastructures.
PLAN FOR DATA ACQUISITION BY USAID
Data collection method: Direct counting of individuals using ICT
Data source: Project records
Method of data acquisition: Through quarterly and annual project reports
Frequency and timing of data acquisition: Quarterly and annually
Estimated cost of data acquisition: Costs are included in the existing contractor
Individuals(s) responsible at USAID: Kevin McCown
Individuals(s) responsible for providing data to USAID: Prof. David Kraybill
Location of data storage: USAID/iAGRI files, iAGRI Public Folder PMP data file
DATA QUALITY ISSUES
Date of Initial Data Quality Assessment: Annual December 2011(as indicated in the calendar of TMG/M&E
Known Data Limitations and Significance (if any):None
Actions Taken or Planned to Address Data Limitations: None planned at this time.
Data of Future Data Quality Assessments: Annual December 2012
Procedures for Future Data Quality Assessments: conduct site visits, review reports and institutional and PMU
records
PLAN FOR DATA ANALYSIS, REVIEW & REPORTING
Data Analysis: Data will be aggregated across departments by gender
Presentation of Data: Data will be presented in tabular and narrative forms.
Review of Data: Data will be reviewed by Project Management Unit(PMU)quarterly and annually through quarterly
and annual reports
Reporting of Data: Data will be reported to USAID on Quarterly and Annual basis
OTHER NOTES
Notes on baselines/Targets: Target setting was done by M&E Advisor in consultation with PMU team and partner
institutions
Other notes:
PERFORMANCE INDICATOR VALUES
Year Target Actual Notes
2011 0 0
2012 750
2013 1000
2014 1250
2015 1500
2016 1750
THE SHEET LAST UPDATED ON

`
PERFORMANCE INDICATOR REFERENCE SHEET
Name of Strategic Objective: Inclusive Agricultural Sector Growth
Name of Intermediate Result: IR 1.2: New Technologies and Management Practices Introduced
Name of indicator: Number of new technologies or management practices under research (FtF Output Indicator) (11)
Is this an annual Report Indicator: Yes to be reported in 2012-2016
DESCRIPTION
Precise Definition(s): Number of technologies, management practices, or products under research/development. Technologies to
be counted here are agriculture-related technologies and innovations. Technologies may include improved management practices
such as sustainable land management. Significant improvements to existing technologies should be counted; an improvement would
by significant if it served a new purpose or allowed a new class of users to employ it. Examples include a scaled-down milk container
that allows individuals to carry it easily, a new blend of fertilizer for a particular soil, and tools modified to suit a particular
management practice. New technologies or management practices under research in a previous year but not under research in the
reporting year should not be included. Technologies under research are as follows:
a) For biotech crop research: When technologies are under research, the process is contained in a laboratory or greenhouse;
once the possibility of success is judged high enough, a permit is required to move to field testing. The change of location
from a contained laboratory or greenhouse to a confined field and the receipt of a permit indicated that the research has
completed the “under research” stage.
b) For non-biotech crop research: When technologies are under research, plant breeders work on developing new lines on
research plots under controlled conditions. All research should have a target, often expressed in terms of traits to be
combined into a specific cultivar or breed. When the research achieves “proof of concept” (by accumulating technical
information and test results that indicate that the target is achievable), the “under research” phase is completed. Note that
for crops, much or all of this phase might be conducted outdoors and in soil; these attributes do not make this work “field
testing.”
For non-crop research: “under research” signifies similarly research conducted under ideal conditions to develop the product or
process. USAID/iAGRI will target on-station applied research themes applied to technologies and practices related to sustainable
cropping systems and food processing. The research activities of graduate students trained through the project will also be included.
Unit of measure: Number of new technologies.
Disaggregated by: Commodity/priority theme ( maize, rice, horticulture, climate change, other)
Justification/Management Utility: This indicator tracks the 1st of 3 stages in research and technology investments and
progress toward dissemination.
PLAN FOR DATA ACQUISITION BY USAID
Data collection method: Direct counting of technologies
Data source: Project reports
Method of data acquisition: Through quarterly and annual Project reports
Frequency and timing of data acquisition: Quarterly and annually
Estimated cost of data acquisition: Costs are included in the existing contractor
Individuals(s) responsible at USAID: Kevin McCown
Individuals(s) responsible for providing data to USAID: Prof. David Kraybill
Location of data storage: USAID/iAGRI files, iAGRI Public Folder PMP data file
DATA QUALITY ISSUES
Date of Initial Data Quality Assessment: Annual December 2011(as indicated in the calendar of TMG/M&E)
Known Data Limitations and Significance (if any): the isolation of a technology from a package or combination of
practices is not always easy to discern.
Actions Taken or Planned to Address Data Limitations: improve and standardize definitions.
Data of Future Data Quality Assessments: Annual December 2012
Procedures for Future Data Quality Assessments: Site/field visits, review of survey instrument and grant reporting.
PLAN FOR DATA ANALYSIS, REVIEW & REPORTING
Data Analysis: Data will be aggregated by commodity/priority themes across USAID/iAGRI grant recipients.
Presentation of Data: Data will be presented in tabular and narrative forms.
Review of Data: Data will be reviewed annually by PMU through activity reports and final reports.
Reporting of Data: Data will be reported to USAID on Quarterly and Annual basis.
OTHER NOTES
Notes on baselines/Targets: Target setting was done by M&E Advisor in consultation with PMU team and partner
institutions
Other notes:
PERFORMANCE INDICATOR VALUES
Year Target Actual Notes
2011 0 0
2012 3
2013 6
2014 8
2015 6
2016 20
THE SHEET LAST UPDATED ON

`
PERFORMANCE INDICATOR REFERENCE SHEET
Name of Strategic Objective: Inclusive Agricultural Sector Growth
Name of Intermediate Result: IR 1.2: New Technologies and Management Practices Introduced
Name of indicator: Number of new technologies or management practices under field testing (FTF Output Indicator) (12)
Is this an annual Report Indicator: Yes to be reported in 2012-2016
DESCRIPTION
Precise Definition(s): Number of technologies, management practices, or products under field testing. Technologies to be counted
here are agriculture-related technologies and innovations, and may relate to any of the product at any point on the supply chain.
“Under field testing” means that research has moved from focused development to broader testing and this testing is underway under
conditions intended to duplicate those encountered by potential users of the new technology. This might be in the actual facilities
(fields) of potential users, or it might be in a facility set up to duplicate those conditions. More specifically:
a) For biotech crop research: Once a permit has been obtained and the research moves to a confined field, the research is said
to be “under field testing.”
b) For non-biotech crop research: During this phase the development of the product continues under end-user conditions in
multi-location trails, which might be conducted at a research station or on farmers’ fields or both. Note that for crops, all of
this phase would be conducted outdoors and in soil, but this is not what makes this work “field testing.”
c) For non-crop research: “under field testing” signifies similarly research conducted under user conditions to further test the
product or process. In the case of research to improve equipment, the endpoint of field testing could be sales of equipment
(when the tester is a commercial entity). In other cases, it could be distribution of designs (when the tester is a
noncommercial entity) and also distribution of publications or other information (on the force of the good results of field
testing).
Significant improvements to existing technologies should also be counted; an improvement would be significant if, among other
reasons, it served a new purpose or allowed a new class of users to employ it. Examples include a scaled-down milk container that
allows individuals to carry it easily, a new blend of fertilizer for a particular soil, and tools modified to suit a particular management
practice. USAID/iAGRI will target on-farm applied research on improved technologies and management practices. The applied
research of graduate students will also be included.
Unit of measure: Number of technologies.
Disaggregated by: Commodity/priority theme ( maize, rice, horticulture, climate change, other)
Justification/Management Utility: This indicator tracks the 2ND of 3 stages in research and technology investments and progress
toward dissemination.
PLAN FOR DATA ACQUISITION BY USAID
Data collection method: Direct counting of technologies
Data source: Project records
Method of data acquisition: Through quarterly & annual reports
Frequency and timing of data acquisition: Quarterly and Annually
Estimated cost of data acquisition: Costs are included in the existing contractor
Individuals(s) responsible at USAID: Kevin McCown
Individuals(s) responsible for providing data to USAID: Prof. David Kraybill
Location of data storage: USAID/iAGRI files, iAGRI Public Folder PMP data file
DATA QUALITY ISSUES
Date of Initial Data Quality Assessment: Annual December 2011(as indicated in the calendar of TMG/M&E)
Known Data Limitations and Significance (if any): the isolation of a technology from a package or combination of practices is not
always easy to discern.
Actions Taken or Planned to Address Data Limitations: Improve and standardize definitions
Data of Future Data Quality Assessments: Annual December 2012
Procedures for Future Data Quality Assessments: Site visits, review of survey instrument.
PLAN FOR DATA ANALYSIS, REVIEW & REPORTING
Data Analysis: Data will be aggregated by commodity/priority theme across USAID/iAGRI grant recipients.
Presentation of Data: Data will be presented in tabular and narrative forms.
Review of Data: Data will be reviewed annually by PMU through activity reports and final reports.
Reporting of Data: Annual reporting
OTHER NOTES
Notes on baselines/Targets: Target setting was done by M&E Advisor in consultation with PMU team and partner institutions
Other notes:
PERFORMANCE INDICATOR VALUES
Year Target Actual Notes
2011 0 0
2012 2
2013 4
2014 6
2015 5
2016 0
THE SHEET LAST UPDATED ON

`
PERFORMANCE INDICATOR REFERENCE SHEET
Name of Strategic Objective: Inclusive Agricultural Sector Growth
Name of Intermediate Result: IR 1.2.1: Improve Capacity to Address Climate Change.
Name of indicator: Number of research projects that address adaptation to climate change (USAID/iAGRI
Output Indicator) (13)
Is this an annual Report Indicator: Yes to be reported in 2012-2016
DESCRIPTION
Precise Definition(s): Technologies innovations and management practices that address climate adaptation and
mitigation. (Including carbon sequestration, clean energy efficiency as related to agriculture). Increased use of climate
information for planning for disaster risk strategies in place, climate change mitigation and energy efficiency, and
natural resource management practices that increases productivity and/or resiliency to climate change, IPM, ISFM, and
PHH as related to agriculture should be included as improved technologies or management practices.
Unit of measure: Number of research projects.
Disaggregated by: N/A
Justification/Management Utility: This indicator measures enhanced institutional capacity to generate data and
information for addressing climate adaptation and mitigation mechanisms.
PLAN FOR DATA ACQUISITION BY USAID
Data collection method: Direct counting of research projects
Data source: Project records
Method of data acquisition: Through quarterly and annual project reports
Frequency and timing of data acquisition: Quarterly and Annually
Estimated cost of data acquisition: Costs are included in the existing contractor
Individuals(s) responsible at USAID: Kevin McCown
Individuals(s) responsible for providing data to USAID: Prof. David Kraybill
Location of data storage: USAID/iAGRI files, iAGRI Public Folder PMP data file
DATA QUALITY ISSUES
Date of Initial Data Quality Assessment: Annual December 2011(as indicated in the calendar of TMG/M&E)
Known Data Limitations and Significance (if any): None
Actions Taken or Planned to Address Data Limitations: None planned at this time.
Data of Future Data Quality Assessments: Annual December 2012
Procedures for Future Data Quality Assessments: conduct site visits, review reports and institutional records
PLAN FOR DATA ANALYSIS, REVIEW & REPORTING
Data Analysis: Data will be aggregated by partner institutions and individuals.
Presentation of Data: Data will be presented in tabular and narrative forms. Other illustrations ( photographs)
Review of Data: Data will be reviewed by Project Management Unit ((PMU) quarterly and annually through quarterly
and annual reports.
Reporting of Data: Data will be reported to USAID on Annual basis.
OTHER NOTES
Notes on baselines/Targets: Target setting was done by M&E Advisor in consultation with PMU team and partner
institutions
Other notes:
PERFORMANCE INDICATOR VALUES
Year Target Actual Notes
2011 0 0
2012 1
2013 5
2014 5
2015 3
2016 0
THE SHEET LAST UPDATED ON

`
PERFORMANCE INDICATOR REFERENCE SHEET
Name of Strategic Objective: Inclusive Agricultural Sector Growth
Name of Intermediate Result: IR 3.1: Increased Participation of the Private Sector in the Delivery of Services.
Name of indicator: Number of public-private partnerships formed as a result of FtF assistance (FtF Output Indicator) (14)
Is this an annual Report Indicator: Yes to be reported in 2012-2016
DESCRIPTION
Precise Definition(s): Number of public-private partnerships (PPP) in agriculture or nutrition formed during the
reporting year due to FtF intervention. A PPP is considered formed when there is a clear agreement, written to work
together to achieve a common objective. There must be either a significant cash or in-kind contribution to the effort by
both a public and private entity. USAID/contractors, for-profit enterprises, NGOs and CBOs and state-owned
enterprises are considered private. A public entity can be a national or sub-national government or a donor-funded
implementing partner. An agricultural activity includes: supply of inputs, production methods, agricultural processing
or transportation. A nutrition activity includes any activity focused on attempting to improve the nutritional content of
agricultural products provided to consumers, develop improved nutritional products, increase support for nutrition
service delivery, etc.Unit of measure: Number of PPPs. Unit of Measure: Number of PPPs
Disaggregated by: Institution and PPP/GDA partner
Justification/Management Utility: This indicator measures enhanced capacity of institutions to acquire private sector
support for their programs.
PLAN FOR DATA ACQUISITION BY USAID
Data collection method: Direct counting of the PPPs
Data source: Project records
Method of data acquisition: Through Quarterly and annual project reports
Frequency and timing of data acquisition: Quarterly and annually
Estimated cost of data acquisition: Costs are included in the existing contractor
Individuals(s) responsible at USAID: Kevin McCown
Individuals(s) responsible for providing data to USAID: Prof. David Kraybill
Location of data storage: USAID/iAGRI files, iAGRI Public Folder PMP data file
DATA QUALITY ISSUES
Date of Initial Data Quality Assessment: Annual December 2011(as indicated in the calendar of TMG/M&E)
Known Data Limitations and Significance (if any): None at this time
Actions Taken or Planned to Address Data Limitations: Improve and standardize definitions; clearly identify each
individual partnership
Data of Future Data Quality Assessments: Annual December 2012
Procedures for Future Data Quality Assessments: review reports and institutional records
PLAN FOR DATA ANALYSIS, REVIEW & REPORTING
Data Analysis: Data will be aggregated by institution/organization, program and threshold or stage of PPP/GDA
Agreement process
Presentation of Data: Data will be presented in tabular and narrative forms.
Review of Data: Data will be reviewed annually through activity reports and or on institutional monitoring forms.
Reporting of Data: Annual reporting.
OTHER NOTES
Notes on baselines/Targets: Target setting was done by M&E Advisor in consultation with PMU team and partner
institutions
Other notes:
PERFORMANCE INDICATOR VALUES
Year Target Actual Notes
2011 0 0
2012 2
2013 4
2014 4
2015 2
2016 1
THE SHEET LAST UPDATED ON

`
PERFORMANCE INDICATOR REFERENCE SHEET
Name of Strategic Objective:
Name of Intermediate Result: IR 3.2: Increased capacity of Women to Participate in Agriculture and Nutrition
Name of indicator Percent change in female secondary-school students applying for admission to agriculture and
science degree programs at Sokoine University (USAID/iAGRI Outcome Indicator) (15)
Is this an annual Report Indicator: Yes, to be reported in 2012-2016
DESCRIPTION
Precise Definition(s): This outcome indicator measures the percentage change in the number of female secondary
students who apply for degree studies in agricultural and science programs at Sokoine University. IAGRI-sponsored
activities aimed at increasing the interest of secondary-school girls in study agriculture and science consist of
presentations in secondary schools by academic staff members of Sokoine University. Agricultural and science degree
programs include Agriculture General, Forestry, Home Economics and Human Nutrition, Veterinary Medicine, Food
Science and Technology, Agricultural Engineering, Horticulture, Animal Science, Agronomy, Agricultural Education
and Extension, Agricultural Economics and Agribusiness, Wildlife Management, Environmental Science Management,
Biotechnology and Laboratory Science, Aquaculture, and Rural Development.
Unit of Measure: Completed applications by prospective female students Disaggregated by: Degree program
Justification/Management Utility: The indicator measures the enhanced capacity of SUA to increase interest of
secondary school girls to study agriculture and nutrition
PLAN FOR DATA ACQUISITION BY USAID
Data collection method: Direct counting
Data source: SUA Admissions and PMU project records,
Method of data acquisition: Activity records
Frequency and timing of data acquisition: Annual
Estimated cost of data acquisition: Costs are included in the implementing partner contract
Individuals(s) responsible at USAID: Kevin McCown
Individuals(s) responsible for providing data to USAID: Prof. David Kraybill
Location of data storage: USAID/iAGRI PMU office
DATA QUALITY ISSUES
Date of Initial Data Quality Assessment: Annual December 20th
as per TMG/M&E calendar of activities
Known Data Limitations and Significance (if any): None
Actions Taken or Planned to Address Data Limitations: None at this time
Data of Future Data Quality Assessments: Annual December 2012
Procedures for Future Data Quality Assessments: Site visits to schools, SUA Admission Office records
PLAN FOR DATA ANALYSIS, REVIEW & REPORTING
Data Analysis: Direct counting and computing
Presentation of Data: Assessment: Data will be summarized in tables
Review of Data: Annually, through M&E forms
Reporting of Data: Annual reporting
OTHER NOTES
Notes on baselines/Targets: Targets will be set by PMU
Other notes:
PERFORMANCE INDICATOR VALUES
Year Target Actual Notes
2011 0 0
2012 5%
2013 5%
2014 5%
2015 5%
2016 5%
THE SHEET LAST UPDATED ON

`
PERFORMANCE INDICATOR REFERENCE SHEET
Name of Strategic Objective:
Name of Intermediate Result: IR 3.2: Increased Capacity of Women to Participate in Agriculture and Nutrition
Name of indicator: Number of actions supportive of gender mainstreaming at Sokoine University
(USAID/iAGRI Outcome Indicator) (16)
Is this an annual Report Indicator: Yes, to be reported in 2012-2016
DESCRIPTION
Precise Definition(s): Number of steps taken towards the realization of a particular policy reform. Steps taken by
stakeholders and partners to improve the gender policy environment may include one or more of the following:
identification and analysis of the problem; elaboration of proposed interventions to address the problem; dialogue,
lobbying public discussions, and validation of the problem; adoption through decree regulation, legislation, or creation
of an implementing team/unit; and implementation or enforcement through concrete action. Results are annual and are
not listed cumulatively.
Unit of Measure: Number
Disaggregated by: None
Justification/Management Utility: This indicator reflects the effectiveness and reach of iAGRI project’s
gender enabling environment and SUA’s commitment to gender integration
PLAN FOR DATA ACQUISITION BY USAID
Data collection method: Observation and analysis of SUA policy status of the various policies being addressed
Data source: iAGRI project files
Method of data acquisition: Semi-annual and annual
Frequency and timing of data acquisition: Analysis annually. Reporting: semi annual
Estimated cost of data acquisition: Minimal; part of field and M&E staff duties
Individuals(s) responsible at USAID: Kevin McCown
Individuals(s) responsible for providing data to USAID: Prof. David Kraybill
Location of data storage: iAGRI/PMU office
DATA QUALITY ISSUES
Date of Initial Data Quality Assessment: Annual: December 2011 as per TMG/M&E calendah of events
Known Data Limitations and Significance (if any): None at this time
Actions Taken or Planned to Address Data Limitations:. None
Data of Future Data Quality Assessments: December 2012
Procedures for Future Data Quality Assessments: Review achievements to date and track any remaining policy
reforms to reach the legislation/decree stage of development PLAN FOR DATA ANALYSIS, REVIEW & REPORTING
Data Analysis: Annually and upon request by USAID
Presentation of Data: Assessment: Tabular and narrative
Review of Data: Data will be reviewed by PMU on a quarterly and annual basis
Reporting of Data: Semi annual reports
OTHER NOTES
Notes on baselines/Targets: Targets will be set by PMU
Other notes:
PERFORMANCE INDICATOR VALUES
Year Target Actual Notes
2011 0 0
2012 4
2013 4
2014 4
2015 4
2016 4
THE SHEET LAST UPDATED ON

`
PERFORMANCE INDICATOR REFERENCE SHEET
Name of Strategic Objective: Inclusive Agricultural Sector Growth
Name of Intermediate Result: IR 3.2: Increased Capacity of Women to Participate in Agriculture and Nutrition
Name of indicator: Number of young female students participating in women-to-women mentorship program
(USAID/iAGRI Indicator) (17)
Is this an annual Report Indicator: Yes to be reported in 2012-2016
DESCRIPTION
Precise Definition(s): The number of young university female students currently enrolled in a woman-to-woman
mentorship program. Mentorship programs may include: offering advice and support by introducing students to clubs
and organizations where they can make friends and pursue new and continuing interests, providing information about
courses in their major or complimentary areas of study, acting as a sounding board and/ or working through situations or
issues that may arise, suggesting services that can provide additional support or advice to assist with academics, career
and leadership development, or personal issues that may arise, accompanying mentee to social and professional
development activities organized for mentees and mentors where students can enjoy and benefit from a diverse
community of women students pursuing a broad range of technological programs of study, the mentor providing help to
the mentee in finding documentation that is related to her field, and Round Tables (including one session showcasing
local CEO in agriculture industry and one career session with panel discussion featuring African women leaders in
agriculture and environment). A person completing a mentorship program in the fiscal year and currently participating
in another mentorship program should not be counted twice.
Unit of measure: Number of female students in mentorship programs.
Disaggregated by: Type of Institution- Faculty of Agriculture and Science departments.
Justification/Management Utility: This indicator measures increased capacity of SUA to provide opportunities for
enhanced professional and personal development among young female students by connecting them with faculty staff.
PLAN FOR DATA ACQUISITION BY USAID
Data collection method: Direct counting
Data source: Project reports
Method of data acquisition: Through quarterly and annual project reports
Frequency and timing of data acquisition: Quarterly and annually
Estimated cost of data acquisition: Costs are included in the existing contractor
Individuals(s) responsible at USAID: Kevin McCown
Individuals(s) responsible for providing data to USAID: Prof. David Kraybill
Location of data storage:: USAID/iAGRI files, iAGRI Public Folder PMP data file
DATA QUALITY ISSUES
Date of Initial Data Quality Assessment: Annual December 2011(as indicated in the calendar of TMG/M&E
Known Data Limitations and Significance (if any) None
Actions Taken or Planned to Address Data Limitations: None at this time
Data of Future Data Quality Assessments: Annual December 2012
Procedures for Future Data Quality Assessments: Attend mentoring events(luncheon, meetings), institutional
monitoring forms, and activity reports
PLAN FOR DATA ANALYSIS, REVIEW & REPORTING
Data Analysis: listing of mentorship events
Presentation of Data: Data will be summarized in tables.
Review of Data: Data will be reviewed annually through activity reports and or on institutional monitoring forms
Reporting of Data: Annual Reporting.
OTHER NOTES
Notes on baselines/Targets: Target setting was done by M&E Advisor in consultation with PMU team and partner
institutions
Other notes:
PERFORMANCE INDICATOR VALUES
Year Target Actual Notes
2011 0 0
2012 50
2013 150
2014 450
2015 350
2016 250
THE SHEET LAST UPDATED ON

`
PERFORMANCE INDICATOR REFERENCE SHEET
Name of Strategic Objective: Inclusive Agricultural Sector Growth
Name of Intermediate Result: IR 3.2: Increased Capacity of Women to Participate in Agriculture and Nutrition
Name of indicator: Number of high school girls provided with career guidance and counseling program
(USAID/iAGRI Output) (18)
Is this an annual Report Indicator: Yes to be reported in 2012-2016
DESCRIPTION
Precise Definition(s): The number of high school girls being provided with career guidance and counseling from
partner high schools. The career guidance program is to inform participants of career options in the agricultural
industry, the type of academic and occupational training needed to succeed in the industry, and postsecondary
opportunities that are associated with the agriculture field. The program will provide teachers, administrators and
parents with information they can use to support students’ career exploration and postsecondary education opportunities
in the field of agriculture, a career booklet which contains a list of degree programs in agriculture and their cut off
points.
Unit of measure: Number of high school girls.
Disaggregated by: N/A
Justification/Management Utility: This indicator measure enhanced capacity of SUA to mentor high school to join
SUA’s departments of Faculty of Agriculture and Science discipline.
PLAN FOR DATA ACQUISITION BY USAID
Data collection method: Direct counting
Data source: Project records
Method of data acquisition: Through quarterly and annual project reports
Frequency and timing of data acquisition: Quarterly and annually
Estimated cost of data acquisition: Costs are included in the existing contractor
Individuals(s) responsible at USAID: Kevin McCown
Individuals(s) responsible for providing data to USAID: Prof. David Kraybill
Location of data storage::: USAID/iAGRI files, iAGRI Public Folder PMP data file
DATA QUALITY ISSUES
Date of Initial Data Quality Assessment: Annual December 2011(as indicated in the calendar of TMG/M&E)
Known Data Limitations and Significance (if any): None. The project is working within the university and project
staff will collaborate with SUA staff in visiting high schools.
Actions Taken or Planned to Address Data Limitations: None planned at this time.
Data of Future Data Quality Assessments: Annual December 2012
Procedures for Future Data Quality Assessments: Visits to high schools, attending events, university and project
records,
PLAN FOR DATA ANALYSIS, REVIEW & REPORTING
Data Analysis: Data will be aggregated by department and position
Presentation of Data: Data will be presented in tabular and narrative forms.
Review of Data: Data will be reviewed annually through activity reports and or on institutional monitoring forms
Reporting of Data: Annual reporting.
OTHER NOTES
Notes on baselines/Targets: Target setting was done by M&E Advisor in consultation with PMU team and partner
institutions
Other notes:
PERFORMANCE INDICATOR VALUES
Year Target Actual Notes
2011 0 0
2012 700
2013 800
2014 950
2015 1000
2016 700
THE SHEET LAST UPDATED ON

`
PERFORMANCE INDICATOR REFERENCE SHEET
Name of Strategic Objective: Inclusive Agricultural Sector Growth
Name of Intermediate Result: IR 3.3: Enhanced Knowledge and External Ideas gained through Study
Tours
Name of indicator: Number of study tours completed as a result of FtF assistance (USAID/iAGRI Output) (19)
Is this an annual Report Indicator: Yes to be reported in 2012-2016
DESCRIPTION
Precise Definition(s): The numbers of individuals to whom significant knowledge or skills have been imparted
through formal or informal means, in-country and off-shore trainings are included. This includes primary sector
producers who receive a variety of best practices in productivity, post-harvest management, linking to markets, etc. It
also includes rural entrepreneurs, processors, managers and traders, researchers, extension workers, policymakers,
climate risk analysts, adaptation, mitigation, and vulnerability assessments. Knowledge or skills gained through
technical assistance activities is included. Individuals attending more than one travel are counted as many times as they
attend training.
Unit of measure: Number of people.
Method of calculation: N/A
Disaggregated by: Sex; Type of person: Farmers/CBOs/NGOs, Faculty and administrators, policy makers, civil
servants and business people.
Justification/Management Utility: Measures enhanced human capacity or technology and management
implementation as well as policy formulation and implementation which are key to transformational development.
PLAN FOR DATA ACQUISITION BY USAID
Data collection method: Direct counting of participants who go for study tours
Data source: Study Tours Register
Method of data acquisition: Through Quarterly & annual project reports
Frequency and timing of data acquisition: Quarterly and Annually
Estimated cost of data acquisition: Costs are included in the existing contractor
Individuals(s) responsible at USAID: Kevin McCown
Individuals(s) responsible for providing data to USAID: Prof. David Kraybill
Location of data storage: USAID/iAGRI files, iAGRI Public Folder PMP data file
DATA QUALITY ISSUES
Date of Initial Data Quality Assessment: December 2011(as indicated in calendar of TMG/M&E)
Known Data Limitations and Significance (if any): NO
Actions Taken or Planned to Address Data limitations: N/A
Data of Future Data Quality Assessments: Annual December 2012
Procedures for Future Data Quality Assessments: site visits to partner departments/recipients and review records
PLAN FOR DATA ANALYSIS, REVIEW & REPORTING
Data Analysis: Data will be aggregated across components on a quarterly basis
Presentation of data: Data will be presented in tabular and narrative forms. Other illustrations( photographs)
Review of Data: Data will be reviewed by Project Management Unit (PMU) quarterly and annually through quarterly
and annual reports
Reporting of Data: Data will be reported to USAID on Quarterly and Annual basis
OTHER NOTES
Notes on baselines/Targets: Target setting was done by the M&E Advisor in consultation with PMU team partner
institutions.
Other notes: None
PERFORMANCE INDICATOR VALUES
Year Target Actual notes
2011 0 0
2012 2
2013 6
2014 6
2015 3
2016 1
THE SHEET LAST UPDATED ON

`
PERFORMANCE INDICATOR REFERENCE SHEET
Name of Strategic Objective: Inclusive Agricultural Sector Growth
Name of Intermediate Result: IR 8.1:Improved Capacity to Conduct Policy Research and Analysis
Name of indicator: Number of policy issues in agriculture, natural resources and environment, climate change
and nutrition researched and analyzed as a result of FtF assistance ( USAID/iAGRI Output Indicator) (20)
Is this an annual Report Indicator: Yes to be reported in 2012-2016
DESCRIPTION
Precise Definition(s): The number of policies, regulations, in the areas of agricultural resource, food market standards
, nutrition, public investment, natural resources or water management and climate change adaptation/mitigation as it
relates to agriculture that are researched and analyzed and generating options for addressing cotemporary problems.
Building of a data bank of information that could be useful in agricultural policy analysis, formulation and
implementation should be included.
Unit Of measure: Number of policy issues.
Disaggregated by: N/A
Justification/Management Utility: The indicator measures the number of policies, regulations and administrative
procedures in the first stage (research, analysis) towards enhanced enabling environment for agriculture.
PLAN FOR DATA ACQUISITION BY USAID
Data collection method: Direct counting
Data source: Project records
Method of data acquisition: Through quarterly and annual project reports
Frequency and timing of data acquisition: Quarterly and annually
Estimated cost of data acquisition: Costs are included in the existing contractor
Individuals(s) responsible at USAID: Kevin McCown
Individuals(s) responsible for providing data to USAID: Prof. David Kraybill
Location of data storage: USAID/iAGRI files, iAGRI Public Folder PMP data file
DATA QUALITY ISSUES
Date of Initial Data Quality Assessment: Annual December 2011(as indicated in the calendar of TMG/M&E)
Known Data Limitations and Significance (if any): None.
Actions Taken or Planned to Address Data Limitations: None planned at this time.
Data of Future Data Quality Assessments: Annual December 2012
Procedures for Future Data Quality Assessments: University and project records,
PLAN FOR DATA ANALYSIS, REVIEW & REPORTING
Data Analysis: Data will be aggregated by policy themes
Presentation of Data: Data will be presented in tabular and narrative forms.
Review of Data: Data will be reviewed by Project Management Unit((PMU)quarterly and annually through quarterly
and annual reports
Reporting of Data: Data will be reviewed by PMU and reported to a quarterly and Annual reporting.
OTHER NOTES
Notes on baselines/Targets: Target setting was done by the M&E Advisor in consultation with PMU team partner
institutions.
Other notes:
PERFORMANCE INDICATOR VALUES
Year Target Actual Notes
2011 0 0
2012 3
2013 10
2014 10
2015 10
2016 3
THE SHEET LAST UPDATED ON

`
PERFORMANCE INDICATOR REFERENCE SHEET
Name of Strategic Objective: Inclusive Agricultural Sector Growth
Name of Intermediate Result: IR 8.2 : Public/Private Sector Dialogue on Policy Issues Increased
Name of indicator: Number of USG- supported policy dialogue events held that are related to improving the
enabling policy environment for agriculture and nutrition (USAID/iAGRI Output Indicator) (21)
Is this an annual Report Indicator: Yes to be reported in 2012-2016
DESCRIPTION
Precise Definition(s): The number of events (including conferences, workshops, seminars, and briefings) to
communicate research findings and provide a forum for open discussion among researchers and other professionals,
university academicians, policy analysts, policy advisors, policy makers, civil society organizations and representatives
of farmers, manufactures, traders and other stakeholders. Publication of research works in proceedings, working
papers, professional journals and popular media should be included. Strengthening of capacity building for policy
research, analysis and collaboration on research and exchange of information with institutions and agencies with similar
interests and engaged in similar work should be included.
Unit of measure: Number of events/publications/papers and number of people reached.
Disaggregated by: N/A
Justification/Management Utility: This indicator measures the number of policies, regulations and administrative
procedures that have gone through the second stage of the policy reform process of public debate, sharing of
information with stakeholders and validation of the research findings and input from the stakeholders.
PLAN FOR DATA ACQUISITION BY USAID
Data collection method: Direct counting
Data source: Project reports
Method of data acquisition: Through quarterly and annual project reports
Frequency and timing of data acquisition: Quarterly and annually
Estimated cost of data acquisition: Costs are included in the existing contractor
Individuals(s) responsible at USAID: Kevin McCown
Individuals(s) responsible for providing data to USAID: Prof. David Kraybill
Location of data storage: USAID/iAGRI files, iAGRI Public Folder PMP data file
DATA QUALITY ISSUES
Date of Initial Data Quality Assessment: Annual December 2011(as indicated in the calendar of TMG/M&E)
Known Data Limitations and Significance (if any): None. The project is working within the university and project
staff will be assisting with the organization of the events.
Actions Taken or Planned to Address Data Limitations: None planned at this time.
Data of Future Data Quality Assessments: Annual December 2012
Procedures for Future Data Quality Assessments: University records (Facts and figures), project records and
participants registration forms.
PLAN FOR DATA ANALYSIS, REVIEW & REPORTING
Data Analysis: Data will be aggregated by gender participation
Presentation of Data: Data will be presented in tabular and narrative forms
Review of Data: Data will be reviewed by Project Management Unit((PMU)quarterly and annually through quarterly
and annual reports
Reporting of Data: Reports to USAID in a quarterly Annual basis.
OTHER NOTES
Notes on baselines/Targets: Target setting was done by the M&E Advisor in consultation with PMU team partner
institutions.
Other notes:
PERFORMANCE INDICATOR VALUES
Year Target Actual Notes
2011 0 0
2012 2
2013 4
2014 4
2015 4
2016 1
THE SHEET LAST UPDATED ON

`
ANNEX 6: PMP Management Task Schedule
PERFORMANCE MANAGEMENT TASKS 2011 2012 2013 Responsible
person
Q1 Q2 Q3 Q4 Q1 Q2 Q3 Q4 Q1 Q2 Q3 Q4
PMP Management Tasks
Develop PMP and submit to USAID XX XX M&E, PMU
Preparation of data collections tools xx xx M&E,PMU
Project monitoring xx Xx xx xx xx xx xx xx xx xx xx xx M&E,PMU
Quarterly report writing xx Xx xx xx xx xx xx xx xx xx xx xx TMG, M&E
Periodic review of the PMP indicators xx xx xx M&E, PMU
Finalize the PIRS for each indicator xx PMU/OSUC
Target setting for the new indicators xx M&E, PMU
Performance evaluation
Preparation of SOW for mid-term evaluation xx TMG
Midterm evaluation xx TMG, PMU
Internal project evaluation TMG, PMU
Final project evaluation TMG
Data Quality Assessment
Preparation of data quality assessment tools xx TMG
Actual data quality assessment xx TMG
Data quality assessment report xx TMG, PMU
Conduct needs assessments xx xx PMU/ OSUC
Establish target and baseline data xx M&E, PMU

`
Annex 7: PMP Indicator Performance Tracking Table
PMP Indicator Performance Tracking Table
QUAR
TER 1
QUARTER
2
QUARTER
3
QUARTE
R 4
An
nu
al
Ta
rget
An
nu
al
Ta
rget
Act
ua
l/
Ta
rget
*1
00
OCT-
DEC
JAN-
MARCH
APR-JUNE JULY-
DEC
Performance Indicator Indicator definition and Unit of measure
Da
ta
So
urc
e
Lev
el O
f
Dis
ag
gre
ga
tion
Ba
seli
ne
yea
r
Ba
seli
ne
Va
lue
Ta
rget
Act
ua
l A
ctu
al/
Ta
rget
*1
00
Ta
rget
Act
ua
l A
ctu
al/
Ta
rget
*1
00
Ta
rget
Act
ua
l A
ctu
al/
Ta
rget
*1
00
Ta
rget
Act
ua
l
Act
ua
l/
Ta
rget
*1
00
ASSISTANCE OBJECTIVE:
Program Areas 4.5 (Agriculture) Intermediate results statement:
Project Goal Statement:
Goal indicator 1
Prevalence of Poverty: % of
people living on less than
$1.25/day
National Level data and Unified
Baseline Survey
Unified Baseline
Survey(UBS) National 2011 0
Goal Indicator 2
Prevalence of underweight
children under 5( weight for
age: below -2 SD) % of
underweight children under
5:
National & regional level data from
DHS, district and below data from UBS
and IP surveys
DHS and Unified
baseline Survey Sex 2011 0

`
PMP Indicator Performance Tracking Table
QUARTER
1
QUARTER
2
QUARTER
3
QUARTER
4
An
nu
al
Ta
rget
An
nu
al
Ta
rget
Act
ua
l/
Ta
rget
*1
00
OCT-DEC JAN-
MARCH
APR-JUNE JULY-DEC
Performance Indicator Indicator definition and Unit of measure
Da
ta
So
urc
e
Lev
el O
f
Dis
ag
gre
ga
tion
Ba
seli
ne
yea
r
Ba
seli
ne
Va
lue
Ta
rget
Act
ua
l A
ctu
al/
Ta
rget
*1
00
Ta
rget
Act
ua
l A
ctu
al/
Ta
rget
*1
00
Ta
rget
Act
ua
l
Act
ua
l/
Ta
rget
*1
00
Ta
rget
Act
ua
l
Act
ua
l/
Ta
rget
*1
00
IR 1.1Capacity for Agricultural and Nutrition Research Strengthened
Percent change in
productivity of Feed-the-
Future commodities
(USAID/iAGRI Outcome
Indicator) (1)
This outcome indicator is the percent
change in farm-level productivity of land
as a result of use of innovation packages
introduced in pilot-study areas. Land
productivity is annual production
divided by acreage. An innovation
bundle is a set of chemical, biological, or
management changes. Well -defined
technology bundles will be identified by
iAGRI-sponsored research teams prior to
measuring the baseline. Feed-the-Future
commodities are maize, rice and
horticulture. Households producing at
least one of the Feed-the-Future
commodities will be included in this
indicator.
Unit of measure: Outputs will be
measured on a kilogram basis, Land on
acre basis
Project
records
FtT
commodities
2011 0 0
10
10
10
10
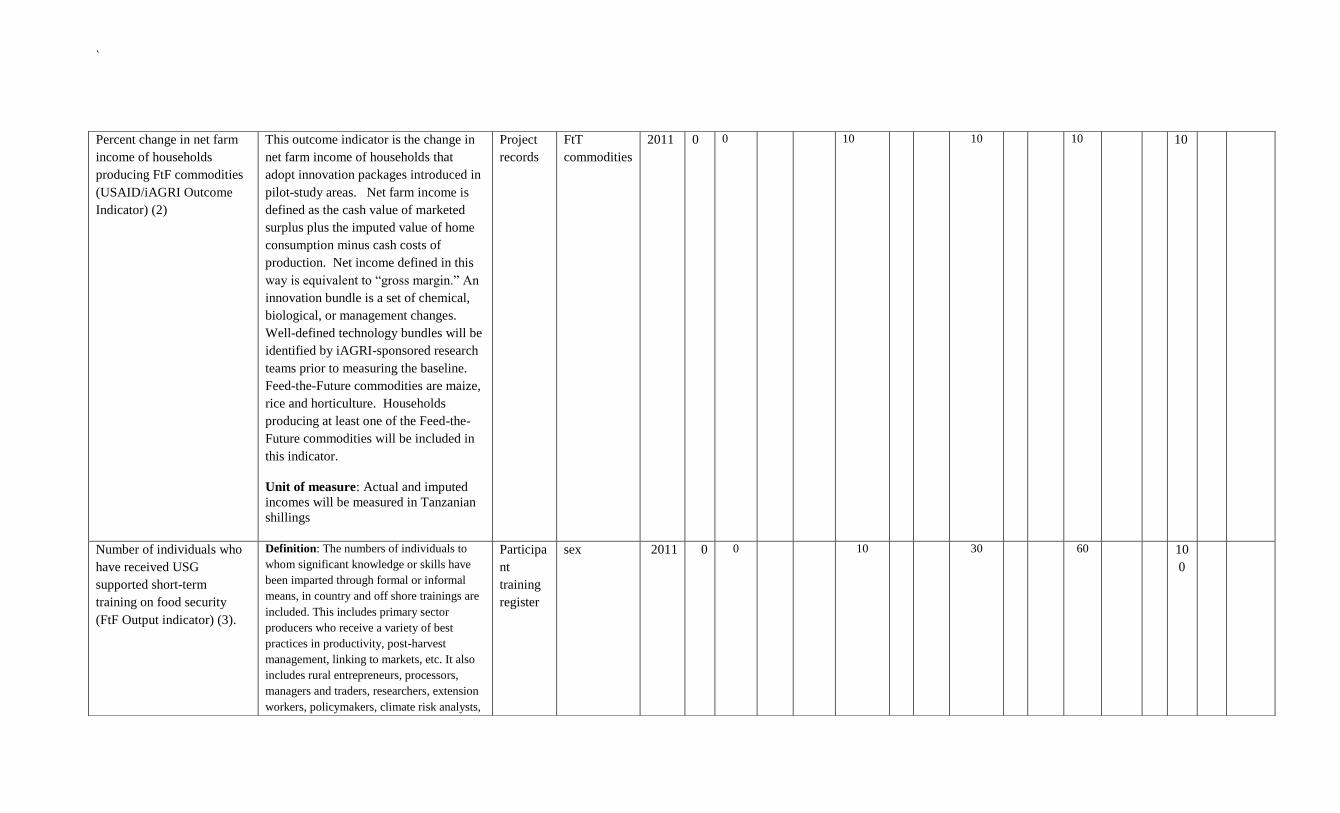
`
Percent change in net farm
income of households
producing FtF commodities
(USAID/iAGRI Outcome
Indicator) (2)
This outcome indicator is the change in
net farm income of households that
adopt innovation packages introduced in
pilot-study areas. Net farm income is
defined as the cash value of marketed
surplus plus the imputed value of home
consumption minus cash costs of
production. Net income defined in this
way is equivalent to “gross margin.” An
innovation bundle is a set of chemical,
biological, or management changes.
Well-defined technology bundles will be
identified by iAGRI-sponsored research
teams prior to measuring the baseline.
Feed-the-Future commodities are maize,
rice and horticulture. Households
producing at least one of the Feed-the-
Future commodities will be included in
this indicator.
Unit of measure: Actual and imputed
incomes will be measured in Tanzanian
shillings
Project
records
FtT
commodities
2011 0 0
10
10
10
10
Number of individuals who
have received USG
supported short-term
training on food security
(FtF Output indicator) (3).
Definition: The numbers of individuals to
whom significant knowledge or skills have
been imparted through formal or informal
means, in country and off shore trainings are
included. This includes primary sector
producers who receive a variety of best
practices in productivity, post-harvest
management, linking to markets, etc. It also
includes rural entrepreneurs, processors,
managers and traders, researchers, extension
workers, policymakers, climate risk analysts,
Participa
nt
training
register
sex 2011 0 0
10
30
60
10
0

`
adaptation, mitigation, and vulnerability
assessments. Knowledge or skills gained
through technical assistance activities is
included. Individuals attending more than
one training are counted as many times as
they attend training.
Unit of measure: Number of people.counted
as many times as they attend training.
Unit of measure: Number of people

`
PMP Indicator Performance Tracking Table
QUARTE
R 1
QUARTER
2
QUARTER
3
QUARTER
4
An
nu
al
Ta
rget
An
nu
al
Ta
rget
Act
ua
l/
Ta
rget
*1
00
OCT-
DEC
JAN-
MARCH
APR-JUNE JULY-DEC
Performance Indicator Indicator definition and Unit of measure
Da
ta
So
urc
e
Lev
el O
f
Dis
ag
gre
ga
tio
n
Ba
seli
ne
yea
r
Ba
seli
ne
Va
lue
Ta
rget
Act
ua
l A
ctu
al/
Ta
rget
*1
00
Ta
rget
Act
ua
l A
ctu
al/
Ta
rget
*1
00
Ta
rget
Act
ua
l A
ctu
al/
Ta
rget
*1
00
Ta
rget
Act
ua
l A
ctu
al/
Ta
rget
*1
00
Number of individuals who have
received USG supported long-
term training on food security
(FtF Output Indicator) (4).
Definition: The number of people who are
currently enrolled in or graduated in the
current fiscal year from Master’s or PhD
program or are currently participating in or
have completed in the current fiscal year a
long-term (degree-seeking) advancing
training programs such as a fellowship
program or post-doctoral studies program. A
person completing on long term training
program in the fiscal year and currently
participating in another long term training
program should not be counted twice. An
example is a USDA Borlaug Fellow.
Unit of measure: Number of people.
Project reports Project
reports
2011 0 7 6 95% 0
20
35
55
Number of students assessed for
graduate-level English
competency (USAID/iAGRI
Output Indicator) (5).
Definition: The number of people whom English language ability is being assessed for evidence that
their spoken and written command of the English
language is adequate for the programs for which they have applied to study for academic degree at a
college or university in the US. To determine the
level of English proficiency, test scores of “Test of English as a Foreign Language (TOEFL) is
required. The test uses a multiple choice and essay
format to measure each examinees ability to understand North American English. The test is
divided into four sections: listening, structure,
reading, and writing of an easy. TOEFL is a computer-adaptive test, which means that not all
students answer exactly the same questions on the
test. Instead, depending on how the student performs on each question; the computer
determines whether the level of the test question
should be easier or more difficult. Unit of measure: Number of people
Participant &
training register
report
Sex 2011 0 0
0
20
15
35

`
PMP Indicator Performance Tracking Table
QUARTE
R 1
QUARTER
2
QUARTER
3
QUARTER
4
An
nu
al
Ta
rget
An
nu
al
Ta
rget
Act
ua
l/
Ta
rget
*1
00
OCT-
DEC
JAN-
MARCH
APR-JUNE JULY-DEC
Performance Indicator Indicator definition and Unit of measure
Da
ta
So
urc
e
Lev
el O
f
Dis
ag
gre
ga
tio
n
Ba
seli
ne
yea
r
Ba
seli
ne
Va
lue
Ta
rget
Act
ua
l A
ctu
al/
Ta
rget
*1
00
Ta
rget
Act
ua
l A
ctu
al/
Ta
rget
*1
00
Ta
rget
Act
ua
l A
ctu
al/
Ta
rget
*1
00
Ta
rget
Act
ua
l A
ctu
al/
Ta
rget
*1
00
Number of students trained for
graduate-level English
competency (USAID/iAGRI
Output Indicator) (6).
Definition: The number of people who cannot
meet the language proficiency requirement
and are enrolled in an intensive English
program which is designed to provide
individuals as quickly as possible with the
English language skills necessary for
admission.
Unit of measure: Number of people.
Participants
training register
Sex 2011 0 0
0
6
7
13
Number of researchers trained
for Randomized Control Trials
(RCTS) USAID/iAGRI Output
Indicator) (7).
Definition: The number of people to whom
significant knowledge or skill has been
imparted through formal or informal means.
In country and off shore trainings are
included. Knowledge or skills gained through
technical assistance activities is included. If
the activity provided training to trainers, and
if the reporting unit can make a credible
estimate of follow-on training provided by
those trainers, this estimate should be
included. Individuals attending more than one
training are counted as many times as they
attend training.
Unit of measure: Number of people.
Participant
training register
Sex 2011 0 0
0
5
5
10

`
6 Number of
Randomized Control
Trials conducted by
trained researchers
(USAID/iAGRI
Output Indicator)
(8).
Definition: The number of Randomized Control Trials (RCT) hypothesis
testing completed using an iAGRI-provided methodology for randomized
controlled trials for the biological and social sciences. The methodology will
address trial design and how to conduct, analyze, interpret, and assess the
validity of results. The methodology will provide specifications for
preparing reports of trial findings, complete and transparent reporting,
reducing the influence of bias on results, and critical appraisal and
interpretation. The methodology will consist of a checklist and a work flow
diagram, along with description of steps. Only count those RCT conducted
during the reporting year.
Unit of measure: Number of RCTs.
Participant
training
register
2011 0 Participan
t training
register
Semi-
annual
Sex 0 0 0 0 5 5 10

`
PMP Indicator Performance Tracking Table
QUARTER
1
QUARTE
R 2
QUARTE
R 3
QUARTER
4
An
nu
al
Ta
rget
An
nu
al
Ta
rget
Act
ua
l/
Ta
rget
*1
00 OCT-DEC JAN-
MARCH
APR-
JUNE
JULY-DEC
Performance Indicator Indicator definition and Unit of measure
Da
ta
So
urc
e
Lev
el O
f
Dis
ag
gre
ga
tio
n
Ba
seli
ne
yea
r
Ba
seli
ne
Va
lue
Ta
rget
Act
ua
l
Act
ua
l/
Ta
rget
*1
00
Ta
rget
Act
ua
l
Act
ua
l/
Ta
rget
*1
00
Ta
rget
Act
ua
l
Act
ua
l/
Ta
rget
*1
00
Ta
rget
Act
ua
l
Act
ua
l/
Ta
rget
*1
00
Number of research projects
conducted which focus
specifically on gender
(USAID/iAGRI Output
Indicator) (9).
Definition: The number of research projects
on topical issues that affect women. Research
on gender and agricultural value chains to
determine where women are concentrated
along the value chains and proposing ways of
increasing productivity and potentially
upgrading them to higher value segments is
included. Research on labor-saving
technologies to reduce women’s labor burden
in the agriculture sector should be included.
Similarly women’s technology adoption and
practices assessed to identify opportunities
for increasing productivity adoption and
diffusion among women to expand their gains
from agricultural productivity is included.
Unit of measure: Number of research project
conducted.
Annual report N/A 2011 0
1
1
2
Number of students making use
of improved ICT in classroom
instruction (USAID/iAGRI
Output Indicator) (10).
Definition: The number of people using
improved information and communications
technology infrastructure and other types of
equipment to meet anticipated training needs.
This will include computers and allied
equipment, communications equipment,
laboratory equipment, and field implements.
Unit of measure: Number of people.
Project reports N/A 2011 0
350
350
700
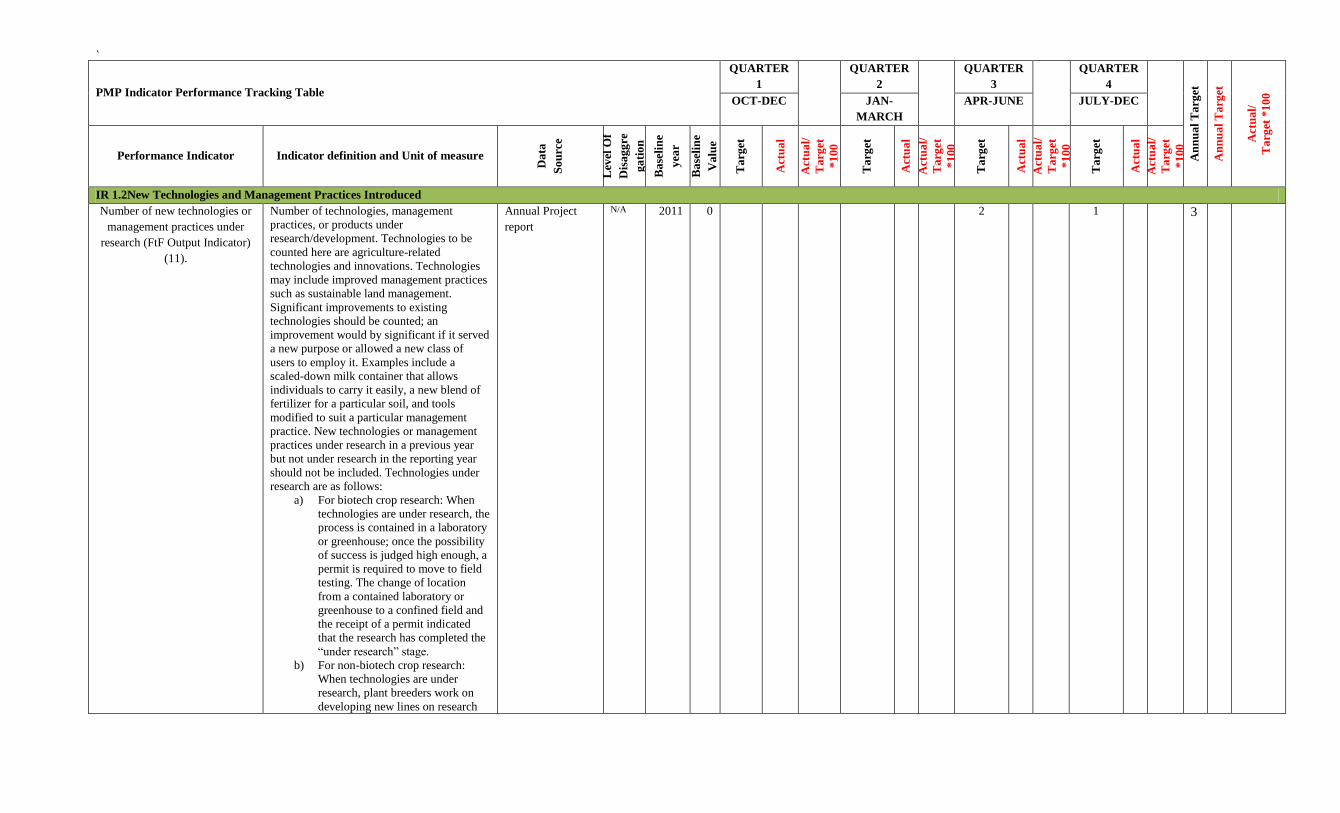
`
PMP Indicator Performance Tracking Table
QUARTER
1
QUARTER
2
QUARTER
3
QUARTER
4
An
nu
al
Ta
rget
An
nu
al
Ta
rget
Act
ua
l/
Ta
rget
*1
00
OCT-DEC JAN-
MARCH
APR-JUNE JULY-DEC
Performance Indicator Indicator definition and Unit of measure
Da
ta
So
urc
e
Lev
el O
f
Dis
ag
gre
ga
tio
n
Ba
seli
ne
yea
r
Ba
seli
ne
Va
lue
Ta
rget
Act
ua
l
Act
ua
l/
Ta
rget
*1
00
Ta
rget
Act
ua
l
Act
ua
l/
Ta
rget
*1
00
Ta
rget
Act
ua
l
Act
ua
l/
Ta
rget
*1
00
Ta
rget
Act
ua
l
Act
ua
l/
Ta
rget
*1
00
IR 1.2New Technologies and Management Practices Introduced
Number of new technologies or
management practices under
research (FtF Output Indicator)
(11).
Number of technologies, management
practices, or products under
research/development. Technologies to be
counted here are agriculture-related
technologies and innovations. Technologies
may include improved management practices
such as sustainable land management.
Significant improvements to existing
technologies should be counted; an
improvement would by significant if it served
a new purpose or allowed a new class of
users to employ it. Examples include a
scaled-down milk container that allows
individuals to carry it easily, a new blend of
fertilizer for a particular soil, and tools
modified to suit a particular management
practice. New technologies or management
practices under research in a previous year
but not under research in the reporting year
should not be included. Technologies under
research are as follows:
a) For biotech crop research: When
technologies are under research, the
process is contained in a laboratory
or greenhouse; once the possibility
of success is judged high enough, a
permit is required to move to field
testing. The change of location
from a contained laboratory or
greenhouse to a confined field and
the receipt of a permit indicated
that the research has completed the
“under research” stage.
b) For non-biotech crop research:
When technologies are under
research, plant breeders work on
developing new lines on research
Annual Project
report
N/A 2011 0
2
1
3
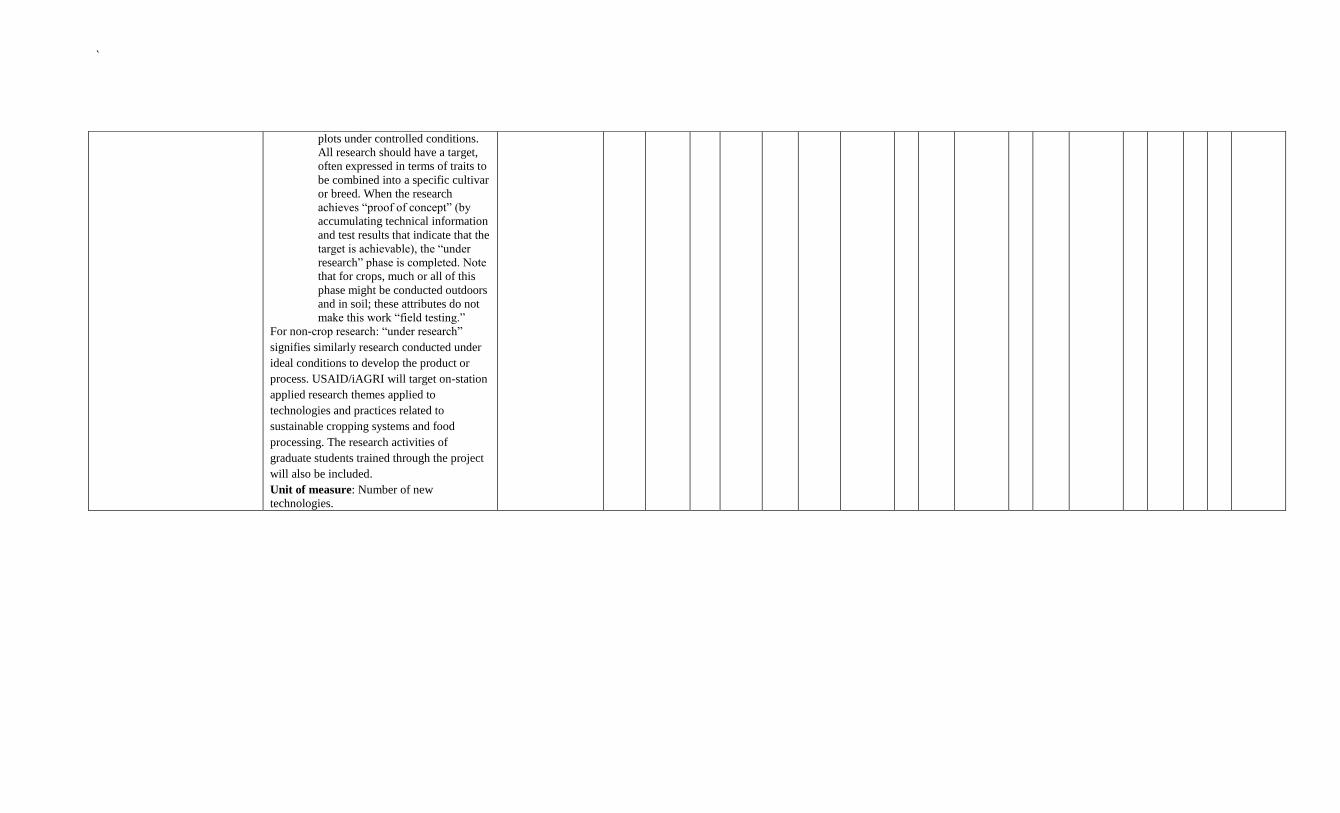
`
plots under controlled conditions.
All research should have a target,
often expressed in terms of traits to
be combined into a specific cultivar
or breed. When the research
achieves “proof of concept” (by
accumulating technical information
and test results that indicate that the
target is achievable), the “under
research” phase is completed. Note
that for crops, much or all of this
phase might be conducted outdoors
and in soil; these attributes do not
make this work “field testing.”
For non-crop research: “under research”
signifies similarly research conducted under
ideal conditions to develop the product or
process. USAID/iAGRI will target on-station
applied research themes applied to
technologies and practices related to
sustainable cropping systems and food
processing. The research activities of
graduate students trained through the project
will also be included.
Unit of measure: Number of new
technologies.

`
PMP Indicator Performance Tracking Table
QUARTER
1
QUARTE
R 2
QUARTER
3
QUARTER
4
An
nu
al
Ta
rget
An
nu
al
Ta
rget
Act
ua
l/
Ta
rget
*1
00 OCT-DEC JAN-
MARCH
APR-JUNE JULY-DEC
Performance Indicator Indicator definition and Unit of measure
Da
ta
So
urc
e
Lev
el O
f
Dis
ag
gre
ga
tio
n
Ba
seli
ne
yea
r
Ba
seli
ne
Va
lue
Ta
rget
Act
ua
l
Act
ua
l/
Ta
rget
*1
00
Ta
rget
Act
ua
l
Act
ua
l/
Ta
rget
*1
00
Ta
rget
Act
ua
l
Act
ua
l/
Ta
rget
*1
00
Ta
rget
Act
ua
l
Act
ua
l/
Ta
rget
*1
00
Number of new technologies or
management practices under
field testing (FTF Output
Indicator) (12).
Definition: Number of technologies
management practices or products under field
testing. Technologies to be counted here are
agriculture –related and innovation, and may
relate to any product at any time on supply
chain. “Under field testing” meant that the
research has moved from focus development
to broader testing and these testing is
underway under conditions intended to
duplicate those encountered by potential
users of the new technology. This might be
the actual facilities (fields) of potential users,
or it might be in a facility set up to duplicate
those conditions
Unit of measure: Number of technologies
Annual & Project
report
N/A 2011 0
1
1
2
IR 1.2.1Improved Capacity to address climate change
Number of research projects that
address adaptation to climate
change (USAID/iAGRI Output
Indicator) (13).
Definition: Technologies innovations and
management practices that address climate
adaptation and mitigation. (Including carbon
sequestration, clean energy efficiency as
related to agriculture). Increased use of
climate information for planning for disaster
risk strategies in place, climate change
mitigation and energy efficiency, and natural
resource management practices that increases
productivity and/or resiliency to climate
change, IPM, ISFM, and PHH as related to agriculture should be included as improved
technologies or management practices. Unit of measure: Number of research projects.
Project records Sex 2011 0
0
1
1

`
PMP Indicator Performance Tracking Table
QUARTER
1
QUARTER
2
QUARTER
3
QUARTER
4
An
nu
al
Ta
rget
An
nu
al
Ta
rget
Act
ua
l/
Ta
rget
*1
00 OCT-DEC JAN-
MARCH
APR-JUNE JULY-DEC
Performance Indicator Indicator definition and Unit of measure
Da
ta
So
urc
e
Lev
el O
f
Dis
ag
gre
ga
tio
n
Ba
seli
ne
yea
r
Ba
seli
ne
Va
lue
Ta
rget
Act
ua
l
Act
ua
l/
Ta
rget
*1
00
Ta
rget
Act
ua
l
Act
ua
l/
Ta
rget
*1
00
Ta
rget
Act
ua
l
Act
ua
l/
Ta
rget
*1
00
Ta
rget
Act
ua
l
Act
ua
l/
Ta
rget
*1
00
IR 3.1Increased Participation of the private Sector in the delivery of services
Number of public-private
partnerships formed as a result of
FtF assistance (FtF Output
Indicator) (14).
Definition: Number of public-private
partnerships (PPP) in agriculture or nutrition
formed during the reporting year due to FtF
intervention. A PPP is considered formed
when there is a clear agreement, written to
work together to achieve a common
objective. There must be either a significant
cash or in-kind contribution to the effort by
both a public and private entity.
USAID/contractors, for-profit enterprises,
NGOs and CBOs and state-owned enterprises
are considered private. A public entity can
be a national or sub-national government or a
donor-funded implementing partner. An
agricultural activity includes: supply of
inputs, production methods, agricultural
processing or transportation. A nutrition
activity includes any activity focused on
attempting to improve the nutritional content
of agricultural products provided to
consumers, develop improved nutritional
products, increase support for nutrition
service delivery, etc.Unit of measure:
Number of PPPs.
Unit of Measure: Number of PPPs
Project records N/A 2011 0
1
1
2

`
PMP Indicator Performance Tracking Table
QUARTE
R 1
QUARTER
2
QUARTER
3
QUARTER
4
An
nu
al
Ta
rget
An
nu
al
Ta
rget
Act
ua
l/
Ta
rget
*1
00
OCT-DEC JAN-
MARCH
APR-JUNE JULY-DEC
Performance Indicator Indicator definition and Unit of measure
Da
ta
So
urc
e
Lev
el
Of
Dis
ag
g
reg
ati
o
n
Ba
seli
n
e y
ear
Ba
seli
n
e V
alu
e
Ta
rget
Act
ua
l
Act
ua
l/
Ta
rget
*1
00
Ta
rget
Act
ua
l
Act
ua
l/
Ta
rget
*1
00
Ta
rget
Act
ua
l
Act
ua
l/
Ta
rget
*1
00
Ta
rget
Act
ua
l
Act
ua
l/
Ta
rget
*1
00
IR 3.2Increased Capacity of women to participate in Agriculture and nutrition
Name of indicator Percent
change in female secondary-
school students applying for
admission to agriculture and
science degree programs at
Sokoine University
(USAID/iAGRI Outcome
Indicator) (15)
This outcome indicator measures the
percentage change in the number of
female secondary students who apply for
degree studies in agricultural and science
programs at Sokoine University.
IAGRI-sponsored activities aimed at
increasing the interest of secondary-
school girls in study agriculture and
science consist of presentations in
secondary schools by academic staff
members of Sokoine University.
Agricultural and science degree
programs include Agriculture General,
Forestry, Home Economics and Human
Nutrition, Veterinary Medicine, Food
Science and Technology, Agricultural
Engineering, Horticulture, Animal
Science, Agronomy, Agricultural
Education and Extension, Agricultural
Economics and Agribusiness, Wildlife
Management, Environmental Science
Management, Biotechnology and
Laboratory Science, Aquaculture, and
Rural Development.
Unit of Measure: Completed
applications by prospective female
students
SUA
Admissions and
PMU project
records
Degree
progra
m
20
11
0 0
1%
2%
2%

`
Number of actions supportive
of gender mainstreaming at
Sokoine University(16)
Number of steps taken towards the
realization of a particular policy reform.
Steps taken by stakeholders and partners
to improve the gender policy
environment may include one or more of
the following: identification and analysis
of the problem; elaboration of proposed
interventions to address the problem;
dialogue, lobbying public discussions,
and validation of the problem; adoption
through decree regulation, legislation, or
creation of an implementing team/unit;
and implementation or enforcement
through concrete action. Results are
annual and are not listed cumulatively.
Unit of Measure: Number
iAGRI project
files
N/A 20
11
0 0
1
1
2
Number of young female
students participating in women-
to-women mentorship program
(USAID/iAGRI Indicator) (17).
Definition: The number of young university
female students currently enrolled in a woman-to-
woman mentorship program. Mentorship programs
may include: offering advice and support by
introducing students to clubs and organizations
where they can make friends and pursue new and
continuing interests, providing information about
courses in their major or complimentary areas of
study, acting as a sounding board and/ or working
through situations or issues that may arise,
suggesting services that can provide additional
support or advice to assist with academics, career
and leadership development, or personal issues that
may arise, accompanying mentee to social and
professional development activities organized for
mentees and mentors where students can enjoy and
benefit from a diverse community of women
students pursuing a broad range of technological
programs of study, the mentor providing help to the
mentee in finding documentation that is related to
Project records N/A 20
11
500
5
20
25
50

`
her field, and Round Tables (including one session
showcasing local CEO in agriculture industry and
one career session with panel discussion featuring
African women leaders in agriculture and
environment). A person completing a mentorship
program in the fiscal year and currently
participating in another mentorship program should
not be counted twice.
Unit of measure: Number of female students in
mentorship programs.
PMP Indicator Performance Tracking Table QUARTE
R 1
QUARTER
2
QUARTER
3
QUARTER
4
An
nu
al
Ta
rget
An
nu
al
Ta
rget
Act
ua
l/
Ta
rget
*1
00
OCT-DEC JAN-
MARCH
APR-JUNE JULY-DEC
Performance Indicator Indicator definition and Unit of measure
Da
ta
So
urc
e
Lev
el
Of
Dis
ag
gr
ega
tion
B
ase
lin
e y
ear
Ba
seli
n
e V
alu
e
Ta
rget
Act
ua
l
Act
ua
l/
Ta
rget
*1
00
Ta
rget
Act
ua
l
Act
ua
l/
Ta
rget
*1
00
Ta
rget
Act
ua
l
Act
ua
l/
Ta
rget
*1
00
Ta
rget
Act
ua
l
Act
ua
l/
Ta
rget
*1
00
IR 3.2Increased Capacity of women to participate in Agriculture and nutrition
Number of high school girls
provided with career guidance
and counseling program
(USAID/iAGRI Output) (18).
Definition: The number of high school girls being
provided with career guidance and counseling from
partner high schools. The career guidance program
is to inform participants of career options in the
agricultural industry, the type of academic and
occupational training needed to succeed in the
industry, and postsecondary opportunities that are
associated with the agriculture field. The program
will provide teachers, administrators and parents
with information they can use to support students’
career exploration and postsecondary education
opportunities in the field of agriculture, a career
booklet which contains a list of degree programs in
agriculture and their cut off points.
Unit of measure: Number of high school girls.
Project records,
SUS Gender
Committee
records/interviews
N/A 2011 500
100
300
300
700
IR 3.3:Enhance Knowledge gained through exposure to external ideas and models of integration

`
Number of study tours
completed as a result of FtF
assistance (USAID/iAGRI
Output) (19).
Definition: The numbers of individuals
to whom significant knowledge or skills
have been imparted through formal or
informal means, in-country and off-shore
trainings are included. This includes
primary sector producers who receive a
variety of best practices in productivity,
post-harvest management, linking to
markets, etc. It also includes rural
entrepreneurs, processors, managers and
traders, researchers, extension workers,
policymakers, climate risk analysts,
adaptation, mitigation, and vulnerability
assessments. Knowledge or skills gained
through technical assistance activities is
included. Individuals attending more
than one travel are counted as many
times as they attend training.
Unit of measure: Number of people.
Study tour
register
sex 2011 0 0
1
1
2

`
IR 8.1Improved Capacity to conduct research and analysis
Number of policy issues in
agriculture, natural resources and
environment, climate change and
nutrition researched and
analyzed as a result of FtF
assistance ( USAID/iAGRI
Output Indicator) (20).
Definition: The number of policies,
regulations, in the areas of agricultural
resource, food market standards , nutrition,
public investment, natural resources or water
management and climate change
adaptation/mitigation as it relates to
agriculture that are researched and analyzed
and generating options for addressing
cotemporary problems. Building of a data
bank of information that could be useful in
agricultural policy analysis, formulation and
implementation should be included.
Unit Of measure: Number of policy issues.
Project records N/A 2011 0
1
2
3

`
PMP Indicator Performance Tracking Table
QUARTER
1
QUARTER
2
QUARTER
3
QUARTER
4
An
nu
al
Ta
rget
An
nu
al
Ta
rget
Act
ua
l/
Ta
rget
*1
00
OCT-DEC JAN-
MARCH
APR-JUNE JULY-DEC
Performance Indicator Indicator definition and Unit of measure
Da
ta
So
urc
e
Lev
el
Of
Dis
ag
g
reg
ati
o
n
Ba
seli
n
e y
ear
Ba
seli
n
e V
alu
e
Ta
rget
Act
ua
l A
ctu
al/
Ta
rget
*1
00
Ta
rget
Act
ua
l A
ctu
al/
Ta
rget
*1
00
Ta
rget
Act
ua
l A
ctu
al/
Ta
rget
*1
00
Ta
rget
Act
ua
l A
ctu
al/
Ta
rget
*1
00
IR 8.2Public/Private Sector Dialogue on Policy Issues Increased
Number of USG- supported
policy dialogue events held that
are related to improving the
enabling policy environment for
agriculture and nutrition
(USAID/iAGRI Output
Indicator) (21).
Definition: The number of events (including
conferences, workshops, seminars, and
briefings) to communicate research findings
and provide a forum for open discussion
among researchers and other professionals,
university academicians, policy analysts,
policy advisors, policy makers, civil society
organizations and representatives of farmers,
manufactures, traders and other stakeholders.
Publication of research works in proceedings,
working papers, professional journals and
popular media should be included.
Strengthening of capacity building for policy
research, analysis and collaboration on
research and exchange of information with
institutions and agencies with similar
interests and engaged in similar work should
be included.
Unit of measure: Number of
events/publications/papers and number of
people reached.
Project records,
participants
training register
N/A 2011 0
1
1
2

`
PMP Indicator Performance Tracking Table
QUARTER
1
QUARTER
2
QUARTER
3
QUARTE
R 4
An
nu
al
Ta
rget
An
nu
al
Ta
rget
Act
ua
l/
Ta
rget
*1
00
OCT-DEC JAN-
MARCH
APR-JUNE JULY-
DEC
Performance Indicator Indicator definition and Unit of measure
Da
ta
So
urc
e
Lev
el
Of
Dis
ag
g
reg
ati
o
n
Ba
seli
n
e y
ear
Ba
seli
n
e V
alu
e
Ta
rget
Act
ua
l A
ctu
al/
Ta
rget
*1
00
Ta
rget
Act
ua
l A
ctu
al/
Ta
rget
*1
00
Ta
rget
Act
ua
l
Act
ua
l/
Ta
rget
*1
00
Ta
rget
Act
ua
l
Act
ua
l/
Ta
rget
*1
00
CROSS CUTTING
INDICATORS
Gender 1 52 300 400 752
Climate change 1 1
Public Private
Partnership(PPP)
1 1
2
Policy support( research &
dissemination)
1
1
Donor Co-ordination
consultations/meetings
1 1 1
3

`
Annex 8 Sample USAID/iAGRI Grant Report
No. Grantee Project Location Action Start End Amount Disbursed Outcome
Name
Name of activity
Brief Description of the nature
of the activity
Zoning, District,
and
Village/Ward
IAGRI
staff
responsible
Start
Date
End
Date
Total of
Grant
Amount
Disbursed