i. why are we late in reporting our 2015 results
TRANSCRIPT

TABLE OF CONTENTS
UNITED STATES SECURITIES AND EXCHANGE COMMISSION
Washington, D.C. 20549
Form 20-FANNUAL REPORT PURSUANT TO SECTION 13 OR 15(d) OF
THE SECURITIES EXCHANGE ACT OF 1934 For the fiscal year ended December 31, 2015
Commission file number 001-04192
(ExactnameofRegistrantasspecifiedinitscharter)
British Columbia, Canada(Jurisdictionofincorporationororganization)
Suite 1860 - 400 Burrard Street, Vancouver, British Columbia, Canada V6C 3A6(Addressofprincipalexecutiveoffice)
Gerardo Cortina Suite 1860 - 400 Burrard Street
Vancouver, British Columbia, Canada V6C 3A6 Telephone: +1 604-683-8286 Facsimile: +1 604-683-3205
withacopyto:H.S. Sangra
Sangra Moller LLP 1000 Cathedral Place, 925 West Georgia Street
Vancouver, British Columbia, Canada V6C 3L2 Facsimile: +1 604-669-8803
(Name,Telephone,E-mailand/orFacsimilenumberandAddressofCompanyContactPerson)
Securities registered or to be registered pursuant to Section 12(b) of the Act:
Title of each class Name of each exchange on which registered Common Shares New York Stock Exchange
Securities registered or to be registered pursuant to Section 12(g) of the Act: None.Securities for which there is a reporting obligation pursuant to Section 15(d) of the Act: None.
Indicate the number of outstanding shares of each of the issuer’s classes of capital or common stock as of the close of the period covered by the annual report.There were 63,142,272 common shares, without par value, issued and outstanding as of December 31, 2015.Indicate by check mark if the registrant is a well-known seasoned issuer, as defined in Rule 405 of the Securities Act. ☐ YES ☒ NOIf this report is an annual or transition report, indicate by check mark if the registrant is not required to file reports pursuant to Section 13 or 15(d) of theExchange Act. ☐ YES ☒ NONote – Checking the box above will not relieve any registrant required to file reports pursuant to Section 13 or 15(d) of the Exchange Act from theirobligations under those Sections.Indicate by check mark whether the registrant (1) has filed all reports required to be filed by Section 13 or 15(d) of the Exchange Act during the preceding 12months (or for such shorter period that the registrant was required to file such reports), and (2) has been subject to such filing requirements for the past 90days. ☒ YES ☐ NOIndicate by check mark whether the registrant is a large accelerated filer, an accelerated filer, or a non-accelerated filer. See definition of “accelerated filer andlarge accelerated filer” in Rule 12b-2 of the Exchange Act.
Large accelerated filer ☐ Accelerated filer ☒ Non-accelerated filer ☐
Indicate by check mark which basis of accounting the registrant has used to prepare the financial statements included in this filing.
U.S. GAAP ☐ International Financial Reporting Standards as issued by the International Accounting Standards Board ☒ Other ☐
If “Other” has been checked in response to the previous question, indicate by check mark which financial statement item the registrant has elected to follow. ☐ Item 17 ☐ Item 18If this is an annual report, indicate by check mark whether the registrant is a shell company (as defined in Rule 12b-2 of the Exchange Act) ☐ YES ☒ NO

In 2015, we incurred losses in connection with four long-term ferro-alloy off-take agreements entered into by asubsidiary prior to its acquisition in 2014. These agreements had pricing mechanisms and fixed supply quantitiesthat did not adequately address market volatility.
These agreements contributed a loss of $9.9 million in 2015. We have terminated these off-take agreements andhave instituted additional risk controls to mitigate our exposure to this type of market volatility going forward.
For illustrative purposes, the following table sets out price movements for various ferro-alloys betweenJanuary 2015 and each of June and December 2015:
TABLE OF CONTENTS
DEAR FELLOW SHAREHOLDERS AND BUSINESS PARTNERSIn 2015, two significant challenges impacted our financial results from continuing operations. Firstly, ferro-alloyoff-take contracts with inadequate pricing mechanisms, which have since been terminated, resulted in realizedlosses in a declining price environment. Secondly, the insolvency of one of our finance and supply chain customersin February 2016 was an adjusting subsequent event which resulted in our recording credit losses in fiscal 2015.
In addition, declining prices resulted in non-cash impairments on our iron ore and hydrocarbon properties under ourdiscontinued operations.
We have taken actions to address these issues and will ensure that we learn from the lessons of 2015.
Change in Reporting Currency
Since2007,wepresentedourfinancialresultsinUnitedStatesdollars.However,aswenolongerhavesignificantassets or revenues denominated in United States dollars, combined with the fact that the majority of ourstakeholdersviewusasaCanadiancompany,wehaverevertedourpresentationcurrencybacktotheCanadiandollar.Thereisnoimpact(positiveornegative)onourfinancialpositionasaresultofthischange.OurcommonsharescontinuetobequotedinUnitedStatesdollarsontheNewYorkStockExchangeunderthesymbol“MFCB”.AllreferencestodollaramountshereinareCanadiandollarsunlessotherwisestated.
I. WHY ARE WE LATE IN REPORTING OUR 2015 RESULTSIn February 2016, one of our finance and supply chain customers filed for insolvency. A customer insolvency is anadjusting subsequent event under International Accounting Standard 10, EventsaftertheReportingPeriod, and, asa result, we had to determine an allowance for credit losses against our receivables due from the customer and itsaffiliates, the provisions under certain guarantees which we had made and the potential recoveries as atDecember 31, 2015. The recognition and measurement of these provisions was a complex process, involving asignificant degree of judgment and a high level of estimation uncertainty. This process required management tospend an extended period of time to evaluate the fact patterns, assess the collateral and reach conclusions. It is thissubsequent event and the related complex measurement issues that caused our first late filing ever.
II. CONTINUING OPERATIONS
1.Long-TermOff-TakeAgreements
PRODUCT June 2015 December 2015 Ferrosilicon 1.1 (24.5 Ferro Manganese 3.2 (12.5 Ferro Chrome (4.2 (18.9 Silicon Metal (1.7 (28.8 Ferro Molybdenum (21.1 (42.8
Source: the CRUGroup.i
LETTER TO SHAREHOLDERS
% )%% )%)% )%)% )%)% )%

After the end of fiscal 2015, in February 2016, a finance and supply chain customer filed for insolvency, which isan adjusting subsequent event for our 2015 consolidated financial statements under International FinancialReporting Standard (“IFRS”). As a result, in the fourth quarter of 2015, we recorded total credit losses andprovisions of $51.4 million related to this customer and its affiliates, which includes an allowance for tradereceivables and provisions for potential future losses.
However, we hold various collateral, including guarantees, mortgages and other mitigation securities, to recover asignificant portion of these losses. We are exercising our rights as we undertake various options to maximize ourrecoveries.
We currently expect that it is highly probable that we will recover at least $36.8 million of these losses in 2016.However, under applicable IFRS, our expected recoveries may only be recognized in our financial statementswhen there is “virtual certainty” that they will be collected. “Virtual certainty” is a very high threshold andtherefore, pursuant to IFRS, we have not recorded our expected recoveries related to such credit losses in our 2015consolidated financial statements.
This creates a timing difference between the recording of credit losses and the recognition of the associatedexpected recoveries. We believe that the most probable outcome of this timing difference is that in either thesecond or third quarter of 2016, we will recognize a gain of at least $36.8 million related to these expectedrecoveries which will flow through our profit and loss statement . In our view, this accounting result does nottruly reflect how we view these transactions from a commercial economic or risk assessment perspective.
We are the lessor under a mining lease underlying an iron ore mine in Canada. The mine had operated since 1966,but in 2015 it was closed by the operator. When the lease is terminated, we intend to re-take the mine and exerciseour contractual rights. However, these rights have been delayed due to the operator filing for relief for all of theirCanadian mines under the Companies’ Creditors Arrangement Act of Canada.
While we continue to believe that the mine presents an interesting long-term opportunity, we have emphasizedconservatism and prudence while we focus on our other efforts. As such, we initiated a rationalization process andhave reclassified the mine and our interest in another iron ore property as discontinued operations and adjusted thecarrying values to $30.0 million resulting in non-cash impairment losses of $215.6 million (before an income taxrecovery of $46.5 million) in 2015.
We have participated in the energy sector through the development, production and processing of natural gas andnatural gas liquids in Alberta, Canada.
We initiated a process to rationalize all of these interests and reclassified them as discontinued operations. In2015, we sold a 95% economic and controlling interest in our Southern Alberta hydrocarbon properties. Theproceeds of this sale consisted of nominal and contingent consideration, which may provide potential upsideshould these markets recover.
The long-term price curves of natural gas, natural gas liquids and oil declined substantially during 2015 and, as aresult, we incurred non-cash impairment losses of $196.5 million (before a reduction of income tax assets of $50.9 million) on our hydrocarbon assets.
Our hydrocarbon interests now include our Northern Alberta production and facilities, as well as certainundeveloped land and equipment. Our Northern Alberta assets are on our balance sheet at $50.0 million, net ofdecommissioning obligations, which we believe is a prudent and conservative valuation given the quality of theproperties and the potential for growth and returns once hydrocarbon markets recover.
TABLE OF CONTENTS
2.InsolvencyofaTradeFinanceandSupplyChainCustomer
III. DISCONTINUED OPERATIONS2015 was a difficult year, especially in relation to our interests in the commodity sector. During the year, wedecided to discontinue the following operations:
1.IronOre
2.Hydrocarbons
iiLETTER TO SHAREHOLDERS

Note: (1) The current ratio is calculated as current assets divided by current liabilities and the total long-term debt-to-equity ratiois calculated as total long-term debt divided by shareholders’ equity.
TABLE OF CONTENTS
IV. FINANCIAL POSTIONAs at December 31, 2015, our cash and cash equivalents decreased to $197.5 million from $344.9 million as atDecember 31, 2014, primarily as a result of the repayment of short-term borrowings and debt.
We have decreased our short-term bank borrowings to $60.1 million as at December 31, 2015, from $187.2million in the prior year.
Trade receivables and other receivables were $151.2 million and $14.7 million, respectively, as at December 31,2015, compared to $187.6 million and $26.4 million, respectively, as at December 31, 2014.
Inventories were $245.3 million as at December 31, 2015. Inventories which were contracted at fixed prices orhedged were $141.3 million as at December 31, 2015, of which $13.7 million and $127.6 million of suchinventories were initially financed by suppliers and short-term bank borrowings, respectively.
The following table highlights selected figures on our financial position as of December 31, 2015 and December 31,2014:
FINANCIAL POSITION ($ in thousands, except ratios and per share amounts) December 31, 2015 December 31, 2014 Cash and cash equivalents 197,519 344,891 Securities, current 170 290 Trade receivables 151,229 187,558 Inventories 245,345 246,611 Total current assets 785,850 1,003,259 Total current liabilities 414,562 440,773 Short-term bank borrowings 60,103 187,171 Working capital 371,288 562,486 Current ratio 1.90 2.28 Total assets 977,351 1,692,219 Total long-term debt 259,038 363,255 Total long-term debt-to-equity 0.71 0.47 Total liabilities 608,151 913,286 Shareholders’ equity 367,192 777,717 Net book value per share 5.81 12.32
Financial Highlights
Revenues for 2015 increased to $1.6 billion from $1.3 billion in 2014, primarily as a result of the consolidation ofour acquisitions in the second quarter of 2014 and an increase in our finance and supply chain volumes.
In 2015, our net loss attributable to shareholders from continuing operations was $59.5 million, or $0.94 per shareon a basic and diluted basis. This includes the above described pre-tax losses of $61.3 million related to aninsolvent customer and long-term off-takes that have been terminated.
Operating EBITDA from continuing operations is defined as earnings from continuing operations before interest,taxes, depreciation, depletion, amortization and impairment. Operating EBITDA from continuing operations is anon-IFRS financial measure and should not be considered in isolation or as a substitute for performance measuresunder IFRS. Management uses Operating EBITDA from continuing operations as a measure of our operating resultsand considers it to be a meaningful supplement to net income as a performance measure, primarily because weincur depreciation and depletion from time to time.
iiiLETTER TO SHAREHOLDERS
(1)
(1)

Note: (1) Includes net (loss) income from continuing operations attributable to non-controlling interests.
TABLE OF CONTENTS
The following table provides a reconciliation of Operating EBITDA to net income from continuing operations forthe periods indicated.
OPERATING EBITDA (LOSS) ($ in thousands) December 31, 2015 December 31, 2014 Net (loss) income (57,918 4,141 Tax expense 2,501 2,173 Finance costs 20,355 13,263 Depreciation, depletion and amortization 6,450 4,957
Operating EBITDA (loss) (28,612 24,534
Our operating EBITDA for 2015 included the following pre-tax losses, which are described above:
OFF-TAKE AND CREDIT LOSSES ($ in thousands) December 31, 2015 Long-term off-take losses (9,880 Credit losses related to an insolvent customer (51,382
Total (61,262
We expect that we will recognize a gain of at least $36.8 million related to the expected recoveries from thesecredit losses which will flow through our profit and loss statement in either the second or third quarter of2016.
Credit Lines and Facilities with Banks
We established, utilized and maintain various kinds of credit lines and facilities with banks and insurers. Most ofthese facilities are short-term. These facilities are used in our day-to-day structured solutions and supply chainbusiness. The amounts drawn under such facilities fluctuate with the kind and level of transactions beingundertaken.
As at December 31, 2015, we had credit facilities aggregating $900.8 million comprised of: (i) unsecured revolvingcredit facilities aggregating $429.6 million from banks. The banks generally charge an interest rate of inter-bankrates plus an interest margin; (ii) revolving credit facilities aggregating $116.2 million from banks for structuredsolutions, a special trade financing. The margin is negotiable when the facility is used; (iii) a specially structurednon-recourse factoring arrangement with a bank for up to a credit limit of $248.7 million for our supply chainactivities. We may factor our receivable accounts upon invoicing at the inter-bank rate plus a margin; (iv) foreignexchange credit facilities of $80.4 million with banks; and (v) secured revolving credit facilities aggregating $25.7million.
All of these facilities are either renewable on a yearly basis or usable until further notice. A substantial portion ofour credit facilities are denominated in Euros and, accordingly, such amounts may fluctuate when reported inCanadian dollars.
In addition, we have margin lines with availability at multiple brokers, which enable us to hedge approximately$138.4 million notional value.
V. VISIONGoing forward, our vision is to become a regulated trade finance institution, offering our customers and suppliers awider range of structured finance solutions including factoring, inventory, financing, forfaiting, marketing and othertypes of risk management and financing solutions.
There are significant opportunities to offer structured and trade finance and banking solutions in the markets weserve as many of our customers and suppliers do not have adequate financing alternatives and could benefit fromour services. Leveraging our vertically-integrated supply chain platform, we have insights into financingrequirements across the value chain and the ability to offer a full portfolio of structured and trade finance andbanking products will allow us to meet the needs of our business partners.
ivLETTER TO SHAREHOLDERS
(1) )
)
)))

■ structured and trade finance, including advisory services, in conjunction with export credit agencies;
■ merchant banking products and services, with and without recourse factoring;
■ forfaiting;
■ discounting of bills of exchange and promissory notes;
■ purchase financing collateralized by the product;
■ inventory financing collateralized by inventory and
■ bank guarantees, letters of credit, documentary bank guarantees/stand-by letters of credit, bills ofexchange, bills of lading, promissory notes and forwarders’ certificate of receipt facilities.
TABLE OF CONTENTS
We are making progress towards this goal:
Acquisition of MFC Merchant Bank Ltd.
In the first quarter of 2016, we completed the acquisition of BAWAG Malta Bank Ltd. (the “Bank”) and changed itsname to MFC Merchant Bank Ltd. As part of our group, the Bank will not engage in retail banking and commercialbanking, but instead will provide merchant banking and specialty banking services, focused on structured and tradefinance, to our customers, suppliers, and group members, among others. The products that the Bank will offerinclude, among others:
The Bank’s customer deposits will mainly be comprised of small and medium sized corporate clients, who may alsobe trade and structured finance customers, as well as our subsidiary companies and other related entities. Inaddition, we will integrate our existing long-standing banking relationships with the Bank to support our corporatevision.
The back office is a significant burden to a bank because it is a major driver of operating expenditures. However, inorder to maintain a variable cost structure, the Bank will outsource major back office services as well as internalfunctions such as technology, internal audit and payment services to third parties.
Changes to our Board of Directors
In the last six months, two new directors, Friedrich Hondl and Jochen Duemler joined our board of directors tosupport our strategic priorities.
Mr. Hondl is an experienced European banking executive and former member of the Supervisory Board ofOesterreichische Kontrollbank AG, the Austrian Export Credit Agency. From 2013 to 2015, Mr. Hondl was thehead of Erste Group Bank AG’s Large Corporates International Division, and from 2009 to 2012 he was the head ofInternational Corporate Relationship Management of UniCredit Bank Austria AG. He has also served as Chairmanof the Supervisory Board of Intermarket Bank AG since 2014.
Mr. Duemler was the former President and Chief Executive Officer of Euler Hermes North America, where hesupervised a team of more than 500 people to permanently protect and insure approximately US$150 billion,managed all credit insurance and bonding / surety lines, and oversaw all Euler Hermes operations in the region.From 2002 to 2010, he was a member of the Board of Management of Euler Hermes Kreditversicherung AG, andfrom 1995 to 2002 he was a Member of the Board of Management of PRISMA Kreditversicherung AG. He is amember of the German-American Chamber of Commerce (New York City), a Member of the German ExecutiveRoundtable (Washington, D.C.), and a board member of the German American Partnership Program.
We are also announcing that Michael Smith, our Managing Director, was appointed as Chairman of our board ofdirectors in March 2016.
vLETTER TO SHAREHOLDERS

■ Stakeholders are encouraged to read our entire audited financial statements and management’s discussion andanalysis for the year ended December 31, 2015 in this Annual Report on Form 20-F for a greaterunderstanding of our Company’s business and operations.
■ All stakeholders who have questions regarding the information in this Annual Report on Form 20-F may callour North American toll free line: +1 (844) 331 3343 or International callers: +1 (604) 662 8873 to book aconference call with members of our senior management. Questions may also be emailed to Rene Randall [email protected].
TABLE OF CONTENTS
VI . FUTURE
We have clear goals and are making changes, but we have to do more.
In 2015, we initiated a process to reduce our inventories and receivables, but it didn’t provide the necessary results.We have now started to implement changes with the goal of drastically reducing our inventories and receivables sowe can reallocate capital to more profitable business units. This is expected to be substantially complete by the endof 2016.
We must learn from the lessons of 2015 and ensure that we do not repeat history as we work diligently to executeour vision.
Stakeholder Communication
After feedback from our stakeholders, we have decided to change the format of our quarterly communicationfollowing our financial reporting:
Management welcomes any questions you may have and looks forward to discussing our operations, results andplans with stakeholders.
Respectfully Submitted,
Gerardo Cortina President and Chief Executive Officer
viLETTER TO SHAREHOLDERS

TABLE OF CONTENTS
Corporate information
BOARD OF DIRECTORS AUDITORS TRANSFER AGENTMichael J. Smith Chairman Director since 1987
Indrajit Chatterjee Director since 2005
Silke S. Stenger* Director since 2013
PricewaterhouseCoopers LLP Suite 700 250 Howe Street Vancouver, BC V6C 3S7 Canada Telephone: (1) 604 806 7000 www.pwc.com/ca
Computershare 480 Washington Blvd 27th Floor Jersey City, NJ 07310 USA Telephone: (1) 888 478 2338 www.computershare.com
STOCK LISTING CORPORATEDr. Shuming Zhao* Director since 2014
Gerardo Cortina Director since 2014
Friedrich Hondl* Director since 2015
New York Stock Exchange 11 Wall Street New York, NY 10005 USA Telephone: (1) 212 656 3000 Email: [email protected] Trading symbol: MFCB
MFC Bancorp Ltd. 400 Burrard Street Suite 1860 Vancouver, BC, V6C 3A6 Canada Telephone: (1) 604 683 8286 Email: [email protected]
Jochen P. Duemler Director since 2016
* MemberoftheAuditCommittee
CORPORATE WEBSITE
www.mfcbancorpltd.com
COMMERCIAL HEADQUARTERS
MFC Commodities GmbH Millennium Tower 21 Floor 94-96 Handelskai 1200 Vienna, Austria Telephone: (43) 1 240 25 0 Email: [email protected]
viiLETTER TO SHAREHOLDERS
st

TABLE OF CONTENTS
Form 20-F
TABLE OF CONTENTS
PART I 1FORWARD-LOOKING STATEMENTS 1CHANGE IN REPORTING CURRENCY 1NOTE ON FINANCIAL AND OTHER INFORMATION 2NON-IFRS FINANCIAL MEASURES 2NOTE ON NATURAL GAS AND OIL DISCLOSURE AND DEFINITIONS 2ITEM 1: IDENTITY OF DIRECTORS, SENIOR MANAGEMENT AND ADVISERS 3ITEM 2: OFFER STATISTICS AND EXPECTED TIMETABLE 3ITEM 3: KEY INFORMATION 3
A. Selected Financial Data 4B. Capitalization and Indebtedness 5C. Reasons for the Offer and Use of Proceeds 5D. Risk Factors 5
ITEM 4: INFORMATION ON THE COMPANY 15A. History and Development of the Company 15B. Business Overview 15C. Organizational Structure 18D. Property, Plants and Equipment 19
ITEM 4A: UNRESOLVED STAFF COMMENTS 22ITEM 5: OPERATING AND FINANCIAL REVIEW AND PROSPECTS 23
General 23Results of Operations 25Liquidity and Capital Resources 31Application of Critical Accounting Policies 38New Standards and Interpretations Adopted and Not Yet Adopted 40Trend Information 41Off-Balance Sheet Arrangements 41Safe Harbor 41
ITEM 6: DIRECTORS, SENIOR MANAGEMENT AND EMPLOYEES 42A. Directors and Senior Management 42B. Compensation 44C. Board Practices 46D. Employees 47E. Share Ownership 48
ITEM 7: MAJOR SHAREHOLDERS AND RELATED PARTY TRANSACTIONS 50A. Major Shareholders 50B. Related Party Transactions 50C. Interests of Experts and Counsel 51
ITEM 8: FINANCIAL INFORMATION 51A. Consolidated Statements and Other Financial Information 51
viii

TABLE OF CONTENTS
B. Significant Changes 51ITEM 9: THE OFFER AND LISTING 52
A. Offer and Listing Details 52B. Plan of Distribution 52C. Markets 52D. Selling Shareholders 52E. Dilution 52F. Expenses of the Issue 53
ITEM 10: ADDITIONAL INFORMATION 53A. Share Capital 53B. Memorandum and Articles of Association 53C. Material Contracts 54D. Exchange Controls 54E. Taxation 56F. Dividends and Paying Agents 60G. Statement by Experts 60H. Documents on Display 60I. Subsidiary Information 60
ITEM 11: QUANTITATIVE AND QUALITATIVE DISCLOSURES ABOUT MARKET RISK 61ITEM 12: DESCRIPTION OF SECURITIES OTHER THAN EQUITY SECURITIES 61
PART II 62ITEM 13: DEFAULTS, DIVIDEND ARREARAGES AND DELINQUENCIES 62ITEM 14: MATERIAL MODIFICATIONS TO RIGHTS OF SECURITY HOLDERS AND USE OF
PROCEEDS 62ITEM 15: CONTROLS AND PROCEDURES 62ITEM 16: [RESERVED] 64ITEM 16A: AUDIT COMMITTEE FINANCIAL EXPERT 64ITEM 16B: CODE OF ETHICS 64ITEM 16C: PRINCIPAL ACCOUNTANT FEES AND SERVICES 64ITEM 16D: EXEMPTIONS FROM THE LISTING STANDARDS FOR AUDIT
COMMITTEES 65ITEM 16E: PURCHASES OF EQUITY SECURITIES BY THE ISSUER AND AFFILIATED
PURCHASERS 65ITEM 16F: CHANGE IN REGISTRANT’S CERTIFYING ACCOUNTANT 65ITEM 16G: CORPORATE GOVERNANCE 66ITEM 16H: MINE SAFETY DISCLOSURE 66ITEM 17: FINANCIAL STATEMENTS 66ITEM 18: FINANCIAL STATEMENTS 67ITEM 19: EXHIBITS 137
ix

TABLE OF CONTENTS
PART I
FORWARD-LOOKING STATEMENTS
This document contains certain forward-looking information and statements, including statements relating tomatters that are not historical facts and statements of our beliefs, intentions and expectations about developments,results and events which will or may occur in the future, which constitute “forward-looking information” within themeaning of applicable Canadian securities legislation and “forward-looking statements” within the meaning of the“safe harbor” provisions of the United States, Private Securities Litigation Reform Act of 1995 , as amended,collectively referred to as “forward-looking statements”. Forward-looking statements are typically identified bywords such as “anticipate”, “could”, “project”, “should”, “expect”, “seek”, “may”, “intend”, “likely”, “will”,“plan”, “estimate”, “believe” and similar expressions suggesting future outcomes or statements regarding anoutlook or their negative or other comparable words. Also, discussions of strategy that involve risks anduncertainties share this “forward-looking” character.
Forward-looking statements are included throughout this document and include, but are not limited to, statementswith respect to: our projected revenues; markets; production, demand and prices for products and services,including commodities; trends; economic conditions; performance; business prospects; results of operations; capitalexpenditures; foreign exchange rates; derivatives; and our ability to expand our business. All such forward-lookingstatements are based on certain assumptions and analyses made by us in light of our experience and perception ofhistorical trends, current conditions and expected future developments, as well as other factors we believe areappropriate in the circumstances. These forward-looking statements are, however, subject to known and unknownrisks and uncertainties and other factors. As a result, actual results, performance or achievements could differmaterially from those expressed in, or implied by, these forward-looking statements and, accordingly, no assurancecan be given that any of the events anticipated by the forward-looking statements will transpire or occur, or if anyof them do so, what benefits will be derived therefrom. These risks, uncertainties and other factors include, amongothers, those set forth under the section entitled “ Item3:KeyInformation–D.RiskFactors”.
Although we believe that the expectations reflected in such forward-looking information and statements arereasonable, we can give no assurance that such expectations will prove to be accurate. Accordingly, readers shouldnot place undue reliance upon any of the forward-looking information and statements set out in this document. Allof the forward-looking information and statements contained in this document are expressly qualified, in theirentirety, by this cautionary statement. The various risks to which we are exposed are described in additional detailin this document under the section entitled “ Item3: Key Information – D. Risk Factors”. The forward-lookinginformation and statements are made as of the date of this document and we assume no obligation to update orrevise them except as required pursuant to applicable securities laws.
As used in this annual report, the terms “we”, “us” and “our” mean MFC Bancorp Ltd. and our subsidiaries, unlessotherwise indicated.
CHANGE IN PRESENTATION CURRENCYEffective December 31, 2015, we changed our presentation currency from the United States dollar to the Canadiandollar. We ceased to use the United States dollar as our reporting currency because we no longer have significantassets or revenues denominated in United States dollars and because we are incorporated in Canada and ourstakeholders view us as such. Prior to 2007, when we commenced reporting in United States dollars due to theconcentration of assets and income denominated in United States dollars, we used the Canadian dollar as ourreporting currency. Both current and historical financial information have been translated to Canadian dollars inaccordance with the method described under “ Item5:OperatingandFinancialReviewandProspects–ResultsofOperations” and Note 1 to our audited consolidated financial statements for the year ended December 31, 2015 forfurther information about our change in presentation currency. The change in presentation currency did not impactour financial position.
Unless otherwise indicated, all references in this document to “$” and “dollars” are to Canadian dollars, allreferences to “US$” are to United States dollars and all references to “Euro” or “€” are to the European Union Euro.
The following table sets out exchange rates, based on the Bank of Canada daily noon exchange rate, referred to asthe “Noon Rate”, for the translation of United States dollars and Euros to Canadian dollars in effect at the end of thefollowing periods, the average exchange rates during these periods (based on daily Noon Rates) and the range ofhigh and low exchange rates for these periods:
1

TABLE OF CONTENTS
Years Ended December 31,2015 2014 2013 2012 2011
($/US$)
End of period 1.3840 1.1601 1.0636 0.9949 1.0170High for period 1.1728 1.0614 0.9839 0.9710 0.9449Low for period 1.3990 1.1643 1.0697 1.0418 1.0604Average for period 1.2787 1.1045 1.0299 0.9996 0.9891
($/€)End of period 1.5029 1.4038 1.4655 1.3118 1.3193High for period 1.3111 1.3927 1.2859 1.2153 1.2847Low for period 1.5298 1.5549 1.4724 1.3446 1.4305Average for period 1.4182 1.4671 1.3681 1.2850 1.3767
On April 29, 2016, the Noon Rate for the translation of United States dollars and Euros to Canadian dollars wereUS$1.00 = $1.2549 and €1.00 = $1.4356, respectively.
NOTE ON FINANCIAL AND OTHER INFORMATION
Unless otherwise stated, all financial information presented herein has been prepared in accordance withInternational Financial Reporting Standards as issued by the International Accounting Standards Board, referred toas “IFRS” and the “IASB”, respectively, which may not be comparable to financial data prepared by many U.S.companies.
Due to rounding, numbers presented throughout this document may not add up precisely to the totals we provideand percentages may not precisely reflect the absolute figures.
All websites referred to herein are inactive textual references only, meaning that the information contained on suchwebsites is not incorporated by reference herein and you should not consider information contained on suchwebsites as part of this document unless expressly specified.
NON-IFRS FINANCIAL MEASURES
This document includes “non-IFRS financial measures”, that is, financial measures that either exclude or includeamounts that are not excluded or included in the most directly comparable measure calculated and presented inaccordance with IFRS. Specifically, we make use of the non-IFRS measure “Operating EBITDA from continuingoperations”.
Operating EBITDA from continuing operations is defined as earnings from continuing operations before interest,taxes, depreciation, depletion, amortization and impairment. Our management uses Operating EBITDA fromcontinuing operations as a measure of our operating results and considers it to be a meaningful supplement to netincome as a performance measurement, primarily because we incur significant depreciation and depletion and theexclusion of impairment losses in Operating EBITDA from continuing operations eliminates the non-cash impact.
Operating EBITDA from continuing operations is used by investors and analysts for the purpose of valuing anissuer. The intent of Operating EBITDA from continuing operations is to provide additional useful information toinvestors and the measure does not have any standardized meaning under IFRS. Accordingly, this measure shouldnot be considered in isolation or used in substitute for measures of performance prepared in accordance with IFRS.Other companies may calculate Operating EBITDA from continuing operations differently. For a reconciliation ofOperating EBITDA from continuing operations to net income from continuing operations, please see “ Item 5:OperatingandFinancialReviewandProspects–ResultsofOperations”.
NOTE ON NATURAL GAS AND OIL DISCLOSURE AND DEFINITIONS
Our discontinued operations include certain natural gas and oil interests located in Alberta, Canada. On March 15,2013, we were granted an exemption order by applicable Canadian securities regulators from the requirements ofCanadian National Instrument 51-101 – StandardsofDisclosureforOilandGasActivities, referred to as “NI 51-101”. The exemption permits us to prepare oil and gas disclosure in accordance with the rules of the SEC. Inaccordance with the exemption, proved and probable reserves data and certain
2

TABLE OF CONTENTS
other disclosures with respect to our natural gas and related activities in this document have been prepared inaccordance with SEC requirements and definitions and, accordingly, may differ from corresponding informationotherwise required by NI 51-101. Accordingly, such disclosures may not be comparable to those prepared by otherCanadian reporting issuers.
NI 51-101 prescribes a relatively comprehensive set of disclosures in respect of hydrocarbon reserves and otherdisclosures about related activities. The SEC also prescribes an extensive set of disclosures but instructs reportingcompanies to remain flexible in their disclosure, where appropriate, in order to provide meaningful disclosure in thecircumstances. Among other differences, the SEC requirements provide for the use of pricing based on a historic12-month average for reserves estimation and disclosure, whereas NI 51-101 requires the evaluation of oil and gasreserves to be based on a forecast of economic conditions.
Where applicable, barrels of oil equivalent amounts, referred to as “boe”, have been calculated using a conversionratio of six thousand cubic feet of natural gas to one barrel of oil which is based on an energy equivalencyconversion method primarily applicable at the burner tip and does not represent a value equivalency at the wellhead.Where applicable, boe amounts including sulphur have been calculated using a conversion ratio of one ton ofsulphur to one barrel of oil. Boes may be misleading, particularly if used in isolation. In addition, the followingindustry specific terms are utilized in this document: (i) bbl/d– barrels per day; (ii) boe/d– barrels of oil equivalentper day; (iii) developedreserves– reserves that can be expected to be recovered through existing wells with existingequipment and operating methods or in which the cost of the required equipment is relatively minor compared tothe cost of a new well; (iv) mbbl– thousand barrels; (v) mboe– thousand barrels of oil equivalent; (vi) mcf/d–thousand cubic feet per day; (vii) mmcf– million cubic feet; (viii) netacresor netwells– the sum of fractionalworking interests owned by us in gross acres or gross wells, as applicable; (ix) NGLor NGLs– natural gas liquid ornatural gas liquids, which are naturally occurring substances found in natural gas, including ethane, butane,isobutane, propane and natural gasoline, that can be collectively removed from produced natural gas, separated intothese substances and sold; (x) probablereserves– those additional reserves that are less certain to be recovered thanproved reserves. It is equally likely that the actual remaining quantities recovered will be greater or less than thesum of the estimated proved plus probable reserves; (xi) producingwell– a well that is not a dry well. Productivewells include producing wells and wells that are mechanically capable of production; (xii) provedreserves– thosequantities of natural gas, NGL and oil, which, by analysis of geoscience and engineering data, can be estimated withreasonable certainty to be economically producible; (xiii) undevelopedreserves– reserves of any category that areexpected to be recovered from new wells on undrilled acreage or from existing wells where a relatively majorexpenditure is required for recompletion; and (xiv) workinginterest– the interest in a property that gives the ownerthat share of production from the property. A working interest owner bears that share of the costs of exploration,development and production in return for a share of production. Working interests are typically burdened byoverriding royalty interests or other interests.
ITEM 1: IDENTITY OF DIRECTORS, SENIOR MANAGEMENT AND ADVISERS
Not applicable.
ITEM 2: OFFER STATISTICS AND EXPECTED TIMETABLE
Not applicable.
ITEM 3: KEY INFORMATION
A. Selected Financial DataThe following table summarizes selected consolidated financial data prepared in accordance with IFRS for the fivefiscal years ended December 31, 2015. Effective December 31, 2015, we changed our reporting currency to theCanadian dollar. Our consolidated financial statements as at and for each of the years in the four-year period endedDecember 31, 2014 were reported using the United States dollar. With the change in reporting currency, allcomparative financial information has been recast from United States dollars to Canadian dollars to reflect ourconsolidated financial statements as if they had been historically reported in Canadian dollars, consistent with IAS21, TheEffectsofChangesinForeignExchangeRates, referred to as “IAS 21”. Revenues and costs of sales andservices for prior periods have been reclassified to present certain transactions on a net basis. This had no impact onour net income, net income from operations, cash flow statements or financial position for such periods. Please see“ Item 5: Operating and Financial Review and Prospects — Prior Periods ”. The information in the table wasextracted from the
3

(1) We commenced consolidation of the operations of two acquired supply chain companies from March 31 and April 1, 2014,respectively.
(2) We commenced consolidation of the operations of MFC Energy Corporation, referred to as “MFC Energy”, from September 7,2012.
(3) Revenues and costs of sales and services for these years have been reclassified to present certain transactions on a net basis. Thishad no impact on our net income, net income from operations, cash flow statements or financial position for such years. Please see“ Item5:OperatingandFinancialReviewandProspects—PriorPeriods” for further information.
(4) Includes losses of $51.4 million related to a customer that filed for insolvency in February 2016 and $9.9 million on long-term off-take agreements entered into by a subsidiary acquired in 2014, which have since been terminated. Please see “ Item5:OperatingandFinancialReviewandProspects — ResultsofOperations” for further information.
(5) Includes a total non-cash impairment loss and write-down of $48.0 million (net of income tax recovery), or $0.77 per share on abasic and diluted basis, on a subsidiary in India, which was subsequently sold in 2013.
(6) Attributable to our shareholders.(7) Includes non-cash impairments of $196.5 million, before a reduction of deferred tax assets of $50.9 million, and $215.6 million,
before a deferred income tax recovery of $46.5 million, respectively, recognized on our hydrocarbon properties and iron oreinterests.
(8) Includes a non-cash impairment loss on our hydrocarbon properties of $33.2 million, before a deferred income tax recovery of$8.4 million.
(9) Includes a non-cash impairment loss on our hydrocarbon properties of $6.5 million, before an income tax recovery of $1.7million.
(10) Includes a bargain purchase of $212.5 million, or $3.40 per share on a basic and diluted basis, primarily in connection with ouracquisition of MFC Energy. The bargain purchase arose as the consideration under the transaction was less than the fair value ofthe net identifiable assets acquired.
TABLE OF CONTENTS
detailed consolidated financial statements and related notes included elsewhere in this or previously filed annualreports on Form 20-F, and should be read in conjunction with such financial statements and with the informationappearing under the heading “ Item5:OperatingandFinancialReviewandProspects”.
The results of discontinued operations have been re-presented for prior periods and certain prior period results havebeen reclassified to conform to current presentation. Please see “ Item 5: Operating and Financial Review andProspects–DiscontinuedOperations” for further information.
Selected Financial Data (Stated in Canadian dollars in accordance with IFRS)
(in thousands, other than per share amounts)
2015 2014 2013 2012 2011 (Restated )
Gross revenues $ 1,579,702 $ 1,286,324 $ 621,085 $ 386,273 $ 452,724(Loss) income from operations (55,129 12,770 6,221 (52,710 (6,388(Loss) earnings from continuing
operations (59,544 2,783 4,324 (41,570 (8,037Net (loss) income from continuing
operations per shareBasic (0.94 0.04 0.07 (0.67 (0.13Diluted (0.94 0.04 0.07 (0.67 (0.13
Net (loss) income from discontinuedoperations (428,086 (3,465 5,408 238,154 19,712
(Loss) earnings per share fromdiscontinued operations:Basic (6.78 (0.05 0.09 3.81 0.32Diluted (6.78 (0.05 0.09 3.81 0.32
Net (loss) income (487,630 (682 9,732 196,584 11,675Net (loss) income per share:
Basic (7.72 (0.01 0.16 3.14 0.19Diluted (7.72 (0.01 0.16 3.14 0.19
Total assets 977,351 1,692,219 1,402,460 1,353,684 873,558Net assets 369,200 778,933 744,245 733,018 558,478Long-term debt, less current portion 174,333 297,157 201,947 31,012 20,493Shareholders’ equity 367,192 777,717 744,063 726,862 555,916Capital stock, net of treasury stock 358,831 358,570 357,322 357,322 357,355Weighted average number of common
stock outstanding, diluted 63,142 62,957 62,757 62,555 62,561Cash dividends paid to shareholders 4,388 12,486 15,353 13,789 12,389
Notes:
4
(1) (2)
(3)
(3) (3) (3) (3)
) (4) ) ( 5 ) )
( 6 ) ) (4) ) ( 5 ) )
) (4) ) ( 5 ) )) (4) ) ( 5 ) )
( 6 ) ) ( 7 ) ) ( 8 ) ( 9 ) ( 10 )
) ( 7 ) ) ( 8 ) ( 9 ) ( 10 )
) ( 7 ) ) ( 8 ) ( 9 ) ( 10 )( 6 ) ) ( 4 ) (7) ) ( 8 ) ( 9 ) ( 5 )( 10 )
) ( 4 ) (7) ) ( 8 ) ( 9 ) ( 5 )( 10 )
) ( 4 ) (7) ) ( 8 ) ( 9 ) ( 5 )( 10 )

TABLE OF CONTENTS
B. Capitalization and Indebtedness
Not applicable.
C. Reasons for the Offer and Use of Proceeds
Not applicable.
D. Risk Factors
An investment in our common shares involves a number of risks. You should carefully consider the following risksand uncertainties in addition to other information in this annual report on Form 20-F in evaluating our company andour business before making any investment decisions. Our business, operating and financial condition could beharmed due to any of the following risks, which include risks that are primarily or partially related to ourdiscontinued operations.
Risk Factors Relating to Our Business – Risks Relating to Continuing Operations
Our financial results may fluctuate substantially from period to period.
We expect our business to experience significant periodic variations in its revenues and results of operations in thefuture. These variations may be attributed in part to the fact that our trade finance and services revenues are oftenearned upon the successful completion of a transaction, the timing of which is uncertain and beyond our control. Inmany cases, we may receive little or no payment for engagements that do not result in the successful completion ofa transaction. Additionally, through our trade finance and services business, we seek to acquire undervalued assetswhere we can use our experience and management to realize upon the value. Often, we will hold or build uponthese assets over time and we cannot predict the timing of when these assets’ values may be realized. As a result,we are unlikely to achieve steady and predictable earnings, which could in turn adversely affect our financialcondition and results of operations.
Our earnings and, therefore, our profitability may be affected by price volatility in our various products.
The majority of our revenue from our finance and supply chain business is derived from the sale of products whichinclude metals and other materials. As a result, our earnings are directly related to the prices of these underlyingproducts. There are many factors influencing the price of these products, including: expectations for inflation;global and regional demand and production; political and economic conditions; and production costs in majorproducing regions. These factors are beyond our control and are impossible for us to predict. Changes in the pricesof our products may adversely affect our operating results.
A weak global economy may adversely affect our business and financial results and have a material adverseeffect on our liquidity and capital resources.
Our business, by its nature, does not produce predictable earnings and it may be materially affected by conditions inthe global financial markets and economic conditions generally.
Over the past eight years, financial systems worldwide have experienced difficult credit and liquidity conditions anddisruptions leading to reduced liquidity, greater volatility (such as volatility in spreads) and, in some cases, a lack ofprice transparency on interbank lending rates. Uncertainties remain concerning the outlook and the future economicenvironment despite recent improvements in certain segments of the global economy, including Europe. There canbe no assurance that economic conditions in these segments will continue to improve or that the global economiccondition as a whole will improve significantly or at all. Such economic uncertainties could have a negative impacton our business and results of operations. The acute economic risks in the eurozone are being addressed by on-going policy initiatives, and the prospects for many of the European economies are improving. Investors remaincautious and a slowing or failing of the economic recovery would likely aggravate the adverse effects of difficulteconomic and market conditions on us and on others in the finance and supply chain industry. In particular, we mayface, among others, the following risks related to any future economic downturn: increased regulation of theoperations of our newly acquired bank subsidiary; compliance with such regulation may increase the costs of ourbanking operations, may affect the pricing of our products and services, and limit our ability to pursue businessopportunities; reduced demand for our products and services; inability of our customers to
5

TABLE OF CONTENTS
comply fully or in a timely manner with their existing obligations; and the degree of uncertainty concerningeconomic conditions may adversely affect the accuracy of our estimates, which may, in turn, impact the reliabilityof the process and the sufficiency of our loan loss allowances.
Continued or worsening disruption and volatility in the global financial markets could have a material adverseeffect on us, including our ability to access capital and liquidity on financial terms acceptable to us, if at all. If all orsome of the foregoing risks were to materialize, this could have a material adverse effect on us.
Global prices for our products are influenced strongly by international demand and global economic conditions.Uncertainties or weaknesses in global economic conditions could adversely affect our business and negativelyimpact our financial results. In addition, the current level of international demand for certain of our products isdriven largely by industrial growth in China. If the economic growth rate in China slows for an extended period oftime, or if another global economic downturn were to occur, we would likely see decreased demand for suchproducts and decreased prices, resulting in lower revenue levels and decreasing margins. We are not able to predictwhether the global economic conditions will improve or worsen and the resultant impact it may have on ouroperations and the industry in general going forward.
Market deterioration and weakness can result in a material decline in the number and size of the transactions thatwe execute for our own account and for our clients and to a corresponding decline in our revenues. Any marketweakness can further result in losses to the extent that we own assets in such market.
The finance and supply chain business is highly competitive.
All aspects of the finance and supply chain business are highly competitive and we expect them to remain so.
Our competitors include merchant and investment banks, brokerage firms, commercial banks, private equity firms,hedge funds, financial advisory firms and natural resource and mineral royalty companies. Many of our competitorshave substantially greater capital and resources, including access to supply, than we do. We believe that theprincipal factors affecting competition in our business include transaction execution, our products and services,client relationships, reputation, innovations, credit worthiness and price. We have experienced price competition insome of our trading business.
The scale of our competitors has increased in recent years as a result of substantial consolidation. These firms havethe ability to offer a wider range of products than we do, which may enhance their competitive position. They alsohave the ability to support their business with other financial services such as commercial lending in an effort togain market share, which has resulted, and could further result, in pricing pressure on our businesses.
If we are unable to compete effectively with our competitors, our business and results of operations will beadversely affected.
During the year ended December 31, 2015, none of our customers accounted for more than 10% of our revenues.However, the loss of key customers, due to competitive conditions or otherwise, may adversely affect our results ofoperations.
If the fair values of our long-lived assets fall below our carrying values, we may be required to record non-cashimpairment losses that could have a material impact on our results of operations.
We review the carrying value of long-lived assets for impairment when events or changes in circumstances indicatethat the carrying amount of the assets may not be recoverable. Should the markets for our products deteriorate,should we decide to invest capital differently or should other cash flow assumptions change, it is possible that wewill be required to record non-cash impairment losses in the future that could have a material adverse effect on ourresults of operations.
The profitability of our finance and supply chain operations depends, in part, on the availability of adequatesources of supply.
Our finance and supply chain business relies on, among other things, numerous outside sources of supply for ouroperations. These suppliers generally are not bound by long-term contracts and will have no obligation to provideproducts to us in the future. In periods of low industry prices, suppliers may elect to hold inventory to wait forhigher prices or intentionally slow their activities. If a substantial number of suppliers cease selling to us, we will beunable to source and/or execute transactions at desired levels and our results of operations and financial conditioncould be materially adversely affected.
6

TABLE OF CONTENTS
We may face a lack of suitable acquisition, merger or other proprietary investment candidates, which may limitour growth.
In order to grow our business, we may seek to acquire, merge with or invest in new companies or opportunities. Ourfailure to make acquisitions or investments may limit our growth. In pursuing acquisition and investmentopportunities, we face competition from other companies having similar growth and investment strategies, many ofwhich may have substantially greater resources than us. Competition for these acquisitions or investment targetscould result in increased acquisition or investment prices, higher risks and a diminished pool of businesses, servicesor products available for acquisition or investment.
Strategic investments or acquisitions and joint ventures, or our entry into new business areas, may result inadditional risks and uncertainties in our business.
We have grown and intend to continue to grow our business both through internal expansion and through strategicinvestments, acquisitions or joint ventures. When we make strategic investments or acquisitions or enter into jointventures, we expect to face numerous risks and uncertainties in combining or integrating the relevant businessesand systems, including the need to combine accounting and data processing systems and management controls andto integrate relationships with customers and business partners.
Acquisitions also frequently result in the recording of goodwill and other intangible assets, which are subject topotential non-cash impairments in the future that could have a material adverse effect on our operating results.Furthermore, the costs of integrating acquired businesses (including restructuring charges associated with theacquisitions, as well as other related costs, such as accounting, legal and investment banking fees) couldsignificantly impact our operating results.
Although we perform due diligence on the businesses we purchase, in light of the circumstances of eachtransaction, an unavoidable level of risk remains regarding the actual condition of these businesses. We may not beable to ascertain the value or understand the potential liabilities of the acquired businesses and their operations untilwe assume operating control of these businesses.
Furthermore, any acquisitions of businesses or facilities could entail a number of risks, including, among others:problems with the effective integration of operations; inability to maintain key pre-acquisition businessrelationships; increased operating costs; exposure to substantial unanticipated liabilities; difficulties in realizingprojected efficiencies, synergies and cost savings; the risks of entering markets in which we have limited or no priorexperience; and the possibility that we may be unable to recruit additional managers with the necessary skills tosupplement the management of the acquired businesses.
In addition, geographic and other expansions, acquisitions or joint ventures may require significant managerialattention, which may be diverted from our other operations. If we are unsuccessful in overcoming these risks, ourbusiness, financial condition or results of operations could be materially and adversely affected.
Our finance and supply chain activities are subject to counterparty risks associated with the performance ofobligations by our counterparties and suppliers.
Our business is subject to commercial risks, which include counterparty risk, such as failure of performance by oursuppliers and failure of payment by our trading customers in our finance and supply chain business. We seek toreduce the risk of supplier non-performance by requiring credit support from creditworthy financial institutionswhere appropriate. We attempt to reduce the risk of non-payment by customers or other counterparties by imposinglimits on open accounts extended to creditworthy customers and imposing credit support requirements for othercustomers. Nevertheless, we are exposed to the risk that parties owing us or our clients and other financialintermediaries may default on their obligations to us due to bankruptcy, lack of liquidity, operational failure or otherreasons. These counterparty obligations may arise, for example, from placing deposits, the extension of credit intrading and investment activities and participation in payment, securities and supply chain transactions on ourbehalf and as an agent on behalf of our clients. If any such customers or counterparties default on their obligations,our business, results of operations, financial condition and cash flow could be adversely affected.
Larger and more frequent capital commitments in our finance and supply chain business increase the potentialfor significant losses.
We may enter into large transactions in which we commit our own capital as part of our finance and supply chainbusiness to facilitate client trading activities. The number and size of these large transactions may materially affectour results of operations in a given period. Market fluctuations may also cause us to incur
7

TABLE OF CONTENTS
significant losses from our trading activities. To the extent that we own assets (i.e., have long positions), a downturnin the value of those assets or in the markets in which those assets are traded could result in losses. Conversely, tothe extent that we have sold assets we do not own (i.e., have short positions) in any of those markets, an upturn inthose markets could expose us to potentially large losses as we attempt to cover our short positions by acquiringassets in a rising market.
We are subject to transaction risks that may have a material adverse effect on our business, results of operations,financial condition and cash flow.We manage transaction risks through allocating and monitoring our capital investments in circumstances where therisk to our capital is minimal, carefully screening clients and transactions and engaging qualified personnel tomanage transactions. Nevertheless, transaction risks can arise from, among other things, our finance and supplychain activities. These risks include market and credit risks associated with our trade finance and servicesoperations. We intend to make investments in highly unstructured situations and in companies undergoing severefinancial distress and such investments often involve severe time constraints. These investments may expose us tosignificant transaction risks. An unsuccessful investment may result in the total loss of such investment and mayhave a material adverse effect on our business, results of operations, financial condition and cash flow.
Our risk management strategies may leave us exposed to unidentified or unanticipated risks that could impactour risk management strategies in the future and could negatively affect our results of operations and financialcondition.We use a variety of instruments and strategies to manage exposure to various types of risks. For example, we usederivative foreign exchange contracts to manage our exposure and our clients’ exposure to foreign currencyexchange rate risks. If any of the variety of instruments and strategies we utilize to manage our exposure to varioustypes of risk are not effective, we may incur losses. Many of our strategies are based on historical trading patternsand correlations. However, these strategies may not be fully effective in mitigating our risk exposure in all marketenvironments or against all types of risk. Unexpected market developments may affect our risk managementstrategies and unanticipated developments could impact our risk management strategies in the future.
Derivative transactions may expose us to unexpected risk and potential losses.We, from time to time, enter into derivative transactions that require us to deliver to the counterparty an underlyingsecurity, loan or other obligation in order to receive payment. Such derivative transactions may expose us tounexpected market, credit and operational risks that could cause us to suffer unexpected losses. Severe declines inasset values, unanticipated credit events or unforeseen circumstances may create losses from risks not appropriatelytaken into account in the structuring and/or pricing of a derivative transaction. In a number of cases, we may nothold the underlying security, loan or other obligation and may have difficulty obtaining, or be unable to obtain, theunderlying security, loan or other obligation through the physical settlement of other transactions. As a result, weare subject to the risk that we may not be able to obtain the security, loan or other obligation within the requiredcontractual time frame for delivery. This could cause us to forfeit the payments due to us under these contracts orresult in settlement delays with the attendant credit and operational risk as well as increased costs to us.
The operations of our newly acquired bank subsidiary are subject to regulation which could adversely affect ourbusiness and operations.The operations of MFC Merchant Bank Limited, referred to as “bank subsidiary”, are subject to a number ofdirectives and regulations, which materially affect our businesses. The statutes, regulations and policies to which weare subject may be changed at any time. In addition, the interpretation and the application by regulators of the lawsand regulations to which we are subject may also change from time to time. Extensive legislation affecting thefinancial services industry has recently been adopted in Europe that directly or indirectly affects our business,including in Malta and other jurisdictions, and regulations are in the process of being implemented. The manner inwhich those laws and related regulations are applied to the operations of credit institutions is still evolving. Anylegislative or regulatory actions and any required changes to our business operations resulting from such legislationand regulations could result in significant loss of revenue, limit our ability to pursue business opportunities in whichwe might otherwise consider engaging or provide certain products and services, affect the value of assets that wehold, require us to increase our prices and therefore reduce demand for our financial products, impose additionalcompliance and other costs on us or otherwise adversely affect our businesses. Accordingly, there can be noassurance that future changes in regulations or in their interpretation or application will not adversely affect us.
8

TABLE OF CONTENTS
The regulations which most significantly affect our newly acquired bank subsidiary, or which could mostsignificantly affect it in the future, relate to capital requirements, liquidity and the funding and development of abanking union in the European Union, including the Capital Requirements Directive Framework and otherdirectives which address minimum capital requirements for credit institutions. The Capital Requirements Directive,through which the European Union began implementing the Basel III capital reforms, among other things, requiresregulatory reporting of “large exposures”, which are generally exposures to a client or group of connected clients inexcess of 10% of the Bank’s eligible capital base and such large exposures cannot be greater than 25% of the Bank'seligible capital base, after taking into account risk mitigation.
The operations of our newly acquired bank subsidiary are exposed to risks faced by other financial institutions.The operations of our newly acquired bank subsidiary may involve transactions with counterparties in the financialservices industry, including commercial banks, investment banks and other institutional clients. Defaults by, andeven rumours or questions about the solvency of certain financial institutions and the financial services industrygenerally, have led to market-wide liquidity problems and could lead to losses or defaults by other institutions. Wemay enter into transactions that could expose us to significant credit risk in the event of default by one of oursignificant counterparties. A default by a significant financial counterparty, or liquidity problems in the financialservices industry generally, could have a material adverse effect on us.
Any failure to remain in compliance with sanctions, anti-money laundering laws or other applicable regulationsin the jurisdictions in which we operate could harm our reputation and/or cause us to become subject to fines,sanctions or legal enforcement, which could have an adverse effect on our business, financial condition andresults of operations.Our finance and supply chain business has adopted policies and procedures respecting compliance with sanctionsand anti-money laundering laws and our banking subsidiary has adopted various policies and procedures to ensurecompliance with specific laws applicable to it, including internal controls and “know-your-customer” proceduresaimed at preventing money laundering and terrorism financing; however, participation of multiple parties in anygiven trade finance transaction can make the process of due diligence difficult. Further, because trade finance canbe more document-based than other banking activities, it is susceptible to documentary fraud, which can be linkedto money laundering, terrorism financing, illicit activities and/or the circumvention of sanctions or other restrictions(such as export prohibitions, licensing requirements or other trade controls). While we are alert to high-risktransactions, we are also aware that efforts, such as forgery, double invoicing, partial shipments of goods and use offictitious goods, may be used to evade applicable laws and regulations. If our policies and procedures areineffective in preventing third parties from using our finance operations as a conduit for money laundering orterrorism financing without our knowledge, our reputation could suffer and/or we could become subject to fines,sanctions or legal action (including being added to any “blacklists” that would prohibit certain parties fromengaging in transactions with us, including our banking subsidiary), which could have an adverse effect on ourbusiness, financial condition and results of operations. In addition, amendments to sanctions, anti-money launderinglaws or other applicable laws or regulations in countries in which we operate could impose additional complianceburdens on our operations.
Fluctuations in interest rates and foreign currency exchange rates may affect our results of operations andfinancial condition.Fluctuations in interest rates may affect the fair value of our financial instruments sensitive to interest rates. Anincrease or decrease in market interest rates may result in changes to the fair value of our fixed interest ratefinancial instrument liabilities, thereby resulting in a reduction in the fair value of our equity. Similarly, fluctuationsin foreign currency exchange rates may affect the fair value of our financial instruments sensitive to foreigncurrency exchange rates.
Our operations and infrastructure may malfunction or fail.Our business is highly dependent on our ability to process, on a daily basis, a number of transactions across diversemarkets and the transactions we process have become increasingly complex. The inability of our systems toaccommodate an increasing volume of transactions could also constrain our ability to expand our businesses. If anyof these systems do not operate properly or are disabled, or if there are other shortcomings or failures in our internalprocesses, people or systems, we could suffer non-cash impairments, financial loss, a disruption of our businesses,liability to clients, regulatory intervention or reputational damage.
9

TABLE OF CONTENTS
Our finance and supply chain operations are subject to environmental laws and regulations that may increasethe costs of doing business and may restrict such operations.
Supply chain operations present environmental risks and hazards and are subject to environmental regulationpursuant to a variety of government laws and regulations. These regulations mandate, among other things, themaintenance of air and water quality standards and land reclamation. They also set forth limitations on thegeneration, transportation, storage and disposal of solid and hazardous waste. Compliance with such laws andregulations can require significant expenditures, and a breach may result in the imposition of fines and penalties,which may be material. Environmental legislation is evolving in a manner expected to result in stricter standardsand enforcement, larger fines and liability and potentially increased capital expenditures and operating costs. Anybreach of environmental legislation by the operator of properties underlying our interests or by us, as an owner oroperator of a property, could have a material impact on the viability of the relevant property and impair the revenuederived from the owned property or applicable royalty or other interest, which could have a material adverse effecton our results of operations and financial condition. Further, environmental hazards may exist on the properties onwhich we hold interests, which are unknown to us at present and have been caused by previous or existing ownersor operators of the properties.
Failure to comply with applicable laws, regulations or permitting requirements may result in enforcement actionsthereunder, including orders issued by regulatory or judicial authorities causing operations to cease or be curtailedand may include corrective measures requiring capital expenditures, installation of additional equipment orremedial actions. Parties engaged in resource operations or in the exploration or development of resource propertiesmay also be required to compensate those suffering loss or damage by reason of the mining activities and may besubject to civil or criminal fines or penalties imposed for violations of applicable laws or regulations.
We may not be fully insured against certain environmental risks, either because such insurance is not available orbecause of high premium costs. In particular, insurance against risks from environmental pollution occurring overtime, as opposed to sudden and catastrophic damages, is not available on economically reasonable terms.Accordingly, our properties may be subject to liability due to hazards that cannot be insured against or that have notbeen insured against due to prohibitive premium costs or for other reasons.
There can be no assurance that we will be able to obtain adequate financing in the future or that the terms ofsuch financing will be favourable and, as a result, we may have to raise additional capital through the issuanceof additional equity, which will result in dilution to our shareholders.
There can be no assurance that we will be able to obtain adequate financing in the future or that the terms of suchfinancing will be favourable. Failure to obtain such additional financing could result in delay or indefinitepostponement of further business activities. We may require new capital to grow our business and there are noassurances that capital will be available when needed, if at all. It is likely such additional capital will be raisedthrough the issuance of additional equity, which would result in dilution to our shareholders.
Limitations on our access to capital could impair our liquidity and our ability to conduct our businesses.
Liquidity, or ready access to funds, is essential to companies engaged in our businesses. Failures of financial firmshave often been attributable in large part to insufficient liquidity. Liquidity is of particular importance to our financeand supply chain business and perceived liquidity issues may affect our clients’ and counterparties’ willingness toengage in transactions with us. Our liquidity could be impaired due to circumstances that we may be unable tocontrol, such as a general market disruption or an operational problem that affects our clients, counterparties, ourlenders or us. Further, our ability to sell assets may be impaired if other market participants are seeking to sellsimilar assets at the same time.
Our existing and future financing arrangements that contain operating and financial restrictions may restrictour business and financing activities.
The terms and conditions of our debt agreements and future financial obligations may impose, among other things,operating and financial restrictions on us. For example, they may, among other things, prohibit or otherwise limitour ability to: enter into other financing arrangements; incur additional indebtedness; create or permit liens on ourassets; make investments; change the general nature of our business; utilize the proceeds of dispositions; and makecapital expenditures. If we are unable to comply with the terms and conditions in our current or future financingagreements, a default could occur under the terms of those agreements. Our ability to comply with these terms andconditions, including meeting
10

TABLE OF CONTENTS
financial ratios and tests, is dependent on our future performance and may be affected by events beyond our control.If a default occurs under current or future financing agreements and we do not obtain a corresponding waiver oramendment to the underlying agreement, lenders could terminate their commitments to lend or accelerate ourobligations thereunder and declare all amounts borrowed due and payable. If any of these events occur, we may beunable to find alternative financing on acceptable terms or at all.
We may substantially increase our debt in the future.It may be necessary for us to obtain financing with banks or financial institutions to provide funds for workingcapital, capital purchases, potential acquisitions and business development. Interest costs associated with any debtfinancing may adversely affect our profitability. Further, the terms on which amounts may be borrowed – includingstandard financial covenants regarding the maintenance of financial ratios, the prohibition against engaging inmajor corporate transactions or reorganizations and the payment of dividends – may impose additional constraintson our business operations and our financial strength.
As a result of our global operations, we are exposed to political, economic, legal, operational and other risks thatcould adversely affect our business, results of operations, financial condition and cash flow.In conducting our business in major markets around the world, we are subject to political, economic, legal,operational and other risks that are inherent in operating in other countries. These risks range from difficulties insettling transactions in emerging markets to possible nationalization, expropriation, price controls and otherrestrictive governmental actions, and terrorism. We also face the risk that exchange controls or similar restrictionsimposed by foreign governmental authorities may restrict our ability to convert local currency received or held byus in their countries into Swiss francs, Canadian dollars, Euros or other hard currencies or to take those othercurrencies out of those countries. If any of these risks become a reality, our business, results of operations, financialcondition and cash flow could be negatively impacted.
We are exposed to litigation risks in our business that are often difficult to assess or quantify and we could incursignificant legal expenses every year in defending against litigation.We are exposed to legal risks in our business and the volume and amount of damages claimed in litigation againstfinancial intermediaries are increasing. These risks include potential liability under securities or other laws formaterially false or misleading statements made in connection with securities and other transactions, potentialliability for advice we provide to participants in corporate transactions and disputes over the terms and conditions ofcomplex trading arrangements. We also face the possibility that counterparties in complex or risky tradingtransactions will claim that we improperly failed to inform them of the risks involved or that they were notauthorized or permitted to enter into such transactions with us and, accordingly, that their obligations to us are notenforceable. During a prolonged market downturn, we expect these types of claims to increase. We are also exposedto legal risks in our trade finance and proprietary investing activities.
We seek to invest in undervalued businesses or assets often as a result of financial, legal, regulatory or other distressaffecting them. Investing in distressed businesses and assets can involve us in complex legal issues relating topriorities, claims and other rights of stakeholders. These risks are often difficult to assess or quantify and theirexistence and magnitude often remains unknown for substantial periods of time. We may incur significant legal andother expenses in defending against litigation involved with any of these risks and may be required to paysubstantial damages for settlements and/or adverse judgments. Substantial legal liability or significant regulatoryaction against us could have a material adverse effect on our financial condition and results of operations.
We rely significantly on the skills and experience of our executives and the loss of any of these individuals mayharm our business.Our future success depends to a significant degree on the skills, experience and efforts of our executives and theloss of their services may compromise our ability to effectively conduct our business. We do not maintain “keyperson” insurance in relation to any of our employees.
We may experience difficulty attracting and retaining qualified management and technical personnel toefficiently operate our business and the failure to operate our business effectively could have a material adverseeffect on our profitability, financial condition and results of operations.We are dependent upon the continued availability and commitment of our management, whose contributions toimmediate and future operations are of significant importance. The loss of any such
11

TABLE OF CONTENTS
management could negatively affect our business operations. From time to time, we will also need to identify andretain additional skilled management and specialized technical personnel to efficiently operate our business. Thenumber of persons skilled in the acquisition, exploration and development of royalties and interests in naturalresource properties is limited, and competition for such persons is intense. Recruiting and retaining qualifiedpersonnel is critical to our success and there can be no assurance of our ability to attract and retain such personnel.If we are not successful in attracting and retaining qualified personnel, our ability to execute our business modeland growth strategy could be affected, which could have a material and adverse impact on our profitability, resultsof operations and financial condition.
We conduct business in countries with a history of corruption and transactions with foreign governments anddoing so increases the risks associated with our international activities.
As we operate internationally, we are subject to the United States’ ForeignCorruptPracticesActand other lawsthat prohibit improper payments or offers of payments to foreign governments and their officials and politicalparties by the United States and other business entities that have securities registered in the United States for thepurpose of obtaining or retaining business. We have operations and agreements with third parties in countriesknown to experience corruption. Further international expansion may involve more exposure to such practices. Ouractivities in these countries create the risk of unauthorized payments or offers of payments by our employees orconsultants that could be in violation of various laws including the ForeignCorrupt Practices Act , even thoughthese parties are not always subject to our control. It is our policy to implement safeguards to discourage thesepractices by our employees and consultants. However, our existing safeguards and any future improvements mayprove to be less than effective and our employees or consultants may engage in conduct for which we might be heldresponsible. Violations of the ForeignCorruptPracticesActmay result in criminal or civil sanctions and we maybe subject to other liabilities, which could negatively affect our business, operating results and financial condition.
Tax audits or disputes, or changes in the tax laws applicable to us, could materially increase our tax payments.
We exercise significant judgment in calculating our provision for income taxes and other tax liabilities. Althoughwe believe our tax estimates are reasonable, many factors may affect their accuracy. Applicable tax authorities maydisagree with our tax treatment of certain material items potentially causing an increase in our tax liabilities.Furthermore, changes to existing laws may also increase our effective tax rate. A substantial increase in our taxburden could have an adverse effect on our financial results. Please see “ Item 8: Financial Information – A.ConsolidatedStatementsandOtherFinancialInformation” for further information.
Employee misconduct could harm us and is difficult to detect and deter.
It is not always possible to detect and deter employee misconduct. The precautions we take to detect and preventemployee misconduct may not be effective in all cases and we could suffer significant reputational and economicharm for any misconduct by our employees. The potential harm to our reputation and to our business caused bysuch misconduct is impossible to quantify.
We may incur losses as a result of unforeseen or catastrophic events, including the emergence of a pandemic,terrorist attacks or natural disasters.
The occurrence of unforeseen or catastrophic events, including the emergence of a pandemic or other widespreadhealth emergency (or concerns over the possibility of such an emergency), terrorist attacks or natural disasters,could create economic and financial disruptions, lead to operational difficulties (including travel limitations) thatcould impair our ability to manage our business or expose our insurance subsidiaries to significant losses.
Failures or security breaches of our information technology systems could disrupt our operations and negativelyimpact our business.
We use information technologies, including information systems and related infrastructure as well as cloudapplications and services, to store, transmit, process and record sensitive information, including employeeinformation and financial and operating data, communicate with our employees and business partners and for manyother activities related to our business. Our business partners, including operating partners, suppliers, customers andfinancial institutions, are also dependent on digital technology. Some of these business partners may be providedlimited access to our sensitive information or our information systems and related infrastructure in the ordinarycourse of business.
12

TABLE OF CONTENTS
Despite security design and controls, our information technology systems, and those of our third party partners andproviders, may be vulnerable to a variety of interruptions, including during the process of upgrading or replacingsoftware, databases or components thereof, natural disasters, terrorist attacks, telecommunications failures,computer viruses, cyber-attacks, the activities of hackers, unauthorized access attempts and other security issues ormay be breached due to employee error, malfeasance or other disruptions. Any such interruption or breach couldresult in operational disruptions or the misappropriation of sensitive data that could subject us to civil and criminalpenalties, litigation or have a negative impact on our reputation. There can be no assurance that such disruptions ormisappropriations and the resulting repercussions will not negatively impact our cash flows and materially affectour results of operations or financial condition.
Risk Factors Relating to Our Business – Risks Relating to Discontinued Operations
The operation of the iron ore mine underlying our royalty interest was closed in 2014. Its operation is generallydetermined by a third-party operator and we currently have no decision-making power as to how the property isoperated. In addition, we have no or very limited access to technical or geological data respecting the mine,including as to mineralization or reserves. The operator’s failure to perform or other operating decisions couldhave a material adverse effect on our revenue, results of operations and financial condition.
In late October 2014, the operator of the mine underlying our royalty interest announced that it would be closing themine. The operator generally has the power to determine the manner in which the property is operated. The interestsof the operator and our interests may not always be aligned. Our inability to control the operations of the mine canadversely affect our profitability, results of operations and financial condition.
To the extent grantors of royalties and other interests do not abide by their contractual obligations, we may beforced to take legal action to enforce our contractual rights. Should any decision with respect to such action bedetermined adversely to us, such decision may have a material and adverse effect on our profitability, results ofoperations and financial condition.
In addition, we have no or very limited access to technical and geological data relating to the mine, including dataas to reserves, nor have we received a Canadian National Instrument 43-101 compliant technical report in respect ofthe mine. Accordingly, we can provide no assurances as to the level of mineralization or reserves at the mine.
Our hydrocarbon and related operations are subject to inherent risks and hazards.
There are many operating risks and hazards inherent in our discontinued resource operations, includingenvironmental hazards, industrial accidents, changes in the regulatory environment, impact of non-compliance withlaws and regulations, potential damage to equipment or personal injury and fires, explosions, blowouts, spills orother accidents. Additionally, we could experience interruptions to, or the termination of, production, processing ortransportation activities due to bad weather, natural disasters, delays in obtaining governmental approvals orconsents, insufficient storage or transportation capacity or other geological or mechanical conditions. Any of theseevents that result in an interruption or suspension of operations would adversely affect our discontinued operations.
Estimates of hydrocarbon reserves involve uncertainty.
Estimates of natural gas and oil reserves involve a great deal of uncertainty because they depend upon the reliabilityof available geologic and engineering data, which is inherently imprecise. Geologic and engineering data are usedto determine the probability that a hydrocarbon reservoir exists at a particular location and whether hydrocarbonsare recoverable from the reservoir. The probability of the existence and recoverability of reserves is less than 100%and actual recoveries may be materially different from estimates.
Such estimates require numerous assumptions relating to operating conditions and economic factors, including theprices of natural gas, NGLs and oil, availability of investment capital, recovery costs, the availability of enhancedrecovery techniques, the ability to market production and governmental and other regulatory factors, such as taxes,royalty rates and environmental laws. A change in one or more of these factors could result in known quantities ofnatural gas and oil previously estimated becoming unrecoverable. Each of these factors also impacts recovery costsand production rates. In addition, estimates of reserves that are prepared by different independent engineers, or bythe same engineers at different times, may vary substantially.
13

TABLE OF CONTENTS
As at December 31, 2015, approximately 12.9% of our total estimated proved reserves (gross, by volume) wereundeveloped. These reserve estimates reflect our plans to complete development activities to convert our provedundeveloped reserves into developed reserves. Such development may not occur as scheduled and results may notbe as estimated. If we elect not to develop these proved undeveloped reserves, or if we are not otherwise able tosuccessfully develop them, we will be required to remove the associated volumes from our reported provedreserves. In addition, SEC rules require that, subject to limited exceptions, proved undeveloped reserves may onlybe disclosed if they relate to wells scheduled to be drilled within five years of initial booking thereof. We may berequired to remove such proved and undeveloped reserves if we do not develop them within the required five-yeartimeframe. Such removal may significantly reduce the quantity and present value of our reported oil and gasreserves.
Certain of our proved undeveloped reserves are, or may in the future be, subject to third-party operatingagreements, including farm-out and participation agreements. While such third-party arrangements may provide forcommitted expenditures and/or drilling activities, our ability to convert such proved undeveloped reserves withinthe required timeframe may be subject to operating decisions of such operators and the results of developmentactivities conducted by such third-parties, which may not be entirely within our control.
Future environmental and reclamation obligations respecting our resource properties and interests may bematerial.
We have not established a separate reclamation fund for the purpose of funding estimated future environmental andreclamation obligations. Any site reclamation or abandonment costs incurred in the ordinary course in a specificperiod will be funded out of cash flow from operations. To the extent our hydrocarbon properties are not disposedof, we expect to incur site restoration costs over a prolonged period as wells reach the end of their economic life andmay be subject to reclamation and other environmental liabilities for past resource activities. There are significantuncertainties related to decommissioning obligations and the impact on the financial statements could be material.The eventual timing of and costs for these asset retirement obligations could differ from current estimates.
General Risks Faced by Us
Investors’ interests may be diluted and investors may suffer dilution in their net book value per share if we issueadditional shares or raise funds through the sale of equity securities.
Our constating documents authorize the issuance of our common shares, Class A common shares and Class Apreference shares, issuable in series. In the event that we are required to issue any additional shares or enter intoprivate placements to raise financing through the sale of equity securities, investors’ interests in us will be dilutedand investors may suffer dilution in their net book value per share depending on the price at which such securitiesare sold. If we issue any such additional shares, such issuances will also cause a reduction in the proportionateownership of all other shareholders. Further, any such issuance may result in a change of control of our company.
Certain factors may inhibit, delay or prevent a takeover of our company, which may adversely affect the price ofour common shares.
Certain provisions of our charter documents and the corporate legislation which govern us may discourage, delay orprevent a change of control or changes in our management that shareholders may consider favourable. Suchprovisions include authorizing the issuance by our board of directors of preferred stock in series, limiting thepersons who may call special meetings of shareholders and the adoption of an advance notice policy. In addition,the Investment Canada Act imposes certain limitations on the rights of non-Canadians to acquire our commonshares, although it is highly unlikely that this will apply. If a change of control or change in management is delayedor prevented, the market price of our common shares could decline.
14

TABLE OF CONTENTS
ITEM 4: INFORMATION ON THE COMPANY
A. History and Development of the Company
Corporate Information
We are a corporation organized under the laws of the Province of British Columbia, Canada. We were originallyincorporated in June 1951 by letters patent issued pursuant to the Companies Act of 1934 (Canada). We werecontinued under the Canada Business Corporations Act in March 1980, under the Business Corporations Act(Yukon) in August 1996 and under the Business Corporations Act (British Columbia) in November 2004. OnFebruary 16, 2016, in order to better reflect our focus on trade and structured finance, merchant banking and supplychain activities, we changed our name from “MFC Industrial Ltd.” to “MFC Bancorp Ltd.”
Our principal executive office is located at Suite 1860 - 400 Burrard Street, Vancouver, British Columbia, CanadaV6C 3A6 and its telephone number is +1 604-683-8286. Our registered office is located at Suite 1000 – 925 WestGeorgia Street, Vancouver, British Columbia, Canada, V6C 3L2.
General
We are a finance and supply chain company, which facilitates the working capital and other requirements of ourcustomers. Our business activities involve customized structured financial solutions and are supported by captivesources and products secured from third parties. We do business in multiple geographies and specialize in a widerange of industrial products such as metals, ceramics, minerals, various steel products and ferro-alloys and woodproducts.
As a supplement to our internal growth initiatives, we seek out and evaluate strategic acquisition and financingcandidates to further expand our finance and supply chain businesses.
Please see “ Item4:InformationontheCompany–B.BusinessOverview” for further information regarding ourrecent developments.
B. Business Overview
The following is a brief description of our business and recent activities.
Recent Developments
Focus on Trade Finance and Acquisition of a European Bank
In March 2015, we announced our strategy to leverage our trade finance and supply chain platform by offeringadditional and complementary trade and structured finance services and solutions, including regulated products, toour existing customer and supplier base.
As an integral part of our long-term strategy and focus on expanding our trade finance and solutions offerings, onFebruary 1, 2016, we completed the acquisition of BAWAG Malta Bank Ltd., referred to as the “Bank”, a licencedWestern European bank, for total consideration of $142.4 million. The consideration under the transaction equaledthe fair values of the identifiable assets acquired and the liabilities assumed on the closing date. Subsequent to thecompletion of the acquisition, the Bank was renamed “MFC Merchant Bank Limited”. Through ownership of an“in-house” bank, we will be able to supplement our core business with regulated banking services, including,among others, collateral-based lending to suppliers and customers, factoring, discounting and forfaiting ofreceivables and issuing guarantees.
The Bank will not engage in retail or commercial banking, but will provide specialty banking services, focused onmerchant banking and structured and trade finance, to our customers, suppliers and group members. These productswill include: bank guarantees, letters of credit, documentary bank guarantees/stand-by letters of credit, bills ofexchange, bills of lading, promissory notes and forwarders’ certificate of receipt facilities; with and withoutrecourse factoring; forfaiting; discounting of bills of exchange and promissory notes; purchase financingcollateralized by the product; inventory financing collateralized by inventory; structured trade finance, includingadvisory services, in conjunction with export credit agencies; and merchant banking products and services.
15

TABLE OF CONTENTS
MFC Merchant Bank Ltd.’s customer deposits will mainly be comprised of small and medium sized corporateclients, who may also be trade and structured finance customers, as well as MFC Group companies and otherrelated entities. In addition, we will integrate MFC’s existing long-standing banking relationships with the Bank tosupport our corporate vision.
The back office is a significant burden to a bank because it is the major driver of operating expenditures. However,in order to maintain a variable cost structure, the Bank will outsource major back office services as well as internalfunctions such as technology, internal audit and payment services to third parties.
Rationalization of Non-Core Resource Assets / Discontinued Operations
In the third quarter of 2015, we determined to pursue the sale of our resource assets, comprised of our hydrocarbonproperties and iron ore interests, and instituted a program to identify potential buyers and rationalize these assets.As a result, these assets are classified as assets held for sale as of December 31, 2015 and the operations and cashflows related to these assets are accounted for as discontinued operations for the year ended December 31, 2015.Please see “ Item 5: Operating and Financial Review and Prospects – Discontinued Operations ” for furtherinformation.
We recognized non-cash impairment losses of $412.1 million, before a net income tax expense of $4.4 million, onour hydrocarbon properties and iron ore interests for 2015 (which included a non-cash impairment loss of $52.9million and a $30.0 million reversal of impairment loss recognized in the fourth quarter of 2015). In the fourthquarter of 2015, we sold a 95% economic interest in certain of our hydrocarbon interests and the related liabilities toa third party for nominal and contingent consideration. These properties had no net asset value at the time of sale, sono gain or loss was recorded upon disposition.
Business Segments
Our business is currently divided into two operating segments: (i) Finance and Supply Chain, which includes ourmarketing activities, captive supply assets, structured solutions, financial services and proprietary investingactivities; and (ii) All Other, which encompasses our corporate and other investments and business interests.
Previously, we presented our finance and supply chain business as two reportable segments: (i) Global SupplyChain; and (ii) Trade Finance and Services. However, as we have advanced our long-term strategy and as a result ofthe acquisition of the Bank, the divide between these two segments has become less clear while the revenue andcost synergies have become more apparent. Therefore, as a result of the integrated nature of these operations, wehave combined these two former segments into “Finance and Supply Chain”.
Finance and Supply Chain
Our finance and supply chain segment includes our trade and structured finance operations, proprietary investingand integrated supply chain business.
We provide supply chain services, logistics and other trade and structured finance services to producers andconsumers of our products. These activities provide cost effective and efficient transportation, as well as paymentterms accommodating working capital requirements for our customers and partners. Our operations often utilizestrategies and structures to facilitate the working capital needs of our clients. We currently engage in purchases andsales with producers who are unable to effectively realize sales due to their specific circumstances. We supplyvarious products in global markets, including metals, ceramics, minerals, various steel products and ferro-alloys andwood products. These are sourced from our directly or indirectly held supply interests or are secured by us fromthird parties in Asia, Africa, Europe, North America, South America and the Middle East.
In 2014, we acquired a supply chain company that is focused on steel products and has offices globally. Theconsideration under the transaction was nominal (including contingent payments between the parties over a 10-yearperiod based on current inventories and accounts receivable, existing legal actions and the utilization of certain taxloss carry-forwards). In addition, in 2014, we acquired a 100% interest in a vertically integrated supply chainmanagement company, which is a producer of ferrosilicon.
In furtherance of our goal to expand our trade finance and solutions offerings, we expanded our finance and supplychain business through the acquisition of the Bank. Please see “ RecentDevelopments” for additional information.As we integrate this acquisition, we expect to significantly expand our existing
16

TABLE OF CONTENTS
business through by offering additional financial products including, among others, collateral-based lending tosuppliers and customers, factoring, discounting and forfaiting of receivables and issuing guarantees.
Often, producers and end consumers work with us to better manage their internal supply chain, distribution risk andcurrency and capital requirements. In such operations, we try to capture various product, financing and currencyspreads. Through our operational history, we have been able to develop long-standing relationships with producers,end customers and financiers and integrate them into our activities, allowing us to leverage our marketing andfinancial experience and relationships to provide marketing services and trade and structured finance services to ourcustomers.
Our finance and supply chain business employs personnel worldwide and our main marketing office is located inVienna, Austria. We also maintain offices in Canada, the United States, Malta, Mexico, Argentina, China, Serbia,Norway, Germany and Spain. In addition, we establish relationships with and seek to further market our productsthrough agents located worldwide. Our marketing and other business activities in this segment are supported by anetwork of agents and relationships, which provides us with worldwide sourcing and distribution capabilities.
We utilize our established relationships with international financial institutions, insurers and factoring companies toprovide flexible, customized financial tools, extensive credit and risk management and structured solutions for ourcustomers. Working closely with our customers, our professional staff arranges support for hedging and marketingof materials, financing and risk management solutions.
Our activities include making proprietary investments through using our own capital and expertise to captureinvestment opportunities. We seek to participate in many industries, emphasizing those business opportunitieswhere the perceived intrinsic value is not properly recognized. Often such investments are in companies or assetsthat are under financial, legal or regulatory distress and our services include resolving such distress. These activitiestake many forms and can include acquiring entire businesses or portions thereof, investing in equity or investing inthe existing indebtedness (secured and unsecured) of businesses or in new equity or debt issues. Such activities aregenerally not passive and we invest where we believe our expertise in financial restructuring and management andcomplementary supply chain and corporate finance capabilities can add or unlock value.
We consider opportunities where: our existing participation in marketing and production provides expert insight; wecan obtain a satisfactory return of future capital investment; and there are synergistic benefits with our existingbusiness. Our philosophy is to utilize our financial strength to realize the commercial potential of assets in marketswhere we have a comprehensive understanding of the drivers of value.
Proprietary investments are generated and made as part of our overall finance and supply chain activities and arerealized upon over time, sometimes taking more than one year. In addition, as part of our overall strategy, we oftenseek to acquire interests or establish relationships with producers to realize upon potential synergies. Such interestscan be acquired through purchases of, or investments in, producers, or through contractual arrangements with them.
All Other
Our all other segment includes our corporate and other operating segments and interests.
Competitive Conditions
Both segments of our business are intensely competitive and we expect them to remain so.
We operate in a highly competitive environment in most of our markets and we face competition in our financeactivities, principally from international banks, the majority of which are European, North American or LatinAmerican regulated banks, in our finance and fee-generating activities. Such competition may have the effect ofreducing spreads on our financing activities.
Our finance and supply chain business is relatively small compared to our competitors in the sector. Many of ourcompetitors have far greater financial resources, a broader range of products and sources of supply, larger customerbases, greater name recognition and marketing resources, a larger number of senior professionals to serve theirclients’ needs, greater global reach and more established relationships with clients than we do. These competitorsmay be better able to respond to changes in business conditions, compete for skilled professionals, financeacquisitions, fund internal growth and compete for market share generally.
17

(1) Percentages rounded to nearest whole number. Our proportional voting interests are identical to our proportional beneficialinterests, except for a non-wholly owned subsidiary in Africa from which we derive a 100% beneficial interest resulting from ourshareholder loan.
TABLE OF CONTENTS
The scale of our competitors in the finance and supply chain business has increased in recent years as a result ofsubstantial consolidation among companies, especially in the banking and financial industries. These firms have theability to offer a wider range of products than we do, which may enhance their competitive position.
We believe that our experience and operating structure permit us to respond more rapidly to our clients’ needs thanmany of our larger competitors. These traits are important to small and mid-sized business enterprises, many ofwhich do not have large internal corporate finance departments to handle their capital requirements. We develop apartnership approach to assist our clients. This often permits us to develop multiple revenue sources from the sameclient. For example, we may purchase and sell a client’s products, or commit our own capital to make a proprietaryinvestment in its business or capital structure.
C. Organizational Structure
The following table describes our direct and indirect material subsidiaries as at the date hereof, their respectivejurisdictions of organization and our interest in respect of each subsidiary. The table excludes subsidiaries that onlyhold inter-company assets and liabilities and do not have active businesses or whose results and net assets do notmaterially impact our consolidated results and net assets.
Subsidiaries Country of
Incorporation
Proportion of Voting Interest
MFC Commodities GmbH Austria 100% MFC Trade & Financial Services GmbH Austria 100% IC Managementservice GmbH Austria 100% International Trade Services GmbH Austria 100% MFC Commodities Trading GmbH Austria 100% MFC Metal Trading GmbH Austria 100% Kasese Cobalt Company Limited Uganda 75% MFC (A) Ltd Marshall Islands 100% MFC (D) Ltd Marshall Islands 100% M Financial Corp. Barbados 100% MFC Corporate Services AG Switzerland 100% GPT Global Pellets Trading GmbH Austria 100% MFC Power Limited Partnership Canada 100% MFC Resources Inc. U.S. 100% Possehl Mexico S.A. de C.V. Mexico 100% MFC Holding Norway AS Norway 100% Fesil AS Norway 100% Fesil Sales AS Norway 100% Fesil Rana Metall AS Norway 100% Fesil Sales GmbH Germany 100% Fesil Sales SA Luxembourg 100% F.J. Elsner Trading Gesellschaft mbH Austria 100% MFC Merchant Bank Limited Malta 100% Mednet (Shanghai) Medical Technical Developing Co. Ltd. China 100% Hangzhou Zhe-er Optical Co. Ltd. China 51%
Note:
Please see Note 28 to our audited consolidated financial statements for the year ended December 31, 2015 forfurther information.
18
(1)

TABLE OF CONTENTS
D. Property, Plants and Equipment
Continuing Operations
Our principal office is located at Suite 1860 – 400 Burrard Street, Vancouver, British Columbia V6C 3A6, Canada.We also maintain offices globally, with our main marketing office located in Vienna, Austria.
We believe that our existing facilities are adequate for our needs through the end of the year ending December 31,2016. Should we require additional space at that time or prior thereto, we believe that such space can be secured oncommercially reasonable terms.
We own a ferrosilicon production plant located in Mo i Rana, Norway, which produces a range of ferrosiliconproducts, including granulated and refined qualities (high and semi-high purity), which make up the bulk of itsproduction. Annual capacity of the plant’s furnaces is approximately 80,000 metric tonnes of ferrosilicon and23,000 metric tonnes of microsilica. The facility is certified according to ISO 9001 and ISO 14001. Through oursales offices, ferrosilicon is sold to customers, including steelworks, aluminum and iron foundries and chemicalgroups.
Discontinued Operations
In the third quarter of 2015, we determined to pursue the sale of our resource assets, comprised of our hydrocarbonproperties and iron ore interests. We instituted a program to identify potential buyers and rationalize these assets,which we expect will be completed by the third quarter of 2016. As a result, we classified these assets as assets heldfor sale as of December 31, 2015 and the operations and cash flows related to these assets are accounted for asdiscontinued operations for the year ended December 31, 2015. Please see “ Item 5: Operating and FinancialReviewandProspects–DiscontinuedOperations” for further information.
Our discontinued operations as at December 31, 2015 included hydrocarbon development, production andprocessing operations in Northern Alberta, Canada. These interests include natural gas infrastructure and processingfacilities with compression capacity of 20 million cubic feet per day utilizing over 6,200 horsepower, including agas processing plant with 28 mmcf per day of capacity.
We retained GLJ Petroleum Consultants, referred to as “GLJ”, to evaluate and prepare a report on our reserves. Asthe result of our disposition of certain hydrocarbon interests in 2015, all of our reserves are located in NorthernAlberta, Canada. Please refer to Exhibit 15.3 of this annual report on Form 20-F for GLJ’s report on their evaluationand methodology.
The following table sets forth our gross (working interest reserves, before royalty) and net (working interestreserves, including royalty) reserves as at December 31, 2015.
Reserves as of December 31, 2015Category Natural Gas NGLs Crude Oil Total
Gross Net Gross Net Gross Net Gross Net (mmcf) (mbbl) (mbbl) (mboe)
ProvedDeveloped Producing 12,020 10,614 468 295 27 36 2,499 2,100Undeveloped 1,564 1,427 61 52 — — 322 290
Total Proved 13,583 12,041 529 347 27 36 2,820 2,391Probable
Probable Developed 3,657 3,239 143 90 13 16 765 645Probable Undeveloped 1,908 1,570 74 52 73 56 465 369
Total Probable 5,565 4,809 217 141 86 72 1,230 1,015
Estimated reserves shown for the producing properties have been projected on the basis of the extrapolation ofperformance data where there was sufficient data to suggest a performance trend. A significant percentage of thecompletions have extensive production histories and provide substantial data with respect to performance trends. Insome cases, the information suggests that recent well intervention work has been performed. In such cases, we haveconsidered prior historical performance in estimating future reserves. Projections for recently drilled wells havebeen prepared on the basis of early performance data and/or well tests with consideration for the performance trendsobserved in those wells with long production histories. Probable reserves are higher risk than proved reserves andare generally believed to be
19

(1) As of December 31, 2015, as a result of transactions completed during the year, our production assets are all located in NorthernAlberta.
TABLE OF CONTENTS
less likely to be accurately estimated or recovered than proved reserves. Estimates of total net proved reserves arenot filed with any U.S. federal authority or agency other than the SEC.
Our policies and practices regarding internal controls over the recording of reserves are structured to objectivelyand accurately estimate our gas and oil reserve quantities and present values in compliance with the SEC’sregulations and financial reporting standards. Our controls over reserve estimates included retaining GLJ as ourindependent petroleum and geological engineering firm. We provided information about our gas and oil properties,including production profiles, prices and costs, to GLJ, and they prepared their own estimates of the reservesattributable to our properties, as at December 31, 2015. All of the information regarding reserves in this annualreport on Form 20-F is derived from the report prepared by GLJ. The principal engineer at GLJ is MyronHladyshevsky, P. Eng., who was responsible for preparing our reserve estimates, has over 30 years of experience inthe oil and gas industry and is a professional engineer registered in the Province of Alberta, Canada. He is also amember of the Society of Professional Engineers in the Province of Alberta. GLJ’s reserve estimates are reviewedby our technical personnel and management and the directors of our operating subsidiaries.
There are numerous uncertainties inherent in estimating quantities of proved reserves, including many factorsbeyond our control or the control of the reserve engineers. Reserve engineering is a subjective process of estimatingunderground accumulations and cannot be measured in an exact manner. The accuracy of any reserve or cash flowestimate is a function of the quality of available data and of engineering and geological interpretation and judgment.Estimates by different engineers often vary, sometimes significantly. In addition, physical factors, such as theresults of drilling, testing and production subsequent to the date of an estimate, as well as economic factors, such asan increase or decrease in product prices that renders production of such reserves more or less economic, mayjustify revision of such estimates. A significant reduction in our proved reserves may result in a full cost ceilinglimitation and/or an accelerated depletion rate. Accordingly, reserve estimates could be different from the quantitiesof gas and oil that are ultimately recovered. Please refer to “ Item3:KeyInformation –D.RiskFactors” for furtherinformation respecting these risks.
As at December 31, 2015, our reserve estimates included 322 mboe (290 mboe on a net basis) of reserves classifiedas proved undeveloped, compared to 8,038 mboe (6,704 mboe on a net basis) of reserves classified as provedundeveloped as of December 31, 2014. The decrease in proved undeveloped reserves compared to last year isprimarily a result of the disposition of hydrocarbon interests in 2015.
In 2015, we produced (on a net working interest basis, less royalties) 10,719 mmcf of natural gas, 208 mboe ofNGLs and 77 mbbl of crude oil, for total production of hydrocarbons of 2,071 mboe, compared to 16,528 mmcf ofnatural gas, 311 mboe of NGLs and 116 mbbl of crude oil, for total production of hydrocarbons of 3,182 mboe in2014 and 3,396 mboe in 2013. We also produced 41,767 tons of sulphur as a byproduct of our hydrocarbonproduction activities in 2015, compared to 55,232 tons of sulphur as a byproduct of our hydrocarbon productionactivities in 2014 and 55,051 tons in 2013. Our total production, including hydrocarbons and sulphur, was 2,113mboe on a net working interest basis for the year ended December 31, 2015, compared to 3,237 mboe on a networking interest basis for 2014 and 3,451 mboe for 2013. Total production of natural gas, NGLs and crude oildecreased primarily due to the shutdown of one of our processing plants for plant turnaround and associatedpipeline repairs as well as the disposition of hydrocarbon properties in 2015.
The following table sets forth our average daily production by field for the years ended December 31, 2015, 2014and 2013:
Years Ended December 31
2015 2014 2013
Area
Natural Gas
(mcf/d) NGLs (bbl/d)
Crude Oil
(bbl/d) Total (boe/d)
Natural Gas
(mcf/d) NGLs (bbl/d)
Crude Oil
(bbl/d) Total (boe/d)
Natural Gas
(mcf/d) NGLs (bbl/d)
Crude Oil
(bbl/d)Total (boe/d)
Northern Alberta 6,289 252 37 1,337 10,144 428 65 2,184 11,712 492 81 2,525Southern Alberta 25,393 332 174 4,738 35,138 424 253 6,533 36,294 484 245 6,778Total 31,682 584 211 6,075 45,282 852 318 8,717 48,006 976 326 9,303
Note :
20
(1)

(1) Excludes third-party processing fees.
(1) Excludes third-party processing fees.
(1) Excludes third-party processing fees.
TABLE OF CONTENTS
The following tables set forth our average sales prices, operating costs, royalty amounts and transportation costs foreach of the periods indicated:
Year Ended December 31, 2015
Area
Natural Gas
($/mcf/d)NGLs
($/bbl/d)
Crude Oil
( $/bbl/d)
Total Hydro-
Carbons ($/boe/d)
Sulphur ($/mcf/d)
Price 3.01 39.42 56.22 21.64 154.26Royalties 0.59 13.63 13.26 4.90 19.38Operating costs N/A N/A N/A 15.77 N/ATransportation costs 0.16 5.44 1.96 1.44 73.46
Note:
Year Ended December 31, 2014
Area
Natural Gas
($/mcf/d)NGLs
($/bbl/d)
Crude Oil
( $/bbl/d)
Total Hydro-
Carbons ($/boe/d)
Sulphur ($/mcf/d)
Price 4.82 79.69 90.80 36.16 150.38Royalties 0.84 28.71 23.14 8.00 25.19Operating costs N/A N/A N/A 13.46 N/ATransportation costs 0.16 7.44 3.27 1.67 73.04
Note:
Year Ended December 31, 2013
Area
Natural Gas
($/mcf/d)NGLs
($/bbl/d)
Crude Oil
( $/bbl/d)
Total Hydro-
Carbons ($/boe/d)
Sulphur ($/mcf/d)
Price 3.46 77.30 84.98 28.92 64.83Royalties 0.62 26.74 20.78 6.76 10.21Operating costs N/A N/A N/A 12.38 N/ATransportation costs 0.14 5.68 2.29 1.39 —
Note:
Our operating costs per boe increased in 2015, primarily as a result of lower production volumes spread over fixedoperating costs. In addition, we generated processing revenues of $5.1 million during 2015, compared to $5.5million in 2014. Transportation costs per boe decreased in 2015, primarily as a result of reduced service providercosts.
In the fourth quarter of 2013, we entered into the participation agreement, referred to as the “ParticipationAgreement”, with a natural gas operator, pursuant to which the operator has committed to spending a minimum of $50.0 million to drill a total of 12 net wells over an initial three-year term. Such initial term was extended toDecember 31, 2018. Drilling under this arrangement is primarily focused on our undeveloped oil and gas propertieslocated in Northern Alberta, Canada. Under the Participation Agreement, the operator pays 100% of the costsrequired to drill and complete each well. If any of the initial 12 net wells achieves continuous production, we mayelect to: (i) participate for up to a 30% interest in the well by reimbursing the operator 25% of the costs of suchwell; or (ii) receive a 10% gross royalty on production. Additionally, any gas produced from a large proportion ofthese wells will be processed exclusively by our existing processing facility in the area. The operator commencedits program under the Participation Agreement in the first quarter of 2014 and has drilled and completed nine grosswells on our lands in Northern Alberta, with eight such wells having been tied in with production from seven ofsuch wells flowing through our facilities in the area. We elected to receive the 10% gross royalty on suchproduction.
21
(1)
(1)
(1)

(1) A portion of the non-producing wells are wells considered capable of production but which, for a variety of reasons including butnot limited to a lack of markets and lack of development, cannot be placed on production at the present time.
TABLE OF CONTENTS
Other than as described above, we have not drilled any wells since acquiring the hydrocarbon properties included inour discontinued operations in the third quarter of 2012.
The following table summarizes the location of our interests as at December 31, 2015 in natural gas and crude oilwells that are producing or that are mechanically capable of production and have economic reserves assigned tothem:
AreaProducing
Natural Gas WellsNon-producing
Natural Gas Wells Producing
Crude Oil WellsNon-producing
Crude Oil Wells Total Wells Gross Net Gross Net Gross Net Gross Net Gross Net
Northern Alberta 99 69 79 54 11 8 13 10 202 141
Note:
The following table sets forth the acreage of our gross and net developed and undeveloped gas and oil properties asat December 31, 2015:
Area Gross Acres Net Acres Alberta
Developed 67,766 49,575Undeveloped 28,841 20,914
Additionally, as at the date hereof, we also hold 79,009 gross acres (79,009 net acres) of undeveloped gas and oilproperties in Montana, U.S.A. The leases respecting our undeveloped properties in Montana are scheduled to expirein March 2017 if no development occurs in relation thereto.
Natural gas production, included in our discontinued operations, is sold to counterparties under contracts at thedaily price quoted in Canadian Enerdata’s Canadian Gas Price Reporter and is transported through regulatedpipelines in the Province of Alberta at tariffs that require either provincial or federal regulatory approval. NGLs arere-priced on an annual basis reflecting purchaser monthly pool prices or are based on U.S. market hub locationswith a basis differential. Crude oil sales included in our discontinued operations are priced at market using theEdmonton market hub as a benchmark and are typically made through 30-day evergreen contracts.
Our gas and oil operations are subject to various Canadian governmental regulations including those imposed by theAlberta Energy Regulator and Alberta Utilities Commission. Matters subject to regulation include discharge permitsfor drilling operations, drilling and abandonment bonds and pooling of properties and taxation. The production,handling, storage, transportation and disposal of oil and gas, by-products thereof, and other substances andmaterials produced or used in connection with such operations are also subject to regulation under federal,provincial and local laws and regulations.
We are subject to decommissioning obligations in connection with our ownership interests in hydrocarbon assets,including well sites, gathering systems and processing facilities. The total decommissioning obligation is estimatedbased on our net ownership interest in wells and facilities, estimated costs to reclaim and abandon same and theestimated timing of the costs to be incurred in future years. We have estimated the net present value of totaldecommissioning obligations to be $17.9 million as at December 31, 2015.
Our discontinued operations also include our royalty interest as the holder of a mining sub-lease related to an ironore mine located in Wabush, Newfoundland and Labrador, Canada. In late 2014, the mine operator announced theclosure of the mine and, in 2015, commenced proceedings under the Companies’ Creditors Arrangement Act(Canada), referred to as the “CCAA”.
ITEM 4A: UNRESOLVED STAFF COMMENTS
None.
22
(1) (1)

TABLE OF CONTENTS
ITEM 5: OPERATING AND FINANCIAL REVIEW AND PROSPECTS
The following discussion and analysis of our financial condition and results of operations for the year endedDecember31,2015and2014shouldbereadinconjunctionwithourauditedconsolidatedfinancialstatementsandrelatednotes.
General
We are a vertically integrated finance and supply chain company which facilitates the working capital and otherrequirements of our customers. Our business activities involve customized structured financial solutions and aresupported by captive sources and products secured from third parties. We do business in multiple geographies andspecialize in a wide range of industrial products such as metals, ceramics, minerals, various steel products andferro-alloys and wood products.
We also commit our own capital to promising enterprises and invest and otherwise capture investment opportunitiesfor our own account. We seek to invest in businesses or assets whose intrinsic value is not properly reflected in theirshare price or value. Our investing activities are generally not passive. We actively seek investments where ourfinancial expertise and management can add or unlock value.
Our results of operations have been and may continue to be affected by many factors of a global nature, includingeconomic and market conditions, the availability of capital, the level and volatility of equity prices and interestrates, currency values, asset prices and other market indices, technological changes, the availability of credit,inflation and legislative and regulatory developments. Our results of operations may also be materially affected bycompetitive factors. Our competitors include firms traditionally engaged in trade finance such as merchant andinvestment banks, along with other capital sources such as hedge funds, private equity firms, insurance companiesand other companies engaged in supply chain activities in Europe, Asia and globally.
Our results of operations for any particular period may also be materially affected by our realization on proprietaryinvestments. These investments are made to maximize total return through long-term appreciation and recognizedgains on divestment. We realize on our proprietary investments through a variety of methods including sales, capitalrestructuring or other forms of divestment.
In 2015, we recognized aggregate non-cash impairment charges of $412.1 million (before income taxes) on ourhydrocarbon properties and iron ore interests. As a result, our net book value declined by $410.5 million as atDecember 31, 2015, compared to December 31, 2014, as set forth below:
December 31, 2015
December 31, 2014
(In thousands, except per share amounts)
Net book value $ 367,192 $ 777,717Net book value per share 5.81 12.32
Prior Periods
Effective December 31, 2015, we changed our reporting currency to the Canadian dollar. With the change inreporting currency, all comparative financial information has been recast from United States dollars to Canadiandollars to reflect our consolidated financial statements as if it had been historically reported in Canadian dollars,consistent with IAS 21.
In connection with the preparation of our audited financial statements for the year ended December 31, 2015 andafter an examination of various historic transactions on a case-by-case basis involving the purchase and subsequentsale of goods to customers or their affiliates, we determined to reclassify $129.9 million and $91.5 million of grossrevenues previously recognized for fiscal 2014 and 2013, respectively, along with corresponding costs of sales andservices of $126.3 million and $89.0 million, respectively for each such period on a net basis where the costs ofpurchases of goods and revenues from subsequent sales of such goods to these entities were previously recorded ona gross basis. As a result, revenues were reduced by $126.3 million and $89.0 million for 2014 and 2013,respectively, with a corresponding identical reduction to our costs of sales and services for such periods, and thecomparative periods included in the statement of operations in our audited financial statements for the year endedDecember 31, 2015 have been restated accordingly. This had no impact on our net income from operations, cashflow statements or financial position.
23

TABLE OF CONTENTS
The results of discontinued operations are included in our consolidated statements of operations and cash flows forthe year ended December 31, 2015, which have been re-presented for prior periods. Please see “ DiscontinuedOperations” and Note 4 to our audited consolidated financial statements for the year ended December 31, 2015 forfurther information.
Discontinued Operations
As at December 31, 2015, our discontinued operations include the following interests, which are classified as assetsheld for sale:
Iron Ore Interests.We are the lessor under a mining sub-lease of the lands upon which a mine is situated inNewfoundland and Labrador, Canada. The mine is owned by Cliffs Natural Resources Inc., referred to as “Cliffs”,which, in late 2014, announced its closure and, in the first quarter of 2015, commenced proceedings under theCCAA with respect to all of its Canadian operations. In the second quarter of 2015, Cliffs’ subsidiaries that operatethe mine became parties to the CCAA proceedings, which continued through 2015. Our iron ore interests, includingour 50% interest in a mine property located in Missouri, U.S.A., are discontinued operations.
Hydrocarbon Properties. In the third quarter of 2015, we determined to pursue the sale of our resource assets,comprised of our hydrocarbon properties and iron ore interests. We have initiated a program to identify potentialpurchasers and sell these assets. Accordingly, our hydrocarbon properties and iron ore interests are classified asassets held for sale as of December 31, 2015. The operations and cash flows related to these assets are accounted foras discontinued operations for the year ended December 31, 2015. Please see Note 4 to our audited consolidatedfinancial statements for the year ended December 31, 2015 for further information. Our ability to rationalize theseassets and the amount of any proceeds are dependent on commodity prices and other market factors.
In connection with the initial classification of our hydrocarbon properties and iron ore interests as held for sale, therecoverable amounts of such assets were measured at fair value less costs to sell in accordance with IFRS. As aresult, in the third quarter of 2015, we recognized non-cash impairment losses (before income taxes) of $389.2million, comprised of non-cash impairment losses of $143.6 million (before a reduction of deferred tax assets of $50.9 million) on our hydrocarbon properties and $245.6 million (before an income tax recovery of $54.3 million)on our iron ore interests. In the fourth quarter of 2015, we recognized an additional non-cash impairment loss of $52.9 million on our hydrocarbon properties. In the fourth quarter of 2015, we reversed the previously recognizednon-cash impairment loss on our iron ore interests by $30.0 million and recognized a related deferred tax liabilityof $7.8 million.
In 2015, we sold a 95% economic interest in certain of our hydrocarbon assets and related liabilities to a third partyfor nominal and contingent consideration. The remaining economic interest has been recognized at nominal valueon December 31, 2015. Pursuant to the transaction, we are entitled to receive 25% of any proceeds above $5 millionin the event that such third party sells all or a portion of the underlying interests in one or more transactions on orbefore the fifth anniversary of the agreement. Such assets comprised our hydrocarbon assets in Southern Alberta.No gain or loss was recognized upon the disposition. However, a deferred tax expense of $12.0 million wasrecognized resulting from the write-off of previously recognized deferred tax assets. Furthermore, as a result of thedeconsolidation of the former subsidiaries, a net receivable of $11.6 million due from the former subsidiaries wasrecognized as the amount was no longer eliminated through consolidation and was included in assets held for sale.
Business Environment
Our financial performance is, and our consolidated results in any period can be, materially affected by economicconditions and financial markets generally.
A favourable business environment is characterized by many factors, including a stable geopolitical climate,transparent financial markets, low inflation, low interest rates, availability of credit, low unemployment, strongbusiness profitability and high business and investor confidence. Unfavourable or uncertain economic and marketconditions can be caused by declines in economic growth, business activity or investor or business confidence,limitations on the availability or increase in the cost of credit and capital, increases in inflation, interest rates,exchange rate volatility, outbreaks of hostilities or other geopolitical instability, corporate, political or otherscandals that reduce investor confidence in the capital markets or a combination of these or other factors.
Ongoing economic conditions and uncertainties, including slower economic growth in China and continuingeconomic uncertainty in Europe, continued to impact markets and cause significant volatility in
24

(1) We commenced consolidation of the operations of two acquired supply chain companies from March 31 and April 1, 2014,respectively.
(2) Revenues and costs of sales and services for these years have been reclassified to present certain transactions on a net basis. Thishad no impact on our net income from operations, net income, cash flow statements or financial position for such years. Please see“ Item5:OperatingandFinancialReviewandProspects—PriorPeriods” for further information.
(3) Attributable to our shareholders.
(4) Includes losses of $51.4 million related to a customer that filed for insolvency in February 2016 and $9.9 million on long-term off-take agreements entered into by a subsidiary acquired in 2014, which have since been terminated. Please see “ Item5:OperatingandFinancialReviewandProspects — ResultsofOperations” for further information.
(5) Includes non-cash impairments of $196.5 million, before a reduction of deferred tax assets of $50.9 million, and $215.6 million,before a deferred income tax recovery of $46.5 million, respectively, recognized on our hydrocarbon properties and iron oreinterests.
(6) Includes a non-cash impairment loss on our hydrocarbon properties of $33.2 million, before a deferred income tax recovery of$8.4 million.
(7) Includes a non-cash impairment loss on our hydrocarbon properties of $6.5 million, before an income tax recovery of $1.7million.
TABLE OF CONTENTS
commodity prices in 2015. The spot prices and long-term price curves of many markets we service, including butnot limited to ferro-alloys, steel and natural gas, declined in 2015 as most remained in surplus.
We operate internationally and therefore our financial performance and position are impacted by changes in theCanadian dollar, our reporting currency, against the other functional currencies of our international subsidiaries andoperations, particularly the Euro and the United States dollar. Changes in currency rates affect our financialperformance and position because our European and United States subsidiaries’ assets, liabilities, revenues andoperating costs are denominated in Euros and United States dollars, respectively. Accordingly, a weakening of theCanadian dollar against the Euro and United States dollar would have the effect of increasing the value of suchassets, liabilities, revenues and operating costs when translated into Canadian dollars, our reporting currency.Conversely, a strengthening of the Canadian dollar against these currencies would have the effect of decreasingsuch values.
As at December 31, 2015, the Canadian dollar had weakened by 7% and 16% against the Euro and the UnitedStates dollar from the end of 2014. Such weakening positively impacted our asset values (net of liabilities) reportedin Canadian dollars as at December 31, 2015. As a result, we recognized a net $79.5 million currency translationadjustment gain accumulated under other comprehensive income within equity in 2015, compared to $45.6 millionin 2014.
Results of Operations
The following table sets forth certain selected operating results and other financial information for each of the yearsended December 31, 2015, 2014 and 2013:
Years Ended December 31,2015 2014 2013
(Restated )(In thousands, except per share amounts)
Gross revenues $ 1,579,702 $ 1,286,324 $ 621,085Costs and expenses 1,634,831 1,273,554 614,864Costs of sales and services 1,529,578 1,178,022 550,822Selling, general and administrative expense 84,653 81,505 53,750Finance costs 20,355 13,263 9,742Share-based compensation – selling, general and administrative — 423 —Impairment of available-for-sale securities 245 341 550(Loss) earnings from continuing operations (59,544 2,783 4,324Net (loss) income from discontinued operations (428,086 (3,465 5,408Net (loss) income (487,630 (682 9,732(Loss) earnings per share:
Basic (7.72 (0.01 0.16Diluted (7.72 (0.01 0.16
Notes:
25
(1)
(2)
(2) (2)(2) (2)(2) (2)
( 3 ) ) (4)
( 3 ) ) ( 5 ) ) ( 6 ) ( 7 )
( 3 ) ) ( 4 ) (5) ) ( 6 ) ( 7 )
) ( 4 ) (5) ) ( 6 ) ( 7 )
) ( 4 ) (5) ) ( 6 ) ( 7 )

(1) We commenced consolidation of the operations of two acquired supply chain companies from March 31 and April 1, 2014,respectively.
(2) Revenues and costs of sales and services for these years have been reclassified to present certain transactions on a net basis. Thishad no impact on our net income from operations, net income, cash flow statements or financial position for such years. Please see“ Item5:OperatingandFinancialReviewandProspects—PriorPeriods” for further information.
(1) Revenues and costs of sales and services for the year have been reclassified to present certain transactions on a net basis. This hadno impact on our net income from operations, net income, cash flow statements or financial position for such year. Please see “Item5:OperatingandFinancialReviewandProspects–PriorPeriods” for further information.
TABLE OF CONTENTS
The following table provides a breakdown of our total revenues from continuing operations for each of the yearsended December 31, 2015, 2014 and 2013:
Years Ended December 31,2015 2014 2013
(Restated )(In thousands)
Finance and supply chain products and services $ 1,531,549 $ 1,237,153 $ 585,146Gains on securities, net — 5,221 6,507Interest 4,225 4,506 2,411Dividends 7 8 304Other 43,921 39,436 26,717
Total revenues $ 1,579,702 $ 1,286,324 $ 621,085
Notes:
Year Ended December 31, 2015 Compared to the Year Ended December 31, 2014
The following is a breakdown of our gross revenues by segment for each of the years indicated:
Years Ended December 31,2015 2014
(Restated) (In thousands)
Gross Revenues:Finance and supply chain $ 1,544,481 $ 1,256,520All other 35,221 29,804
$ 1,579,702 $ 1,286,324
Note:
In 2015, our proportionate revenues by product were: (i) 20% steel products; (ii) 46% minerals, chemicals andalloys; (iii) 16% metals; (iv) 15% wood products; and (v) 3% other. In 2015, 66% of our revenues were fromEurope, 19% were from the Americas and 15% were from Asia and other regions.
Based upon the average exchange rates for 2015, the Canadian dollar strengthened by approximately 3% andweakened by approximately 14% in value against the Euro and the United States dollar, respectively, compared tothe average exchange rates for 2014.
Revenues for 2015 increased to $1,579.7 million from $1,286.3 million in 2014, primarily as a result of theconsolidation of our acquisitions in the second quarter of 2014 and an increase in our finance and supply chainvolumes, partially offset by the exiting of certain product lines and the negative impact of the marginally strongerCanadian dollar against the Euro in 2015. As a substantial portion of our revenues are generated in Euros, themarginal strengthening of the Canadian dollar against the Euro slightly negatively impacted our revenues in 2015when such Euro-denominated revenues were translated to Canadian dollars.
Revenues for our finance and supply chain business were $1,544.5 million for 2015, compared to $1,256.5 millionfor 2014, primarily as a result of the consolidation of our acquisitions in the second quarter of 2014 and an increasein our finance and supply chain volumes, partially offset by the exiting of certain product lines and the impact of themarginally stronger Canadian dollar against the Euro.
Revenues for our all other segment were $35.2 million for 2015, compared to $29.8 million for 2014.
26
(1)
(2)
(2) (2)
(1)

(1) Revenues and costs of sales and services for the year have been reclassified to present certain transactions on a net basis. This hadno impact on our net income from operations, net income, cash flow statements or financial position for such year. Please see “Item5:OperatingandFinancialReviewandProspects–PriorPeriods” for further information.
TABLE OF CONTENTS
Costs of sales and services increased to $1,529.6 million during 2015 from $1,178.0 million during 2014, primarilyas a result of the consolidation of our acquisitions in the second quarter of 2014 and increased credit losses on loansand receivables and guarantees as a result of the insolvency of a customer subsequent to December 31, 2015 (seebelow), partially offset by the exiting of certain product lines and the impact of the marginally stronger Canadiandollar against the Euro. The following is a breakdown of our costs of sales and services for each of the yearsindicated:
Years Ended December 31,2015 2014
(Restated) (In thousands)
Supply chain products and services $ 1,468,680 $ 1,169,305Credit losses on loans and receivables and guarantees 54,540 4,346Fair value gain on government environmental emission refund (4,157 —Fair value loss on investment property — 134Market value decrease (increase) on commodities inventories 1,910 (4,172Gain on derivative contracts, net (2,913 (3,466Write-off of inventories, net — 165Loss on trading securities 84 —Other 11,434 11,710
Total costs of sales and services $ 1,529,578 $ 1,178,022
Note:
The gain on derivative instruments stemmed from commodity and currency derivatives.
In the fourth quarter of 2015, one of our customers in the wood products market experienced financial difficultiesand, subsequent to year end, filed for insolvency. This is an adjusting subsequent event under IAS 10, EventsaftertheReportingPeriod, and, as a result, we had to determine an allowance for credit losses against our receivablesdue from the customer and its affiliates and evaluate all other exposures. As at December 31, 2015, we had grosstrade receivables of $103.3 million due from this customer and its affiliates as well as other trading contracts withsuch customer. We conducted an extensive assessment of impairment losses on these trade receivables. Thisassessment included a number of judgments and a high level of estimation uncertainty. The factors considered inthese estimates include our legal rights and obligations under all related contracts and collateral, which includeinventories, mortgages, insurance of collateral and other credit enhancement instruments. We recognized anallowance for credit losses of $10.7 million in connection with this customer and its affiliates as at December 31,2015. After the recognition of such impairment losses, we had trade receivables of $92.6 million due from thiscustomer and its affiliates as at December 31, 2015.
In addition, we guaranteed certain prepayment loans made by third-party banks to this customer to finance off-takecontracts for which we were the off-taker. These guarantees were previously classified as contingent liabilities and,as a result of the insolvency of the customer, we have recorded a provision of $40.7 million for the expectedpayments under the guarantees as at December 31, 2015. However, we hold various collateral, includingguarantees, mortgages and other mitigation securities to recover a significant portion of these losses. We areexercising our rights as we undertake various options to maximize our recoveries. We currently expect that it ishighly probable that we will recover at least $36.8 million of these losses in 2016. However, under applicable IFRS,our expected recoveries may only be recognized in our financial statements when there is “virtual certainty” thatthey will be collected. “ VirtualCertainty” is a very high threshold and therefore, pursuant to IFRS, we have notrecorded our expected recoveries related to such credit losses in our 2015 consolidated financial statements.Therefore, there is a timing difference between the recording of credit losses and the recognizing of the associatedexpected recoveries in future periods. In our view, this accounting result does not truly reflect how we view thesetransactions from a commercial, economic or risk assessment perspective. Please see Note 23 to our auditedconsolidated financial statements for the year ended December 31, 2015 for further information.
In 2015, we recognized losses of $9.9 million in connection with long-term off-take agreements, which we havenow terminated. Such long-term off-take agreements were entered into by a subsidiary we acquired in
27
(1)
)
)) )

TABLE OF CONTENTS
2014, which produces and sells ferro-alloy and other related products, and resulted in losses being incurred asferrosilicon prices generally declined in 2015.
Selling, general and administrative expenses, excluding share-based compensation, increased to $84.7 million in2015 from $81.5 million in 2014, primarily as a result of an increase in professional fees relating to restructuringactivities, an arbitration settlement of $2.0 million with the vendor of a subsidiary acquired in 2014, the payment ofcertain restructuring and severance expenses in 2014 and the consolidation of our acquisitions in the second quarterof 2014, partially offset by the impact of the marginally stronger Canadian dollar against the Euro.
In 2015, finance costs increased to $20.4 million from $13.3 million in 2014, primarily as a result of higher debtlevels and factoring charges in relation to an increase in business volume.
In 2015, we recognized a net foreign currency transaction loss of $0.3 million, compared to $6.3 million in 2014, inthe consolidated statement of operations. The loss in 2014 was primarily non-cash and relates to the settlement ofcertain intercompany accounts of subsidiaries with different functional currencies in pursuit of fiscally responsiblestrategies. The foreign currency transaction gain and loss represent exchange differences arising on the settlementof monetary items or on translating monetary items at rates different from those at which they were translated oninitial recognition during the period or in previous financial statements.
We recognized an income tax expense of $2.5 million in 2015, compared to $2.2 million in 2014. Our statutory taxrate was 26% in each of 2015 and 2014. The income tax paid in cash during 2015 was $5.0 million, compared to$4.2 million in 2014.
In 2015, our net loss attributable to shareholders from continuing operations was $59.5 million, or $0.94 per shareon a basic and diluted basis, compared to net income attributable to shareholders from continuing operations of $2.8 million, or $0.04 per share on a basic and diluted basis, in 2014.
Our net loss attributable to shareholders from continuing operations for 2015 included credit losses of $51.4million, which does not include expected reimbursements of $36.8 million, in connection with a customer filing forinsolvency in the first quarter of 2016 and losses of $9.9 million incurred in connection with long-term off-takeagreements (see above).
Our revenues from discontinued operations were $73.4 million for 2015, compared to $146.7 million for 2014. Thedecrease was primarily the result of a decrease in natural gas prices and volumes, compared to 2014. Our costs andexpenses for discontinued operations were $489.6 million in 2015, which included non-cash impairments of $412.1million, before income taxes, on our hydrocarbon properties and iron ore interests, compared to $150.4 million in2014, which included a non-cash impairment of $33.2 million on our hydrocarbon properties.
In connection with the sale of a 95% economic interest in certain of our hydrocarbon assets in the fourth quarter of2015, we recognized a deferred tax expense of $12.0 million in 2015 resulting from the write-off of previouslyrecognized deferred tax assets.
In 2015, our loss from discontinued operations was $428.1 million, or $6.78 per share on a basic and diluted basis,which includes non-cash impairments of $196.5 million, or $3.11 per share on a basic and diluted basis, and $215.6million, or $3.41 per share on a basic and diluted basis, before income taxes, respectively, on our hydrocarbonproperties and iron ore interests, compared to a net loss of $3.5 million, or $0.05 per share, for 2014, whichincluded a non-cash impairment of $33.2 million, or $0.53 per share on a basic and diluted basis, before incometaxes, on our hydrocarbon properties. Please see Note 4 to our audited consolidated financial statements for the yearended December 31, 2015 for further information.
For 2015, our net loss attributable to shareholders was $487.6 million, or $7.72 per share on a basic and dilutedbasis, which includes non-cash impairments of $196.5 million, or $3.11 per share on a basic and diluted basis, and$215.6 million, or $3.41 per share on a basic and diluted basis, before income taxes, respectively, on ourhydrocarbon properties and iron ore interests, compared to a net loss attributable to shareholders of $0.7 million, or$0.01 per share on a basic and diluted basis, in 2014, which included a non-cash impairment of $33.2 million, or$0.53 per share on a basic and diluted basis, before income taxes, on our hydrocarbon properties.
For 2015, our Operating EBITDA from continuing operations decreased to an Operating EBITDA loss of $28.6million from Operating EBITDA of $24.5 million for 2014.
28

(1) Includes net income attributable to non-controlling interests.
(2) There were no impairments for continuing operations in 2015 and 2014.
(1) Revenues and costs of sales and services for these years have been reclassified to present certain transactions on a net basis. Thishad no impact on our net income from operations, net income, cash flow statements or financial position for such years. Please see“ Item5:OperatingandFinancialReviewandProspects–PriorPeriods” for further information.
TABLE OF CONTENTS
The following is a reconciliation of our net income to Operating EBITDA from continuing operations for each ofthe years indicated.
Years Ended December 31,2015 2014
(In thousands)Operating EBITDA (loss) from continuing operationsNet (loss) income from continuing operations $ (57,918 $ 4,141Income tax expense 2,501 2,173Finance costs 20,355 13,263Amortization, depreciation and depletion 6,450 4,957
Operating EBITDA (loss) from continuing operations $ (28,612 $ 24,534
Notes:
Please see “ Non-IFRSFinancialMeasures” for additional information.
Our net loss attributable to shareholders from continuing operations, net loss attributable to shareholders andOperating EBITDA (loss) for 2015 included the following losses (see above for further information):
Year Ended December 31, 2015
(In thousands)Long-term ferrosilicon off-take losses $ (9,880Credit losses related to an insolvent customer (51,382
Total $ (61,262
Year Ended December 31, 2014 Compared to the Year Ended December 31, 2013
The following is a breakdown of our total revenues from continuing operations by segment for each of the yearsended December 31, 2014 and 2013:
Years Ended December 31,2014 2013
(Restated) (In thousands)
Gross Revenues:Finance and supply chain $ 1,256,520 $ 597,518All other 29,804 23,567
$ 1,286,324 $ 621,085
Note:
In 2014, our proportionate revenues by product were: (i) 18% steel products; (ii) 42% minerals, chemicals andalloys; (iii) 10% metals; (iv) 23% wood products; and (v) 7% other. In 2014, 68% of our revenues were fromEurope, 22% were from the Americas and 10% were from Asia and other regions.
Based upon the yearly average exchange rates for 2014, the Canadian dollar decreased by approximately 7% invalue against each of the Euro and the United States dollar, compared to the average exchange rates in 2013. As atDecember 31, 2014, the Canadian dollar had strengthened by approximately 4% against the Euro and had weakenedby approximately 8% against the United States dollar since December 31, 2013.
Revenues in 2014 increased to $1,286.3 million from $621.1 million in 2013, primarily as a result of organicgrowth in certain product lines and an overall increase in finance and supply chain revenue (see below) due to theconsolidation of our acquisitions in the second quarter of 2014. As a substantial portion of our revenues weregenerated in Euros, the strengthening of the Euro against the Canadian dollar positively impacted our results ofoperations for 2014.
29
(1) )
(2) )
)))
(1)


(1) Revenues and costs of sales and services for these years have been reclassified to present certain transactions on a net basis. Thishad no impact on our net income from operations, net income, cash flow statements or financial position for such years. Please see“ Item5:OperatingandFinancialReviewandProspects–PriorPeriods” for further information.
TABLE OF CONTENTS
Revenues for our finance and supply chain business were $1,256.5 million in 2014, compared to $597.5 million in2013, primarily as a result of organic growth in certain product lines, the consolidation of our acquisitions in thesecond quarter of 2014 and the impact of the stronger Euro against the Canadian dollar.
Revenues for our all other segments were $29.8 million in 2014, compared to $23.6 million in 2013.
Costs of sales and services increased to $1,178.0 million in 2014 from $550.8 million in 2013, primarily as a resultof the consolidation of our acquisitions in the second quarter of 2014 and the impact of the stronger Euro against theCanadian dollar. The following is a breakdown of our costs of sales and services for each of the years endedDecember 31, 2014 and 2013:
Years Ended December 31,2014 2013
(Restated) (In thousands)
Supply chain products and services $ 1,169,305 $ 544,179Credit losses on loans and receivables 4,346 4,763Fair value loss on investment property 134 —Market value increase on commodity inventories (4,172 (5,502Gain on derivative contracts, net (3,466 (2,135Write-off of inventories, net 165 —Other 11,710 9,517
Total costs of sales and services $ 1,178,022 $ 550,822
Note:
In 2014, the gain on derivative contracts of $3.5 million primarily resulted from commodity and currencyderivatives.
Selling, general and administrative expenses, excluding share-based compensation, increased to $81.5 million in2014 from $53.8 million in 2013. The increase was primarily as a result of our acquisitions in the second quarter of2014, expansion to new geographies and markets, certain restructuring and severance expenses and the impact ofthe stronger Euro against the Canadian dollar.
During 2014, finance costs increased to $13.3 million from $9.7 million in 2013 as a result of increased borrowingsin our supply chain business.
In 2014, we recognized $0.4 million of share-based compensation expense as a result of the granting of stockoptions to employees during the year, compared to $nil in 2013.
Impairment of available-for-sale securities was $0.3 million in 2014, compared to $0.6 million in 2013. Thisrepresented an other-than-temporary decline in the value of our investment portfolio.
In 2014, we recognized a net foreign currency transaction loss of $6.3 million, compared to $2.2 million in 2013, inthe consolidated statement of operations. The loss in 2014 was primarily non-cash and relates to the settlement ofcertain intercompany accounts of subsidiaries with different functional currencies in pursuit of fiscally responsiblestrategies. To a lesser extent, we recognized a net currency translation loss on monetary assets and liabilities ofsubsidiaries which were denominated in currencies other than their functional currencies.
We recognized an income tax expense of $2.2 million in 2014, compared to a recovery of $1.0 million in 2013.Our statutory tax rate was 26.0% in 2014, compared to 25.75% in 2013, and our effective tax rates were lower thanour statutory tax rates in 2014. The income tax paid in cash during 2014 was $4.2 million, compared to $2.3 millionin 2013.
In 2014, our net income attributable to shareholders from continuing operations was $2.8 million, or $0.04 per shareon a basic and diluted basis, compared to net income attributable to shareholders from continuing operations of $4.3 million, or $0.07 per share on a basic and diluted basis, in 2013.
30
(1)
) )) )

(1) Includes net income attributable to non-controlling interests.
• to safeguard our ability to continue as a going concern so that we can continue to provide returns forshareholders and benefits for other stakeholders;
• to provide an adequate return to our shareholders by pricing products and services commensurately withthe level of risk; and
• to maintain a flexible capital structure that optimizes the cost of capital at acceptable risk.
TABLE OF CONTENTS
Our revenues from discontinued operations were $146.7 million for 2014, compared to $128.2 million for 2013.The increase was primarily the result of higher natural gas pricing.
In 2014, our loss from discontinued operations was $3.5 million, or $0.05 per share on a basic and diluted basis,which included a non-cash impairment on our hydrocarbon properties of $33.2 million, or $0.53 per share on abasic and diluted basis, before income taxes, compared to net income from discontinued operations of $5.4 million,or $0.09 per share, for 2013, which included a non-cash impairment loss on our hydrocarbon properties of $6.5million, or $0.10 per share on a basic and diluted basis, before income taxes. Please see Note 4 to our auditedconsolidated financial statements for the year ended December 31, 2015 for further information.
In 2014, our net loss attributable to shareholders was $0.7 million, or $0.01 per share on a basic and diluted basis,after giving effect to a non-cash impairment loss on hydrocarbon properties of $33.2 million, or $0.53 per share ona basic and diluted basis, before income taxes, compared to net income attributable to shareholders of $9.7 million,or $0.16 per share on a basic and diluted basis, in 2013 after giving effect to a non-cash impairment loss onhydrocarbon properties of $6.5 million, or $0.10 per share on a basic and diluted basis, before income taxes.
In 2014, our Operating EBITDA from continuing operations increased by approximately 62% to $24.5 million, or$0.39 per share on a basic and diluted basis, from $15.1 million, or $0.24 per share on a basic and diluted basis, in2013. Operating EBITDA from continuing operations is defined as earnings from continuing operations beforeinterest, taxes, depreciation, depletion, amortization and impairment.
Operating EBITDA from continuing operations is not a measure of financial performance under IFRS and shouldnot be considered in isolation or as a substitute for analysis of our results as reported under IFRS.
The following is a reconciliation of our net income to Operating EBITDA from continuing operations for each ofthe years indicated.
Years Ended December 31,2014 2013
Operating EBITDA from continuing operations (In thousands)Earnings from continuing operations $ 4,141 $ 4,156Income tax expense (recovery) 2,173 (997Finance costs 13,263 9,742Amortization, depreciation and depletion 4,957 2,206
Operating EBITDA from continuing operations $ 24,534 $ 15,107
Note:
Please see “ Non-IFRSFinancialMeasures” for additional information.
Liquidity and Capital Resources
General
Liquidity is of importance to our business as insufficient liquidity often results in underperformance.
Our objectives when managing capital are:
We set the amount of capital in proportion to risk. We manage our capital structure and make adjustments to it inthe light of changes in economic conditions and the risk characteristics of the underlying assets. In order to maintainor adjust this capital structure, we may adjust the amount of dividends paid to shareholders, return capital toshareholders, issue new shares or sell assets to reduce debt.
31
(1)
)

TABLE OF CONTENTS
Consistent with others in our industry, we monitor capital on the basis of our net debt-to-equity ratio and long-termdebt-to-equity ratio. The net debt-to-equity ratio is calculated as net debt divided by shareholders’ equity. Net debtis calculated as total debt less cash and cash equivalents. The long-term debt-to-equity ratio is calculated as long-term debt divided by shareholders’ equity. The computations are based on continuing operations.
The following table sets forth the calculation of our net debt-to-equity ratio as at the dates indicated:
December 31,2015 2014 2013
(In thousands, except ratio amounts)Total long-term debt $ 259,038 $ 363,255 $ 249,670Less: cash and cash equivalents (197,519 (344,891 (353,299Net debt (net cash and cash equivalents) 61,519 18,364 (103,629Shareholders’ equity 367,192 777,717 744,063Net debt-to-equity ratio 0.17 0.02 Not applicable
There were no amounts in accumulated other comprehensive income relating to cash flow hedges, nor were thereany subordinated debt instruments as at December 31, 2015, 2014 and 2013. Our net debt-to-equity ratio as atDecember 31, 2015 and 2014 was 0.17 and 0.02, respectively, and as at December 31, 2013 was not applicable, aswe had net cash and cash equivalents balances.
The following table sets forth the calculation of our long-term debt-to-equity ratio as at the dates indicated:
December 312015 2014 2013
(In thousands, except ratio amounts)Long-term debt, less current portion $ 174,333 $ 297,157 $ 201,947Shareholders’ equity 367,192 777,717 744,063Long-term debt-to-equity ratio 0.47 0.38 0.27
During 2015, our strategy, which remained unchanged from 2014 and 2013, was to maintain our net debt-to-equityratio and long-term debt-to-equity ratio at manageable levels. Our long-term debt-to-equity ratio was 0.47, 0.38 and0.27 as at December 31, 2015, 2014 and 2013, respectively.
Cash Flows
Due to the number of businesses we engage in, our cash flows are not necessarily reflective of net earnings and netassets for any reporting period. As a result, instead of using a traditional cash flow analysis solely based on cashflow statements, our management believes it is more useful and meaningful to analyze our cash flows by overallliquidity and credit availability. Please see the discussion on our financial position, short-term bank loans, facilitiesand long-term debt below.
The finance and supply chain business can be cyclical and our cash flows vary accordingly. Our principal operatingcash expenditures are for our working capital, proprietary investments and general and administrative expenses.
Working capital levels fluctuate throughout the year and are affected by the level of our finance and supply chainoperations, the markets and prices for commodities and the timing of receivables and the payment of payables andexpenses. Changes in the volume of transactions can affect the level of receivables and influence overall workingcapital levels. We currently have a sufficient level of cash on hand and credit facility amounts and we believe thatwe have sufficient cash flows from operations, cash on hand and credit availability to meet our working capital andother requirements as well as unexpected cash demands.
32
) ) ))

TABLE OF CONTENTS
The following table presents a summary of cash flows for our continuing operations for each of the years indicated:
Years Ended December 312015 2014 2013
(In thousands)Cash flows used in continuing operating activities $ (94,102 $ (48,638 $ (27,467Cash flows used in continuing investing activities $ (7,960 $ (105,121 $ (919Cash flows (used in) provided by continuing financing activities $ (49,488 $ 90,909 $ 89,905
Cash Flows from Continuing Operating Activities
Operating activities used cash of $94.1 million in 2015, compared to $48.6 million in 2014. In 2015, a decrease inshort-term bank borrowings used cash of $135.5 million, compared to $99.3 million in 2014. A decrease inreceivables (including derivative assets) provided cash of $56.3 million in 2015, compared to $3.6 million in 2014,primarily as a result of collections of trade receivables. A decrease in account payables and accrued expenses(including derivative liabilities) used cash of $17.0 million in 2015, compared to an increase in account payablesand accrued expenses providing cash of $13.4 million in 2014. A decrease in inventories provided cash of $15.7million in 2015, compared to an increase in inventories using cash of $32.0 million in 2014. An increase indeposits, pre-paid and other, used cash of $8.6 million in 2015, compared to a decrease in deposits, pre-paid andother, providing cash of $41.4 million in 2014. The increase in deposits, pre-paid and other, was primarily a resultof an increase in prepaid inventories.
Operating activities used cash of $48.6 million in 2014, compared to $27.5 million in 2013. In 2014, a decrease inshort-term bank borrowings used cash of $99.3 million, compared to $32.6 million in 2013. A decrease in deposits,prepaid and other provided cash of $41.4 million in 2014, compared to $32,000 in 2013. The decrease in 2014 wasprimarily a result of recovery of a prepaid item during 2014. An increase in inventories used cash of $32.0 millionin 2014, compared to a decrease in inventories providing cash of $33.5 million in 2013, primarily as a result of theconsolidation of our acquisitions in 2014. An increase in account payables and accrued expenses (includingderivative liabilities) provided cash of $13.4 million in 2014, compared to $5.6 million in 2013. A decrease inreceivables (including derivative assets) provided cash of $3.6 million in 2014, compared to an increase inreceivables using cash of $38.7 million in 2013. A decrease in restricted cash provided cash of $6.6 million in2014, compared to $0.6 million in 2013. A decrease in short-term cash deposits provided cash of $4.6 million in2014, compared to an increase in short-term cash deposits using cash of $4.3 million in 2013.
Cash Flows from Continuing Investing Activities
Investing activities used cash of $8.0 million in 2015, compared to $105.1 million in 2014, primarily in connectionwith our acquisitions in 2014. Purchases of property, plant and equipment, net of proceeds from dispositions, usedcash of $8.0 million in 2015, compared to $29.6 million in 2014.
Investing activities used cash of $105.1 million in 2014, compared to $0.9 million in 2013. Acquisitions ofsubsidiaries net of cash acquired used cash of $74.1 million in 2014, primarily in connection with our acquisitionsof two supply chain companies in 2014, compared to $6.6 million in 2013. Purchases of property, plant andequipment, net of proceeds from dispositions, primarily related to a power project in Alberta, Canada, used cash of $29.6 million in 2014, compared to $1.6 million in 2013. An increase in loan receivables used cash of $3.1 millionin 2014, compared to $nil in 2013. Proceeds from sales of long-term investments provided cash of $1.6 million in2014, compared to $7.2 million in 2013.
Cash Flows from Continuing Financing Activities
Net cash used by financing activities was $49.5 million in 2015, compared to net cash provided by financingactivities of $90.9 million in 2014. A net decrease in debt used cash of $43.9 million in 2015, compared to a netincrease in debt providing $127.7 million in 2014. In 2015, dividends paid to our shareholders used cash of $4.4million in connection with the fourth instalment of our 2014 dividend, which was paid in the first quarter of 2015,compared to $12.5 million in 2014.
Net cash provided by financing activities was $90.9 million in 2014, compared to $89.9 million in 2013. A netincrease in debt provided cash of $127.7 million in 2014, compared to $82.5 million in 2013. In 2014, dividendspaid to our shareholders used cash of $12.5 million, compared to $15.4 million in 2013. The fourth installment ofour dividend declared in 2014 was paid in January 2015. A repayment to a customer
33
) ) )) ) ))

TABLE OF CONTENTS
used cash of $23.6 million in 2014, compared to providing cash of $23.6 million in 2013. On December 31, 2013,a customer paid $23.6 million to one of the Company’s subsidiaries. However, the underlying invoice was subjectto factoring arrangements and the amount was subsequently repaid in January 2014. As a result, $23.6 million wasrecognized as a repayment to a customer in 2014. No income or loss was recognized in connection with suchtransactions. Dividends paid to non-controlling interests used cash of $1.0 million in 2014, compared to $0.8million in 2013.
Cash Flows from Discontinued Operations
Discontinued operating activities used cash of $10.2 million in 2015, compared to providing cash of $51.6 millionand $45.3 million in 2014 and 2013, respectively.
Discontinued investing activities used cash of $2.0 million in 2015, compared to $13.7 million and $7.2 million in2014 and 2013, respectively.
Discontinued financing activities used cash of $19.2 million in 2015, compared to $19.8 million and $41.1 millionin 2014 and 2013, respectively.
Financial Position
The following table sets out our selected financial information as at the dates indicated:
December 31,2015 2014
(In thousands)Cash and cash equivalents $ 197,519 $ 344,891Short-term cash deposits 233 184Short-term securities 170 290Securities – derivatives 5,555 6,274Restricted cash 639 644Trade receivables 151,229 187,558Tax receivables 11,705 15,339Other receivables 14,727 26,406Inventories 245,345 246,611Real estate held for sale 1,130 13,970Deposits, prepaid and other 21,442 8,985Assets held for sale 136,156 152,107Total assets 977,351 1,692,219Working capital 371,288 562,486Short-term bank borrowings 60,103 187,171Debt, current portion 84,705 66,098Account payables and accrued expenses 174,812 158,345Dividends payable — 4,388Income tax liabilities 3,809 4,963Liabilities relating to assets held for sale 87,579 17,802Long-term debt, less current portion 174,333 297,157Deferred income tax liabilities 13,711 11,852Decommissioning obligations — 150,299Shareholders’ equity 367,192 777,717
We maintain an adequate level of liquidity, with a portion of our assets held in cash and cash equivalents andsecurities. The liquid nature of these assets provides us with flexibility in managing and financing our business andthe ability to realize upon investment or business opportunities as they arise. We also use this liquidity in client-related services by acting as a financial intermediary for third parties (e.g., by acquiring a position or assets andreselling such position or assets) and for our own proprietary trading and investing activities.
As at December 31, 2015, cash and cash equivalents decreased to $197.5 million from $344.9 million as atDecember 31, 2014, primarily as a result of the repayment of borrowings.
Trade receivables and other receivables were $151.2 million and $14.7 million, respectively, as December 31, 2015,compared to $187.6 million and $26.4 million, respectively, as at December 31, 2014. The decrease in
34

TABLE OF CONTENTS
trade receivables was primarily as a result of collections, increased factoring and an increase in an allowance forcredit losses, partially offset by the increase in receivables resulting from higher sales and the impact of the weakerCanadian dollar against the Euro.
Inventories decreased to $245.3 million as at December 31, 2015, from $246.6 million as at December 31, 2014. Asat December 31, 2015, $13.7 million and $127.6 million of such inventories were initially financed by suppliers andshort-term bank borrowings, respectively. $141.3 million of our inventories were contracted at fixed prices orhedged as at December 31, 2015.
Assets held for sale, consisting of our discontinued operations, were $136.2 million, which consisted of certainhydrocarbon properties, iron ore interests and an amount due from our former subsidiaries, as at December 31,2015, compared to $152.1 million, which consisted of certain hydrocarbon properties and investment property, as atDecember 31, 2014. The decrease in assets held for sale was a result of our decision to sell additional hydrocarbonproperties, reduced by impairment losses recognized on the assets.
Deposits, prepaid and other assets were $21.4 million as at December 31, 2015, compared to $9.0 million as atDecember 31, 2014.
Tax receivables, consisting primarily of refundable value-added taxes, were $11.7 million as at December 31, 2015,compared to $15.3 million as at December 31, 2014.
We had short-term financial assets relating to derivatives of $5.6 million as at December 31, 2015, compared to$6.3 million as at December 31, 2014. We had current liabilities relating to derivatives of $3.6 million as atDecember 31, 2015, compared to $2.0 million as at December 31, 2014. Such derivatives relate to commodities andcurrencies.
Account payables and accrued expenses were $174.8 million as at December 31, 2015, compared to $158.3 millionas at December 31, 2014. The increase was primarily due to the provision for payments under guarantees, partiallyoffset by the reclassification of liabilities related to our assets held for sale and fluctuations in the timing ofpayments of certain invoices in the ordinary course of business.
As at December 31, 2015, we had liabilities relating to assets held for sale of $87.6 million, which includeddecommissioning obligations, bank debt and other liabilities associated with such assets, compared to $17.8 millionas at December 31, 2014, which comprised decommissioning obligations only. The increase was as a result of areclassification of assets held for sale as at December 31, 2015.
Our short-term bank borrowings decreased to $60.1 million as at December 31, 2015, from $187.2 million as atDecember 31, 2014. Total long-term debt decreased to $259.0 million as at December 31, 2015, from $363.3million as at December 31, 2014, primarily as a result of repayments and the re-classification of liabilities related toour assets held for sale. Our decommissioning obligations decreased to $nil as at December 31, 2015 from $150.3million as at December 31, 2014, as a result of the re-classification of decommissioning obligations related to assetsheld for sale.
As at December 31, 2015, we had deferred income tax liabilities of $13.7 million, compared to $11.9 million as atDecember 31, 2014.
Short-Term Bank Loans and Facilities
As part of our operations, we establish, utilize and maintain various kinds of credit lines and facilities with banksand insurers. Most of these facilities are short-term. These facilities are used in our day-to-day structured solutionsand supply chain business. The amounts drawn under such facilities fluctuate with the kind and level of transactionsbeing undertaken.
As at December 31, 2015, we had credit facilities aggregating $900.8 million comprised of: (i) unsecured revolvingcredit facilities aggregating $429.6 million from banks. The banks generally charge an interest rate of inter-bankrates plus an interest margin; (ii) revolving credit facilities aggregating $116.2 million from banks for structuredsolutions, a special trade financing. The margin is negotiable when the facility is used; (iii) a non-recourse speciallystructured factoring arrangement with a bank for up to a credit limit of $248.7 million for our supply chainactivities. We may factor our receivable accounts upon invoicing at the inter-bank rate plus a margin; (iv) foreignexchange credit facilities of $80.4 million with banks; and (v) secured revolving credit facilities aggregating $25.7million. All of these facilities are either renewable on a yearly basis or usable until further notice. A substantialportion of our credit facilities are denominated in Euros and, accordingly, such amounts may fluctuate whenreported in Canadian dollars.
35

TABLE OF CONTENTS
In addition, we have margin lines with availability at multiple brokers, which enable us to hedge over $138.4million (US$100.0 million) notional value of industrial products.
Long-Term Debt
Other than lines of credit drawn and as may be outstanding for trade financing and structured solutions activities, asat December 31, 2015, the maturities of our long-term debt from our continuing operations were as follows:
Maturity Principal Interest Total (In thousands)
2016 $ 84,705 $ 7,333 $ 92,0382017 34,886 5,170 40,0562018 44,452 3,998 48,4502019 29,404 2,649 32,0532020 26,778 1,714 28,492Thereafter 38,813 1,491 40,304
$ 259,038 $ 22,355 $ 281,393
We expect our maturing debt to be satisfied primarily through the settlement of underlying supply chaintransactions, trade financing transactions, including structured solutions transactions, cash on hand and cash flowsfrom operations. Much of our maturing debt may either subsequently be made re-available to us by the applicablefinancial institution or we may replace such facilities with new facilities depending upon particular capitalrequirements.
Please refer to Note 15 to our audited consolidated financial statements for the year ended December 31, 2015 forfurther information regarding interest rates, maturities and other terms and conditions for our bank debts.
Future Liquidity
We expect that there will be acquisitions of businesses or commitments to projects in the future. To achieve thelong-term goals of expanding our assets and earnings, including through acquisitions, capital resources will berequired. Depending on the size of a transaction, the capital resources that will be required can be substantial. Thenecessary resources will be generated from cash flows from operations, cash on hand, borrowings against ourassets, sales of proprietary investments or the issuance of securities.
Foreign Currency
Substantially all of our operations are conducted in international markets and our consolidated financial results aresubject to foreign currency exchange rate fluctuations.
Effective December 31, 2015, our presentation currency is the Canadian dollar. We translate subsidiaries’ assetsand liabilities into Canadian dollars at the rate of exchange on the balance sheet date. Revenues and expenses aretranslated at exchange rates approximating those at the date of the transactions or, for practical reasons, the averageexchange rates for the applicable periods, when they approximate the exchange rate as at the dates of thetransactions. As a substantial amount of revenues is generated in Euros, the financial position for any given period,when reported in Canadian dollars, can be significantly affected by the exchange rates for these currenciesprevailing during that period. In addition, we also have exposure to the Chinese yuan and the United States dollar.
In the year ended December 31, 2015, we reported a net $79.5 million currency translation adjustment gain underother comprehensive income within equity. This compared to net gains of $45.6 million and $16.9 million in 2014and 2013, respectively. This currency translation adjustment did not affect our profit and loss statement. Theincrease in 2015 was primarily a result of the strengthening of the Euro and the United States dollar against theCanadian dollar and the increase in 2014 was primarily a result of the strengthening of the United States dollaragainst the Canadian dollar.
36

(1) Undiscounted.
(2) This table does not include non-financial instrument liabilities, guarantees and liabilities relating to assets held for sale.
(1) Revenues and costs of sales and services for the periods have been reclassified to present certain transactions on a net basis. Thishad no impact on our net income from operations, net income, cash flow statements or financial position for such periods. Pleasesee “ Item5:OperatingandFinancialReviewandProspects–PriorPeriods” for further information.
(2) Attributable to our shareholders.
TABLE OF CONTENTS
Contractual Obligations
The following table sets out our contractual obligations and commitments from continuing operations as atDecember 31, 2015 in connection with our long-term liabilities.
Payments Due by Period (In thousands)
Contractual Obligations Less than
1 Year 1 – 3 Years 3 – 5 YearsMore than
5 Years Total Long-term debt obligations, including
interest $ 92,038 $ 88,506 $ 60,545 $ 40,304 $ 281,393Operating lease obligations 2,006 2,975 2,580 1,266 8,827Purchase obligations 71,865 — — — 71,865Other long-term liabilities — 504 177 — 681Total $ 165,909 $ 91,985 $ 63,302 $ 41,570 $ 362,766
Notes:
Risk Management
Risk is an inherent part of our business and operating activities. The extent to which we properly and effectivelyidentify, assess, monitor and manage each of the various types of risk involved in our activities is critical to ourfinancial soundness and profitability. We seek to identify, assess, monitor and manage the following principal risksinvolved in our business activities: market, credit, liquidity, operational, legal and compliance, new business,reputational and other. Risk management is a multi-faceted process that requires communication, judgment andknowledge of financial products and markets. Our management takes an active role in the risk management processand requires specific administrative and business functions to assist in the identification, assessment and control ofvarious risks. Our risk management policies, procedures and methodologies are fluid in nature and are subject toongoing review and modification.
Inflation
We do not believe that inflation has had a material impact on our revenues or income over the past two fiscal years.However, increases in inflation could result in increases in our expenses, which may not be readily recoverable inthe price of goods or services provided to our clients. To the extent that inflation results in rising interest rates andhas other adverse effects on capital markets, it could adversely affect our financial position and profitability.
Summary of Quarterly Results
The following tables provide selected unaudited financial information for the most recent eight quarters:
December 31,
2015 September 30,
2015June 30,
2015March 31,
2015 (Restated)
(In thousands, except per share amounts)Gross revenues $ 406,164 $ 403,697 $ 420,284 $ 349,557Net (loss) income from continuing operations (71,160 399 5,818 5,399(Loss) earnings from continuing operations, per share
Basic (1.13 0.01 0.09 0.09Diluted (1.13 0.01 0.09 0.09
Net (loss) income (111,807 (392,208 8,549 7,836(Loss) earnings, per share
Basic (1.77 (6.21 0.14 0.12Diluted (1.77 (6.21 0.14 0.12
Notes:
37
(1)
(2)
(1)
(1) (1) (1)( 2 ) ) (3)
) (3)
) (3)( 2 ) ) ( 3 ) (4) ) ( 5 )
) ( 3 ) (4) ) ( 5 )
) ( 3 ) (4) ) ( 5 )

(3) Includes losses of $51.4 million related to a customer that filed for insolvency in February 2016 and $9.9 million on long-term off-take agreements entered into by a subsidiary acquired in 2014, which have since been terminated. Please see “ Item5:OperatingandFinancialReviewandProspects — ResultsofOperations” for further information.
(4) Includes non-cash impairments of $52.9 million recognized on our hydrocarbon properties and the reversal of non-cashimpairment losses of $30.0 million and the recognition of a deferred tax liability of $7.8 million in connection therewith.
(5) Includes non-cash impairments of $143.6 million, before a reduction of deferred tax assets of $50.9 million, and $245.6 million,before an income tax recovery of $54.3 million, respectively, recognized on our hydrocarbon properties and iron ore interests.
(1) We commenced consolidation of the operations of two acquired supply chain companies from March 31 and April 1, 2014,respectively.
(2) Revenues and costs of sales and services for the periods have been reclassified to present certain transactions on a net basis. Thishad no impact on our net income from operations, net income, cash flow statements or financial position for such periods. Pleasesee “ Item5:OperatingandFinancialReviewandProspects–PriorPeriods” for further information.
(3) Attributable to our shareholders.
(4) Includes a non-cash impairment of interests in resource properties of $33.2 million before an income tax recovery of $8.4 million.
TABLE OF CONTENTS
December 31,
2014 September 30,
2014 June 30, 2014
March 31, 2014
(Restated) (In thousands, except per share amounts)
Gross revenues $ 346,560 $ 360,260 $ 388,264 $ 191,240Net (loss) income from continuing operations 3,659 (4,909 3,290 743(Loss) earnings from continuing operations, per share
Basic 0.06 (0.08 0.05 0.01Diluted 0.06 (0.08 0.05 0.01
Net income (loss) (21,797 6,990 7,720 6,405Earnings (loss), per share
Basic (0.35 0.11 0.12 0.10Diluted (0.35 0.11 0.12 0.10
Notes:
Application of Critical Accounting Policies
The preparation of financial statements in conformity with IFRS requires our management to make estimates andassumptions that affect the reported amounts of assets and liabilities and disclosure of contingent assets andliabilities at the date of the financial statements and the reported amounts of revenues and expenses during thereporting periods.
Our management routinely makes judgments and estimates about the effects of matters that are inherently uncertain.As the number of variables and assumptions affecting the probable future resolution of the uncertainties increase,these judgments become even more subjective and complex. We have identified certain accounting policies that arethe most important to the portrayal of our current financial condition and results of operations. Please refer to Note1 to our audited consolidated financial statements included in this annual report on Form 20-F for a discussion ofthe significant accounting policies.
The following accounting policies are the most important to our ongoing financial condition and results ofoperations from continuing operations:
Allowance for Credit Losses
We apply credit risk assessment and valuation methods to our trade and other receivables. Credit losses ariseprimarily from receivables but may also relate to other credit instruments issued by or on our behalf, such asguarantees and letters of credit. An allowance for credit losses is increased by provisions which are charged toincome and reduced by write-offs net of any recoveries.
Specific provisions are established on an individual receivable basis. A country risk provision may be made basedon exposures in less developed countries and on our management’s overall assessment of the underlying economicconditions in those countries.
38
(1)
(2)
(2) (2) (2) (2)
( 3 ) )
))
( 3 ) ) ( 4 )
))

(a) during the period, the asset’s market value has declined significantly more than would be expected as aresult of the passage of time or normal use;
(b) significant changes with an adverse effect on the entity have taken place during the period, or will takeplace in the near future, in the technological, market, economic or legal environment in which the entityoperates or in the market to which an asset is dedicated;
(c) market interest rates or other market rates of return on investments have increased during the period, andthose increases are likely to affect the discount rate used in calculating an asset’s value in use anddecrease the asset’s recoverable amount materially;
(d) the carrying amount of the net assets of the entity is more than its market capitalization;
(e) evidence is available of obsolescence or physical damage of an asset;
(f) significant changes with an adverse effect on the entity have taken place during the period, or areexpected to take place in the near future, in the extent to which, or manner in which, an asset is used or isexpected to be used. These changes include the asset becoming idle, plans to discontinue or restructurethe operation to which an asset belongs, plans to dispose of an asset before the previously expected dateand reassessing the useful life of an asset as finite rather than indefinite; and
(g) evidence is available from internal reporting that indicates that the economic performance of an asset is,or will be, worse than expected.
TABLE OF CONTENTS
Our allowance for credit losses is maintained at an amount considered adequate to absorb estimated credit-relatedlosses. Such allowance reflects our management’s best estimate of the losses in our receivables and judgmentsabout economic conditions. The assessment of allowance for credit losses is a complex process, which involve asignificant degree of judgement and a high level of estimation uncertainty. The input factors include our legal rightsand obligations under all the contracts and the expected future cash flows from the receivables and their collateralwhich include inventories, mortgages and other credit enhancement instruments. The major source of estimationuncertainty relates to the likelihood of the various scenarios under which different amounts are expected to berecovered through the security in place on the receivables. The expected future cash flows are projected underdifferent scenarios and weighted by probability, which involves the exercise of significant judgment. Estimates andjudgments could change in the near-term, and could result in a significant change to a recognized allowance.
In addition, we also provide credit losses for our credit exposures arising from guarantees we issued. The lossassessment process, as well as the exercise of judgment and estimation uncertainty, are similar to the precedingparagraph.
Classification of Assets Held for Sale
We apply judgment to determine whether an asset (disposal group) is available for immediate sale in its presentcondition and that its sale is highly probable and therefore should be classified as held for sale at the balance sheetdate. In order to assess whether it is highly probable that the sale can be completed within one year or the extensionperiod in certain circumstances, our management reviews the business and economic factors, both macro and micro,which include the industry trends and capital markets. It is also open to all forms of sales, including exchanges ofnon-current assets for other non-current assets when the exchange will have commercial substance in accordancewith IAS 16, Property,PlantandEquipment.
Non-Cash Impairment of Non-Financial Assets
We assess at the end of each reporting period whether there is any indication that an asset may be impaired. If anysuch indication exists, we estimate the recoverable amount of the asset. In assessing whether there is any indicationthat an asset may be impaired, we consider, as a minimum, the following indications:
External sources of information
Internal sources of information
Income Taxes
Management believes that it has adequately provided for income taxes based on all of the information that iscurrently available. The calculation of income taxes in many cases, however, requires significant judgment ininterpreting tax rules and regulations, which are constantly changing.
39

• the history of the tax loss carry-forwards and their expiry dates;
• future reversals of temporary differences;
• our projected earnings; and
• tax planning opportunities.
TABLE OF CONTENTS
Our tax filings are also subject to audits, which could materially change the amount of current and deferred incometax assets and liabilities. Any change would be recorded as a charge or a credit to income tax expense. Any cashpayment or receipt would be included in cash from operating activities.
We currently have deferred income tax assets, which are comprised primarily of tax loss carry-forwards anddeductible temporary differences, both of which will reduce taxable income in the future. The amounts recorded fordeferred income tax assets are based upon various judgments, assumptions and estimates. We assess the realizationof these deferred income tax assets on a periodic basis to determine to what extent it is probable that taxable profitwill be available against which the deductible temporary differences and the carry-forward of unused tax credits andunused tax losses can be utilized. We determine whether it is probable that all or a portion of the deferred incometax assets will be realized, based on currently available information, including, but not limited to, the following:
On the reporting date, we also reassess unrecognized deferred income tax assets. We recognize a previouslyunrecognized deferred income tax asset to the extent that it has become probable that future taxable profit will allowthe deferred income tax asset to be recovered.
We provide for future liabilities in respect of uncertain tax positions where additional tax may become payable infuture periods and such provisions are based on our management’s assessment of exposures. We do not recognizethe full deferred income tax liability on taxable temporary differences associated with investments in subsidiaries,joint ventures and associates where we are able to control the timing of the reversal of the temporary differencesand it is probable that the temporary differences will not reverse in the foreseeable future. We may change ourinvestment decision in the normal course of our business, thus resulting in additional tax liability.
New Standards and Interpretations Adopted and Not Yet Adopted
IFRS 9, FinancialInstruments, referred to as “IFRS 9”, issued in July 2014 is the IASB’s replacement of IAS 39,FinancialInstruments:RecognitionandMeasurement, referred to as “IAS 39”. IFRS 9 includes requirements forrecognition and measurement, impairment, derecognition and general hedge accounting. The version of IFRS 9issued in 2014 supersedes all previous versions and is mandatorily effective for periods beginning on or afterJanuary 1, 2018 with early adoption permitted (subject to local endorsement requirements). Management hasdecided not to early apply IFRS 9 and is currently assessing the impacts of IFRS 9 on our consolidated financialstatements.
IFRS 15, RevenuefromContractswithCustomers, referred to as “IFRS 15”, specifies how and when an entity willrecognize revenue as well as requiring such entities to provide users of financial statements with more informative,relevant disclosures. The standard provides a single, principles based five-step model to be applied to all contractswith customers. IFRS 15 was issued in May 2014 and applies to annual periods beginning on or after January 1,2018. Management is currently assessing the impacts of IFRS 15 on our consolidated financial statements.
Amendments to IFRS 10, Consolidated Financial Statements, and IAS 28, Investments in Associates and JointVentures, were issued in September 2014 and are effective for years beginning on or after January 1, 2016, to beapplied prospectively. The amendments require that upon loss of control of a subsidiary during its transfer to anassociate or joint venture, full gain recognition on the transfer is appropriate only if the subsidiary meets thedefinition of a business in IFRS 3, to the extent of the company’s share and unless the principles of IFRS 3 conflictwith the guidance under IFRS 11. Adoption of these amendments is not expected to have significant impact on ourconsolidated financial statements.
Amendments to IFRS 11, JointArrangements, referred to as “IFRS 11”, were issued in May 2014 and are effectivefor years beginning on or after January 1, 2016, to be applied prospectively. The amendments clarify that anacquisition of an interest in a joint operation that is a business should be accounted for by a company and disclosedas a business combination in accordance with IFRS 3, Business Combinations , referred to as “IFRS 3”, to theextent of the company’s share and unless the principles of IFRS conflict with the guidance under IFRS 11.Adoption of these amendments is not expected to have a significant impact on our consolidated financialstatements.
40

TABLE OF CONTENTS
Trend Information
For a discussion of trends relating to revenues derived from our royalty interest, please see “ Item4:InformationontheCompany–B.BusinessOverview–BusinessSegments–FinanceandSupplyChain”.
Off-Balance Sheet Arrangements
We do not have any off-balance sheet arrangements that have or are reasonably likely to have a current or futureeffect on our financial condition, changes in financial condition, revenues or expenses, results of operations,liquidity, capital expenditures or capital resources that are material to investors.
We have outstanding issued guarantees held by our external trading and financial partners in connection with ourfinance and supply chain activities. As at December 31, 2015, we had issued guarantees of up to a maximum of $14.1 million, being the total potential principal amount that may be guaranteed thereunder, of which $0.4 millionwere outstanding and have not been recorded as liabilities in our consolidated statement of financial position. Therehas been no claim against the guarantees.
Safe Harbor
The safe harbor provided in Section 27A of the Securities Act of 1933, as amended, and Section 21E of theSecurities Exchange Act of 1934, as amended, applies to forward-looking information provided under “ Off-BalanceSheetArrangements” and “ LiquidityandCapitalResources–ContractualObligations”.
41

(1) Mr. Smith was appointed Chairman in March 2016.
(2) Member of our Compensation Committee.
(3) Member of our Audit Committee.
(4) Member of our Nominating and Corporate Governance Committee.
(5) Mr. Hondl was appointed a director in October 2015.
(6) Mr. Dümler was appointed a director in January 2016.
TABLE OF CONTENTS
ITEM 6: DIRECTORS, SENIOR MANAGEMENT AND EMPLOYEES
A. Directors and Senior Management
We have no arrangement or understanding with major shareholders, customers, suppliers or others pursuant towhich any of our directors or officers was selected as a director or officer. Each director holds office until the nextannual general meeting of our shareholders or until his or her successor is elected or appointed unless such office isearlier vacated in accordance with our Articles or with the provisions of the Business Corporations Act (BritishColumbia). The following table sets forth the names of each of our directors and officers as at the date hereof:
Name (Age) Present Position
Date of Commencement of
Office with our Company
Gerardo Cortina (60) President and Chief Executive Officer and Director 2014Samuel Morrow (31) Deputy Chief Executive Officer and
Chief Financial Officer2014
Ferdinand Steinbauer (59) Treasurer 2014Michael J. Smith (68) Chairman and Managing Director 1986Dr. Shuming Zhao (63) Director 2014Indrajit Chatterjee (70) Director 2005Silke S. Stenger (47) Director 2013Friedrich Hondl (55) Director 2015Jochen Dümler (61) Director 2016
Notes:
GerardoCortina–PresidentandChiefExecutiveOfficer
Mr. Cortina was appointed President and Chief Executive Officer in May 2014. Mr. Cortina was managing directorof Possehl Mexico S.A. de S.V., referred to as “Possehl”, from 1986 until June 2014. Possehl has been active intrading and distribution of metals, mineral products, chemicals and ferroalloys to the iron and steel, foundry,refractory, plastics, paints, animal feed and chemicals industries. Mr. Cortina has successfully developed exportmarkets in Central America, the Caribbean and South America. Mr. Cortina has over 25 years of experience in thesupply chain business. Mr. Cortina has a Master of Business Administration from the Wharton School of Businessat the University of Pennsylvania.
SamuelMorrow–DeputyChiefExecutiveOfficerandChiefFinancialOfficer
Mr. Morrow was appointed Chief Financial Officer in June 2014 and was appointed Deputy Chief ExecutiveOfficer in May 2014. Mr. Morrow is a Chartered Financial Analyst and was most recently a Vice President of MFCin Vienna, Austria. Before joining MFC, Mr. Morrow was Vice President of Tanaka Capital Management andTreasurer, Chief Financial Officer and Chief Operating Officer of the Tanaka Growth Fund. Mr. Morrow is agraduate of St. Lawrence University.
FerdinandSteinbauer–Treasurer
Mr. Steinbauer was appointed Treasurer in March 2014. He is currently also a Managing Director of MFCCommodities GmbH and has held that position since 1998. Previously he served as Treasurer for 20 years withKNP Leykam Austria (later acquired by SAPPI). Mr. Steinbauer holds a degree from the Austrian CommercialAcademy in Graz and has over 35 years of experience in banking, structured trade finance and risk management.
42
(1)
(2)(3)(4)
(2)(4)
(2)(3)(4)
(3)(5)
(6)(2)

TABLE OF CONTENTS
MichaelJ.Smith–ChairmanandManagingDirector
Mr. Smith has been a director of our company since 1986 and was appointed Chairman in March 2016. Mr. Smithwas appointed our Managing Director in May 2014, having served as our President and Chief Executive Officerfrom 1996 to 2000 and from 2010 to May 2014 and Chief Financial Officer from 2010 to March 2014. He was ourSecretary until March 1, 2008. Mr. Smith was also previously the President, Chief Executive Officer, Secretary anda director of Mass Financial Corp. and has served as a director and officer of various public companies. Mr. Smithhas experience in corporate finance and restructuring.
Dr.ShumingZhao–Director
Dr. Zhao was a director of our company from 2004 until December 2013 and was re-appointed to the board ofdirectors in March 2014. Dr. Zhao is the Chair Professor and Honorary Dean of the School of Business, NanjingUniversity in the People’s Republic of China. He also serves as President of the International Association ofChinese Management Research (IACMR, Third Term), Vice-President of Chinese Society of ManagementModernization, President of the Jiangsu Provincial Association of Human Resource Management and Vice-President of the Jiangsu Provincial Association of Business Management and Entrepreneurs. Since 1994, Dr. Zhaohas acted as a management consultant for several Chinese and international firms. He has also served as a directorof Daqo New Energy Corp. (China) since October 2011 and was a director of Little Swan Company, Ltd. (China)from 2009 to 2014. Dr. Zhao has successfully organized and held eight international symposia on multinationalbusiness management. Dr. Zhao worked as a visiting professor at Marshall School of Business, University ofSouthern California, U.S.A. in 1997 to 2003. Now he is the Distinguished Visiting Professor at the College ofBusiness, University of Missouri-St. Louis, U.S.A. and the Distinguished Visiting Professor at the Katz GraduateSchool of Business, University of Pittsburgh, U.S.A. He has also lectured in various countries, including the UnitedStates, Canada, Japan, Singapore, South Korea, the United Kingdom, Germany, the Netherlands, Portugal andAustralia.
IndrajitChatterjee–Director
Mr. Chatterjee has been a director of our company since 2005. He is a retired businessman who was formerlyresponsible for marketing with the Transportation Systems Division of General Electric for India. Mr. Chatterjee isexperienced in dealing with Indian governmental issues.
SilkeS.Stenger–Director
Ms. Stenger has been a director of our company since August 2013. She is an independent business consultant andbusiness leadership coach, was a director of our company when our company was KHD Humboldt WedagInternational Ltd. from 2003 to 2010 and was a director of KHD Humboldt Wedag International AG from 2010 to2012. Ms. Stenger was the Chief Financial Officer of Management One Human Capital Consultants Ltd. from 2006to 2011. Ms. Stenger is a certified controller (German Chamber of Commerce IHK) and IFRS accountant,specializing in corporate governance and Sarbanes-Oxley compliance.
FriedrichHondl–Director
Mr. Hondl has been a director of our company since October 2015. He is an experienced European bankingexecutive and former member of the Supervisory Board of Oesterreichische Kontrollbank AG, the Austrian ExportCredit Agency. From 2013 to 2015, Mr. Hondl was the head of Erste Group Bank AG’s Large CorporatesInternational Division and, from 2009 to 2012, he was the head of International Corporate RelationshipManagement of UniCredit Bank Austria AG. Mr. Hondl has also served as Chairman of the Supervisory Board ofIntermarket Bank AG since 2014.
JochenDümler–Director
Mr. Dümler has been a director of our company since January 2016. He was the former President and ChiefExecutive Officer of Euler Hermes North America. From 2002 to 2010, Mr. Dümler was a Member of the Board ofManagement of Euler Hermes Kreditversicherung AG and, from 1995 to 2002, he was a Member of the Board ofManagement of PRISMA Kreditversicherung AG. Mr. Dümler is a member of the German-American Chamber ofCommerce (New York City), a Member of the German Executive Roundtable (Washington, D.C.) and a BoardMember of the German-American Partnership Program.
43

(1) All awards under MFC’s non-equity incentive compensation plans are paid during the financial year they were earned.
(2) Consists of housing and car allowances and other customary perquisites.
(3) Consists of housing allowance and other customary perquisites.
(4) Consists of housing allowances and expenses.
(5) Mr. Konsbruck has resigned, effective May 2016.
TABLE OF CONTENTS
Family Relationships
There are no family relationships between any of our directors and executive officers.
B. Compensation
During the fiscal year ended December 31, 2015, we paid an aggregate of approximately $4.5 million in cashcompensation to our directors and officers, excluding directors’ fees. No other funds were set aside or accrued byour company during the fiscal year ended December 31, 2015 to provide pension, retirement or similar benefits forour directors or officers pursuant to any existing plan provided or contributed to by us.
Executive Officers
The following table provides a summary of compensation paid by us during the fiscal year ended December 31,2015 to our Managing Director, President and Chief Executive Officer, Chief Financial Officer and each of our twomost highly compensated executive officers (or persons acting in a similar capacity) whose total compensation forthe fiscal year exceeded $150,000:
Non-equity incentive compensation plan
compensation ($)
Name and Principal PositionSalary
($)
Share- based
awards ($)
Option- based
awards ($)
Annual incentive
plans
Long- term
incentive plans
Pension value
($)
All other compensation
($)
Total compensation
($) Gerardo Cortina
President and ChiefExecutive Officer 840,645 — — 226,328 — — 123,026 1,189,999
Samuel Morrow Chief Financial Officerand Deputy ChiefExecutive Officer 312,332 — — 205,840 — — 3,259 521,431
Michael J. Smith Chairman and ManagingDirector 596,895 — — 135,083 — — 275,278 1,007,256
Ferdinand Steinbauer Treasurer 462,182 — — 205,840 — — — 668,022
Guy Konsbruck Executive Vice-President
473,923 — — 140,491 — — — 614,414
Notes:
44
(1)
(2)
(3)
(4)
(5)

(1) Compensation provided to Mr. Cortina, in his capacity as Chief Executive Officer is disclosed in the table above under the heading“ ExecutiveOfficers”.
(2) Compensation provided to Mr. Smith, in his capacity as managing director is disclosed in the table above under the heading “ExecutiveOfficers”.
(3) Mr. Hondl was appointed as a director in October 2015.
(4) Mr. Dümler was appointed as a director in January 2016.
(5) Mr. Kellogg stepped down as a director in July 2015.
(6) Mr. Horn stepped down as a director in July 2015.
TABLE OF CONTENTS
Directors’ Compensation
The following table provides a summary of compensation paid by us to, or earned by, the directors of our companyduring the fiscal year ended December 31, 2015.
Director Compensation Table
Name
Fees Earned
($)
Share- based
awards ($)
Option- based
awards ($)
Non-equity incentive plan compensation
($)
Pension value
($)
All other compensation
($) Total
($) Gerardo Cortina — — — — — — —Michael J. Smith — — — — — — —Dr. Shuming Zhao 78,493 — — — — — 78,493Indrajit Chatterjee 118,251 — — — — — 118,251Silke S. Stenger 148,549 — — — — — 148,549Friedrich Hondl 13,616 — — — — — 13,616Jochen Dümler — — — — — — —Peter Kellogg 52,064 — — — — — 52,064William C. Horn III 67,959 — — — — — 67,959
Notes:
A total of $0.5 million was paid to our directors for services rendered as directors, or for committee participation orassignments, during our most recently completed financial year. Our directors are each paid an annual fee ofUS$25,000 and US$2,500 for each director’s meeting attended as well as additional fees, as applicable, for theirrespective participation on our Audit and Compensation Committees. We also reimburse our directors and officersfor expenses incurred in connection with their services as directors and officers.
Employment Agreements
MichaelSmith
In July 2014, we entered into a two-year consulting agreement with Mr. Smith in connection with his appointmentas our Managing Director. Pursuant to the agreement, among other things, we agreed to pay Mr. Smith an annualbase fee of US$460,000 and an annual discretionary bonus and provide him certain customary perquisites. Theagreement also entitles Mr. Smith to receive under our 2014 Equity Incentive Plan, referred to herein as the “2014Plan”, which was approved by our shareholders at our 2014 Annual General and Special Meeting of Shareholdersheld on November 14, 2014, referred to as the “Meeting”: (i) 100,000 restricted stock units, which “time only”vested on the first anniversary of the grant date and the balance of which will vest on the second anniversary of thegrant date; and (ii) performance share units with a target value of 200% of Mr. Smith’s annual base fee. IfMr. Smith’s engagement with us is terminated by us for any reason other than for just cause or he resigns for goodreason, he will be entitled to a lump sum cash payment equal to his base fee for the balance of the term followingsuch termination.
GerardoCortina
We entered into an employment agreement with Mr. Cortina effective May 2014, in connection with hisappointment as our President and Chief Executive Officer. Pursuant to the agreement, we will pay Mr. Cortina anannual base salary of US$650,000 (subject to annual review) and an annual discretionary
45
(1)
(2)
(3)
(4)
(5)
(6)

TABLE OF CONTENTS
bonus and provide him certain customary perquisites. The agreement also entitles Mr. Cortina to receiveperformance share units under the 2014 Plan with a target value of no less than 100% of his base salary for each ofthe years ending December 31, 2014, 2015 and 2016. If Mr. Cortina’s employment is terminated by us other thanfor just cause, or by Mr. Cortina for good reason, he will be entitled to a severance payment, payable in eighteenequal monthly instalments, equal to one and a half times the sum of (i) his current annual base salary and (ii) thehigher of (A) his current bonus and (B) the average bonus received by him in the three years prior to termination. IfMr. Cortina’s employment is terminated by us other than for just cause or by Mr. Cortina for good reason incontemplation of, or within six months of, a change of control, he will be entitled to a lump sum cash paymentequal to two times the sum of (i) his current annual base salary and (ii) the average bonus received by him in thethree years prior to termination.
SamuelMorrow
We entered into an employment agreement with Mr. Morrow effective May 2014, in connection with hisappointment as our Deputy Chief Executive Officer. Pursuant to the agreement, we will pay Mr. Morrow an annualbase salary of US$210,000 (subject to annual review) and an annual discretionary bonus and provide him certaincustomary perquisites. The agreement also entitles Mr. Morrow to receive performance share units under the 2014Plan with a target value of at least 50% of Mr. Morrow’s base salary for each of the years ending December 31,2014, 2015 and 2016. If Mr. Morrow’s employment is terminated by us other than for just cause, or by Mr. Morrowfor good reason, he will be entitled to a severance payment, payable in twelve equal monthly instalments, equal toof the sum of (i) his current annual base salary and (ii) the higher of (A) his current bonus and (B) the averagebonus received by him in the three years prior to termination. If Mr. Morrow’s employment is terminated by usother than for just cause or by Mr. Morrow for good reason in contemplation of, or within six months of, a changeof control, he will be entitled to a lump sum cash payment equal to one and one-quarter times the sum of (i) hiscurrent annual base salary and (ii) the average bonus received by him in the three years prior to termination.
FerdinandSteinbauer
We entered into an employment agreement with Mr. Steinbauer effective June 2014, in connection with hisappointment as our Treasurer. Pursuant to the agreement, we will pay Mr. Steinbauer an annual base salary of €325,000 (subject to annual review) and an annual discretionary bonus and provide him certain customaryperquisites. The agreement also entitles Mr. Steinbauer to receive performance share units under the 2014 Plan witha target value of at least 50% of Mr. Steinbauer’s base salary for each of the years ending December 31, 2014, 2015and 2016. If Mr. Steinbauer’s employment is terminated by us other than for just cause, or by Mr. Steinbauer forgood reason, he will be entitled to a severance payment, payable in fifteen equal monthly instalments, equal to oneand one-quarter times the sum of (i) his current annual base salary and (ii) the higher of (A) his current bonus and(B) the average bonus received by him in the three years prior to termination. If Mr. Steinbauer’s employment isterminated by us other than for just cause or by Mr. Steinbauer for good reason in contemplation of, or within sixmonths of, a change of control, he will be entitled to a lump sum cash payment equal to one and a half times thesum of (i) his current annual base salary and (ii) the average bonus received by him in the three years prior totermination.
Pension Plan Benefits
As of December 31, 2015, we did not have any defined benefit, defined contribution or deferred compensationplans for any of our senior officers or directors.
C. Board Practices
In November 2014, to effect a special resolution adopted by our shareholders at the Meeting, we amended Article11.1 of our Articles to remove the provision for three-year staggered terms for our directors and replace it with aprovision for annual director retirement from office and re-election on a one-year term. As a result, each of ourdirectors now holds office until the close of the next annual general meeting of our shareholders or until his or hersuccessor is elected or appointed, unless such office is earlier vacated in accordance with our Articles or with theprovisions of the BusinessCorporationsAct(British Columbia).
Other than as discussed elsewhere herein, there are no service contracts between our company and any of ourdirectors providing for benefits upon termination of employment.
46

TABLE OF CONTENTS
Our board of directors has established an Audit Committee. Our Audit Committee currently consists of Silke S.Stenger, Dr. Shuming Zhao and Friedrich Hondl, who was appointed to the Audit Committee in November 2015.The Audit Committee operates pursuant to a charter adopted by the board of directors on October 26, 2013, a copyof which is available online at our website at www.mfcbancorpltd.com. The Audit Committee is appointed by andgenerally acts on behalf of the board of directors. The Audit Committee is responsible primarily for monitoring: (i)the integrity of our financial statements; (ii) compliance with legal and regulatory requirements; (iii) theindependence, qualifications and performance of our independent auditors; and (iv) the performance and structureof our internal audit function. The Audit Committee also reviews and approves our hiring policies, establishes ourprocedures for dealing with complaints, oversees our financial reporting processes and consults with managementand our independent auditors on matters related to our annual audit and internal controls, published financialstatements, risk assessment and risk management, accounting principles and auditing procedures being applied.
Our board of directors has established a Compensation Committee. Our Compensation Committee currentlyconsists of Indrajit Chatterjee, Silke S. Stenger, Dr. Shuming Zhao and Jochen Dümler. Our CompensationCommittee operates pursuant to a charter adopted by the board of directors on October 26, 2013, a copy of which isavailable online at our website at www.mfcbancorpltd.com. The Compensation Committee is appointed andgenerally acts on behalf of the board of directors. The Compensation Committee is responsible for reviewing ourboard compensation practices and our selection, retention and remuneration arrangements for our executive officersand employees and reviewing and approving our Chief Executive Officer’s compensation in light of our corporategoals and objectives. Except for plans that are, in accordance with their terms or as required by law, administeredby our board of directors or another particularly designated group, the Compensation Committee also administersand implements all of our incentive compensation plans and equity-based compensation plans. The CompensationCommittee also recommends changes or additions to those plans, monitors our succession planning processes andreports to our board of directors on other compensation matters. Our Chief Executive Officer does not vote upon orparticipate in the deliberations regarding his compensation.
Our board of directors has established a Nominating and Corporate Governance Committee. Our Nominating andCorporate Governance Committee currently consists of Indrajit Chatterjee, Silke S. Stenger and Dr. Shuming Zhao.Our Nominating and Corporate Governance Committee operates pursuant to a charter adopted by our board ofdirectors on October 26, 2013, a copy of which is available online at our website at www.mfcbancorpltd.com. Theprimary function of the Nominating and Corporate Governance Committee is to assist our board of directors indeveloping our Corporate Governance Guidelines and monitor the board and management’s performance againstthe defined approach. The Nominating and Corporate Governance Committee is also responsible for evaluating theboard and board committees’ structure and size and the independence of existing and prospective directors,identifying and reporting on candidates to be nominated to our board of directors, reporting on the board’s annualperformance and overseeing our process for providing information to the board.
D. Employees
At December 31, 2015, 2014 and 2013, we employed approximately 651, 809 and 951 people, respectively.
47

(1) Mr. Smith was appointed Chairman in March 2016.
(2) Mr. Hondl was elected as a director in October 2015.
(3) We entered into a share purchase agreement with Mr. Cortina in April 2014, pursuant to which he may acquire an additional50,000 of our common shares per year until 2025 if Possehl achieves certain annual milestones. Please see “ Item 7: MajorShareholdersandRelatedPartyTransactions–B.RelatedPartyTransactions” for further information.
(4) The options are exercisable at a price of US$8.01 per common share and expire on April 2, 2019.
(5) Mr. Konsbruck has resigned, effective May 2016.
(6) Mr. Kellogg stepped down as Chairman and as a director in July 2015. Mr. Kellogg controls 13,405,000 of our common sharesthrough IAT. In his public filings, Mr. Kellogg disclaims beneficial ownership of any shares owned by IAT. In addition, in hispublic filings, Mr. Kellogg disclaims beneficial ownership of 1,200,000 common shares of our company owned by his wife,Cynthia Kellogg.
(7) Mr. Horn stepped down as a director in July 2015.
(8) Based on insider reports filed while Mr. Horn was a director.
* Less than 0.1%.
TABLE OF CONTENTS
E. Share Ownership
There were 63,142,272 common shares, 200,000 stock options and no share purchase warrants issued andoutstanding as of April 29, 2016. Of the common shares and stock options issued and outstanding on that date, ourdirectors and senior officers, who served in such positions at any time during the fiscal year ended December 31,2015, beneficially owned the following common shares and held the following stock options:
Name and principal position
Common shares beneficially owned
(#)
Percentage of total common shares
outstanding (%)
Stock options held (#)
Michael J. Smith Chairman, Managing Director and Director 272,727 0.4 —
Dr. Shuming Zhao Director — — —
Indrajit Chatterjee Director — — —
Silke S. Stenger Director — — —
Friedrich Hondl Director — — —
Gerardo Cortina President and Chief Executive Officerand Director 559,820 0.9 —
Samuel Morrow Deputy Chief Executive Officer and Chief Financial Officer 42,390 — 100,000
Ferdinand Steinbauer Treasurer 241,438 0.4 —
Guy Konsbruck Executive Vice-President 7,700 — —
Peter Kellogg Former Chairman and Director 20,662,400 32.7 —
William C. Horn III Former Director 618 — —
Notes:
2014 Equity Incentive Plan
At our annual and special meeting of our shareholders held in November 2014, our shareholders passed a resolutionapproving our 2014 Plan to further align the interests of employees and directors with those of our shareholders byproviding incentive compensation opportunities tied to the performance of our common shares and promotingincreased ownership of our common shares by such individuals. The 2014 Plan replaced our 1997 Stock OptionPlan and our 2008 Incentive Plan and any plans emanating or
48
(1)
%
(2)
(3) %
* (3)
%
(5) *
(6) (6) %
(7) (8) *

TABLE OF CONTENTS
deriving therefrom, collectively referred to as the “Prior Plans”; provided, however, that each applicable Prior Planwill continue to govern prior awards granted under such Prior Plan until all awards granted under such Prior Planprior to November 14, 2014 have been exercised, forfeited, cancelled, expired or otherwise terminated inaccordance with the terms thereof.
Pursuant to the terms of the 2014 Plan, our board of directors, our Compensation Committee or such othercommittee as is appointed by our board of directors to administer the 2014 Plan, may grant stock options, restrictedstock rights, restricted stock, performance share awards, performance share units and stock appreciation rightsunder the 2014 Plan, establish the terms and conditions for those awards, construe and interpret the 2014 Plan andestablish the rules for the 2014 Plan’s administration. Such awards may be granted to employees, non-employeedirectors, officers or consultants of ours or any affiliate or any person to whom an offer of employment with us orany affiliate is extended. Such committee has the authority to determine which employees, non-employee directors,officers, consultants and prospective employees should receive such awards.
The maximum number of our common shares that may be issuable pursuant to all awards granted under the 2014Plan is 2,877,018 common shares, being 2,000,000 plus the number of common shares available for awards underthe Prior Plans as of the effective date of the 2014 Plan. Notwithstanding the foregoing, the maximum number ofshares that may be issued as incentive stock options under the 2014 Plan is 2,000,000. Forfeited, cancelled, returnedand lapsed awards are not counted against the 2,000,000 common shares. Any awards granted under the 2014 Plan,or portions thereof, that are settled in cash and not by issuance of our common shares are not counted against theforegoing limits. No awards had been issued pursuant to the 2014 Plan as at December 31, 2015. There were2,877,018 awards available for grant under the 2014 Plan as at December 31, 2015.
As at December 31, 2015, the following option awards were outstanding under the Prior Plans: (i) 1,372,500 stockoptions under our 1997 Stock Option Plan; and (ii) 860,000 stock options under our 2008 Incentive Plan.
49

A. Major Shareholders
(1) Based on 63,142,272 common shares issued and outstanding on April 29, 2016.
(2) Mr. Kellogg controls 13,405,000 of our common shares through IAT. In his public filings, Mr. Kellogg disclaims beneficialownership of all of the shares, or approximately 21.2% of the issued and outstanding common shares, owned by IAT. In addition,in his public filings, Mr. Kellogg disclaims beneficial ownership of 1,200,000 common shares of our company owned by his wife,Cynthia Kellogg.
(3) Mr. Miller controls such shares through a number of trusts and wholly-owned corporations. In his public filings, Mr. Millerdiscloses that he exercises sole dispositive and voting control over 6,253,738 of such shares and shared dispositive and votingcontrol over 432,595 of such shares.
B. Related Party Transactions
TABLE OF CONTENTS
ITEM 7: MAJOR SHAREHOLDERS AND RELATED PARTY TRANSACTIONS
There were 63,142,272 common shares issued and outstanding as of April 29, 2016. The following table sets forth,as of the date hereof, persons known to us to be the beneficial owner of more than five percent (5%) of our commonshares:
Name Amount Owned Percent of Class Peter Kellogg 20,662,400 32.7Lloyd I. Miller, III 6,686,333 10.6
Notes:
As of April 1, 2016, there were 63,142,272 common shares issued and outstanding held by 386 registeredshareholders. Of those common shares issued and outstanding, 63,115,522 common shares were registered in theUnited States (347 registered shareholders).
The voting rights of our major shareholders do not differ from the voting rights of holders of our shares who are notmajor shareholders.
Peter Kellogg may be considered to control our company as a result of, among other things, his ownership ofapproximately 32.7% of our common shares. However, on February 7, 2014, we entered into a mutual settlementagreement with Peter Kellogg and IAT, pursuant to which, among other things, Mr. Kellogg and IAT agreed toabide by customary standstill provisions for a 30-month period, subject to earlier termination in accordance with itsterms. Please refer to “ Item10:AdditionalInformation–C.MaterialContracts” for further information.
There are no arrangements known to us, the operation of which may at a subsequent date result in a change in thecontrol of our company.
Other than as disclosed herein, to the best of our knowledge, since January 1, 2015, there have been no materialtransactions or loans between our company and: (a) enterprises that directly or indirectly through one or moreintermediaries control or are controlled by, or are under common control with, our company; (b) associates; (c)individuals owning, directly or indirectly, an interest in the voting power of our company that gives them significantinfluence over our company, and close members of any such individual’s family; (d) key management personnel ofour company, including directors and senior management of our company and close members of such individuals’families; or (e) enterprises in which a substantial interest in the voting power is owned, directly or indirectly, by anyperson described in (c) or (d) or over which such a person is able to exercise significant influence.
In the normal course of operations, we enter into transactions with related parties, which include, among others,affiliates whereby we have a significant equity interest (10% or more) in the affiliates or have the ability toinfluence the affiliates’ or our operating and financing policies through significant shareholding, representation onthe board of directors, corporate charter and/or bylaws. The affiliates also include certain of our directors, ourPresident, Chief Executive Officer, Chief Financial Officer, Treasurer, Chief Operating Officer and their closefamily members.
50
(1)
(2) %(3) %

C. Interests of Experts and Counsel
A. Consolidated Statements and Other Financial Information
B. Significant Changes
TABLE OF CONTENTS
In addition to transactions disclosed elsewhere in our financial statements for the year ended December 31, 2015and in this annual report on Form 20-F, we had the following transactions with affiliates during the year endedDecember 31, 2015:
(In thousands)
Sale of Goods $ 3,349
In April 2014, we entered into a share purchase agreement with the holder of the puttable instrument financialliabilities, referred to as the “Put Holder”, whereby we acquired from the Put Holder his 40% equity shares inPossehl. Upon the execution of the agreement, the puttable instrument was terminated. The purchase price consistedof 509,820 of our common shares (which would be delivered upon occurrence of an event (as defined in theagreement), the latest being in 2025) and a contingent purchase price whereby 50,000 of our common shares wouldbe issued to the Put Holder for each year from 2014 to 2025 if Possehl achieves an annual net income milestone ascomputed under IFRS for the year. In June 2014, the share purchase agreement was amended whereby the 509,820of our common shares were released to the Put Holder following the approval of the New York Stock Exchange,referred to as the “NYSE”, (which was received in June 2014) and the contingent purchase price was reduced to bepayable for each year from 2014 to 2024. All other terms remain unchanged. The Put Holder was appointed to ourboard of directors and as our President and Chief Executive Officer in May 2014. The annual target was achievedfor 2014. As a result, we issued 50,000 common shares to the Put Holder in the first half of 2015.
Not applicable.
ITEM 8: FINANCIAL INFORMATION
Effective January 1, 2010, we adopted IFRS following approval from the Canadian Securities Administrators underNational Instrument 52-107 – Acceptable Accounting Principles and Auditing Standards . The consolidatedfinancial statements have been prepared in compliance with IFRS. See “ Item18:FinancialStatements”.
Legal Proceedings
We are subject to routine litigation incidental to our business and are named from time to time as a defendant invarious legal actions arising in connection with our activities, certain of which may include large claims for punitivedamages. Further, due to the size, complexity and nature of our operations, various legal and tax matters areoutstanding from time to time, including a currently ongoing audit by the Canadian taxation authority of ourdomestic and international transactions covering the years ended December 31, 2006 to April 19, 2013. Currently,based upon information available to us, we do not believe any such matters would have a material adverse effectupon our financial condition or results of operations. However, due to the inherent uncertainty of litigation, wecannot provide certainty as to their outcome. If our current assessments are materially incorrect or if we are unableto resolve any of these matters favorably, there may be a material adverse impact on our financial performance,cash flows or results of operations. Please see Note 13 to our audited consolidated financial statements for the yearended December 31, 2015 for further information.
Dividend Distributions
Our board of directors declared annual cash dividends per common share, payable in four quarterly installments ofUS$0.24 in each of 2013 and 2014. No dividend was declared in 2015.
Please refer to “ Item4:InformationontheCompany–A.HistoryandDevelopmentoftheCompany” and Note 29of our annual financial statements included herewith for a discussion of significant events that have occurred afterDecember 31, 2015.
51

A. Offer and Listing Details
B. Plan of Distribution
C. Markets
D. Selling Shareholders
E. Dilution
TABLE OF CONTENTS
ITEM 9: THE OFFER AND LISTING
Since June 18, 2007, our common shares have been quoted on the NYSE, currently under the symbol “MFCB”. Thefollowing table sets forth the high and low quoted prices of our common shares on the NYSE for the periodsindicated.
High (US$) Low (US$) Annual Highs and Lows2015 7.11 1.502014 8.25 5.202013 10.39 7.252012 8.80 6.652011 9.00 6.17
Quarterly Highs and Lows2016First Quarter 2.50 1.712015Fourth Quarter 3.32 1.50Third Quarter 4.15 2.79Second Quarter 5.04 3.85First Quarter 7.11 3.612014Fourth Quarter 7.17 5.20Third Quarter 8.20 7.11Second Quarter 8.11 7.07First Quarter 8.25 6.97
Monthly Highs and LowsApril 2016 2.04 1.66March 2016 2.50 1.90February 2016 2.23 1.80January 2016 2.24 1.71December 2015 2.06 1.50November 2015 3.00 1.98
The transfer of our common shares is managed by our transfer agent, Computershare, 480 Washington Boulevard,Jersey City, NJ 07310 (Tel: 201-680-5258; Fax: 201-680-4604).
Not applicable.
Our common shares are quoted on the NYSE under the symbol “MFCB”.
Not applicable.
Not applicable.
52

F. Expenses of the Issue
A. Share Capital
B. Memorandum and Articles of Association
TABLE OF CONTENTS
Not applicable.
ITEM 10: ADDITIONAL INFORMATION
Not applicable.
We are organized under the laws of the Province of British Columbia, Canada and have been assigned the numberBC0778539.
Our Articles do not contain a description of our objects and purposes.
Our Articles do not restrict a director’s power to vote on a proposal, arrangement or contract in which the director ismaterially interested, vote on compensation to themselves or any other members of their body in the absence of anindependent quorum or exercise borrowing powers. There is no mandatory retirement age for our directors and ourdirectors are not required to own securities of our company in order to serve as directors.
Our authorized capital consists of an unlimited number of common shares without par value, an unlimited numberof Class A common shares without par value and an unlimited number of Class A preferred shares without parvalue. Our Class A preferred shares may be issued in one or more series and our directors may fix the number ofshares that is to comprise each series and designate the rights, privileges, restrictions and conditions attaching toeach series.
Holders of our common shares may receive dividends when, as and if declared by the board, subject to thepreferential dividend rights of any other classes or series of preferred shares issued and outstanding. In no eventmay a dividend be declared or paid on the common shares if payment of the dividend would cause the realizablevalue of the assets of our company to be less than the aggregate of its liabilities. Holders of our common shares areentitled to one vote per share at any meeting of shareholders of any class of common shares and, in general andsubject to applicable law, all matters will be determined by a majority of votes cast other than fundamental changeswith respect to our company. The common shareholders are entitled, in the event of a distribution of assets of ourcompany on the liquidation, dissolution or winding-up of our company, referred to as a “Liquidation Distribution”,to receive, before any Liquidation Distribution is made to the holders of the Class A common shares or any othershares of our company ranking junior to the common shares, but after any prior rights of any of our preferredshares, the stated capital with respect to each common share held by them, together with all declared and unpaiddividends (if any and if preferential) thereon, up to the date of such Liquidation Distribution, and thereafter thecommon shares shall rank pari passu with all other classes of our common shares in connection with theLiquidation Distribution.
The rights and restrictions attaching to our Class A common shares are the same as those attaching to our commonshares, except that, in the event of a Liquidation Distribution, the holders of the Class A common shares are entitledto receive such Liquidation Distribution only after any prior rights of the preferred shares and common shares orany other share ranking prior in right to the Class A common shares.
Our Class A preferred shares of each series rank on a parity with our Class A preferred shares of any other seriesand are entitled to a preference over our common shares with respect to the payment of dividends and thedistribution of assets or return of capital in the event of liquidation, dissolution or winding-up of our company.
The provisions in our Articles attaching to our common shares and Class A preferred shares may be altered,amended, repealed, suspended or changed by the affirmative vote of the holders of not less than two-thirds of thecommon shares and two-thirds of the Class A preferred shares, respectively, present in person or by proxy at anysuch meeting of holders.
Our Articles provide for the election of directors at each annual general meeting. Each director holds office until thenext annual general meeting of our shareholders or until his successor is elected or appointed, unless his office isearlier vacated in accordance with our Articles or with the provisions of the Business Corporations Act (BritishColumbia).
53

C. Material Contracts
D. Exchange Controls
TABLE OF CONTENTS
An annual meeting of shareholders must be held at such time in each year that is not later than fifteen months afterthe last preceding annual meeting and at such place as our board of directors, or failing it, our Chairman, ManagingDirector or President, may from time to time determine. The holders of not less than five percent of our issuedshares that carry the right to vote at a meeting may requisition our directors to call a meeting of shareholders for thepurposes stated in the requisition. The quorum for the transaction of business at any meeting of shareholders is twopersons who are entitled to vote at the meeting in person or by proxy. Only persons entitled to vote, our directorsand auditors and others who, although not entitled to vote, are otherwise entitled or required to be present, areentitled to be present at a meeting of shareholders.
Except as provided in the InvestmentCanadaAct, there are no limitations specific to the rights of non-Canadians tohold or vote our common shares under the laws of Canada or British Columbia, or in our charter documents. See thesection of this annual report on Form 20-F entitled “ ExchangeControls” below for a discussion of the principalfeatures of the InvestmentCanadaActfor non-Canadian residents proposing to acquire our common shares.
As set forth above, our Articles contain certain provisions that would have an effect of delaying, deferring orpreventing a change in control of our company, including authorizing the issuance by our board of directors ofpreferred stock in series, and limiting the persons who may call special meetings of shareholders. Our Articles donot contain any provisions that would operate only with respect to a merger, acquisition or corporate restructuringof our company. In addition, on November 18, 2013, we adopted an advance notice policy, which, among otherthings, fixes a deadline by which director nominations must be submitted to us prior to our meetings of shareholdersand sets forth the information that must be included in such notice in order for such nominee to be eligible forelection. In the case of an annual meeting, notice must be given to us not less than 30 nor more than 65 days prior tothe date of such meeting; provided that if the meeting is to be held on a date that is less than 50 days after the dateon which the first public announcement of the date of such meeting was made, notice may be given no later than theclose of business on the 10th day following such announcement. In the case of a special meeting called for thepurpose of electing directors that is not also an annual meeting, notice must be provided to us no later than the closeof business on the 15th day following the day on which the first public announcement of the date of such specialmeeting was made.
Our Articles do not contain any provisions governing the ownership threshold above which shareholder ownershipmust be disclosed.
Our Articles are not significantly different from the requirements of the Business Corporations Act (BritishColumbia) and the conditions imposed by our Articles governing changes in capital are not more stringent thanwhat is required by the BusinessCorporationsAct(British Columbia).
The following summary of certain material provisions of each agreement referenced below is not complete andthese provisions are qualified in their entirety by reference to the full text of such agreement.
On February 7, 2014, we entered into an agreement with Peter Kellogg and IAT in connection with the settlementof litigation between the parties. Pursuant to such agreement, among other things, each party agreed to provide theother with a mutual release and Mr. Kellogg and IAT agreed to abide by certain customary standstill provisions fora 30-month period, subject to earlier termination in accordance with its terms.
There are presently no governmental laws, decrees or regulations in Canada that restrict the export or import ofcapital or that impose foreign exchange controls or affect the remittance of interest, dividends or other payments tonon-resident holders of our common shares. However, any remittances of dividends to shareholders not resident inCanada are subject to withholding tax in Canada. See “ Item10:AdditionalInformation–E.Taxation”.
Except as provided in the InvestmentCanadaAct, there are no limitations specific to the rights of non-Canadians tohold or vote our common shares under the laws of Canada or British Columbia or in our charter documents. Thefollowing summarizes the principal features of the InvestmentCanadaActfor non-Canadian residents proposing toacquire our common shares.
This summary is of a general nature only and is not intended to be, and should not be construed to be, legaladvice to any holder or prospective holder of our common shares and no opinion or representation to anyholder or prospective holder of our common shares is hereby made. Accordingly, holders and prospective
54

(a) the acquisition of our common shares by a person in the ordinary course of that person’s business as atrader or dealer in securities;
(b) the acquisition of control of our company in connection with the realization of security granted for a loanor other financial assistance and not for a purpose related to the provisions of the InvestmentCanadaAct,provided such acquisitions are subject to approval under the Bank Act , the Cooperative CreditAssociationsAct, the InsuranceCompaniesActor the TrustandLoanCompaniesAct; and
(c) the acquisition of control of our company by reason of an amalgamation, merger, consolidation orcorporate reorganization, following which the ultimate direct or indirect control in fact of our company,through ownership of our common shares, remains unchanged.
TABLE OF CONTENTS
holders of our common shares should consult with their own legal advisors with respect to the consequencesof purchasing and owning our common shares.
The InvestmentCanadaActgoverns the direct or indirect acquisition of control of an existing Canadian business bynon-Canadians. Under the Investment Canada Act , non-Canadian persons or entities acquiring “control” (asdefined in the InvestmentCanadaAct) of a corporation carrying on business in Canada are required to either notify,or file an application for review with, Industry Canada, unless a specific exemption, as set out in the InvestmentCanadaAct, applies. Industry Canada may review any transaction that results in the direct or indirect acquisition ofcontrol of a Canadian business, where the enterprise value of corporate assets exceeds certain threshold levels(which are higher for investors from members of the World Trade Organization, including United States residents,or World Trade Organization member-controlled companies) or where the activity of the business is related toCanada’s cultural heritage or national identity. For such purpose, enterprise value is calculated as follows: (i) in thecase of a publicly traded Canadian business, as the company’s market capitalization, plus its non-operatingliabilities, minus its cash and cash equivalents; (ii) in the case of a non-publicly traded Canadian business, as theacquisition value, plus the company’s non-operating liabilities, minus its cash and cash equivalents; and (iii) in thecase of an asset acquisition, as the purchase price, plus the assumed non-operating liabilities, minus the transferredcash and cash equivalents.
No acquisition of control will be deemed to have occurred, for purposes of the InvestmentCanadaActbut subject tocertain exceptions, if less than one-third of the voting shares of a Canadian corporation is acquired by an investor.In addition, the Investment Canada Act permits the Canadian government to review any investment where theresponsible Minister has reasonable grounds to believe that an investment by a non-Canadian could be injurious tonational security or where the responsible Minister determines there has been an acquisition of control in fact by astate-owned enterprise. No financial threshold applies to a national security review and a lower financial thresholdbased on book value of assets applies to direct acquisitions by state-owned enterprises. The Minister may deny theinvestment, ask for undertakings, provide terms or conditions for the investment or, where the investment hasalready been made, require divestment. Review can occur before or after closing and may apply to corporate re-organizations where there is no change in ultimate control.
If an investment is reviewable under the InvestmentCanadaAct, an application for review in the form prescribed isnormally required to be filed with Industry Canada prior to the investment taking place and the investment may notbe implemented until the review has been completed and the Minister responsible for the InvestmentCanadaActissatisfied that the investment is likely to be of net benefit to Canada. If the Minister is not satisfied that theinvestment is likely to be of net benefit to Canada, the non-Canadian applicant must not implement the investmentor, if the investment has been implemented, the applicant may be required to divest itself of control of the Canadianbusiness that is the subject of the investment. The Minister is required to provide reasons for a decision that aninvestment is not of net benefit to Canada.
Certain transactions relating to our common shares will generally be exempt from the Investment Canada Act ,subject to the Minister’s prerogative to conduct a national security review, including:
An acquisition of control of our company in connection with the realization of security granted for a loan or otherfinancial assistance and not for a purpose related to the provisions of the Investment Canada Actwill not bereviewable under the InvestmentCanadaActif the acquisition is not subject to approval under the BankAct , theCooperativeCreditAssociationsAct, the InsuranceCompaniesActor the TrustandLoanCompaniesAct.
55

E. Taxation
TABLE OF CONTENTS
Material Canadian Federal Income Tax Consequences
The discussion under this heading is a general summary of the principal Canadian federal income tax consequencespursuant to the IncomeTaxAct(Canada), referred to as the “Tax Act”, of holding and disposing of our commonshares for a shareholder of our Company who, at all relevant times and for purposes of the Tax Act holds suchcommon shares as capital property, deals at arm’s length with the Company, is not affiliated with the Company and,for purposes of the Tax Act, is not, and is not deemed to be, a resident of Canada and has not and will not use orhold or be deemed to use or hold the common shares in or in the course of carrying on business in Canada, referredto as a “Non-Resident Holder”. Special rules, which are not discussed below, may apply to a non-resident ofCanada that is an insurer which carries on business in Canada and elsewhere. Such Non-Resident Holders shouldconsult their own tax advisors.
Our common shares will generally be considered capital property to a Non-Resident Holder unless either (i) theNon-Resident Holder holds the common shares in the course of carrying on a business of buying and sellingsecurities or (ii) the Non-Resident Holder has acquired the common shares in a transaction or transactionsconsidered to be an adventure in the nature of trade.
The term “U.S. Shareholder,” for the purposes of this section, means a Non-Resident Holder who, for purposes ofthe Canada-United States Tax Convention (1980) as amended, referred to as the “Convention”, is at all relevanttimes a resident of the United States and is a “qualifying person” within the meaning of the Convention. In somecircumstances, income or gains earned by fiscally transparent entities (including limited liability companies) will beeligible for benefits under the Convention. U.S. Shareholders are urged to consult with their own tax advisors todetermine their entitlement to benefits under the Convention based on their particular circumstances.
This summary is based upon the current provisions of the Tax Act, the regulations thereunder, referred to as the“Regulations”, the current publicly announced administrative and assessing policies of the Canada Revenue Agencyand the Convention. This summary also takes into account the amendments to the Tax Act and the Regulationspublicly announced by the Minister of Finance (Canada) prior to the date hereof, referred to as the “Tax Proposals”,and assumes that all such Tax Proposals will be enacted in their present form. However, no assurances can be giventhat the Tax Proposals will be enacted in the form proposed, or at all. This summary is not exhaustive of all possibleCanadian Federal income tax consequences applicable to a holder of our common shares and, except for theforegoing, this summary does not take into account or anticipate any changes in law, whether by legislative,administrative or judicial decision or action, nor does it take into account provincial, territorial or foreign incometax legislation or considerations, which may differ from the Canadian Federal income tax consequences describedherein.
This summary is of a general nature only and is not intended to be, and should not be construed to be, legal,business or tax advice to any particular holder or prospective holder of our common shares and no opinionor representation with respect to the tax consequences to any holder or prospective holder of our commonshares is hereby made. Accordingly, holders and prospective holders of our common shares should consulttheir own tax advisors with respect to the income tax consequences of purchasing, owning and disposing ofour common shares in their particular circumstances.
CurrencyConversion
For the purposes of the Tax Act, all amounts relating to the acquisition, holding or disposition of the commonshares, including dividends, adjusted cost base and proceeds of disposition must be converted into Canadian dollarsusing the Noon Rate on the date on which the amount first arose or such other rate of exchange as is acceptable tothe Canada Revenue Agency.
Dividends
Under the Tax Act, dividends on common shares paid or credited to a Non-Resident Holder will be subject toCanadian withholding tax at the rate of 25% of the gross amount of the dividends. This withholding tax may bereduced pursuant to the terms of an applicable income tax treaty or convention between Canada and the country ofresidence of a Non-Resident Holder. Under the Convention, a U.S. Shareholder will generally be subject toCanadian withholding tax at a rate of 15% of the amount of such dividends. The 25% rate may be further reduced to5% where the U.S. Shareholder is a corporation that owns at least 10% of our voting shares. In addition, under theConvention, dividends may be exempt from Canadian
56

TABLE OF CONTENTS
non-resident withholding tax if paid to certain U.S. Shareholders that are qualifying religious, scientific, literary,educational or charitable tax-exempt organizations and qualifying trusts, companies, organizations or arrangementsoperated exclusively to administer or provide pension, retirement or employee benefits that are exempt from tax inthe United States and that have complied with specific administrative procedures.
CapitalGains
A Non-Resident Holder will not be subject to tax under the Tax Act on any capital gain realized on a disposition ofour common shares unless the common shares constitute “taxable Canadian property”, as defined in the Tax Act, ofthe holder at the time of the disposition and such gain is not otherwise exempt from tax under the Tax Act pursuantto the provisions of an applicable income tax convention.
Generally, a common share of our company will not be taxable Canadian property to a Non-Resident Holder at aparticular time provided that such share is listed on a “designated stock exchange” (which currently includes theNYSE), as defined in the Tax Act, unless at any time during the 60-month period immediately preceding thedisposition (i) the Non-Resident Holder, persons with whom the Non-Resident Holder did not deal at arm’s length,partnerships in which the Non-Resident Holder or such persons hold a membership interest (directly or indirectlythrough one or more partnerships) or the Non-Resident Holder together with all such persons or partnerships owned25% or more of the issued shares of any class or series of shares of our capital stock and (ii) more than 50% of thefair market value of the particular share was derived directly or indirectly from one or any combination of real orimmovable property situated in Canada, “Canadian resource property”, as defined in the Tax Act, “timber resourceproperty”, as defined in the Tax Act, and options in respect of, or interests in, or for civil law rights in, any suchproperties (whether or not such property exists). Notwithstanding the foregoing, in certain circumstances set out inthe Tax Act, our common shares could be deemed to be taxable Canadian property to a non-resident holder. Non-Resident Holders, whose shares may constitute taxable Canadian property, should consult their own tax advisors foradvice having regard to their particular circumstances.
Even if a common share is taxable Canadian property to a Non-Resident Holder, a taxable capital gain or anallowable capital loss resulting from the disposition of the share will not be included in computing the Non-Resident Holder’s taxable income for purposes of the Tax Act, provided that the share constitutes “treaty-protectedproperty” of such shareholder. Common shares owned by a U.S. Shareholder generally will be treaty-protectedproperty if the gain from the disposition of such share would, because of the Convention, be exempt from tax underthe Tax Act. Non-Resident Holders whose shares may constitute taxable Canadian property or treaty-protectedproperty should consult their own tax advisors for advice having regard to their particular circumstances.
If a Non-Resident Holder realizes a capital gain or capital loss from a disposition of a common share of our capitalstock which constitutes taxable Canadian property and not treaty-protected property for purposes of the Tax Act,then the capital gain or capital loss is the amount, if any, by which the Non-Resident Holder’s proceeds ofdisposition exceed (or are exceeded by, respectively) the aggregate of the Non-Resident Holder’s adjusted cost baseof the share and reasonable expenses of disposition as determined under the Tax Act. The capital gain or loss mustbe computed in Canadian currency using a weighted average adjusted cost base for identical properties. Generally,one-half of a capital gain (“taxable capital gain”) is included in income for Canadian tax purposes in the year of thedisposition, and one-half of a capital loss (“an allowable capital loss”) must be deducted from taxable capital gainsrealized by the Non-Resident Holder in that year. Allowable capital losses in excess of taxable capital gains for thatyear may generally be carried back three years or forward indefinitely and deducted against net taxable capital gainsin those years, in the manner permitted under the Tax Act. Reporting and filing requirements will also arise. Such aNon-Resident Holder should consult its own tax advisors.
Material United States Federal Income Tax Consequences
The following is a discussion of certain United States Federal income tax matters under current law, generallyapplicable to a U.S. Holder (as defined below) of our common shares who holds such shares as capital assets. Thisdiscussion does not address all aspects of United States Federal income tax matters and does not addressconsequences particular to persons subject to certain special provisions of United States Federal income tax lawsuch as those described below. In addition, this discussion does not cover any state, local or foreign taxconsequences. See “ MaterialCanadianFederalIncomeTaxConsequences” above.
The following discussion is based upon the InternalRevenueCodeof1986, as amended, referred to as the “Code”,Treasury Regulations, published by the Internal Revenue Service, referred to as the “IRS”, rulings,
57

TABLE OF CONTENTS
published administrative positions of the IRS and court decisions that are currently applicable, any or all of whichcould be materially and adversely changed, possibly on a retroactive basis, at any time. In addition, this discussiondoes not consider the potential effects, both adverse and beneficial, of any recently proposed legislation that, ifenacted, could be applied, possibly on a retroactive basis, at any time. No assurance can be given that the IRS willagree with the statements and conclusions herein, or will not take, or that a court will not adopt, a position contraryto any position taken herein.
The following discussion is for general information only and is not intended to be, nor should it be construedto be, legal, business or tax advice to any holder or prospective holder of our common shares and no opinionor representation with respect to the United States Federal income tax consequences to any such holder orprospective holder is hereby made. Accordingly, holders and prospective holders of common shares areurged to consult their own tax advisors with respect to United States Federal, state, local and foreign taxconsequences of purchasing, owning and disposing of our common shares.
U.S.Holders
As used in this section, a “U.S. Holder” includes: (i) a holder of our common shares who is a citizen or resident ofthe United States; (ii) a corporation created or organized in or under the laws of the United States or of any politicalsubdivision thereof, or any entity which is taxable as a United States corporation for United States tax purposes;(iii) an estate, the income of which is subject to United States Federal income tax without regard to its source; or(iv) a trust if (1) a court within the United States is able to exercise primary supervision over the administration ofthe trust and one or more U.S. persons have the authority to control all substantial decisions of the trust or (2) thetrust has a valid election in effect under applicable Treasury regulations to be treated as a U.S. person.
This summary does not purport to address all material United States Federal income tax consequences that may berelevant to a U.S. Holder and does not take into account the specific circumstances of any particular investors, someof which (such as tax-exempt entities, banks or other financial institutions, insurance companies, broker-dealers,traders in securities that elect to use a mark-to-market method of accounting for their securities holdings, regulatedinvestment companies, real estate investment trusts, U.S. expatriates, investors liable for the alternative minimumtax, partnerships and other pass-through entities, investors that own or are treated as owning 10% or more of ourcommon shares, investors that hold the common shares as part of a straddle, hedge, conversion or constructive saletransaction or other integrated transaction, and U.S. holders whose functional currency is not the United Statesdollar) may be subject to special tax rules. This summary does not address shareholders who acquired their sharesthrough the exercise of employee stock options or otherwise as compensation.
Distributions
The gross amount of a distribution paid to a U.S. Holder (including amounts withheld in respect of Canadian taxes)in respect of the common shares will be subject to United States Federal income taxation as ordinary income to theextent paid out of our current or accumulated earnings and profits, as determined under United States Federalincome tax principles. Such dividends will not be eligible for the dividends received deduction allowed tocorporations. Distributions that are taxable dividends and that meet certain requirements will be “qualified dividendincome” and will generally be taxed to U.S. Holders who are individuals at a maximum United States Federalincome tax rate of 20% (subject to the “Passive Foreign Investment Corporation” rules discussed below).Distributions in excess of our current and accumulated earnings and profits will be treated first as a tax-free returnof capital to the extent the U.S. Holder’s tax basis in the common shares and, to the extent in excess of such taxbasis, will be treated as a gain from a sale or exchange of such shares.
CapitalGains
In general, upon a sale, exchange or other disposition of common shares, a U.S. Holder will generally recognize acapital gain or loss for United States Federal income tax purposes in an amount equal to the difference between theamount realized on the sale or other distribution and the U.S. Holder’s adjusted tax basis in such shares. Such gainor loss will be a United States source gain or loss and will be treated as a long-term capital gain or loss if the U.S.Holder’s holding period of the shares exceeds one year. If the U.S. Holder is an individual, any capital gain willgenerally be subject to United States Federal income tax at preferential rates if specified minimum holding periodsare met. The deductibility of capital losses is subject to significant limitations.
58

TABLE OF CONTENTS
ForeignTaxCredit
Dividends paid by us generally will constitute income from non-U.S. sources and will be subject to variousclassification rules and other limitations for U.S. foreign tax credit purposes. Subject to generally applicablelimitations under United States Federal income tax law, Canadian withholding tax imposed on such dividends, ifany, will be treated as a foreign income tax eligible for credit against a U.S. holder’s United States Federal incometax liability (or at a U.S. holder’s election if it does not elect to claim a foreign tax credit for any foreign taxes paidduring the taxable year, all foreign income taxes paid may instead be deducted in computing such U.S. holder’staxable income). Generally, it will be more advantageous to claim a credit because a credit reduces United StatesFederal income taxes on a dollar-for-dollar basis, while a deduction merely reduces the taxpayer’s income subjectto tax. There are significant and complex limitations which apply to the tax credit, among which are an ownershipperiod requirement and the general limitation that the credit cannot exceed the proportionate share of the U.S.Holder’s United States Federal income tax liability that the U.S. Holder’s foreign source income bears to his or itsworldwide taxable income. In determining the application of this limitation, the various items of income anddeduction must be classified into foreign and United States sources. Complex rules govern this classificationprocess. In general, special rules will apply to the calculation of foreign tax credits in respect of dividend incomethat is subject to preferential rates of United States Federal income tax. The availability of the foreign tax credit andthe application of these complex limitations on the tax credit are fact specific and holders and prospective holders ofour common shares should consult their own tax advisors regarding their individual circumstances.
PassiveForeignInvestmentCorporation
We do not believe that we are currently a passive foreign investment corporation, referred to as a “PFIC”. However,since PFIC status depends upon the composition of a corporation’s income and assets and the market value of itsassets and shares from time to time, there is no assurance that we will not be considered a PFIC for any taxableyear. If we were treated as a PFIC for any taxable year during which a U.S. Holder held shares, certain adverseUnited States Federal income tax consequences could apply to the U.S. Holder.
If we are treated as a PFIC for any taxable year, gains recognized by a U.S. Holder on a sale or other disposition ofshares would be allocated rateably over the U.S. Holder’s holding period for the shares. The amount allocated to thetaxable year of the sale or other exchange and to any year before we became a PFIC would be taxed as ordinaryincome. The amount allocated to each other taxable year would be subject to tax at the highest rate in effect forindividuals or corporations, as applicable, and an interest charge would be imposed on the amount allocated to suchtaxable year. Further, any distribution in respect of shares in excess of 125% of the average of the annualdistributions on shares received by the U.S. Holder during the preceding three years or the U.S. Holder’s holdingperiod, whichever is shorter, would be subject to United States federal income taxation as described above. Certainelections might be available to U.S. Holders that may mitigate some of the adverse consequences resulting fromPFIC status. However, regardless of whether such elections are made, dividends paid by a PFIC will not be“qualified dividend income” and will generally be taxed at the higher rates applicable to other items of ordinaryincome.
U.S. Holders and prospective holders should consult their own tax advisors regarding the potentialapplication of the PFIC rules to their ownership of our common shares.
MedicareTax
A U.S. Holder that is an individual or estate, or a trust that does not fall into a special class of trusts that is exemptfrom such tax, will be subject to a 3.8% tax on the lesser of (1) the U.S. Holder’s “net investment income” (orundistributed “net investment income” in the case of estates and trusts) for the relevant taxable year and (2) theexcess of the U.S. Holder’s modified adjusted gross income for the taxable year over a certain threshold (which inthe case of individuals will be between US$125,000 and US$250,000, depending on the individual’scircumstances). A holder’s net investment income will generally include its interest income and its net gains fromthe disposition of securities, unless such interest income or net gains are derived in the ordinary course of theconduct of a trade or business (other than a trade or business that consists of certain passive or trading activities). Ifyou are a U.S. Holder that is an individual, estate or trust, you are urged to consult your own tax advisor regardingthe applicability of this Medicare tax.
InformationReportingandBackupWithholding
Under United States Federal income tax law and the Treasury Regulations, certain categories of U.S. Holders mustfile information returns with respect to their investment in, or involvement in, a foreign
59

F. Dividends and Paying Agents
G. Statement by Experts
H. Documents on Display
I. Subsidiary Information
TABLE OF CONTENTS
corporation. For example, certain United States Federal income tax return disclosure obligations (and relatedpenalties) are generally imposed on U.S. Holders that hold certain specified foreign financial assets in excess ofUS$50,000. The definition of specified foreign financial assets includes not only financial accounts maintained inforeign financial institutions, but also, unless held in accounts maintained by a financial institution, any stock orsecurity issued by a non-U.S. person, any financial instrument or contract held for investment that has an issuer orcounterparty other than a U.S. person and any interest in a foreign entity. U.S. Holders may be subject to thesereporting requirements unless their common shares are held in an account at a domestic financial institution.Penalties for failure to file certain of these information returns are substantial. U.S. Holders should consult withtheir own tax advisers regarding the requirements of filing information returns and, if applicable, filing obligationsrelating to the PFIC rules.
Dividends paid on, and proceeds from the sale or other taxable disposition of, our common shares to a U.S. Holdergenerally may be subject to United States Federal information reporting requirements and may be subject to backupwithholding (currently at the rate of 28%) unless the U.S. Holder provides an accurate taxpayer identificationnumber or otherwise demonstrates that it is exempt. The amount of any backup withholding collected from apayment to a U.S. Holder will generally be allowed as a credit against the U.S. Holder’s United States Federalincome tax liability and may entitle the U.S. Holder to a refund, provided that certain required information is timelysubmitted to the IRS. A non-U.S. holder generally will be exempt from these information reporting requirementsand backup withholding tax but may be required to comply with certain certification and identification proceduresin order to establish its eligibility for exemption.
Not applicable.
Not applicable.
Documents and agreements concerning our company may be inspected at the offices of Sangra Moller LLP, 1000Cathedral Place, 925 West Georgia Street, Vancouver, British Columbia, Canada.
For a list of our significant wholly-owned direct and indirect subsidiaries and significant non-wholly-ownedsubsidiaries, see “ Item4:InformationontheCompany–C.OrganizationalStructure”.
60

TABLE OF CONTENTS
ITEM 11: QUANTITATIVE AND QUALITATIVE DISCLOSURES ABOUT MARKET RISK
We are exposed to various market risks from changes in interest rates, foreign currency exchange rates and equityprices that may affect our results of operations and financial condition and, consequently, our fair value. Generally,our management believes that our current financial assets and financial liabilities, due to their short-term nature, donot pose significant financial risks. We use various financial instruments to manage our exposure to variousfinancial risks. The policies for controlling the risks associated with financial instruments include, but are notlimited to, standardized company procedures and policies on matters such as hedging of risk exposures, avoidanceof undue concentration of risk and requirements for collateral (including letters of credit) to mitigate credit risk. Wehave risk managers to perform audits and checking functions to ensure that company procedures and policies arecomplied with.
We use derivative instruments to manage certain exposures to commodity price and currency exchange rate risks.The use of derivative instruments depends on our management’s perception of future economic events anddevelopments. These types of derivatives are often very volatile, as they are highly leveraged, given that marginrequirements are relatively low in proportion to their notional amounts.
Many of our strategies, including the use of derivative instruments and the types of derivative instruments selectedby us, are based on historical trading patterns and correlations and our management’s expectations of future events.However, these strategies may not be fully effective in all market environments or against all types of risks.Unexpected market developments may affect our risk management strategies during this time, and unanticipateddevelopments could impact our risk management strategies in the future. If any of the variety of instruments andstrategies we utilize are not effective, we may incur losses.
Please refer to Note 26 of our annual consolidated financial statements for the years ended December 31, 2015,2014 and 2013 for a qualitative and quantitative discussion of our exposure to market risks and the sensitivityanalysis of interest rate, currency and other price risks at December 31, 2015.
ITEM 12: DESCRIPTION OF SECURITIES OTHER THAN EQUITY SECURITIES
Not applicable.
61

1. pertain to the maintenance of records that, in reasonable detail, accurately and fairly reflect thetransactions and dispositions of our assets and our consolidated entities;
TABLE OF CONTENTS
PART II
ITEM 13: DEFAULTS, DIVIDEND ARREARAGES AND DELINQUENCIES
None.
ITEM 14: MATERIAL MODIFICATIONS TO RIGHTS OF SECURITY HOLDERS AND USE OF PROCEEDS
A. Modifications to Rights of Security Holders
Advance Notice Policy
At our Annual General and Special Meeting held on December 27, 2013, our shareholders approved a resolutionaffirming, ratifying and approving our company’s advance notice policy, referred to as the “Advance NoticePolicy”. The Advance Notice Policy, among other things, fixes a deadline by which director nominations must besubmitted to us prior to any meeting of our shareholders and sets forth the information that must be included in thenotice in order for a nominee to be eligible for election. No person will be eligible for election as a director of ourcompany unless nominated in accordance with the Advance Notice Policy.
In the case of an annual meeting, notice to us must be given no less than 30 and no more than 65 days prior to thedate of such meeting, provided that if the meeting is to be held on a date that is less than 50 days after the date onwhich the first public announcement of the date of such meeting was made, notice may be given no later than theclose of business on the 10th day following such announcement.
In the case of a special meeting called for the purpose of electing directors that is not also an annual meeting, noticeto us must be made no later than the close of business on the 15th day following the day on which the first publicannouncement of the date of such special meeting was made.
The foregoing summary of the Advance Notice Policy is not complete and is qualified in its entirety by reference tothe full text of the Advance Notice Policy, a copy of which was filed as Exhibit 1.4 of our annual report on Form20-F filed with the SEC on March 31, 2014.
ITEM 15: CONTROLS AND PROCEDURES
Evaluation of Disclosure Controls and Procedures
Disclosure controls and procedures are controls and other procedures that are designed to ensure that informationrequired to be disclosed in our company’s reports filed or submitted under the SecuritiesExchangeActof1934isrecorded, processed, summarized and reported, within the time periods specified in the SEC’s rules and forms.Disclosure controls and procedures include, without limitation, controls and procedures designed to ensure thatinformation required to be disclosed in our company’s reports filed under the SecuritiesExchangeActof1934isaccumulated and communicated to management, including our company’s Chief Executive Officer and ChiefFinancial Officer, as appropriate, to allow timely decisions regarding required disclosure.
As required by Rule 13a-15 under the SecuritiesExchangeActof1934, we have carried out an evaluation of theeffectiveness of the design and operation of our company’s disclosure controls and procedures as of the end of theperiod covered by this annual report on Form 20-F, being December 31, 2015. This evaluation was carried out byour Chief Executive Officer (being our principal executive officer) and Chief Financial Officer (being our principalfinancial officer). Based upon that evaluation, our Chief Executive Officer and Chief Financial Officer concludedthat our disclosure controls and procedures are effective.
Report of Management on Internal Control over Financial Reporting
Management is responsible for establishing and maintaining adequate internal control over financial reporting asdefined in Rule 13a-15(f) or 13d-15(f) under the SecuritiesExchangeActof1934, as amended. Our internal controlover financial reporting is a process designed to provide reasonable assurance regarding the reliability of financialreporting and the preparation of consolidated financial statements for external purposes in accordance with IFRS.Our internal control over financial reporting includes those policies and procedures that:
62

2. provide reasonable assurance that transactions are recorded as necessary to permit preparation of theconsolidated financial statements in accordance with IFRS and that receipts and expenditures of ourcompany are being made only in accordance with authorizations of management and our directors; and
3. provide reasonable assurance regarding prevention or timely detection of unauthorized acquisition, use ordisposition of our assets that could have a material effect on the consolidated financial statements.
TABLE OF CONTENTS
Management, including our Chief Executive Officer and Chief Financial Officer, conducted an evaluation of theeffectiveness of our internal control over financial reporting as of December 31, 2015. In conducting thisevaluation, management used the criteria set forth by the Committee of Sponsoring Organizations of the TreadwayCommission (COSO) in InternalControl — IntegratedFramework(2013).
A material weakness is a deficiency, or a combination of deficiencies, in internal control over financial reporting,such that there is a reasonable possibility that a material misstatement of the annual or interim financial statementswill not be prevented or detected on a timely basis. Management has identified the following material weaknessesin our internal control over financial reporting:
Deficiencies in the design of internal controls were identified relating to: (i) interpretations for complex accountingon contingent liabilities, collateral and risk mitigation assets stemming from structured trade finance transactions.Specifically, the insolvency of a customer subsequent to year-end resulted in management having to evaluate andmeasure certain receivables and contingent liabilities as at December 31, 2015; and (ii) the determination of thepresentation of revenue and costs of sales on a gross or net basis, which resulted in revenues and costs of salesbeing recast for prior periods. The internal controls over the assessment of these items and the related entity levelcontrols were not sufficiently designed to address the risks of potential misstatement. The material weaknessescould have resulted in the overstatement of assets and understatement of credit losses in the consolidated financialstatements as at and for the year ended December 31, 2015 and resulted in the restatement of revenues and costs ofsales for comparative periods. These misstatements were corrected prior to the issuance of the consolidatedfinancial statements and therefore, there were no misstatements in the current or prior period consolidated financialstatements.
Unless remediated, these control deficiencies could potentially result in a material misstatement of our futureconsolidated financial statements. We have responded to specific control deficiencies as they were identified andimplemented remediation plans to address any issues. We are actively working to strengthen our control procedureswith respect to the above deficiencies.
As a result of the material weaknesses identified above, management has concluded that, as of December 31, 2015,our company’s internal control over financial reporting was not effective.
The effectiveness of our company’s internal control over financial reporting as of December 31, 2015 has beenaudited by our independent registered chartered accountants, PricewaterhouseCoopers LLP, who also audited ourconsolidated financial statements for the year ended December 31, 2015. PricewaterhouseCoopers LLP hasexpressed an adverse opinion on the effectiveness of our internal control over financial reporting as of December31, 2015. Their report is included in this annual report on Form 20-F.
Changes in Internal Control over Financial Reporting
We maintain internal controls over financial reporting that have been designed to provide reasonable assurance ofthe reliability of external financial reporting in accordance with IFRS, as required by Canadian National Instrument52-109 – CertificationofDisclosureinIssuers’AnnualandInterimFilings.
Other than the control weaknesses described above, there were no changes in our internal control over financialreporting that occurred during the year ended December 31, 2015 that have materially affected, or are reasonablylikely to materially affect, our internal control over financial reporting.
Inherent Limitations on Effectiveness of Controls
Internal control over financial reporting has inherent limitations. Internal control over financial reporting is aprocess that involves human diligence and compliance and is subject to lapses in judgment and breakdownsresulting from human failures. Internal control over financial reporting also can be circumvented by collusion orimproper management override. Because of such limitations, there is a risk
63

TABLE OF CONTENTS
that material misstatements will not be prevented or detected on a timely basis by internal control over financialreporting. However, these inherent limitations are known features of the financial reporting process. Therefore, it ispossible to design into the process safeguards to reduce, though not eliminate, this risk.
ITEM 16: [RESERVED]
ITEM 16A: AUDIT COMMITTEE FINANCIAL EXPERT
Silke Stenger was appointed Chair of our Audit Committee with effect from March 2014. Our board of directorshad determined that Ms. Stenger qualified as an “audit committee financial expert” and was “independent”, as suchterms are used in Section 303A.02 of the NYSE Listed Company Manual.
ITEM 16B: CODE OF ETHICS
Code of Ethics and Code of Conduct
Our board of directors encourages and promotes a culture of ethical business conduct through the adoption andmonitoring of our codes of ethics and conduct, the insider trading policy and such other policies as may be adoptedfrom time to time.
Our board of directors adopted a written Code of Business Conduct and Ethics and Insider Trading Policy onOctober 26, 2013, referred to as the “Code of Ethics”. Prior to the adoption of the Code of Ethics, our board ofdirectors had previously adopted a written code of ethics on November 9, 2006 and a code of conduct. Since suchadoption, our board of directors has conducted an assessment of its performance, including the extent to which theboard and each director comply therewith. It is intended that such assessment will be conducted annually.
The Code of Ethics applies to all of our directors, officers and employees. The purpose of the Code of Ethics is to,among other things, promote honest and ethical behavior and conduct, including: (i) ethical handling of actual orapparent conflicts of interest between personal and professional relationships; (ii) full, fair, accurate, timely andunderstandable disclosure in all reports and documents that we file with, or submit to, the SEC, the Canadiansecurities regulatory authorities and in all other public communications made by us; (iii) compliance withapplicable governmental laws, rules and regulations; (iv) prompt internal reporting of violations of the Code ofEthics to an appropriate person or the persons identified therein; and (v) accountability for adherence to the Code ofEthics.
There has been no conduct of any director or officer that would constitute a departure from the Code of Ethics, andtherefore, no material change reports have been filed in this regard.
The foregoing summary of the Code of Ethics is not complete and is qualified in its entirety by reference to the fulltext of the Code of Ethics, a copy of which is available online at our website at www.mfcbancorpltd.com . A copyof the Code of Ethics was filed as Exhibit 11.1 of our Annual Report on Form 20-F for the year endedDecember 31, 2013.
We will provide a copy of the Code of Ethics to any person without charge, upon request. Requests can be sent bymail to: MFC Bancorp Ltd., Suite 1860 - 400 Burrard Street, Vancouver, British Columbia, Canada V6C 3A6.
ITEM 16C: PRINCIPAL ACCOUNTANT FEES AND SERVICES
Audit Fees
The aggregate fees for audit services rendered for the audit of our annual financial statements for the year endedDecember 31, 2015 by PricewaterhouseCoopers LLP were $2,679,000 (before goods and services tax). Theaggregate fees for audit services rendered for the audit of our annual financial statements for the fiscal year endedDecember 31, 2014 by PricewaterhouseCoopers LLP were $2,707,500 (before goods and services tax).
Audit-Related Fees
$27,500 and $nil were billed by PricewaterhouseCoopers LLP during the years ended December 31, 2015 and 2014for assurance or related services that were reasonably related to the performance of the audit of our financialstatements and that were not reported under the category “Audit Fees” above.
64

TABLE OF CONTENTS
Tax Fees
During the fiscal year ended December 31, 2015, the aggregate fees billed for tax compliance, tax advice and taxplanning by PricewaterhouseCoopers LLP were $100,800 (before goods and services tax). For the fiscal year endedDecember 31, 2014, the aggregate fees for tax compliance, tax advice and tax planning by PricewaterhouseCoopersLLP were $184,000 (before goods and services tax).
All Other Fees
During the fiscal year ended December 31, 2015, the aggregate fees billed by PricewaterhouseCoopers LLP for allservices not related to audit or tax were $148,700 (before goods and services tax). For the fiscal year endedDecember 31, 2014, the aggregate fees billed by PricewaterhouseCoopers LLP for all services not related to audit ortax were $40,000 (before goods and services tax), which related to certain financial due diligence matters.
Audit Committee Pre-approval Policies and Procedures
The Audit Committee pre-approves all services provided by our independent auditors. All of the services and feesdescribed under the categories of “Audit-Related Fees”, “Tax Fees” and “All Other Fees” were reviewed andapproved by the Audit Committee before the respective services were rendered and none of such services wereapproved by the Audit Committee pursuant to paragraph (c)(7)(i)(C) of Rule 2-01 of Regulation S-X.
The Audit Committee has considered the nature and amount of the fees billed for the fiscal years endedDecember 31, 2015 and 2014 by PricewaterhouseCoopers LLP and believes that the provision of the services foractivities unrelated to the audit is compatible with maintaining the independence of PricewaterhouseCoopers LLP.
ITEM 16D: EXEMPTIONS FROM THE LISTING STANDARDS FOR AUDIT COMMITTEES
Not applicable.
ITEM 16E: PURCHASES OF EQUITY SECURITIES BY THE ISSUER AND AFFILIATED PURCHASERS
In 2015, neither we nor any affiliated purchaser (as defined in the SecuritiesExchangeActof1934) purchased anyof our common shares.
ITEM 16F: CHANGE IN REGISTRANT’S CERTIFYING ACCOUNTANT
Appointment of PricewaterhouseCoopers LLP
Our board of directors appointed PricewaterhouseCoopers LLP to be our principal accountant effectiveSeptember 23, 2013.
Except as they may have advised us in their position as the auditors of our company, during our two most recentfiscal years and any subsequent interim period prior to engaging PricewaterhouseCoopers LLP, we did not consultthem regarding (i) the application of accounting principles to a specified transaction, either completed or proposed,or the type of audit opinion that might be rendered on our financial statements or (ii) any matter that was either thesubject of a disagreement (as defined in Item 16F(a)(1)(iv) and the related instructions to Item 16F of Form 20-F) ora reportable event (as described in Item 16F(a)(1)(v) of Form 20-F).
Disclosure Provided to Accountants
We have provided a member of PricewaterhouseCoopers LLP with a copy of our disclosure under Item 16F of thisannual report on Form 20-F. We have requested that PricewaterhouseCoopers LLP furnish us with a letteraddressed to the SEC stating whether it agrees with the statements made by us in response to this Item 16F(a) and,if not, stating the respects in which it does not agree.
65

• Section 303A.03 of the NYSE’s Listed Company Manual requires the non-management directors of alisted company to meet at regularly scheduled executive sessions without management.
• Section 303A.08 of the NYSE’s Listed Company Manual requires shareholder approval of all equitycompensation plans and material revisions to such plans.
TABLE OF CONTENTS
ITEM 16G: CORPORATE GOVERNANCE
Shares of our common stock are listed on the NYSE. Summarized below are the significant differences between ourcorporate governance rules and the corporate governance rules applicable to U.S. domestic issuers under the listingstandards of the NYSE:
While our independent directors (all of whom are non-management directors) meet regularly forcommittee meetings at which they are all present without non-independent directors or management inattendance, they do not generally hold other regularly scheduled meetings at which non-independentdirectors and members of management are not in attendance.
Our current stock option and the 2014 Plan have been approved by our shareholders. However, while our2014 Plan provides that amendments may be submitted for shareholder approval by our board of directorsto the extent that it deems it necessary or advisable, our plans do not specifically require shareholderapproval of material revisions.
ITEM 16H: MINE SAFETY DISCLOSURE
The information concerning mine safety violations and other regulatory matters required by Section 1503(a) of theDodd-FrankWallStreetReformandConsumerProtectionActis included in Exhibit 16.1 to this annual report onForm 20-F.
ITEM 17: FINANCIAL STATEMENTS
Not applicable. See “ Item18:FinancialStatements”.
66

1. Report of Independent Auditors, PricewaterhouseCoopers LLP, dated May 2, 2016 on the consolidatedfinancial statements of our company for the years ended December 31, 2015 and 2014 and on theeffectiveness of internal controls over financial reporting as at December 31, 2015
2. Consolidated statements of financial position as of December 31, 2015 and 2014
3. Consolidated statements of operations for the years ended December 31, 2015, 2014 and 2013
4. Consolidated statements of comprehensive income for the years ended December 31, 2015, 2014 and2013
5. Consolidated statements of changes in equity for the years ended December 31, 2015, 2014 and 2013
6. Consolidated statements of cash flows for the years ended December 31, 2015, 2014 and 2013
7. Notes to consolidated financial statements as of December 31, 2015
TABLE OF CONTENTS
ITEM 18: FINANCIAL STATEMENTS
The following attached audit reports and financial statements are incorporated herein:
68
71
72
73
74
76
78
67

TABLE OF CONTENTS
Independent Auditor’s Report
To the Shareholders of MFC Bancorp Ltd.
We have completed integrated audits of MFC Bancorp Ltd. and its subsidiaries’ current year and prior yearconsolidated financial statements and their internal control over financial reporting as at December 31, 2015. Ouropinions, based on our audits are presented below.
Report on the consolidated financial statements
We have audited the accompanying consolidated financial statements of MFC Bancorp Ltd. and its subsidiaries,which comprise the consolidated statements of financial position as at December 31, 2015, December 31, 2014 andJanuary 1, 2014 and the consolidated statements of operations, comprehensive (loss)/income, changes in equity andcash flows for each of the three years in the period ended December 31, 2015, and the related notes, which comprisea summary of significant accounting policies and other explanatory information.
Management’s responsibility for the consolidated financial statements
Management is responsible for the preparation and fair presentation of these consolidated financial statements inaccordance with International Financial Reporting Standards as issued by the International Accounting StandardsBoard and for such internal control as management determines is necessary to enable the preparation ofconsolidated financial statements that are free from material misstatement, whether due to fraud or error.
Auditor’s responsibility
Our responsibility is to express an opinion on these consolidated financial statements based on our audits. Weconducted our audits in accordance with Canadian generally accepted auditing standards and the standards of thePublic Company Accounting Oversight Board (United States). Those standards require that we plan and performthe audit to obtain reasonable assurance about whether the consolidated financial statements are free from materialmisstatement. Canadian generally accepted auditing standards also require that we comply with ethicalrequirements.
An audit involves performing procedures to obtain audit evidence, on a test basis, about the amounts anddisclosures in the consolidated financial statements. The procedures selected depend on the auditor’s judgment,including the assessment of the risks of material misstatement of the consolidated financial statements, whether dueto fraud or error. In making those risk assessments, the auditor considers internal control relevant to the company’spreparation and fair presentation of the consolidated financial statements in order to design audit procedures that areappropriate in the circumstances. An audit also includes evaluating the appropriateness of accounting principles andpolicies used and the reasonableness of accounting estimates made by management, as well as evaluating theoverall presentation of the consolidated financial statements.
We believe that the audit evidence we have obtained in our audits is sufficient and appropriate to provide a basis forour audit opinion on the consolidated financial statements.
Opinion
In our opinion, the consolidated financial statements present fairly, in all material respects, the financial position ofMFC Bancorp Ltd. and its subsidiaries as at December 31, 2015, December 31, 2014 and January 1, 2014 and theirfinancial performance and their cash flows for each of the three years in the period ended December 31, 2015 inaccordance with International Financial Reporting Standards as issued by the International Accounting StandardsBoard.
Emphasis of Matter
As discussed in Note 1A of the consolidated financial statements, certain comparative information in theconsolidated financial statements for the years ended December 31, 2014 and 2013 have been restated to correct anerror. Our opinion is not modified with respect to this matter.
68

TABLE OF CONTENTS
Report on internal control over financial reporting
We have also audited MFC Bancorp Ltd. and its subsidiaries’ internal control over financial reporting as atDecember 31, 2015, based on criteria established in Internal Control — Integrated Framework (2013), issued by theCommittee of Sponsoring Organizations of the Treadway Commission (COSO).
Management’s responsibility for internal control over financial reporting
Management is responsible for maintaining effective internal control over financial reporting and for its assessmentof the effectiveness of internal control over financial reporting included in Item 15 of the Annual Report on Form20-F.
Auditor’s responsibility
Our responsibility is to express an opinion on the company’s internal control over financial reporting based on ouraudit. We conducted our audit of internal control over financial reporting in accordance with the standards of thePublic Company Accounting Oversight Board (United States). Those standards require that we plan and performthe audit to obtain reasonable assurance about whether effective internal control over financial reporting wasmaintained in all material respects.
An audit of internal control over financial reporting includes obtaining an understanding of internal control overfinancial reporting, assessing the risk that a material weakness exists, testing and evaluating the design andoperating effectiveness of internal control, based on the assessed risk, and performing such other procedures as weconsider necessary in the circumstances.
We believe that our audit provides a reasonable basis for our audit opinion on the company’s internal control overfinancial reporting.
Definition of internal control over financial reporting
A company’s internal control over financial reporting is a process designed to provide reasonable assuranceregarding the reliability of financial reporting and the preparation of financial statements for external purposes inaccordance with generally accepted accounting principles. A company’s internal control over financial reportingincludes those policies and procedures that: (i) pertain to the maintenance of records that, in reasonable detail,accurately and fairly reflect the transactions and dispositions of the assets of the company; (ii) provide reasonableassurance that transactions are recorded as necessary to permit preparation of financial statements in accordancewith generally accepted accounting principles, and that receipts and expenditures of the company are being madeonly in accordance with authorizations of management and directors of the company; and (iii) provide reasonableassurance regarding prevention or timely detection of unauthorized acquisition, use, or disposition of the company’sassets that could have a material effect on the financial statements.
Inherent limitations
Because of its inherent limitations, internal control over financial reporting may not prevent or detectmisstatements. Also, projections of any evaluation of effectiveness to future periods are subject to the risk thatcontrols may become inadequate because of changes in conditions or that the degree of compliance with thepolicies or procedures may deteriorate.
Opinion
In our opinion, the Company did not maintain, in all material respects, effective internal control over financialreporting as at December 31, 2015, based on criteria established in Internal Control — Integrated Framework (2013)issued by COSO because material weaknesses in internal control over financial reporting existed as of that daterelated to deficiencies in the design of internal controls over (i) the accounting for contingent liabilities andcollateral and risk mitigation securities on trade receivables in structured trade finance transactions involving acustomer and multiple third parties, and (ii) the determination of the presentation of revenue and cost of sales on agross or net basis. The internal controls over the assessment of these amounts on the statement of financial position,the presentation of these transactions in the consolidated statements of operations and the related entity levelcontrols were not sufficiently designed to address the risks of potential misstatement.
69

TABLE OF CONTENTS
A material weakness is a deficiency, or a combination of deficiencies, in internal control over financial reporting,such that there is a reasonable possibility that a material misstatement of the annual or interim financial statementswill not be prevented or detected on a timely basis. The material weaknesses referred to above are described inManagement’s Report on Internal Control Over Financial Reporting included in Item 15 of the Annual Report onForm 20-F. We considered these material weaknesses in determining the nature, timing, and extent of audit testsapplied in our audit of the December 31, 2015 consolidated financial statements and our opinion regarding theeffectiveness of the Company’s internal control over financial reporting does not affect our opinion on thoseconsolidated financial statements. We do not express an opinion or any other form of assurance on management’sstatement referring to management’s remediation plans.
(signed)PricewaterhouseCoopersLLP
Chartered Professional Accountants
Vancouver, British Columbia May 2, 2016
70

TABLE OF CONTENTS
MFC BANCORP LTD. ( FORMERLY MFC INDUSTRIAL LTD. )
CONSOLIDATED STATEMENTS OF FINANCIAL POSITION (Canadian Dollars in Thousands)
NotesDecember 31,
2015December 31,
2014January 1,
2014 ASSETS
Current AssetsCash and cash equivalents $ 197,519 $ 344,891 $ 353,299Short-term cash deposits 233 184 4,660Securities 170 290 2,200Securities – derivatives 5,555 6,274 1,483Restricted cash 639 644 332Trade receivables 6 151,229 187,558 123,035Tax receivables 11,705 15,339 6,917Other receivables 7 14,727 26,406 23,944Inventories 8 245,345 246,611 94,494Real estate held for sale 1,130 13,970 13,482Deposits, prepaid and other 9 21,442 8,985 28,861Assets held for sale 4 136,156 152,107 103,535
Total current assets 785,850 1,003,259 756,242Non-current Assets
Securities 680 839 2,622Securities – derivatives 171 — —Real estate held for sale 13,812 — —Investment property 10 37,873 — —Property, plant and equipment 11 95,745 122,829 100,503Interests in resource properties 4 — 403,813 382,678Hydrocarbon probable reserves 4 — 50,644 80,054Hydrocarbon unproved lands 4 — 27,560 33,348Accrued pension assets, net 12 — 1,362 1,339Deferred income tax assets 13 20,641 27,832 19,082Other 21,912 53,490 26,592Other, restricted 667 591 —
Total non-current assets 191,501 688,960 646,218$ 977,351 $ 1,692,219 $ 1,402,460
LIABILITIES AND EQUITY Current Liabilities
Short-term bank borrowings 14 $ 60,103 $ 187,171 $ 138,037Debt, current portion 15 84,705 66,098 47,723Account payables and accrued expenses 16 174,812 158,345 132,490Dividends payable — 4,388 —Income tax liabilities 3,809 4,963 2,011Financial liabilities – derivatives 3,554 2,006 2,213Liabilities relating to assets held for sale 4 87,579 17,802 12,249
Total current liabilities 414,562 440,773 334,723Long-term Liabilities
Debt, less current portion 15 174,333 297,157 201,947Deferred income tax liabilities 13 13,711 11,852 3,798Financial liabilities – derivatives 682 1,533 —Decommissioning obligations 4 — 150,299 112,586Accrued pension obligations, net 12 4,061 4,329 —Other 802 7,343 5,161
Total long-term liabilities 193,589 472,513 323,492Total liabilities 608,151 913,286 658,215
EquityCapital stock, fully paid 17 419,916 419,655 418,407Treasury stock 17 (61,085 (61,085 (61,085Contributed surplus 15,417 15,620 13,451Retained (deficit) earnings (63,559 424,129 438,508Accumulated other comprehensive income (loss) 56,503 (20,602 (65,218
Shareholders’ equity 367,192 777,717 744,063Non-controlling interests 2,008 1,216 182
Total equity 369,200 778,933 744,245$ 977,351 $ 1,692,219 $ 1,402,460
Theaccompanyingnotesareanintegralpartoftheseconsolidatedfinancialstatements.71
) ) )
)) )

TABLE OF CONTENTS
MFC BANCORP LTD. ( FORMERLY MFC INDUSTRIAL LTD.)
CONSOLIDATED STATEMENTS OF OPERATIONS For the Years Ended December 31, 2015, 2014 and 2013
(Canadian Dollars in Thousands, Except per Share Amounts)
Notes 2015 2014 2013 (Restated – Note 1A)
Gross revenues 18 $ 1,579,702 $ 1,286,324 $ 621,085
Costs and expenses:Costs of sales and services 18 1,529,578 1,178,022 550,822Selling, general and administrative 84,653 81,505 53,750Share-based compensation – selling, general and
administrative 19 — 423 —Finance costs 20,355 13,263 9,742Impairment of available-for-sale securities 245 341 550
1,634,831 1,273,554 614,864
(Loss) income from operations (55,129 12,770 6,221
Other items:Exchange differences on foreign currency
transactions (288 (6,293 (2,211Change in fair value of puttable instrument financial
liabilities — (163 (851
(Loss) income before income taxes (55,417 6,314 3,159Income tax (expense) recovery 20 (2,501 (2,173 997(Loss) income from continuing operations (57,918 4,141 4,156(Loss) income on discontinued operations 4 (428,086 (3,465 5,408Net (loss) income for the year (486,004 676 9,564
Less: Net (income) loss attributable to non-controllinginterests (1,626 (1,358 168
Net (loss) income attributable to owners of the parentcompany $ (487,630 $ (682 $ 9,732
Basic (loss) earnings per share:Continuing operations 21 $ (0.94 $ 0.04 $ 0.07Discontinued operations 21 (6.78 (0.05 0.09
$ (7.72 $ (0.01 $ 0.16
Diluted (loss) earnings per share:Continuing operations 21 $ (0.94 $ 0.04 $ 0.07Discontinued operations 21 (6.78 (0.05 0.09
$ (7.72 $ (0.01 $ 0.16
Weighted average number of common shares outstanding– basic 21 63,142,272 62,922,837 62,552,126– diluted 21 63,142,272 62,957,105 62,756,791
Theaccompanyingnotesareanintegralpartoftheseconsolidatedfinancialstatements.72
)
) ) )
) )
)) ))) ))
) )
) )
)) )) )
)) )) )

TABLE OF CONTENTS
MFC BANCORP LTD. ( FORMERLY MFC INDUSTRIAL LTD .)
CONSOLIDATED STATEMENTS OF COMPREHENSIVE (LOSS) INCOME For the Years Ended December 31, 2015, 2014 and 2013
(Canadian Dollars in Thousands)
2015 2014 2013
Net (loss) income for the year $ (486,004 $ 676 $ 9,564Other comprehensive income, net of income taxes
Exchange differences arising from translating financial statements offoreign operations 79,355 45,767 16,916
Reclassification adjustment for exchange differences to statements ofoperations for subsidiaries deconsolidated 143 (127 —
Net exchange differences 79,498 45,640 16,916
Fair value loss on available-for-sale securities (293 (282 (117Reclassification of fair value loss on available-for-sale securities to
statements of operations for securities disposed of or impaired 245 147 321
Net fair value (loss) gain on available-for-sale securities (48 (135 204
Remeasurement of net defined benefit liabilities (298 (1,034 1,522
Other comprehensive income 79,152 44,471 18,642Total comprehensive (loss) income for the year (406,852 45,147 28,206Comprehensive income attributable to non-controlling interests (2,028 (1,213 (123Comprehensive (loss) income attributable to owners of the parent
company $ (408,880 $ 43,934 $ 28,083
Consisting of: Continuing operations $ 7,057 $ 28,201 $ 35,758Discontinued operations (415,937 15,733 (7,675
$ (408,880 $ 43,934 $ 28,083Other comprehensive income, net of income taxes, comprised amounts:
will not be reclassified subsequently to profit or loss $ (298 $ (1,034 $ 1,522will be reclassified subsequently to profit or loss when specific
conditions are met 79,450 45,505 17,120
$ 79,152 $ 44,471 $ 18,642
Theaccompanyingnotesareanintegralpartoftheseconsolidatedfinancialstatements.73
)
)
) ) )
) )
) )
)) ) )
)
) ))
) )

TABLE OF CONTENTS
MFC BANCORP LTD. ( FORMERLY MFC INDUSTRIAL LTD .)
CONSOLIDATED STATEMENTS OF CHANGES IN EQUITY For the Years Ended December 31, 2015, 2014 and 2013
(Canadian Dollars in Thousands)
Capital Stock Treasury Stock Contributed Surplus Accumulated Other
Comprehensive Income
Number of Shares Amount
Number of Shares Amount
Share-based Compensation
Contingently Issuable Shares
Retained Earnings (Deficit)
Available- for-sale
Securities
Defined Benefit
Obligations
Currency Translation Adjustment
Share- holders’ Equity
Non- controlling
Interests Total Equity
Balance at December 31, 2012 67,132,106 $ 418,035 (4,579,980 $ (60,713 $ 13,451 $ — $ 439,658 $ (118 $ 956 $ (84,407 $ 726,862 $ 6,156 $ 733,018
Net income — — — — — — 9,732 — — — 9,732 (168 9,564Dividends paid — — — — — — (15,353 — — — (15,353 (804 (16,157Issuance of preferred shares as
dividends 369,830 372 (369,830 (372 — — — — — — — — —Acquisition and elimination of
non-controlling interest — — — — — — 4,471 — — — 4,471 (5,293 (822
Net fair value gain — — — — — — — 204 — — 204 — 204Net gain on remeasurements — — — — — — — — 1,522 — 1,522 — 1,522Net exchange
differences — — — — — — — — — 16,625 16,625 291 16,916
Balance at December 31, 2013 67,501,936 418,407 (4,949,810 (61,085 13,451 — 438,508 86 2,478 (67,782 744,063 182 744,245
Net income — — — — — — (682 — — — (682 1,358 676Dividends paid and payable — — — — — — (16,874 — — — (16,874 (1,034 (17,908Share-based
compensation — — — — 423 — — — — — 423 — 423Exercise of employee stock
options 30,326 343 — — (84 — — — — — 259 — 259Acquisition and elimination of
non-controlling interest 509,820 905 — — — 1,830 3,177 — — — 5,912 (1,403 4,509
Purchase of a subsidiary — — — — — — — — — — — 140 140
Disposition of subsidiaries — — — — — — — — — — — 2,118 2,118
Net fair value loss — — — — — — — (135 — — (135 — (135Net loss on remeasurements — — — — — — — — (1,034 — (1,034 — (1,034Net exchange
differences — — — — — — — — — 45,785 45,785 (145 45,640
Balance at December 31, 2014 68,042,082 419,655 (4,949,810 (61,085 13,790 1,830 424,129 (49 1,444 (21,997 777,717 1,216 778,933
Net loss — — — — — — (487,630 — — — (487,630 1,626 (486,004Deconsolidation of a
subsidiary — — — — — — — — (1,645 — (1,645 — (1,645
Issuance of contingentlyissuable shares 50,000 261 — — — (203 (58 — — — — — —
Dividends paid — — — — — — — — — — — (1,236 (1,236
Net fair value loss — — — — — — — (48 — — (48 — (48
Net loss on remeasurements — — — — — — — — (298 — (298 — (298Net exchange
differences — — — — — — — — — 79,096 79,096 402 79,498
Balance at December 31, 2015 68,092,082 $ 419,916 (4,949,810 $ (61,085 $ 13,790 $ 1,627 $ (63,559 $ (97 $ (499 $ 57,099 $ 367,192 $ 2,008 $ 369,200
Theaccompanyingnotesareanintegralpartoftheseconsolidatedfinancialstatements.74
) ) ) )
)) ) ) )
) )
) )
) ) )
) )) ) ) )
)
)
) ) )) ) )
)
) ) ) )
) ) )
) ) )
) )
) )
) ) )
) ) )
) ) ) ) )

* All the Class A Common Shares and Preferred Shares were and are held by the Group as Treasury Stock
TABLE OF CONTENTS
MFC BANCORP LTD. ( FORMERLY MFC INDUSTRIAL LTD .)
CONSOLIDATED STATEMENTS OF CHANGES IN EQUITY (CONTINUED) For the Years Ended December 31, 2015, 2014 and 2013
(Canadian Dollars in Thousands)
Total Comprehensive Income (Loss) for the Years ended December 31,
Owners of the Parent Company
Non- controlling
Interests Total 2013 $ 28,083 $ 123 $ 28,2062014 $ 43,934 $ 1,213 $ 45,1472015 $ (408,880 $ 2,028 $(406,852
Common Shares Preferred Shares* Total Capital Stock
Components of Capital Stock Number of Shares Amount
Number of Shares Amount
Number of Shares Amount
Balance at December 31, 2012 62,880,365 $ 401,388 4,251,741 $ 16,647 67,132,106 $ 418,035Exercise of employee stock options — — 369,830 372 369,830 372
Balance at December 31, 2013 62,880,365 401,388 4,621,571 17,019 67,501,936 418,407Exercise of employee stock options 30,326 343 — — 30,326 343Acquisition and elimination of non-controlling
interests 509,820 905 — — 509,820 905
Balance at December 31, 2014 63,420,511 402,636 4,621,571 17,019 68,042,082 419,655Issuance of contingently issuable shares 50,000 261 — — 50,000 261Balance at December 31, 2015 63,470,511 $ 402,897 4,621,571 $ 17,019 68,092,082 $ 419,916
Theaccompanyingnotesareanintegralpartoftheseconsolidatedfinancialstatements.75
) )

TABLE OF CONTENTS
MFC BANCORP LTD. ( FORMERLY MFC INDUSTRIAL LTD .)
CONSOLIDATED STATEMENTS OF CASH FLOWS For the Years Ended December 31, 2015, 2014 and 2013
(Canadian Dollars in Thousands)2015 2014 2013
Cash flows from continuing operating activities:Net (loss) income for the year $ (57,918 $ 4,141 $ 4,156Adjustments for:
Amortization, depreciation and depletion 6,450 4,957 2,206Exchange differences on foreign currency transactions 288 6,293 2,211Loss (gain) on short-term securities 84 (299 (5,851Gain on available-for-sale and other securities, net — (5,066 (238Impairment of available-for-sale securities 245 341 550Share-based compensation — 423 —Deferred income taxes (1,771 (1,202 (3,696Market value decrease (increase) on commodity inventories 1,910 (4,172 (5,502Interest accretion 47 — 433Credit losses 54,528 4,358 4,095Change in fair value of puttable instrument financial liabilities — 163 851Changes in operating assets and liabilities, net of effects of
acquisitions and dispositions:Short-term cash deposits (33 4,643 (4,314Short-term securities 80 2,305 10,458Restricted cash 60 6,593 599Receivables 56,306 3,640 (38,660Inventories 15,650 (32,026 33,514Deposits, prepaid and other (8,596 41,445 32Assets held for sale — 911 113Short-term bank borrowings (135,467 (99,329 (32,631Account payables and accrued expenses (17,017 13,423 5,636Income tax liabilities (975 720 (1,080Accrued pension assets, net of obligations (760 (119 —
Other (7,213 (781 (349
Cash flows used in continuing operating activities (94,102 (48,638 (27,467
Theaccompanyingnotesareanintegralpartoftheseconsolidatedfinancialstatements.76
)
) )) )
) ) )) )
) )
))
)
) ) ))) )) )) ) )
) ) )

TABLE OF CONTENTS
MFC BANCORP LTD. ( FORMERLY MFC INDUSTRIAL LTD .)
CONSOLIDATED STATEMENTS OF CASH FLOWS (CONTINUED) For the Years Ended December 31, 2015, 2014 and 2013
(Canadian Dollars in Thousands)2015 2014 2013
Cash flows from continuing investing activities:Purchases of property, plant and equipment, net $ (8,045 $ (29,648 $ (1,645Proceeds from sales of long-term investments, net — 1,632 7,249Increase in loan receivables — (3,132 —Decrease in loan receivables — 88 —Acquisition (disposition) of subsidiaries, net of cash acquired
(disposed) — (74,135 (6,599Other 85 74 76
Cash flows used in continuing investing activities (7,960 (105,121 (919Cash flows from continuing financing activities:
Debt repayment (49,526 (12,735 (19,311Debt borrowing 5,662 140,481 101,797Issuance of shares — 259 —Repayment to a customer — (23,576 23,576Dividends paid to shareholders (4,388 (12,486 (15,353Dividends paid to non-controlling interests (1,236 (1,034 (804
Cash flows (used in) provided by continuing financing activities (49,488 90,909 89,905Cash flows (used in) provided by discontinued operating activities (10,264 51,596 45,327Cash flows used in discontinued investing activities (1,996 (13,698 (7,160Cash flows used in discontinued financing activities (19,181 (19,843 (41,052Exchange rate effect on cash and cash equivalents 35,619 36,387 22,271
(Decrease) increase in cash and cash equivalents (147,372 (8,408 80,905Cash and cash equivalents, beginning of year 344,891 353,299 272,394
Cash and cash equivalents, end of year $ 197,519 $ 344,891 $ 353,299
Cash and cash equivalents at end of year consisted of:Cash $ 120,805 $ 279,867 $ 246,866Money market and highly liquid funds 76,714 65,024 106,433
$ 197,519 $ 344,891 $ 353,299
Supplemental cash flows disclosure (see Note 24)Interest received $ 4,222 $ 5,369 $ 2,916Dividends received 7 6 304Interest paid (15,183 (12,672 (9,441Income taxes paid (5,035 (4,229 (2,304
Theaccompanyingnotesareanintegralpartoftheseconsolidatedfinancialstatements.77
) ) )
)
) )
) ) )
) ) )
)) ) )) ) )
))) ) )) ) )
) )
) ) )) ) )
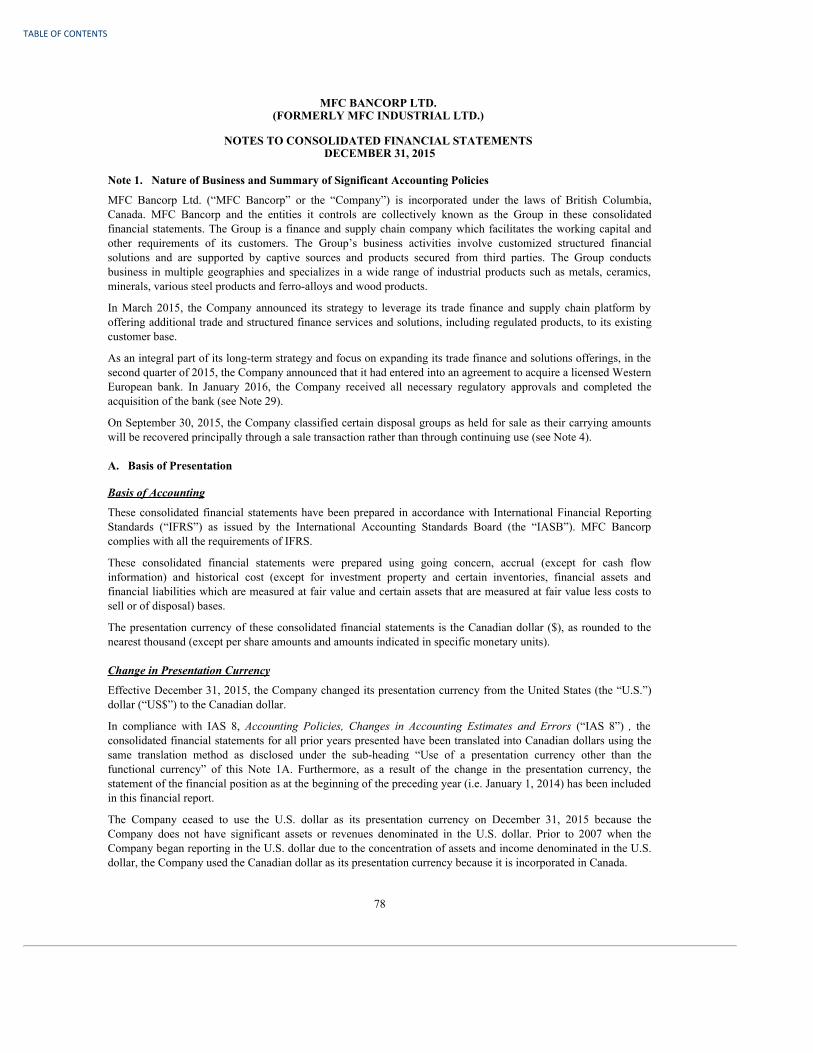
TABLE OF CONTENTS
MFC BANCORP LTD. (FORMERLY MFC INDUSTRIAL LTD.)
NOTES TO CONSOLIDATED FINANCIAL STATEMENTS
DECEMBER 31, 2015
Note 1. Nature of Business and Summary of Significant Accounting Policies
MFC Bancorp Ltd. (“MFC Bancorp” or the “Company”) is incorporated under the laws of British Columbia,Canada. MFC Bancorp and the entities it controls are collectively known as the Group in these consolidatedfinancial statements. The Group is a finance and supply chain company which facilitates the working capital andother requirements of its customers. The Group’s business activities involve customized structured financialsolutions and are supported by captive sources and products secured from third parties. The Group conductsbusiness in multiple geographies and specializes in a wide range of industrial products such as metals, ceramics,minerals, various steel products and ferro-alloys and wood products.
In March 2015, the Company announced its strategy to leverage its trade finance and supply chain platform byoffering additional trade and structured finance services and solutions, including regulated products, to its existingcustomer base.
As an integral part of its long-term strategy and focus on expanding its trade finance and solutions offerings, in thesecond quarter of 2015, the Company announced that it had entered into an agreement to acquire a licensed WesternEuropean bank. In January 2016, the Company received all necessary regulatory approvals and completed theacquisition of the bank (see Note 29).
On September 30, 2015, the Company classified certain disposal groups as held for sale as their carrying amountswill be recovered principally through a sale transaction rather than through continuing use (see Note 4).
A. Basis of Presentation
Basis of Accounting
These consolidated financial statements have been prepared in accordance with International Financial ReportingStandards (“IFRS”) as issued by the International Accounting Standards Board (the “IASB”). MFC Bancorpcomplies with all the requirements of IFRS.
These consolidated financial statements were prepared using going concern, accrual (except for cash flowinformation) and historical cost (except for investment property and certain inventories, financial assets andfinancial liabilities which are measured at fair value and certain assets that are measured at fair value less costs tosell or of disposal) bases.
The presentation currency of these consolidated financial statements is the Canadian dollar ($), as rounded to thenearest thousand (except per share amounts and amounts indicated in specific monetary units).
Change in Presentation Currency
Effective December 31, 2015, the Company changed its presentation currency from the United States (the “U.S.”)dollar (“US$”) to the Canadian dollar.
In compliance with IAS 8, Accounting Policies, Changes in Accounting Estimates and Errors (“IAS 8”) , theconsolidated financial statements for all prior years presented have been translated into Canadian dollars using thesame translation method as disclosed under the sub-heading “Use of a presentation currency other than thefunctional currency” of this Note 1A. Furthermore, as a result of the change in the presentation currency, thestatement of the financial position as at the beginning of the preceding year (i.e. January 1, 2014) has been includedin this financial report.
The Company ceased to use the U.S. dollar as its presentation currency on December 31, 2015 because theCompany does not have significant assets or revenues denominated in the U.S. dollar. Prior to 2007 when theCompany began reporting in the U.S. dollar due to the concentration of assets and income denominated in the U.S.dollar, the Company used the Canadian dollar as its presentation currency because it is incorporated in Canada.
78

TABLE OF CONTENTS
MFC BANCORP LTD. (FORMERLY MFC INDUSTRIAL LTD.)
NOTES TO CONSOLIDATED FINANCIAL STATEMENTS
DECEMBER 31, 2015
Note 1. Nature of Business and Summary of Significant Accounting Policies (continued) Principles of Consolidation
These consolidated financial statements include the accounts of MFC Bancorp and entities it controls. TheCompany controls an investee if and only if it has all the following: (a) power over the investee; (b) exposure, orrights, to variable returns from its involvement with the investee; and (c) the ability to use its power over theinvestee to affect the amount of its returns. When the Group holds, directly or indirectly, more than 50% of thevoting power of the investee, it is presumed that the Group controls the investee, unless it can be clearlydemonstrated that this is not the case. Subsidiaries are consolidated from the date of their acquisition, being the dateon which the Group obtains control, and continue to be consolidated until the date that such control ceases. Allintercompany balances and transactions, including unrealized profits arising from intragroup transactions, havebeen eliminated in full. Unrealized losses are eliminated unless the transaction provides evidence of an impairmentof the asset transferred.
On the acquisition date, a non-controlling interest is measured at either its fair value or its proportionate share in therecognized amounts of the subsidiary’s identifiable net assets, on a transaction-by-transaction basis. Subsequently,non-controlling interest increases or decreases for its share of changes in equity since the acquisition date.
After initial consolidation of a subsidiary, when the proportion of equity held by the non-controlling interestschanges, the Group adjusts the carrying amounts of the controlling and non-controlling interests to reflect thechanges in their relative interests in the subsidiary. The Group recognizes directly in equity any difference betweenthe amount by which the non-controlling interests are adjusted and the fair value of the consideration paid orreceived, and attribute it to the owners of the Group.
When the Group loses control of a subsidiary, it (a) derecognizes: (i) the assets (including any goodwill) andliabilities of the subsidiary at their carrying amounts at the date when control is lost; and (ii) the carrying amount ofany non-controlling interests in the former subsidiary at the date when control is lost (including any components ofother comprehensive income attributable to them); (b) recognizes: (i) the fair value of the consideration received, ifany, from the transaction, event or circumstances that resulted in the loss of control; (ii) if the transaction, event orcircumstances that resulted in the loss of control involves a distribution of shares of the subsidiary to owners in theircapacity as owners, that distribution; and (iii) any investment retained in the former subsidiary at its fair value at thedate when control is lost; (c) reclassifies to profit or loss, or transfers directly to retained earnings if required byIFRS, the amounts recognized in other comprehensive income in relation to the subsidiary and (d) recognizes anyresulting difference as a gain or loss in profit or loss attributable to the Group.
The financial statements of MFC Bancorp and its subsidiaries used in the preparation of the consolidated financialstatements are prepared as of the same date, using uniform accounting policies for like transactions and other eventsin similar circumstances.
Foreign Currency Translation
The presentation currency of the Group’s consolidated financial statements is the Canadian dollar.
MFC Bancorp conducts its business throughout the world through its foreign operations. Foreign operations areentities that are subsidiaries, associates, joint arrangements or branches, the activities of which are based orconducted in countries or currencies other than those of MFC Bancorp. Functional currency is the currency of theprimary economic environment in which an entity operates and is normally the currency in which the entityprimarily generates and expends cash. Foreign currency is a currency other than the functional currency of theentity. The functional currencies of the Company and its subsidiaries and branches primarily comprise the Canadiandollar, Euro (“EUR” or “€”) and U.S. dollar (“US$”).
Reporting foreign currency transactions in the functional currency
A foreign currency transaction is a transaction that is denominated or requires settlement in a foreign currency. Aforeign currency transaction is recorded, on initial recognition in an entity’s functional currency, by applying to theforeign currency amount the spot exchange rate between the functional currency and the
79

(a) in the principal market for the asset or liability; or
TABLE OF CONTENTS
MFC BANCORP LTD. (FORMERLY MFC INDUSTRIAL LTD.)
NOTES TO CONSOLIDATED FINANCIAL STATEMENTS
DECEMBER 31, 2015
Note 1. Nature of Business and Summary of Significant Accounting Policies (continued) foreign currency at the date of the transaction. At the end of each reporting period: (a) foreign currency monetaryitems are translated using the closing rate; (b) non-monetary items denominated in a foreign currency that aremeasured in terms of historical cost are translated using the exchange rate at the date of the transaction; and (c)foreign currency non-monetary items that are measured at fair value are translated using the exchange rates at thedate when the fair value was determined.
Exchange differences arising on the settlement of monetary items or on translating monetary items at rates differentfrom those at which they were translated on initial recognition during the period or in previous periods arerecognized in profit or loss in the period in which they arise, except for exchange differences arising on a monetaryitem that forms part of a reporting entity’s net investment in a foreign operation which are initially recorded in othercomprehensive income in the consolidated financial statements and reclassified from equity to profit or loss ondisposal of the net investment.
When a gain or loss on a non-monetary item is recognized in other comprehensive income, any exchangecomponent of that gain or loss is recognized in other comprehensive income. Conversely, when a gain or loss on anon-monetary item is recognized in profit or loss, any exchange component of that gain or loss is recognized inprofit or loss.
Use of a presentation currency other than the functional currency
When an entity presents its financial statements in a currency that differs from its functional currency, the resultsand financial position of the entity are translated into the presentation currency using the following procedures: (a)assets and liabilities for each statement of financial position presented are translated at the closing rate at the date ofthe statement of financial position; (b) income and expenses for each statement of comprehensive income orseparate income statement presented are translated at exchange rates at the dates of the transactions or, for practicalreasons, the average exchange rates for the periods when they approximate the exchange rates at the dates of thetransactions; (c) individual items within equity are translated at either the historical exchange rates when practicalor at the closing exchange rates at the date of the statement of financial position; and (d) all resulting exchangedifferences are recognized in other comprehensive income.
The following table sets out exchange rates for the translation of the Euro and U.S. dollar, which represented themajor trading currencies of the Group, into the Canadian dollar:
EUR US$ Closing rate at December 31, 2015 1.5029 1.3840Average rate for the year 2015 1.4182 1.2787Closing rate at December 31, 2014 1.4038 1.1601Average rate for the year 2014 1.4671 1.1045Closing rate at December 31, 2013 1.4655 1.0636Average rate for the year 2013 1.3681 1.0299
Fair Value Measurement
Certain assets and liabilities of the Group are measured at fair value (see Note 1B. Significant Accounting Policies).
Fair value is the price that would be received to sell an asset or paid to transfer a liability in an orderly transactionbetween market participants at the measurement date. A fair value measurement is for a particular asset or liability.Therefore, when measuring fair value, the Group takes into account the characteristics of the asset or liability ifmarket participants would take those characteristics into account when pricing the asset or liability at themeasurement date. A fair value measurement assumes that the transaction to sell the asset or transfer the liabilitytakes place either:
80

(b) in the absence of a principal market, in the most advantageous market for the asset or liability.
TABLE OF CONTENTS
MFC BANCORP LTD. (FORMERLY MFC INDUSTRIAL LTD.)
NOTES TO CONSOLIDATED FINANCIAL STATEMENTS
DECEMBER 31, 2015
Note 1. Nature of Business and Summary of Significant Accounting Policies (continued)
The Group measures the fair value of an asset or a liability using the assumptions that market participants woulduse when pricing the asset or liability, assuming that market participants act in their economic best interest.
The Group uses valuation techniques that are appropriate in the circumstances and for which sufficient data isavailable to measure fair value, maximizing the use of relevant observable inputs and minimizing the use ofunobservable inputs. IFRS 13, Fair Value Measurement (“IFRS 13”) , establishes a fair value hierarchy thatcategorizes the inputs to valuation techniques used to measure fair value into three levels:
Level 1 inputs are quoted prices (unadjusted) in active markets for identical assets or liabilities that the entity canaccess at the measurement date.
Level 2 inputs are inputs other than quoted prices included within Level 1 that are observable for the asset orliability, either directly or indirectly.
Level 3 inputs are unobservable inputs for the asset or liability.
Assessing the significance of a particular input to the fair value measurement in its entirety requires judgment,considering factors specific to the asset or liability.
Non-current Assets Held for Sale
A non-current asset (or disposal group) is classified as held for sale if its carrying amount will be recoveredprincipally through a sale transaction rather than through continuing use. For this to be the case, the asset (ordisposal group) must be available for immediate sale in its present condition subject only to terms that are usual andcustomary for the sale of such asset (or disposal group), the appropriate level of management must be committed toa plan to sell the asset (or disposal group) and an active program to locate a buyer and complete the plan must havebeen initiated. Further, the asset (or disposal group) must be actively marketed for sale at a price that is reasonablein relation to its current fair value and the sale is highly probable to complete within one year from the date ofclassification, except as permitted under certain events and circumstances. If the aforesaid criteria are no longermet, the Group ceases to classify the asset (or disposal group) as held for sale.
Non-current assets (and disposal groups) classified as held for sale are measured at the lower of their carryingamounts and fair values less costs to sell. The Group does not depreciate or amortize a non-current asset while it isclassified as held for sale.
Use of Estimates and Assumptions and Measurement Uncertainty
The timely preparation of the consolidated financial statements in conformity with IFRS requires management tomake estimates and assumptions that affect the reported amounts of assets and liabilities and disclosure ofcontingent assets and liabilities at the date of the financial statements and the reported amounts of revenues andexpenses during the reporting period. Management’s best estimates are based on the facts and circumstancesavailable at the time estimates are made, historical experience, general economic conditions and trends, andmanagement’s assessment of probable future outcomes of these matters. Actual results could differ from theseestimates, and such differences could be material. For critical judgments in applying accounting policies and majorsources of estimation uncertainty, see Notes 1C and 1D.
Restatement
In connection with the preparation of these financial statements and after an examination of various historictransactions on a case-by-case basis involving the purchase and subsequent sale of goods to customers or theiraffiliates, management of the Group determined to reclassify $129,899 and $91,465 of gross revenues previouslyrecognized for fiscal 2014 and 2013, respectively, along with corresponding costs of sales and services of $126,318and $88,974, respectively for each such period on a net basis where the
81

TABLE OF CONTENTS
MFC BANCORP LTD. (FORMERLY MFC INDUSTRIAL LTD.)
NOTES TO CONSOLIDATED FINANCIAL STATEMENTS
DECEMBER 31, 2015
Note 1. Nature of Business and Summary of Significant Accounting Policies (continued) costs of purchases of goods and subsequent sales of such goods to these entities were previously recorded on a grossbasis. As a result, revenues were reduced and restated by $126,318 and $88,974 for 2014 and 2013, respectively,with a corresponding identical reduction to our costs of sales and services for such periods, and such comparativeperiods have been restated accordingly. This had no impact on the Group’s net income, income from operations,statement of cash flows or financial position.
B. Significant Accounting Policies
(i) Financial Instruments
All financial assets and financial liabilities are classified by characteristic and/or management intent. Except forcertain financial instruments which are excluded from the scope, all financial assets are classified into one of fourcategories: at fair value through profit or loss, held-to-maturity, loans and receivables, and available-for-sale; andall financial liabilities are classified into one of two categories: at fair value through profit or loss and at amortizedcost.
A financial asset or financial liability at fair value through profit or loss is a financial asset or financial liability thatmeets either of the following conditions: (a) it is classified as held for trading if it is (i) acquired or incurredprincipally for the purpose of selling or repurchasing it in the near term; (ii) part of a portfolio of identified financialinstruments that are managed together and for which there is evidence of a recent actual pattern of short-term profittaking; or (iii) a derivative, except for a derivative that is a designated and effective hedging instrument; or (b) it isdesignated by the Group upon initial recognition as at fair value through profit or loss when certain conditions aremet. Generally, a financial instrument cannot be reclassified out of the fair value through profit or loss categorywhile it is held or issued, except in rare circumstances.
Available-for-sale financial assets are those non-derivative financial assets that are designated as available for sale,or that are not classified as loans and receivables, held-to-maturity investments, or at fair value through profit orloss.
Non-derivative financial liabilities are classified as financial liabilities measured at amortized cost.
When a financial asset or financial liability is recognized initially, the Group measures it at its fair value plus, in thecase of a financial asset or financial liability not at fair value through profit or loss, transaction costs that aredirectly attributable to the acquisition or issue of the financial asset or financial liability. Transaction costs related tothe acquisition or issue of a financial asset or financial liability at fair value through profit or loss are expensed asincurred. The subsequent measurement of a financial instrument and the recognition of associated gains and lossesis determined by the financial instrument classification.
After initial recognition, the Group measures financial assets, including derivatives that are assets, at their fairvalues, without any deduction for transaction costs it may incur on sale or other disposal, except for the followingfinancial assets: (a) held-to-maturity investments which are measured at amortized cost using the effective interestmethod; (b) loans and receivables which are measured at amortized cost using the effective interest method; (c)investments in equity instruments that do not have a quoted market price in an active market and whose fair valuecannot be reliably measured and derivatives that are linked to and must be settled by delivery of such unquotedequity instruments which are measured at cost. All financial assets except those measured at fair value throughprofit or loss are subject to review for impairment.
After initial recognition, the Group measures all financial liabilities at amortized cost using the effective interestmethod, except for financial liabilities at fair value through profit or loss (including derivatives that are liabilities)which are measured at their fair values (except for derivative liabilities that are linked to and must be settled bydelivery of unquoted equity instruments whose fair value cannot be reliably measured, which should be measured atcost).
Regular way purchases and sales of financial assets are accounted for at the settlement date.
82

TABLE OF CONTENTS
MFC BANCORP LTD. (FORMERLY MFC INDUSTRIAL LTD.)
NOTES TO CONSOLIDATED FINANCIAL STATEMENTS
DECEMBER 31, 2015
Note 1. Nature of Business and Summary of Significant Accounting Policies (continued) A gain or loss on a financial asset or financial liability classified as at fair value through profit or loss is recognizedin profit or loss for the period in which it arises. A gain or loss on an available-for-sale financial asset is recognizedin other comprehensive income, except for impairment losses, until the financial asset is derecognized, at whichtime the cumulative gain or loss previously recognized in accumulated other comprehensive income is recognizedin profit or loss for the period. For financial assets and financial liabilities carried at amortized cost, a gain or loss isrecognized in profit or loss when the financial asset or financial liability is derecognized or impaired, and throughthe amortization process.
Whenever quoted market prices are available, bid prices are used for the measurement of fair value of financialassets while ask prices are used for financial liabilities. When the market for a financial instrument is not active, theGroup establishes fair value by using a valuation technique. Valuation techniques include using recent arm’s lengthmarket transactions between knowledgeable, willing parties, if available; reference to the current fair value ofanother financial instrument that is substantially the same; discounted cash flow analysis; option pricing models andother valuation techniques commonly used by market participants to price the financial instrument.
The Group assesses at each balance sheet date whether there is any evidence that a financial asset or group offinancial assets is impaired. If such evidence exists, the Group will determine the amount of the impairment loss. Asignificant or prolonged decline in the fair value of an investment in an equity instrument below its cost is anobjective evidence of impairment. The Group considers a decline in excess of 25 percent generally as significant;and a decline in a quoted market price that persists for 15 months as prolonged.
(ii) Cash and Cash Equivalents
Cash and cash equivalents include cash on hand, cash at banks and highly liquid investments (e.g. money marketfunds) readily convertible to a known amount of cash and subject to an insignificant risk of change in value. Theyhave maturities of three months or less from the date of acquisition and are generally interest-bearing.
(iii) Restricted Cash
Restricted cash is cash and cash equivalents that are set aside for restricted use pursuant to the terms of a contract oran agreement.
(iv) Securities
Securities are classified as at fair value through profit or loss (i.e. held for trading), or short-term or long-termavailable-for-sale securities.
Publicly-traded securities (debt and equity) which are acquired principally for the purpose of selling in the nearterm are classified as held for trading. Securities held for trading are measured at their bid prices on the reportingdate.
Available-for-sale securities consist of publicly-traded securities and unlisted equity securities which are not heldfor trading and not held to maturity. Long-term available-for-sale securities are purchased with the intention to holduntil market conditions render alternative investments more attractive. Short-term available-for-sale securities areheld with the intention of management to sell within the current operating cycle but do not meet the definition oftrading securities.
When a decline in the fair value of an available-for-sale security has been recognized in other comprehensiveincome and there is objective evidence that the asset is impaired, the cumulative loss that had been recognized inother comprehensive income is reclassified from equity to profit or loss as a reclassification adjustment even thoughthe security has not been derecognized. Impairment losses recognized in profit or loss for an investment in an equityinstrument classified as available for sale shall not be reversed through profit or loss.
83

TABLE OF CONTENTS
MFC BANCORP LTD. (FORMERLY MFC INDUSTRIAL LTD.)
NOTES TO CONSOLIDATED FINANCIAL STATEMENTS
DECEMBER 31, 2015
Note 1. Nature of Business and Summary of Significant Accounting Policies (continued) If, in a subsequent period, the fair value of a debt instrument classified as available for sale increases and theincrease can be objectively related to an event occurring after the impairment loss was recognized in profit or loss,the impairment loss shall be reversed, with the amount of the reversal recognized in profit or loss.
Gains and losses on sales of securities are calculated on the average cost basis.
(v) Receivables
Receivables are classified as loans and receivables and are measured at amortized cost.
Receivables are net of an allowance for credit losses, if any. The Group performs ongoing credit evaluations of itscustomers and adjusts the allowance accounts for specific customer risks and credit factors. Receivables areconsidered past due on an individual basis based on the terms of the contracts.
(vi) Allowance for Credit Losses
The Group applies credit risk assessment and valuation methods to its trade and other receivables. The Group’sallowance for credit losses is maintained at an amount considered adequate to absorb estimated credit-related losses.Such allowance reflects management’s best estimate of the losses in the Group’s receivables and judgments abouteconomic conditions. Estimates and judgments could change in the near-term, and could result in a significantchange to a recognized allowance. Credit losses arise primarily from receivables but may also relate to other creditinstruments issued by or on behalf of the Group, such as guarantees and letters of credit. An allowance for creditlosses is increased by provisions which are charged to income and reduced by write-offs net of any recoveries.
Specific provisions are established on an individual receivable basis. A country risk provision may be made basedon exposures in less developed countries and on management’s overall assessment of the underlying economicconditions in those countries. Write-offs are generally recorded after all reasonable restructuring or collectionactivities have taken place and there is no realistic prospect of recovery.
If, in a subsequent period, the amount of an impairment loss decreases and the decrease is related objectively to anevent occurring after the impairment was recognized, the previously recognized impairment loss is reversed byadjusting the allowance account.
(vii) Derivative Financial Instruments
A derivative is a financial instrument or other contract with all three of the following characteristics: (a) its valuechanges in response to the change in a specified interest rate, financial instrument price, product price, foreignexchange rate, index of prices or rates, credit rating or credit index, or other variable; (b) it requires no initial netinvestment or an initial net investment that is smaller than would be required for other types of contracts that wouldbe expected to have a similar response to changes in market factors; and (c) it is settled at a future date. A derivativefinancial instrument is either exchange-traded or negotiated. A derivative is included in the consolidated statementof financial position and is measured at fair value. The recognition and measurement of a derivative financialinstrument is covered by IAS 39 ,FinancialInstruments:RecognitionandMeasurement(“IAS 39”) ,which doesnot apply to a contract that is entered into and continues to be held for the purpose of the receipt or delivery of anon-financial item in accordance with the Group’s expected purchase, sale or usage requirements.
Derivatives embedded in other financial instruments or other host contracts are accounted for as separatederivatives and recorded separately in the consolidated statement of financial position at fair value when their risksand characteristics are not closely related to those of the host contract. Changes in the fair value of those embeddedderivatives recognized separately in the consolidated statement of financial position are recognized in profit or lossas they arise.
84

TABLE OF CONTENTS
MFC BANCORP LTD. (FORMERLY MFC INDUSTRIAL LTD.)
NOTES TO CONSOLIDATED FINANCIAL STATEMENTS
DECEMBER 31, 2015
Note 1. Nature of Business and Summary of Significant Accounting Policies (continued) Where the Group has both the legal right and intent to settle derivative assets and liabilities simultaneously with thecounterparty, the net fair value of the derivative financial instruments is reported as an asset or liability, asappropriate.
Changes in the fair values of derivative financial instruments that do not qualify for hedge accounting arerecognized in profit or loss as they arise.
(viii) Inventories
Inventories principally consist of raw materials, work-in-progress, and finished goods. Inventories, other thanproducts acquired in commodity activities, are recorded at the lower of cost and net realizable value. Cost, whereappropriate, includes an allocation of manufacturing overheads incurred in bringing inventories to their presentlocation and condition and is assigned by using the first-in, first-out formula for inventories in the finance andsupply chain business and weighted average cost formula for other inventories. Net realizable value represents theestimated selling price less all estimated costs of completion and costs to be incurred in marketing, selling anddistribution. The amount of any write-down of inventories to net realizable value and all losses of inventories arerecognized as an expense in the period the write-down or loss occurs. The reversal of a write-down of inventoriesarising from an increase in net realizable value is recognized as a reduction in the amount of costs of sales andservices in the period in which the reversal occurs.
Products acquired in commodity activities with the purpose of selling in the near future and generating a profit fromfluctuations in price or broker-traders’ margin are measured at fair value less costs to sell.
(ix) Real Estate Held for Sale
Real estate held for sale is real estate intended for sale in the ordinary course of business or in the process ofconstruction or development for such sale.
Real estate held for sale is accounted for as inventories measured at the lower of cost (on a specific item basis) andnet realizable value. Net realizable value is estimated by reference to sale proceeds of similar properties sold in theordinary course of business less all estimated selling expenses around the reporting date, or by managementestimates based on prevailing market conditions. The amount of any write-down of properties to net realizablevalue is recognized as an expense in the period the write-down occurs. The reversal of a write-down arising from anincrease in net realizable value is recognized in the period in which the reversal occurs.
All of the Group’s real estate held for sale is located in Europe.
(x) Investment Property
Investment property is property that is held for generating rental income or for capital appreciation or both, ratherthan for: (a) use in the production or supply of goods or services or for administrative purposes; or (b) sale in theordinary course of business. The Group’s investment property comprises freehold land and buildings. Investmentproperty is initially recognized at cost including related transaction costs. After initial recognition, investmentproperty is measured at fair value, with changes in fair value recognized in profit or loss in the period in which theyarise.
The fair value of investment property is the price at which the property could be exchanged betweenknowledgeable, willing parties in an arm’s length transaction. Fair value specifically excludes an estimated priceinflated or deflated by special terms or circumstances, special considerations or concessions granted by anyoneassociated with the sale. The Group determines fair value without any deduction for transaction costs it may incuron sale or other disposal. Fair value of the Group’s investment property is based on valuations prepared annually byexternal evaluators in accordance with guidance issued by the International
85

TABLE OF CONTENTS
MFC BANCORP LTD. (FORMERLY MFC INDUSTRIAL LTD.)
NOTES TO CONSOLIDATED FINANCIAL STATEMENTS
DECEMBER 31, 2015
Note 1. Nature of Business and Summary of Significant Accounting Policies (continued) Valuation Standard Committee and reviewed by the Group, or these valuations are updated by management whenthere are no significant changes in the inputs to the valuation prepared by external evaluators in the preceding year,in accordance with guidance on fair value in IFRS 13.
All of the Group’s investment property is located in Europe.
(xi) Property, Plant and Equipment
Property, plant and equipment are carried at cost, net of accumulated depreciation and, if any, accumulatedimpairment losses. The initial cost of an item of property, plant and equipment comprises its purchase price orconstruction cost, any costs directly attributable to bringing the asset into operation, the initial estimate of anydecommissioning obligation, if any, and, for qualifying assets, borrowing costs. The purchase price or constructioncost is the aggregate amount paid and the fair value of any other consideration given to acquire the asset. Where anitem of property, plant and equipment or part of the item that was separately depreciated is replaced and it isprobable that future economic benefits associated with the replacement item will flow to the Group, the cost of thereplacement item is capitalized and the carrying amount of the replaced asset is derecognized. All other replacementexpenditures are recognized in profit or loss when incurred.
Inspection costs associated with major maintenance programs are capitalized and amortized over the period to thenext inspection. All other maintenance costs are expensed as incurred.
The depreciable amounts of the Group’s property, plant, and equipment (i.e. the costs of the assets less theirresidual values) are depreciated according to the following estimated lives and methods:
Lives Method
Buildings 20 years straight-lineProcessing plant and equipment 5 to 20 years straight-linePower plants 20 to 30 years straight-lineOffice equipment and other 3 to 10 years straight-line
Depreciation expense is included in either costs of sales and services or selling, general and administrative expense,whichever is appropriate.
The residual value and the useful life of an asset are reviewed at least at each financial year-end and, if expectationsdiffer from previous estimates, the changes, if any, are accounted for as a change in an accounting estimate inaccordance with IAS 8. The depreciation method applied to an asset is reviewed at least at each financial year-endand, if there has been a significant change in the expected pattern of consumption of the future economic benefitsembodied in the asset, the method is changed to reflect the changed pattern.
The carrying amount of an item of property, plant and equipment is derecognized upon disposal or when no futureeconomic benefits are expected to arise from the continued use of the asset. Any gain or loss arising onderecognition of the asset (calculated as the difference between the net disposal proceeds and the carrying amountof the item) is included in profit or loss in the period in which the item is derecognized.
(xii) Impairment of Non-financial Assets
The Group reviews the carrying amounts of its non-financial assets at each reporting date to determine whetherthere is any indication of impairment. If any such indication exists, then the asset’s recoverable amount is estimated.
The recoverable amount is the higher of an asset’s fair value less costs of disposal and value in use. Where anindividual asset does not generate separately identifiable cash flows, an impairment test is performed at the cash-generating unit (“CGU”) level. A CGU is the smallest identifiable group of assets that generates cash inflows thatare largely independent of the cash inflows from other assets or groups of assets. Where
86

TABLE OF CONTENTS
MFC BANCORP LTD. (FORMERLY MFC INDUSTRIAL LTD.)
NOTES TO CONSOLIDATED FINANCIAL STATEMENTS
DECEMBER 31, 2015
Note 1. Nature of Business and Summary of Significant Accounting Policies (continued) the carrying amount of an asset (or CGU) exceeds its recoverable amount, the asset (or CGU) is consideredimpaired and written down to its recoverable amount. In assessing value-in-use, the estimated future cash flows arediscounted to their present value using a discount rate that reflects current market assessments of the time value ofmoney and the risks specific to the asset. In determining fair value less costs of disposal, an appropriate valuationmodel is used. These calculations are corroborated by external valuation metrics or other available fair valueindicators wherever possible.
An assessment is made at the end of each reporting period whether there is an indication that previously recognizedimpairment losses no longer exist or have decreased. If such indication exists, an estimate of the asset’s (or CGU’s)recoverable amount is reviewed. A previously recognized impairment loss is reversed to the extent that the eventsor circumstances that triggered the original impairment have changed. The reversal is limited so that the carryingamount of the asset does not exceed its recoverable amount, nor exceed the carrying amount that would have beendetermined, net of depreciation, depletion and amortization, had no impairment loss been recognized for the asset inprior periods.
A reversal of an impairment loss for a CGU is allocated to the assets of the CGU pro-rata with the carrying amountsof those assets.
(xiii) Leases
A lease is classified as an operating lease if it does not transfer substantially all the risks and rewards incidental toownership of the leased asset. Operating lease payments are expensed in profit or loss over the term of the lease ona straight line basis.
(xiv) Defined Benefit Pension Plan
The Group has defined benefit pension plans.
The Group recognizes a net defined benefit liability, which represents the deficit of a defined benefit pension planand is calculated by deducting the fair value of plan assets from the present value of the defined benefit obligations,in the consolidated statement of financial position. When the Group has a surplus in a defined benefit plan, itmeasures the net defined benefit asset at the lower of (a) the surplus in the defined benefit plan; and (b) the assetceiling. The Group accounts not only for its legal obligation under the formal terms of a defined benefit plan, butalso for any constructive obligation that arises from the Group’s informal practices. An asset relating to one plan isnot offset against a liability relating to another plan.
The Group uses the projected unit credit method to determine the present value of its defined benefit obligationsand the related current service cost and, where applicable, past service cost. Actuarial assumptions are unbiased andmutually compatible and comprise demographic and financial assumptions.
Past service cost, which is the change in the present value of the defined benefit obligation for employee service inprior periods resulting from a plan amendment or curtailment, is recognized as an expense at the earlier of when theamendment/curtailment occurs or when the Group recognizes related restructuring or termination costs. The gain orloss on a settlement, which is the difference between the present value of the defined benefit obligation beingsettled and the settlement price, is recognized when the settlement occurs.
Current service cost and net interest on the net defined benefit liability (asset) are recognized in profit or loss.
Remeasurements of the net defined benefit liability (asset), which comprise actuarial gains and losses, the return onplan assets (excluding amounts included in net interest on the net defined benefit liability (asset)) and any change inthe effect of the asset ceiling (excluding amounts included in net interest on the net defined benefit liability (asset)),are recognized in other comprehensive income and are not reclassified to profit or loss in a subsequent period.
87

TABLE OF CONTENTS
MFC BANCORP LTD. (FORMERLY MFC INDUSTRIAL LTD.)
NOTES TO CONSOLIDATED FINANCIAL STATEMENTS
DECEMBER 31, 2015
Note 1. Nature of Business and Summary of Significant Accounting Policies (continued) (xv) Provisions and Contingencies
Provisions are recognized when the Group has a present obligation as a result of a past event, it is probable that anoutflow of resources embodying economic benefits will be required to settle the obligation and a reliable estimatecan be made of the amount of the obligation. Provisions are measured at management’s best estimate of theexpenditure required to settle the obligation at the reporting date. Where appropriate, the future cash flow estimatesare adjusted to reflect risks specific to the liability. If the effect of the time value of money is material, provisionsare determined by discounting the expected future cash flows at a pre-tax rate that reflects current marketassessments of the time value of money and the risks specific to the liability. Where discounting is used, theincrease in the provision due to the passage of time is recognized as interest expense.
Contingent liabilities are possible obligations whose existence will only be confirmed by future events not whollywithin the control of the Group. Contingent liabilities, other than those assumed in connection with businesscombinations which are measured at fair value at the acquisition date, are not recognized in the consolidatedfinancial statements but are disclosed unless the possibility of an outflow of economic resources is consideredremote. Legal costs in connection with a loss contingency are recognized in profit or loss when incurred.
The Group does not recognize a contingent or reimbursement asset unless it is virtually certain that the contingentor reimbursement asset will be received.
(xvi) Puttable Instrument Financial Liabilities
A puttable financial instrument represents a contractual obligation for the issuer to repurchase or redeem thatinstrument for cash or another financial asset on exercise of the put. Puttable instruments held by non-controllinginterests in a subsidiary are classified as a financial liability, which is recognized at an amount equal to the presentvalue of the amount that could be required to be paid to the counterparties. Changes in the measurement of theobligation due to the unwinding of the discount or changes in the amount that the acquirer could be required to payare recognized in profit or loss.
The financial liability is reclassified to equity when all the features of and conditions for classification as equity aremet. At such time, equity is measured at the carrying amount of the financial liability at the date of reclassification.
(xvii) Own Equity Instruments
The Group’s holdings of its own equity instruments, including common stock and preferred stock, are classified as“treasury stock” and deducted from shareholders’ equity at cost and in the determination of the number of equityshares outstanding. No gain or loss is recognized in profit or loss on the purchase, sale, re-issue or cancellation ofthe Group’s own equity instruments.
(xviii) Revenue Recognition
Revenues include proceeds from sales of supply chain products and services, real estate properties, medicalinstruments and supplies, fees from provisions of financial and other services, rental income on investmentproperty, interest and dividend income and net gains on securities.
Revenue from the sale of goods is recognized when: (a) the Group has transferred to the buyer the significant risksand rewards of ownership of the goods (which generally coincides with the time when the goods are delivered tobuyer and title has passed); (b) the Group retains neither continuing managerial involvement to the degree usuallyassociated with ownership nor effective control over the goods sold; (c) the amount of revenue can be measuredreliably; (d) it is probable that the economic benefits associated with the transaction will flow to the Group; and (e)the costs incurred or to be incurred in respect of the transaction can be measured reliably.
88

TABLE OF CONTENTS
MFC BANCORP LTD. (FORMERLY MFC INDUSTRIAL LTD.)
NOTES TO CONSOLIDATED FINANCIAL STATEMENTS
DECEMBER 31, 2015
Note 1. Nature of Business and Summary of Significant Accounting Policies (continued) Revenue from rendering of services is recognized when: (a) the amount of revenue can be measured reliably; (b) itis probable that the economic benefits associated with the transaction will flow to the Group; (c) the stage ofcompletion of the transaction at the reporting date can be measured reliably; and (d) the costs incurred for thetransaction and the costs to complete the transaction can be measured reliably.
Revenue is measured at the fair value of the consideration received or receivable and represents amounts receivablefor goods and services provided in the normal course of business, net of discounts, customs duties and sales taxes.When the Group charges shipping and handling fees to customers, such fees are included in sales revenue. Wherethe Group acts as an agent on behalf of a third party to procure or market goods, any associated fee income isrecognized but no purchase or sale is recorded.
For interest, royalty and dividend income, recognition is warranted when it is probable that economic benefits willflow to the Group and the amount of income can be measured reliably. Interest income is recognized on a timeproportion basis, taking into account the effective yield on the underlying asset. Royalty income is recognized on anaccrual basis, in accordance with the terms of the underlying agreement. Dividend income is recognized when theGroup’s right as a shareholder to receive payment has been established.
(xix) Costs of Sales and Services
Costs of sales and services include the costs of goods (supply chain products and services, real estate properties,medical instruments and supplies) sold. The costs of goods sold include both the direct cost of materials andindirect costs, freight charges, purchasing and receiving costs, inspection costs, distribution costs and a provisionfor warranty when applicable.
Costs of sales and services also include write-downs of inventories, net loss on securities, credit losses on loans andreceivables and fair value gain and loss on investment property, commodity inventories and derivative contracts.
The reversal of write-downs of inventories and allowance for credit losses reduces the costs of sales and services.
(xx) Employee Benefits
Wages, salaries, bonuses, social security contributions, paid annual leave and sick leave are accrued in the period inwhich the associated services are rendered by employees of the Group. The employee benefits are included in eithercosts of sales and services or selling, general and administrative expense, as applicable.
(xxi) Share-Based Compensation
The cost of equity-settled transactions with employees is measured by reference to the fair value at the date atwhich equity instruments are granted and is recognized as an expense over the vesting period, which ends on thedate on which the relevant employees become fully entitled to the award. Fair value is determined by using anappropriate valuation model. No expense is recognized for awards that do not ultimately vest. At each reportingdate before vesting, the cumulative expense is calculated, representing the extent to which the vesting period hasexpired and management’s best estimate of the achievement or otherwise of non-market conditions and the numberof equity instruments that will ultimately vest. The movement in cumulative expense since the previous reportingdate is recognized in profit or loss, with a corresponding amount in equity.
When the terms of an equity-settled award are modified or a new award is designated as replacing a cancelled orsettled award, the cost based on the original award terms continues to be recognized over the original vestingperiod. In addition, an expense is recognized over the remainder of the new vesting period for the incremental fairvalue of any modification, based on the difference between the fair value of the original award and the fair value ofthe modified award, both as measured on the date of the modification.
89

- except where the deferred income tax liability arises on goodwill that is not tax deductible or the initialrecognition of an asset or liability in a transaction that is not a business combination and, at the time ofthe transaction, affects neither the accounting profit nor taxable profit or loss.
- in respect of taxable temporary differences associated with investments in subsidiaries and branches,except where the Group is able to control the timing of the reversal of the temporary differences and it isprobable that the temporary differences will not reverse in the foreseeable future.
- except where the deferred income tax asset relating to the deductible temporary difference arises from theinitial recognition of an asset or liability in a transaction that is not a business combination and, at thetime of the transaction, affects neither the accounting profit nor taxable profit or loss.
- in respect of deductible temporary differences associated with investments in subsidiaries and branches,deferred tax assets are recognized only to the extent that it is probable that the temporary differences willreverse in the foreseeable future.
TABLE OF CONTENTS
MFC BANCORP LTD. (FORMERLY MFC INDUSTRIAL LTD.)
NOTES TO CONSOLIDATED FINANCIAL STATEMENTS
DECEMBER 31, 2015
Note 1. Nature of Business and Summary of Significant Accounting Policies (continued) No reduction is recognized if this difference is negative. When an equity-settled award is cancelled other than byforfeiture when the vesting conditions are not satisfied, it is treated as if it had vested on the date of cancellation andany cost not yet recognized in profit or loss for the award is expensed immediately.
Share-based compensation expenses are classified as selling, general and administrative expenses. When stockoptions are exercised, the exercise price proceeds together with the amount initially recorded in contributed surplusare credited to capital stock.
(xxii) Finance Costs
Finance costs comprise interest expense on borrowings, accretion of the discount on provisions, decommissioningobligations and other liabilities and charges and fees relating to factoring transactions.
Finance costs directly attributable to the acquisition, construction or production of qualifying assets, which areassets that necessarily take a substantial period of time to get ready for their intended use, are added to the cost ofthose assets, until such time as the assets are substantially ready for their intended use. All other finance costs arerecognized in profit or loss in the period in which they are incurred.
Capital stock and debt are recorded at the proceeds received, net of direct issue costs (transaction costs). Thetransaction costs attributable to the debt are amortized over the debt term using the effective interest method.
(xxiii) Income Taxes
Income tax expense (recovery) comprises current income tax expense (recovery) and deferred income tax expense(recovery) and includes all domestic and foreign taxes which are based on taxable profits. The current income taxprovision is based on the taxable profits for the period. Taxable profit differs from income before income taxes asreported in the statements of operations because it excludes items of income or expense that are taxable ordeductible in other periods and items that are never taxable or deductible. The Group’s liability for current incometax is calculated using tax rates that have been enacted or substantively enacted by the reporting date. Deferredincome tax is provided, using the liability method, on all temporary differences at the reporting date between the taxbases of assets and liabilities and their carrying amounts for financial reporting purposes.
Deferred income tax liabilities are recognized for all taxable temporary differences:
Deferred income tax assets are recognized for all deductible temporary differences, carry-forward of unused taxcredits and unused tax losses, to the extent that it is probable that taxable profit will be available against which thedeductible temporary differences and the carry-forward of unused tax credits and unused tax losses can be utilized:
90

TABLE OF CONTENTS
MFC BANCORP LTD. (FORMERLY MFC INDUSTRIAL LTD.)
NOTES TO CONSOLIDATED FINANCIAL STATEMENTS
DECEMBER 31, 2015
Note 1. Nature of Business and Summary of Significant Accounting Policies (continued) On the reporting date, management reviews the Group’s deferred income tax assets to determine whether it isprobable that the benefits associated with these assets will be realized. The Group also reassesses unrecognizeddeferred income tax assets. This review and assessment involve evaluating both positive and negative evidence. TheGroup recognizes a previously unrecognized deferred income tax asset to the extent that it has become probable thatfuture taxable profit will allow the deferred income tax asset to be recovered.
Deferred income tax assets and liabilities are measured at the tax rates that are expected to apply in the year whenthe asset is realized or the liability is settled, based on tax rates and tax laws that have been enacted or substantivelyenacted at the reporting date. Tax relating to items recognized in other comprehensive income or equity isrecognized in other comprehensive income or equity and not in profit or loss.
Deferred income tax assets and liabilities are offset when there is a legally enforceable right to set off currentincome tax assets against current income tax liabilities, and when they relate to income tax levied by the sametaxation authority and the Group intends to settle its current income tax assets and liabilities on a net basis.
Withholding taxes (which include withholding taxes payable by a subsidiary on distributions to the Group) aretreated as income taxes when they have the characteristics of an income tax. This is considered to be the case whenthey are imposed under government authority and the amount payable is calculated by reference to revenue derived.
The Group includes interest charges and penalties on current income tax liabilities as a component of interestexpense.
(xxiv) Earnings Per Share
Basic earnings per share is determined by dividing net income attributable to ordinary equity holders of the parentcompany by the weighted average number of common shares outstanding during the period, net of treasury stock.
Diluted earnings per share is determined using the same method as basic earnings per share except that the weightedaverage number of common shares outstanding includes the effect of dilutive potential ordinary shares. For thepurpose of calculating diluted earnings per share, the Group assumes the exercise of its dilutive options with theassumed proceeds from these instruments regarded as having been received from the issue of common shares at theaverage market price of common shares during the period. The difference between the number of common sharesissued and the number of common shares that would have been issued at the average market price of commonshares during the period is treated as an issue of common shares for no consideration and added to the weightedaverage number of common shares outstanding. The amount of the dilution is the average market price of commonshares during the period minus the issue price and the issue price includes the fair value of services to be supplied tothe Group in the future under the share-based payment arrangement. Potential ordinary shares are treated as dilutivewhen, and only when, their conversion to ordinary shares would decrease earnings per share or increase loss pershare from continuing operations.
When share-based payments are granted during the period, the shares issuable are weighted to reflect the portion ofthe period during which the payments are outstanding. The shares issuable are also weighted to reflect forfeituresoccurring during the period. When stock options are exercised during the period, shares issuable are weighted toreflect the portion of the period prior to the exercise date and actual shares issued are included in the weightedaverage number of shares outstanding from the exercise date.
(xxv) Business Combinations
The Group accounts for each business combination by applying the acquisition method. Pursuant to the acquisitionmethod, the Group, when a business combination occurs and is identified as the acquirer, determines the acquisitiondate (on which the Group legally transfers the consideration, acquires the assets
91

TABLE OF CONTENTS
MFC BANCORP LTD. (FORMERLY MFC INDUSTRIAL LTD.)
NOTES TO CONSOLIDATED FINANCIAL STATEMENTS
DECEMBER 31, 2015
Note 1. Nature of Business and Summary of Significant Accounting Policies (continued) and assumes the liabilities of the acquiree), recognizes and measures the identifiable assets acquired, the liabilitiesassumed and any non-controlling interest in the acquiree, and recognizes and measures goodwill or a gain from abargain purchase (i.e. negative goodwill). The identifiable assets acquired and the liabilities assumed are measuredat their acquisition-date fair values. A non-controlling interest is measured at either its fair value or its proportionateshare in the recognized amounts of the subsidiary’s identifiable net assets, on a transaction-by-transaction basis.
The consideration transferred in a business combination is measured at fair value, which is calculated as the sum ofthe acquisition-date fair values of the assets transferred by the Group, the liabilities incurred by the Group to formerowners of the acquiree and the equity interests issued by the Group.
In a business combination achieved in stages, the Group remeasures its previously held equity interest in theacquiree at its acquisition-date fair value and recognizes the resulting gain or loss, if any, in profit or loss.
If the initial accounting for a business combination is incomplete by the end of the reporting period in which thecombination occurs, the Group reports in its financial statements provisional amounts for the items for which theaccounting is incomplete. During the measurement period, the Group retrospectively adjusts the provisionalamounts recognized at the acquisition date to reflect new information obtained about facts and circumstances thatexisted as of the acquisition date and, if known, would have affected the measurement of the amounts recognized asof that date. During the measurement period, the Group also recognizes additional assets or liabilities if newinformation is obtained about facts and circumstances that existed as of the acquisition date and, if known, wouldhave resulted in the recognition of those assets and liabilities as of that date. The measurement period ends as soonas the Group receives the information it was seeking about facts and circumstances that existed as of the acquisitiondate or learns that more information is not obtainable. However, the measurement period does not exceed one yearfrom the acquisition date.
Acquisition-related costs are costs the Group incurs to effect a business combination. Those costs include finder’sfees; advisory, legal, accounting, valuation and other professional or consulting fees; general administrative costs,including the costs of maintaining an internal acquisitions department; and costs of registering and issuing debt andequity securities. The Group accounts for acquisition-related costs as expenses in the periods in which the costs areincurred and the services are received, except for the costs to issue debt or equity securities (see SignificantAccounting Policy Item (xxii) above).
(xxvi) Exploration and Evaluation Assets
Exploration and evaluation assets comprise hydrocarbon probable reserves and hydrocarbon unproved lands in theconsolidated statements of financial position.
Pre-license costs are recognized in profit or loss as incurred.
Exploration and evaluation costs, including the costs of acquiring undeveloped land and drilling costs are initiallycapitalized until the drilling of the well is complete and the results have been evaluated in order to determine thetechnical feasibility and commercial viability of the asset. Technical feasibility and commercial viability areconsidered to be determinable when proved and/or probable reserves are determined to exist. When proved and/orprobable reserves are found, the drilling costs and the costs of associated hydrocarbon unproved lands arereclassified to interests in resource properties; or from hydrocarbon unproved lands to hydrocarbon probablereserves. The cost of hydrocarbon undeveloped land that expires or any impairment recognized during a period ischarged to profit or loss.
(xxvii) Interests in Resource Properties
The Group’s interests in resource properties include a royalty interest in an iron ore mine and hydrocarbondevelopment and production assets.
92

TABLE OF CONTENTS
MFC BANCORP LTD. (FORMERLY MFC INDUSTRIAL LTD.)
NOTES TO CONSOLIDATED FINANCIAL STATEMENTS
DECEMBER 31, 2015
Note 1. Nature of Business and Summary of Significant Accounting Policies (continued) (a) Recognition and measurement
Interests in resource properties are initially measured at cost and subsequently carried at cost less accumulateddepletion and, if any, accumulated impairment losses.
The cost of an interest in resource property includes the initial purchase price and directly attributable expendituresto find, develop, construct and complete the asset. This cost includes reclassifications from exploration andevaluation assets, installation or completion of infrastructure facilities such as platforms, pipelines and the drillingof development wells, including unsuccessful development or delineation wells. Any costs directly attributable tobringing the asset to the location and condition necessary to operate as intended by management and result in anidentifiable future benefit are also capitalized. These costs include an estimate of decommissioning obligations and,for qualifying assets, capitalized borrowing costs.
(b) Subsequent costs
Costs incurred subsequent to the determination of technical feasibility and commercial viability and the costs ofreplacing parts of property are capitalized only when they increase the future economic benefits embodied in thespecific asset to which they relate. Such capitalized costs generally represent costs incurred in developing provedreserves and bringing in or enhancing production from such reserves, and are accumulated on a field orgeotechnical area basis. All other expenditures are recognized in profit or loss as incurred. The costs of periodicservicing of the properties are recognized in operating expenses as incurred.
The carrying amount of any replaced or sold component is derecognized.
(c) Depletion
The carrying amount of an interest in a resource property is depleted using the unit of production method byreference to the ratio of production in the period to the related reserves.
For interests in hydrocarbon properties, depletion is calculated based on proved producing reserves, taking intoaccount estimated future development costs necessary to bring those reserves into production and the estimatedsalvage values of the assets at the end of their useful lives. Future development costs are estimated taking intoaccount the level of development required to continue to produce the reserves. Reserves for hydrocarbon propertiesare estimated annually by independent qualified reserve evaluators, and represent the estimated quantities of naturalgas, natural gas liquids and crude oil which geological, geophysical and engineering data demonstrate with aspecified degree of certainty to be recoverable in future years from known reservoirs and which are consideredcommercially producible. For depletion purposes, relative volumes of petroleum and natural gas production andreserves are converted at the energy equivalent conversion rate of six thousand cubic feet of natural gas to onebarrel of crude oil.
For the royalty interest in an iron ore and extracting facilities, depletion is calculated based on proved and probablereserves. The estimate of the reserves of iron ore is reviewed whenever significant new information about thereserve is available, or at least at each financial year-end.
(xxviii) Decommissioning Obligations
The Group provides for decommissioning, restoration and similar liabilities (collectively, decommissioningobligations, or asset retirement obligations) on its resource properties, facilities, production platforms, pipelines andother facilities based on estimates established by current legislation and industry practices. The decommissioningobligation is initially measured at fair value and capitalized to interests in resource properties or property, plant andequipment as an asset retirement cost. The liability is estimated by discounting expected future cash flows requiredto settle the liability using a pre-tax rate that reflects current market assessments of the time value of money and therisks specific to the liability. The estimated future asset retirement costs may be adjusted for risks such as project,physical, regulatory and timing. The estimates are reviewed periodically. Changes in the provision as a result ofchanges in the estimated future costs or discount rates are added to or deducted from the asset retirement cost in theperiod of the change.
93

TABLE OF CONTENTS
MFC BANCORP LTD. (FORMERLY MFC INDUSTRIAL LTD.)
NOTES TO CONSOLIDATED FINANCIAL STATEMENTS
DECEMBER 31, 2015
Note 1. Nature of Business and Summary of Significant Accounting Policies (continued) The liability accretes for the effect of time value of money until it is settled. The capitalized asset retirement cost isamortized through depreciation, depletion and amortization over the life of the related asset. Actual asset retirementexpenditures are recorded against the obligation when incurred. Any difference between the accrued liability andthe actual expenditures incurred is recorded as a gain or loss in the settlement period.
C. Critical Judgments in Applying Accounting Policies
In the process of applying the Group’s accounting policies, management makes various judgments, apart from thoseinvolving estimations under Note 1D below, that can significantly affect the amounts it recognizes in theconsolidated financial statements. The following are the critical judgments that management has made in theprocess of applying the Group’s accounting policies and that have the most significant effects on the amountsrecognized in the consolidated financial statements:
(i) Identification of Cash-generating Units
The Group’s assets are aggregated into CGUs, for the purpose of assessing and calculating impairment, based ontheir ability to generate largely independent cash flows. The determination of CGUs requires judgment in definingthe smallest identifiable group of assets that generate cash inflows that are largely independent of the cash inflowsfrom other assets or groups of assets. CGUs have been determined based on similar geological structure, sharedinfrastructure, geographical proximity, product type and similar exposures to market risks. In the event facts andcircumstances surrounding factors used to determine the Group’s CGUs change, the Group will re-determine thegroupings of CGUs.
(ii) Assets Held for Sale
The Group applies judgment to determine whether an asset (or disposal group) is available for immediate sale in itspresent condition and that its sale is highly probable and therefore should be classified as held for sale at the balancesheet date. In order to assess whether it is highly probable that the sale can be completed within one year or theextension period in certain circumstances, management reviews the business and economic factors, both macro andmicro, which include the industry trends and capital markets, and the progress towards a sale transaction. It is alsoopen to all forms of sales, including exchanges of non-current assets for other non-current assets when the exchangewill have commercial substance in accordance with IAS 16, Property,PlantandEquipment.
(iii) Consolidation
Judgment is required when assessing whether the Group controls and therefore consolidates an entity, particularlyan entity with complex share capital, management/decision-making or financing structures. Judgment is required todetermine whether the Group has decision-making power over the key relevant activities of an investee, whether theGroup has exposure or rights to variable returns from its involvement with the investee and whether the Group hasthe ability to use that power to affect its returns.
(iv) Purchase Price Allocations
Purchase prices related to business combinations and asset acquisitions are allocated to the underlying acquiredassets and liabilities based on their estimated fair value at the time of acquisition. The determination of fair valuerequires the Group to make assumptions, estimates and judgments regarding future events. The allocation process isinherently subjective and impacts the amounts assigned to individual identifiable assets and liabilities, including thefair value of long-lived assets and the amount of goodwill or bargain purchase calculated. As a result, the purchaseprice allocation impacts the Group’s reported assets and liabilities and future net earnings due to the impact onfuture depreciation, depletion and amortization and impairment tests.
94

TABLE OF CONTENTS
MFC BANCORP LTD. (FORMERLY MFC INDUSTRIAL LTD.)
NOTES TO CONSOLIDATED FINANCIAL STATEMENTS
DECEMBER 31, 2015
Note 1. Nature of Business and Summary of Significant Accounting Policies (continued) (v) Impairment of Receivables
A receivable is considered impaired when there is objective evidence that there has been a deterioration of creditquality subsequent to the initial recognition of the receivable to the extent the Group no longer has reasonableassurance as to the timely collection of the full amount of principal and interest. The Group assesses receivables forobjective evidence of impairment individually for receivables that are individually significant, and collectively forreceivables that are not individually significant. Management exercises judgment as to the timing of designating areceivable as impaired, the amount of the allowance required and the amount that will be recovered by taking intoconsideration collateral that is directly linked to the receivable.
D. Major Sources of Estimation Uncertainty
The timely preparation of the consolidated financial statements requires management to make judgments, estimatesand assumptions that affect the application of accounting policies and the reported amount of assets, liabilities,income and expenses.
The major assumptions about the future and other major sources of estimation uncertainty at the end of thereporting period that have a significant risk of resulting in a material adjustment to the carrying amounts of assetsand liabilities within the next financial year are discussed below. These items require management’s most difficult,subjective or complex estimates. Actual results may differ materially from these estimates.
(i) Impairment of Assets Held for Sale
The Group had hydrocarbon assets, iron ore interests and an amount due from former subsidiaries classified as heldfor sale aggregating $136,156 at December 31, 2015. The Group measures a non-current asset (or disposal group)classified as held for sale at the lower of its carrying amount and fair value less costs to sell and recognizes animpairment loss for any initial or subsequent write-down of the asset (or disposal group) to fair value less costs tosell, to the extent that it has not been recognized. Fair value is defined as the price that would be received to sell anasset in an orderly transaction between market participants at the measurement date, which generally does notinclude a transaction which takes place under duress or when the seller is experiencing financial difficulty in aforced sale. Management relies on external valuation reports using discounted cash flows to measure the fair valuesof the hydrocarbon interests which are classified as assets held for sale. Management then reviews the reports andcompares to market and industry data so as to ensure that the trends and fluctuations are consistent.
(ii) Impairment of Other Non-financial Assets
The Group had property, plant and equipment aggregating $95,745 at December 31, 2015, consisting mainly of twopower plants and a ferrosilicon production facility. Impairment of the Group’s non-financial assets is evaluated atthe CGU level. In testing for impairment, the recoverable amounts of the Company’s CGUs are determined as thehigher of their values in use and fair values less costs of disposal. In the absence of quoted market prices, therecoverable amount is based on estimates of future production rates, future product selling prices and costs,discount rates and other relevant assumptions. Increases in future costs and/or decreases in estimates of futureproduction rates and product selling prices may result in a write-down of the Group’s property, plant andequipment.
(iii) Taxation
The Group is subject to tax in a number of jurisdictions and judgment is required in determining the worldwideprovision for income taxes. Deferred income taxes are recognized for temporary differences using the liabilitymethod, with deferred income tax liabilities generally being provided for in full (except for taxable temporarydifferences associated with investments in subsidiaries, branches and associates and interests in joint arrangementswhere the Group is able to control the timing of the reversal of the
95

TABLE OF CONTENTS
MFC BANCORP LTD. (FORMERLY MFC INDUSTRIAL LTD.)
NOTES TO CONSOLIDATED FINANCIAL STATEMENTS
DECEMBER 31, 2015
Note 1. Nature of Business and Summary of Significant Accounting Policies (continued) temporary differences and it is probable that the temporary differences will not reverse in the foreseeable future)and deferred income tax assets being recognized to the extent that it is probable that future taxable profits will beavailable against which the temporary differences can be utilized.
The operations and organization structures of the Group are complex, and related tax interpretations, regulationsand legislation are continually changing. As a result, there are usually some tax matters in question that result inuncertain tax positions. The Group only recognizes the income tax benefit of an uncertain tax position when it isprobable that the ultimate determination of the tax treatment of the position will result in that benefit being realized.
The Group companies’ income tax filings are subject to audit by taxation authorities in numerous jurisdictions.There are audits in progress and items under review, some of which may increase the Group’s income tax liabilities.In addition, the companies have filed appeals and have disputed certain issues. While the results of these itemscannot be ascertained at this time, the Group believes that the Group has an adequate provision for income taxesbased on available information.
The Group recognized deferred income tax assets of $20,641 at December 31, 2015. In assessing the realizabilityof deferred income tax assets, management considers whether it is probable that some portion or all of the deferredincome tax assets will be realized. The ultimate realization of deferred income tax assets is dependent upon thegeneration of future taxable income during the periods in which temporary differences become deductible or beforetax loss and tax credit carry-forwards expire. Management considers the future reversals of existing taxabletemporary differences, projected future taxable income, taxable income in prior years and tax planning strategies inmaking this assessment. Unrecognized deferred income tax assets are reassessed at the end of each reporting period.
The Group provides for future income tax liabilities in respect of uncertain tax positions where additional incometax may become payable in future periods and such provisions are based on management’s assessment ofexposures. The Group did not recognize the full deferred tax liability on taxable temporary differences associatedwith investments in subsidiaries and branches where the Group is able to control the timing of the reversal of thetemporary differences and it is probable that the temporary differences will not reverse in the foreseeable future.The Group may change its investment decision in its normal course of business, thus resulting in additional incometax liabilities.
(iv) ContingenciesPursuant to IAS 37, Provisions, Contingent Liabilities and Contingent Assets, the Group does not recognize acontingent liability. By their nature, contingencies will only be resolved when one or more future events occur orfail to occur. The assessment of contingencies inherently involves the exercise of significant judgment andestimates of the outcome of future events. If it becomes probable that an outflow of future economic benefits will berequired for an item previously accounted for as a contingent liability, an accrual or a provision is recognized in theconsolidated financial statements of the period in which the change in probability occurs.
(v) Allowance for Credit Losses The Group applies credit risk assessment and valuation methods to its trade and other receivables (see Note 1B(vi)).Subsequent to December 31, 2015, a customer of the Group filed for insolvency. A customer insolvency is anadjusting subsequent event under IAS 10, EventsaftertheReportingPeriod(“IAS 10”), and, as a result, the Grouphad to determine an allowance for credit losses against the receivables due from the customer and its affiliates, theprovisions under certain guarantees which the Group had made, and the potential recoveries as at December 31,2015. The recognition and measurement of these provisions was a complex process, involving a significant degreeof judgment and a high level of estimation uncertainty. The input factors include the Group’s legal rights andobligations under all the contracts and collateral which include inventories, mortgages and other credit enhancementinstruments. After the recognition of the impairment losses, the Group had trade receivables of $92,595 due fromthe customer and its affiliates as at December 31, 2015.
96

Note 2. Capital Disclosure on the Group’s Objectives, Policies and Processes for Managing Its Capital
TABLE OF CONTENTS
MFC BANCORP LTD. (FORMERLY MFC INDUSTRIAL LTD.)
NOTES TO CONSOLIDATED FINANCIAL STATEMENTS
DECEMBER 31, 2015
Note 1. Nature of Business and Summary of Significant Accounting Policies (continued) E. Accounting Changes
Future accounting changesIFRS 9, Financial Instruments, (“IFRS 9”) issued in July 2014 is the IASB’s replacement of IAS 39. IFRS 9includes requirements for recognition and measurement, impairment, derecognition and general hedge accounting.The version of IFRS 9 issued in 2014 supersedes all previous versions and is mandatorily effective for annualreporting periods beginning on or after January 1, 2018 with earlier application permitted. Management has decidednot to early apply IFRS 9 and is currently assessing the impacts of IFRS 9 on the Group’s consolidated financialstatements.
IFRS 15, RevenuefromContracts withCustomers (“IFRS 15”), specifies how and when an entity will recognizerevenue as well as requiring such entities to provide users of financial statements with more informative, relevantdisclosures. The standard provides a single, principles based five-step model to be applied to all contracts withcustomers. IFRS 15 was issued in May 2014. In September 2015, the IASB deferred the effective date of IFRS 15to annual reporting periods beginning on or after January 1, 2018, with earlier application permitted. Managementis currently assessing the impacts of IFRS 15 on the Group’s consolidated financial statements.
IFRS 16, Leases(“IFRS 16”), issued in January 2016, introduces a single on-balance sheet model of accounting forleases by lessees under a single model that eliminates the distinction between operating and finance leases. Lessoraccounting remains largely unchanged and the distinction between operating and finance leases is retained. IFRS 16supersedes IAS 17, Leases, and related interpretations and is effective for annual reporting periods beginning on orafter January 1, 2019, with earlier application permitted if IFRS 15 has also been applied. Management is currentlyassessing the impacts of IFRS 16 on the Group’s consolidated financial statements.
Amendments to IFRS 10, Consolidated Financial Statements, and IAS 28, Investments in Associates and JointVentures,were issued in September 2014 and are to be applied prospectively. The amendments require that uponloss of control of a subsidiary during its transfer to an associate or joint venture, full gain recognition on the transferis appropriate only if the subsidiary meets the definition of a business in IFRS 3, BusinessCombinations(“IFRS3”). Otherwise, gain recognition is appropriate only to the extent of third party ownership of the associate or jointventure. In December 2015, the IASB postponed the effective date of these amendments indefinitely, pending theoutcome of its research project on the equity method of accounting, though earlier application is permitted.Adoption of these amendments is not expected to have significant impact on the Group’s consolidated financialstatements.
Amendments to IFRS 11, Joint Arrangements,were issued in May 2014 and are effective for annual reportingperiods beginning on or after January 1, 2016, to be applied prospectively with earlier application permitted. Theamendments clarify that an acquisition of a joint interest in a joint operation that is a business should be accountedfor and disclosed as a business combination in accordance with IFRS 3. Adoption of these amendments is notexpected to have a significant impact on the Group’s consolidated financial statements.
StructureThe Group’s objectives when managing capital are: (i) to safeguard the entity’s ability to continue as a goingconcern so that it can continue to provide returns for shareholders and benefits for other stakeholders, (ii) to providean adequate return to shareholders by pricing products and services commensurately with the level of risk, and (iii)to maintain a flexible capital structure which optimizes the cost of capital at acceptable risk.
The Group sets the amount of capital in proportion to risk. The Group manages the capital structure and makesadjustments to it in light of changes in economic conditions and the risk characteristics of the underlying assets. Inorder to maintain or adjust the capital structure, the Group may adjust the amount of dividends paid to shareholders,return capital to shareholders, issue new shares, or sell assets to reduce debt.
97

Note 2. Capital Disclosure on the Group’s Objectives, Policies and Processes for Managing Its Capital
TABLE OF CONTENTS
MFC BANCORP LTD. (FORMERLY MFC INDUSTRIAL LTD.)
NOTES TO CONSOLIDATED FINANCIAL STATEMENTS
DECEMBER 31, 2015
Structure (continued)
Consistent with others in the finance and supply chain industry, the Group monitors capital on the basis of the debt-to-adjusted capital ratio and long-term debt-to-equity ratio. The debt-to-adjusted capital ratio is calculated as netdebt divided by adjusted capital. Net debt is calculated as total debt less cash and cash equivalents. Adjusted capitalcomprises all components of shareholders’ equity other than amounts in accumulated other comprehensive incomerelating to cash flow hedges, and includes some forms of subordinated debt. The long-term debt-to-equity ratio iscalculated as long-term debt divided by shareholders’ equity. The debt does not include short-term bankborrowings.
As at December 31: 2015 2014 Total debt $ 259,038 $ 363,255Less: cash and cash equivalents (197,519 (344,891Net debt (net cash and cash equivalents) 61,519 18,364Shareholders’ equity 367,192 777,717Debt-to-adjusted capital ratio 0.17 0.02
As at December 31: 2015 2014 Long-term debt $ 174,333 $ 297,157Shareholders’ equity 367,192 777,717Long-term debt-to-equity ratio 0.47 0.38
During 2015, the Group’s strategy, which was unchanged from 2014, was to maintain the debt-to-adjusted capitalratio and the long-term debt-to-equity ratio at a manageable level. The increase in the ratios in 2015 reflects thereduction in shareholders’ equity. The terms and conditions of the Group’s debt agreements include, and future debtagreements may include, covenants and restrictions of a customary nature for such agreements.
Note 3. Acquisitions of Consolidated Entities
Year 2015There were no business combinations in 2015.
Year 2014
F.J. Elsner & Co. GmbH (“Elsner”)In March 2014, MFC Bancorp, through its Austrian subsidiary, acquired all of the outstanding shares in Elsner.Elsner is an Austrian-based finance and supply chain company focused on steel and related products. Elsner offers afull range of steel products, including slabs, booms, billets, hot rolled steel plates, hot and cold rolled coils andsheets, reinforcing bars, galvanized material, pipes, tubers and merchant bars.
The purchase price consisted of a nominal consideration (including certain contingent payments between the partiesover a 10-year period based on current inventories and account receivables, existing legal actions and utilization ofcertain tax loss carry-forwards). There were no goodwill or intangible assets acquired. This acquisition was notconsidered a material business combination. The amount of acquisition-related costs was nominal which wasincluded in selling, general and administrative expenses in profit or loss.
FESIL AS (“FESIL”)In April 2014, the Company acquired a 100% interest in FESIL. Headquartered in Trondheim, Norway, FESIL isone of the leading producers of ferrosilicon, an essential alloy in the production of steel, stainless steel, and castiron. FESIL’s melting plant is located in Mo i Rana, Norway and produces a range of ferrosilicon productsincluding granulated and refined qualities (high and semi-high purity), which makes up the bulk of its production.
98
) )

TABLE OF CONTENTS
MFC BANCORP LTD. (FORMERLY MFC INDUSTRIAL LTD.)
NOTES TO CONSOLIDATED FINANCIAL STATEMENTS
DECEMBER 31, 2015
Note 3. Acquisitions of Consolidated Entities (continued) The base purchase price of $93,480 was based on the net tangible asset value as of September 30, 2013 and wassubsequently adjusted to reflect the fair value of certain assets and the profit and loss over the period to finalclosing. There is a two-year royalty based on tiered ferrosilicon production at the Mo i Rana facility, expected toequal approximately 2.9% of ferrosilicon revenue per annum at full production. Management recognized thiscontingent consideration as a liability which was measured at its fair value on the acquisition date. There werenominal intangible assets and there was no goodwill acquired. This acquisition was not considered a materialbusiness combination. The amount of acquisition-related costs was $615 which was included in selling, general andadministrative expenses in profit or loss.
Year 2013
There were no business combinations in 2013.
Note 4. Assets Classified as Held for Sale and Discontinued Operations
In March 2015, the Board of Directors of the Company approved a plan to rationalize certain assets of MFC EnergyCorporation, a subsidiary of the Company, with a portion of the net proceeds to be redeployed to the Company’sother businesses and the balance to be returned to shareholders.
In the third quarter of 2015, the Board of Directors of the Company approved a plan to sell all of the Company’sresource properties. Pursuant to the resolution, an active program to locate buyers and complete the plan has beeninitiated. Management is of opinion that the disposal groups are actively marketed for sale at a price that isreasonable in relation to their current fair value and the sales are expected to be completed within one year. As such,the assets of the disposal groups were classified as assets held for sale as of September 30, 2015. In compliancewith IFRS 5, Non-currentAssetsHeldforSaleandDiscontinuedOperations,the operations and cash flows of thedisposal groups are accounted for as discontinued operations.
The Company’s discontinued operations comprised the hydrocarbon properties and iron ore interests, both of whichwere included in the Company’s former global supply chain segment.
The following summarizes the results of the discontinued operations for the years ended December 31:
2015 2015 2014 2014 2013 2013
Hydro-carbon
properties Iron ore interests
Hydro-carbon properties
Iron ore interests
Hydro-carbon properties
Iron ore interests
Revenues $ 71,792 $ 1,625 $ 133,088 $ 13,588 $ 101,488 $ 26,727Costs and expenses (273,979 (215,608 (146,934 (3,486 (108,590 (6,446(Loss) income before income
taxes (202,187 (213,983 (13,846 10,102 (7,102 20,281Income tax (expense)
recovery (45,773 45,844 4,853 (4,574 339 (8,110Net (loss) income from
discontinued operations (247,960 (168,139 (8,993 5,528 (6,763 12,171
Loss on disposal of assets — — — — — —Income tax expense (11,987 — — — — —
Net loss on disposal of assets (11,987 — — — — —
Total (loss) income fromdiscontinued operations $ (259,947 $ (168,139 $ (8,993 $ 5,528 $ (6,763 $ 12,171
99
) ) ) ) ) )
) ) ) )
) ) )
) ) ) )
)
)
) ) ) )

TABLE OF CONTENTS
MFC BANCORP LTD. (FORMERLY MFC INDUSTRIAL LTD.)
NOTES TO CONSOLIDATED FINANCIAL STATEMENTS
DECEMBER 31, 2015
Note 4. Assets Classified as Held for Sale and Discontinued Operations (continued) All the intercompany transactions with continuing operations have been eliminated. Costs and expenses includedthe impairment losses on tangible assets and resource properties discussed below.
The following non-cash impairment losses (before income taxes) were recognized and included in costs andexpenses in the above table in the years ended December 31:
2015 2014 2013
Hydrocarbon properties $ 196,549 $ 33,200 $ 6,463Interests in iron ore mines 215,600 — —
Gross impairment $ 412,149 $ 33,200 $ 6,463
Hydrocarbon properties
In September 2015, the Group’s realized pricing of natural gas, natural gas liquids and oil had declined sinceDecember 31, 2014. As such, as at September 30, 2015, the Group performed an impairment assessment on itshydrocarbon properties utilizing post-tax discount rates between 10% and 13% and recognized a non-cashimpairment loss of $143,609. As a result of the impairment charge, a previously recorded deferred tax asset of $50,918 had to be written off. This non-cash impairment comprised $46,715 allocated to interests in resourceproperties, $16,108 to probable reserves, $33,114 to property, plant and equipment and $47,672 to the propertiespreviously included in assets held for sale. In the fourth quarter of 2015, the Group recognized an additionalimpairment loss of $52,940.
On December 30, 2015, the Group sold a 95% economic interest in certain hydrocarbon assets and the relatedliabilities to a third party for nominal and contingent consideration (see Note 23). Based on the terms of thetransaction, the Group continued to be registered holder of the entities holding these assets and liabilities but lostpower to direct the business activities of these subsidiaries. As such, effective December 30, 2015 the Group ceasedconsolidating these entities (the former subsidiaries). No gain or loss was recognized upon the disposition.However, a deferred tax expense of $11,987 was recognized resulting from the write-off of previously recognizeddeferred tax assets. Furthermore, as a result of the deconsolidation of the former subsidiaries, a net receivable of $11,600 due from the former subsidiaries was recognized as at December 31, 2015 as the amount was no longereliminated within the Group and was included in assets held for sale. The remaining economic interest has beenrecognized at a nominal value as at December 31, 2015.
In December 2014, the Group’s realized pricing of natural gas, natural gas liquids and oil declined 20%, 32% and35%, respectively. As such, as at December 31, 2014, the Group performed an annual impairment assessment on itshydrocarbon properties utilizing post-tax discount rates between 8.5% and 9.0% and recognized an impairment lossof $33,200 before a deferred income tax recovery of $8,372. This impairment is comprised of $18,780 allocated tointerests in resource properties, $7,191 to probable reserves, $3,707 to unproved lands and $3,522 to assets held forsale.
As at December 31, 2013, the Group performed an annual impairment assessment on its hydrocarbon propertiesbased on a pre-tax discount rate of 10% and recognized an impairment loss of $6,463 before an income taxrecovery of $1,660.
Interests in iron ore mines
In the first quarter of 2015, the operator of the iron ore mine in Canada in which the Group has a royalty interestcommenced proceedings under the Companies’ Creditors Arrangement Act (Canada) (the “CCAA”) with respect toits Canadian operations and publicly disclosed that its assets comprising the mine will be included in any salesprocess.
In the third quarter of 2015, the long-term price curve of iron ore continued to deteriorate. Management of theGroup reviewed the underlying legal documents and performed a sensitivity analysis on the expected future cashflows from its royalty interest. Consideration was given to reasonably possible scenarios,
100

* The interest was written down to a nominal amount.
** The Group ceased to classify its investment property as held for sale on September 30, 2015.
TABLE OF CONTENTS
MFC BANCORP LTD. (FORMERLY MFC INDUSTRIAL LTD.)
NOTES TO CONSOLIDATED FINANCIAL STATEMENTS
DECEMBER 31, 2015
Note 4. Assets Classified as Held for Sale and Discontinued Operations (continued) including the Company exercising its step-in rights and re-taking the mine. The primary factors which impact therecoverable amount, among others, are the number of years of production, iron ore pricing and/or production costs.Each possible scenario was assigned a probability. Based on the cash flows projections, management determinedthat a non-cash impairment loss of $218,203 was required, before a deferred income tax recovery of $54,305, as atSeptember 30, 2015, to write down the carrying amount of its interest to a nominal amount. In the fourth quarter of2015, the Group reversed the previously recognized impairment loss by $30,000 and recognized a related deferredtax liability of $7,800. The reversal of the previously recognized impairment loss reflected the improvements in theexpected future cash flows under possible scenarios, using a pre-tax discount rate of 9% and taking intoconsideration events that occurred subsequent to the third quarter of 2015.
The Group also reviewed the cash flow projections for the iron ore development project located in the UnitedStates. Given the reduced viability of this project, high capital cost to complete requisite studies and management’sbusiness focus on trade finance banking activities, management determined that an impairment loss of $27,397 wasrequired, before a deferred income tax recovery of $nil, as at September 30, 2015, to write down the carryingamount of its interest to a nominal amount.
There were no impairment charges on the Group’s interests in iron ore mines during the years ended December 31,2014 and 2013.
The assets held for sale comprised the following items as of December 31, 2015 and 2014, respectively:
2015 2014Assets held for sale:Hydrocarbon properties $ 94,556 $ 116,729Amount due from former subsidiaries, net 11,600 —Royalty interest in an iron ore mine 30,000 —Interest in an iron ore development project — —Investment property — 35,378
136,156 152,107Liabilities (including decommissioning obligations) relating to assets held for sale:Hydrocarbon properties (79,779 (17,802Royalty interest in an iron ore mine, deferred income tax liability (7,800 —
Total liabilities (87,579 (17,802Net assets held for sale $ 48,577 $ 134,305
Represented by:Hydrocarbon properties $ 14,777 $ 98,927Royalty interest in an iron ore mine 22,200 —Amount due from former subsidiaries, net 11,600 —Investment property — 35,378
$ 48,577 $ 134,305
101
***
) ))) )
**

TABLE OF CONTENTS
MFC BANCORP LTD. (FORMERLY MFC INDUSTRIAL LTD.)
NOTES TO CONSOLIDATED FINANCIAL STATEMENTS
DECEMBER 31, 2015
Note 4. Assets Classified as Held for Sale and Discontinued Operations (continued) The major assets and liabilities of the hydrocarbon properties disposal group as at December 31, 2015 comprisedthe following:
Current assets $ 8,583Non-current assets held for sale 85,973
Total assets 94,556Bank debt (59,252Short-term borrowings (1,859Decommissioning obligations (17,923Other liabilities (745
Net assets held for sale, owing to the Group entities $ 14,777
As at December 31, 2015, there was a net cumulative translation adjustment loss of $20,772 arising from thetranslation of the financial position of the disposal groups into the Canadian dollar reporting currency, which hasbeen included in accumulated other comprehensive income under equity. The cumulative translation adjustmentloss is subject to further changes resulting from the fluctuation of the underlying functional currencies of thedisposal groups against the Canadian dollar and will be reclassified to profit or loss upon the disposal of thesubsidiaries and/or operations.
If the disposal groups had been re-presented in the statement of financial position as of December 31, 2014, thefollowing non-current assets and associated decommissioning obligations would have been reclassified andincluded in assets held for sale and liabilities relating to assets held for sale:
Property, plant and equipment $ 43,652Interests in resource properties 403,813Hydrocarbon probable reserves 50,644Hydrocarbon unproved lands 27,560Decommissioning obligations (149,199
Note 5. Business Segment Information
The Group is primarily in the finance and supply chain business, which includes marketing activities, captivesupply assets, structured solutions, financial services and proprietary investing activities.
In reporting to management, the Group’s operating results are categorized into the following operating segments:finance and supply chain and all other segments.
Previously, the Group presented its finance and supply chain business in two reportable segments, global supplychain and trade finance and services. However, as the Group has advanced its long-term strategy, the dividebetween these two segments has become less clear while the revenue and cost synergies have become moreapparent. Therefore, as a result of the integrated nature of these operations, the Group has combined these twoformer segments into the finance and supply chain segment.
Basis of Presentation
In reporting segments, certain of the Group’s business lines have been aggregated where they have similareconomic characteristics and are similar in each of the following areas: (i) the nature of the products and services;(ii) the methods of distribution, and (iii) the types or classes of customers/clients for the products and services.
The Group provides supply chain services, logistics and other trade and structured finance services to producers andconsumers of the Group’s products. The trade finance and services business also provides supply chain structuredsolutions. These activities provide cost effective and efficient transportation, as well
102
))))
)

TABLE OF CONTENTS
MFC BANCORP LTD. (FORMERLY MFC INDUSTRIAL LTD.)
NOTES TO CONSOLIDATED FINANCIAL STATEMENTS
DECEMBER 31, 2015
Note 5. Business Segment Information (continued) as payment terms accommodating working capital requirements of the Group’s customers and partners. TheGroup’s operations often utilize strategies and structures to facilitate the working capital needs of the Group’sclients. The Group supplies various products, including metals, ceramics, minerals, various steel products and ferro-alloys and wood products. The Group also seeks investments in many industries, emphasizing those businessopportunities where the perceived intrinsic value is not properly recognized. The Group uses its financial andmanagement expertise to add or unlock value within a relatively short time period.
The all other segment includes the Group’s corporate and operating segments whose quantitative amounts do notexceed 10% of any of the Group’s (a) reported revenue, (b) net income or (c) total assets. The Group’s otheroperating segments primarily include business activities in medical equipment, instruments, supplies and services.
The accounting policies of the operating segments are the same as those described in the summary of significantaccounting policies. The chief operating decision maker evaluates performance on the basis of income or loss fromoperations before income taxes and does not consider acquisition accounting adjustments in assessing theperformance of the Group’s reporting segments. The segment information presented below is prepared according tothe following methodologies: (a) revenues and expenses directly associated with each segment are included indetermining pre-tax earnings; (b) intersegment sales and transfers are accounted for as if the sales or transfers wereto third parties at current market prices; (c) certain selling, general and administrative expenses paid by corporate,particularly incentive compensation and share-based compensation, are not allocated to reporting segments; (d) allintercompany investments, receivables and payables are eliminated in the determination of each segment’s assetsand liabilities; and (e) deferred income tax assets and liabilities are not allocated.
The segment information for prior years presented has been restated to reflect the combination of the two formerreportable segments of global supply chain and trade finance and services into the finance and supply chainsegment. All data and discussions on revenues, expenses, income and loss in this Note 5 relate to the Group’scontinuing operations only and do not include discontinued operations.
Segment Operating ResultsYear ended December 31, 2015
Finance and supply chain All other
Elimination with
discontinued operations Total
Revenues from external customers $ 1,544,481 $ 35,221 $ — $ 1,579,702Intersegment sale 1,705 175 — 1,880Interest expense 15,535 11 — 15,546Loss before income taxes (53,811 (449 (1,157 (55,417
Year ended December 31, 2014
(Restated – Note 1A)
Finance and supply chain All other
Elimination with
discontinued operations Total
Revenues from external customers $ 1,256,520 $ 29,804 $ — $ 1,286,324Intersegment sale 242 507 — 749Interest expense 11,690 45 — 11,735Income (loss) before income taxes 19,264 (10,873 (2,077 6,314
103
) ) ) )
) )

TABLE OF CONTENTS
MFC BANCORP LTD. (FORMERLY MFC INDUSTRIAL LTD.)
NOTES TO CONSOLIDATED FINANCIAL STATEMENTS
DECEMBER 31, 2015
Note 5. Business Segment Information (continued)
Year ended December 31, 2013(Restated – Note 1A)
Finance and supply chain All other
Elimination with
discontinued operations Total
Revenues from external customers $ 597,518 $ 23,567 $ — $ 621,085Intersegment sale 219 354 — 573Interest expense 9,069 75 — 9,144Income (loss) before income taxes 15,341 (9,851 (2,331 3,159
As at December 31, 2015
Finance and supply chain All other Total
Segment assets $ 907,337 $ 70,014 $ 977,351
As at December 31, 2014Finance and
supply chain All other Total
Segment assets $ 1,638,921 $ 53,298 $ 1,692,219
As at December 31, 2015
Finance and supply chain All other Total
Segment liabilities $ 594,842 $ 13,309 $ 608,151
As at December 31, 2014
Finance and supply chain All other Total
Segment liabilities $ 896,932 $ 16,354 $ 913,286
Geographic Information
Due to the highly integrated nature of international products and services, finance and supply chain activities andmarkets, and a significant portion of the Group’s activities requiring cross-border coordination in order to serve theGroup’s customers and clients, the methodology for allocating the Group’s profitability to geographic regions isdependent on estimates and management judgment.
Geographic results are generally determined as follows:
Segment Basis for attributing revenuesFinance and supply chain Locations of external customers or the reporting units, whichever
is appropriateAll other Locations of the reporting units
104
) )

TABLE OF CONTENTS
MFC BANCORP LTD. (FORMERLY MFC INDUSTRIAL LTD.)
NOTES TO CONSOLIDATED FINANCIAL STATEMENTS
DECEMBER 31, 2015
Note 5. Business Segment Information (continued) Due to the nature of cross-border business, the Group presents its geographic information by geographic regions,instead of by countries. The following table presents revenues from external customers attributed to MFCBancorp’s country of domicile (i.e. Canada) and all foreign geographic regions from which the Group derivesrevenues:
Years ended December 31: 2015 2014 2013 (Restated – Note 1A)
Canada $ 39,196 $ 31,578 $ 2,443Africa 26,376 24,633 5,139Americas 297,830 277,130 166,403Asia 176,766 81,877 22,411Europe 1,038,496 871,106 424,689Other 1,038 — —
$ 1,579,702 $ 1,286,324 $ 621,085
Except for the geographic concentrations as indicated in the above table and one trading customer in the finance andsupply chain segment representing approximately 8%, 12% and 2% of the Group’s total revenues in 2015, 2014 and2013, respectively, there were no other revenue concentrations in 2015, 2014 and 2013.
The following table presents non-current assets other than financial instruments, post-employment benefit assets,deferred tax assets and other non-current assets by geographic area based upon the location of the assets.
As at December 31: 2015 2014 Canada $ 27,742 $ 549,949Africa 33,695 28,890Americas 4,651 3,654Asia 7,770 451Europe 73,572 21,902
$ 147,430 $ 604,846
The non-current assets located in Canada as of December 31, 2014 comprised primarily the Group’s interests inresource properties and hydrocarbon properties which were classified as assets held for sale during 2015 (see Note4).
Note 6. Trade Receivables
As at December 31: 2015 2014 Trade receivables, gross amount (including $nil (2014: $1,227) due from
related parties) $ 172,439 $ 196,813Less: Allowance for credit losses (21,210 (9,255Trade receivables, net amount $ 151,229 $ 187,558
Trade receivables primarily arise from finance and supply chain activities.
The Group has a specially structured non-recourse factoring arrangement with a bank for the Group’s tradereceivables (see Note 14). As at December 31, 2015, trade receivables amounting to $1,226 were used as securityagainst bank debt (see Note 15).
105
) )

(1) The recoverable amount of impaired receivables is covered by credit insurance, bank guarantees and/or other credit enhancementsand, therefore, management of the Group believes this entire net amount to be collectible in the ordinary course of business.
TABLE OF CONTENTS
MFC BANCORP LTD. (FORMERLY MFC INDUSTRIAL LTD.)
NOTES TO CONSOLIDATED FINANCIAL STATEMENTS
DECEMBER 31, 2015
Note 6. Trade Receivables (continued) As at December 31, 2015, trade receivables of $13,918 (2014: $76,301) were past due but not impaired. The aginganalyses of these trade receivables as at December 31, 2015 and 2014 are as follows:
Past-due 2015 2014 Below 30 days $ 6,847 $ 45,608Between 31 and 60 days 3,191 8,905Between 61 and 90 days 1,936 4,725Between 91 and 365 days 1,923 14,866Over 365 days 21 2,197
$ 13,918 $ 76,301
As at December 31, 2015, trade receivables of $37,454 (2014: $37,969) were impaired and an allowance for creditlosses of $21,210 (2014: $9,255) has been provided. Not all past-due account balances are uncollectible as most ofthe accounts are covered by credit insurance or other collection procedures. Credit risk from trade accountreceivables is mitigated since they are credit insured, covered by letters of credit, bank guarantees and/or othercredit enhancements (see Note 26). The aging analyses of impaired trade receivables as at December 31, 2015 and2014 are as follows:
Past-due 2015 2014 Below 30 days $ 13,765 $ 238Between 31 and 60 days 8,656 238Between 61 and 90 days 625 468Between 91 and 365 days 2,792 9,101Over 365 days 11,616 27,924
37,454 37,969Allowance for credit losses 21,210 9,255Expected recoverable amount of impaired receivables $ 16,244 $ 28,714
A substantial amount of the impaired trade receivables that were past-due for over one year as at December 31,2014 were related to one customer and settled during the year ended December 31, 2015.
The movements in the allowance for credit losses during 2015 and 2014 are as follows:
2015 2014Balance, beginning of the year $ 9,255 $ 1,091Additions 13,381 3,702Reversals (124 (1,463Write-offs (95 (91Other (2,946 6,859Reclassification to assets held for sale (114 —Currency translation adjustment 1,853 (843Balance, end of the year $ 21,210 $ 9,255
Subsequent to December 31, 2015, a customer of the Group filed for insolvency. This is an adjusting subsequentevent under IAS 10 and, as a result, the Group had to determine an allowance for credit losses against the Group’sreceivables due from this customer and its affiliates. At December 31, 2015, the Group
106
(1)
) )) )))
)

TABLE OF CONTENTS
MFC BANCORP LTD. (FORMERLY MFC INDUSTRIAL LTD.)
NOTES TO CONSOLIDATED FINANCIAL STATEMENTS
DECEMBER 31, 2015
Note 6. Trade Receivables (continued) had gross trade receivables of $103,300 due from this customer and its affiliates as well as other contracts withsuch customer. The Group conducted an extensive assessment of impairment losses on these trade receivables. Thisassessment involved a number of judgments and a high level of estimation uncertainty. The factors considered inthese estimates include the Group’s legal rights and obligations under all related contracts and collateral, whichinclude inventories, mortgages, insurance of collateral and other credit enhancement instruments. The Grouprecognized an allowance for credit losses of $10,705 in connection with this customer and its affiliates as atDecember 31, 2015. After the recognition of such impairment losses, the Group had trade receivables of $92,595due from this customer and its affiliates as at December 31, 2015. See Note 23 for further information.
Note 7. Other Receivables
As at December 31: 2015 2014 Investment income $ 9 $ 13Government environmental emission refund 4,913 1,979Royalty income 100 600Receivables from insurance company/supplier 4,333 12,036Indemnification assets — 3,361Suppliers with debit balance 972 3,916Other 4,400 4,501
$ 14,727 $ 26,406
Other receivables primarily arise in the normal course of business and are expected to be collected within one yearfrom the reporting date.
Note 8. Inventories
As at December 31: 2015 2014 Raw materials $ 21,852 $ 27,414Work-in-progress 5,275 4,000Finished goods 88,556 43,120Commodity inventories 120,323 150,213Goods-in-transit 7,899 20,683Other 1,440 1,181
$ 245,345 $ 246,611Presented on the consolidated statements of financial position as follows:
Inventories contracted at fixed prices or hedged $ 141,344 $ 127,407Inventories - other 104,001 119,204
$ 245,345 $ 246,611
As at December 31, 2015, inventories with a carrying amount of $54,635 were pledged as security for liabilities.
As at December 31, 2015, inventories aggregating $141,344 (2014: $127,407) had been contracted to be sold atfixed prices or hedged, of which $13,697 (2014: $17,079) and $127,647 (2014: $110,328), respectively, wereinitially financed by suppliers and short-term bank borrowings.
107

Note 10. Investment Property
Note 11. Property, Plant and Equipment
* Net of deconsolidation of subsidiaries disposed of.
TABLE OF CONTENTS
MFC BANCORP LTD. (FORMERLY MFC INDUSTRIAL LTD.)
NOTES TO CONSOLIDATED FINANCIAL STATEMENTS
DECEMBER 31, 2015
Note 9. Deposits, Prepaid and Other
As at December 31: 2015 2014 Prepayments and deposits for inventories $ 19,368 $ 5,317Other 2,074 3,668
$ 21,442 $ 8,985
Investment property was classified as non-current assets prior to September 30, 2013. In September 2013,management committed to a plan to sell its investment property. As a result, the Group’s investment property wasclassified as held for sale and included in current assets as at December 31, 2014 and 2013. In September 2015,management ceased to classify its investment property as held for sale and, thus, included it in non-current assets asof December 31, 2015.
Changes in investment property in non-current assets: 2015 2014 Balance, beginning of year $ — $ —Additions — —Disposals — —Change in fair value during the year — —Reclassification from assets held for sale 37,677 —Currency translation adjustments 196 —Balance, end of year $ 37,873 $ —
The amounts recognized in profit or loss in relation to investment property during 2015, 2014 and 2013 are asfollows:
2015 2014 2013
Rental income $ 1,474 $ 1,468 $ 1,421Direct operating expenses (including repairs and maintenance) arising from
investment property that generated rental income during the year 279 243 343
The following changes in property, plant and equipment were recorded in 2015:
Costs Opening balance Additions Reclassification
Reclassified to assets
held for sale
Currency translation adjustments
Ending balance
Land and buildings $ 3,890 $ 18 $ — $ — $ 1,982 $ 5,890Refinery and power plants 104,779 3,961 — (48,134 6,730 67,336Processing plant and
equipment 21,204 3,836 6,769 — 2,739 34,548Office equipment 8,584 983 (274 (1,592 814 8,515
$ 138,457 $ 8,798 $ 6,495 $ (49,726 $ 12,265 $ 116,289
108
)
) ))

Note 11. Property, Plant and Equipment (continued)
* Net of deconsolidation of subsidiaries disposed of.
Note 12. Accrued Pension Assets (Obligations)
TABLE OF CONTENTS
MFC BANCORP LTD. (FORMERLY MFC INDUSTRIAL LTD.)
NOTES TO CONSOLIDATED FINANCIAL STATEMENTS
DECEMBER 31, 2015
Accumulated depreciation Opening balance Additions Reclassification
Reclassified to assets
held for sale
Currency translation adjustments
Ending balance
Land and buildings $ 436 $ 425 $ — $ — $ 739 $ 1,600Refinery and power plants 9,065 1,218 — (4,636 1,213 6,860Processing plant and equipment 2,979 3,936 225 — 1,252 8,392Office equipment 3,148 871 (225 (736 634 3,692
15,628 $ 6,450 $ — $ (5,372 $ 3,838 20,544
Carrying amount $ 122,829 $ 95,745
The following changes in property, plant and equipment were recorded in 2014:
Costs Opening balance Additions Disposals
Business combination* Reclassification
Reclassified to assets
held for sale
Decom- missioning obligations
Currency translation adjustments
Ending balance
Land and buildings $ 3,018 $ — $ — $ 166 $ 1,047 $ — $ — $ (341 $ 3,890Refinery and power
plants 100,832 26,138 — — — (22,913 (1,253 1,975 104,779Processing plant and
equipment 4,455 1,330 (972 21,407 — — — (5,016 21,204Office equipment 4,437 4,329 (225 1,007 (1,047 — — 83 8,584
$ 112,742 $ 31,797 $ (1,197 $ 22,580 $ — $ (22,913 $ (1,253 $ (3,299 $ 138,457
Accumulated depreciationOpening balance Additions Disposals
Business combination*
Reclassified to assets
held for sale
Currency translation adjustments
Ending balance
Land and buildings $ 337 $ 283 $ — $ — $ — $ (184 $ 436Refinery and power
plants 7,041 4,564 — — (2,658 118 9,065Processing plant and
equipment 2,726 3,217 (941 (1,254 — (769 2,979Office equipment 2,135 1,212 (24 — — (175 3,148
12,239 $ 9,276 $ (965 $ (1,254 $ (2,658 $ (1,010 15,628Carrying amount $ 100,503 $ 122,829
As at December 31, 2015, land and buildings with net carrying amount of $2,352 were used as security againstbank debt (see Note 15).
During 2015, 2014 and 2013, $3,948, $23,415 and $400, respectively, of expenditures were recognized in thecarrying amount of items of property, plant and equipment in the course of their construction.
The Group currently has post-retirement defined benefit plans for its employees in Austria, Norway, Germany andMexico. In addition there is a small jubilee pay plan for an Austrian entity, which is based on collective agreements.
The majority of the Group’s post-retirement defined benefit pension plans are funded. These are pensionarrangements for managers in Germany and Austria and a closed pension plan for former employees in Norway.
109
)
) ))
)
) )
) )) )) ) ) )
)
)
) ) )) )) ) ) )

Note 12. Accrued Pension Assets (Obligations) (continued)
TABLE OF CONTENTS
MFC BANCORP LTD. (FORMERLY MFC INDUSTRIAL LTD.)
NOTES TO CONSOLIDATED FINANCIAL STATEMENTS
DECEMBER 31, 2015
The major defined benefit pension plan in Norway is closed to new employees and provides retirement and deathbenefits to former employees and is administered by management. The plan provides no lump sum option and theindexation of benefits is limited to surplus spending of the insurance contract.
The defined benefit pension plans in Germany and Austria are based on single pension promises to four formermanagers and one active manager and are partly funded. These pension plans provide retirement, disability anddeath benefits. The related plan assets are held separately by an independent insurance company.
In Austria and Mexico termination indemnity plans are provided to employees. These plans are required to beprovided by companies based on local labor laws. They are unfunded and closed to new employees in Austria.These termination indemnity plans provide lump sum benefits in the case of retirement, disability and death.
The Group had a defined benefit pension plan for its employees in Canada which was classified as assets held forsale which was subsequently disposed of during 2015.
Changes in the defined benefit obligations for the years ended December 31:2015 2014
Balance, beginning of year $ 27,088 $ 11,345Assumed upon acquisition — 18,124Reclassified to assets held for sale (10,063 —Net current service cost 213 527Employee contributions — 74Obligation interest cost 389 492Actuarial gains from changes in demographic assumptions and
experience (618 (1,011Actuarial (gains) losses from changes in financial assumptions (455 2,943Benefits paid (1,272 (4,621Currency translation adjustments 617 (785
Balance, end of year $ 15,899 $ 27,088
Defined benefit obligations for plans that are wholly unfunded $ 3,702 $ 3,363Defined benefit obligations for plans that are wholly or partly
funded $ 12,197 $ 23,725
Significant actuarial assumptions used in calculating the defined benefitobligations as at December 31: 2015 2014
Discount rate 2.1%–6.3% 1.8%–6.0%Rate of salary increases 1.0%–5.5% 1.0%–5.5%Consumer price index 0%–1.5% 1.0%–5.5%
110
)
) ))) )
)

Note 12. Accrued Pension Assets (Obligations) (continued)
TABLE OF CONTENTS
MFC BANCORP LTD. (FORMERLY MFC INDUSTRIAL LTD.)
NOTES TO CONSOLIDATED FINANCIAL STATEMENTS
DECEMBER 31, 2015
Changes in the fair value of plan assets for the years ended December 31:2015 2014
Balance, beginning of year $ 24,121 $ 12,684Reclassified to assets held for sale (11,425 —Fair value of plan assets upon acquisition — 13,560(Loss) return on plan assets (241 1,447Administration costs — (66Employer contributions 448 775Employee contributions — 74Benefits paid (1,272 (4,621Currency translation adjustments 207 268
Balance, end of year $ 11,838 $ 24,121
Interest income on plan assets $ 289 $ 567Actuarial (losses) gains (530 880
(Loss) return on plan assets $ (241 $ 1,447
Reconciliation to the amounts recognized in the consolidated statement of financial position as at December 31:
2015 2014
Fair value of plan assets $ 11,838 $ 24,121Defined benefit obligations (15,899 (27,088
Plan deficit and net liability $ (4,061 $ (2,967
Recognized in the consolidated statement of financial position as follows:
Accrued pension assets $ — $ 1,362Accrued pension obligations (4,061 (4,329
$ (4,061 $ (2,967
Sensitivity analysis
A sensitivity analysis for each significant actuarial assumption as at December 31, 2015, showing how the definedbenefit obligations would have been affected by changes in the relevant actuarial assumption that were reasonablypossible at the date, is as follows:
Discount Rate Sensitivity Analysis 2015Effect of an increase of 1%
Defined benefit obligations, end of year $ 14,605Effect of a decrease of 1%
Defined benefit obligations, end of year $ 17,518
Salary Increase Sensitivity Analysis 2015Effect of an increase of 1%
Defined benefit obligations, end of year $ 15,940Effect of a decrease of 1%
Defined benefit obligations, end of year $ 15,303
111
)
))
) )
))
) )
) )
) )
) )

Note 12. Accrued Pension Assets (Obligations) (continued)
TABLE OF CONTENTS
MFC BANCORP LTD. (FORMERLY MFC INDUSTRIAL LTD.)
NOTES TO CONSOLIDATED FINANCIAL STATEMENTS
DECEMBER 31, 2015
The defined benefit obligation sensitivity figures were calculated using the same methods and assumptions as theDecember 31, 2015 defined benefit obligation figures, with the only assumption change being the 1% change indiscount rate or salary scale, respectively, as indicated. There was no change from the previous period in themethods and assumptions used in preparing the sensitivity analyses.
As is the case with the actuarial valuations, formal materiality guidelines were not employed in the derivation of thesensitivity analyses. The defined benefits pension obligations were valued using assumptions adopted for eachrelevant contingency and membership data that were reviewed for consistency with previous data as well as overallreasonableness. To the extent that the assumptions and methods adopted for the valuations were appropriate for thepurpose of the valuations; nothing was omitted as being immaterial. Nevertheless, emerging experience differingfrom the assumptions will result in gains or losses that will be revealed in future valuations and could affect thevalidity of the sensitivity analyses.
Plan assets
Plan assets are generally held and administered by independent financial services companies. The assets do notinclude the Group’s own financial instruments or any property occupied by, or other assets used by, the Group.
Expected contributions and benefit payments
The expected contributions in 2016 from the employers and employees are $422 and $nil, respectively. Theemployer contributions represent the Group’s minimum required contribution under pension legislation.
As at December 31, 2015, the Group’s expected benefit payments are as follows:
Years ending December 31:2016 $ 1,2572017 1,3172018 1,3192019 1,3002020 1,292Thereafter 9,414
Total $ 15,899
Note 13. Deferred Income Tax Assets and Liabilities
The tax effect of temporary differences and tax loss carry-forwards that give rise to significant components of theGroup’s deferred income tax assets and liabilities are as follows:
As at December 31: 2015 2014 Non-capital tax loss carry-forwards $ 11,848 $ 20,661Interests in resource properties — (3,529Other assets 11,469 10,700Other liabilities (16,387 (11,852
$ 6,930 $ 15,980
Presented on the consolidated statement of financial position as follows:Deferred income tax assets $ 20,641 $ 27,832Deferred income tax liabilities (13,711 (11,852
Net $ 6,930 $ 15,980
112
)
) )
) )

TABLE OF CONTENTS
MFC BANCORP LTD. (FORMERLY MFC INDUSTRIAL LTD.)
NOTES TO CONSOLIDATED FINANCIAL STATEMENTS
DECEMBER 31, 2015
Note 13. Deferred Income Tax Assets and Liabilities (continued) At December 31, 2015, the Group had estimated accumulated non-capital losses which expire in the followingcountries as follows. Management is of the opinion that not all of these non-capital losses are probable to be utilizedin the future.
CountryGross
amount
Amount for which no deferred income
tax asset is recognized
Expiration dates
Canada $ 10,556 $ — 2033-2035Germany 14,535 14,485 IndefiniteAustria 96,536 67,003 IndefiniteSlovakia 751 751 2016-2017Uganda 113,297 113,297 IndefiniteUnited Sates of America 9,594 9,594 IndefiniteRomania 2,018 2,018 2021Luxembourg 12,254 12,254 2016
The utilization of the deferred tax assets is dependent on future taxable profits in excess of the profits arising fromthe reversal of existing taxable temporary differences and the Group companies have suffered losses in either thecurrent or preceding period(s) in the tax jurisdictions to which the deferred tax assets relate.
At December 31, 2015, MFC Bancorp had an aggregate amount of $62,478 of temporary differences associatedwith its investments in subsidiaries and branches, for which deferred income tax liabilities have not been recognizedbecause the Group is in a position to control the timing of the reversal of such temporary differences and it isprobable that such differences will not reverse in the foreseeable future.
In November 2012 and February 2016, the Company received from the Canada Revenue Agency (“CRA”) taxnotices of reassessment relating to taxation years ended December 31, 2006 to April 19, 2013. The reassessmentsdeny a deduction in computing income, attribute income earned by predecessors to the Company and deny theapplication of losses and deductions by predecessors in computing their taxable income, and deny the application ofcredits in the computation of income taxes payable. The Company has filed notices of objection to theNovember 2012 notices of reassessment. The period for filing notices of objection to the February 2016 notices ofreassessment has not yet expired. Notices of objection will be filed to the February 2016 notices of reassessment indue course. The Company, among other things, reviewed the reassessments, the material facts related thereto andthe subject transactions and consulted its advisors. Based on such review, management determined that theprobability of the CRA’s reassessments being successful in court was remote. Accordingly, the Company has notrecorded a liability in these consolidated financial statements in connection with the reassessments. There can be noassurance that the Company will be successful in defending its positions. If the CRA is successful in respect ofeither reassessment, then the Company will be required to pay a material amount of income tax plus applicableinterest. There continues to be tax litigation in progress involving the CRA and other companies which may have abearing on the Company’s own income tax position with the CRA. The Company will continue to assess its positionas such litigation progresses.
The Group companies’ income tax filings are also subject to audit by taxation authorities in numerous jurisdictions.There are audits in progress and items under review, some of which may increase the Group’s income tax liability.In the event that management’s estimate of the future resolution of these matters changes, the Group will recognizethe effects of the changes in its consolidated financial statements in the appropriate period relative to when suchchanges occur.
113

TABLE OF CONTENTS
MFC BANCORP LTD. (FORMERLY MFC INDUSTRIAL LTD.)
NOTES TO CONSOLIDATED FINANCIAL STATEMENTS
DECEMBER 31, 2015
Note 14. Short-term Bank BorrowingsShort-term bank borrowings are repayable within a year from the borrowing date. They are used to finance theGroup’s day-to-day finance and supply chain business.
As at December 31: 2015 2014 Credit facilities from banks $ 60,103 $ 187,171
As at December 31, 2015, the Group had credit facilities aggregating $900,763 as follows: (i) the Group hadunsecured revolving credit facilities aggregating $429,635 from banks. The banks generally charge an interest rateat inter-bank rate plus an interest margin; (ii) the Group also had revolving credit facilities aggregating $116,232from banks for structured solutions, a special trade financing. The margin is negotiable when the facility is used;(iii) the Group had a specially structured non-recourse factoring arrangement with a bank up to a credit limit of $248,730 for the Group’s finance and supply chain activities. The Group factors certain of its trade receivableaccounts upon invoicing, at inter-bank rate plus a margin; (iv) the Group had foreign exchange credit facilities of $80,446 with banks; and (v) the Group had secured revolving credit facilities aggregating $25,720. All thesefacilities are renewable on a yearly basis or usable until further notice.
In addition, the Group has margin lines with availability at multiple brokers, which enable the Group to hedge over$138,400 notional value of industrial products.
Note 15. DebtThe Company and certain of its subsidiaries have entered into long-term debt agreements with numerous banks andfinancial institutions. These agreements, which include customary terms and conditions in accordance with industrystandards for unsecured facilities, include:
As at December 31: 2015 2014 Due to a bank, US$886 and US$6,000 at December 31, 2015 and 2014, respectively,
interest at LIBOR plus an interest margin (3.23% at December 2015) and payable monthly, secured by trade receivables and due in negotiated periodic repayments with final payment in September 2016 $ 1,225 $ 6,960
Due to a bank, US$1,700 and US$11,100 at December 31, 2015 and 2014, respectively, interest at LIBOR plus an interest margin (4.73% at December 2015) and payable monthly, secured by real estate and trade receivables and due in negotiated periodic repayments with final payment in October 2018 2,353 12,877
Due to banks, €52,950 at December 31, 2014, fixed interest and backup guarantee fee on€52,950 and payable quarterly, due in semi-annual repayments with final payment inNovember 2020. Reclassified to liabilities relating to assets held for sale in 2015 — 74,331
Due to a bank, US$24,000 and US$28,000 at December 31, 2015 and 2014, respectively, fixed interest plus an interest margin and backup guarantee fee on US$24,000 (5.05% at December 31, 2015) and payable quarterly and due in equal annual repayments with final repayment in September 2022 33,216 32,483
Due to a bank, €22,200 and €27,600 at December 31, 2015 and 2014, respectively, fixedinterest and backup guarantee fee on €21,660 (3.94% at December 31, 2015) and theremainder at OEKB variable plus an interest margin and backup guarantee fee (3.29%at December 2015) and payable quarterly, due in semi-annual repayments with finalpayment in December 2022 33,364 38,745
Due to a bank, US$10,000 at both December 31, 2015 and 2014, interest at LIBOR plus an interest margin (2.307% at December 2015) and payable in November 2016 13,840 11,601
Due to banks, €31,000 at both December 31, 2015 and 2014, interest at EURIBOR plus an interest margin (1.90% at December 2015) and payable from November 2016 to November 2020 46,590 43,519
114

TABLE OF CONTENTS
MFC BANCORP LTD. (FORMERLY MFC INDUSTRIAL LTD.)
NOTES TO CONSOLIDATED FINANCIAL STATEMENTS
DECEMBER 31, 2015
Note 15. Debt (continued) As at December 31: 2015 2014 Due to a bank, €65,708 and €76,380 at December 31, 2015 and 2014, respectively, fixed
interest and backup guarantee fee on €59,604 (2.57% at December 31, 2015) and theremainder at OEKB variable plus an interest margin and backup guarantee fee (1.82%at December 2015) and payable quarterly due in semi-annual repayments with finalpayment in August 2022 98,752 107,218
Due to a bank, €4,043 and €4,620 at December 31, 2015 and 2014, respectively, fixedinterest and backup guarantee fee on €3,696 (at 2.5% at December 31, 2015) and theremainder at OEKB variable plus an interest margin and backup guarantee fee (1.85%at December 2015) and payable quarterly due in semi-annual repayments with finalpayment in August 2022 6,076 6,486
Due to a Bank €5,830 at December 31, 2014 at fixed interest. Repaid in 2015 — 8,185Due to a bank, €16,713 and €16,052 at December 31, 2015 and 2014, respectively,
€14,192 at a fixed interest rate (2.7% at December 31, 2015) and the remainder at EURIBOR plus an interest margin (1.30% at December 31, 2015) and payable quarterly, due in semi-annual repayments with final payment in May 2025 23,622 20,850
$ 259,038 $ 363,255
Current portion $ 84,705 $ 66,098Long-term portion 174,333 297,157
$ 259,038 $ 363,255
As at December 31, 2015, the maturities of the Group’s debt are as follows:
Years ending December 31: Principal Interest Total 2016 $ 84,705 $ 7,333 $ 92,0382017 34,886 5,170 40,0562018 44,452 3,998 48,4502019 29,404 2,649 32,0532020 26,778 1,714 28,492Thereafter 38,813 1,491 40,304
$ 259,038 $ 22,355 $ 281,393
Interest expense of $608, $1,683 and $nil, respectively, was capitalized into property, plant and equipment in theyears ended December 31, 2015, 2014 and 2013.
115

TABLE OF CONTENTS
MFC BANCORP LTD. (FORMERLY MFC INDUSTRIAL LTD.)
NOTES TO CONSOLIDATED FINANCIAL STATEMENTS
DECEMBER 31, 2015
Note 16. Account Payables and Accrued ExpensesAs at December 31: 2015 2014 Trade and account payables $ 110,881 $ 137,280Value-added, goods and services and other taxes (other than income taxes) 8,821 8,470Compensation 3,358 3,391Provisions for payments under guarantees (see Note 23) 40,677 —Provisions for warranty — 730Short-sale of securities — 131Deferred revenues 1,239 420Deposits from customers 2,920 2,488Acquisition price payables 1,769 1,484Sale of shares on behalf of other 3,070 3,070Contingent consideration on a business combination 2,077 881
$ 174,812 $ 158,345
Trade payables arise from the Group’s day-to-day trading activities. The Group’s expenses for services and otheroperational expenses are included in account and other payables. Generally, these payables and accrual accounts donot bear interest and have a maturity of less than one year.
Note 17. Shareholders’ Equity
Capital Stock
The authorized share capital of MFC Bancorp consists of an unlimited number of common shares and class Acommon shares both without par value and without special rights or restrictions and an unlimited number of ClassA Preference shares without par value and with special rights and restrictions.
Holders of common shares may receive dividends when, as and if declared by the Board of Directors, subject to thepreferential dividend rights of any other classes or series of preferred shares issued and outstanding. In no eventmay a dividend be declared or paid on the common shares if payment of the dividend would cause the realizablevalue of the assets of the Company to be less than the aggregate of its liabilities. Holders of common shares areentitled to one vote per share at any meeting of shareholders of common shares, and in general and subject toapplicable law, all matters will be determined by a majority of votes cast other than fundamental changes withrespect to the Company. The holders of common shares are entitled, in the event of a distribution of assets of theCompany on the liquidation, dissolution or winding-up of the Company (a “Liquidation Distribution”), to receive,before any Liquidation Distribution is made to the holders of the class A common shares or any other shares of theCompany ranking junior to the common shares, but after any prior rights of any preferred shares, the stated capitalwith respect to each common share held by them, together with all declared and unpaid dividends (if any and ifpreferential) thereon, up to the date of such Liquidation Distribution, and thereafter the common shares shall rankpari passu with all other classes of common shares in connection with the Liquidation Distribution.
The rights and restrictions attaching to the class A common shares are the same as those attaching to the commonshares, except that in the event of a Liquidation Distribution, the holders of the class A common shares are entitledto receive such Liquidation Distribution only after any prior rights of the preferred shares and common shares orany other share ranking prior in right to the class A common shares.
The Class A Preference shares may include one or more series and the Board of Directors may alter the specialrights of and restrictions to such series. Except as may be set out in the rights and restrictions, the holders of theClass A Preference shares are not entitled to vote at or attend shareholder meetings. Holders of Class A Preferenceshares are entitled to receive repayment of capital on the liquidation or dissolution of MFC Bancorp beforedistribution is made to holders of common shares.
All of the Company’s issued capital stock are fully paid.
116

TABLE OF CONTENTS
MFC BANCORP LTD. (FORMERLY MFC INDUSTRIAL LTD.)
NOTES TO CONSOLIDATED FINANCIAL STATEMENTS
DECEMBER 31, 2015
Note 17. Shareholders’ Equity (continued) Treasury Stock
As at December 31: 2015 2014 Common shares 328,239 328,239Preferred Shares 4,621,571 4,621,571
Total number of treasury stock 4,949,810 4,949,810
Total carrying amount of treasury stock $ 61,085 $ 61,085
All of the Company’s treasury stock is held by wholly-owned subsidiaries. The dividends paid and payable on thetreasury stock by the Company are eliminated on consolidation.
Note 18. Consolidated Statements of Operations
Revenues
The Group’s gross revenues comprised:
Years ended December 31: 2015 2014 2013 (Restated – Note 1A)
Finance and supply chain products and services $ 1,531,549 $ 1,237,153 $ 585,146Gain on securities, net — 5,221 6,507Interest 4,225 4,506 2,411Dividends 7 8 304Other 43,921 39,436 26,717
Gross revenues $ 1,579,702 $ 1,286,324 $ 621,085
The Group’s revenues include the revenues of the Elsner group and FESIL group from April 1, 2014 in the financeand supply chain segment.
The Group’s net gain on securities comprised:
Years Ended December 31: 2015 2014 2013 Trading securities $ — $ 299 $ 5,850Available-for-sale securities — 178 238Subsidiaries — 4,888 427Holding loss on advance sales of securities — (144 (8
Net gain on securities $ — $ 5,221 $ 6,507
117
) )

TABLE OF CONTENTS
MFC BANCORP LTD. (FORMERLY MFC INDUSTRIAL LTD.)
NOTES TO CONSOLIDATED FINANCIAL STATEMENTS
DECEMBER 31, 2015
Note 18. Consolidated Statements of Operations (continued) ExpensesThe Group’s costs of sales and services comprised:
Years Ended December 31: 2015 2014 2013 (Restated – Note 1A)
Supply chain products and services $ 1,468,680 $ 1,169,305 $ 544,179
Credit losses on loans and receivables and guarantees 54,540 4,346 4,763Fair value gain on government environmental emission refund (4,157 — —
Fair value loss on investment property — 134 —Market value decrease (increase) on commodity inventories 1,910 (4,172 (5,502
Gain on derivative contracts, net (2,913 (3,466 (2,135
Write-off of inventories, net — 165 —
Loss on trading securities 84 — —
Other 11,434 11,710 9,517
Total costs of sales and services $ 1,529,578 $ 1,178,022 $ 550,822
The Group included the following items in costs of sales and services:
Years ended December 31: 2015 2014 2013 Inventories as costs of goods sold (including depreciation,
amortization and depletion expenses allocated to costs of goods sold) $ 1,421,175 $ 1,117,770 $ 549,461
Loss on unwinding sale and repurchase arrangements — — 2,426
Additional information on the nature of expenses incurred in continuing operationsYears Ended December 31: 2015 2014 2013
Depreciation, amortization and depletion $ 6,450 $ 4,957 $ 2,206Employee benefits expenses 36,502 34,597 22,896
Note 19. Share-Based CompensationMFC Bancorp has a 2014 Equity Incentive Plan which replaced the 1997 Stock Option Plan and 2008 EquityIncentive Plan.
1997 Stock Option Plan (Amended)Subject to the terms of the 1997 Stock Option Plan (Amended) (“1997 Plan”), the Company granted options tocertain employees and directors to acquire common shares of the Company.
2008 Equity Incentive PlanSubject to the terms of the 2008 Equity Incentive Plan (“2008 Plan”), a committee, as appointed by the Company’sBoard of Directors, granted nonqualified stock options, incentive stock options, stock appreciation rights, restrictedstock awards, stock unit awards, stock awards, performance stock awards and tax bonus awards under the plan.
2014 Equity Incentive PlanPursuant to the terms of the 2014 Equity Incentive Plan (“2014 Plan”), the Company’s Board of Directors, thecompensation committee or such other committee as appointed by the Board of Directors to
118
)
) )
) ) )

TABLE OF CONTENTS
MFC BANCORP LTD. (FORMERLY MFC INDUSTRIAL LTD.)
NOTES TO CONSOLIDATED FINANCIAL STATEMENTS
DECEMBER 31, 2015
Note 19. Share-Based Compensation (continued) administer the 2014 Plan, may grant stock options, restricted stock rights, restricted stock, performance shareawards, performance share units and stock appreciation rights under the 2014 Plan, establish the terms andconditions for those awards, construe and interpret the 2014 Plan and establish the rules for the 2014 Plan’sadministration. Such awards may be granted to employees, non-employee directors, officers or consultants of theGroup or any affiliate or any person to whom an offer of employment with the Group or any affiliate is extended.Such committee has the authority to determine which employees, non-employee directors, officers, consultants andprospective employees should receive such awards. The 2014 Plan replaced the 1997 Plan and the 2008 Plan;provided, however, that the 1997 and 2008 Plans will continue to govern prior awards granted under such plansuntil all awards granted under such plans prior to November 14, 2014 have been exercised, forfeited, cancelled,expired or otherwise terminated in accordance with the terms thereof.
The maximum number of the Company’s common shares that may be issuable pursuant to all awards granted underthe 2014 Plan is 2,877,018 common shares, being 2,000,000 plus 267,344 and 609,674 of common shares availablefor awards under the 1997 and 2008 Plan, respectively, as of the effective date of the 2014 Plan. Notwithstandingthe foregoing, the maximum number of shares that may be issued as incentive stock options under the 2014 Plan is2,000,000. Forfeited, cancelled, returned and lapsed awards are not counted against the 2,000,000 common shares.Any awards granted under the 2014 Plan, or portions thereof, that are settled in cash and not by issuance of theCompany’s common shares are not counted against the foregoing limits.
The following table is a summary of the changes in stock options granted under the plans:
2008 Plan 2008 Plan 1997 Plan 1997 Plan
Number of
options
Weighted average
exercise price per share
(US$) Number of
options
Weighted average
exercise price per share
(US$) Outstanding as at December 31, 2012 and 2013 915,000 7.81 1,720,000 7.81
Granted 200,000 8.01 — —Expired (24,674 7.81 (255,000 7.81Exercised (30,326 7.81 — —Surrendered and cancelled (200,000 7.81 — —
Outstanding as at December 31, 2014 860,000 7.83 1,465,000 7.81Expired — — (92,500 7.81
Outstanding as at December 31, 2015 860,000 7.83 1,372,500 7.81
As at December 31, 2015:Options exercisable 860,000 1,372,500
Options available for granting in future periods — —
No awards had been issued pursuant to the 2014 Plan as at December 31, 2015. There were 2,877,018 awardsavailable for grant under the 2014 Plan as at December 31, 2015.
119
) )))
)

* Options to purchase 2,032,500 common shares of MFC Bancorp at US$7.81 per share expired on January 1, 2016.
TABLE OF CONTENTS
MFC BANCORP LTD. (FORMERLY MFC INDUSTRIAL LTD.)
NOTES TO CONSOLIDATED FINANCIAL STATEMENTS
DECEMBER 31, 2015
Note 19. Share-Based Compensation (continued) The following table summarizes information about stock options outstanding and exercisable as at December 31,2015:
Options Outstanding and Exercisable
Exercise Price per Share (US$)Number
outstanding
Weighted average remaining contractual
life (in years) $7.81 2,032,500 0.00$8.01 200,000 3.25
2,232,500 0.29
The following table summarizes the share-based compensation expenses recognized by the Group:
Years ended December 31: 2015 2014 2013Share-based compensation expenses arising from stock options granted
by the Company $ — $ 423 $ —
On April 2, 2014, the Company granted to two employees options to purchase 200,000 MFC Bancorp commonshares in aggregate at an exercise price of US$8.01 per share. The options vested immediately and expire onApril 2, 2019.
The weighted average assumptions and inputs used in calculating the fair value of the stock options granted onApril 2, 2014 using the Black-Scholes-Merton formula are as follows:
Number of options granted 200,000Vesting requirements ImmediatelyContractual life 5 yearsMethod of settlement In equityExercise price per share US$8.01Market price per share on grant date US$8.01Expected volatility 34.72%Expected option life 5 yearsExpected dividends 3.03%Risk-free interest rate 1.64%Fair value of option granted (per option) $2.115 (US$1.917)
The expected volatility was determined based on the historical price movement over the expected option life, withadjustments for underlying businesses. The stock option holders are not entitled to dividends or dividendequivalents until the options are exercised.
The aggregate fair value of options granted was $423 which was recognized as share-based compensation expensein the Group’s consolidated statement of operations for the year ended December 31, 2014. The share-basedcompensation expense is not tax deductible under the Canadian income tax act and, therefore, the Group did notrecognize any tax benefit from granting stock options.
Note 20. Income Taxes
MFC Bancorp’s statutory tax rate was 26.0%, 26.0% and 25.75% in 2015, 2014 and 2013, respectively. Theincrease in the tax rate in 2014 was due to the increase in the British Columbia provincial corporation tax rateeffective from April 2013.
120
*

TABLE OF CONTENTS
MFC BANCORP LTD. (FORMERLY MFC INDUSTRIAL LTD.)
NOTES TO CONSOLIDATED FINANCIAL STATEMENTS
DECEMBER 31, 2015
Note 20. Income Taxes (continued) A reconciliation of the provision for income taxes calculated at applicable statutory income tax rates in Canada tothe provision in the consolidated statements of operations is as follows:
Years ended December 31: 2015 2014 2013 (Loss) income before income taxes $ (55,417 $ 6,314 $ 3,159Computed recovery of (provision for) income taxes at MFC
Bancorp’s statutory tax rates $ 14,408 $ (1,642 $ (813(Increase) decrease in income taxes resulting from:
Subsidiaries’ tax rate differences 935 404 6Other non-taxable income 2,774 481 1,569Revisions to prior years 227 (548 2,822Taxable capital gains on dispositions, net 13 516 (60Unrecognized losses in current year (20,848 (607 (1,433Previously recognized deferred income tax assets, net 1,449 — —Deferred income tax asset on a purchased asset 1,339 — —Permanent differences (3,360 (1,109 (968Change in future tax rate 94 — 252Other, net 468 332 (378
(Provision for) recovery of income taxes $ (2,501 $ (2,173 $ 997
In addition, the aggregate current and deferred income tax relating to items that are charged directly to equity wasan expense of $109 and a recovery of $445 and $82, respectively, in 2015, 2014 and 2013, relating to the changesin fair values of available-for-sale securities and the remeasurements of defined benefit pension plans.
Note 21. Earnings Per Share
Earnings per share data from continuing operations for the years ended December 31 is summarized as follows:
2015 2014 2013
Basic (loss) earnings available to holders of common shares $ (59,544 $ 2,783 $ 4,324
Effect of dilutive securities: — — —
Diluted earnings $ (59,544 $ 2,783 $ 4,324
Number of Shares2015 2014 2013
Weighted average number of common shares outstanding —basic 63,142,272 62,922,837 62,552,126
Effect of dilutive securities:Options — 21 204,665Contingently issuable shares — 34,247 —
Weighted average number of common shares outstanding —diluted 63,142,272 62,957,105 62,756,791
The Group’s potential ordinary shares include stock options outstanding and contingently issuable shares pursuantto a share purchase agreement (see Note 25).
121
)
) )
))
) ) )
) ) )
)) )
)
)

TABLE OF CONTENTS
MFC BANCORP LTD. (FORMERLY MFC INDUSTRIAL LTD.)
NOTES TO CONSOLIDATED FINANCIAL STATEMENTS
DECEMBER 31, 2015
Note 21. Earnings Per Share (continued) As at December 31, 2015 and 2014, there were 2,232,500 and 2,325,000 stock options, respectively, outstandingthat could potentially dilute basic earnings per share in the future, but were not included in the calculation of dilutedearnings per share because they were antidilutive for 2015 and 2014.
Pursuant to a share purchase agreement (as amended), 50,000 common shares of MFC Bancorp would be issued toa put holder for each year from 2014 to 2024 if Possehl achieves an annual net income milestone as computed underIFRS for the year (see Note 25). The net income milestone for 2015 had been achieved, subject to the audit. These50,000 contingently issuable shares will dilute basic earnings per share in the future, but were not included in thecalculation of diluted earnings per share in 2015 because they were antidilutive.
Note 22. Dividends paid
The Company did not declare dividends in 2015. The last and final 2014 quarterly dividends of $4,388 (or US$0.06per common share) were paid on January 5, 2015 to shareholders of record on December 29, 2014.
Note 23. Commitments and Contingencies
Leases as lessors
The Group leases out land and buildings and equipment under non-cancellable operating lease agreements. Theleases have varying terms, subject to the customary practices in the particular regions.
Future minimum rentals under long-term non-cancellable operating leases are as follows:
Years ending December 31: Amount
2016 $ 13,2842017 2,1622018 3142019 1252020 105Thereafter 6
$ 15,996
The leases have varying terms, subject to the customary practices in the local regions. The Group recognized rentaland lease income of $5,345, $2,821 (including sublease of $7) and $2,435 (including sublease of $14) for theyears ended December 31, 2015, 2014 and 2013, respectively.
Leases as lessees
Future minimum commitments under long-term non-cancellable operating leases are as follows:
Years ending December 31: Amount
2016 $ 2,0062017 1,5532018 1,4222019 1,3792020 1,201Thereafter 1,266
$ 8,827
122

TABLE OF CONTENTS
MFC BANCORP LTD. (FORMERLY MFC INDUSTRIAL LTD.)
NOTES TO CONSOLIDATED FINANCIAL STATEMENTS
DECEMBER 31, 2015
Note 23. Commitments and Contingencies (continued) The leases, which principally comprise office space, have varying terms, subject to the customary practices in thelocal regions. Minimum lease payments recognized as expenses were $3,569 (including sublease of $875), $3,953(including sublease of $218 and contingent rents of $87) and $2,489 for the years ended December 31, 2015, 2014,and 2013 respectively.
Litigation
The Group is subject to litigation and tax audits in the normal course of business, the ultimate results of whichcannot be ascertained at this time. The Group records costs as they are incurred or become determinable.
Guarantees
Guarantees are accounted for as contingent liabilities unless it becomes probable that the Group will be required tomake a payment under the guarantee.
The Group coordinated prepayment loans made by third-party banks to one of its customers, which financed off-take contracts to the Group. The Group has guaranteed the bank loans which were previously classified anddisclosed as contingent liabilities. Subsequent to December 31, 2015, the customer filed for insolvency.Management of the Group expects that the banks will exercise their contractual rights under the guarantees todemand the payments from the Group and, as a result, the Group recorded a provision of $40,677 for the expectedpayments under the guarantees and a credit loss of $40,677 thereon as at December 31, 2015. The Group holdsvarious collateral, including guarantees, mortgages and other mitigation securities to recover a significant portion ofthese losses. The Group is exercising its rights as it undertakes various options to maximize recoveries. See sub-heading “Contingent Gain” in this Note 23.
Excluding the guarantee transaction discussed in the preceding paragraph, as at December 31, 2015, the Group hadissued guarantees up to a maximum of $14,137 to its trade and financing partners in the normal course of itsfinance and supply chain activities, being the total potential principal amount that may be guaranteed, of which$390 were outstanding and have not been recorded as liabilities in the consolidated statement of financial position.
Purchase Obligations
As at December 31, 2015 the Group had open purchase contracts aggregating $71,865 due in 2016 relating to itsfinance and supply chain activities. None of these have been recognized in the consolidated statement of financialposition as at December 31, 2015.
Contingent Gain
Subsequent to December 31, 2015, a customer filed for insolvency. As a result, the Group made a provision of $40,677 as credit loss for the expected payments under the guarantees during the year ended December 31, 2015.However, the Group holds various collateral, including guarantees, mortgages and other mitigation securities torecover a significant portion of these losses. The Group is exercising its rights as it undertakes various options tomaximize recoveries. The Group has not recorded any probable expected recoveries related to such credit losses inthese consolidated financial statements.
In December 2015, the Group sold a 95% economic interest in certain hydrocarbon assets and the related liabilitiesto a third party for nominal and contingent consideration. In the event that the purchaser sells, transfers or disposesof all or a portion of the participating interest in one or more transactions on or before the fifth anniversary date ofthe participating interest purchase and sale agreement and receives, collects or is otherwise entitled to aggregateproceeds equal to or greater than $5,000, it shall pay an amount equal to 25% thereof to the Group. As a result ofthe significant uncertainties as to the probability of receipt of any future consideration, management determined thatthe expected value of such future cash flow was $nil as at December 31, 2015.
123

TABLE OF CONTENTS
MFC BANCORP LTD. (FORMERLY MFC INDUSTRIAL LTD.)
NOTES TO CONSOLIDATED FINANCIAL STATEMENTS
DECEMBER 31, 2015
Note 23. Commitments and Contingencies (continued) Effective April 2014, the Group sold its interests in two aluminum processing mills to a third party. Pursuant to theshare purchase agreement, the sale price includes a certain percentage of the disposed entity’s (1) free cash flowfrom operations for the fiscal years 2014 through and inclusive of 2016 and (2) proceeds from the dispositions ofassets during a period of five years commencing on the day of the share purchase agreement. As a result of thesignificant uncertainties as to the probability of receipt of any future consideration, management determined that theexpected value of such future cash flow was $nil as at December 31, 2015.
In February 2013, the Group sold its interests in extracting facilities. Pursuant to the share purchase agreement, thesale price includes a certain percentage of the sold entity’s future free cash flows from operations and investmentfor a period of seven years. As a result of the significant uncertainties as to the probability of receipt of any futureconsideration, management determined that the expected value of such future cash flow was $nil as atDecember 31, 2015.
Note 24. Consolidated Statements of Cash Flows – Supplemental Disclosure
Interest paid and received, dividends received and income taxes paid are classified as operating activities.Dividends paid are classified as financing activities.
The Group establishes, utilizes and maintains various kinds of credit lines and facilities with banks and insurers.Most of these facilities are short term. These facilities are used in our day-to-day supply chain business andstructured solutions activities. The amounts drawn under such facilities fluctuate with the kind and level oftransactions being undertaken. As a result, management considers short-term bank borrowings to be a part of itsoperating activities and that it is most appropriate to include the changes in short-term bank borrowings withinoperating activities on the consolidated statements of cash flows.
There are no circumstances in which cash and cash equivalents held by an entity are not available for use by theGroup.
On December 31, 2013, a customer paid $23,576 to one of the Group’s subsidiaries. However, the underlyinginvoice was subject to a factoring arrangement with a bank pursuant to which such bank had previously purchasedthe related receivable and the customer was to submit such payment to the bank directly. The amount, which hadbeen incorrectly paid to the Group’s subsidiary by the customer instead of as directed to the bank, was subsequentlyrepaid in January 2014. As a result, $23,576 was recognized as repayment to a customer. No income or loss wasrecognized in connection with such transactions.
The Group had the following non-cash transactions:
Non-cash transactions in 2015: (1) recognition of a non-cash gain of $1,194 on the reversal of a decommissioningobligation (which was included in costs of sales and services), (2) issuance of 50,000 common shares of MFCBancorp to a director pursuant to a share purchase agreement executed in 2014 (see Note 25), (3) the Group sold a95% participating interest in certain hydrocarbon assets and liabilities, resulting in a post-tax loss of $11,987 ondisposition which was included in the results of discontinued operations and a net receivable of $11,600 due fromthe former subsidiaries (see Notes 4 and 23) and (4) the Group recognized provisions of $40,677 for expectedpayments under the guarantee (see Note 23).
Non-cash transactions in 2014: (1) conversion of puttable instrument financial liabilities into the share capital of theCompany (see Note 25) and (2) the Group sold its interest in a group of German entities and recognized a non-cashaccounting gain of $4,535 on disposition (see Note 28).
Non-cash transactions in 2013: (1) conversion of puttable instrument financial liabilities into the share capital ofnon-wholly-owned subsidiaries; (2) the Group sold its interest in a group (which held the resource properties inIndia) and recognized a non-cash accounting gain of $427 on disposition and (3) the Group acquired the non-controlling interests in a group for no consideration, resulting in $1,561 credited to the retained earnings account.
124

* Related to transactions with two processing facilities, which are owned by a former subsidiary of the Company. One of theCompany’s employees and one of its directors held unpaid positions on the board of directors of the parent company of the ownerof these facilities until July 2014.
** The director (who is also the former President of the Company) provided office space and services to the Company at cost.
*** Pursuant to a consulting agreement, the former President of the Company was entitled to a termination payment of US$1,770 uponthe termination of the consulting agreement.
TABLE OF CONTENTS
MFC BANCORP LTD. (FORMERLY MFC INDUSTRIAL LTD.)
NOTES TO CONSOLIDATED FINANCIAL STATEMENTS
DECEMBER 31, 2015
Note 25. Related Party Transactions
In the normal course of operations, the Group enters into transactions with related parties which include affiliates inwhich the Group has a significant equity interest (10% or more) or has the ability to influence their operating andfinancing policies through significant shareholding, representation on the board of directors, corporate charterand/or bylaws. The related parties also include MFC Bancorp’s directors, President, Chief Executive Officer, ChiefFinancial Officer, Chief Operating Officer and their close family members, as well as any person and entity whichhave significant influence over MFC Bancorp. In addition to transactions disclosed elsewhere in these consolidatedfinancial statements, the Group had the following transactions with its related parties.
Years ended December 31: 2015 2014 2013 Continuing operations:Sales of goods $ 3,349 $ 2,994 $ 2,028Fee income — 61 —Purchases of goods for sale* — 19,346 —Reimbursement of office and expenses at cost to a director** — (117 —Termination payment to the former President*** — (1,909 —
Discontinued operations:Dividend income on common shares $ — $ — $ 286Royalty expense paid and payable — (284 (625
Puttable instrument financial liabilities
In connection with the acquisitions of Mexico City-based Possehl Mexico S.A. de C.V. (“Possehl”) inNovember 2012, the Group entered into call and put agreements with the non-controlling interests, which allowedor required the Group to acquire up to 100% in the entity. As a result of the put options (i.e. puttable instrument),the non-controlling interests were classified as financial liabilities.
In April 2014, the Group entered into a share purchase agreement with the holder of the puttable instrument (the“Put Holder”) whereby the Group acquired from the Put Holder his 40% equity shares in Possehl. Upon theexecution of the agreement, the puttable instrument was terminated. The purchase price consisted of 509,820common shares of MFC Bancorp (which would be delivered upon occurrence of an event (as defined in theagreement, the latest being in 2025) and a contingent purchase price whereby 50,000 common shares of MFCBancorp would be issued to the Put Holder for each year from 2014 to 2025 if Possehl achieves an annual netincome milestone as computed under IFRS for the year. The fair values of the 509,820 common shares of MFCBancorp and the contingent purchase price were measured at $2,736 in aggregate on the execution date of the sharepurchase agreement, using a generally accepted financial valuation model which took into consideration theilliquidity and restrictions of the shares, the expected timing of the triggering events, the probability of the issuanceof the contingently issuable shares and appropriate discount rates. As a result, the carrying amount of the puttableinstrument financial liabilities of $4,510 were derecognized and a credit of $3,177 was recognized in retainedearnings directly. In May 2014, the Put Holder was appointed by the Board of Directors as the President and ChiefExecutive Officer of MFC Bancorp.
125
))
) )

* The share-based payments were computed by the reference to the fair value of options calculated using the Black-Scholes-Mertonformula on the grant date (see Note 19).
TABLE OF CONTENTS
MFC BANCORP LTD. (FORMERLY MFC INDUSTRIAL LTD.)
NOTES TO CONSOLIDATED FINANCIAL STATEMENTS
DECEMBER 31, 2015
Note 25. Related Party Transactions (continued) In June 2014, the share purchase agreement was amended whereby the 509,820 common shares of MFC Bancorpwere released to the Put Holder following the approval of the New York Stock Exchange (which was received inJune 2014) and the contingent purchase price was reduced to be payable for each year from 2014 to 2024. All otherterms remain unchanged. No credit or charge was recognized in connection with these amendments.
In June 2015, the Company issued 50,000 common shares of MFC Bancorp to its President/Chief Executive Officeras the 2014 annual net income milestone of a subsidiary was achieved.
In addition to the transactions above, the Group had the following transactions with related parties:
In April 2014, the then-President of the Company surrendered his options to purchase 200,000 MFC Bancorpcommon shares at an exercise price of US$7.81 per share. The cancellation of these options had no impact on theconsolidated financial statements.
In February 2013, the Group sold its interest in a group to a director of two of the Group’s sub-subsidiaries,resulting in non-cash accounting gain on securities of $427 on disposition. The director resigned from thesubsidiaries in March 2013. In addition, a subsidiary sold its office furniture and equipment to a companybeneficially owned by the Chairman of the Company for $14, resulting in a gain of $14. Included in otherreceivables was an overpayment of net director fee of $8 which was subsequently repaid by the director in 2014.
Key management personnel
The Group’s key management personnel comprise the members of its Board of Directors, President, ChiefExecutive Officer and Chief Financial Officer. The remuneration of key management personnel of the Group was asfollows:
Years ended December 31: 2015 2014 2013 Short-term employee benefits $ 2,719 $ 1,932 $ 745Termination benefits — 1,909 —Share-based payments* — 211 —Directors’ fees 479 402 383
Total $ 3,198 $ 4,454 $ 1,128
The termination benefits in 2014 represented amounts paid to the former President of the Company.
Note 26. Financial Instruments
The disclosures and analyses in this Note 26 do not include the financial instruments classified as assets held forsale and their related revenues and expenses presented (or represented) in discontinued operations.
126

TABLE OF CONTENTS
MFC BANCORP LTD. (FORMERLY MFC INDUSTRIAL LTD.)
NOTES TO CONSOLIDATED FINANCIAL STATEMENTS
DECEMBER 31, 2015
Note 26. Financial Instruments (continued) The fair values of the Group’s financial instruments as at December 31, other than those with carrying amounts thatapproximate their fair values due to their short-term nature, are summarized as follows:
As at December 31: 2015 2014Carrying Amount
Fair Value
Carrying Amount
Fair Value
Financial Assets:Fairvaluethroughprofitorloss:
Short-term securities $ 170 $ 170 $ 290 $ 290Derivative assets 5,726 5,726 6,274 6,274
Loansandreceivables:Long-term loan receivables (including current portion) 2,828 2,691 2,996 2,797Long-term receivables, other 4,523 4,523 — —
Available-for-saleinstruments:Securities, at fair value 630 630 790 790Securities, at cost 298 298 287 287
Financial Liabilities:Financialliabilitiesmeasuredatamortizedcost:
Debt $ 259,038 $ 242,808 $ 363,255 $ 365,244Other financial liabilities, long-term — — 5,778 5,778
Fairvaluethroughprofitorloss:Derivative liabilities 4,236 4,236 3,539 3,539
Fair value of a financial instrument represents the price that would be received to sell an asset or paid to transfer aliability in an orderly transaction in the principal (or most advantageous) market at the measurement date undercurrent market conditions regardless of whether that price is directly observable or estimated using a valuationtechnique. The price for a transaction which takes place under duress or the seller is forced to accept the price in thetransaction might not represent the fair value of an asset or a liability. The best evidence of fair value is publishedprice quotations in an active market. When the market for a financial asset or financial liability is not active, theGroup establishes fair value by using a valuation technique. The valuation technique used maximizes the use ofinputs observed in active markets, and minimizes the use of inputs generated by the Group. Internally generatedinputs take into account factors that market participants would consider when pricing the financial instruments, suchas liquidity and credit risks. Use of judgment is significantly involved in estimating fair value of financialinstruments in inactive markets and actual results could materially differ from the estimates. To value longer-termtransactions and transactions in less active markets for which pricing information is not generally available,unobservable inputs may be used.
The fair values of short-term trading securities are based on quoted market prices (Level 1 fair value hierarchy).The fair values of available-for-sale securities are based on quoted market prices, except for those which are notquoted in an active market which are estimated using an appropriate valuation method (Level 3 fair valuehierarchy). Investments in equity instruments that do not have a quoted price in an active market and whose fairvalue cannot be reliably measured are measured at cost. The carrying amounts of cash and cash equivalents,restricted cash, short-term cash deposits, short-term receivables, short-term borrowings and account payables andaccrued expenses, due to their short-term nature and normal trade credit terms, approximate their fair values. Thefair values of long-term receivables, long-term debt and other long-term liabilities are determined using discountedcash flows at prevailing market rates of interest for similar instruments with similar credit ratings (Level 2 fair valuehierarchy).
127

TABLE OF CONTENTS
MFC BANCORP LTD. (FORMERLY MFC INDUSTRIAL LTD.)
NOTES TO CONSOLIDATED FINANCIAL STATEMENTS
DECEMBER 31, 2015
Note 26. Financial Instruments (continued) The fair values of derivative financial instruments are based on quoted market prices when possible; and if notavailable, estimates from third-party brokers. These broker estimates are corroborated with multiple sources and/orother observable market data utilizing assumptions that market participants would use when pricing the asset orliability, including assumptions about risk and market liquidity (Level 2 fair value hierarchy). Inputs may be readilyobservable or market-corroborated.
The following tables present the Group’s financial instruments measured at fair value on the consolidatedstatements of financial position classified by the fair value hierarchy as at December 31, 2015 and 2014,respectively:
As at December 31, 2015 Level 1 Level 2 Level 3 Total Financial Assets:Fair value through profit or loss:
Short-term securities $ 170 $ — $ — $ 170Derivative assets — 5,726 — 5,726
Available-for-sale:Securities 630 — — 630
Total $ 800 $ 5,726 $ — $ 6,526Financial Liabilities:Fair value through profit or loss:
Derivative liabilities $ — $ 4,236 $ — $ 4,236
As at December 31, 2014 Level 1 Level 2 Level 3 Total Financial Assets:Fair value through profit or loss:
Short-term securities $ 290 $ — $ — $ 290Derivative assets — 6,274 — 6,274
Available-for-sale:Securities 790 — — 790
Total $ 1,080 $ 6,274 $ — $ 7,354Financial Liabilities:Fair value through profit or loss:
Derivative liabilities $ — $ 3,539 $ — $ 3,539
Generally, management of the Group believes that current financial assets and financial liabilities, due to theirshort-term nature, do not pose significant financial risks. The Group uses various financial instruments to manageits exposure to various financial risks. The policies for controlling the risks associated with financial instrumentsinclude, but are not limited to, standardized company procedures and policies on matters such as hedging of riskexposures, avoidance of undue concentration of risk and requirements for collateral (including letters of credit andbank guarantees) to mitigate credit risk. The Group has risk managers and other personnel to perform checkingfunctions and risk assessments so as to ensure that the Group’s procedures and policies are complied with.
Many of the Group’s strategies, including the use of derivative instruments and the types of derivative instrumentsselected by the Group, are based on historical trading patterns and correlations and the Group’s management’sexpectations of future events. However, these strategies may not be fully effective in all market environments oragainst all types of risks. Unexpected market developments may affect the
128

TABLE OF CONTENTS
MFC BANCORP LTD. (FORMERLY MFC INDUSTRIAL LTD.)
NOTES TO CONSOLIDATED FINANCIAL STATEMENTS
DECEMBER 31, 2015
Note 26. Financial Instruments (continued) Group’s risk management strategies during the period, and unanticipated developments could impact the Group’srisk management strategies in the future. If any of the variety of instruments and strategies the Group utilizes is noteffective, the Group may incur losses.
The Group does not trade in financial instruments, including derivative financial instruments, for speculativepurposes.
The nature of the risks that the Group’s financial instruments are subject to as at December 31, 2015 is set out in thefollowing table:
Risks
Market risks Financial instrument Credit Liquidity Currency Interest rate Other price Cash and cash equivalents, short-term cash deposits and
restricted cash X X XShort-term securities X XLong-term securities X XDerivative assets and liabilities X X X XReceivables X XShort-term bank borrowings X XAccount payables and accrued expenses X XLong-term debt X X X
A sensitivity analysis for each type of market risk to which the Group is exposed on its financial instruments at theend of the reporting period is provided, showing how profit or loss and equity would have been affected by changesin the relevant risk variable that were reasonably possible at that date. These ranges of parameters are estimated bymanagement, which are based on the facts and circumstances available at the time estimates are made, and anassumption of stable socio-economic and geopolitical states. No unusual and exceptional events, for example,natural disasters or human-made crises and calamities, are taken into consideration when the sensitivity analysis isprepared. Actual occurrence could differ from these assumptions and such differences could be material.
Credit risk
Credit risk is the risk that one party to a financial instrument will fail to discharge an obligation and cause the otherparty to incur a financial loss. Financial instruments which potentially subject the Group to credit risk consist ofcash and cash equivalents, restricted cash, short-term cash deposits, and derivative and credit exposures (includingoutstanding receivables and committed transactions). The Group has deposited cash and cash equivalents, restrictedcash, short-term cash deposits and entered into derivative contracts with reputable financial institutions with highcredit ratings, from which management believes the risk of loss to be remote.
Most of the Group’s credit exposures are with counterparties in the finance and supply chain segment and aresubject to normal industry credit risk. The Group has receivables from various entities including, primarily, tradecustomers. Credit risk from trade account receivables is mitigated since they are credit insured, covered by letters ofcredit, bank guarantees and/or other credit enhancements. The Group routinely monitors credit risk exposures,including sector, geographic and corporate concentrations of credit and set and regularly review counterparties’credit limits based on rating agency credit ratings and/or internal assessments of company and industry analysis.The Group also uses factoring and credit insurances to manage credit risk. Management believes that thesemeasures minimize the Group’s overall credit risk; however, there can be no assurance that these processes willprotect the Group against all losses from non-performance.
129

TABLE OF CONTENTS
MFC BANCORP LTD. (FORMERLY MFC INDUSTRIAL LTD.)
NOTES TO CONSOLIDATED FINANCIAL STATEMENTS
DECEMBER 31, 2015
Note 26. Financial Instruments (continued) The average contractual credit period for trade receivables is 60-65 days and up to 180 days for certain sales. Withthe use of factoring facilities, the average cash collection period is reduced to approximately 15 days. For the aginganalysis of past-due receivables, see Note 6.
The maximum credit risk exposure as at December 31, 2015 is as follows:
Cash and cash equivalents, short-term cash deposits and restricted cash $ 198,391Derivative assets 5,726Receivables 167,649
Amounts recognized in the consolidated statement of financial position 371,766Guarantees (see Note 23) 14,137
Maximum credit risk exposure $ 385,903
As at December 31, 2015, the Group had issued guarantees up to a maximum of $14,137 to its trading andfinancing partners in the normal course of its supply chain activities. As at December 31, 2015, $390 wereoutstanding and have not been recorded as liabilities in the consolidated statement of financial position. Typically,these guarantees are issued on behalf of the Group’s trading partners and the Group companies. The guaranteesissued on behalf of the Group companies are typically issued in favor of trading and financing partners.
In the preceding five years, no claims were made against the guarantees issued by the Group. Subsequent toDecember 31, 2015, certain guarantees related to a customer filing for insolvency were called and the Group met itsobligations under these amounts. Since these guarantees are no longer contingent, but instead are probable, theyhave been recognized as provisions as at December 31, 2015. In case of non-performance by a trading partner and aclaim made against the Group, the Group can make the claim against the defaulting trading partner and has a pledgeon the goods as well as other assets to recover the loss. The Group can also get reimbursements from various otherforms of collateral and risk mitigation securities (see Note 23).
Please see sub-heading of “Concentration risk” in this Note 26 on credit risk concentration.
Liquidity riskLiquidity risk is the risk that an entity will encounter difficulty in raising funds to meet commitments associatedwith financial instruments. The Group requires liquidity specifically to fund capital requirements, satisfy financialobligations as they become due, and to operate its finance and supply chain business. The Group puts in place anactively managed production and capital expenditure budgeting process for major capital programs. The Group’sapproach to managing liquidity is to ensure, as far as possible, that it always has sufficient liquidity to meet itsliabilities when they fall due, under normal and stress conditions, without incurring unacceptable losses. The Groupmaintains an adequate level of liquidity, with a portion of its assets held in cash and cash equivalents. The Groupalso maintains adequate banking facilities, including factoring arrangements. It is the Group’s policy to invest cashin highly liquid, diversified money market funds or bank deposits for a period of less than three months. The Groupmay also invest in cash deposits with an original maturity date of more than three months so as to earn higherinterest income.
Generally, trade payables are due within 90 days and other payables and accrued expenses are due within one year.All derivative financial liabilities are to be settled within one year. All short-term bank borrowings are renewable ona yearly basis. Please also refer to Note 15 for the Group’s debt maturity schedule. The schedule of future paymentsis based on the Group’s historical payment patterns and management’s interpretation of contractual arrangements.The actual cash outflows might occur significantly earlier than indicated in the schedule or be for significantlydifferent amounts from those indicated in the schedule.
Currency riskCurrency risk is the risk that the value of a financial instrument will fluctuate due to changes in foreign exchangerates. Currency risk does not arise from financial instruments that are non-monetary items or
130

TABLE OF CONTENTS
MFC BANCORP LTD. (FORMERLY MFC INDUSTRIAL LTD.)
NOTES TO CONSOLIDATED FINANCIAL STATEMENTS
DECEMBER 31, 2015
Note 26. Financial Instruments (continued) from financial instruments denominated in the functional currency. The Group operates internationally and isexposed to risks from changes in foreign currency rates, particularly the Euro, Canadian dollar and U.S. dollar.Currency risk arises principally from future trading transactions, and recognized assets and liabilities. In order toreduce the Group’s exposure to foreign currency risk on material contracts (including intercompany loans)denominated in foreign currencies (other than the functional currencies of the Group companies), the Group mayuse foreign currency forward contracts and options to protect its financial positions. As at December 31, 2015, in itscontinuing operations, the Group had foreign currency derivative financial instruments (foreign currency forwardcontracts and options) with aggregate notional amounts of $162,051 (2014: $255,906) and a net unrealized fairvalue gain of $2,492 (2014: $2,795).
The Group does not have any material exposure to highly inflationary foreign currencies.
Sensitivity analysis:
At December 31, 2015, if the U.S. dollar had weakened 10% against the Group companies’ functional currencieswith all other variables held constant, loss from continuing operations for the year ended December 31, 2015 wouldhave been $1,156 higher. Conversely, if the U.S. dollar had strengthened 10% against the local functionalcurrencies with all other variables held constant, loss from continuing operations for the year ended December 31,2015 would have been $1,156 lower. The reason for such change is mainly due to certain U.S. dollar denominatedfinancial instrument liabilities (net of assets) held by entities whose functional currencies were not the U.S. dollar.There would have been no material impact arising from financial instruments on other comprehensive income ineither case.
At December 31, 2015, if the Euro had weakened 10% against the Group companies’ functional currencies with allother variables held constant, loss from continuing operations for the year ended December 31, 2015 would havebeen $4,317 lower. Conversely, if the Euro had strengthened 10% against the local functional currencies with allother variables held constant, loss from continuing operations for the year ended December 31, 2015 would havebeen $3,217 higher. The reason for such change is mainly due to certain currency derivative contracts held byentities whose functional currencies were not the Euro. There would have been no impact arising from financialinstruments on other comprehensive income in either case.
At December 31, 2015, if the Canadian dollars had weakened 10% against the Group companies’ functionalcurrencies with all other variables held constant, loss from continuing operations for the year ended December 31,2015 would have been $583 higher. Conversely, if the Canadian dollars had strengthened 10% against the localfunctional currencies with all other variables held constant, loss from continuing operations for the year endedDecember 31, 2015 would have been $583 lower. The reason for such change is mainly due to certain Canadiandollar-denominated financial assets (net of liabilities) held by entities whose functional currencies were not theCanadian dollars. There would have been no impact arising from financial instruments on other comprehensiveincome in either case.
Interest rate risk
Interest rate risk is the risk that the fair value or future cash flows of a financial instrument will fluctuate due tochanges in market interest rates. Short-term financial assets and financial liabilities are generally not exposed tosignificant interest rate risk, because of their short-term nature. The Group’s long-term debt is not exposed tosignificant interest rate cash flow risk as the interest rates have been fixed for approximately 72% of the Group’slong-term debt.
Sensitivity analysis:
At December 31, 2015, if benchmark interest rates (such as LIBOR or prime rates) at that date had been 100 basispoints (1.00%) per annum lower with all other variables held constant, loss from continuing operations for the yearended December 31, 2015 would have been $2,202 lower, arising mainly as a result of lower net interest expense.Conversely, if benchmark interest rates at that date had been 100 basis points
131

TABLE OF CONTENTS
MFC BANCORP LTD. (FORMERLY MFC INDUSTRIAL LTD.)
NOTES TO CONSOLIDATED FINANCIAL STATEMENTS
DECEMBER 31, 2015
Note 26. Financial Instruments (continued) (1.00%) per annum higher with all other variables held constant, loss from continuing operations for the year endedDecember 31, 2015 would have been $2,202 higher, arising mainly as a result of higher net interest expense. Therewould have been no impact arising from financial instruments on the Group’s other comprehensive income.
Other price risk
Other price risk is the risk that the value of a financial instrument will fluctuate as a result of changes in marketprices, whether those changes are caused by factors specific to the individual instrument or its issuer or factorsaffecting all instruments traded in the market. The Group’s other price risk includes equity price risk whereby theGroup’s investments in equities of other entities that are classified as held for trading or available for sale aresubject to market price fluctuations. The Group did not hold any asset-backed securities.
Sensitivity analysis:
At December 31, 2015, if the equity price in general had weakened 10% with all other variables held constant, lossand other comprehensive income from continuing operations for the year ended December 31, 2015 would havebeen $33 higher and $60 lower, respectively. Conversely, if the equity price in general had strengthened 10% withall other variables held constant, loss and other comprehensive income from continuing operations for the yearended December 31, 2015 would have been $33 lower and $60 higher, respectively.
In addition, the Group buys and sells futures contracts on the London Metal Exchange and enters into financialderivative contracts (e.g. futures and swaps) with banks, customers and brokers. Management uses the financialderivative contracts to manage the price fluctuations for its own account or for customers. As at December 31, 2015in its continuing operations, the Group had outstanding derivative financial instruments with an aggregate notionalamount of $43,820 (2014:$21,277), respectively, primarily to hedge against the long position in inventories and theusage of energy, which resulted in a net unrealized fair value loss of $1,002 (2014: fair value gain of $848).
Sensitivity analysis:
At December 31, 2015, if the underlying price in the financial instrument contracts in general had weakened 10%with all other variables held constant, loss from continuing operations for the year ended December 31, 2015 wouldhave been $147 higher. Conversely, if the underlying price in the financial instrument contracts in general hadstrengthened 10% with all other variables held constant, loss from continuing operations for the year endedDecember 31, 2015 would have been $147 lower. There would have been no impact arising from financialinstruments on other comprehensive income in either case.
The Group executes contracts with third parties for the sale and physical delivery of inventory so as to achieve atargeted price. Such contracts are not typically financial instruments and therefore are excluded from the fair valuedisclosures and sensitivity analysis.
Concentration risk
Management determines the concentration risk threshold amount as any single financial asset (or liability)exceeding 10% of total financial assets (or liabilities) in the Group’s consolidated statement of financial position.
The Group regularly maintains cash balances in financial institutions in excess of insured limits. The Group hasdeposited cash and cash equivalents, restricted cash and term deposits with reputable financial institutions with highcredit ratings, and management believes the risk of loss to be remote. As at December 31, 2015, the Group had cashand cash equivalents aggregating $56,107 and an investment of $102 in a banking group in Austria. The Group alsoowed $163,326 in aggregate short-term banking borrowings and debt to the Austria banking group and hadderivative contracts with an aggregate notional
132

TABLE OF CONTENTS
MFC BANCORP LTD. (FORMERLY MFC INDUSTRIAL LTD.)
NOTES TO CONSOLIDATED FINANCIAL STATEMENTS
DECEMBER 31, 2015
Note 26. Financial Instruments (continued) amount of $140,540 with the Austria banking group. In addition, as of December 31, 2015, the assets held for saleincluded cash and cash equivalent of $2,286 with and the liabilities relating to the assets held for sale includedshort-term banking borrowings and debt of $31,486 due to the same Austria banking group.
A customer filed for insolvency in 2016. As of December 31, 2015, the Group recognized trade receivables of $92,595 due from the customer and its affiliates, net of allowance for credit losses.
Additional disclosure
In addition to information disclosed elsewhere in these consolidated financial statements, the Group had significantitems of income, expense, and gains and losses resulting from financial assets and financial liabilities which wereincluded in profit or loss from its continuing operations in 2015, 2014 and 2013 as follows:
2015 2014 2013 Interest income on financial assets not at fair value through
profit or loss $ 742 $ 1,268 $ 63Interest income on financial assets classified at fair value
through profit or loss 3,483 3,238 2,348
Total interest income $ 4,225 $ 4,506 $ 2,411Interest expense on financial liabilities not at fair value
through profit or loss $ 1,791 $ 2,482 $ 3,614Interest expense on financial liabilities classified at fair value
through profit or loss 13,755 9,253 5,530
Total interest expense $ 15,546 $ 11,735 $ 9,144Dividend income on financial assets at fair value through
profit or loss $ — $ — $ 232
Dividend income on financial assets classified as available forsale, other 7 8 72
Net gain on financial assets at fair value through profit or loss 2,829 3,765 7,986
Credit losses 54,540 4,346 4,763
Note 27. Fair Value Disclosure of Non-financial Assets
The fair values of the Group’s financial instrument assets and liabilities which are measured at fair value on theconsolidated statements of financial position are discussed in Note 26. The following tables present non-financialassets which are measured at fair value in the consolidated statements of financial position, classified by the fairvalue hierarchy;
Assets measured at fair value on a recurring basis as at December 31, 2015:Fair Value Measurements at
Reporting Date UsingLevel 1 Level 2 Level 3
Inventories $ 3,418 $ 116,905 $ —Investment property — 37,873 —
Total $ 3,418 $ 154,778 $ —
133

TABLE OF CONTENTS
MFC BANCORP LTD. (FORMERLY MFC INDUSTRIAL LTD.)
NOTES TO CONSOLIDATED FINANCIAL STATEMENTS
DECEMBER 31, 2015
Note 27. Fair Value Disclosure of Non-financial Assets (continued) Assets measured at fair value on a recurring basis as at December 31, 2014:
Fair Value Measurements at Reporting Date Using
Level 1 Level 2 Level 3 Inventories $ 3,200 $ 147,013 $ —Investment property (included in assets held for sale) — 35,378 —
Total $ 3,200 $ 182,391 $ —
Commodity inventories are measured at fair value less costs to sell. The fair values are determined by reference totheir contractual selling prices or quoted prices in marketplaces in the absence of a contract (level 1 fair valuehierarchy). An average of past sale prices is used when there are no observable market prices or current contractsbut there have been recent past sales of such goods and there are no indications that the market prices have beenmaterially impacted (level 2 fair value hierarchy).
The fair values of investment property are measured using an income approach which includes the following inputs:land value, realized basic rents, operating costs, discount rates and damages and defects (level 2 fair valuehierarchy). The valuation approach is consistent in both 2015 and 2014, except that the 2014 valuation wasperformed by an independent external valuator and the 2015 update was performed by internal management asmanagement concluded there were no major changes in the input factors since 2014.
Note 28. MFC Bancorp and its Significant Subsidiaries
MFC Bancorp has its principal executive office at Suite 1860 – 400 Burrard Street, Vancouver, British Columbia,Canada.
A subsidiary is an entity that is controlled by MFC Bancorp. The following table shows the Company’s direct andindirect significant subsidiaries as at December 31, 2015. The table excludes subsidiaries which only holdintercompany assets and liabilities and do not have an active business as well as subsidiaries whose results and netassets did not materially impact the consolidated results and net assets of the Group.
SubsidiariesCountry of
IncorporationProportion of Interest
MFC Commodities GmbH Austria 100MFC Trade & Financial Services GmbH Austria 100IC Managementservice GmbH Austria 100International Trade Services GmbH Austria 100MFC Commodities Trading GmbH Austria 100MFC Metal Trading GmbH Austria 100Kasese Cobalt Company Limited Uganda 75MFC (A) Ltd Marshall Islands 100MFC (D) Ltd Marshall Islands 100M Financial Corp. Barbados 100MFC Corporate Services AG Switzerland 100GPT Global Pellets Trading GmbH Austria 100MFC Power Limited Partnership Canada 100MFC Resources Inc. U.S. 100Possehl Mexico S.A. de C.V Mexico 100MFC Holding Norway AS Norway 100Fesil AS Norway 100
134
%%%%%%%%%%%%%%%%%

TABLE OF CONTENTS
MFC BANCORP LTD. (FORMERLY MFC INDUSTRIAL LTD.)
NOTES TO CONSOLIDATED FINANCIAL STATEMENTS
DECEMBER 31, 2015
Note 28. MFC Bancorp and its Significant Subsidiaries (continued)
Subsidiaries Country of
Incorporation Proportion of Interest
Fesil Sales AS Norway 100Fesil Rana Metall AS Norway 100Fesil Sales GmbH Germany 100Fesil Sales SA Luxembourg 100F.J. Elsner Trading Gesellschaft mbH Austria 100Mednet (Shanghai) Medical Technical Developing Co. Ltd. China 100Hangzhou Zhe-er Optical Co. Ltd. China 51
As at December 31, 2015, the Group controlled entities in which the Group held more than 50% of the voting rightsand did not control any entities in which the Group held 50% or less of the voting rights. The Group’s proportionalvoting interests in the subsidiaries are identical to its proportional beneficial interests, except for a non-wholly-owned subsidiary in Africa from which the Group derives a 100% beneficial interest resulting from holding ashareholder loan. As at December 31, 2015, none of non-controlling interests are material to the Group. Also, therewere no significant restrictions (statutory, contractual and regulatory restrictions, including protective rights of non-controlling interests) on MFC Bancorp’s ability to access or use the assets and settle the liabilities of the Group.
During the year ended December 2015, the Group sold a 95% economic interest in certain hydrocarbon assets andthe related liabilities to a third party for nominal and contingent consideration and derecognized the formersubsidiaries holding these assets and liabilities. As a result, the Group recognized a non-cash post-tax loss of $11,987 upon the deconsolidation (see Note 4).
During the year ended December 31, 2014, the Group disposed of a group of German entities (see Note 23) andrecognized an accounting gain of $4,535 on the derecognition of these former subsidiaries in the consolidatedstatement of operations. The Group also disposed of three inactive wholly-owned subsidiaries for cashconsideration, resulting in a net gain of $353.
During the year ended December 31, 2014, the Group purchased the remaining 40% equity interest in Possehl (seeNote 25). As a result, Possehl became a wholly-owned subsidiary of the Group since April 2014, the date theremaining 40% equity interests were acquired.
During the year ended December 31, 2013, the Group sold its interest in a group (which held the resource propertiesin India) and recognized a non-cash accounting gain of $427 on disposition (see Note 23). The gain was included innet sales in the consolidated statement of operations. The Group also acquired the non-controlling interests aconsolidated structured entity) and another group. There was no income or loss resulting from the transactions andnon-controlling interests aggregating $2,503 were reclassified to retained earnings. The Group also credited $1,968to retained earnings in 2013 when it acquired the remaining equity interest in MFC Resources Inc.
Note 29. Subsequent Event
Purchase of assets
On January 5, 2016, the Group purchased certain assets from a former subsidiary for $790 at their fair value. Thepurchase consideration was recorded as a reduction in the amount due from the former subsidiary.
Business combination
On January 11, 2016, the Company received all necessary regulatory approvals and, on February 1, 2016,completed the acquisition of BAWAG Malta Bank Ltd. (the “Bank”), a Western European bank. Subsequent to theacquisition, the Bank changed its name to MFC Merchant Bank Ltd.
135
%%%%%%%

TABLE OF CONTENTS
MFC BANCORP LTD. (FORMERLY MFC INDUSTRIAL LTD.)
NOTES TO CONSOLIDATED FINANCIAL STATEMENTS
DECEMBER 31, 2015
Note 29. Subsequent Event (continued) As part of the Group, the Bank will not engage in retail banking, commercial banking or universal banking, butinstead will provide specialty banking services and focus on structured and trade finance to the Group’s customers,suppliers, and group members, among others. In order to maintain a variable cost structure, the Bank will outsourcemajor back office services as well as internal functions such as technology, internal audit and payment services tothird parties.
Pursuant to the transaction, the Group acquired the Bank for total purchase consideration of $142,417 whichequaled the fair values of the identifiable assets acquired and the liabilities assumed on the closing date.
This acquisition was not considered as a material business combination.
Note 30. Approval of Consolidated Financial Statements
These consolidated financial statements were approved by the Board of Directors and authorized for issue onMay 2, 2016.
136

* Incorporated by reference from our Form 20-Fs filed in prior years.
TABLE OF CONTENTS
ITEM 19: EXHIBITS
Exhibits Required by Form 20-F
Exhibit Number Description1.1 Amended and Restated Articles of MFC Bancorp Ltd. dated November 14, 2014. Incorporated by
reference from our Form 6-K dated November 14, 2014.
1.2 Certificate of Change of Name dated February 16, 2016 of MFC Bancorp Ltd. Incorporated byreference from our Form 6-K dated February 16, 2016.
1.3 Advance Notice Policy adopted by board of directors of MFC Bancorp Ltd. on November 18, 2013.Incorporated by reference from our Form 6-K dated November 19, 2013.
4.1 Amendment to Mining Lease Agreement dated January 1, 1987 between MFC Bancorp Ltd. andWabush Iron Co. Limited, Stelco Inc. and Dofasco Inc. Incorporated by reference from our Form 10-Kfor the year ended December 31, 1989.
4.2 Memorandum of Agreement dated November 24, 1987 between MFC Bancorp Ltd. and Wabush IronCo. Limited, Stelco Inc. and Dofasco Inc. Incorporated by reference from our Form 10-K for the yearended December 31, 1989.
4.3 First Amendment to the Memorandum of Agreement between MFC Bancorp Ltd. and Wabush IronCo. Limited, Stelco Inc. and Dofasco Inc. Incorporated by reference from our Form 10-K for the yearended December 31, 1989.
4.4 Amended 1997 Stock Option Plan. Incorporated by reference from our Form S-8 dated May 23, 2007.
4.5 2008 Equity Incentive Plan. Incorporated by reference from our Form F-4 dated October 7, 2010.
4.6 Mutual Settlement Agreement between MFC Bancorp Ltd., Peter Kellogg and IAT ReinsuranceCompany, Ltd. dated February 7, 2014. Incorporated by reference from our Form 6-K datedFebruary 10, 2014.
4.7 2014 Equity Incentive Plan. Incorporated by reference from our Form 6-K dated October 10, 2014.
8.1 List of significant subsidiaries of MFC Bancorp Ltd. as at May 2, 2016.
11.1* Code of Business Conduct and Ethics and Insider Trading Policy.
12.1 Certification of Chief Executive Officer pursuant to Section 302 of the Sarbanes-Oxley Act of 2002.
12.2 Certification of Chief Financial Officer pursuant to Section 302 of the Sarbanes-Oxley Act of 2002.
13.1 Certification of Chief Executive Officer pursuant to 18 U.S.C. section 1350, as adopted pursuant toSection 906 of the Sarbanes-Oxley Act of 2002.
13.2 Certification of Chief Financial Officer pursuant to 18 U.S.C. section 1350, as adopted pursuant toSection 906 of the Sarbanes-Oxley Act of 2002.
15.1 Consent dated May 2, 2016 of PricewaterhouseCoopers LLP.
15.3 Third Party Report on Reserves.
15.4 Consent dated May 2, 2016 of GLJ Petroleum Consultants Ltd.
16.1 Mine Safety and Health Administration Safety Data.
137

TABLE OF CONTENTS
SIGNATURES
The registrant hereby certifies that it meets all of the requirements for filing on Form 20-F and that it has dulycaused and authorized the undersigned to sign this annual report on its behalf.
Date: May 2, 2016
MFC BANCORP LTD.
/s/GerardoCortina
Gerardo Cortina President and Chief Executive Officer
138

(1) Percentages rounded to nearest whole number. Our proportional voting interests are identical to our proportional beneficialinterests, except for a non-wholly owned subsidiary in Africa from which we derive a 100% beneficial interest resulting from ourshareholder loan.
Exhibit 8.1
MFC BANCORP LTD.
LIST OF SIGNIFICANT SUBSIDIARIES AS AT MAY 2, 2016
Subsidiaries Country of
Incorporation
Proportion of Voting
Interest MFC Commodities GmbH Austria 100MFC Trade & Financial Services GmbH Austria 100IC Managementservice GmbH Austria 100International Trade Services GmbH Austria 100MFC Commodities Trading GmbH Austria 100MFC Metal Trading GmbH Austria 100Kasese Cobalt Company Limited Uganda 75MFC (A) Ltd Marshall Islands 100MFC (D) Ltd Marshall Islands 100M Financial Corp. Barbados 100MFC Corporate Services AG Switzerland 100GPT Global Pellets Trading GmbH Austria 100MFC Power Limited Partnership Canada 100MFC Resources Inc. U.S. 100Possehl Mexico S.A. de C.V. Mexico 100MFC Holding Norway AS Norway 100Fesil AS Norway 100Fesil Sales AS Norway 100Fesil Rana Metall AS Norway 100Fesil Sales GmbH Germany 100Fesil Sales SA Luxembourg 100F.J. Elsner Trading Gesellschaft mbH Austria 100MFC Merchant Bank Limited Malta 100Mednet (Shanghai) Medical Technical Developing Co. Ltd. China 100Hangzhou Zhe-er Optical Co. Ltd. China 51
Note:
(1)
%%%%%%%%%%%%%%%%%%%%%%%%%

1. I have reviewed this annual report on Form 20-F of MFC Industrial Ltd.;
2. Based on my knowledge, this report does not contain any untrue statement of a material fact or omit tostate a material fact necessary to make the statements made, in light of the circumstances under whichsuch statements were made, not misleading with respect to the period covered by this report;
3. Based on my knowledge, the financial statements, and other financial information included in this report,fairly present in all material respects the financial condition, results of operations and cash flows of thecompany as of, and for, the periods presented in this report;
4. The company’s other certifying officer and I are responsible for establishing and maintaining disclosurecontrols and procedures (as defined in Exchange Act Rules 13a-15(e) and 15d-15(e)) and internal controlover financial reporting (as defined in Exchange Act Rules 13a-15(f) and 15d-15(f)) for the company andhave:
a. Designed such disclosure controls and procedures, or caused such disclosure controls andprocedures to be designed under our supervision, to ensure that material information relating to thecompany, including its consolidated subsidiaries, is made known to us by others within thoseentities, particularly during the period in which this report is being prepared;
b. Designed such internal control over financial reporting, or caused such internal control overfinancial reporting to be designed under our supervision, to provide reasonable assurance regardingthe reliability of financial reporting and the preparation of financial statements for external purposesin accordance with generally accepted accounting principles;
c. Evaluated the effectiveness of the company’s disclosure controls and procedures and presented inthis report our conclusions about the effectiveness of the disclosure controls and procedures, as ofthe end of the period covered by this report based on such evaluation; and
d. Disclosed in this report any change in the company’s internal control over financial reporting thatoccurred during the period covered by the annual report that has materially affected, or is reasonablylikely to materially affect, the company’s internal control over financial reporting; and
5. The company’s other certifying officer and I have disclosed, based on our most recent evaluation ofinternal control over financial reporting, to the company’s auditors and the audit committee of thecompany’s board of directors (or persons performing the equivalent functions):
a. All significant deficiencies and material weaknesses in the design or operation of internal controlover financial reporting which are reasonably likely to adversely affect the company’s ability torecord, process, summarize and report financial information; and
b. Any fraud, whether or not material, that involves management or other employees who have asignificant role in the company’s internal control over financial reporting.
EXHIBIT 12.1
SARBANES-OXLEY CEO CERTIFICATION
I, Gerardo Cortina, certify that:
Date: May 2, 2016
By: /s/ Gerardo Cortina Gerardo Cortina Title: Chief Executive Officer

1. I have reviewed this annual report on Form 20-F of MFC Industrial Ltd.;
2. Based on my knowledge, this report does not contain any untrue statement of a material fact or omit tostate a material fact necessary to make the statements made, in light of the circumstances under whichsuch statements were made, not misleading with respect to the period covered by this report;
3. Based on my knowledge, the financial statements, and other financial information included in this report,fairly present in all material respects the financial condition, results of operations and cash flows of thecompany as of, and for, the periods presented in this report;
4. The company’s other certifying officer and I are responsible for establishing and maintaining disclosurecontrols and procedures (as defined in Exchange Act Rules 13a-15(e) and 15d-15(e)) and internal controlover financial reporting (as defined in Exchange Act Rules 13a-15(f) and 15d-15(f)) for the company andhave:
a. Designed such disclosure controls and procedures, or caused such disclosure controls andprocedures to be designed under our supervision, to ensure that material information relating to thecompany, including its consolidated subsidiaries, is made known to us by others within thoseentities, particularly during the period in which this report is being prepared;
b. Designed such internal control over financial reporting, or caused such internal control overfinancial reporting to be designed under our supervision, to provide reasonable assurance regardingthe reliability of financial reporting and the preparation of financial statements for external purposesin accordance with generally accepted accounting principles;
c. Evaluated the effectiveness of the company’s disclosure controls and procedures and presented inthis report our conclusions about the effectiveness of the disclosure controls and procedures, as ofthe end of the period covered by this report based on such evaluation; and
d. Disclosed in this report any change in the company’s internal control over financial reporting thatoccurred during the period covered by the annual report that has materially affected, or is reasonablylikely to materially affect, the company’s internal control over financial reporting; and
5. The company’s other certifying officer and I have disclosed, based on our most recent evaluation ofinternal control over financial reporting, to the company’s auditors and the audit committee of thecompany’s board of directors (or persons performing the equivalent functions):
a. All significant deficiencies and material weaknesses in the design or operation of internal controlover financial reporting which are reasonably likely to adversely affect the company’s ability torecord, process, summarize and report financial information; and
b. Any fraud, whether or not material, that involves management or other employees who have asignificant role in the company’s internal control over financial reporting.
EXHIBIT 12.2
SARBANES-OXLEY CFO CERTIFICATION
I, Samuel Morrow, certify that:
Date: May 2, 2016
By: /s/ Samuel Morrow Samuel Morrow Title: Chief Financial Officer

(i) the Annual Report fully complies with the requirements of Section 13(a) or 15(d) of the SecuritiesExchange Act of 1934, as amended; and
(ii) the information contained in the Annual Report fairly presents, in all material respects, the financialcondition and results of operations of the Company.
EXHIBIT 13.1
CERTIFICATION OF
CHIEF EXECUTIVE OFFICER
PURSUANT TO
18 U.S.C. SECTION 1350,
AS ADOPTED PURSUANT TO
SECTION 906 OF THE SARBANES-OXLEY ACT OF 2002
In connection with the annual report of MFC Industrial Ltd. (the “Company”) on Form 20-F for the year endedDecember 31, 2015, as filed with the Securities and Exchange Commission on the date hereof (the “AnnualReport”), I, Gerardo Cortina, as Chief Executive Officer of the Company, hereby certify pursuant to 18 U.S.C.Section 1350, as adopted pursuant to Section 906 of the Sarbanes-Oxley Act of 2002, that, to the best of myknowledge:
Date: May 2, 2016
/s/GerardoCortinaBy: Gerardo Cortina Title: Chief Executive Officer
ThiscertificationaccompaniesthisAnnualReportpursuanttoSection906oftheSarbanes-OxleyActof2002andshallnot,excepttotheextentrequiredbysuchAct,bedeemedfiledbytheCompanyforpurposesofSection18oftheSecuritiesExchangeActof1934,asamended(the“ExchangeAct”).SuchcertificationwillnotbedeemedtobeincorporatedbyreferenceintoanyfilingundertheSecuritiesActof1933,asamended,ortheExchangeAct,excepttotheextentthattheCompanyspecificallyincorporatesitbyreference.

(i) the Annual Report fully complies with the requirements of Section 13(a) or 15(d) of the SecuritiesExchange Act of 1934, as amended; and
(ii) the information contained in the Annual Report fairly presents, in all material respects, the financialcondition and results of operations of the Company.
EXHIBIT 13.2
CERTIFICATION OF
CHIEF FINANCIAL OFFICER
PURSUANT TO
18 U.S.C. SECTION 1350,
AS ADOPTED PURSUANT TO
SECTION 906 OF THE SARBANES-OXLEY ACT OF 2002
In connection with the annual report of MFC Industrial Ltd. (the “Company”) on Form 20-F for the year endedDecember 31, 2015, as filed with the Securities and Exchange Commission on the date hereof (the “AnnualReport”), I, Samuel Morrow, as Chief Financial Officer of the Company, hereby certify pursuant to 18 U.S.C.Section 1350, as adopted pursuant to Section 906 of the Sarbanes-Oxley Act of 2002, that, to the best of myknowledge:
Date: May 2, 2016
/s/SamuelMorrowBy: Samuel Morrow Title: Chief Financial Officer
ThiscertificationaccompaniesthisAnnualReportpursuanttoSection906oftheSarbanes-OxleyActof2002andshallnot,excepttotheextentrequiredbysuchAct,bedeemedfiledbytheCompanyforpurposesofSection18oftheSecuritiesExchangeActof1934,asamended(the“ExchangeAct”).SuchcertificationwillnotbedeemedtobeincorporatedbyreferenceintoanyfilingundertheSecuritiesActof1933,asamended,ortheExchangeAct,excepttotheextentthattheCompanyspecificallyincorporatesitbyreference.

Exhibit 15.1
Consent of Independent Auditor
We hereby consent to the incorporation by reference in the registration statements on Form S-8 (Nos. 333-143183and 333-171009) of MFC Bancorp Ltd. of our report dated May 2, 2016 relating to the financial statements and theeffectiveness of internal control over financial reporting of MFC Bancorp Ltd., which appears in this Form 20-F.
(signed)PricewaterhouseCoopersLLP
Chartered Professional Accountants Vancouver, British Columbia May 2, 2016

Exhibit 15.3


Exhibit 15.4

Exhibit 16.1
Disclosure of Mine Safety and Health Administration (MSHA) Safety Data
MFC Bancorp Ltd.’s Pea Ridge Mine in the United States is subject to regulation by MSHA under the United StatesFederal Mine Safety and Health Act of 1977 (the “Mine Act”). MSHA inspects mines and issues various citationsand orders when it believes a violation has occurred under the Mine Act, and it typically proposes a civil penalty, orfine, related to the alleged violation.
The following disclosures are provided pursuant to Section 1503(a) of the Dodd-Frank Wall Street Reform andConsumer Protection Act (“Dodd-Frank”), which requires certain disclosures by companies operating minesregulated under the Mine Act and which are required to file periodic reports under the SecuritiesExchangeActof1934.
During the year ended December 31, 2015, the Pea Ridge Mine did not receive a written notice from MSHA of (a)a pattern of violations of mandatory health or safety standards that are of such nature as could have significantlyand substantially contributed to the cause and effect of mine health or safety hazards under section 104(e) of theMine Act or (b) the potential to have such a pattern.
The information in the table below reflects citations and orders issued by MSHA inspectors to the relevant PeaRidge Mine site during the year ended December 31, 2015. This data may not match or reconcile with the dataMSHA maintains on its public website.
In evaluating this information, consideration should be given to factors such as: (a) the number of citations andorders may vary depending on the size, nature of operations and operational status of the mine, (b) the number ofcitations issued may vary from inspector to inspector and mine to mine, and (c) citations and orders may becontested and appealed, a process which may result in a reduction in severity and amount, or they might bedismissed.
Mine Safety Disclosures
Mine Act Section 104 – Significant and Substantial Citations -Mine Act Section 104(b) Orders -Mine Act Section 104(d) Citations and Orders -Mine Act Section 110(b)(2) Flagrant Violations -Mine Act Section 107(a) Imminent Danger Orders -Total US$ Value of Proposed MSHA Assessments $100Total Number of Mining Related Fatalities -Received Notice of Pattern of Violations Under Mine Act Section 104(e) NoReceived Notice of Potential to Have Pattern of Violations Under Mine Act Section 104(e) NoTotal number of pending legal actions before the Federal Mine Safety and Health Review Commission
(“FMSHRC”) -Number of pending contests of citations and orders -Number of pending contests of proposed penalties -Number of pending complaints for compensation -Number of pending complaints of discharge -Number of pending applications for temporary relief -Number of pending appeals of judges’ decisions or orders to the FMSHRC -Total number of legal actions instituted by the FMSHRC -Total number of legal actions before the FMSHRC resolved -