i supersonic linear i i - ntrs.nasa.gov · nasa technical paper 1539 i 'i f il application of...
TRANSCRIPT

NASA Technical Paper 1539
i ' I
f il
Application of Supersonic Linear I I
Theory and Hypersonic Impact Methods to Three Nonslender
,.(, 'i . ~ ~-
2 P
Hypersonic Airplane Concepts at Mach Numbers From 1.10 to 2.86
, - -
Jimmy L. Pittman
DECEMBER 1979
L
https://ntrs.nasa.gov/search.jsp?R=19800003815 2018-05-27T03:29:48+00:00Z

TECH LIBRARY KAFB, NM
NASA Technical Paper 1539
Application of Supersonic Linear Theory and Hypersonic Impact Methods to Three Nonslender Hypersonic Airplane Concepts at Mach Numbers From 1.10 to 2.86
Jimmy L. Pittman Langley Research Center Hampton, Virginia
National Aeronautics and Space Administration
Scientific and Technical Information Branch
1979

SUMMARY
Aerodynamic predictions from supersonic linear theory and hypersonic impact theory were compared w i t h experimental data for three hypersonic research airplane concepts over a Mach number range from 1 . 1 0 t o 2.86. The linear theory gave good l i f t prediction and f a i r t o good pitching-moment pre- diction over the Mach number (M) range. The tangent-cone theory predictions were .good for l i f t and f a i r t o good for pitching moment for M >= 2.0. The combined tangent-cone/tangent-wedge theory (tangent cone for the fuselage; tangent wedge for the wing and t a i l ) gave t h e least accurate prediction of l i f t and pitching manent. For all theories, the zero-lif t drag was overesti- mated, especially for Mach numbers below 2.0. The linear theory drag predic- tion was generally poor, w i t h areas of good agreement only for M 6 1 . 2 . The inaccuracy of the zero-lift drag prediction from linear theory resulted prin- cipally because the slender-body assumptions necessary to calculate wave drag are violated by low-fineness-ratio bodies. For M >= 2.0, the tangent-cone method predicted the zero-lift drag most accurately. The errors i n zero-lif t drag prediction from t h i s method for M 2 2.0 were less than 1 0 percent for two of the concepts, but 23 to 28 percent for the third concept.
INTRODUCTION
I n recent years a number of design concepts have been proposed for hyper- sonic research airplanes. I n order to evaluate the merits of a configuration, it is necessary to determine the aerodynamic characterist ics of the configura- t ion a t off-design speeds as well as a t the cruise Mach number. T h i s evalua- tion is presently accomplished through extensive wind-tunnel testing. Analytic methods can shorten the design cycle and reduce t e s t requirements; however, an assessment of the accuracy of the analytic methods requires that an extensive data base be developed and compared w i t h appropriate theories.
Impact theories have been shown to be fairly accurate for longitudinal aerodynamic character is t ics a t Mach 6 ( refs . 1 and 21, but the lower Mach num- ber limit of their applicabili ty to t h i s class of vehicles is not known. The accuracy of the vortex-lattice theory (ref. 3) a t low subsonic Mach numbers has also been shown to be good for t h i s type of airplane (refs. 1 and 4 ) . The supersonic region is important because the peak drag, which is an important factor for propulsion system s i z i n g , usually occurs between Mach 1 . 0 and 1.5 . A cursory analysis of the abi l i ty of linearized supersonic theory to predict the supersonic longitudinal characteristics for several hypersonic research vehicle concepts was made i n reference 1 , b u t a more detailed analysis is required. Therefore, it is the purpose of t h i s s tudy to compare supersonic linear theory and hypersonic impact theory w i t h transonic and supersonic data i n order to determine t h e accuracy of these methods for t h i s class of airplane.
A typical concept features a low-fineness-ratio fuselage w i t h a b lun t base which houses a rocket nozzle, as shown i n figure 1 . The concepts studied

involve an a i r launch which poses s e v e r e r e s t r a i n t s on t h e wing span, fuselage l eng th , and gross .weight . The result is a c o n f i g u r a t i o n w h i c h v i o l a t e s t h e slender-body assumption of supe r son ic l i nea r t heo ry and for which the appl ica- b i l i t y of t y p i c a l s u p e r s o n i c m e t h o d s ( e . g . , r e f s . 5 to 7) is not proven.
This paper p r e s e n t s force and moment d a t a o b t a i n e d i n t h e L a n g l e y 8-foot t r a n s o n i c pressure t u n n e l (8'TPT) and the Lang ley Un i t a ry P l an wind tunne l (UPWII) for th ree a i r - l aunched rocke t -boos ted hype r son ic r e sea rch a i rp l ane concep t s ( r e f s . 1 and 8 to 1 0 ) . Some of t h e data are unpublished and were ob ta ined by J i m A. Penland and James L. D i l l o n of Langley Research Center (LaRC). The data are compared w i t h t h e l i n e a r i z e d s u p e r s o n i c t h e o r y of refer- ences 6 and 7; they are also compared wi th the t angent -cone empirical theory, the tangent-wedge theory (oblique shock) , and the Prandt l -Meyer theory found i n r e f e r e n c e s 11 and 12. The appendix, by C. L. W. Edwards, describes t h e ve r s ion of the tangent-cone approximation developed a t LaRC.
SYMBOLS
Measurements and calculations were made i n U.S. Cus tunary Uni t s . They are p resen ted he re in i n t he In t e rna t iona l Sys t em o f Un i t s (SI) and also i n U.S. Custanary Units .
CD
c D , c
cD ,f
c D , i
cD,o
cD ,W
CL
CL ,o
cLCY
Cm
a%/acL
Cm, o
cmcr cP
z
2
d r a g c o e f f i c i e n t , Drag/qS
camber d r a g c o e f f i c i e n t
f r i c t i o n d r a g c o e f f i c i e n t
i n v i s c i d d r a g c o e f f i c i e n t
z e r o - l i f t d r a g c o e f f i c i e n t
wave d r a g c o e f f i c i e n t
l i f t c o e f f i c i e n t , Lif t/qS
l i f t c o e f f i c i e n t a t CY = Oo
l i f t - c u r v e slope, a C L / k i a t CL = 0 , deg-l
p i tch ing-moment coef f ic ien t , P i tch ing munent/qSZ
l o n g i t u d i n a l s t a b i l i t y p a r a m e t e r a t Cm = 0
pi tching-moment coeff ic ient a t CL, = 0
l o n g i t u d i n a l s t a b i l i t y parameter, aC,,,/aCY a t C, = 0, deg-l
p r e s s u r e c o e f f i c i e n t (see appendix)
body l eng th , cm ( i n . )

9 ." r
L/D l i f t - d r a g r a t io
M f ree-s t ream Mach number
Mns Mach number normal to shock (see appendix)
P t s t a g n a t i o n pressure, kPa (psia)
9 dynamic pressure, Pa (psia)
S r e f e r e n c e area, m2 (in21
T t s t agna t ion t empera tu re , K ( O R )
X,Y d i s t ances a long body axes
a ang le o f attack, deg
6 Newtonian impact angle, deg (see appendix)
S u b s c r i p t :
LaRC Langley Research Center
Abbreviations:
c .g . cen ter o f g rav i ty
HL h i n g e l i n e
LT l i n e a r t h e o r y
TC tangent cone
TC/TW tangent cone/ tangent wedge
UPWT Langley Unitary Plan wind t u n n e l
8 'TPT Langley 8-foot t ransonic pressure t u n n e l
METHOD OF ANALYSIS
There are s e v e r a l computer p r o g r a m s a v a i l a b l e f o r t h e p r e d i c t i o n of super- sonic aerodynamics. The l inear theory p rograms of re fe rences 6 and 7 i n con- junc t ion w i th t he sk in - f r i c t ion p rog ram of r e f e r e n c e 5 are widely used a t Langley Research Center. The u t i l i t y of t h i s p r o c e d u r e h a s b e e n v e r i f i e d f o r h igh - f ineness - r a t io supe r son ic t r anspor t (SST) class conf igu ra t ions and also f o r f i g h t e r airplanes which have a lower f i n e n e s s ratio t h a n t h e SST ( r e f s . 13 and 1 4 ) .
3

Lif t , pitching-moment, and drag-due-to-lift estimates are calculated by the' planar method of reference 7 . The mean camber surface of the body and wing is input to t h i s program, but the vertical tail surfaces, which can contribute to the pitching moment, are ignored i n t h i s analysis.
The drag buildup is accomplished by properly summing the output f r m ref- erences 5, 6, and 7, as seen i n f igure 2(a) . The calculated drag a t zero l i f t consists of friction drag from reference 5, wave or pressure drag due to volume a t o! = Oo from reference 6, and camber drag a t z e r o . l i f t from reference 7 . When the l i f t is nonzero, there is a drag-due-to-lift term from reference 7 .
Impact theory, which has been shown to be fairly accurate for the predic- tion of longitudinal aerodynamic coefficients on configurations of t h i s class a t M = 6 (refs. 1 and 2) , is another method of analysis. Many impact theo- ries are available i n references 11 and 12. Two of these methods were evalu- ated to determine their lower Mach number limit. A skin-friction calculation based on the work of Eckert (ref. 15) is also available i n references 11 and 12. The f inal resul t from t h i s computer program is . the total l i f t , drag, and pitch- ing moment for the total configuration, since .the actual surface is modeled. The drag buildup from t h i s method is i l lustrated i n figure 2 ( b ) . The program calculates the aerodynamics of the various body components separately, as though each acted independently i n the free stream. T h i s allows the contribu- tion of each component to the total forces to be evaluated, b u t no interference effects are calculated.
The impact theories used were tangent-cone empirical on the body and tangent wedge (oblique shock) on the wing and ta i l surfaces . A t Mach numbers below 3.0, the s k i n f r ic t ion was calculated by Eckert's method. Prandtl-Meyer flow was assumed on the expansion surfaces, where the minimum expansion pres- sure coefficient was l imited to - l /M2 on the basis of the work of Mayer ( ref . 1 6 ) . Also evaluated was the tangent-cone empirical method on a l l configuration components. The tangent-cone empirical method of analysis is hereafter referred to as TC, the linear theory analysis of references 5 t o 7 is referred to as LT, and the tangent-cone/tangent-wedge method i s referred to as TC/TW.
Another advantage of the methods chosen for t h i s analysis was that a com- mon surface geometry could be modified automatically to the proper format of each program. The numerical representation of the wind-tunnel model geometries was specified by the method of reference 17. Additional coding is available to translate the surface geometry t o the appropriate input format for each partic- ular program used.
I n each method of analysis, there occurred input problems which resulted i n some minor b u t necessary modifications to the numerical models. The prob- lems w i t h t h e wave-drag predictions from reference 6 can best be explained when preceded by a short description of the method.
The wave drag due to volume i s obtained through t h e use of the supersonic area rule and the Von Kkmiin slender-body theory. I n t h i s procedure, cutting planes which l i e on the Mach plane are passed through the configuration t o obtain an equivalent axisymmetric body a t each Mach number. If the airplane is
4

p' .! rolled a b o u t t h e l o n g i t u d i n a l r e f e r e n c e a x i s (a = Oo), t h e r e s u l t i n g e q u i v a -
l e n t body is d i f f e r e n t from t h e e q u i v a l e n t body o b t a i n e d a t another r o l l angle . (See f i g . 1 of ref. 6.) Then, i n t h e o r y , t h e r e are a n i n f i n i t e number of equiv- a len t ax isymmetr ic bodies a t each Mach number. Applying slender-body theory to a number of e q u i v a l e n t b o d i e s r e s u l t s i n a number of wave drags which are i n t e - gra ted and averaged to o b t a i n a c o n f i g u r a t i o n wave drag a t a Mach number.
The f i rs t problem wi th the s lender -body theory occur red because of t h e requi rement tha t the body l i e w i t h i n t h e local Mach cone. The program checks body slopes between the input cross s e c t i o n s to e n s u r e t h a t no body slope exceeds the free-stream Mach angle . Minor body mod i f i ca t ions such as extend- ing the semihemispherical nose t o a s h a r p p o i n t were allowed i n o r d e r to o b t a i n a s o l u t i o n a t lmer Mach numbers, but i n t h o s e i n s t a n c e s t h e e x t e n t of body modif icat ions had t o be l imi t ed . A s t h e Mach number i n c r e a s e d , t h e s e v e r i t y of t h i s problem grew as a r e s u l t of t h e s h r i n k i n g Mach cone ; t he re fo re , no fu r the r body modi f ica t ions ,were a t tempted . For the numer ica l models of concepts A and C, t h e local body slopes exceeded the Mach a n g l e a t these h ighe r Mach numbers and t hus i nva l ida t ed t he wave -d rag estimates.
A second problem i n t h e wave-drag p r e d i c t i o n w a s t h a t t h e t h e o r e t i c a l l y de te rmined angle o f a t t ack f o r z e r o l i f t was n o t Oo. Changes i n t h e wave d r a g w i t h l i f t are accounted for by the methods o f re fe rence 7. The re fo re , t he estimate of wave drag due to volume should be determined a t t h e a n g l e of z e r o l i f t . To obtain the proper wave-drag estimate, t h e t h e o r e t i c a l l y d e t e r m i n e d ang le o f at tack for z e r o l i f t was added to t h e c u t t i n g p l a n e or Mach a n g l e f o r a p o s i t i v e r o l l a n g l e of 90°. Conversely, for a n e g a t i v e r o l l a n g l e o f 90° t h e a n g l e of attack for z e r o l i f t was s u b t r a c t e d from t h e c u t t i n g p l a n e a n g l e . The c o r r e c t i o n to t h e Mach a n g l e for r o l l angles between ?90° is simply a l i n e a r v a r i a t i o n o f t h e a n g l e for z e r o l i f t wi th ro l l angle , as t h e r e is no c o r r e c t i o n for z e r o r o l l a n g l e . I n t e g r a t i o n o f t h e wave d r a g f o r t h e v a r i o u s r o l l a n g l e s y i e l d s an estimate of wave drag due t o volume a t c1 # Oo.
The problem assoc ia ted wi th the t angent -wedge approximat ion resu l ted from t h e d e c r e a s e i n d e f l e c t i o n a n g l e for shock detachment with decreasing Mach num- be r . A detached shock caused t h e p a n e l p r e s s u r e c o e f f i c i e n t to be c a l c u l a t e d by t h e method of r e f e r e n c e 18 , which is intended for high-speed flow o n l y . I n order to e x t e n d t h i s a n a l y s i s to t h e lowest Mach number possible, it was neces- s a r y to remove t h e l e a d i n g - e d g e b l u n t n e s s f r o m t h e v e r t i c a l - t a i l s u r f a c e s a t M = 2.00 and M = 2.36. The r e s u l t i n g d r a g error c o n s t i t u t e d a small percent- a g e o f t h e o v e r a l l d r a g f o r t h i s class o f v e h i c l e s . The a n a l y s i s u s i n g t h e tangent-wedge theory was not ex tended b e l o w M = 2.00 because of t h e f u r t h e r d e c r e a s e i n t h e a n g l e for shock detachment.
A similar problem arose fo r t he t angen t - cone t heo ry , bu t t he cone ang le s for shock detachment are much l a r g e r t h a n t h o s e for a wedge a t t h e same Mach number. The numer i ca l r ep resen ta t ion of t h e t a n g e n t - c o n e t h e o r y i n refer- ences 11 and 12 has been improved a t LaRC. (See the appendix.) These changes allow more accurate estimates to be o b t a i n e d a t M > 1 for the unmodif ied geometry i n i n v i s c i d f l a w . A t M 2.0, the tangent-cone parameters necessary for t h e s k i n - f r i c t i o n c a l c u l a t i o n c o u l d n o t be o b t a i n e d . T h e r e f o r e , t h e s k i n f r i c t i o n or v iscous drag was c a l c u l a t e d by t h e method of reference 5, which was also used i n LT.
5

There are t w o major d i f f e rences be tween t he two methods of c a l c u l a t i n g . s k i n f r i c t i o n . The means o f ob ta in ing the re fe rence t empera ture of t h e bound- a r y l a y e r is one d i f f e rence . The o t h e r d i f f e r e n c e is that the program of ref- erences 11 and 1 2 c a l c u l a t e s t h e s k i n f r i c t i o n o n e a c h surface panel a t each angle o f at tack, while the program used to calculate t h e s k i n - f r i c t i o n d r a g based on the method of reference 5 assumes a = Oo. However, t h e s k i n - f r i c t i o n d r a g c o e f f i c i e n t f r a n r e f e r e n c e s 11 and 1 2 was found to be e s s e n t i a l l y i n d e p e n - den t of ang le of attack. (See f i g . 2.)
DATA COMPARISON AND DISCUSSION
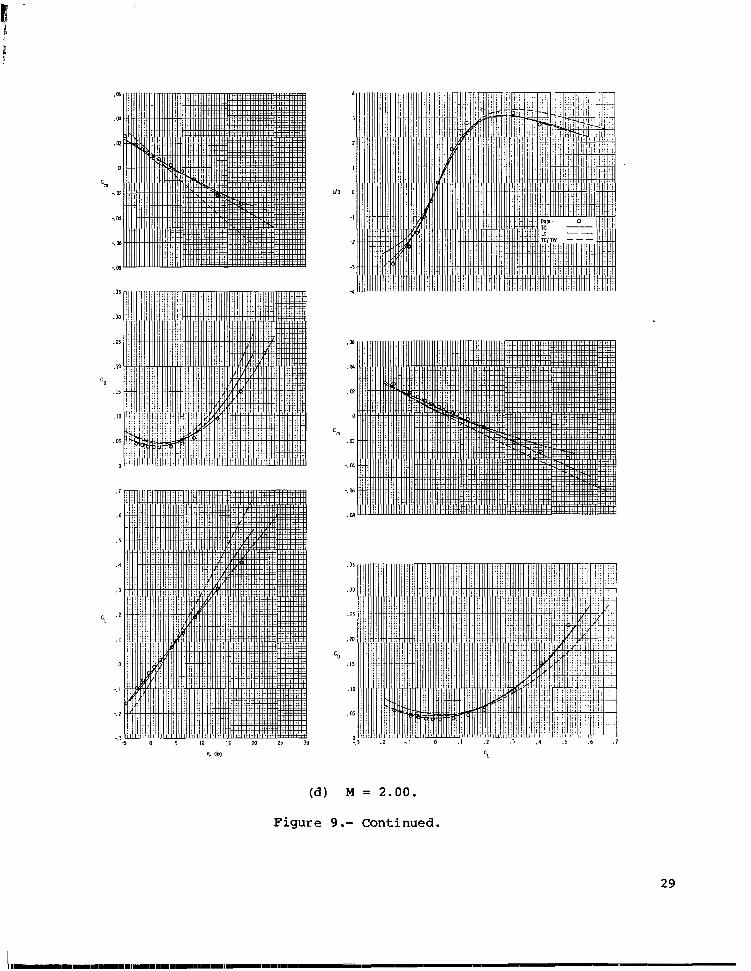
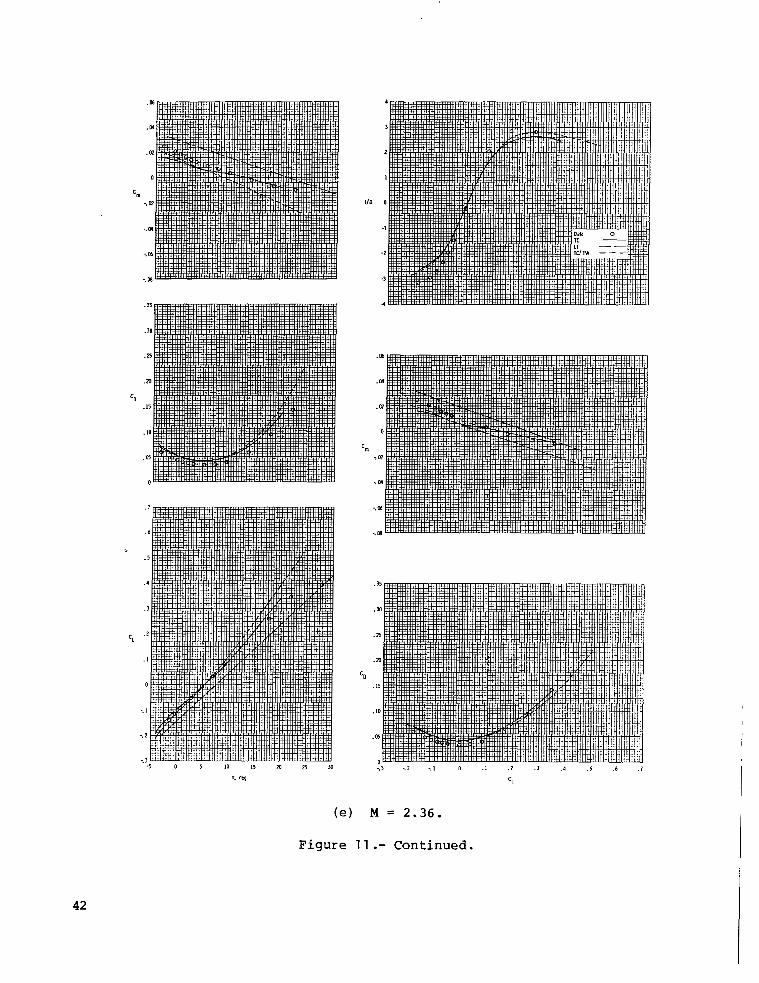
P r e s e n t e d i n table I are t h e test c o n d i t i o n s for each of t h e t h r e e con- c e p t s . Tables 11, 111, and IV p r e s e n t i m p o r t a n t g e o m e t r i c c h a r a c t e r i s t i c s of t h e wind-tunnel models f o r c o n c e p t s A, B, and C, r e s p e c t i v e l y . F i g u r e 1 is a photograph of t h e t h r e e models, f i g u r e 2 p r e s e n t s t h e d r a g b u i l d u p procedure, and f i gu res 3 to 5 presen t ske t ches o f t h e models. F igu res 6 to 8 p r e s e n t computer-generated drawings from t h e program of r e f e r e n c e 1 7 for each concept . F igu res 9 to 11 p r e s e n t t h e basic data- theory comparisons. The r e s u l t s h a v e b e e n p l o t t e d a g a i n s t CC as well as a g a i n s t CL. F igu res 1 2 to 1 9 p r e s e n t t h e summary data p l o t t e d a g a i n s t Mach number. A l l the wind-tunnel data p resen ted are corrected to a cond i t ion o f f r ee - s t r eam s ta t ic p r e s s u r e on the base.
Genera l ly , t h e summary plots are a good ind ica t ion o f t h e accuracy of the t h e o r e t i c a l methods. However, summary p l o t s do not reveal agreement with data n o n l i n e a r i t y and d i s t o r t i o n due to compensating errors. For t h i s reason, an examination of bo th t he basic data plots and t h e summary data p l o t s is necessary.
Several examples of t h i s d i s t o r t i o n c a n be cited. For a l l t h ree concep t s , TC p r e d i c t s CLcr and CD,o ( f i g s . 1 2 and 1 9 ) v e r y p o o r l y f o r M 5 1 .5. The
p r e d i c t i o n of (L/D)max ( f i g . 18) by TC is q u i t e good fo r concep t s A and B, b u t o n l y f a i r f o r c o n c e p t C. The poor p red ic t ions o f both CL and CD wi th c1 ( f i g s . 9 ( a ) t o 9 ( c ) , 1 0 ( a ) to lO(c ) , and 11 (a ) to 11 ( c ) ) compensate each o ther ; t h i s resu l t s i n good (L/DImax, a l t hough p red ic t ed (L/D)max gen- e r a l l y occurs a t a d i f f e r e n t v a l u e of CL for t h e data and for TC. Examina- t i o n of the cu rves for CL versus a and CD ve r sus a e n s u r e s t h e proper p e r s p e c t i v e f o r t h e summary (L/D)max p l o t . The summary plot of ve r sus
Mach number ( f i g . 1 4 ) shows good agreement between data and TC b u t very poor agreement between data and LT a t M = 1 . 1 0 and M = 1.20. However, examina- t i o n of t h e c u r v e for Cm ve r sus CC ( f i g s . 9 ( a ) and 9 (b ) , 1 O(a) and 1 O(b) , and 11 ( a ) and 11 ( b ) ) r e v e a l s t h e o p p o s i t e to be t r u e . The d i f f e r e n c e c a n be expla ined by t h e d i v e r g i n g n o n l i n e a r i t y both o f t h e data and t h e p r e d i c t i o n from TC. A similar problem occurs fo r concep t A a t M = 2.00, b u t i n t h i s i n s t a n c e t h e agreement of Cm, between data and TC is poor, w h i l e t h e c u r v e s
f o r C, ver sus a ( f i g . 9 (d) ) show good agreement.
6

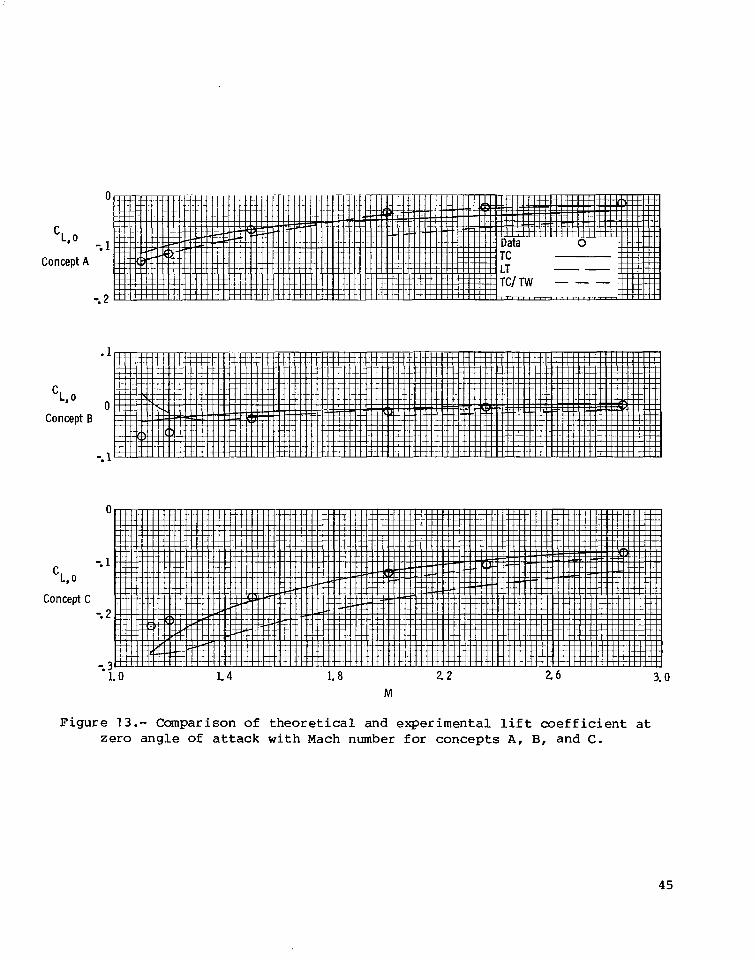
The summary p l o t f o r CLCY ve r sus Mach number ( f i g . 12) c l e a r l y shows t h e
s u p e r i o r i t y o f LT f o r l i f t p r e d i c t i o n , a r e s u l t which is b a s i c a l l y s u p p o r t e d by t h e CL,o f i g u r e ( f i g . 13) a l though t he re is a r a t h e r l a r g e s h i f t i n C L , ~ for concept C. For M 2 2.0, TC also p r e d i c t s C L ~ and CL,o f a i r l y well.
The p l o t s f o r %, C, a t CY = Oo, %,,,/~CL, and &,o ( f i g s . 14, 15, 16,
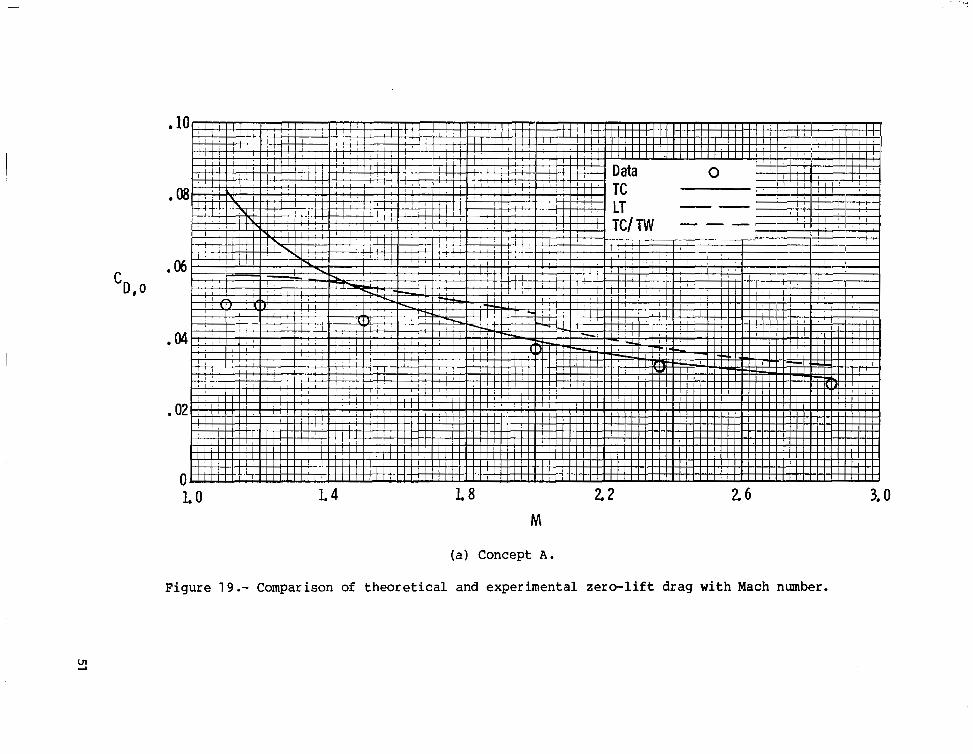
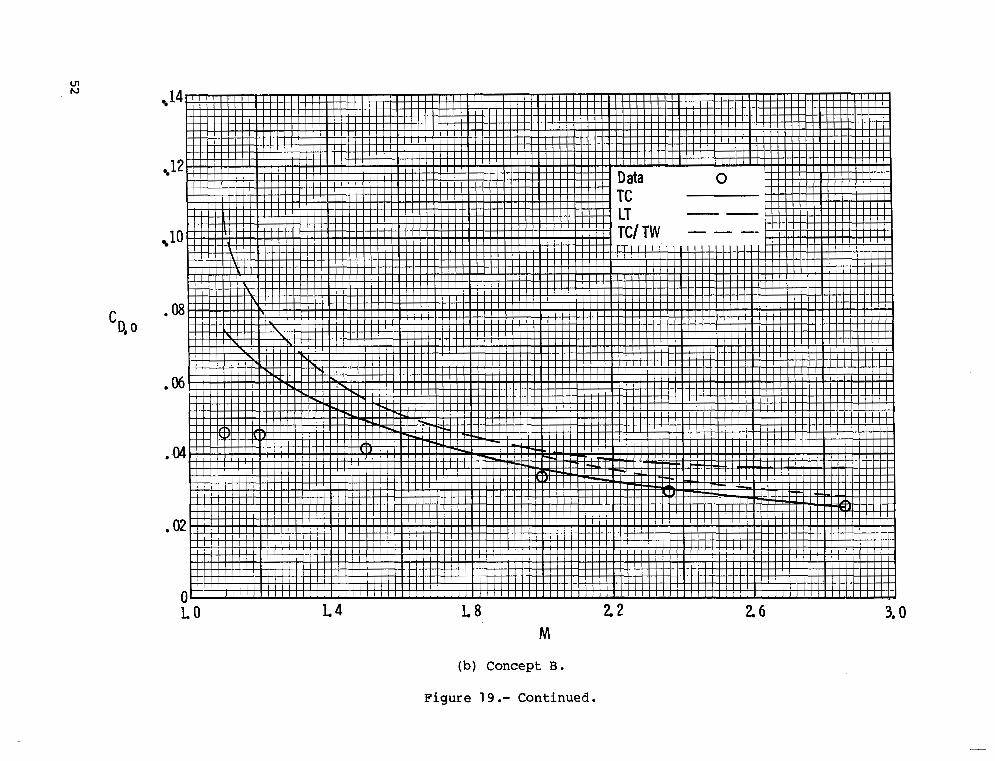
and 17, r e s p e c t i v e l y ) also tend to show LT to be g e n e r a l l y s u p e r i o r : t h e r e are many instances, however, where LT s u b s t a n t i a l l y d i v e r g e s f r o m t h e d a t a . A t t h e t r a n s o n i c Mach numbers, LT tends to g ive its worst a g r e e m e n t . T h i s r e s u l t i s to be expec ted fo r t w o reasons . Obvious ly , t ransonic f low is a mixed flow reg ion ; t he re fo re , t he gove rn ing equa t ions fo r supe r son ic l i nea r t heo ry are no t comple t e ly va l id . A l s o , t h e n u m e r i c a l g r i d g e n e r a t e d i n t h e l i f t program v a r i e s w i t h Mach number, and t h e g r i d becomes too coarse t o be accurate b e l o w M = 1 . 4 . Therefore, the good agreement between data and LT a t M = 1 .l 0 and M = 1 . 2 0 must be cons ide red fo r tu i tous . Pe rhaps t he most impor tan t resu l t to be de r ived from t h e f a i r l y good ag reemen t o f l i nea r t heo ry and da t a i n CL and C, is t h a t t h e l i n e a r t h e o r y w i t h its th in -a i r fo i l and p l ana r a s sumpt ions is still v a l i d e v e n f o r t h i s class of low-fineness-rat io , law-aspect-ratio, blunt-base, high-volume concept. The p l o t s for (L/D)max and C D , ~ ( f i g s . 18 and 19) p r e s e n t m i s l e a d i n g i n f o r m a t i o n i n c e r t a i n i n s t a n c e s , as w a s n o t e d i n the p rev ious paragraph . The p r e d i c t i o n s f o r C D , ~ and (L/D)max from LT are g e n e r a l l y poor. This r e s u l t i s d i s c u s s e d f u r t h e r i n a subsequent paragraph. For M 2 2.0, the (L/D)max p r e d i c t i o n from TC/TW is very good, b u t TC pro- v ides a more accurate C D , ~ p r e d i c t i o n .
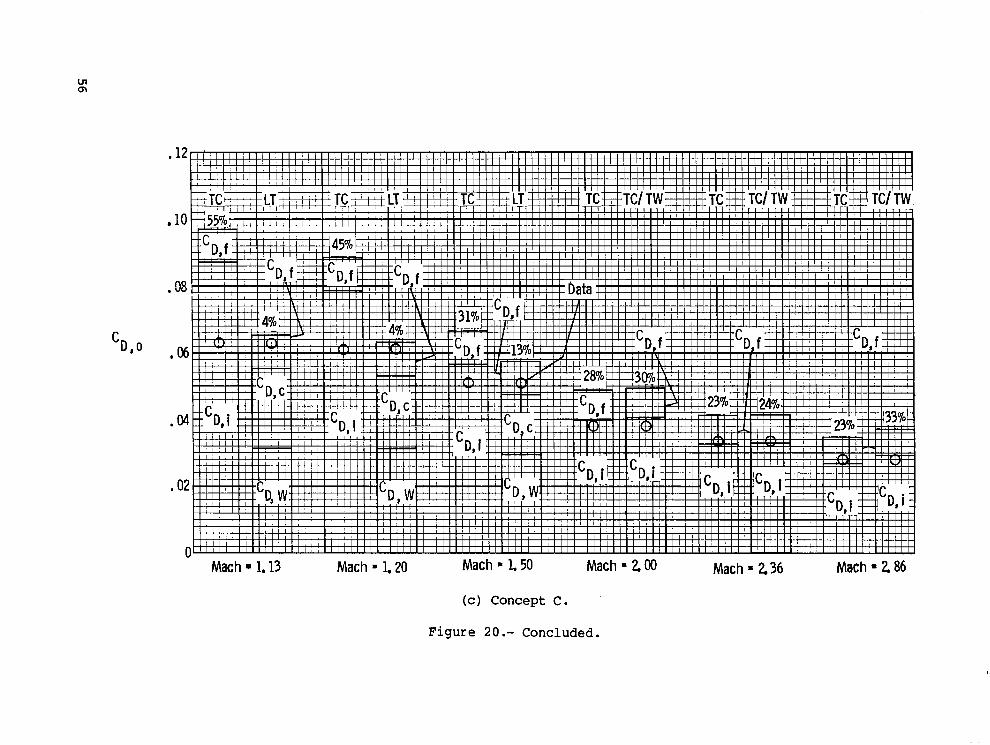
F igure 20 is a bui ldup of the components of C D , ~ for t h e three concepts . Above each bar graph , the percentage d i f fe rence be tween the estimated and the e x p e r i m e n t a l d r a g c o e f f i c i e n t s is shown. Three components make up LT: t he wave drag due to volume a t z e r o l i f t , t h e camber d rag , and t he sk in - f r i c t ion drag. For TC and TC/TW, s epa ra t ion o f t he wave drag f ran t h e camber drag is not poss ib le ; therefore, t h e components of drag are t h e i n v i s c i d a n d v i s c o u s drag. Most of t h e CD,o is invi ' sc id d rag ; for LT, t h e l a r g e r c o n s t i t u e n t of t he i nv i sc id d rag can be i d e n t i f i e d as wave drag . As expected, concept C is p r e d i c t e d t o have a l a r g e r component of camber drag than concepts A and B because concept C was the most h igh ly cambered o f t he t h ree concep t s .
The a b i l i t y o f LT to p r e d i c t C D , ~ is g e n e r a l l y poor, and most of t h e error seems to be from t h e wave-drag p r e d i c t i o n . Two facts s u p p o r t t h i s state- ment. F i r s t , a p r e v i o u s p a r a g r a p h p o i n t e d o u t t h e a b i l i t y o f t h e p l a n a r l i n e a r t heo ry t o p r e d i c t CL and Cm with good accuracy. Therefore, the camber-drag p r e d i c t i o n f r o m t h i s t h e o r y p r o b a b l y h a s t h e same accuracy. Second, the fuse- lages of these concepts have a f a i r l y law f i n e n e s s r a t io of approximately 7. The inc reas ing d i spa r i ty be tween da t a and t heo ry w i th dec reas ing f i neness r a t i o is c l e a r l y shown i n f i g u r e 4 of r e f e rence 6. The s lender-body theory used for t h e wave-drag computation assumes t h a t t h e f i n e n e s s r a t io is much g rea t e r t han
(M2 - 1 . For these bod ie s , t h i s a s sumpt ion cou ld be s a t i s f i e d o n l y a t supe r - s o n i c Mach numbers near 1. Support ing evidence for t h i s s t a t e m e n t c a n be seen i n f i g u r e 20, which shows t h e l i n e a r t h e o r y p r e d i c t i o n o f C D , ~ to be best a t
7

t h e lowest Mach numbers for concepts A and C. The un reasonab ly l a rge estimate of CD,o fo r concep t B a t t h e lower Mach number is not understood.
CONCLUDING REMARKS
Aerodynamic p red ic t ions f rom supe r son ic l i nea r t heo ry and hype r son ic impact theo ry were compared with experimental data for th ree hype r son ic r e s e a r c h a i r p l a n e c o n c e p t s o v e r t h e Mach number (M) range from 1.10 to 2.86. The l inea r t heo ry gave good l i f t p r e d i c t i o n a n d f a i r to good pitching-moment p r e d i c t i o n o v e r t h e Mach number range. The tangent -cone theory p red ic t ions were good f o r l i f t and f a i r to good f o r p i t c h i n g moment f o r M >= 2.0. The combined tangent-cone/tangent-wedge theory ( tangent cone for t h e f u s e l a g e ; tangent wedge f o r t h e wing and t a i l ) gave the least a c c u r a t e p r e d i c t i o n o f l i f t and p i t c h i n g moment. For a l l t h e o r i e s , t h e z e r o - l i f t d r a g was o v e r e s t i - m a t e d , e s p e c i a l l y f o r M < 2.0. The l i n e a r t h e o r y d r a g p r e d i c t i o n was gen- e r a l l y poor, wi th t he on ly areas of good agreement being for M 6 1.2. A major cause o f t he i naccuracy o f t he ze ro - l i f t d rag p red ic t ion from l i n e a r t h e o r y is that the s lender-body assumptions necessary to calculate wave drag are v i o l a t e d by law-f ineness-rat io bodies . For M 2 2.0 the tangent-cone method predicted t h e z e r o - l i f t d r a g most a c c u r a t e l y . The errors i n z e r o - l i f t d r a g p r e d i c t i o n from t h i s method for M b 2.0 were less than 1 0 p e r c e n t f o r t w o of t h e con- c e p t s , b u t 23 to 28 p e r c e n t f o r t h e t h i r d c o n c e p t .
Langley Research Center Nat ional Aeronaut ics and Space Adminis t ra t ion Hampton, VA 23665 October 16, 1979
8

APPENDIX
VERSION OF TANGENT-CONE APPROXIMATION DEVELOPED AT LaRC
C. L. W. Edwards Langley Research Center
The Hypersonic Arbitrary-Body Aerodynamic Computer Program (Mark I11 v e r s i o n (HABS)) developed by A. E. Gen t ry ( r e f s - . 11 and 12) contains a r o u t i n e l a b e l e d C@TE f o r a p p l y i n g c o n i c a l f l o w p r e s s u r e c o e f f i c i e n t s to geometr ic s u r f a c e s . The p r e s s u r e c o e f f i c i e n t s are de f ined by an empirical r e p r e s e n t a t i o n of s o l u t i o n s to t h e d i f f e r e n t i a l e q u a t i o n s g o v e r n i n g c o n e s a t ze ro ang le o f at tack. The e q u a t i o n f o r pressure c o e f f i c i e n t
cp = I - . + 5 \ 1 ("s
1 " I
is a funct ion of the Newtonian impact a n g l e 6 and a s o - c a l l e d " e f f e c t i v e Mach number normal to t h e shock" Mns . The a n g l e 6 is de f ined as t h e smallest angle be tween the f ree-s t ream d i rec t ion and tangents to t h e v e h i c l e s u r f a c e a t the po in t o f in te res t . Equat ion (Al ) is a p h y s i c a l r e p r e s e n t a t i o n o f Cp f o r two-dimensional oblique shock theory when t h e actual Mach number normal to t h e shock is employed. The r e l a t i o n s h i p f o r " e f f e c t i v e Mach number" p r e s e n t e d i n HABS was
Equation (A2) is a p u r e l y empirical curve f i t based on free-stream Mach number M and the Newtonian impact angle which is supposed to p r o v i d e t h e correct con- i ca l pressure c o e f f i c i e n t when employed i n e q u a t i o n (A1 ) .
The a c c u r a c y o f t h i s r e l a t i o n s h i p is shown i n t h e lower p o r t i o n of f i g - u r e AI. The s t a n d a r d f o r a c c u r a c y t a k e n h e r e is t h e c o n i c a l f l o w s o l u t i o n s o f Sims ( r e f . 1 9 ) . The p e r c e n t d e v i a t i o n i n p r e s s u r e c o e f f i c i e n t % A C p , m B ~ is de f ined as
and is p resen ted as a funct ion of Newtonian impact a n g l e f o r a n g l e s less than 30°. Exact agreement is assumed whenever the deviations are w i t h i n t h e k l per- cent bands shown o n t h e f i g u r e . The accuracy is cons idered to be a c c e p t a b l e f o r Mach numbers above 4 and impact angles above loo. However, the impact ang le s on a i r c r a f t c o n c e p t s s u c h as t h o s e p r e s e n t e d i n t h i s paper are ve ry o f t e n less than loo w i t h maximum cruise Mach numbers of 6 or less. T h i s con- d i t i o n places them i n a r e g i o n o f s i g n i f i c a n t error.
9

APPENDIX
A s a consequence of the large errors i n Cp f o r low Mach numbers and small impact ang le s , a new empirical r e l a t i o n s h i p f o r c o n i c a l p r e s s u r e c o e f f i - c i e n t s was developed and implemented in the bas ic HABS program. The o r i g i n a l r e l a t i o n s h i p f o r Cp i n terms of impact a n g l e a n d e f f e c t i v e Mach number given by equat ion (AI ) was r e t a i n e d . The r e l a t i o n s h i p f o r " e f f e c t i v e Mach number normal to the shock" M,.,s was a l t e r e d to t h e f o l l o w i n g form:
%s = (0.87M - 0.554) s i n 6 + 0.53
which is still on ly a func t ion o f f r ee - s t r eam Mach number and Newtonian impact angle . The d e v i a t i o n s f r m S i m s ' v a l u e s r e s u l t i n g f r o m t h i s new express ion are i l lus t ra ted i n t h e upper port ion of f igure Al . For a l l impact angles up to 30°, t h e d e v i a t i o n s are less than +5 pe rcen t fo r a l l Mach numbers above 1.5. The ove ra l l a ccu racy i s much better t h a n t h i s +5 percent and i s g e n e r a l l y w i t h i n t h e +1 pe rcen t dev ia t ion band . Th i s r e l a t ionsh ip is a s imple empir ica l curve f i t based on t he r eg ions o f p rev ious g rea t e s t error. Neither mathematical nor phys i ca l r i go r is i n any way i m p l i e d ; t h e r e l a t i o n s h i p d o e s , however, r e p r e s e n t f a i r l y a c c u r a t e l y t h e real case (i.e., Sims' p r e s s u r e s ) .
Seve ra l o the r small a d d i t i o n s to t h e c o n i c a l Cp c a l c u l a t i o n c o n t a i n e d i n t h e HABS program were also incorpora ted for cons is tency and comple teness . A r e l a t ionsh ip de f in ing shock de t achmen t was added along with a r e l a t i o n s h i p l i m i t i n g t h e maximum magnitude of Cp as a func t ion of f ree-s t ream Mach number. A l s o , a modified Newtonian patchwork procedure was inco rpora t ed to d e f i n e pres- sure coef f ic ien ts ex is t ing be tween shock de tachment and maximum a l lawable p res - s u r e c o e f f i c i e n t .
10

APPENDIX
10
%Acp. LaRC 0
-10
M = (0.87 M - 0.554) sin 6 + 0.53
l - a ( 1 M’;S+5 1 6M2 nc
%A C P.
0 5 10 15 20 25 30
N E W T O N I A N IMPACT ANGLE, 6, DEG
Figure A1.- P e r c e n t d e v i a t i o n i n empirical c o n i c a l p r e s s u r e c o e f f i c i e n t s f o r o r i g i n a l a n d LaRC m o d i f i c a t i o n to program of r e f e r e n c e s 11 and 12.
11

REFERENCES
1 . Penland, J i m A.; D i l lon , James L.; and Pittman, Jimmy L.: An Aerodynamic Analysis of Several Hypersonic Research Airplane Concepts From M = 0 . 2 to 6 . 0 . J. Aircr., vol . 15 , no. 1 1 , Nov. 1 9 7 8 , pp. 716-723.
2 . Dil lon , James L.; and Pittman, Jimmy L.: Aerodynamic C h a r a c t e r i s t i c s a t Mach 6 of a Wing-Body Concept for a Hypersonic Research Airplane. NASA TP-1249, 1978.
3 . Lamar, John E.; and Gloss, Blair B.: Subsonic Aerodynamic Characterist ics o f In t e rac t ing L i f t i ng Su r faces With Separated Flaw Around Sharp Edges Predicted by a Vortex-Lat t ice Method. NASA TN D-7921, 1975.
4 . Pittman, Jimmy L.; and Dillon, James L.: Vortex Lattice P red ic t ion of Sub- s o n i c Aerodynamics of Hypersonic Vehicle Concepts. J. Aircr ., vol . 1 4 , no. 10 , O c t . 1977, pp. 101 7-1018.
5 . Somer, Simon C.; and Short, Barbara J.: Free-Flight Measurements of Turbulent-Boundary-Layer S k i n F r i c t i o n i n t h e P r e s e n c e of Severe Aero- dynamic Heating a t Mach Numbers From 2 . 8 to 7 . 0 . NACA TN 3391 , 1955 .
6 . Harris, Roy V., Jr.: An Analys is and Corre la t ion o f Ai rcraf t Wave Drag. NASA TM X-947, 1964.
7 . Middleton, Wilbur D.; and Carlson, Harry W.: Numerical Method of E s t i m a t - i n g and Optimizing Supersonic Aerodynamic Character is t ics of Arbi t rary Planform Wings. J. Aircr . , vol . 2 , no. 4 , July-Aug. 1965, pp. 261-265.
8 . Penland, J i m A.; Fourn ier , Roger H.; and Marcum, Don C. , J r .: Aerodynamic C h a r a c t e r i s t i c s of a Hypersonic Research Airplane Concept Having a 70° Swept Double-Delta Wing a t Mach Numbers From 1 . 5 0 to 2 . 8 6 . NASA TN m 8 0 6 5 , 1 9 7 5 .
9 . Penland, J i m A.; H a l l i s s y , James B.; and Di l lon , James L.: Aerodynamic C h a r a c t e r i s t i c s of a Hypersonic Research Airplane Concept Having a 70° Swept Double-Delta Wing a t Mach Numbers From 0 . 8 0 to 1 . 2 0 , With Summary of Data From 0 . 2 0 to 6 . 0 . NASA TP-1552, 1979.
10. D i l lon , James L.; and Pi t tman, Jimmy L.: Aerodynamic C h a r a c t e r i s t i c s a t Mach Numbers Fran 0 . 3 3 t o 1 . 2 0 of a Wing-Body Design Concept for a H y p e r - sonic Research Airplane. NASA TP-1044, 1 977 .
1 1 . Gentry, Arvel E.: Hypersonic Arbitrary-Body Aerodynamic Computer Program (Mark I11 Vers ion) . V o l . I - User's Manual. Rep. DAC 61552, V o l . I ( A i r Force Cont rac t Nos. F33615 67 C 1008 and F33615 67 C 1 6 0 2 ) , McDonnell Douglas Corp., Apr. 1968 . (Avai lab le from DDC as AD 851 81 1 .)
1 2

12; Gentry, Arvel E.: and Smyth, Douglas N.: Hypersonic Arbitrary-Body Aerodynamic Computer Program (Mark I11 Vers ion ) . V o l . I1 - Program Formulat ion and Lis t ings. Rep. DAC 61 552, V o l . I1 ( A i r Force Cont rac t N o s . F33615 67 C 1008 and F33615 67 C 1602) , McDonnell Douglas Corp., Apr. 1968. (Avai lable f rom DDC as AD 851 812.)
13. Dollyhigh, S . M.: Theoretical Evaluation of High Speed Aerodynamics for Arrow Wing Conf igu ra t ions . NASA TP-1358, 1979.
14. Lamb, Milton: and McLean, F. Edward: Evalua t ion of Techniques for Numeri- cal Representation and Predict ion of the Longi tudinal Aerodynamic Char- acteristics o f Supe r son ic F igh te r s . NASA TM X-2283, 1971 .
15. E c k e r t , E r n s t R. G.: Survey on Heat Trans fe r a t High Speeds. ARL 189, U . S . A i r Force, Dec. 1961 .
16. Mayer, John P.: A L i m i t P re s su re Coe f f i c i en t and an Est imat ion of L i m i t Forces on A i r f o i l s a t Supersonic Speeds. NACA RM L8F23, 1948.
17. Stack, Sharon H .; Edwards, Clyde L . W. : and Small, William J .: GEMPAK: An A r b i t r a r y A i r c r a f t Geometry Generator. NASA TP-1022, 1977.
18. Kaufman, Louis G., 11: Pressure Es t imat ion Techniques for Hypersonic Flaws Over Blunt Bodies . J . As t ronau t . Sc i . , vo l . X, no. 2, Summer 1963, pp. 35-41.
19. Sims, Joseph L.: Tables fo r Supe r son ic Flow Around Right Circular Cones a t Zero Angle of A t t a c k . NASA SP-3004, 1964.
13

TABLE I .- TEST CONDITIONS FOR CONCEPTS A, B, AND C
Reynolds number P t T t M Faci l i ty a, deg
per m psia kPa K per f t
Concept A
1.10
2.00 6.6 2.86 2.00 6.6 2.36 2.00 6.6 2.00 2.00 6.6 1.50 3.17 '10.4 1.20 3.14 x 10 10.3 x l o 6
.___" -
76.1
- 4 . 3 to 21.8 14.28 98.4 -4.3 t o 22.2 10.97 75.7 -4.8 t o 22.2 9.22 63.5 -5.0 t o 22.3 7.72 53.2 -4.6 t o 20.5 11.04 76.1 -4.6 t o 20.8 11.04
Concept B
1.10
98.4 339 61 0 2.00 6.6 2.86 75.7 339 61 0 2.00. 6.6 2.36 63.5 339 610 2.00 6.6 2.00 53.2 339 610 2.00 6.6 1.50
101 .5 322 580 4.23 13.9 1.20 101.5 322 580 4.20 x l o 6 13.8 x l o 6
Concept C
1.13 1.20 1.50 2.00 2.36 2.86
8.5 x l o 6 8.5 6.6 6.6 6.6 6.6
2.59 x l o 6 2.60 2.00 2.00 2.00 2.00
-
62.3 62.3 53.2 63.5 75.7 98.4
8 'TPT 8 'TPT
UPWT
1 14.72
UPWT -2.7 t o 22.5 .l4.28 UPWT -1.4 t o 24.3 10.97 UPW -2.1 t o 24.0 9.22 UPW -3.0 t o 23.4 7.72 8'TPT -3.5 t o 18.2 14.72 8'TPT -3.5 t o 18.3
8 'TPT 8 'TPT
1 4
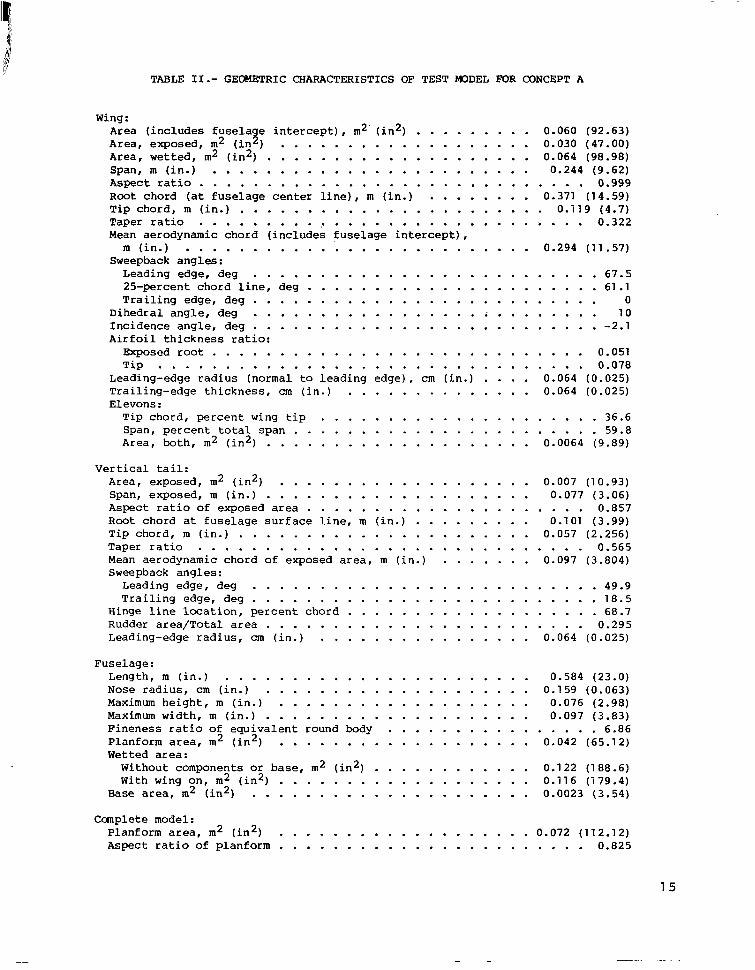
TABLE 11.- GEOMETRIC CHARACTERISTICS OF TEST MODEL FOR CONCEPT A
Wing: Area ( i n c l u d e s f u s e l a e i n t e r c e p t ) . m2 ( i n 2 ) . . . . . . . . . 0.060 (92.63) Area. exposed. m2 ( i n s ) . . . . . . . . . . . . . . . . . . . 0.030 (47.00) Area. wet ted. m2 ( i n 2 ) . . . . . . . . . . . . . . . . . . . . 0.064 (98.98) Span. m ( i n . ) . . . . . . . . . . . . . . . . . . . . . . . . 0.244 (9.62) Aspect r a t i o . . . . . . . . . . . . . . . . . . . . . . . . . . . . . 0.999 R o o t chord ( a t f u s e l a g e c e n t e r l i n e ) . m ( i n . ) . . . . . . . . 0.371 (1 4.59) Tip chord . m ( i n . ) . . . . . . . . . . . . . . . . . . . . . . . 0.119 (4.7) Taper ra t io . . . . . . . . . . . . . . . . . . . . . . . . . . . . . . . 0.322 Mean a e r o d y n a m i c c h o r d ( i n c l u d e s f u s e l a g e i n t e r c e p t ) .
m ( i n . ) . . . . . . . . . . . . . . . . . . . . . . . . . . 0.294 (11.57) Sweepback a n g l e s :
Leading edge. deg . . . . . . . . . . . . . . . . 25-percent chord l ine. deg . . . . . . . . . . . . Tra i l ing edge . deg . . . . . . . . . . . . . . . .
Dihedral angle . deg . . . . . . . . . . . . . . . . Inc idence angle . deg . . . . . . . . . . . . . . . . A i r f o i l t h i c k n e s s ratio:
Exposed root . . . . . . . . . . . . . . . . . . . T i p . . . . . . . . . . . . . . . . . . . . . . .
Leading-edge radius (normal to l e a d i n g e d g e ) . cm ( i n Tra i l i ng -edge t h i ckness . cm ( i n . ) . . . . . . . . . Elevons :
Tip chord . pe rcen t wing t i p . . . . . . . . . . . Span. percent t o t a l span . . . . . . . . . . . . . Area. both. m2 ( i n 2 ) . . . . . . . . . . . . . . .
. . . . . . . . . . 67.5 . . . . . . . . . . 61.1 . . . . . . . . . . 0 . . . . . . . . . . 10 . . . . . . . . . . -2.1
. . . . . . . . . 0.051 . . . . . . . . . 0.078 ) . . . . 0.064 (0.025) . . . . . 0.064 (0.025)
. . . . . . . . . . 36.6 . . . . . . . . . . 59.8 . . . . . 0.0064 (9.89) V e r t i c a l t a i l :
Area. exposed. m2 ( i n 2 ) . . . . . . . . . . . . . . . . . . . 0.007 (1 0.93) Span. exposed. m ( i n . ) . . . . . . . . . . . . . . . . . . . . 0.077 (3.06) A s p e c t r a t i o o f e x p o s e d area . . . . . . . . . . . . . . . . . . . . . 0.857
Tip chord . m ( i n . ) . . . . . . . . . . . . . . . . . . . . . . 0.057 (2.256) Taper r a t i o . . . . . . . . . . . . . . . . . . . . . . . . . . . . . 0.565 Mean aerodynamic chord of exposed area. m ( i n . ) . . . . . . . 0.097 (3.804) Sweepback a n g l e s :
Leading edge. deg . . . . . . . . . . . . . . . . . . . . . . . . . . 49.9 Tra i l ing edge . deg . . . . . . . . . . . . . . . . . . . . . . . . . . 18.5
Hinge l i n e l o c a t i o n . p e r c e n t c h o r d . . . . . . . . . . . . . . . . . . . 68.7 Rudder a rea /Tota l a rea . . . . . . . . . . . . . . . . . . . . . . . . 0.295 Leading-edge radius. cm ( i n . ) . . . . . . . . . . . . . . . . 0.064 (0.025)
R o o t chord a t f u s e l a g e s u r f a c e l i n e . m ( i n . ) . . . . . . . . . 0.1 01 (3.99)
Fuselage: Length. m ( i n . ) . . . . . . Nose r a d i u s . cm ( i n . ) . . . Maximum h e i g h t . m ( i n . ) . . Maximum width. m ( i n . ) . . . Fineness ra t io o f e q u i v a l e n t P lanform a rea . m2 (in’) . . Wetted area:
Without components or base. With wing on. m 2 ( i n 2 ) . .
Base a r e a . m2 ( i n 2 ) . . . .
. . . . . . . . . . . . . . . . . . . . . . . . . . . . . . . . . . . . . . . . . . . . . . . . . . . . . . . . . . . . . . . . . . . . round body . . . . . . . . . . . . . . . . . . . . . . . . . . . . . m2 ( in21 . . . . . . . . . . . . . . . . . . . . . . . . . . . . . . . . . . . . . . . . . . . . . .
0.584 (23.0) 0.159 (0.063) 0.076 (2.98) 0.097 (3.83) . . . . 6.86
0.042 (65.12)
0.122 (188.6) 0.716 (179.4) 0.0023 (3.54)
Canplete model: Planform area. m 2 ( i n 2 ) . . . . . . . . . . . . . . . . . . . 0.072 (112.12) Aspect ra t io of planform . . . . . . . . . . . . . . . . . . . . . . . 0.825
1 5
.

TABLE 111.- GEOMETRIC CHARACTERISTICS OF TEST MDDEL FOR CONCEPT B
Winq : . Area. r e f e r e n c e ( i n c l u d e s f u s e l a g e i n t e r c e p t ) .
m2 ( in2 ) . . . . . . . . . . . . . . . . . . . . . . . . . . 0.043 (67.200) Area. exposed. m2 ( i n 2 ) . . . . . . . . . . . . . . . . . . . 0.023 (36.1 21 )
Span. m ( i n . ) . . . . . . . . . . . . . . . . . . . . . . . . 0.217 (8.542)
Tip chord. m ( i n . ) . . . . . . . . . . . . . . . . . . . . . . 0.085 (3.355)
Mean aerodynamic chord. m ( i n . ) . . . . . . . . . . . . . . . 0.248 (9.779)
. . . . . . . . . . . . . . . . . . . . Area. wetted. m2 (in2) 0.047 (72.242)
Aspect r a t io 1.086 R o o t chord ( a t f u s e l a g e c e n t e r l i n e ) . m ( i n . ) . . . . . . . . 0.353 (13.896)
Taper r a t io 0.241
. . . . . . . . . . . . . . . . . . . . . . . . . . . . .
. . . . . . . . . . . . . . . . . . . . . . . . . . . . . Sweepback angles :
Leading edge. deg . . . . . . . . . Trai l ing edge. deg . . . . . . . . .
Incidence angle . deg . . . . . . . . . Exposed root . . . . . . . . . . . .
25-percent chord l ine. deg . . . . . Dihedra l angle ( a t a i r f o i l mean l i n e ) .
A i r f o i l t h i c k n e s s ratio:
. . . . . . . . . . . . . . . . Leading-edge radius a t - T i p
Fuselage-line chord. m ( i n . ) . . . . Area of both e levons. m2 ( i n2 ) . . . . Tip. m ( i n . ) . . . . . . . . . . . .
. . . . . . . . . . . . . . . . . . 70 . . . . . . . . . . . . . . . . . . . 64
. . . . . . . . . . . . . . . . . . 0 deg . . . . . . . . . . . . . . -3.64 . . . . . . . . . . . . . . . . . . 0
. . . . . . . . . . . . . . . . . 0.05 . . . . . . . . . . . . . . . . . 0.06
. . . . . . . . . 5.08 X 10⁻⁴ (0.020) . . . . . . . . . 5.08 X 10⁻⁴ (0.020) . . . . . . . . . . . . 0.005 (7.161)
Forward d e l t a wing: Area. exposed (out3ide sf fuselage. forward of wing
l ead ing edge ) . m ( i n ) . . . . . . . . . . . . . . . . . . 0.002 (3.394) Leading-edge sweep. deg . . . . . . . . . . . . . . . . . . . . . . . . . 80
Vertical t a i l : Area. exposed. m 2 ( i n2 ) . . . . . . . . . . . . . . . . . . . 0.007 (11 -492) Span. exposed. m ( in . ) . . . . . . . . . . . . . . . . . . . . 0.086 (3.380) Aspect ratio of exposed area . . . . . . . . . . . . . . . . . . . . . 0.994 R o o t chord a t f u s e l a g e s u r f a c e l i n e . m ( i n . ) . . . . . . . . . 0.128 (5.040) Tip chord. m ( i n . ) . . . . . . . . . . . . . . . . . . . . . . 0.045 (1 . 760) T a p e r r a t i o . . . . . . . . . . . . . . . . . . . . . . . . . . . . . 0.349 Mean aerodynamic chord of exposed area. m ( i n . ) . . . . . . . 0.093 (3.664) Sweepback angles :
Leading edge. deg . . . . . . . . . . . . . . . . . . . . . . . . . . 55.0 Trail ing edge. deg . . . . . . . . . . . . . . . . . . . . . . . . . . 24.6
Thickness r a t io a t - A i r f o i l s e c t i o n :
T i p . . . . . . . . . . . . . . . . . . . . . . . . . . . . . . . 0.106 R o o t . . . . . . . . . . . . . . . . . . . . . . . . . . . . . . . 0.106
Leading-edge radius. m ( i n . ) . . . . . . . . . . . . . 5.08 x 1 0-4 (0.020)
Fuselage : L e n g t h , m . ( i n . ) . . . . . . . . . . . . . . . . . . . . . . Maximum height . m ( i n . ) . . . . . . . . . . . . . . . . . . Maximum width. m ( i n . ) . . . . . . . . . . . . . . . . . . . Fineness r a t io of equivalent round body . . . . . . . . . . Planform area. m2 ( i n 2 ) . . . . . . . . . . . . . . . . . . Wetted area. m2 ( i n2 ) . . . . . . . . . . . . . . . . . . . Wetted area (with wing o n ) . m 2 ( i n 2 ) . . . . . . . . . . . . Wetted area (with both del ta wings on) . m2 ( i n 2 ) . . . . . . Base area. m2 ( i n 2 ) . . . . . . . . . . . . . . . . . . . .
. 0.508 (20.000) . 0.071 (2.782) . 0.073 (2.866) . . . . . 6.822 0.026 (40.445)
0.083 (1 28.460) 0.078 (120.695) 0.077 (118.747)
0.002 (3.726)
Complete model (with both del ta wings) : Planform area. m2 ( i n 2 ) . . . . . . . . . . . . . . . . . . . 0.052 (79.960) Aspect ra t io of planform . . . . . . . . . . . . . . . . . . . . . . . 0.913
1 6

TABLE 1V.- GEOMETRIC CHARACTERISTICS OF TEST MDDEL FOR CONCEPT C
Wing : Area ( i n c l u d e s f u s e l a g e i n t e r c e p t ) . m2 ( i n 2 ) . . . . . . . . 0.078 (120.207) Area. e x p o s e d ( b o t h ) . m2 ( i n 2 ) . . . . . . . . . . . . . . . 0.027 (41.486) Area. w e t t e d ( b o t h ) . m2 ( i n 2 ) . . . . . . . . . . . . . . . 0.055 (84.486) Span. total. m ( i n . ) . . . . . . . . . . . . . . . . . . . . 0.246 (9.666) Aspect ra t io . . . . . . . . . . . . . . . . . . . . . . . . . . . . . . 0.78 Root c h o r d ( a t f u s e l a g e c e n t e r l i n e ) . m ( i n . ) . . . . . . . . 0.562 (22.1 23) T i p c h o r d . m ( i n . ) . . . . . . . . . . . . . . . . . . . . . . 0.102 (4.015) Taper ra t io . . . . . . . . . . . . . . . . . . . . . . . . . . . . . . 0.18 Mean a e r o d y n a m i c c h o r d . m ( i n . ) . . . . . . . . . . . . . . . 0.365 (14.371) Sweepback angles :
Leading edge . d e g . . . . . . . . . . . . . . . . . . . . . 2 5 - p e r c e n t c h o r d l i n e . d e g . . . . . . . . . . . . . . . . . T r a i l i n g e d g e . d e g . . . . . . . . . . . . . . . . . . . . .
D i h e d r a l a n g l e . deg . . . . . . . . . . . . . . . . . . . . . I n c i d e n c e a n g l e . d e g . . . . . . . . . . . . . . . . . . . . .. A i r f o i l t h i c k n e s s ratio:
Exposed root . . . . . . . . . . . . . . . . . . . . . . . . T i p . . . . . . . . . . . . . . . . . . . . . . . . . . . .
Area of b o t h e l e v o n s . m 2 ( i n 2 ) . . . . . . . . . . . . . . . . V e r t i c a l t a i l :
Area. e x p o s e d ( e a c h ) . m2 ( i n 2 ) . . . . . . . . . . . . . . . Area. w e t t e d ( e a c h ) . m2 ( i n 2 ) . . . . . . . . . . . . . . . Span. exposed. m ( i n . ) . . . . . . . . . . . . . . . . . . .
. . . . . 75.0 . . . . . 70.3 . . . . . 0.0 . . . . . 0.0 . . . . . -5.0
. . . . . 0.05 . . . . . 0.05 0.004 (6 .104)
0.009 (13.827) 0 .018 (28.256)
0 .095 (3 .74) Aspect r a t io of e x p o s e d area . . . . . . . . . . . . . . . . . . . . . 1.01 R o o t c h o r d a t f u s e l a g e s u r f a c e l i n e . m ( i n . ) . . . . . . . . . 0.144 (5 .680) T i p c h o r d . m ( i n . ) . . . . . . . . . . . . . . . . . . . . . 0.062 (2 .450) T a p e r r a t i o . . . . . . . . . . . . . . . . . . . . . . . . . . . . 0.431 Mean ae rodynamic chord of exposed area. m ( i n . ) . . . . . . 0.103 (4 .044)
Lead ing edge . deg . . . . . . . . . . . . . . . . . . . . . . . . . . 53.6 T r a i l i n g e d g e . d e g . . . . . . . . . . . . . . . . . . . . . . . . . . 61 . 0 Toe- in ang le . deg . . . . . . . . . . . . . . . . . . . . . . . . . . 2.9 Can t a n g l e . d e g . . . . . . . . . . . . . . . . . . . . . . . . . . . 1 5 .0
T h i c k n e s s ra t io . . . . . . . . . . . . . . . . . . . . . . . . . . . . 0.05
Sweepback angles :
F u s e l a g e : Length. m ( i n . ) . . . . . . . . . . . . . . . . . . . . . . . 0.71 0 (27.966) Nose r a d i u s . an ( i n . ) . . . . . . . . . . . . . . . . . . . . 0.254 (0 .100) Maximum h e i g h t . m ( i n . ) . . . . . . . . . . . . . . . . . . . 0.105 (4 .121) Maximum width . m ( i n . ) . . . . . . . . . . . . . . . . . . . . 0.079 (3 .110) F i n e n e s s ra t io of e q u i v a l e n t r o u n d b o d y . . . . . . . . . . . . . . . . 7.12 Planform area. m2 ( i n 2 ) . . . . . . . . . . . . . . . . . . 0.066 (102.454) W e t t e d area:
Without components or base. m2 ( i n 2 ) . . . . . . . . . . . 0.180 (278.442) With wings on. m 2 ( i n 2 ) . . . . . . . . . . . . . . . . . 0.1 74 (269.341) W i t h w i n g s a n d v e r t i c a l t a i l s on. m2 ( i n 2 ) . . . . . . . . 0.1 73 (267.383)
Base area. m2 ( i n 2 ) . . . . . . . . . . . . . . . . . . . . 0.004 (6 .26)
Canplete model: P l a n f o r m area. m2 ( i n 2 ) . . . . . . . . . . . . . . . . . . . 0.088 (135.79) A s p e c t r a t io of p l a n f o r m . . . . . . . . . . . . . . . . . . . . . . . . 0.69
1 7
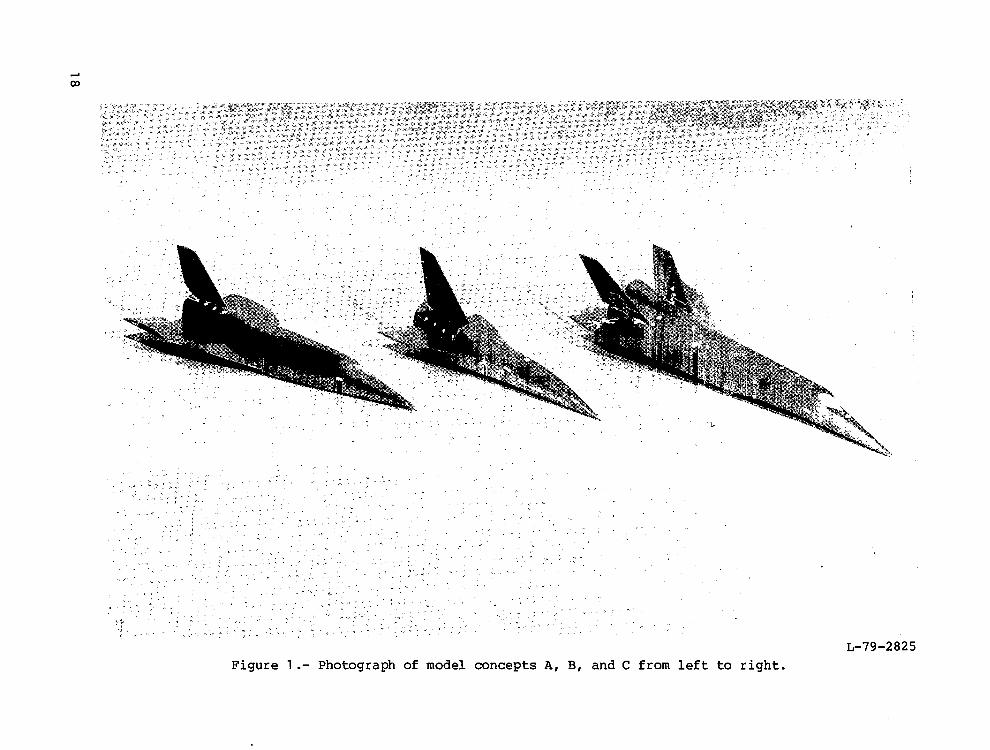
L-79-2825 Figure 1.- Photograph of model concepts A, B, and C from lef t to r ight .

WAVE DRAG AT ZERO LIFT
SKIN-FRICTION DRAG
L L
Supersonic linear theory.
I N V I S C I D DRAG
SKIN-FRICTION DRAG
(b) Hypersonic impact theory.
Figure 2.- Drag polar construction.
19

p3 0
x-station l.OOftJ+
I y-station I - .209
HL:
Figure 3.- General dimensions of concept A. A l l dimensions have been normalized by body length ( 2 = 0.584 m (23.000 i n . ) ) .
I

i .167 .;
"-----
I
.901, m,
.833 Station 0.0 .M2 .a3 .125 117
- /
"
I. 0125
Figure 4.- General dimensions of concept B. A l l dimensions have been normalized by body length ( 2 = 0.508 m (20.000 i n . ) ) .

Station b
-+- .863 61, .768
83. !+ J
Station .I67 .M .a .358 .458 .!35 .613 .6?d .768 .a3 .952 1.0
I .6M
Figure 5.- General dimensions of concept C . All dimensions have been normalized by body l e n g t h ( 2 = 0.710 m (27.966 i n . ) ) .

Figure 6.- Canputer-generated drawing of concept A .

Figure 7.- Computer-generated drawing of concept B.

Figure 8 .- Computer-generated drawing of concept C.

7
6
5
4
3
2
I
0
-. I
-. 2
-. 3 -5 0 5 IO I5 2U 25 M
4 dm
(a) M = 1.10.
F igure 9 .- Cmpar ison of experiment with theory for concept A.
26

.I
0
cm i m
i M
i M
-.a
.I5
.IO
.25
.m
co . I5
.IO
.05
0
1
6
5
1
I
2
I
0
-. I
-. 2
UD
CD
.35
.IO
.25
.m
. I5
.IO
.m
(b) M = 1.20 .
Figure 9 .- Continued.
27

I
0
-. I
-. 2
- 1
Figur
co
:c 1
e 9,
.35
.30
.n
.m
. I5
.LO
.05
0 -. 3 -. 2 -, I 0 . I . 7 . 3 . d . 5 . 6 . I
C t
M = 1.50.
,- Continued.
28
.M
.a
.m
0
.. m
i M
-. m
7
6
5
4
I
2
I
o
-. 1
.. 2
-. I -5 0 5 IO 15 Zl 25 30
.M
.a
.m
0
-. m
-. M
-. M
(d) M = 2.00.
Figure 9 .- Continued.
29

(e) M = 2.36.
F igu re 9.- Continued.
30

UD
-.? -.2 -.I o . I . 2 . I ,I , 5 ,6 , I
CL
(f) M = 2.86.
Figure 9 .- Concluded.
31
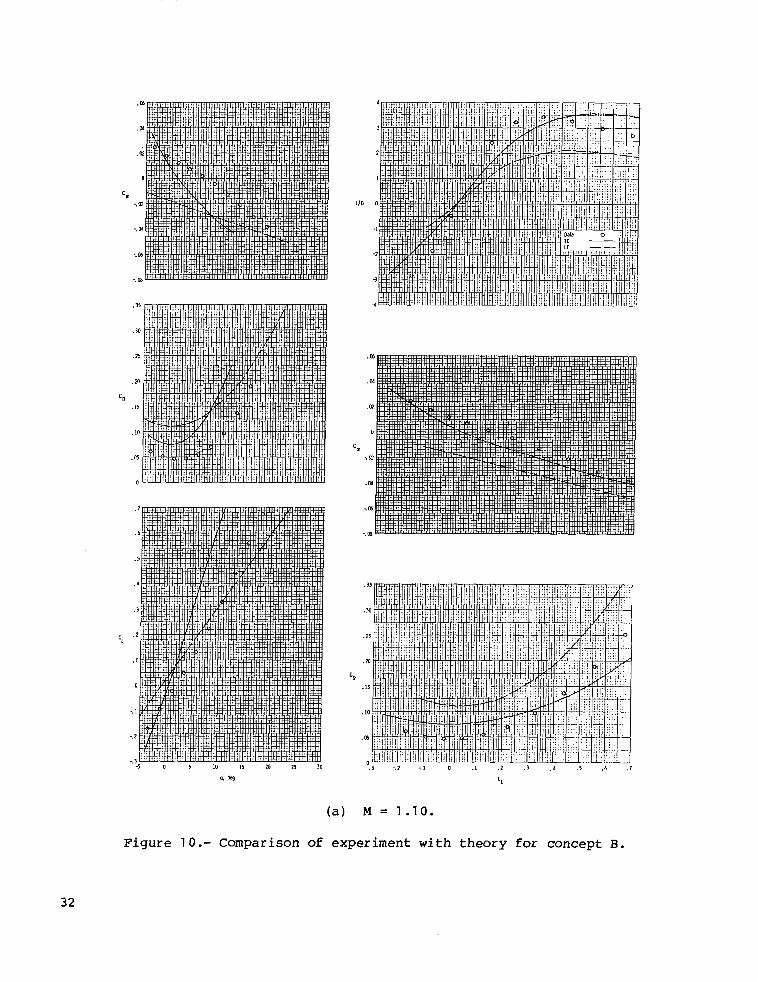
F i g u r e 10.- Comparison of e x
32

‘m
.M
. M
.01
0
-. m
-. M
-. M
-. OB
(b) M = 1 .20.
F i g u r e 1 0 .- Continued.
33

ut
(c) M = 1 .SO.
Figure 1 0 .- Continued.
34

1
3
2
1
uo 0
I
2
3
d
(d) M = 2.00.
Figure 1 0 .- Continued.
35

(e) M = 2.36.
F i g u r e 1 0 .- Continued.
36

(f) M = 2.86.
Figure 10 .- Concluded.
37

‘I
(a) M = 1 . 1 3 .
Figure 11.- Comparison of experiment with theory for Concept c -
38

-5 0 5 IO I5 7l 25 30
CO
.ob
.cd
.m
0
-. m
-. M
-. ob
-. m
.35
. 3 0
.25
.m
. I5
.IO
.05
n 3 -.2 :I 0 . I .? . 3 , d .I ,1 , I
464 CL
(b) M = 1 .20.
Figure 11 .- Continued.
39

(c) M = 1 .50.
Figure 1 1 .- Continued.
40

uo
.oI
.M
.m
0
cm i m
-. M
-. oI
-. 08
.3Q
.25
.m
CO . I5
.IO
.M
0
(d ) M = 2.00.
F igu re 11 .- Continued.
41
UC
I
1
2
I
I O
I
2
3
4
.m
.DI
0
i m
i DI
i I
-. m
.35
.30
.25
.m
. I5
.IO
.oI
( e ) M = 2.36.
Figure 1 1 .- Continued.
42

.I5
.30
.25
.m
co . I5
.IO
.m
0
.m
.M
.m
0
cm -. m
-. w
-. m
.15
.10
.25
.m
CO . I5
.IO
.05
(f) M = 2.86.
F i g u r e 11 .- Concluded.
43

C La
Concept
C
C
Incept
.06
.04 A
.02
0
B
.of
.04
.02
0
Concept
1.0 1.4 1.8 22 M
26
Figure 12.- Canparison of theoretical and experimental lift-curve Mach number for concepts A, B, and C .
3.0'
slope w i t h
44
CL, 0
Concept A
0
-. 1
-. 2
C L, 0
Concept B
C L, 0
Concept C
0
-. 1
-. 2
-. 3 LO 1.4 1.8 22 2 6 3.0
M
F i g u r e 13.- Comparison of t h e o r e t i c a l a n d experimental l i f t c o e f f i c i e n t a t z e r o a n g l e of a t tack w i t h Mach number f o r c o n c e p t s A, B, and C.
45

C
C "'a
:oncept
C "'a
ioncept
C ma
Concept
M
Figure 14.- Comparison of theoretical and e x p e r i m e n t a l l o n g i t u d i n a l s t a b i l i t y parameter wi th Mach number fo r concep t s A , B, and C.
46

C, a ta- 00
Concept A
.02
C m a t a - O O
Concept B 0
-. 02
C a t a = m
Concept
.M
.04 : 00
.02
0 1. 0 1.4 L8 2 2 26 3.0
M
F i g u r e 15.- Canparison of theo re t i ca l and expe r imen ta l p i t ch ing - manen t coe f f i c i en t a t ze ro ang le o f at tack w i t h Mach number fo r concep t s A, B, and C.
47

Cor
- a ‘m a ‘L
ncept A
- a ‘m
a ‘L Concept
Concept
B
- C
0
,05
10 LO L4 L8 22 26 3.0
M
Figure 16.- Canparison of t h e o r e t i c a l a n d e x p e r i m e n t a l l o n g i t u d i n a l s t a b i l i t y parameter wi th Mach number for concepts A, B, and C.
48

C m, 0
Concept
C m, 0
Concept
C m, 0
Concept
A
B
C
04
"
02
0
02
0
02
M
Figure 17.- Canparison of theoretical and experimental zero-lift pitching- moment coefficient with Mach number for concepts A, B, and C.
P 10

cn 0
(L/D ''rnax
Concept B
4
3
2 "
TC/TW - - -
(L/ Dlmax
Concept C
M
Figure 18.- Comparison of theoretical and experimental maximum lift-drag ratio w i t h Mach number for concepts A, B, and C.
,02
n - 1.0 1.4 1, . 8 2
M
(a) Concept A .
2 26 3.0
Figure 19.- Comparison of theoretical and experimental zero-lift drag w i t h Mach number.
. 0
.
.
.
14
12
10
08
06
02
0 LO 1.4 L8 22 26 3.0
M
(b) Concept B.
F igure 19 .- Continued.

n h
.04
.02
0 1.0 1.4 1.8 22
M
(c) Concept C.
Figure 1 9 .- Concluded.
26 3.0
UI W

Mach l. 10 Mach = 1.20 Mach = l. 50 Mach = 200 Mach = 236 Mach - 286
(a) Concept A .
Figure 20.- Theoretical zero-lift drag buildup and comparison with experiment.

0
(b) Concept B . Figure 20.- Continued.
C
Mach = 1.13 Mach = 1.20 Mach = 1.50 Mach - 2 00 Mach = 236 Mach = 2.86
(c) Concept C . Figure 20 .- Concluded.

1. Report No. 2. Government Accession No.
NASA TP-1539 4. Title and Subtitle APPLICATION OF SUPERSONIC LINEAR THEORY AND HYPERSONIC IMPACT METHODS To THREE NONSLENDER HYPERSONIC AIRPLANE CONCEPTS AT MACH NUMBERS FROM 1.1 0 to 2.86
7. Authorfs)
Jimmy L. Pittman ~
9. Performing Organization Name and Address -
NASA Langley Research Center Hampton, VA 23665
12. Sponsoring Agency Name and Address National Aeronautics and Space Administration Washington, DC 20546
15. Supplementary Notes
Appendix by C. L. W. Edwards.
5. Aewrt Date
8. Performing Organwation Report No.
L-13142 10. Work Unit No.
505-31-73-01
11. Contract or Grant No.
13. Type of Report and Period Covered Technical Paper
14. Sponsoring Agency Code
~~
16. Abstract
Aerodynamic predictions from supersonic linear theory and hypersonic impact theory were compared with experimental data for three hypersonic research airplane concepts over a Mach number range from 1.1 0 to 2.86. The linear theory gave good lift pre- diction and fair to good pitching-moment prediction over the Mach number (M) range. The tangent-cone theory predictions were good for lift and fair to good for pitching moment for M 2 2.0. The combined tangent-cone/tangent-wedge method gave the least accurate prediction of lift and pitching moment. For all theories, the zero-lift drag was overestimated, especially for M < 2.0. The linear theory drag prediction was generally poor, with areas of good agreement only for M 5 1.2. For M 2 2.0, the tangent-cone method predicted the zero-lift drag most accurately.
7. Key Words (Suggested by Author(s))
Hypersonic aircraft Supersonic aerodynamics Transonic aerodynamics Computational methods
18. Distribution Statement
Unclassified - Unlimited
Subject Category 02 9. Security Classif. (of this report) 22. Price' 21. No. of Pages 20. Security Classif. (of this page)
m s i g i e d Unclassified 56 $5.25
*For sale by the National Technical Information Service, Springfield, Virginia 22161 NASA-Langley. 1979

THIRD-CLASS BULK RATE Postage and Fees Paid National Aeronautics and Space Administration N A S A 4 5 1
National Aeronautics and Space Administration
Washington, D.C. 20546 Official Business
Penalty for Private Use, $300