i. settlement of account for fy12/2013 - highlights of contents 1 i. settlement of account for...
TRANSCRIPT

0
Japan Hotel REIT Investment Corporation
Financial Results Briefing 14th period (FY12/2013)
February 21, 2014
(TSE:8985)
http://www.jhrth.co.jp/en/index.html
Table of contents
1
I. Settlement of account for FY12/2013 - Highlights
1.Settlement of account - Highlights 3
2.HMJ’s five hotels – Monthly performance highlights 4
II. Settlement of account - Summary
1.Operational performance 6
2.Revenue forecast 7
3.Balance sheet (Summary) 8
III. Performance of the major hotels with variable rents
1.Performance highlights of HMJ’s five hotels 10
2.Performance highlights of each of HMJ’s five hotels 11
3.Performance highlights of Ibis Tokyo Shinjuku 16
4.Performance highlights of Ibis Styles Kyoto Station 17
IV. Characteristics of JHR
1.Accommodate both stability and upside potential 19
2.Factors which increased room sales from a
medium-to-long term perspective 20
3.Utilization of negative goodwill 21
4.Preferential treatment for unitholders 22
V. Operations strategies
1.Three growth engines and key points of operations
strategies 24
2.External growth strategies 25
3.Internal growth strategies 26
4.Track record and capital investment plan 27
5.Major CAPEX III by each hotel 28
6.Financial strategy 29
Appendix 1 Basic information
1.Property list 31
2.Summary of lease contracts 33
3.JHR’s operation methods 35
4.Portfolio map 36
5.Major properties 37
Appendix 2 Index data for the major hotels with variable rents
1.Hotel performance indicators 39
Appendix 3 Investors composition and investment unit price
1.Major unitholders and owners of the investment units 44
2.Changes in the investment unit price and market
capitalization 45
Appendix 4 Summary of the asset management company
1.Summary of the asset management company 47
2.Features and governance of the asset management
company 48
Appendix 5 Market data
1.Tourism related information 50
2.Changes in the number of overseas travelers 51
3.Economic assessment and direction/Changes in
DI by industry 52
<Reference> Our website
Former Nippon Hotel Fund Investment Corporation (“former NHF) and former Japan Hotel and Resort, Inc. (“former JHR”) merged in
April1, 2012 (The surviving company is the former NHF). The new name after the merger is Japan Hotel REIT Investment Corporation
(“JHR”). The asset management company of JHR is Japan Hotel REIT Advisors Co., Ltd. (“Asset Management Company).

I. Settlement of account for FY12/2013 - Highlights

1.Settlement of account - Highlights
3
1 Rating of JHR (Improved) 3 Acquisitions (Two properties)
2 Revenue enhancement of hotels
with variable rent
(2012) (2013)
Sales (Actual)
JPY21,312M JPY21,994M
GOP (Actual)
JPY5,645M JPY6,155M
<Sales and GOP of HMJ’s five hotels(*2)>
(*2) They are namely Kobe Meriken Park Oriental Hotel, Oriental Hotel Tokyo
Bay, Namba Oriental Hotel, Hotel Nikko Alivila, and Oriental Hotel
Hiroshima. (five hotels). (The same applies hereinafter.)
Issuance of investment corporation bonds 4
5 Partial revision of asset management fees
(End of the
previous period) (End of this period)
Scale of assets (Based on
purchase price) 130,883M 158,902M
NOI yield after
depreciation(*5) 4.5% 4.8%
LTV (Based on
appraisal value)
49.7% 45.0%
Annualized
loan cost(*6) 2.26% 2.02%
Growth in 2013
Dividend per unit
Previous period
(annualized dividend)
This period
(Actual dividend)
Hilton Tokyo Bay Hotel
(Acquired in April 26, 2013)
Ibis Styles Kyoto Station
(Acquired in October 31, 2013)
• Purchase price:JPY26,050M
• Appraisal value: JPY29,500M(*1)
• Acquisition of the trophy asset
• Purchased through PO +
Borrowing + Cash on hand.
• Purchase price: JPY6,600M
• Appraisal value: JPY6,750M(*1)
• Replaced hotel operator upon
acquisition for further upside.
R&I
Beginning
of the period
Improved in
Oct. 30, 2013
BBB+ (Stable)
A- (Stable)
JCR New rating in Sept. 13, 2013
A (Stable)
Total amount of bonds: JPY2,500M
Term: 3 years
Interest rate: 0.89%
JHR decided to implement the new fee system which directly
links to the dividend per unit (Effective from 2014).
JHR’s asset management company clearly showed its
stance that the asset management company and
investors’ profits are on the same boat.
(*3)See press release dated October 24, 2013 for details and definition of terms, etc.
JPY1,939 JPY1,621
(*3)R&I: Rating and Investment Information Inc.
JCR: Japan Credit Rating Agency, Ltd.
(+3.2%)
(+9.0%)
(*5) NOI yield after depreciation at the end of previous period is annualized number of FY12/2012 (nine
months).
(*6) Annualized loan cost at the end of each year.
(Before change) (After change)
Asset management
fee 1 (Maximum)
Total assets ×0.4%
Total assets ×0.35%
Asset management
fee 2 (Maximum)
NOI ×1.0%
NOI ×1.0%
Asset management
fee 3 (Maximum)
Dividend per unit ×43,000
(Reduced)
(No change)
(New)
(*1) Appraisal value as of the end of December 2013.
None

2.HMJ’s five hotels – Monthly performance highlights
4
Jan. Feb. Mar. Apr. May Jun. Total
(Jan.-Jun.) Jul. Aug. Sept. Oct. Nov. Dec.
Total
(Jul-Dec.) Total
Majo
r ind
exe
s of th
e ro
om
s dep
artm
en
t
Occupancy
rate
2013 75.1% 84.1% 89.1% 85.3% 84.1% 83.6% 83.5% 87.5% 94.8% 88.9% 88.6% 88.6% 82.8% 88.5% 86.1%
2012 72.3% 79.4% 85.3% 79.5% 77.5% 79.3% 78.9% 83.1% 93.2% 87.0% 88.7% 86.5% 80.5% 86.5% 82.7%
Year-on-year 3.8% 5.8% 4.4% 7.3% 8.5% 5.4% 5.9% 5.4% 1.8% 2.1% -0.1% 2.4% 2.8% 2.4% 4.0%
ADR (JPY)
2013 13,640 12,454 16,252 15,417 16,113 13,994 14,718 20,338 28,240 17,674 16,150 16,080 18,840 19,691 17,297
2012 12,907 11,693 16,093 14,920 15,875 13,511 14,230 19,236 25,365 15,725 14,982 14,723 17,174 17,978 16,200
Year-on-year 5.7% 6.5% 1.0% 3.3% 1.5% 3.6% 3.4% 5.7% 11.3% 12.4% 7.8% 9.2% 9.7% 9.5% 6.8%
RevPAR (JPY)
2013 10,242 10,471 14,481 13,156 13,546 11,703 12,295 17,803 26,779 15,707 14,317 14,246 15,595 17,434 14,886
2012 9,337 9,289 13,730 11,866 12,300 10,718 11,227 15,982 23,628 13,682 13,291 12,740 13,822 15,549 13,400
Year-on-year 9.7% 12.7% 5.5% 10.9% 10.1% 9.2% 9.5% 11.4% 13.3% 14.8% 7.7% 11.8% 12.8% 12.1% 11.1%
Gross hotel sales (JPY M)
2013 1,410 1,355 1,915 1,711 1,806 1,599 9,797 1,994 2,543 1,849 1,891 1,943 1,976 12,197 21,994
2012 1,402 1,416 1,935 1,677 1,655 1,594 9,679 1,966 2,367 1,707 1,854 1,864 1,874 11,633 21,312
Year-on-year 0.6% -4.3% -1.0% 2.1% 9.1% 0.3% 1.2% 1.4% 7.5% 8.4% 2.0% 4.2% 5.4% 4.8% 3.2%
The performance of the rooms department was favorable. Occupancy rate and ADR increased in almost all hotels compared with the previous period, and RevPAR greatly improved.
Gross sales, which were almost flat or decreased slightly year-on-year during the first three months, have increased since April. GOP increased further on the back of growth in the rooms
department with a high profit contribution ratio.
* ADR<Average Daily Rate> :Total room sales for a certain period / No. of rooms sold for the same period.
* RevPAR<Revenue Per Available Room> :The total room sales for a certain period / No. of rooms available to sell for the same period (same as ADR× Occupancy rate).
* GOP<Gross Operating Profit> :Total hotel sales – Direct expenses necessary to operate hotel such as labor cost and general administrative cost, etc.

II. Settlement of account - Summary

1.Operational performance
6
(A) (B) (B)-(A)
FY12/2012
Actual
FY12/2013
Actual Variance
Annualized numbers(*2)
Pro
fit an
d lo
ss
Operating revenue 9,638 11,472 1,834
Fixed rent 2,189 2,811 622
Variable rent 7,448 8,661 1,213
NOI (*1)
8,139 9,907 1,768
6.2% 6.2% 0.0%
Depreciation expenses 2,214 2,297 83
Loss on retirement of noncurrent
assets 12 8 -4
Loss on disposal of fixed assets 0 1,189 1,189
NOI after depreciation (*1)
5,912 6,413 501
4.5% 4.8% 0.3%
Other operating expenses 870 1,045 175
Operating profit 5,042 5,367 325
Non-operating income 4 6 2
Non-operating expenses 1,633 1,634 1
Ordinary income 3,412 3,740 328
Current net profit 3,410 3,233 -177
Div
iden
d
Utilization of negative goodwill 12 1,848 1,836
Total dividends 3,422 5,083 1,661
No. of investment units issued 2,111,281 2,621,281 510,000
Dividend per unit (JPY) 1,621 1,939 318
(*1) NOI (Net operating income) = Real estate operating income – Real estate
operating expenses + Depreciation expenses + Loss on retirement of non-current
assets. NOI yield: NOI/Total purchase price of the assets owned as of the end of the
period. NOI after depreciation = Real estate operating income – Real estate
operating expenses. NOI yield after depreciation = NOI after depreciation / Total
purchase price of the asset owned as of the end of the period.
(*2) The actual for FY12/2012 (9 months) is annualized. Variable rent of HMJ’s five
hotels are calculated based on the actual numbers for the period from January 2012
through December 2012. The assets acquired in FY12/2012 shows the forecast for
the period from January 2013 through December 2013 as of the end of FY12/2012.
The assets sold in FY12/2012 are calculated based on the premise that they would
not be owned for the full financial year. Gain on negative goodwill, loss on disposal
of fixed assets, and impairment loss are not assumed.
Major causes of variances
1. Increased revenue of HMJ’s five hotels: +416
Increased revenue of “Ibis Tokyo Shinjuku”: +110
Other: +96
2. Increase due to acquisition: +1,282
Decrease due to disposition: -71
Other: +2
3. Increase due to acquisition: +120
Decrease due to disposition: -37
4. Loss on disposal of fixed assets: +1,189
5. Increased fees, etc. resulted from acquisition : +108
Other: +67
6. Impairment loss from the property to be sold
(as of the date of settlement of accounts): -517
7. Loss on disposal and impairment loss : +1,705
Loss on retirement of noncurrent assets: -4
Coped for dilution:: +135
8. Public offering to acquire Hilton Tokyo Bay Hotel
1→
2→
3→
4→
5→
8→
7→
6→
(Unit JPY M)

2.Revenue forecast
7
(A) (B) (B)-(A)
FY12/2012 FY12/2013 FY12/2014
Variance Actual Actual Forecast
Annualized numbers(*2)
Pro
fit an
d lo
ss
Operating revenue 9,638 11,472 11,964 492
Variable rent 2,189 2,811 3,006 195
Fixed rent 7,448 8,661 8,958 297
NOI (*1)
8,139 9,907 10,180 273
6.2% 6.2% 6.5% 0.3%
Depreciation expenses 2,214 2,297 2,358 61
Loss on retirement of
noncurrent assets 12 8 13 5
Loss on disposal of fixed
assets 0 0 0 0
NOI after depreciation (*1)
5,912 7,602 7,808 206
4.5% 4.8% 5.0% 0.2%
Other operating expenses 870 1,045 1,124 79
Operating income 5,042 6,556 6,684 128
Non-operating income 4 6 0 -6
Non-operating expense 1,633 1,634 1,609 -25
Ordinary income 3,412 4,929 5,074 145
Current net profit 3,410 4,939 5,072 133
Div
iden
d
Utilization of negative
goodwill 12 143 13 -130
Total amount of dividend 3,422 5,083 5,085 2
No. of investment units
issued 2,111,281 2,621,281 2,621,281 0
Dividend per unit (JPY) 1,621 1,939 1,940 1
To be updated
(Unit JPY M)
1. Decrease in revenue of HMJ’s five hotels: -124
Full-year revenue impact of “Ibis Styles Kyoto Station”: +305
Other : +14
2. Full-year revenue impact of hotels acquired in 2013 : +632
Decreased rental income due to disposition, etc.: -335
3. Increased fees, etc. resulted from acquisition: +52
Other: +27
Major causes of variances
Major assumptions for FY12/2014(*4)
Operating assets: 27 properties (excluding Dormy Inn Namba sold
in January 24, 2014) will be owned/operated for the full financial
period. No property transfer (acquisition or disposition) is expected.
Operating income: Hotels’ competitiveness and market
environment have been considered based on the lease contracts.
Operating expenses: Fixed asset tax and city planning tax, etc.
cost JPY849M. Straight-line method has been applied to calculate
depreciation cost.
Non-operating costs: JPY1,577M is expected in interest and loan
related costs.
Borrowing: Balance of loans and investment corporation bonds
totaled JPY74,784M at the beginning of the period. Expected to
total JPY73,449M at the end of the period.
No. of investment units issued:2,621,281units in total
Dividend per unit : Negative goodwill is utilized for loss on disposal
of fixed assets (JPY13M).
(*1) NOI (Net Operating Income) = Real estate operating income – Real estate operating expenses +
Depreciation expenses + Loss on retirement of non-current assets. NOI yield = NOI/Total purchase
price of the assets owned as of the end of the period (including the asset planned to be owned at the
end of the period). NOI after depreciation = Real estate operating income - Real estate operating
expenses. NOI yield after depreciation = NOI after depreciation / Total purchase price of the assets
owned at the end of this period (including the asset(s) planned to be owned).
(*2) See (*2) of Page 6.
(*3) Actual numbers excluding loss on disposal of fixed assets and impairment loss for comparison.
(*4) Please see “Notice Concerning Operating Forecast for the Fiscal Period Ending December 2014 (15th
period) dated December 19, 2013 for detail.
1 →
2 →
(*3)
3 →

3.Balance sheet (Summary)
8
(*1) Cash in trust and savings in trust are included.
(*2) The sum of building, structure, machinery and equipment, tools, appliances and fixtures and construction in progress account.
(*3) The sum of building in trust, structure in trust, machinery and equipment in trust, tools in trust, appliances and fixtures in trust, and construction in progress account in trust.
(JPY M)
As of end of
FY12/2012
As of end of
FY12/2013 Variance
As of end of
FY12/2012
As of end of
FY12/2013 Variance
2012.12.31 2013.12.31 2012.12.31 2013.12.31
ASSETS LIABILITIES
Current assets 9,960 13,642 3,682 Current liabilities 12,540 17,887 5,347
Cash and deposits(*1) 8,922 12,553 3,631 Operating accounts payable 298 238 -60
Operating accounts receivable 705 753 48 Short-term loans payable 3,841 2,669 -1,172
Other 331 335 4 Investment corporation bonds
due within one year 2,000 - -2,000
Fixed asset 129,608 157,005 27,397 Long-term loans due within one
year 5,280 13,701 8,421
Tangible fixed assets 109,153 136,529 27,376 Other payables 460 560 100
Building(*2) 577 546 -31 Advances received 638 634 -4
Land ‐ - - Others 21 82 61
Buildings in trust(*3) 49,364 53,480 4,116 Fixed liabilities 58,072 63,084 5,012
Land in trust 59,212 82,502 23,290 Long-term loans 54,098 55,913 1,815
Intangible fixed assets 19,836 19,824 -12 Investment corporation bonds - 2,500 2,500
Investments and other assets 618 651 33
Security deposits and guarantee
money 3,936 4,625 689
Security deposits and
guarantee money 180 170 -10 Others 38 45 7
Others 437 481 44 TOTAL LIABILITIES 70,613 80,971 10,358
Deferred assets 55 79 24 EQUITY
Total unit holder’s capital 28,260 48,845 20,585
Unit holders surplus 21,746 21,746 0
Dividend allowances - 16,017 16,017
Retained earnings 19,031 3,235 -15,796
Others -28 -88 -60
TOTAL EQUITY 69,010 89,756 20,746
TOTAL ASSETS 139,623 170,727 31,104 TOTAL LIABILITIES AND EQUITY 139,623 170,727 31,104

III. Performance of the major hotels with variable rents

1.Performance highlights of HMJ’s five hotels
10
Changes in sales volume, GOP and management index (*)
of HMJ’s five hotels
(*) Sales, GOP and management index have been provided by the lessees and the operators. CY2014 is a forecast and the actual results may differ from the forecast due to various factors (The same applies hereafter for each hotel.)
Sales and GOP
Management index
CY2010 CY2011 CY2012 CY2013 CY2014
(Forecast)
Occupancy rate 80.4% 76.7% 82.7% 86.1% 85.7%
ADR (JPY) 15,980 15,846 16,200 17,297 16,937
RevPAR (JPY) 12,845 12,160 13,400 14,886 14,510
GOP (JPY M) 5,696 5,158 5,645 6,155 6,003
GOP ratio 26.6% 25.5% 26.5% 28.0% 27.2%
Actual performance from January 2013 through December 2013
Gross sales increased by JPY682M or 3.2% compared with the previous period.
The rooms department positively attracted domestic leisure travelers and overseas travelers, and
occupancy rate and ADR of all five hotels improved. Room sales increased by JPY989M or 10.8%
compared with the previous period.
Although restaurant sales increased due to improved occupancy rate, wedding sales declined due
to a decrease in the number of weddings. Food and beverage sales declined by JPY331M or
3.3% compared with the previous period.
Sales forecast from January 2014 through December 2014
Gross sales are expected to increase by JPY59M or 0.3% compared with the previous period.
The rooms department will continuously attract more leisure demand and refine revenue
management skills. However, room sales are forecast to decline by JPY265M or 2.6% compared
with the previous period due to a slowdown in sales from the Oriental Hotel Tokyo Bay after the
thirty year anniversary event of Tokyo Disney Resort (TDR).
All food and beverage sectors (wedding, general banquet and restaurant) are expected to exceed
the previous period due to strengthened sales efforts. Food and beverage sales are expected to
increase by JPY279M or 2.9% compared with the previous period.
GOP forecast from January 2014 through December 2014
Total GOP is forecast to decline by JPY152M or 2.5% compared with the previous period.
Total GOP and GOP ratio are forecast to decline due to a decrease in room sales with high profit
ratio (slowdown in sales from the Oriental Hotel Tokyo Bay after the thirty year anniversary event
of TDR).
9,888 8,521 9,679 9,797 9,830
11,508 11,703
11,633 12,197 12,223
21,396 20,223
21,312 21,994 22,053
5,696
5,158
5,645
6,155 6,003
4,000
4,500
5,000
5,500
6,000
6,500
0
5,000
10,000
15,000
20,000
25,000
CY2010 CY2011 CY2012 CY2013 CY2014
(Forecast)
GO
P
Sale
s
1st half of the year 2nd half of the year GOP (JPY M)
0
2.Performance highlights of each HMJ hotel 1
11
CY2010 CY2011 CY2012 CY2013
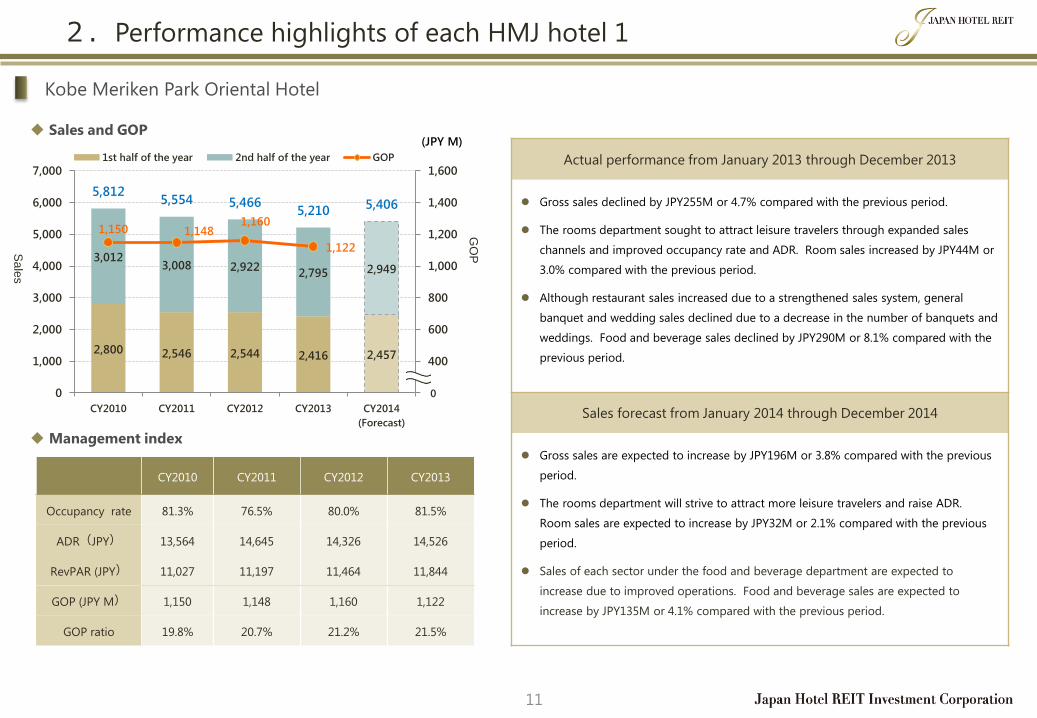
Occupancy rate 81.3% 76.5% 80.0% 81.5%
ADR(JPY) 13,564 14,645 14,326 14,526
RevPAR (JPY) 11,027 11,197 11,464 11,844
GOP (JPY M) 1,150 1,148 1,160 1,122
GOP ratio 19.8% 20.7% 21.2% 21.5%
Kobe Meriken Park Oriental Hotel
Sales and GOP
Management index
Actual performance from January 2013 through December 2013
Gross sales declined by JPY255M or 4.7% compared with the previous period.
The rooms department sought to attract leisure travelers through expanded sales
channels and improved occupancy rate and ADR. Room sales increased by JPY44M or
3.0% compared with the previous period.
Although restaurant sales increased due to a strengthened sales system, general
banquet and wedding sales declined due to a decrease in the number of banquets and
weddings. Food and beverage sales declined by JPY290M or 8.1% compared with the
previous period.
Sales forecast from January 2014 through December 2014
Gross sales are expected to increase by JPY196M or 3.8% compared with the previous
period.
The rooms department will strive to attract more leisure travelers and raise ADR.
Room sales are expected to increase by JPY32M or 2.1% compared with the previous
period.
Sales of each sector under the food and beverage department are expected to
increase due to improved operations. Food and beverage sales are expected to
increase by JPY135M or 4.1% compared with the previous period.
2,800 2,546 2,544 2,416 2,457
3,012 3,008 2,922
2,795 2,949
5,812 5,554 5,466
5,210 5,406
1,150 1,148 1,160
1,122
200
400
600
800
1,000
1,200
1,400
1,600
0
1,000
2,000
3,000
4,000
5,000
6,000
7,000
CY2010 CY2011 CY2012 CY2013 CY2014
(Forecast)
GO
P
Sa
les
1st half of the year 2nd half of the year GOP
(JPY M)
0

2.Performance highlights of each HMJ hotel 2
12
CY2010 CY2011 CY2012 CY2013
Occupancy rate 90.2% 78.7% 94.0% 96.1%
ADR(JPY) 16,583 15,941 17,469 20,125
RevPAR (JPY) 14,950 12,542 16,425 19,349
GOP(JPY M) 1,508 1,055 1,532 1,917
GOP ratio 22.8% 18.3% 22.7% 26.7%
Oriental Hotel Tokyo Bay
Sales and GOP
Management index
Actual performance from January 2013 through December 2013
Gross sales increased by JPY420M or 6.2% compared with the previous period.
The number of TDR’s visitors increased due to its thirty year anniversary event, and
rooms department strategically raised the unit price. Occupancy rate and ADR
increased and room sales increased by JPY580M or 17.4% compared with the previous
period.
Although restaurant and banquet sales increased compared with the previous period,
wedding sales declined due to a decrease in the number of weddings. Food and
beverage sales declined by JPY170M or 5.8% compared with the previous period.
Sales forecast from January 2014 through December 2014
Gross sales are forecast to decline by JPY244M or 3.4% compared with the previous
period.
Room sales are forecast to decline by JPY389M or 9.9% compared with the previous
period due to a slowdown in room sales after the thirty year anniversary event of TDR.
Food and Beverage sales are expected to increase by JPY144M or 5.2% compared with
the previous period due to a strengthened sales system.
3,130 2,219
3,221 3,209 3,227
3,478
3,529 3,542
3,973 3,711
6,608
5,748
6,762 7,182
6,938
1,508
1,055
1,532
1,917
0
400
800
1,200
1,600
2,000
2,400
0
1,000
2,000
3,000
4,000
5,000
6,000
7,000
8,000
CY2010 CY2011 CY2012 CY2013 CY2014
(Forecast)
GO
P
Sale
s
1st half of the year 2nd half of the year GOP
(JPY M)

2.Performance highlights of each HMJ hotel 3
13
CY2010 CY2011 CY2012 CY2013
Occupancy rate 81.6% 87.3% 87.6% 91.9%
ADR(JPY) 9,677 10,250 10,049 10,918
RevPAR (JPY) 7,899 8,949 8,805 10,037
GOP(JPY M) 1,048 1,051 999 1,048
GOP ratio 56.0% 55.1% 53.7% 53.2%
Namba Oriental Hotel
Sales and GOP
Management index
Actual performance from January 2013 through December 2013
Gross sales increased by JPY114M or 6.1% compared with the previous period.
The rooms department attracted demand of both domestic and overseas leisure
travelers, and occupancy rate and ADR improved. Room sales increased by JPY125M or
13.7% compared with the previous period.
Tenant sales declined by JPY8M or 1.0% compared with the previous period, as the
hotel received tenant cancelation fees in the previous period.
Sales forecast from January 2014 through December 2014
Gross sales are expected to increase by JPY18M or 0.9% compared with the previous
period.
The rooms department will continuously strive to attract domestic and overseas leisure
travelers while maintaining a high occupancy rate and ADR. Room sales are expected
to be almost the same as the previous period.
Food and beverage sales are expected to increase by JPY11M or 7.1% compared with
the previous period due to a substantiated menu and strengthened sales system.
914 940 885 934 957
956
968
973 1,038 1,033
1,870 1,909 1,858 1,972 1,990
1,048
1,051
999 1,048
700
800
900
1,000
1,100
1,200
0
500
1,000
1,500
2,000
2,500
CY2010 CY2011 CY2012 CY2013 CY2014
(Forecast)
GO
P
Sale
s
1st half of the year 2nd half of the year GOP
(JPY M)
0

2.Performance highlights of each HMJ hotel 4
14
CY2010 CY2011 CY2012 CY2013
Occupancy rate 72.2% 73.2% 73.4% 78.0%
ADR(JPY) 25,800 24,934 25,030 25,127
RevPAR (JPY) 18,634 18,243 18,364 19,594
GOP(JPY M) 1,678 1,598 1,627 1,718
GOP ratio 33.3% 31.5% 32.0% 32.0%
Hotel Nikko Alivila
Sales and GOP
Management index
Actual performance from January 2013 through December 2013
Gross sales increased by JPY287M or 5.6% compared with the previous period.
The number of visitors to Okinawa’s islands exceeded that of the previous period and
the market was in good shape. The rooms department strengthened sales through
travel agencies and web agencies and refined revenue management skills. Occupancy
rate and ADR improved and room sales increased by JPY188M or 6.4% compared with
the previous period.
Food and beverage sales increased by JPY62M or 3.7% compared with the previous
period due to improved occupancy rate, etc.
Sales forecast from January 2014 through December 2014
Gross sales are expected to increase by JPY116M or 2.1% compared with the previous
period.
Although some rooms will be closed temporarily for renovation during January
through March, ADR will still increase due to detailed revenue management and
improved guestroom structure. Room sales are expected to increase by JPY92M or
2.9% compared with the previous period.
Wedding and restaurant sales are expected to exceed those of the previous period due
to a strengthened sales system. Food and beverage sales are expected to increase by
JPY21M or 1.2% compared with the previous period.
2,035 1,911 2,041 2,193 2,125
3,005 3,163
3,048 3,183 3,365
5,040 5,074 5,088 5,375 5,491
1,678 1,598 1,627
1,718
0
500
1,000
1,500
2,000
2,500
3,000
3,500
0
1,000
2,000
3,000
4,000
5,000
6,000
7,000
CY2010 CY2011 CY2012 CY2013 CY2014
(Forecast)
GO
P
Sale
s
1st half of the year 2nd half of the year GOP
(JPY M)

2.Performance highlights of each HMJ hotel 5
15
CY2010 CY2011 CY2012 CY2013
Occupancy rate 70.3% 67.1% 72.2% 77.5%
ADR (JPY) 8,876 8,479 8,255 8,446
RevPAR (JPY) 6,240 5,692 5,959 6,545
GOP(JPY M) 311 306 327 350
GOP ratio 15.1% 15.8% 15.3% 15.5%
Oriental Hotel Hiroshima
Sales and GOP
Management index
Actual performance from January 2013 through December 2013
Gross sales increased by JPY117M or 5.5% compared with the previous period.
The rooms department attracted demand from domestic leisure travelers and
occupancy rate and ADR improved. Room sales increased by JPY52M or 9.5%
compared with the previous period.
Wedding sales increased due to a strengthened sales system, and restaurant sales
increased due to improved occupancy rate and various sales measures. Food and
beverage sales increased by JPY72M or 4.7% compared with the previous period.
Sales forecast from January 2014 through December 2014
Gross sales are expected to increase by JPY26M or 1.1% compared with the previous
period.
The rooms department will strive to attract leisure travelers further and raise ADR.
Room sales are expected to increase by JPY3M or 0.4% compared with the previous
period.
Despite growth of general banquet sales, food and beverage sales are forecast to
decline by JPY32M or 2.0% compared with the previous period due to a decrease in
the number of weddings.
1,009 904 989 1,046 1,063
1,058 1,034 1,148
1,208 1,165
2,067 1,939
2,137 2,254 2,229
311 306 327
350
0
100
200
300
400
500
0
500
1,000
1,500
2,000
2,500
CY2010 CY2011 CY2012 CY2013 CY2014
(Forecast)
GO
P
Sale
s
1st half of the year 2nd half of the year GOP
(JPY M)

3.Performance highlights of Ibis Tokyo Shinjuku
16
CY2012 CY2013
Occupancy rate 83.5% 92.8%
ADR(JPY) 9,154 10,240
RevPAR (JPY) 7,641 9,502
GOP(JPY M) 270 371
GOP ratio 42.9% 46.7%
Sales and GOP
Management index
Ibis Tokyo Shinjuku
Actual performance from January 2013 through December 2013
Gross sales increased by JPY167M or 26.5% compared with the previous period.
After rebranding, the rooms department strived to attract business and leisure travelers
through expanded sales channels. Moreover, they attracted increased demand from
overseas travelers through websites centered on the operator’s own website.
Occupancy rate and ADR improved, and room sales increased by JPY136M or 23.5%
compared with the previous period.
Sales forecast from January 2014 through December 2014
Gross sales are expected to increase by JPY18M or 2.8% compared with the previous
period.
The rooms department will continuously strive to attract business and leisure travelers
and overseas travelers while increasing ADR through refined revenue management.
Room sales are expected to increase by JPY19M or 3.2% compared with the previous
period.
313 381 398
316
414
415
629
795 813
270
371
0
100
200
300
400
500
600
700
800
900
0
100
200
300
400
500
600
700
800
900
CY2012 CY2013 CY2014
(Forecast)
GO
P
Sale
s
1st half of the year 2nd half of the year (JPY M)

4.Performance highlights of Ibis Styles Kyoto Station
17
Actual performance after acquisition
Gross sales after rebranding were JPY123M.
JHR rebranded the hotel immediately after the acquisition on October 31, 2013.
The hotel improved its booking website and revised existing contracts with travel
agencies. They strived to attract domestic and overseas leisure travelers.
Sales forecast from January 2014 through December 2014
Gross sales are expected to be JPY720M.
The hotel will strive to restructure its sales system and improve public recognition as
soon as possible. In addition to domestic leisure travelers, the hotel will positively
attract overseas travelers further with the operator’s own network to improve
occupancy rate and ADR.
Sales (Plan for 2014)
Management index on monthly basis after the acquisition
Ibis Styles Kyoto Station
November 2013 December 2013
Occupancy rate 86.4% 69.0%
ADR(JPY) 12,846 9,566
RevPAR(JPY) 11,106 6,599
Sales (JPY M) 76 47
335
385
720
0
100
200
300
400
500
600
700
800
CY2014
(Forecast)
Sale
s
1st half of the year 2nd half of the year
(JPY M)

IV. Characteristics of JHR

1.Accommodate both stability and upside potential
19
Planning and execution of the asset
management strategies
Build cooperative relationship and relationship of
trust with hotels
Strategic capital investment
Increase in rental income, etc. through
improved hotel performances
Capital investment (CAPEX) to retain competitiveness and
proper asset value
Retention/improvement of rent-paying
capacity
Economic trends
Expansion of nonresident population
Tourism nation policy
Overseas travelers
Domestic travelers
Pursue upside Ensure stable revenue
Management
contract method
Variable rent
method Fixed rent method
JHR accommodates both stability and upside potential through mixed various rent systems.

2.Factors which increased room sales from a medium-to-long term perspective
20
“Leisure-oriented”
Japanese mindset
Government’s tourism
nation promotion plan
Abenomics
Increase in the number of Japanese domestic travelers
(Increase in volume of travel and number of travel days)
Ease visa
requirements
Promote MICE(*)
business
Publicize
attractiveness of
Japan
Weak Yen
Asset effect
Income effect
Increase in
overseas travelers
Increase in travel
expenditure of
each individual
Improved occupancy rate
Improvement of
demand and supply
for hotel rooms
Improved average daily
rate
Increase in
room sales
(*) MICE stands for Meeting (business meetings, etc.), Incentive (Corporate training, etc.), Convention (International conventions, etc.), and Exhibitions and Events.
Improvement of
infrastructure for the
Tokyo Olympic Games

3.Utilization of negative goodwill
21
2013
(January to December)
Amount of negative goodwill used
Balance of negative goodwill JPY14,168M
With utilization of negative goodwill, JHR seeks strategic renovation, rebranding and replacement of portfolio assets, while avoiding
impact to profit distribution.
Major policies for
utilizing negative
goodwill
Cope with losses caused by property dispositions in replacing assets.
Prevent dilution at issuance of investment units during the period.
Cope with loss on retirement of noncurrent assets resulting from renovation, etc.
2012
(April to December)
Gain on negative goodwill JPY18,578M
Off-set various losses,
and paid dividend per unit, eliminated
special factors
Balance of negative goodwill
(Dividend allowance) JPY16,017M
Impairment loss : 958M
Loss on disposal of asset : 1,393M
Loss on retirement of Noncurrent assets : 9M
Prevent dilution : 200M
Impairment loss : 517M
Loss on disposal of asset : 1,189M
Loss on retirement of noncurrent assets : 8M
Prevent dilution : 135M
2014
(January to December)
Amount of negative goodwill (plan)
Balance of negative goodwill (plan) JPY14,155M
Loss on retirement of
Noncurrent assets : 13M

4.Preferential treatment for unitholders
22
Eligible recipients of the complimentary coupons and
program launch date
The preferential treatment coupons will be sent to those who hold
ten or more JHR units at the end of June every year (end of the mid-
term settlement).
Detail of the preferential treatment
Five 50% off discount accommodation coupons (50% off discount
from rack rate) and five 20% off restaurant coupons.
Hotels that offer the benefit program
HMJ’s five hotels
Coupon redemption (June 2012 through May 2013)
HMJ’s five hotels
Hotels
Rooms Restaurant
No. of
coupons used
No. of people
who used
No. of
coupons used
No. of people
who used
Kobe Meriken Park Oriental Hotel 109 133 315 880
Oriental Hotel Tokyo Bay 458 533 750 2,228
Namba Oriental Hotel 64 76 29 53
Hotel Nikko Alivila 131 229 292 778
Oriental Hotel Hiroshima 168 175 113 283
Total 930 1,146 1,499 4,222
No. of eligible recipients: 5,376 (Former JHR unitholders as of the end of Feb. 2012)
JHR provides the unitholders with the preferential treatment to improve their satisfaction and expand the investor base.
Hotel Nikko Alivila Namba Oriental Hotel
Oriental Hotel Tokyo Bay Oriental Hotel Hiroshima Kobe Meriken Park Oriental
Hotel

V. Operations strategies

1.Three growth engines and key points of operations strategies
24
Japan Hotel REIT
Investment Corporation
I. Three growth engines II. Points of operations strategies
Power up further !
New acquisition
Increase of variable rent, etc.
Reduction of borrowing cost
External growth strategies
1. Acquire hotels with prospects for attracting domestic and
international leisure travelers.
2. Improve profitability, stability and quality of the entire
portfolio.
Internal growth strategies
1. Increase variable rent, etc. through improved hotel revenue.
2. Set proper fixed rent based on proper rent-paying capacity.
Financial strategies
1. Maintain LTV level at a maximum of 50% for the time being
(total asset base).
2. Diversify fund procurement methods including issuance of
investment corporation bonds
3. Disperse maturity and manage interest rate risk.

2.External growth strategies
25
Perception of the external
environment Basic
policy
Major
policies
Emphasize the superiority of the hardware, software and location of the hotel real estate.
• The prime investment targets are “full-service hotels” and “resort hotels” that have high barriers to entry
due to the necessity of operation and management know-how, capital outlay and location.
• In the case of “limited service hotels”, the credit worthiness of the hotel lessee, the age of the building,
location, guestroom structure and profitability are important.
• Hotels specialized in selling single rooms only are carefully chosen.
Major areas of strategic investment
• Tokyo Metropolitan area, Osaka city, Kyoto city, Fukuoka city, Karuizawa (Nagano prefecture), Hakone
(Kanagawa prefecture), Hokkaido and Okinawa, etc.
Investigation and planning of the internal growth strategy upon property acquisition
• Investigate the appropriate rent level and rent scheme upon renewal, cost reduction possibilities and
hardware improvement potential.
• If hotel pays a variable rent, etc., internal growth is accelerated through collaboration with the lessee and
the operator.
Acquisition of hotel real estate with prospects for attracting “domestic leisure travelers”
and “overseas leisure travelers”.
Improvement of profitability, stability, and quality of the entire portfolio.
Hotel investment market trends
• Improved hotel revenue on the
back of economic recovery and
increased demand from overseas
travelers, and declined yield of
other asset classes intensify
competition to acquire property
in the hotel investment market.
Yields tend to fall at the same
time.
• These trends are likely to
continue and the market price is
forecast to rise.

3.Internal growth strategies
26
Major
policies
Basic
policy
Perception of the external
environment
Monitoring, planning and execution of the asset management strategy based on an in-
depth understanding of the hotel business.
• Analyze the credit worthiness of hotel lessees, understand and improve hotel income and
expenditures.
• Understand ever-changing needs of customers and diligently cope with the changes.
• Provide global level services to hotel users.
• Differentiation strategy that enables “Value competition”, not “Price competition”.
• Propose a hotel organization system that will spur hotel innovation.
Plan and execute strategic capital investment
• Strategic capital investment that will improve profitability and strengthen competitiveness
• Maintain asset value and everyday revenue
Financial management including cost reduction, and maximization of asset value
through proper building maintenance.
Increase variable rent, etc. through improvement of hotel revenues
Maintain proper fixed rent levels based on rent-paying capacity. General Market environment
• The consumption tax hike this April carries a risk of
placing downward pressures on the Japanese
economy. However, the Abe administration’s
economic measures to overcome deflation,
additional aggressive monetary easing policies of
the Bank of Japan against declining consumption
trends, and improved corporate revenue and
wage increase will result in capital investment and
increase in family income. The economy is
expected to recover.
Hotel Market environment
• Demand for hotels will be continuously favorable
due to an increased number of overseas travelers
and domestic leisure and business demand
resulting from improved consumer and business
sentiment. Unit price is expected to increase
continuously in the accommodation market.
• From the medium-to-long-term perspective, 1.
Travel demand from baby boomers, 2. Overseas
travelers promoted by the government’s tourism
nation policies, are expected to increase.

4.Track record and capital investment plan
27
(*1) CAPEX is the capital investment for retaining the proper building, facilities, and equipment values. CAPEX II is the capital investment for the fixtures and furnishings that are not directly related to the building structure or facilities but necessary for operating a hotel. CAPEX III is the strategic capital investment for renewing the guest rooms, banquet rooms and restaurant for maintaining/improving the proper competitiveness of the hotel.
(*2) The actual for FY2006 is the actual of the former JHR for the period from IPO to August 2006 (6.5 months). The actual for FY2007 is the sum of the actual of the former JHR from September 2006 through August 2007 and that of the former NHF from IPO to September 2007 (15.5 months). FY2008 is the sum of the actual of former JHR from September 2007 through August 2008 and that of former NHF from October 2007 through September 2008 (same for FY2009 to FY2011). The sum of CY2012 is the actual from January 2012 through December 2012 (Depreciation expenses are the annualized number for the 13th period.), and the actual for CY2013 is for the period from January 2013 through December 2013. The plan for CY2014 is the plan for the period from January 2014 through December 2014 based on the operating forecast dated December 19, 2013.
(*3) The former NHF and former JHR spent JPY31M (October 2011 through December 2011) and JPY90M (September 2011 through December 2011) respectively, in addition to the amount indicated above.
(*1)
(*2)
(*3)
156
378 322 177
322 281
622 629 770
49
118 283
90
36 213
198 167
162
793
600
1,236
518 233 21
258
58
346 999
1,096
1,842
786
591 516
1,079
854
1,280
668
1,869
2,072
2,212 2,242 2,322
2,214 2,297
2,358
0
500
1,000
1,500
2,000
2,500
FY2006
Actual
FY2007
Actual
FY2008
Actual
FY2009
Actual
FY2010
Actual
FY2011
Actual
CY2012
Actual
CY2013
Actual
CY2014
Plan
(JPY M) CAPEX I CAPEX II CAPEX III Depreciation expenses

5.Major CAPEX Ⅲ by each hotel
28
Unit: JPY M * Numbers in brackets are amount of expenditures.
FY2006
Actual
FY2007
Actual
FY2008
Actual
FY2009
Actual
FY2010
Actual
FY2011
Actual
FY2012
Actual
FY2012(New)
Actual
CY2013
Actual
CY2014
Plan
Former JHR 1st period
(IPO -2006/8)
2nd period
(2006/9-2007/8)
3rd period
(2007/9-2008/8)
4th period
(2008/9-2009/8)
5th period
(2009/9-2010/8)
6th period
(2010/9-2011/8)
7th period
(2011/9-2012/3) 13th period
2012/4-2012/12
14th period
2013/1-2013/12
15th period
2014/1-2014/12 Former NHF - 2nd to 3rd period
(IPO -2007/9)
4th to 5th period
(2007/10-2008/9)
6th to 7th period
(2008/10-2009/9)
8th to 9th period
(2009/10-2010/9)
10th to 11th period
(2010/10-2011/9)
12th period
(2011/10-2012/3)
Kobe Meriken Park
Oriental Hotel
• Guest rooms on
12th and 13th floors
(189) • Restaurant (51)
• Guest rooms on
10th and 11th floors
(222) • Pier (98)
• Bride’s room (68) • Banquet room (46)
- - - - -
Oriental Hotel Tokyo Bay
• Guest rooms on 9th
and 10th floors
(145) • Banquet room (59)
• Guest rooms on 7th
and 8th floors (171) • Restaurant (58)
• Guest rooms on 5th
and 6th floors (210) • Lobby (60)
-
• Chapel (77) • Guest rooms, etc.
on 12th floor (135)
- • Restaurant (79) - • Restaurant (45)
Namba Oriental Hotel • Guest rooms on 7th
and 8th floors (93) • Restaurant (40) - -
• Guest rooms on 4th
floor and corridors
on 4th, 5th and 6th
floors (20)
- - -
• Corner rooms on
5th to 8th floors
(10)
Hotel Nikko Alivila • Suite (32) • Restaurant (155)
- • Guest rooms on 3rd
to 8th floors (479)
• Guest rooms on 1st
to 6th floors of
South and West
wings (361)
- - - -
• Guest rooms on 3rd
to 8th floors of
North building and
3rd to 5th floors of
Central building
(332) • Bar (10)
Oriental Hotel Hiroshima N/A (Acquired in Oct.
2007)
• Guest rooms on 7th
to 18th floors (347) • Tenant floor (23)
• Banquet rooms on
3rd and 4th floors
(138) -
• Renovation of
banquet room on
3rd floor.
Renovation of
corner double
room to twin room
(21)
- • Chapel on 3rd floor(9)
• Restaurant and bar
on 1st floor (3)
• Banquet rooms on
23rd floor (5)
Ibis Tokyo Shinjuku N/A - - - - - -
• Lobby and restaurant
on 2nd floor, and
guest rooms on 3rd,
5th, 6th and 9th floors
(170)
Ibis Styles Kyoto Station N/A N/A N/A N/A N/A N/A N/A N/A (Acquired in Oct. 2013)
Rebranding project
Repositioning project
Rebranding project
Rebranding project

As of the end of December
2012
As of the end of December
2013
LTV (total asset base) 46.7% 43.8%
Interest rate
fixation ratio (including purchase of cap
contract)
51.2% 65.5%
6.Financial strategy
29
Basic
policy
Key
measures
Maintain LTV level at a maximum of 50% (total asset
base) for the time being.
Diverse fund procurement methods including issuance
of the investment corporation bonds
Disperse maturity
Interest-rate risk management while preparing for
interest rate hike.
Ensure financial health and stability
Strengthen bank formation and relationships with
financial institutions
Repayment schedule of the interest-bearing debts
Lender list for the interest-bearing debts (JPY M)
(As of the end of December 2013) 3.6%
93.1%
3.3% 5.9% 3.1%
Breakdown of the
interest-bearing debts
Short-term loan
Investment Corporation
Bonds
Long-term loan
(*) Long term loan: Original loan maturity
over one year.
Short term loan: Original loan maturity
within one year.
91.0%
Lenders/Bonds
Balance as of the end of
previous period (As of 12/2012)
Balance as of the end of
this period (As of 12/2013)
Variance
(Balance)
Balance Ratio Balance Ratio
Sumitomo Mitsui Banking Corporation 17,518 26.9% 19,365 25.9% 1,846
Shinsei Bank, Ltd. 8,524 13.1% 9,735 13.0% 1,210
The Tokyo Star Bank, Limited 6,384 9.8% 7,520 10.1% 1,135
Resona Bank, Limited 6,379 9.8% 6,000 8.0% ▲ 379
Mizuho Bank, Ltd. 4,969 7.6% 5,769 7.7% 800
Sumitomo Mitsui Trust Bank, Limited 4,949 7.6% 5,506 7.4% 557
MetLife Alico Life Insurance K.K. 5,000 7.7% 5,000 6.7% -
The Norinchukin Bank 4,969 7.6% 4,769 6.4% ▲ 200
The Nomura Trust and Banking Co., Ltd. 1,909 2.9% 3,794 5.1% 1,884
The Chiba Bank, Ltd. 759 1.2% 1,670 2.2% 910
Hiroshima Bank, Ltd. 1,000 1.5% 1,000 1.3% -
Development Bank of Japan Inc. - - 895 1.2% 895
Sompo Japan Insurance Inc. 854 1.3% 760 1.0% ▲ 94
The Bank of Fukuoka, Ltd. - - 497 0.7% 497
Sub-total of loans 63,220 96.9% 72,284 96.7% 9,063
1st unsecured investment corporation bonds 2,000 3.1% - - ▲ 2,000
2nd unsecured investment corporation bonds - - 2,500 3.3% 2,500
Sub-total of investment corporation bonds 2,000 3.1% 2,500 3.3% 500
Total interest-bearing loans 65,220 100.0% 74,784 100.0% 9,563

Basic information
Appendix 1

1.Property list(1/2)
31
No. Property name Hotel type Grade
No. of
guest
rooms
Location Age Purchase
price Book value
Appraisal value
Investment
ratio
Income from
leasing
business
NOI P/L of leasing
business
NOI
yield
NOI
yield
(Reference
after
adjustment)
13th period (as of 2012.12.31)
14th period (as of 2013.12.31)
Appraisal
value CAP rate
Appraisal
value CAP rate
(JPY M) (JPY M) (JPY M) (JPY M) (JPY 1000) (JPY 1000) (JPY 1000) (*1) (*2) (*3) (*4) (*5) (*6) (*7) (*8) (*9) (*9) (*9) (*10) (*11)
1 Kobe Meriken Park Oriental Hotel Full-service Upper-middle 319 Hyogo 18.5 10,900 10,531 10,900 6.3% 10,900 6.1% 6.9% 1,072,641 731,918 378,250 6.7% 6.7%
2 Oriental Hotel Tokyo Bay Full-service Mid-price 503 Chiba 18.7 19,900 19,381 21,000 5.2% 21,400 5.1% 12.5% 1,629,282 1,516,771 1,023,721 7.6% 7.6%
3 Namba Oriental Hotel Limited-service Mid-price 257 Osaka 17.8 15,000 14,846 15,200 5.4% 15,400 5.2% 9.4% 974,179 872,622 707,695 5.8% 5.8%
4 Oriental Hotel Hiroshima Full-service Upper-middle 227 Hiroshima 20.3 4,100 4,065 4,100 8.0% 4,100 8.0% 2.6% 438,987 389,985 323,052 9.5% 9.5%
5 Hotel Nikko Alivila Resort Luxury 396 Okinawa 19.8 18,900 18,537 19,600 6.2% 19,900 6.1% 11.9% 1,392,466 1,238,324 899,017 6.6% 6.6%
6 The Beach Tower Okinawa Resort Mid-price 280 Okinawa 9.8 7,610 7,053 7,090 6.0% 7,440 5.7% 4.8% 511,023 466,730 349,804 6.1% 6.1%
7 Hakone Setsugetsuka Resort Mid-price 158 Kanagawa 7.3 4,070 3,939 4,190 6.3% 4,260 6.2% 2.6% 294,946 269,669 187,507 6.6% 6.6%
8 Dormy Inn Kumamoto Limited-service Mid-price 294 Kumamoto 5.9 2,334 2,307 2,610 6.7% 2,660 6.6% 1.5% 194,460 171,885 132,412 7.4% 7.4%
9 Dormy Inn Namba Limited-service Economy 105 Osaka 14.9 1,270 684 1,090 6.5% 700 - 0.8% 87,720 77,027 58,801 6.1% 6.1%
10 Dormy Inn Suidobashi Limited-service Economy 99 Tokyo 27.4 1,120 1,065 1,011 5.8% 1,030 5.7% 0.7% 84,000 73,095 61,922 6.5% 6.5%
11 Dormy Inn EXPRESS Asakusa(*12) Limited-service Economy 77 Tokyo 16.8 999 984 929 5.2% 950 5.1% 0.6% 63,995 52,410 39,669 5.2% 5.2%
12 Hakata Nakasu Washington Hotel Plaza Limited-service Mid-price 247 Fukuoka 18.8 2,130 2,096 2,130 6.1% 2,210 6.1% 1.3% 240,000 222,000 197,000 10.4% 10.4%
13 Nara Washington Hotel Plaza Limited-service Mid-price 204 Nara 13.8 2,050 1,987 2,060 6.3% 2,090 6.2% 1.3% 153,000 135,000 95,000 6.6% 6.6%
14 R&B Hotel Ueno-Hirokoji Limited-service Economy 187 Tokyo 11.8 1,720 1,741 1,540 5.2% 1,580 5.1% 1.1% 100,143 83,836 71,775 4.9% 4.9%
15 R&B Hotel Higashi-Nihombashi Limited-service Economy 203 Tokyo 15.8 1,534 1,496 1,670 5.6% 1,710 5.5% 1.0% 122,207 103,202 87,376 6.7% 6.7%
16 Comfort Hotel Tokyo Higashi-Nihombashi Limited-service Economy 259 Tokyo 5.9 3,746 3,719 4,310 5.7% 4,410 5.6% 2.4% 270,114 239,567 204,589 6.4% 6.4%
17 Comfort Hotel Shin-Yamaguchi Limited-service Economy 139 Yamaguchi 6.4 866 813 786 6.5% 805 6.4% 0.5% 60,529 51,411 36,916 5.9% 5.9%

1.Property list(2/2)
32
(*1) “Full-service” is a full-service hotel, “Resort” is a resort hotel, and “Limited-service” is a limited service hotel.
(*2) In terms of ADR, etc., JHR has classified the hotels into four categories such as “luxury”, “Upper-middle”, “mid-price” and “Economy”.
(*3) Average age: The sum of (Purchase price x property age) / Total purchase price.
(*4) The purchase price on the Purchase Agreement for the Beneficial Interest in Trust or Real Estate Purchase Agreement is indicated., excluding consumption tax, brokerage fee and other purchase related costs.
(*5)Book value as of the end of December 2013.
(*6)No. 26 and No. 28 are appraisal values at the time of acquisition.
(*7)No. 9 was sold on January 24, 2014 and appraisal value shows disposition price. (No appraisal value is available as of December 31, 2013.)
(*8)Investment ratio: The percentage of the purchase price to the total purchase price. Fractions after two decimal places are rounded off.
(*9)Actual for the period from January 2013 to December 2013. The actual for the disposed two properties (Hotel Vista Hashimoto , Pearl Hotel Kayabacho) are included (Real estate operating income: 235,144 thousand yen, NOI: 199,437 thousand yen, Real estate profit and loss: 163,379 thousand yen).
Lessee did not agree to disclose numbers in units of JPY1000 for Nos. 12, 13 and 18. Fractions less than JPY1M are rounded down.
(*10)The actual NOI yields were not calculated for No. 26 and No. 28, as they were acquired in this period. The overall NOI yield= Actual NOI for FY12/2013 / Total purchase price of the assets owned at the end of the period.
(*11)With respect to the acquired/disposed properties, each NOI is calculated by annualizing the actual NOI (Actual NOI / holding period x 365 days).
(*12)”Dormy Inn Asakusa” was changed to “Dormy Inn EXPRESS Asakusa” in February 1, 2014. (The same applies hereafter.)
No. Property name Hotel type Grade
No. of
guest
rooms
Location Age Purchase
price Book value
Investment
ratio
Income from
leasing
business
NOI P/L of leasing
business
NOI
yield
NOI
yield (Reference
after
adjustment)
13th period (as of 2012.12.31)
14th period (as of 2013.12.31)
Appraisal
value CAP rate
Appraisal
value CAP rate
(JPY M) (JPY M) (JPY M) (JPY M) (JPY 1000) (JPY 1000) (JPY 1000)
(*1) (*2) (*3) (*4) (*5) (*6) (*7) (*8) (*9) (*9) (*9) (*10) (*11)
18 Daiwa Roynet Hotel Akita Limited-service Economy 221 Akita 7.6 1,760 1,706 1,770 6.7% 1,770 6.7% 1.1% 138,000 124,000 89,000 7.1% 7.1%
19 Smile Hotel Nihombashi-Mitsukoshimae Limited-service Economy 164 Tokyo 16.8 2,108 2,054 2,160 5.2% 2,210 5.1% 1.3% 134,400 116,595 98,507 5.5% 5.5%
20 Hotel Sunroute Niigata Limited-service Mid-price 231 Niigata 21.4 2,105 1,956 1,840 6.6% 1,870 6.5% 1.3% 156,001 136,301 100,026 6.5% 6.5%
21 Toyoko Inn Hakataguchi Ekimae Limited-service Economy 257 Fukuoka 12.3 1,652 1,541 1,930 6.3% 2,060 6.1% 1.0% 141,039 127,776 106,385 7.7% 7.7%
22 Hotel Keihan Universal City Resort Mid-price 330 Osaka 12.5 6,000 6,125 6,840 6.6% 7,070 6.4% 3.8% 561,978 494,538 413,569 8.2% 8.2%
23 Chisan Inn Kamata Limited-service Economy 70 Tokyo 10.7 823 821 671 6.0% 712 5.8% 0.5% 50,142 38,291 27,852 4.7% 4.7%
24 Hotel Vista Kamata Tokyo Limited-service Economy 106 Tokyo 21.9 1,512 1,464 1,080 5.8% 1,290 5.5% 1.0% 93,604 75,665 50,418 5.0% 5.0%
25 Hotel Sunroute Shimbashi Limited-service Mid-price 220 Tokyo 5.8 4,800 4,914 5,670 5.1% 5,720 5.1% 3.0% 350,121 295,151 274,078 6.1% 6.1%
26 Hilton Tokyo Bay Hotel Resort Luxury 818 Chiba 25.5 26,050 26,264 29,400 5.1% 29,500 5.1% 16.4% 1,283,669 1,169,472 1,055,538 - 6.6%
27 Ibis Tokyo Shinjuku Limited-service Mid-price 206 Tokyo 33.3 7,243 7,478 5,510 5.2% 5,740 5.3% 4.6% 545,640 352,313 292,774 4.9% 4.9%
28 Ibis Styles Kyoto Station Limited-service Mid-price 215 Kyoto 4.8 6,600 6,770 6,740 5.2% 6,750 5.2% 4.2% 92,775 81,750 74,815 - 7.3%
Total or Average - - 6,792 - 17.7 158,902 156,350 163,827 - 166,237 - 100% 11,472,924 9,907,696 7,602,340 6.2% 6.7%

2.Summary of lease contracts (1/2)
33
No. Property name Rent type Lessee
Hotel
operator/Hotel
consulting and
management
company
Lease
tem
Remaining
contract
term
Contractual rent Rent summary
Rent modification
summary (Acquisition to
2012)
Rent modification schedule (2013~2015)
Term Condition 2013 2014 2015 (*1) (*2) (*3) (*4)
1 Kobe Meriken Park Oriental Hotel
Fixed
+
Variable
Hotel
Management
Japan Co., Ltd.
Abilitas Hospitality
Co., Ltd. 8 6
<Fixed rent>
JPY3,221M +
<Variable rent> (When the total GOP of
HMJ’s five hotels exceeds
GOP base amount
(JPY3,351M), the excess x
81.5% is paid.)
The same rent will be applied until
expiration of the contract.
(Fixed rent)
Sep. 2011 Scheme is
modified. - - -
2 Oriental Hotel Tokyo Bay
3 Namba Oriental Hotel
4 Oriental Hotel Hiroshima
5 Hotel Nikko Alivila JAL Hotels Co., Ltd.
6 The Beach Tower Okinawa Fixed
Kyoritsu Maintenance Co., Ltd.
20 13 JPY42M/month The same rent will be applied until
expiration of the contract. - - - - -
7 Hakone Setsugetsuka Fixed 20 13 JPY24M/month The same rent will be applied until
expiration of the contract. - - - - -
8 Dormy Inn Kumamoto Fixed 12 9 JPY16M/month Rent can be modified through
mutual agreement every three years. - - -
To be
renewed
(Apr.)
-
9 Dormy Inn Namba Fixed (Sold in January 24, 2014.)
10 Dormy Inn Suidobashi Fixed 10 1 JPY7M/month The same rent will be applied until
expiration of the contract. - - - -
Expire
(Jun.)
11 Dormy Inn EXPRESS Asakusa Fixed 20 3 JPY5M/month Rent can be modified through
mutual agreement every three years. Apr. 2012 Same - -
To be
renewed
(Apr.)
12 Hakata Nakasu Washington Hotel Plaza Fixed
Washington Hotel K.K.
20 1 JPY20M/month
The same rent is applied from April
21, 2012 though expiration of the
contract.
Apr. 2012 Reduced (-7.5%)
- - Expire
(Mar.)
13 Nara Washington Hotel Plaza Fixed 20 6 JPY11M/month Rent can be modified through
mutual agreement. - - - - -
14 R & B Hotel Ueno-Hirokoji Fixed 20 8 JPY8M/month Rent can be modified through
mutual agreement. Apr. 2011
Increased (+3.0%)
- - -
15 R & B Hotel Higashi-Nihombashi Fixed 20 4 JPY10M/month Rent can be modified through
mutual agreement. Apr. 2010
Increased (+5.0%)
Renewed with
same rent
(Apr.)
- -
16 Comfort Hotel Tokyo Higashi Nihombashi Fixed
Greens Co., Ltd.
20 14 JPY21M/month Rent can be modified through
mutual agreement every five years. - -
Renewed with
same rent
(Jan.)
- -
17 Comfort Hotel Shin-Yamaguchi Fixed 20 14 JPY5M/month Rent can be modified through
mutual agreement every three years. Sep. 2010 Same
Renewed with
same rent
(Sep.)
- -
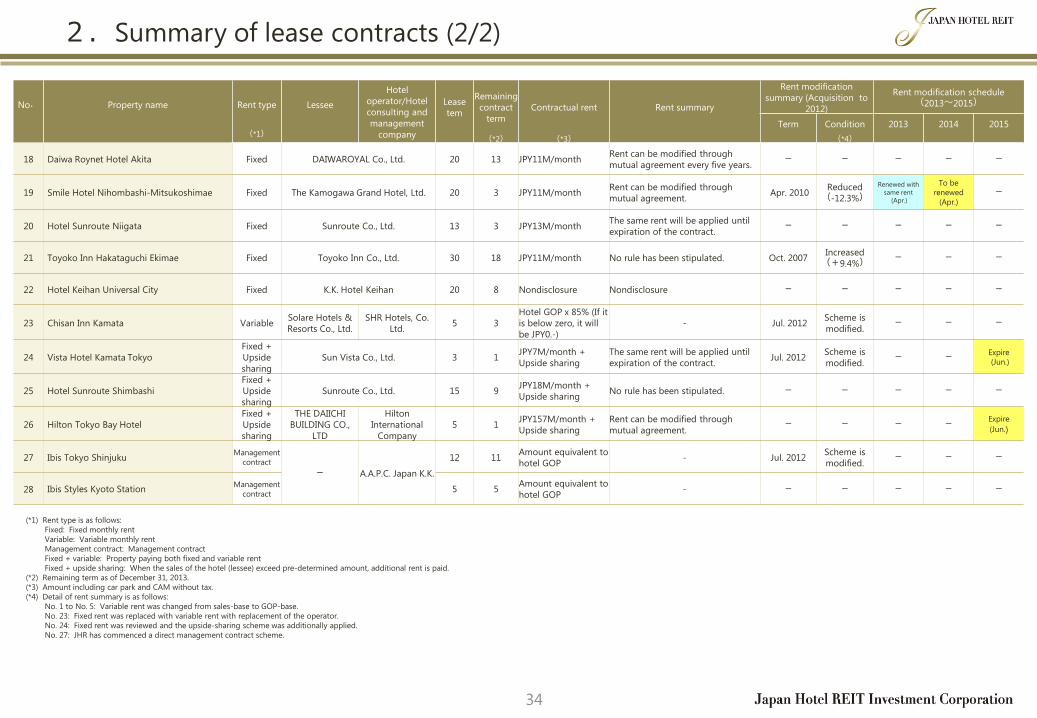
2.Summary of lease contracts (2/2)
34
No. Property name Rent type Lessee
Hotel
operator/Hotel
consulting and
management
company
Lease
tem
Remaining
contract
term
Contractual rent Rent summary
Rent modification
summary (Acquisition to
2012)
Rent modification schedule (2013~2015)
Term Condition 2013 2014 2015 (*1)
(*2) (*3) (*4)
18 Daiwa Roynet Hotel Akita Fixed DAIWAROYAL Co., Ltd. 20 13 JPY11M/month Rent can be modified through
mutual agreement every five years. - - - - -
19 Smile Hotel Nihombashi-Mitsukoshimae Fixed The Kamogawa Grand Hotel, Ltd. 20 3 JPY11M/month Rent can be modified through
mutual agreement. Apr. 2010
Reduced (-12.3%)
Renewed with
same rent
(Apr.)
To be
renewed
(Apr.)
-
20 Hotel Sunroute Niigata Fixed Sunroute Co., Ltd. 13 3 JPY13M/month The same rent will be applied until
expiration of the contract. - - - - -
21 Toyoko Inn Hakataguchi Ekimae Fixed Toyoko Inn Co., Ltd. 30 18 JPY11M/month No rule has been stipulated. Oct. 2007 Increased (+9.4%)
- - -
22 Hotel Keihan Universal City Fixed K.K. Hotel Keihan 20 8 Nondisclosure Nondisclosure - - - - -
23 Chisan Inn Kamata Variable Solare Hotels &
Resorts Co., Ltd.
SHR Hotels, Co.
Ltd. 5 3
Hotel GOP x 85% (If it
is below zero, it will
be JPY0.-)
- Jul. 2012 Scheme is
modified. - - -
24 Vista Hotel Kamata Tokyo
Fixed +
Upside
sharing
Sun Vista Co., Ltd. 3 1 JPY7M/month +
Upside sharing
The same rent will be applied until
expiration of the contract. Jul. 2012
Scheme is
modified. - -
Expire
(Jun.)
25 Hotel Sunroute Shimbashi
Fixed +
Upside
sharing
Sunroute Co., Ltd. 15 9 JPY18M/month +
Upside sharing No rule has been stipulated. - - - - -
26 Hilton Tokyo Bay Hotel
Fixed +
Upside
sharing
THE DAIICHI
BUILDING CO.,
LTD
Hilton
International
Company
5 1 JPY157M/month +
Upside sharing
Rent can be modified through
mutual agreement. - - - -
Expire
(Jun.)
27 Ibis Tokyo Shinjuku Management
contract
- A.A.P.C. Japan K.K.
12 11 Amount equivalent to
hotel GOP - Jul. 2012
Scheme is
modified. - - -
28 Ibis Styles Kyoto Station Management
contract 5 5
Amount equivalent to
hotel GOP - - - - - -
(*1) Rent type is as follows:
Fixed: Fixed monthly rent
Variable: Variable monthly rent
Management contract: Management contract
Fixed + variable: Property paying both fixed and variable rent
Fixed + upside sharing: When the sales of the hotel (lessee) exceed pre-determined amount, additional rent is paid.
(*2) Remaining term as of December 31, 2013.
(*3) Amount including car park and CAM without tax.
(*4) Detail of rent summary is as follows:
No. 1 to No. 5: Variable rent was changed from sales-base to GOP-base.
No. 23: Fixed rent was replaced with variable rent with replacement of the operator.
No. 24: Fixed rent was reviewed and the upside-sharing scheme was additionally applied.
No. 27: JHR has commenced a direct management contract scheme.

3.JHR’s operation methods
35
Type of rent Fixed rent Fixed rent + Upside sharing Fixed rent + Variable rent Variable rent Management contract scheme
Total
Type of contract Lease contract Lease contract Lease contract Lease contract Management contract
Detail
JHR receives fixed rent on
monthly basis.
JHR receives fixed rent on
monthly basis.
JHR receives fixed rent on monthly
basis. - - -
-
When lessee’s sale exceeds the
pre-agreed amount, JHR receives
additional rent.
JHR receives variable rent
according to the following formula:
JHR receives variable rent
according to the following formula:
Hotel’s GOP is JHR’s revenue.
-
There is no assurance that the hotel
sales will exceed the pre-agreed
amount every year. Thus, there is
no guarantee that JHR can share
the upside every year.
There is almost no case where GOP
goes down below zero. Thus, JHR
receives variable rent every year in
principle.
There is almost no case where GOP
goes down below zero. Thus, JHR
receives variable rent every year in
principle.
JHR pays fees from the income
above (hotel GOP).
Economic sensitivity Low Relatively higher High High High -
Operating income (%)
3,549M
(30.9%)
1,727M
(15.1%)
5,507M
(48.0%)
50M
(0.4%)
638M
(5.6%)
11,472M
(100.0%)
Break-down
Fixed portion (%)
3,549M (30.9%)
1,693M (14.8%)
3,221M (28.1%)
- 196M
(1.7%)
8,661M (75.5%)
Variable portion (%)
- 34M
(0.3%)
2,285M (19.9%)
50M (0.4%)
441M (3.9%)
2,811M (24.5%)
Involvement in hotel
operation Low Low High High High -
CAPEX paid by JHR
1) Renewal of building and facilities 1) Renewal of building and facilities
<3) Strategic investment>
1) Renewal of building and facilities
2) Fixtures and equipment
3) Strategic investment
1) Renewal of building and facilities
2) Fixture and equipment
3) Strategic investment
1) Renewal of building and facilities
2) Fixture and equipment
3) Strategic investment
-
No. of properties 17(*) 3 5 1 2 28
Purchase price (%)
43,074M
(27.1%)
32,362M
(20.4%)
68,800M
(43.3%)
823M
(0.5%)
13,843M
(8.7%)
158,902M
(100.0%)
Hotels
Hakone Setsugetsuka Hotel Sunroute Shimbashi Kobe Meriken Park Oriental Hotel Chisan Inn Kamata Ibis Tokyo Shinjuku
-
Hotel Keihan Universal City Hilton Tokyo Bay Hotel Oriental Hotel Tokyo Bay Ibis Styles Kyoto Station
The Beach Tower Okinawa Hotel Vista Kamata Tokyo Namba Oriental Hotel
Dormy Inn Kumamoto Hotel Nikko Alivila
(13 other hotels*) Oriental Hotel Hiroshima
Excess of sales
× Pre-agreed %
GOP of Hotel (lessee) x
Pre-agreed %
GOP of hotel (lessee) x
Pre-agreed %
Stability Upside
*One property (Dormy Inn Namba) was sold in January 24, 2014.

4.Portfolio map (as of the end of December 2013)
36
Hotel type
Area
Grade
Tokyo 23 wards
9 3
17
21 12
8
13
20
18
27
10
14
19
25
24
23
15 16
11
7
4
1
2
22
26
5 6
28
Resort hotel
Full-service hotel
Limited-service hotel
Kobe Meriken Park
Oriental Hotel
Oriental Hotel Tokyo
Bay
Namba Oriental
Hotel
Hotel Nikko
Alivila Oriental Hotel
Hiroshima The Beach Tower
Okinawa
Hotel Setsugetuka Dormy Inn
Kumamoto
Dormy Inn
Namba (*)
Hakata Nakasu
Washington Hotel Plaza Nara Washington
Hotel Plaza
Comfort Hotel Shin
Yamaguchi
Daiwa Roynet Hotel Akita
Hotel Sunroute
Niigata
Ibis Tokyo Shinjuku
Toyoko Inn Hakataguchi
Ekimae Hotel Keihan Universal
City
Hilton Tokyo Bay Hotel
Dormy Inn
Suidobashi
Dormy Inn
EXPRESS Asakusa
R&B Hotel
Ueno Hirokoji R&B Hotel Higashi-
Nihombashi
Comfort Hotel Tokyo
Higashi Nihombashi
Ibis Styles Kyoto Station
Smile Hotel Nihombashi
Mitsukoshimae
Hotel Vista Kamata
Tokyo Chisan Inn Kamata Hotel Sunroute
Shimbashi
1 2 3 5 4 6 7 8
9 9 10 11 14
16
15 12 13
17 18
20
28 27
21 22
26
19
24 23 25
(*) Disposed in January 14, 2014.

5.Major properties
37
Property
Name
Kobe Meriken Park
Oriental Hotel Oriental Hotel Tokyo Bay Namba Oriental Hotel Hotel Nikko Alivila Oriental Hotel Hiroshima
Hotel
Type Full-service hotel Full-service hotel Limited-service hotel Resort hotel Full-service hotel
Photo-
graph
Location Chuo-ku, Kobe city, Hyogo Urayasu city, Chiba Chuo-ku, Osaka city, Osaka Yomitanson, Nakagami-gun,
Okinawa
Naka-ku, Hiroshima city,
Hiroshima
No. of
rooms 319 503 257 396 227
Year built July 1995/June 2001 May 1995 March 1996 April 1994 September 1993/
September 2006 (extended)
Map

Index data for the major hotels with variable rents
Appendix 2

1.Hotel performance indicators (1)
39
HMJ’s five hotels in total January February March April May June July August September October November December Total
Sales (JPY M)
2010 1,396 1,462 1,843 1,655 1,961 1,572 1,910 2,382 1,755 1,986 1,727 1,749 21,396
2011 1,466 1,390 1,341 1,296 1,640 1,387 1,940 2,282 1,727 1,974 1,904 1,876 20,223
2012 1,402 1,416 1,935 1,677 1,655 1,594 1,966 2,367 1,707 1,854 1,864 1,874 21,312
2013 1,410 1,355 1,915 1,711 1,806 1,599 1,994 2,543 1,849 1,891 1,943 1,976 21,994
Occupancy rate
2010 66.1% 76.2% 80.8% 80.1% 79.3% 78.6% 81.9% 91.5% 87.9% 86.1% 79.6% 76.2% 80.4%
2011 74.6% 75.8% 61.3% 52.6% 69.2% 72.0% 82.3% 90.4% 87.3% 88.0% 86.3% 80.7% 76.7%
2012 72.3% 79.4% 85.3% 79.5% 77.5% 79.3% 83.1% 93.2% 87.0% 88.7% 86.5% 80.5% 82.7%
2013 75.1% 84.1% 89.1% 85.3% 84.1% 83.6% 87.5% 94.8% 88.9% 88.6% 88.6% 82.8% 86.1%
ADR (JPY)
2010 12,971 11,870 15,846 13,518 16,494 13,104 19,105 25,288 15,745 15,203 13,833 16,063 15,980
2011 12,912 12,213 14,091 14,006 14,926 12,328 18,983 25,157 16,284 15,240 13,705 16,731 15,846
2012 12,907 11,693 16,093 14,920 15,875 13,511 19,236 25,365 15,725 14,982 14,723 17,174 16,200
2013 13,640 12,454 16,252 15,417 16,113 13,994 20,338 28,240 17,674 16,150 16,080 18,840 17,297
RevPAR (JPY)
2010 8,572 9,044 12,797 10,827 13,082 10,307 15,641 23,148 13,846 13,089 11,018 12,242 12,845
2011 9,632 9,258 8,642 7,368 10,322 8,876 15,631 22,748 14,223 13,404 11,825 13,498 12,160
2012 9,337 9,289 13,730 11,866 12,300 10,718 15,982 23,628 13,682 13,291 12,740 13,822 13,400
2013 10,242 10,471 14,481 13,156 13,546 11,703 17,803 26,779 15,707 14,317 14,246 15,595 14,886
Kobe Meriken Park Oriental Hotel January February March April May June July August September October November December Total
Sales (JPY M)
2010 406 429 476 447 608 434 434 493 448 608 511 518 5,812
2011 372 358 445 439 531 401 468 490 456 555 532 507 5,554
2012 359 357 508 448 459 413 439 481 440 498 538 526 5,466
2013 343 321 446 422 485 398 398 458 435 475 508 520 5,210
Occupancy rate
2010 70.7% 71.6% 78.6% 78.5% 75.7% 80.3% 80.4% 91.7% 86.7% 88.3% 82.8% 89.6% 81.3%
2011 66.5% 61.4% 74.7% 61.4% 83.3% 76.0% 74.0% 87.6% 83.0% 83.3% 82.9% 81.9% 76.5%
2012 61.7% 68.8% 82.3% 76.1% 79.9% 78.4% 78.1% 94.3% 86.2% 85.2% 84.1% 84.6% 80.0%
2013 68.7% 70.2% 85.0% 82.8% 79.6% 76.4% 78.8% 92.6% 84.2% 86.3% 86.2% 86.7% 81.5%
ADR (JPY)
2010 12,485 11,480 12,853 11,964 15,248 12,156 13,273 16,344 12,966 13,891 13,084 15,787 13,564
2011 12,050 12,149 13,876 14,140 14,722 12,390 14,860 18,026 14,827 15,290 13,841 17,598 14,645
2012 13,055 11,582 13,142 13,529 14,771 12,695 13,645 16,909 13,916 14,523 14,555 17,964 14,326
2013 12,623 12,644 12,823 12,952 15,424 12,591 14,265 18,025 14,389 14,047 15,032 17,981 14,526
RevPAR (JPY)
2010 8,821 8,216 10,105 9,387 11,537 9,767 10,669 14,986 11,240 12,261 10,835 14,140 11,027
2011 8,019 7,456 10,364 8,676 12,263 9,420 10,997 15,795 12,303 12,740 11,473 14,407 11,197
2012 8,049 7,968 10,812 10,302 11,799 9,956 10,659 15,946 11,991 12,378 12,234 15,199 11,464
2013 8,677 8,880 10,896 10,728 12,272 9,614 11,237 16,689 12,114 12,123 12,962 15,585 11,844

1.Hotel performance indicators (2)
40
Oriental Hotel Tokyo Bay January February March April May June July August September October November December Total
Sales(JPY M)
2010 474 442 610 486 605 513 501 618 513 649 612 585 6,608
2011 510 462 262 211 393 382 456 599 516 657 643 657 5,748
2012 488 458 669 509 565 532 503 667 509 600 614 649 6,762
2013 485 435 670 525 597 496 557 748 610 664 689 705 7,182
Occupancy rate
2010 76.4% 85.4% 91.7% 82.5% 89.4% 91.1% 88.6% 96.2% 97.9% 97.6% 94.8% 90.1% 90.2%
2011 87.5% 91.1% 44.4% 17.9% 53.5% 68.1% 85.8% 99.6% 98.7% 99.1% 99.2% 99.1% 78.7%
2012 90.2% 97.4% 98.8% 83.7% 91.3% 93.2% 87.6% 98.9% 97.9% 96.2% 97.1% 96.0% 94.0%
2013 90.5% 98.7% 98.7% 87.8% 95.5% 97.6% 94.2% 98.5% 98.2% 98.6% 98.7% 97.0% 96.1%
ADR(JPY)
2010 13,368 11,895 19,625 14,706 17,685 13,791 15,439 22,103 15,114 18,124 16,369 18,878 16,583
2011 14,091 12,845 14,156 12,410 13,643 11,529 14,337 22,130 16,379 17,732 15,505 19,097 15,941
2012 13,416 12,374 20,142 17,288 17,433 14,071 15,932 24,549 15,971 18,322 18,496 20,467 17,469
2013 14,727 13,440 21,267 18,545 19,079 15,398 19,583 30,210 20,733 21,534 21,780 23,789 20,125
RevPAR(JPY)
2010 10,208 10,160 18,003 12,135 15,805 12,558 13,678 21,262 14,798 17,690 15,521 17,008 14,950
2011 12,330 11,706 6,291 2,217 7,301 7,855 12,294 22,046 16,174 17,576 15,388 18,922 12,542
2012 12,106 12,051 19,906 14,463 15,922 13,109 13,958 24,286 15,631 17,625 17,964 19,649 16,425
2013 13,322 13,264 20,983 16,279 18,230 15,027 18,446 29,754 20,354 21,242 21,493 23,069 19,349
Namba Oriental Hotel January February March April May June July August September October November December Total
Sales (JPY M)
2010 141 136 181 151 159 146 155 175 150 154 156 166 1,870
2011 151 140 162 161 164 163 179 171 142 152 148 176 1,909
2012 142 141 154 157 152 140 153 177 151 159 163 170 1,858
2013 150 148 165 161 158 152 164 188 160 167 175 184 1,972
Occupancy rate
2010 75.5% 76.6% 83.4% 85.8% 80.3% 78.3% 79.6% 88.0% 82.9% 79.5% 85.5% 84.0% 81.6%
2011 78.2% 79.4% 86.1% 89.8% 89.0% 93.5% 98.4% 92.9% 83.3% 83.4% 86.1% 86.8% 87.3%
2012 79.5% 75.4% 88.3% 92.0% 84.7% 82.5% 86.5% 96.5% 89.0% 94.0% 93.1% 89.3% 87.6%
2013 86.5% 95.1% 94.6% 90.2% 87.7% 88.8% 93.5% 97.0% 90.8% 93.9% 94.4% 90.8% 91.9%
ADR (JPY)
2010 9,025 8,835 9,812 9,520 10,333 8,953 9,893 10,145 9,460 9,902 9,896 10,090 9,677
2011 9,496 9,487 10,751 10,580 10,340 10,170 11,053 10,419 9,677 10,124 9,741 10,778 10,250
2012 9,429 8,929 9,861 10,276 10,036 8,995 9,875 11,368 9,634 9,713 10,806 11,138 10,049
2013 9,566 9,687 10,440 11,106 10,413 9,847 10,384 12,594 10,736 10,983 12,153 12,811 10,918
RevPAR (JPY)
2010 6,813 6,769 8,179 8,164 8,294 7,011 7,874 8,923 7,841 7,871 8,464 8,473 7,899
2011 7,431 7,530 9,257 9,503 9,198 9,513 10,878 9,683 8,056 8,447 8,389 9,358 8,949
2012 7,499 6,732 8,705 9,449 8,500 7,424 8,545 10,974 8,578 9,130 10,056 9,947 8,805
2013 8,276 9,208 9,875 10,012 9,131 8,749 9,707 12,218 9,747 10,317 11,478 11,637 10,037

1.Hotel performance indicators (3)
41
Hotel Nikko Alivila January February March April May June July August September October November December Total
Sales (JPY M)
2010 244 291 382 384 418 316 644 943 485 387 271 276 5,040
2011 317 276 302 332 380 303 678 899 465 420 376 325 5,074
2012 283 292 416 376 335 339 686 877 430 413 330 312 5,088
2013 302 300 432 423 372 364 697 960 463 388 332 343 5,375
Occupancy rate
2010 47.1% 74.7% 71.3% 80.7% 74.2% 70.7% 80.3% 91.6% 89.8% 80.9% 57.1% 48.7% 72.2%
2011 72.2% 74.1% 56.2% 65.2% 67.1% 66.5% 85.3% 88.0% 85.2% 86.7% 76.6% 54.9% 73.2%
2012 60.2% 76.8% 77.7% 74.3% 57.2% 66.8% 86.1% 85.2% 81.6% 86.2% 75.0% 53.9% 73.4%
2013 62.0% 78.2% 84.4% 86.2% 73.5% 74.4% 88.7% 92.6% 83.4% 79.6% 73.7% 59.3% 78.0%
ADR (JPY)
2010 20,106 15,825 21,139 18,539 23,681 18,342 40,205 54,398 25,657 18,594 16,864 22,116 25,800
2011 16,253 14,881 20,862 20,045 23,781 17,714 38,190 53,155 25,615 18,253 16,694 23,055 24,934
2012 17,858 14,251 20,698 20,061 24,846 20,292 38,954 54,220 24,982 17,670 15,574 22,336 25,030
2013 19,466 15,184 19,812 19,794 20,702 19,531 38,521 54,989 25,856 17,861 15,800 23,538 25,127
RevPAR (JPY)
2010 9,465 11,829 15,073 14,955 17,580 12,975 32,295 49,838 23,048 15,042 9,627 10,772 18,634
2011 11,729 11,034 11,731 13,070 15,949 11,781 32,587 46,803 21,816 15,834 12,781 12,666 18,243
2012 10,745 10,942 16,073 14,901 14,222 13,545 33,543 46,177 20,375 15,233 11,679 12,034 18,364
2013 12,064 11,867 16,727 17,070 15,209 14,538 34,150 50,935 21,570 14,215 11,640 13,953 19,594
Oriental Hotel Hiroshima January February March April May June July August September October November December Total
Sales (JPY M)
2010 131 163 193 188 170 164 176 153 159 188 178 204 2,067
2011 116 153 170 154 172 139 159 123 148 190 204 210 1,939
2012 129 169 188 186 145 171 185 164 176 185 219 218 2,137
2013 130 151 202 180 194 190 178 190 181 196 239 225 2,254
Occupancy rate
2010 59.3% 64.2% 73.0% 69.6% 70.0% 63.0% 74.3% 85.0% 70.0% 74.1% 74.3% 65.9% 70.3%
2011 57.5% 61.0% 60.8% 53.0% 65.1% 60.1% 63.1% 75.3% 76.6% 77.0% 79.4% 76.2% 67.1%
2012 60.8% 63.8% 69.6% 70.2% 70.5% 68.3% 70.8% 88.8% 71.3% 75.4% 79.3% 76.7% 72.2%
2013 59.9% 69.1% 75.6% 76.4% 79.4% 73.1% 76.4% 91.2% 82.2% 79.6% 89.0% 77.7% 77.5%
ADR (JPY)
2010 8,455 8,475 8,627 8,295 9,726 8,194 9,023 9,812 8,777 8,873 8,920 8,894 8,876
2011 8,297 8,577 8,783 8,597 8,802 7,626 8,461 9,170 8,264 8,406 8,367 8,327 8,479
2012 7,627 7,886 8,248 8,189 8,400 7,748 8,089 8,954 8,187 8,343 8,534 8,448 8,255
2013 7,791 7,983 8,472 8,351 8,889 7,767 8,182 9,547 8,490 8,492 8,623 8,227 8,446
RevPAR (JPY)
2010 5,014 5,439 6,296 5,776 6,809 5,163 6,708 8,335 6,148 6,577 6,631 5,865 6,240
2011 4,768 5,235 5,337 4,560 5,727 4,581 5,340 6,904 6,334 6,468 6,647 6,342 5,692
2012 4,640 5,035 5,744 5,752 5,924 5,288 5,730 7,953 5,840 6,292 6,767 6,478 5,959
2013 4,665 5,516 6,408 6,379 7,057 5,674 6,252 8,708 6,976 6,760 7,674 6,390 6,545
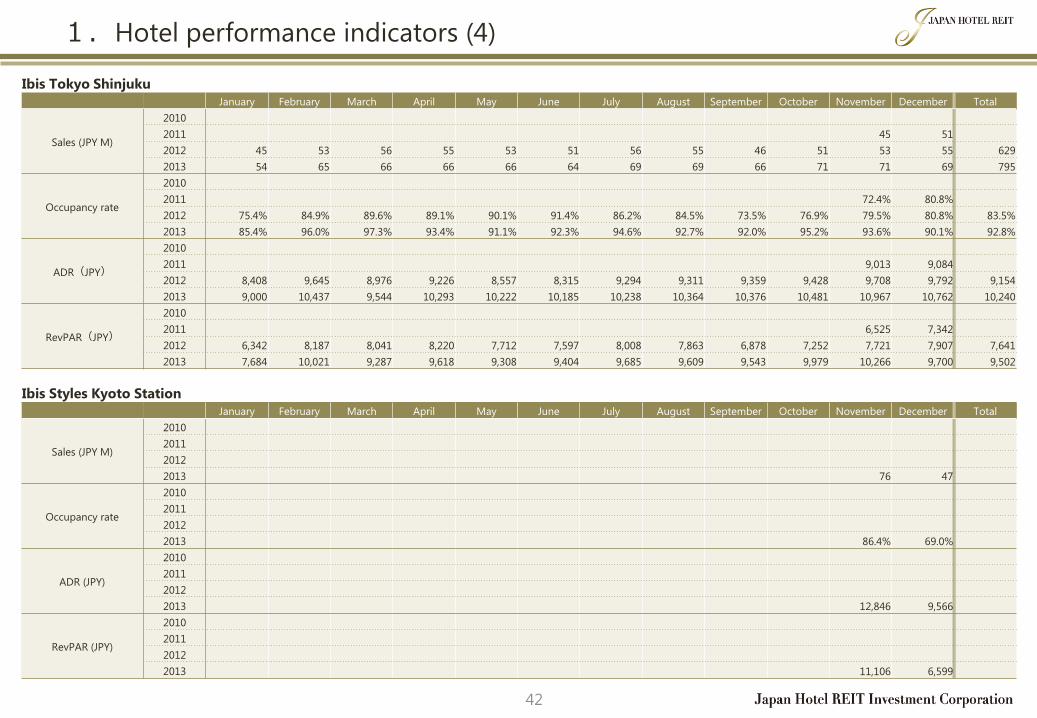
1.Hotel performance indicators (4)
42
Ibis Tokyo Shinjuku January February March April May June July August September October November December Total
Sales (JPY M)
2010
2011 45 51
2012 45 53 56 55 53 51 56 55 46 51 53 55 629
2013 54 65 66 66 66 64 69 69 66 71 71 69 795
Occupancy rate
2010
2011 72.4% 80.8%
2012 75.4% 84.9% 89.6% 89.1% 90.1% 91.4% 86.2% 84.5% 73.5% 76.9% 79.5% 80.8% 83.5%
2013 85.4% 96.0% 97.3% 93.4% 91.1% 92.3% 94.6% 92.7% 92.0% 95.2% 93.6% 90.1% 92.8%
ADR(JPY)
2010
2011 9,013 9,084
2012 8,408 9,645 8,976 9,226 8,557 8,315 9,294 9,311 9,359 9,428 9,708 9,792 9,154
2013 9,000 10,437 9,544 10,293 10,222 10,185 10,238 10,364 10,376 10,481 10,967 10,762 10,240
RevPAR(JPY)
2010
2011 6,525 7,342
2012 6,342 8,187 8,041 8,220 7,712 7,597 8,008 7,863 6,878 7,252 7,721 7,907 7,641
2013 7,684 10,021 9,287 9,618 9,308 9,404 9,685 9,609 9,543 9,979 10,266 9,700 9,502
Ibis Styles Kyoto Station January February March April May June July August September October November December Total
Sales (JPY M)
2010
2011
2012
2013 76 47
Occupancy rate
2010
2011
2012
2013 86.4% 69.0%
ADR (JPY)
2010
2011
2012
2013 12,846 9,566
RevPAR (JPY)
2010
2011
2012
2013 11,106 6,599

Investors composition and investment unit price
Appendix 3

1.Major unitholders and owners of the investment units
44
(*1) The total units held by each investor to the total units issued by JHR as of the end of December 2012 and the end of 2013 (Rounded off to two decimal places).
(*2) Both Taiyo Investment Specific Purpose Company and Umi Investment Specific Purpose Company are the SPCs established through the intention of RECAP Group.
Top ten major unitholders
Owners of the Investment units
No. of investors No. of units
Ranking Name No. of units Percentage (*1)
1 Taiyo Investment Specific Purpose Company (*2) 257,059 12.17
2 Japan Trustee Service Bank, Ltd. (Trust) 202,934 9.61
3 Umi Investment Specific Purpose Company (*2) 173,400 8.21
4 Trust and Custody Services Bank, Ltd. (Securities
Investment Trust) 164,593 7.79
5 The Master Trust Bank of Japan, Ltd. (Trust) 160,327 7.59
6 The Nomura Trust and Banking Co., Ltd. (Trust) 84,219 3.98
7 Nomura Bank Luxemburg S.A. 68,045 3.22
8 Shikoku Railway Company 58,311 2.76
9 Goldman Sachs International 39,904 1.89
10 Nomura P.B. Nominees T.K. One Limited 28,320 1.34
Total 1,237,112 58.59
97.4%
0.3% 1.3%
0.9%
Owners No. of
investors No. of units
Individuals and other 13,277 468,320
Financial institutions
(including securities
firms)
46 682,373
Other domestic firms 184 558,068
Foreign firms and
individuals 123 402,520
Total 13,630 2,111,281
(*) Percentage of investors: Percentage of owners to the total number of investors in JHR.
Percentage of investment units: Percentage of investment units owned to the total investment units issued (Round off to one decimal place.)
22.1%
32.3%
26.4%
19.0%
No. of investors No. of units Owners No. of
Investors No. of units
Individuals and other 16,564 392,782
Financial institutions
(including securities
firms)
58 1,213,027
Other domestic firms 268 334,077
Foreign firms and
individuals 183 681,395
Total 17,073 2,621,281
Ranking Name No. of units Percentage (*1)
1 Japan Trustee Service Bank, Ltd. (Trust) 448,866 17.12
2 The Master Trust Bank of Japan, Ltd. (Trust) 310,214 11.83
3 Trust and Custody Services Bank, Ltd. (Securities
Investment Trust) 215,180 8.20
4 The Nomura Trust and Banking Co., Ltd. (Trust) 138,110 5.26
5 Taiyo Investment Specific Purpose Company (*2) 127,204 4.85
6 Nomura Bank Luxemburg S.A. 77,718 2.96
7 Umi Investment Specific Purpose Company (*2) 77,435 2.95
8 The Bank of New York, Non-Treaty JASDEC Account 69,926 2.66
9 Shikoku Railway Company 58,311 2.22
10 Goldman Sachs International 42,946 1.63
Total 1,565,910 59.73
As of the end of December 2012 As of the end of December 2013
As of the end of December 2012 As of the end of December 2013
Individuals and other Financial institutions (including securities firms) Other domestic firms Foreign firms and individuals
97.0%
0.3% 1.5%
1.0% 14.9
%
46.2%
12.7%
25.9%

2.Changes in the investment unit price and market capitalization
45
50
100
150
200
250
300
04/2012 05/2012 06/2012 07/2012 08/2012 09/2012 10/2012 11/2012 12/2012 01/2013 02/2013 03/2013 04/2013 05/2013 06/2013 07/2013 08/2013 09/2013 10/2013 11/2013 12/2013
Investment unit price of JHR TSE REIT Indiex TOPIX
0
50,000
100,000
150,000
10,000
20,000
30,000
40,000
50,000
60,000
04/2012 05/2012 06/2012 07/2012 08/2012 09/2012 10/2012 11/2012 12/2012 01/2013 02/2013 03/2013 04/2013 05/2013 06/2013 07/2013 08/2013 09/2013 10/2013 11/2013 12/2013
Mark
et c
ap
italiz
atio
n
Investm
en
t un
it pric
e
Market capitalization Investment unit price(JPY) (JPY M)
Changes in the investment
unit price and market
Capitalization
(Based on the closing price)
Price of the investment unit:
JPY50,400.-
Total market capitalization
JPY132,113M (Based on the closing price of December 30, 2013)
Comparison with REIT
Index and TOPIX of Tokyo
Stock Exchange (TSE)
(*) 100 is the closing price of JHR, and the REIT index
and TOPIX of TSE dated April 2, 2012. The REIT index
of the TSE is an index of the weighted average of the
market capitalization of all REITs listed on the TSE.
2013/4/18
+510,000 units through PO
2012/9/13
+240,000 units through PO
2012/10/15
+12,000 units through OA
0
(*) Price of the real estate investment securities may fall
depending on the price of the real estate or
fluctuations in profitability, etc., and investors may
suffer losses. Investors may also suffer losses
through the bankruptcy or deteriorated finances of
the issuer. With reference to the risk of investment in
JHR units, see Securities Report of JHR dated March
22, 2013 and Mid-term financial report dated
September 20, 2013.
0

Summary of the asset management company
Appendix 4

1.Summary of the asset management company
47
Company Japan Hotel REIT Advisors Co., Ltd.
Location Ebisu Neonato 4F, 4-1-18 Ebisu, Shibuya-ku, Tokyo 150-0013
Establishment August 10, 2004
Capital JPY300M (as of December 31, 2013)
Shareholders Rockrise Sdn Bhd, Kyoritsu Maintenance Co., Ltd., Orix Real Estate Corporation
Representative Director Hiroyuki Suzui
Registration and Licenses
Building Lots and Buildings Transaction Business Operator, Governor of Tokyo (2) No. 83613
Discretionary Transaction Agent by Minister of Land, Infrastructure, Transport and Tourism, No. 38
Financial Instruments Trading Company by Director of Kanto Local Finance Bureau, No. 334
Member of The Investment Trust Association, Japan
Compliance Committee
Shareholders Meeting
Investment (and Operation)
Committee
Auditor
Compliance Office
Investment Division
Management & Planning
Office
Finance and Accounting Division
Asset
Management Acquisitions Accounting Finance
Board Meeting
Representative Director

2.Features and governance of the asset management company
48
Rule to prevent conflict of interest in dealing with the sponsor-related persons
Strict decision-making rules including those detailed below have been set for dealing with “sponsor-related persons”(*2). In order to prevent conflict,
we strive to comply with arms length rule and ensure deal transparency.
(*1)No employee of the asset management company is a seconded employee of the main sponsor, RECAP group, except for a part-time director.
(*2)Definition of “sponsor-related person” is broader than the “interested party” stipulated by law. All investors of the asset management company and its subsidiary company, etc. are considered as sponsor-related persons.
Asset management company: Compliance committee
The compliance committee consists of the committee members including
outside specialists, and attendance of the outside specialists is in principle
required for approval of the transaction.
In principle, the outside specialists are authorized to dismiss the proposal.
JHR: Committee
The committee consists of third party members who do not
have any relationship with the sponsors-related persons.
All deals involving a sponsor-related persons in principle
need the approval of the committee.
Features of the asset management company
【1】 Mission statement
We continue challenge and creation, and provide you with attractive hotel investment opportunities.
【2】 Advanced expertise
Planned and executed unprecedented measures for the asset management of JHR.
Extensive experience, planning and execution abilities in renovation or rebranding through collaboration with hotel lessees or hotel operator.
Good and long term business relationships with many hotel lessees and hotel operators.
Ensure managerial independence from the main sponsor, the RECAP group(*1), and strong commitment to the growth of JHR.
Conduct and publish unique proprietary research on the hotel and tourism industries.

Market data
Appendix 5

1.Tourism related information
50
Companies that plan to raise salaries (regular pay raise) :79.8%(+4.5% compared with last year)
Year-end bonus of the major domestic companies: 822,121(+5.79% compared with last year)
“Visit Japan Campaign” launched.
The Tourism Nation Promotion Basic Law” was implemented.
The Tourism Nation Promotion Basic Plan (Revised and decided on by the cabinet))
“Basic policy for Promoting Tourists Visit and Stay Through Development of Tourism Areas” revised.
The number of overseas travelers in 2013: 10,363,900
(+24% compared with the previous period)
Source: Japan National Tourist Organization (JNTO)
Status of overseas travelers
~History of national tourism promotion~
Source: Nihon Keizai Shinbun dated November 14, 2013 and November 29, 2013
Domestic economic trend and consumption trend
Consumption trends: “Shopping” to “Enjoy the pastime”
What people want to put emphasis in future
According to the investigation conducted by the asset management company of JHR in the middle of October 2013(*),
those who intend to increase travel expenditures for one trip account for 20% to 30%, and more than 50% intend to keep
the same level spending as that of the previous year.
Source: Survey concerning Japanese lifestyle by Office of Public Relations, Minister's Secretariat, Cabinet Office
Travel expenses for 2014
According to the attitude survey concerning the lifestyles of Japanese people, those who want to emphasize “hobbies
and leisure life” in the future account for the highest level (36.9%).
2003 Apr.
2007 Jan.
2012 Mar.
Dec.
2013 Jun. Japan Revitalization Strategy (Decided on by the cabinet in June 14, 2013)
Goals for the tourism business
“Action program for realizing a tourism nation” was made
(Tourism nation promotion cabinet meeting)(*)
(*)Policy meeting consisting of all cabinet members. It was established in March 2013 to realize
a tourism nation.
① Create “Japan brand” and send messages
② Promote inbound travels through mitigation of visa requirements
③ Improvement of environment to accept more overseas travelers
④ Solicit international meetings (MICE ) and promote investment
2014 Promote tourism policies further to establish a tourism nation
No. of overseas travelers 2013 Achieved 10,000,000
2030 Exceed 30,000,000
Consumption of overseas travelers 2030 JPY4.7T According to the on-line investigation in December 2013, the top three products
and services people want to buy or increase the number of times using are all
related to hobbies and leisure life.
1st Domestic travel(33%)
2nd Overseas travel(16%)
3rd Dining-out(13%)
People are highly motivated to travel even after a consumption tax hike.
Sign of income effect The number of overseas travelers exceeded 10,000,000, the goal set by the government.
Source: Nihon Keizai Shinbun dated January 6, 2014
Number of trips for 2014
*Target: 1,035 men and women aged twenty and over in Japan.
*Target: 1,000 men and women at the 20s to 60s and over who reside in Tokyo, Saitama, Chiba, and Kanagawa prefectures.
Taking advantage of the forthcoming Tokyo Olympic and Paralympic Games, the
government made the basic policy with the aim of receiving 20,000,000 overseas travelers by 2020. (Council for Industrial Competitiveness on January 20, 2014)
27.2
26.7
27.7
29.1
32.5
66.5
67.5
65.5
65.5
54.9
6.3
4.9
5.3
4.9
11.7
1.0
1.5
0.5
1.0
0% 20% 40% 60% 80% 100%
60th and over
50th
40th
30th
20th
Increase same as last year Decrease Other
24.8
22.8
23.8
24.8
35.4
68.9
68.0
69.4
67.0
53.9
6.3
8.7
6.3
7.8
10.2
0.5
0.5
0.5
0.5
0% 20% 40% 60% 80% 100%
60th and over
50th
40th
30th
20th
Increase Same as last year Decrease Other
36.9
32.3 30.4
27.2 26.7 24.2
8.8
5.9
1.9
9.7
1.6
0
5
10
15
20
25
30
35
40
Hobbies and
leisure life
Income Asset and
savings
Food(Dietary life) Self/Capacity
development
Dwelling Consumer
durables
Clothing Other None Do not know
(%)

5,212
6,138
6,728
7,334
8,347 8,351
6,790
8,611
6,219
8,358
10,364
0
500
1,000
1,500
2,000
2,500
3,000
3,500
4,000
4,500
5,000
0
2,000
4,000
6,000
8,000
10,000
12,000
2003 2004 2005 2006 2007 2008 2009 2010 2011 2012 2013
Ko
rea, C
hin
a, T
aiw
an
To
tal
Total Korea China Taiwan
2.Changes in the number of overseas travelers
51
Source: JNTO (*) The numbers from January through October 2013 are provisional numbers calculated by JNTO based on the material made by the Ministry of Justice. The numbers for November
and December are calculated based on JNTO’s own investigation.
The Great East
Japan Earthquake
Lehman
Shock Launch of Visit Japan
Campaign
(*)
(Unit: 1000)
The number of overseas travelers has been steadily increasing since the launch of the Visit Japan Campaign. It fell temporarily in 2009 and 2011 due to the Lehman
Shock and Great East Japan Earthquake disaster but recovered the following year. The Visit Japan campaign marked its 10th anniversary in 2013 and the number of
overseas travelers showed the highest on record, exceeding the goal of 10,000,000 set by the government.

3.Economic assessment and direction / Changes in DI by industry
52
0.0
10.0
20.0
30.0
40.0
50.0
60.0
70.0
Jan
.
Feb
.
Mar.
Ap
r.
May
Jun
.
Jul.
Au
g.
Sep
t.
Oct.
No
v.
Dec.
Jan
.
Feb
.
Mar.
Ap
r.
May
Jun
.
Jul.
Au
g.
Sep
t.
Oct.
No
v.
Dec.
Jan
.
Feb
.
Mar.
Ap
r.
May
Jun
.
Jul.
Au
g.
Sep
t.
Oct.
No
v.
Dec.
Jan
.
Feb
.
Mar.
Ap
r.
May
Jun
.
Jul.
Au
g.
Sep
t.
Oct.
No
v.
Dec.
Jan
.
Feb
.
Mar.
Ap
r.
May
Jun
.
Jul.
Au
g.
Sep
t.
Oct.
No
v.
Dec.
Jan
.
Feb
.
Mar.
Ap
r.
May
Jun
.
Jul.
Au
g.
Sep
t.
Oct.
No
v.
Dec.
2008 2009 2010 2011 2012 2013
All Travel, Transportation Leisure, Leisure related facility
According to the Economic Watcher Survey of the Cabinet Office, diffusion indexes (DI) for the overall industries and tourism related industry have almost recovered from
the Lehman Shock and the Great East Japan Earthquake disaster. They tended to grow further in 2013 compared with the previous year, and a level of around 50 was
kept throughout the year.
The Great East Japan
Earthquake Lehman
Shock
Source: Cabinet office

Disclaimer
53
This material is prepared and provided solely for the purpose of providing information and not to solicit any purchase of investment units or investment
corporation bonds of Japan Hotel REIT Investment Corporation (“JHR”) or any other particular products.
This material is neither a disclosure document nor an investment report required under or prepared pursuant to the Financial Instruments and Exchange Act,
Investment Trust and Investment Corporation Act and related government ordinances, Cabinet Office regulations, Tokyo Stock Exchange listing rules, or other
related rules and regulations.
This material contains forward-looking statements about financial conditions, operational results, and businesses of JHR, as well as plans and intentions of JHR
and its asset management company, Japan Hotel REIT Advisors Co., Ltd (“JHRA”). Such forward-looking statements involve known and unknown risks,
uncertainties, and other factors that may cause actual results or performance of JHR to materially differ from those expressed or implied forecasts. Those
forecasts are made based on JHR’s present and future business strategies and assumptions relating to the political and economic circumstances surrounding
JHR in the future.
Every effort has been made to ensure the accuracy of the information contained in this material. However, there can be no assurance that the information is
accurate, complete, appropriate or fair. The information may be revised or retracted without prior notice.
Regarding the offering and trading of investment units or investment corporation bonds, financial institutions may charge you pre-determined handling fees
and other charges aside from the price of the investment units or investment corporation bonds, please ask financial institutions for the amount, upper limit, and
calculation methods of such fees and other charges.
JHR mainly invests in real estate-related assets, primarily hotels which are subject to change in values. Therefore, unitholders and investment corporation bond
holders may suffer losses due to economic conditions of the real estate market or securities market, interest rates, the nature of investment units, dependency
on mechanisms and related persons of investment corporations, changes in legal systems related to real estate (such as tax regulations and building
regulations), damages caused to the real estate-related assets by natural disasters, fluctuation in prices or profitability of the real estate-related assets, nature of
the trust beneficiary rights under management, delisting of the investment units, or worsening of the financial position or insolvency of JHR. For details, please
refer to the Articles of Incorporation, Securities Registration Statement, Annual Securities Report and Extraordinary Report of JHR.
The contents of this material may not be copied or reproduced without our prior permission.
Japan Hotel REIT Advisors Co., Ltd.
Financial Instruments Trading Company
No. 334, Director of Kanto Local Finance Bureau
Member of the Investment Trust Association, Japan

<Reference> Our website
54
In addition to the statutory disclosure, JHR discloses important and advantageous information swiftly and properly for investors.
The latest financial data (Financial report and
Financial Results Briefing) are available.
Financial Data
Website address
http://www.jhrth.co.jp/en/index.html
Performance Review
Information distribution function through RSS
Monthly performance (occupancy rate and sales, etc.) of
the hotels paying variable rent are available. The
performance of these hotels is disclosed on a monthly
basis.
JHR distributes the latest information and press releases
through RSS.