i- - nasa 3. 3 cell short test i 3. 4 internal resistance test i i 3. 5 cell selection 4. 0 summary...
TRANSCRIPT
I - I - I I I I I I I I I I I I I I I I I
i
Fina l Report on Acceptance Test ing
Phase One of NASA
Nic ke 1 - Cadmium Bat te ry T e s t Pro j e c t
Contract No, NAS5-3027 ER 13179
Martin Marietta Corporation Bal t imore, Maryland
October, 1963
https://ntrs.nasa.gov/search.jsp?R=19650003959 2018-05-18T01:48:28+00:00Z

1 . I ' 1 I 1 I I I I I I I I I I I I I I
CONTENTS
PARAGRAPH
1. 0 Purpose of Nickel - Cadmium Cel l Acceptance Test ing
2. 0 General Description
2 . 1 Acceptance Tes t s
2. 1. 1 P re l imina ry Operations
2. 1. 2 Cell Conditioning
2. 1. 3 Phenolphthalein Leak Test
2. 1. 4 Capacity Tes t
2. 1. 5 Cell Short Tes t
2. 1. 6 Internal Resis tance Tes t
2. 2 Tes t Equipment
2. 2. 1 Cel l Conditioning Unit
2. 2. 2 Capacity Tes t Enit
2. 2. 3 Internal Resis tance Test Unit and Tes t Set -up
3. 0 Tes t Results
3. 1 Phenolphthalein Leak Tes t
3. 2 Capacity Tes t
3. 2. 1 Capacity
3. 2. 2 T e r m i n a l Voltage
3. 2. 3 P r e s s u r e
P A GE --
1-1
11-1
11-1
11-1
11-5
I1 -5
I1 -5
I1 -6
I1 -6
11-7
11- 7
1:- 11
11- 1 4
111- 1
111- 1
111- 2
111- 2
111- 6
111- 13

I ' 3. 3 Cell Short Tes t
I 3. 4 Internal Resis tance Tes t
I I
3. 5 Cell Selection
4. 0 Summary
FIGURE NO.
111- 19
111- 20
111-25
IV- 1
ILLUSTRATIONS
PAGE
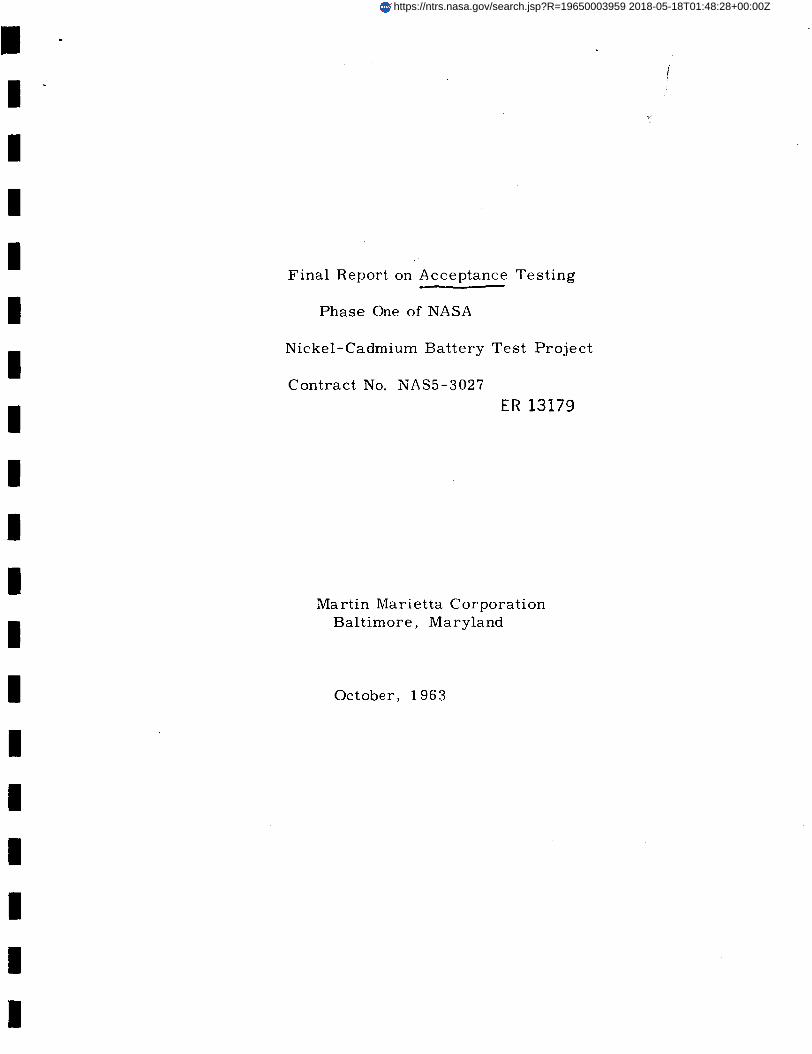
1 Acceptance Tes t Functional Block Diagram 11- 2
2 Nickel Cadmium Cell with Pressure Pla tes 11- 3 and Te rmina l Adapters
3 Cell Holder 11- 4
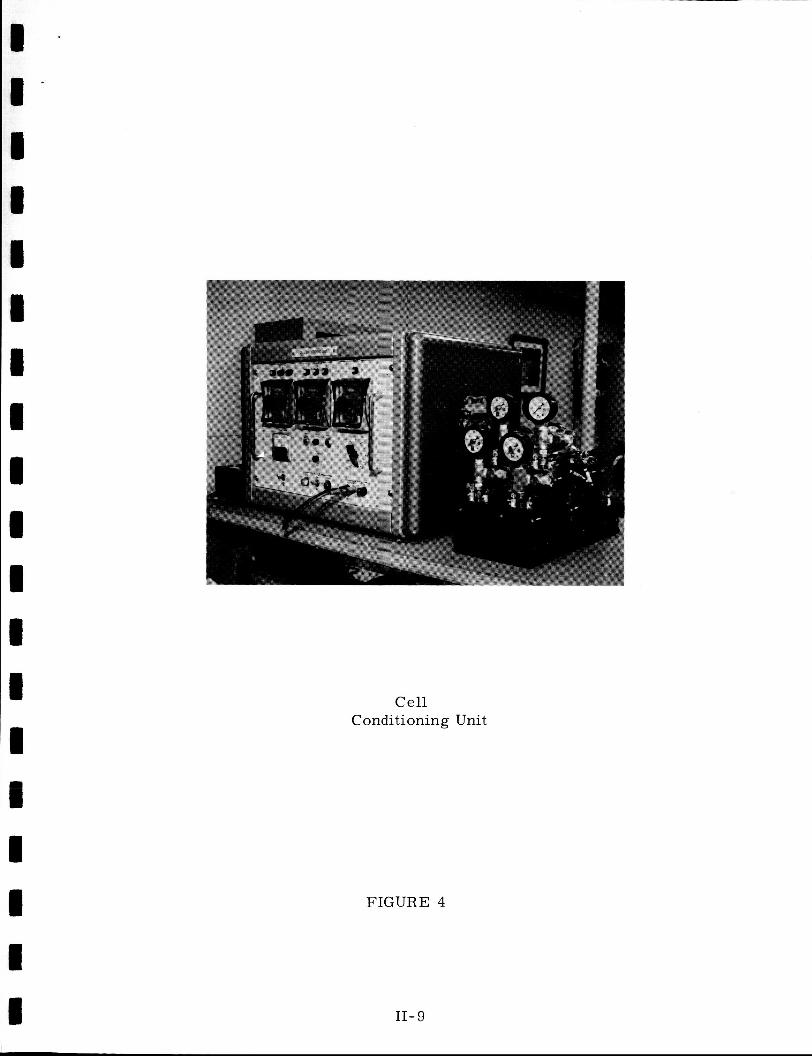
4 Cel l Conditioning Unit 11- 9
5 Cel l Conditioning Unit Functional Block Diagram 11-1 0
6 Capacity Tes t Unit and Data Logger 11-1 2
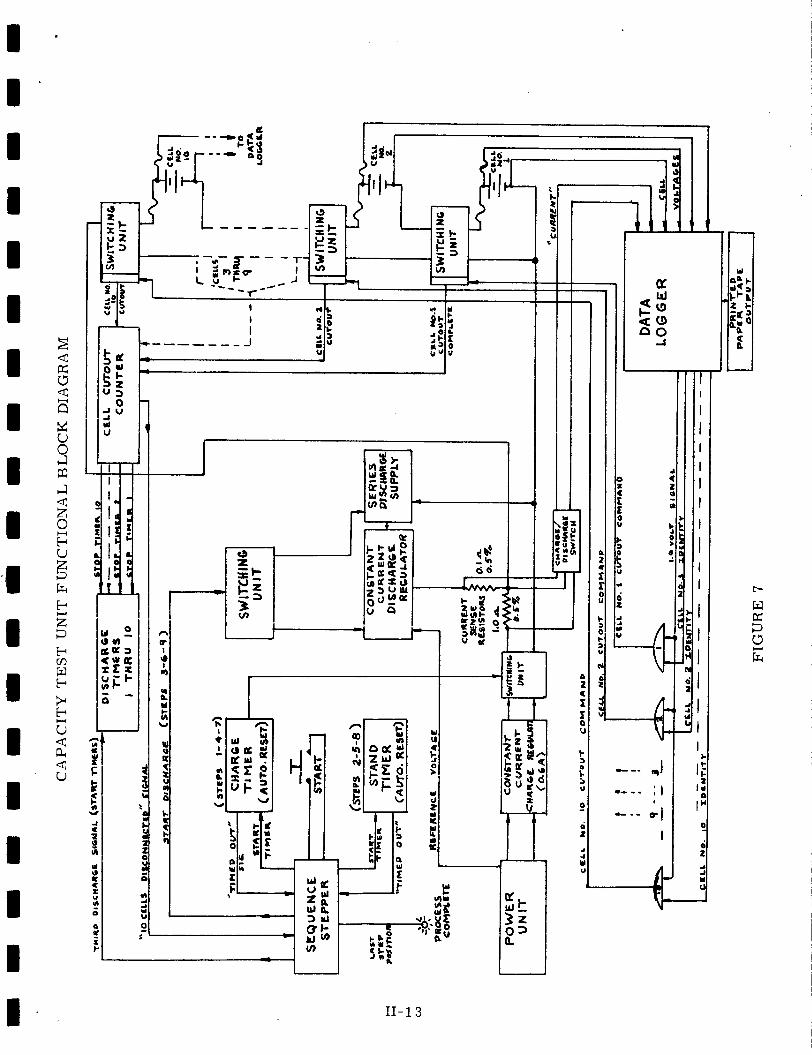
7 11-1 3
8 Internal Resis tance T e s t Unit Functional Block 11-1 5
Capacity Tes t Unit Functional Block D i o m r n m '-b ---- I Diagram
9 Internal Resis tance T e s t Set-up 11-1 5
1 0 Cell Voltage during C / 2 0 to C Discharge 111- 21 I 11 Shunt Voltage Output during C / 2 0 t o C Discharge 111-21 I

I ' I ' I I I I I I I I I I I I I I I I I
TABLES AND GRAPHS
TABLE NO. PAGE -~
1 Lis t of Measured Capacity Values 111-3
2 Capacity T e s t T e r mina l Vol ta ge s 111-7
3 Capacity T e s t P r e s s u r e Readings 111-1 4
4 Inte rna l Resis tance Measurements 111-22
5 Rejected Cel ls IV-2
6 Manufacturer ' s Cel l Ser ia l Numbers V e r s e s IV-4 T e s t Assigned Numbers
GRAPH NO.
1 Capacity Distribution 111- 5
2 Normal v s "Overvoltage" Cell Charge-Charac te r i s t ics 111-1 2
3 Termina l P r e s s u r e Distribution 111-1 7
4 Pre s s u r e Charge - t ime C ha rac t e 1. is tic s 111-1 8
5 Internal Resis tance Distribution 111-24

I . I ’ I 1 I I I I 1 1
1 I
I I I I I
m
m
1.0 Purpose of Nickel-Cadmium Cel l Acceptance Test ing
The purpose of the acceptance t e s t s w a s t o define the capacity of the cel ls , to e l iminate those cells with markedly var ian t e lectr ical p roper t ies , such as capacity and end charging voltage, and t o e l iminate all ce l l s with defects such as l eaks and in te rna l shor t s .
The mean ampere-hour capaci ty of a l l accepted ce l l s w i l l be utilized during Phase Two of the Nickel Cadmium Battery Project, Cyz!ing Tests , in de te rx in ing the charge! discharge r a t e s on selected ba t te r ies . be made between the data obtained during Phase One and the data t o be obtained during Phase Two, and cor re la t ion of this data w i l l l a t e r be attempted.
Compar isons wi l l
In addition to the above objectives i t is hoped that fu r the r investigation into the cause of the abnormal behavior exhibited by cer ta in groups of ce l l s in r e g a r d s to an over - voltage condition wi l l mater ia l ly aid the effor ts of discovering and defining the cause of ce l l fa i lures .
I- 1

4 - I ' I I I 1 I I I 1 I 1 I I I I 1 I I
2. 0 General Description
2. 1 Acceptance T e s t s
To facil i tate rapid processing the ce l l acceptance tes t ing w a s conducted on a production l ine basis .
Functional Block Diagram, F igu re 1 a s s ta t ions 1 through 6. The operation of each station is descr ibed in detail below.
Groups of ten ce l l s w e r e tes ted on a s ix position line, i l lus t ra ted in the Acceptance T e s t
2 . 1 . 1 Pre l iminary Operations
The ce l l s a s received w e r e engraved with a n identifying code number , and assigned a correspondingly numbered file c a r d on which was recorded the manufacturer ' s s e r i a l number . A one-half ohm r e s i s t o r was then connected a c r o s s the te rmina ls of e a c h ce l l fo r a th ree hour period to effect a complete discharge,
The lucite supports on each cel l ce l l s washed thoroughly with detergent and water , r insed with tap water , r insed with disti l led water and dr ied with a c lean towel.
w e r e removed and the
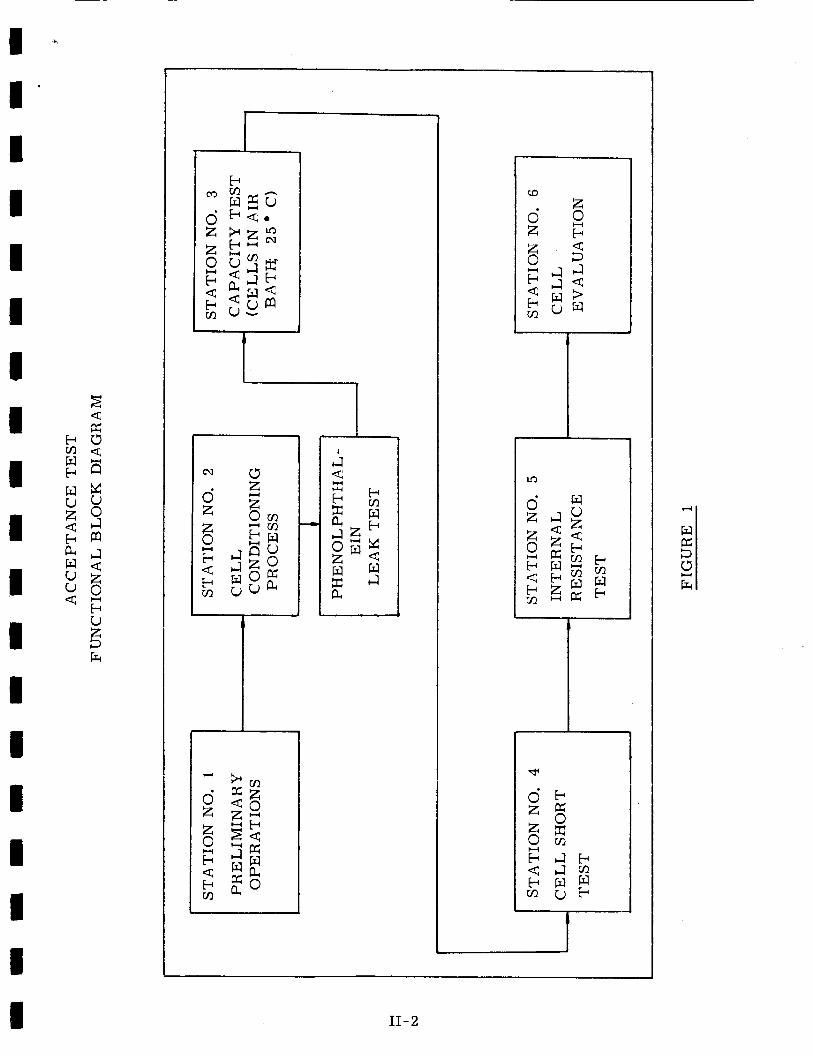
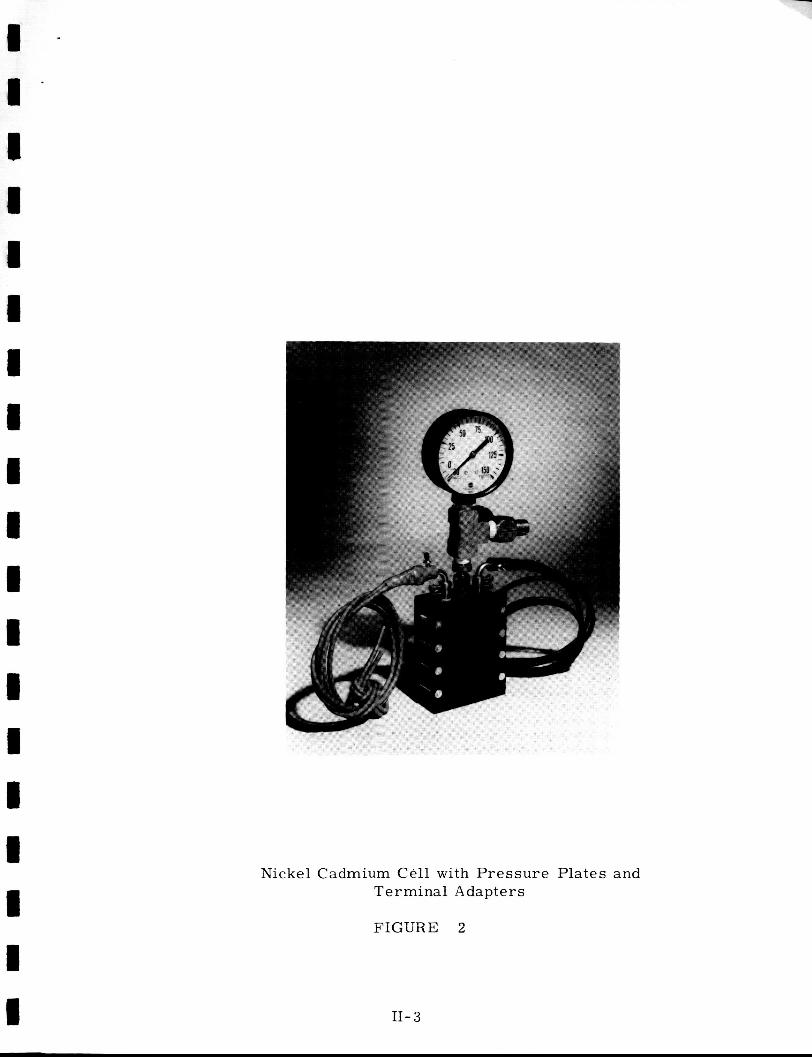
A l l c e l l s were then equipped with two 3 /16 inch black- anodized aluminum p r e s s u r e plates and two aluminum bushing te rmina l -adapters and copper bus t e rmina l extenders. installed to provide a degree of a s su rance aga ins t accidental sho r t c i rcu i t s of the positive ce l l t e rmina l to the negative c a s e during connect/disconnect operat ions, and to provide a convenient means for mat ing a quick- disconnect connector to the ce l l terminals . Wooden ce l l holders were manufactured t o hold a 10 ce l l group, or bat tery, i n a manner that resu l ted in maximum vis ibi l i ty of the p re s su re gauges and permit ted sa t i s fac tory placement of 1 2 ba t t e r i e s in a c o m m e r c i a l environmental chamber . tied to the f i r s t ce l l of each ba t te ry to faci l i ta te ba t te ry movement and to insu re complete testing of all cel ls .
T h e s e t e rmina l adapters and ex tenders w e r e
A s a l a s t s t e p "Operational Flow Tags" w e r e
11-2
v-4
W P= 5 c5 R H
Nickel C a d m i u m C e l l with P r e s s u r e Plates a n d T e r m i n a l Adap te r s
FIGURE 2
11- 3
I - I ' I
Cell Holder
F IGURE 3
11-4

2 . 1 . 2
2 . 1 . 3
Cel l Conditioning
Cell Conditioning consisted of t h ree charge-d ischarge cycles followed by a 1 6 hour s h o r t c i rcui t . half cycle consisted of a 1 3 hour constant voltage charge to a n end ce l l t e rmina l emf of between 1. 4 3 and 1. 45 volts.
The charge
Following the charge, the ce l l s w e r e discharged through individual one-half ohm r e s i s t o r s f o r 4. 5 hours.
The ce l l s were disconnected a f t e r the 1 6 hour s h o r t c i rcu i t period, shorted again with s h o r t t e s t leads and moved the next position: The Phenolphthalein leak tes t .
Phenolphthalein leak tes t
Each ce l l w a s checked fo r caust ic l eaks by swabbing neut ra l phenolphthalein solution on the ce l l s and checking fo r any r e d indications. w a s in te rpre ted as indicating a leak and was cause for re ject ion of the cell.
The appearance of a r ed co lor
After the leak test, the ce l l s were r insed thoroughly with disti l led water and dr ied with a clean paper towel.
2 . 1 . 4 Capacity Tes t
Capacity tes t ing consisted of t h ree charge-stand-discharge cycles. hours , followed by a n open c i rcu i t s tand t ime of one hour, and then a constant c u r r e n t 2. 6 amp. d ischarge to 1 . 0 volt is representat ive of a typical cycle. The capacity of each ce l l of the ten ce l l group under t e s t a t this station w a s obtained by multiplying the constant discharge cu r ren t by the individually recorded t ime each ce l l to discharge to 1. 0 volt.
A constant c u r r e n t charge of 0. 600 a m p s for 16
requi red for
11- 5

2 . 1 . 4 continued During the capacity t e s t the ce l l voltages w e r e sensed eve ry 6 seconds and recorded on paper tape eve ry 10 minutes. P r e s s u r e readings on ba t te r ies no. 1 and 2 w e r e recorded at the end of charges no. 1 and 2 and eve ry 1 5 minutes during the third charge. On all other bat ter ies with p r e s s u r e gauges, p r e s s u r e readings were recorded at the end of charges 1 and 2 and eve ry 1 5 minutes during the l a s t 6 hours of the th i rd charge. The ce l l s were thermosta ted at 25 degrees C during the en t i re capacity tes t .
2 . 1 . 5 Cell Short Test
Following the l a s t cycle of the above capacity test the ce l l s were discharged through a one-half ohm r e s i s t o r f o r one-half hour; then s h o r t c i rcui ted for 16 hours . A t the end of this period the ce l l s were charged a t 1 . 2 amps fo r one minute Each ce l l voltage w a s then checked with a high impedance voltmeter and all ce l l s having an emf of less than 1. 0 volt were rejected.
and then left on open c i rcu i t f o r 24 hours.
2 . 1 . 6 Internal Resistance Tes t
Each ten cel l group w a s charged a t 0 . 6 a m p s fo r 1 6 hours , then discharged a t 3. 0 a m p s f o r 1 hour. The d ischarge rate w a s then adjusted to 0. 3 amps and continued at th i s r a t e until the ce l l voltage stabil ized. Each individual ce l l was then subjected to a 5 to 8 second discharge at 6 amps. The ce l l voltage immediately pr ior to this discharge and 5 milliseconds a f t e r the s t a r t of the discharge w a s recorded on a photograph of a n oscil loscope trace, the oscilloscope being suitably connected into the sys t em to display the two voltage - levels mentioned above. The internal res i s tance of each ce l l was then calculated using the following formula
R = v 1 - v 2 c - c / 2 0
11-6

2. 2
2.1. 6 continued
where R = internal res i s tance of the ce l l
VI- cell voltage immediately pr ior to the 6 amp discharge
V2= cell voltage 5 mill iseconds a f t e r s t a r t of the 6 amp. d ischarge
C = Nominal cel l capacity in amp-hours = 6
Test E qui pm en t
The ma jo r pieces of tes t equipment used in per formance of the acceptance t e s t s a r e descr ibed in functional detail below.
2. 2. 1 Cell Conditioning Unit
The following descr ipt ion is made with re ference to the Cell Conditioning Unit Functional Block Diagram.
Depress i rg the "Start" button moves the sequence s tepper to position no. 1, where the charge t i m e r (0-30 hr ) is s ta r ted . The cha rge switching unit is energized by the charge t i m e r , thereby connecting the voltage regulator output to the 10 paral le led ce l l s in the output line. When the cha rge t i m e r has t imed out, a s t ep signal is sent to the sequence s tepper which moves the s tepper to position #2. Thus the charge switching unit is de-energized, the discharge t i m e r (0-10 hr ) i s s ta r ted , and the d ischarge re lays a r e energized, connecting individual one-half ohm r e s i s t o r s ac ross each cell. has t imed out, a s t e p signal, is sen t to the sequence stepper which moves the s tepper to position #3. At position # 3 the charge half-cycle is again repeated. This sequence of operation is continued until a total of t h ree charges and th ree d ischarges have been completed, and the sequence s t eppe r is positioned a t s t ep #7. Position #7, in a manner s i m i l a r to that descr ibed above, shor t -c i rcu i t s the output ce l l s for a prescr ibed length of t ime (0 to 30 hrs . ) the completion of which automatically open c i rcu i t s the cel ls and gives a visual indication of p rocess completion.
When the discharge t i m e r
11-7

The unit is equipped with a fail-safe overvoltage switch which automatically disconnects the charge c i rcu i t f r o m the ce l l s in the event of any regulator fa i lure which would cause the output voltage to rise out of control. ce l l voltages may be monitored a t the front panel by e i ther the Charge Cur ren t m e t e r o r the se l ec to r switch connected "Voltage Monitor" jacks.
Also, the output cu r ren t or any of the
11-8
I - I - I I I I I I 1 I I I I I I I I I I
C e l l Conditioning Unit
FIGURE 4
11- 9

w u
11-10

2. 2. 2 Capacity Tes t Unit
The following description is made with re ference to the Capacity Tes t Unit Functional Block Diagram.
Depress ing the "Start" button moves the sequence s t eppe r to position no. 1, vhere the charge t i m e r (0 to 30 hrs . 1 is s ta r ted . The charge switching unit is energized by the charge t imer , thereby connecting the constant c u r r e n t charge regulator (0. 6 A ) to the 1 0 series connected ce l l s in the output. When the charge t i m e r has t imed out, a s t e p s igna l is sen t to the sequence s tepper which moves the s t eppe r to position #2. Thus the charge switching unit is de-energized and the s tand t i m e r (0 to 150 min. ) is s ta r ted . t imed out, a s t ep s ignal is sen t to the sequence s t eppe r which moves the s tepper t o position # 3 . Thus the d ischarge switching unit is energized, connecting the constant c u r r e n t discharge regulator (2. SA) and the series d ischarge supply t o the s e r i e s connected ce l l s in such a manner that the ce l l s are discharged at the 2. 6 amp. r a t e . as w e l l a s the cha rge and stand s teps , the ce l l voltages and cu r ren t a r e monitored and r eco rded by the data logger. any particular ce l l r eaches a discharge voltage of 1. 0 volt a coincidence o r and", s ignal is sensed by the cor responding
and" gate, and a ce l l cutout command is i ssued t o the corresponding output switching unit. When a l l ten ce l l s have discharged to 1. 0 volt, the ce l l cutout counter i s s u e s a
1 0 ce l l s disconnected" s ignal t o the sequence s tepper which moves to position #4. A t position #4 the charge half-cycle is again repeated. a total of three charge-stand-discharge cycles have been performed. the third and final discharge,a group of 1 0 elapsed t ime m e t e r s are s ta r ted . ce l l and m e a s u r e s the elapsed t ime between the s t a r t of the third discharge and the point a t which the cor responding cell reaches 1. 0 volt. cu r ren t discharge value (2. 6 amps ) and the t ime indicated by the elapsed t ime m e t e r , the capacity of a cel l , in a m p e r e - minutes , may be obtained.
When the stand t i m e r has
During the d ischarge s tep ,
When
I 1
I t
II
This sequence of operation is continued until
The only exception being that a t the beginning of
Each t ime m e t e r is assoc ia ted with a par t icu lar
This by later multiplying the constant
This unit is equipped with a n overvoltage switch which automatically disconnects the charge c i rcu i t f r o m the ce l l s in the event that the constant cu r ren t charging rate of 0. 6 amps . causes any of the ce l l s t o r each 1. 50 volts.
11-11

I - I ' I 1 I I
Capacity Test Unit and Data Logger
FIGURE 6
11-1 2
XI-1 3
-i
1 I I I I I I
I
I I I
I I I I I I
1 ' I ' I I I I I I I I I I I I 1 I I I I
2. 2. 3 Internal Resistance T e s t Unit and Tes t Set-up
The following descr ipt ion is made with re ference to the Internal Resis tance Tes t Unit Functional Block Diagram, Figure 8.
When connected to the t e s t s e t -up shown in figure 9, turning on the Power switch s t a r t s the 0. 3 A ce l l d i scharge which is m e t e r e d with IA. cel l voltage has s tabi l ized (approximately 5 minutes) as indicated b y the oscil loscope t r a c e , the "Start 6 A Discharge" switch is d e p r e s s e d by the operator . This action applies a positive pulse to the scope ex terna l tr igger jack and s t a r t s the t r a c e moving a c r o s s the CRT. The s a m e pulse that s t a r t s the scope t r ace s t a r t s a n adjustable delay. After the delay period a re ference voltage is switched to the normal ly cutoff s e r i e s regulator and thus s t a r t s the 6 amp. discharge (the actual c u r r e n t in this loop is 5. 7 a m p s which i s added to the original 0. 3 a m p s to produce 6 . 0 amps . )
After the
The delay period mentioned above is adjusted so that with a scope sweep of 5 m s / c m , the 6 a m p pulse is applied to the ce l l when the t r a c e is in the approximate cen te r of the CRT face. A c a m e r a attached to the CRT face with the shu t t e r open r eco rds the en t i re event.
11-1 4

1 1 I
I I
POWER
SLRI E S r -
I REGULATOR
I t REC EREWCE
VoLrACE SWITCH
SERlEO DROPPING
RESISTOR
+
ADTUSTABL
START 64 DI L C H 4 R G E . E X T .
I TRIGGER
INTERNAL RESISTANCE TEST UNIT FUNCTICNAL BLOCK DIAGRAM
FIGURE 8
I I I I I I I I I
TNTERNA L
RGSISTANCC
I-
VERT.
INPUT 1
4
Osc I LLOSCO PE
INTERNAL RESISTANCE TEST SET-UP
FIGURE 9
11-1 5
1 - I ' I I I I I I I I I I I I I I I I m
3. 0 T e s t Resul ts
A total of 239 ce l l s were furnished by the government. shipments were as follows:
Cel l
162 cells May 1963 6 9 ce l l s August 1963 8 ce l l s September 1963
The l a s t group of 8 ce l l s were equipped with p r e s s u r e t ransducers .
Acceptance Test ing was s tar ted on May 27, 1963 and completed on September 24, 1963. Additional tes t ing on approximately 1 2 p r e s s u r e t ransducer equipped ce l l s is expected t o s t a r t in the n e a r future. Results of acceptance tes t ing on these additional ce l l s w i l l be furzished i n a supplemental report .
A11 of the ce l l s tes ted w e r e of the s a m e type, f r o m the s a m e manufacturer , and had the same nominal capacity of 6 ampere -hour s .
Detailed r e s u l t s of each tes t a r e l is ted below.
3. 1 Phenolphthalein Leak Test
Following the conditioning process each ce l l w a s tes ted for caust ic leaks using a rleutral phenolphthalein solution. the 239 ce l l s tested, IOcells w e r e found with sma l l leaks. These ce l l s a r e l i s ted below.
Of
MFGS SERIAL NO. CONTRA CT OR S LOCATION OF LEAK - ASSIGNED
CELL NUMBER
2863 28?3 2876 2850 2839 31 46 2833 2406 2527 21 83B
1 2 4 5 5 5 5 8 76 8 4
104 237 238 1 4 2
111-1
+ T e r m i n a l + T e r m i n a l + T e r m i n a l
+ T e r m i n a l + T e r m i n a l + T e r m i n a l
+ T e r m i n a l + T e r m i n a l
nea r - T e r m i n a l
p r e s s . tube mount
I - I ' I I I I I I I I I I I I I I 1 I I
3. 2 Capacity Tes t
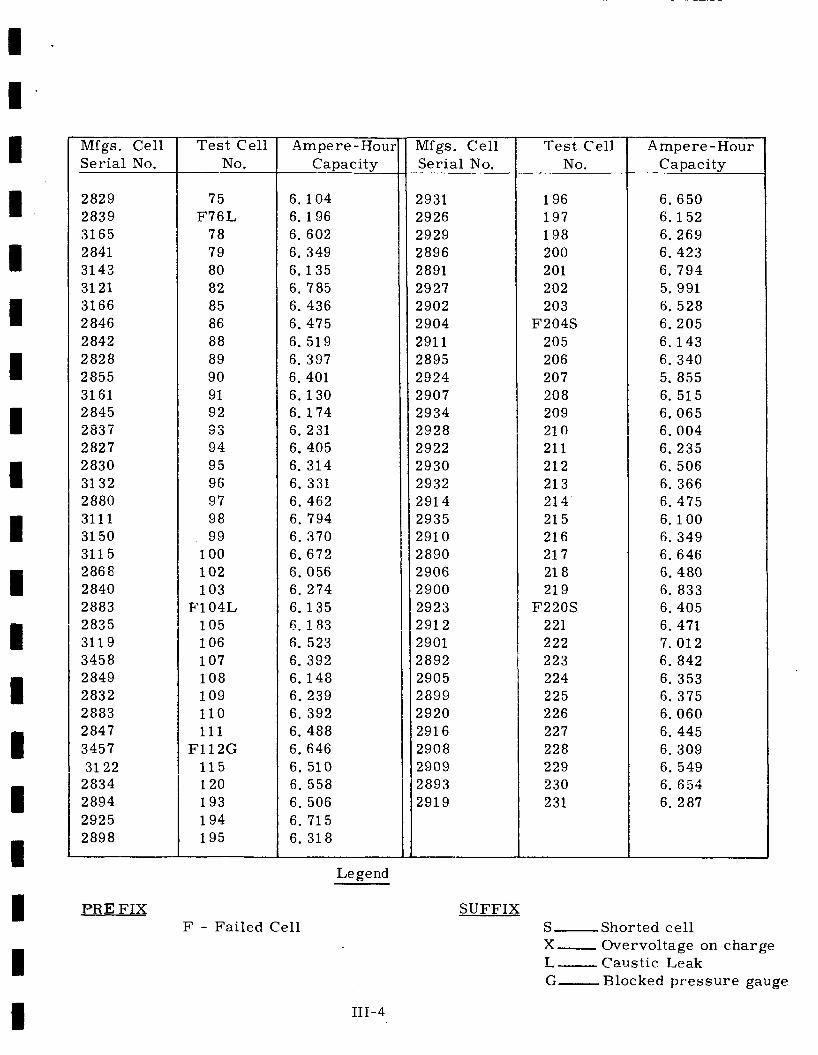
3. 2 . 1 Capacity
The capacity values for all cells passing acceptance tes t ing are listed in Table 1, L i s t of Measured Capaci ty Values. which failed the acceptance tes t . These include cell fa i lures that occur red a f t e r capaci ty testing, ce r t a in ll overvoltage" cells (descr ibed in para . 3. 2. 2) which w e r e under fur ther investigation, and ce l l s with caust ic leaks. A l l cells numbers with a n "F" prefix failed the acceptance tes t . the ce l l number indicates the type of fa i lure:
Capacity values a r e a l s o l is ted for some ce l l s
A suffix l e t t e r following
S shor ted internal ly X overvoltage on charge L caust ic leak G blocked p r e s s u r e gauge
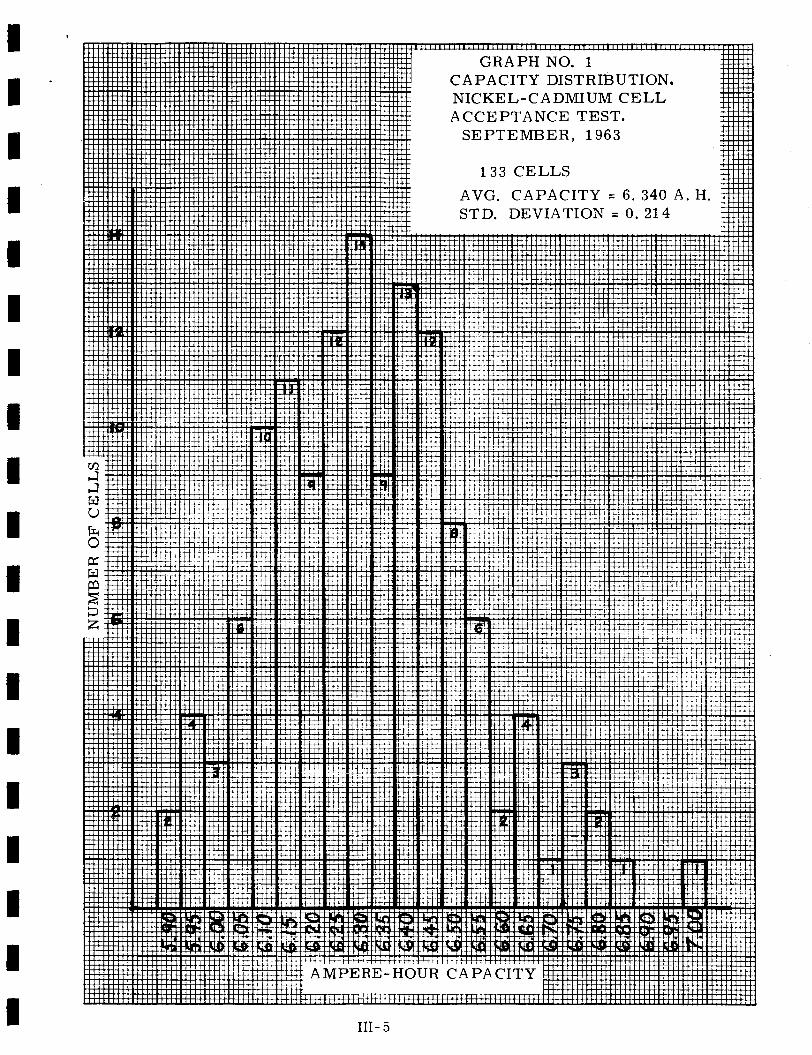
Graph No. 1, Capacity Distribution Graph, i l l u s t r a t e s the distribution pat tern of all init ially accepted ce l l s (no failed cells a re included). The average capacity of these 1 3 3 initially accepted ce l l s is 6. 340 a m p e r e - hours. (See para. 3 . 5 Cel l Selection).
111- 2

1 I I
I I I I I I U I I I I I I I I I I
Mfgs. Cell Serial No.
2869 2874 2858 2854 2852 2887 2870 2884 2851 2853 31 45 2863 2856 2882 31 29 31 42 31 51 31 49 2872 31 30 2871 31 24 2865 31 20 2886 31 31 2878
31 09 31 39 2879 31 59 2860 311 8 31 28 31 26
2888
TABLE 1
LIST OF MEASURED CAPACITY VALUES
Tes t Cell No.
001 002 003 004 005 006 007 008 009 Oi 0 01 1
F012L F013G
01 4 01 5 01 6 01 7 01 8 01 9 020 021 022 023 024 02 5 026 027 028 029 030 031 032 033 034 035 036
5.943 6.104 6. 213 6.170 6. 301 6. 253 6. 248 6. 484 6.178 6.344 6. 218 6. 235 6. 419 6. 322 6.480 6. 580 6. 322 6. 606 6. 296 6.497 6.209 6. 868 6. 589 6. 418 6.113 6.453 6.453 6. 414 6.052 6. 279 6.327 6. 056 6. 484 6. 384 5.995 6.152
A in pe r e -Hour C a pa c it y
111-3
Afgs. Cell lerial No.
3117 31 53 3110 2867 31 55 31 54 2862 3114 2873 31 41 31 25 31 48 31 62 31 56 3116 2861 3112 2876 31 44 3113 2850 31 08 31 60
31 58
2848 2866 31 23 2826 31 27 2825
31 64 2836 2877
2881
2831
2838
Tes t Cell No.
37 38 39 40 41 42 43 44
F45L 46 47 49 50 51 52 53 54
F55L 56 57
F58L 59 60 62 63 64 65 66 67 68
F69S 70 71 72 73 74
Ampere-Hour Capacity
6. 257 6.239 5. 956 6. 327 6.187 6.148 6.060 6. 030 6.069 6. 279 6. 418 6. 266 5. 969 5. 960 6. 549 6. 410 6. 248 6.440 6.143 6. 423 6. 222 6. 418 6.117 6. 440 6. 279 6. 209 6. 301 6.113
6.432 6. 619 6.174 6.182 6. 331 6. 235 6. 584
6.248
I * I- I I 1 I I I I 1 1 I I I I I I 1 I
Mfgs. Cell Serial No.
2829 2839 31 65 2841 31 43 31 21 3166 2 846 2842 2828 2855 31 61 2845 2837 2827 2830 31 32 2880 3111 31 50 311 5 2868 2840 2883 2835 311 9 3458 2849 2832 2883 2847 3457 31 22
2834 2894 2925 2898
PREFIX
Test Cell No.
75 F76L
78 79 80 82 85 86 88 89 90 91 92 53 94 95 96 97 98 99
100 102 103
F104L 105 106 107 108 109 110 111
F112G 11 5 120 193 194 195
Ampere - Hour Capacity
6.104 6.196 6. 602 6. 349 6.135 6. 785 6. 436 6.475 6. 519 6. 397 6. 401 6.130 6.174 6. 231 6.405 6. 314 6. 331 6. 462 6. 794 6. 370 6. 672 6. 056 6. 274 6.135 6 . 1 8 3 6. 523 6. 392 6.148 6. 239 6. 392 6. 488 6. 646 6. 510 6. 558 6. 506 6. 715 6. 318
Legend
Mfgs. Cel l Serial No.
2931 2926 2929 2896 2891 2927 2902 2904 291 1 2895 2924 2907 2934 2928 2922 2930 2932 291 4 2935 291 0 2890 2906 2900 2923 291 2 2901 2892 2905 2899 2920 291 6 2908 2909 2893 291 9
Tes t Cell No.
196 197 198 200 201 202 203
F204S 205 206 207 20 8 209 21 0 21 1 21 2 21 3 21 4 21 5 21 6 21 7 21 8 21 9
F220S 221 222 223 224 225 226 227 228 229 230 231
Ampere-Hour Capacity
6.650 6.152 6.269 6. 423 6. 794 5.991 6.528 6.205 6.143 6. 340 5. 855 6. 515 6.065 6.004 6. 235 6. 506 6. 366 6.475 6.100 6.349 6. 646 6.480 6. 833 6.405 6. 471 7.012 6. 842 6. 353 6. 375 6.060 6. 445 6. 309 6. 549 6.654 6. 287
F - Failed Cell SUFFIX
111-4
S-Shorted cell X- Overvoltage on charge L- Caustic Leak G- Blocked p r e s s u r e gauge

I ' I ' I I 1 I I I 1 I I I I 1 I I I 1 I
3. 2. 2 Te r mi nal Volt a ge s
The end charging voltage of each init ially accepted ce l l is l is ted in Table 2, Te rmina l Charging Voltages. Termina l voltages a r e a l s o l is ted fo r failed ce l l s where applicable.
The possibil i ty of a significant difference in t e rmina l voltages between charge no. 1 and cha rges no. 2 and 3 is apparent from a glance a t Table 2. This possibil i ty has been computed and found to be approximately 97 percent , that i s , t he re is a 97 percent possibility that the te rmina l voltages of charge no. 1 is significantly different f r o m charges 2 and 3. possibil i ty of a significant change between the t e r m i m l voltages of charges 2 and 3 is v e r y close t o 0.
Computed r e su l t s a l so indicate that the
The average of a l l the init ially accepted ce l l s fo r charges 1, 2 and 3 a r e as follows:
Charge No. 1 1. 444 vol ts Charge No. 2 1. 425 volts Charge No. 3 1. 420 volts
The 0. 024 volt sp read of these ave rages is mos t probably due to the dissimilar initia.1 conditions between charge no. 1 and charges no. 2 and 3: charge no. 1 was applied to ce l l s which had been previously sho r t
c i rcui ted fo r 1 6 hours , and charges no. 2 and 3 were applied to cel ls which had been discharged to 1. 0 volts. The conclusions drawn above have been cor robora ted by the r e su l t s of additional tes t ing where a group of 10 ce l l s w a s charged with varying ini t ia l conditions.
III- 6
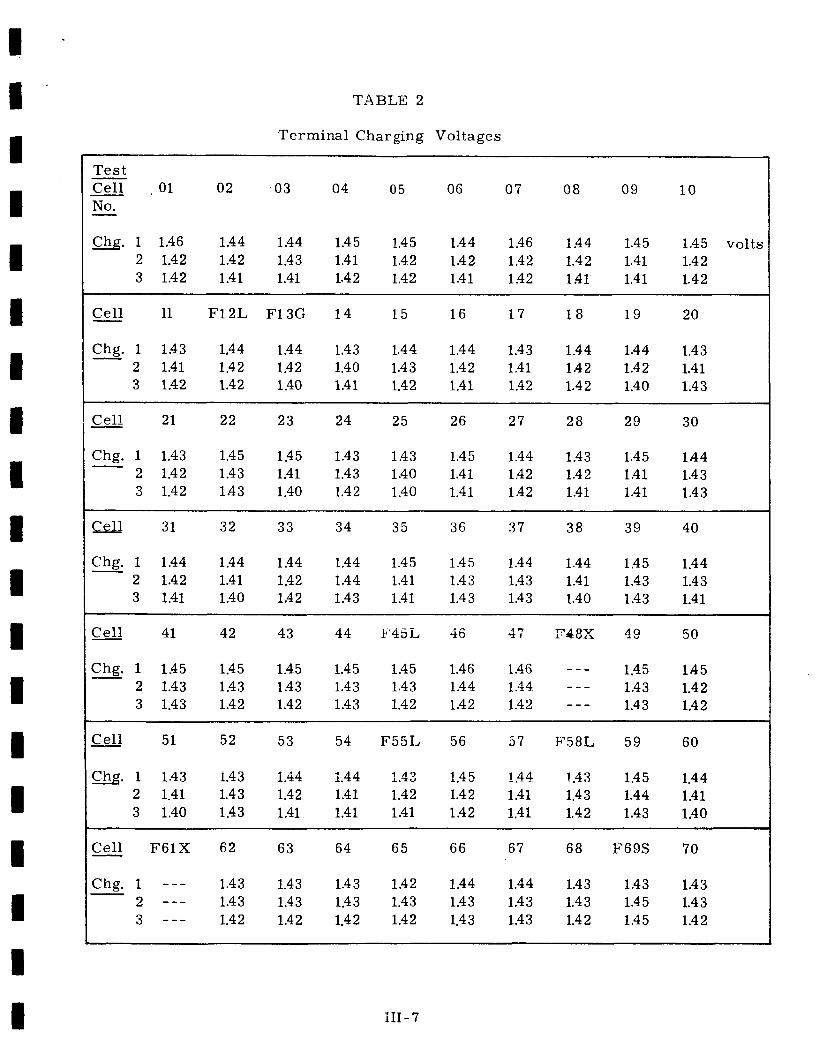
TABLE 2
T e r mi nal Char gin g V ol t a g e s ~~~ ~
T e s t
No. - Cel l 01 02 03 04 05 06 07 0 8 09 1 0
m. 1 1.46 1.44 1.44 1.45 1.45 1.44 1.46 1.44 1.45 1.45 volts 2 1.42 1.42 1.43 1.41 1.42 1.42 1.42 1.42 1.41 1.4 2 3 1.42 1.41 1.41 1.42 1.42 1.41 1.42 1.41 1.41 1.42
~~~ ~~~ ~
Cel l - 11 F12L F13G 1 4 15 16 1 7 1 8 19 20
Chg. 1 1.43 1.44 1.44 1.43 1.44 1.44 1.43 1.44 1.44 1.43 2 1.41 1.42 1.42 1.40 1.43 1.42 1.41 1.42 1.42 1.41 3 1.42 1.42 1.40 1.41 1.42 1.41 1.42 1.42 1.40 1.43
-
- Cel l 21 22 23 24 25 26 27 28 29 30
Chg. 1 1.43 1.45 1.45 1.43 1.43 1.45 1.44 1.43 1.45 1.44 1.4 3 2 1.42 1.43 1.41 1.43 1.40 1.41 1.42 1.42 1.41
3 1.42 1.43 1.40 1.42 1.40 1.41 1.42 1.41 1.41 1.43
-
Cell 31 32 33 34 35 36 37 38 39 40
Chg. 1 1.44 1.44 1.44 1.44 1.45 1.45 1.44 1.44 1.45 1.44 2 1.42 1.41 1.42 1.44 1.41 1.4 3 1.43 1.41 1.43 1.43 3 1.41 1.40 1.42 1.43 1.41 1.43 1.43 1.40 1.43 1.41
-
Cel l 41 42 43 44 F45L 46 4; F48X 49 50
1.45 1.45 1.43 1.42 1.43 1.42
Chg. 1 1.45 1.45 1.45 1.45 1.45 1.46 1.46 - - - 2 1.43 1.43 1.43 1.43 1.43 1.44 1.44 - - - 3 1.43 1.42 1.42 1.43 1.42 1.42 1.42 - - -
-
- Cel l 51 52 53 54 F55L 56 57 F 5 8 L 59 60
Chff. 1 1.43 i.43 1.44 i.44 1.43 1.45 1.44 1,43 1.45 1.44 2 1.41 1.43 1.42 1.41 1.42 1.42 1.41 1.43 1.44 1.41 3 1.40 1.43 1.41 1.41 1.41 1.42 1.41 1.42 1.43 1.40
- Cel l F61X 62 63 64 65 66 67 68 F69S 70
Chg. 1 - - - 1.43 1.43 1.43 1.42 1.44 1.44 1.43 1.43 1.43 2 - - - 1.43 1.43 1.43 1.43 1.43 1.43 1.43 1.45 1.43 3 - - - 1.42 1.42 1.42 1.42 1.43 1.43 1.42 1.45 1.42
-
III - 7

I . I - I
C e l l F121X through F192X
C e l l 193 194 195 196 197 198 F199T 200
TABLE 2 (continued)
- C e l l 71 72 73 74 75 F76LS F77X 78 79 80
a. 1 1.45 1.46 1.44 1.44 1.45 1.45 --- 1.45 1.45 1.46 2 1.43 1.44 1.42 1.43 1.42 1.43 --- 1.43 1.42 1.43 3 1.42 1.43 1.42 1.42 1.42 1.42 --- 1.43 1.42 1442 I
C e l l F81X 82 F83X F 8 4 L 85 86 F87S 88 89 90
Chg. 1 --- 1.45 --- 1. 46 1,44 1.45 1. 45 1.44 144 1.45 2 --- 1.44 --- 1. 43 1.43 1.44 1. 43 1.43 1.43 1.44 3 --- 1.43 --- 1. 44 1.43 1.43 1. 43 1.42 1.42 1.43
C. ell 91 92 93 94 95 96 979 98 99 100
Chg. 1 1.45 1.45 1.45 1.45 1.45 1.46 i.45 1.45 1.44 1.45 2 1.42 1.42 1.42 1.41 1.42 1.44 142 1.42 1.43 1.42 3 1.43 1.42 1.42 1.42 1.42 1.43 1.42 1.43 1.42 1.43
C e l l F l O l X 102 1 0 3 F 104L 105 106 107 108 109 110
Chg. 1 --- 1.45 1.44 1.44 1.44 1.45 1.44 ' 1.44 1.44 1.44 2 - - - 1.43 1.42 1.42 1.42 1.43 1.42 1.43 1.42 1.43 3 --- 1.43 1.42 1.41 1.42 1.43 1.42 1.42 1.42 1.43
I C e l l 111 F112G F113X F114X 115 F116X F117XF118X F119X 120 I
1.4 4 1.4 3 1.42
-- - e-- --- -e- 1.45 --- 1.43 --- 1.43 ---
Chg. 1 144 1.44 --- 2 1.42 1.43 --- 3 1.42 1.42 -0-
--- --- --- --- -- - -..- --- ---
1 C e l l 201 202 203 F204S 205 206 207 208 209 210
Chg. 1 1.45 1.45 1.45 1.45 1.45 1.45 1.44 1.45 1.45 1.44 2 1.43 1.43 1.42 1.43 1.42 1.43 1.42 1.43 1.43 1.42 3 1.43 1.42 1.42 1.43 1.42 1.42 1.42 1.42 1.42 1.42
III- 8

I TABLE 2 (continued)
I I I I I I I
Cell - 21 1 212 213 214 215 216 217 218 219 F220S
Chg. 1 145 145 145 144 145 145 145 145 145 145 2 143 143 143 143 143 143 143 143 143 143 3 142 142 142 142 1 4 2 142 142 142 142 142
-
221 222 223 224 225 226 227 228 229 230
Chg. 1 145 145 145 145 144 146 145 145 145 145 2 143 143 143 143 143 143 143 143 143 143 3 142 142 142 142 142 142 143 142 142 142
-
Cell 231
Chg. 1 145 2 143 3 142
-
I PREFIX
F Failed cell
SUFFIX S Shorted cc?! X Overvoltage on charge L Caustic leak T Malformed terminal G Blocked gauge
III- 9

3. 2. 2 Termina l Voltage (continued)
Approximately 35 percent of all ce l l s tes ted exhibited an overvoltage condition when charged a t a 0. 60 a m p e r e r a t e , These ce l l s r eached a closed c i r cu i t voltage of 1. 50 volts in less than 16 hours , usually in 11 to 14 hours, and m o s t probably would have gone higher had they not been disconnected f r o m the charging source upon reaching 1. 50 volts. No. 2, Normal vs “Overvoltage” cel l charge cha rac t e r i s t i c s , i l l u s t r a t e s the inc rease i n t e rmina l voltage on one of these ce l l s as compared to a I t normal”cel1 .
Graph
This charac te r i s t ic of s o m e ce l l s , although previously observed by the ce l l manufacturer , w a s peculiar in that i t occu r red oniy in ce i i s with a ce r t a in type of p re s su re gauge. A l l no rma l ce l l s w e r e equipped with a M a r s h Instrument Co. gauge o r no gauge at all, and all overvoltage ce l l s w e r e equipped with a gauge manufac tured by U. S. Gauge Co. The 100 percent fa i lure r a t e of the cells equipped with the l a t t e r gauge w a s too grea t t o consider the resu l t s coincidental; yet , the cause of the overvoltage cha rac t e r i s t i c could not be readi ly attr ibuted to the ga.;ge i tself because of the s imi la r i ty of two gauges, both in construction and method of operation. Although the l a t t e r gauge w a s physically l a r g e r than the o ther gauge, 2 3 / 4 inches 0. D. a s compared t o 2 1 / 4 inches 0. D. , the internal volume of the two gauges w a s identical: 2. 0 cc. ve ry slight white and green flecked co r ros ive appearing fi lm found on the inside of the en t rance fitting on each of the two U. S. Gauge Co. gauges inspected.
The only o ther difference noted was a
P re l imina ry investigation disc 10s ed that s ever a1 different manufacturing lot numbers were represented in the group of failed cel ls . This fac t s eemed to ru le out the possibility of a manufactur ing process defect in a cer ta in batch or lot of cel ls .
111-1 0
3. 2. 2 (continued)
At the present t ime investigation is being continued on the previously mentioned co r ros ion found in the gauge fitting. A supplemental r e p o r t on the findings of these t e s t s will be presented upon t e s t completion.
A computer programmed "Least Squares Polynomial F i t " routine on the two c h a r a c t e r i s t i c c u r v e s in Graph No. 2 , page 111-12, yielded the following equations :
Curve No. 1, "Normal Cell" 1st o r d e r fit
Y = 1. 335 + .00694 X and Std. Deviation = . 0112 volts
where Y = Cell Voltage and X = Hours of cha rge a t 0. 600 amps .
Curve No. 2, "Overvoltage Cell" 1st o r d e r f i t
Y = 1. 333 + . 00966 X and Std. Deviation = . 0162 vol ts
3rd o r d e r f i t
y = 1. 329 + ,0266X - . 00519X2 + . ooo348x3 and Std. Deviation = . 0102 vol ts
111- 1 1

111- 1 2

I 1 ' I I I I I I I I I I I I I I I I I
3. 2. 3 P r e s s u r e
Terminal P r e s s u r e readings fo r a l l ce l l s equipped with p r e s s u r e gauges a r e l is ted i n Table 3. Readings labeled CHG 1 TERM, CHG 2 TERM and CHG 3 TERM rep resen t cel l p re s su res recorded at the terminat ion of capacity tes t charges No. 1, No. 2 and No. 3, respectively. All negative readings are in Inches of Mercury and a l l positive readings are in Pounds pe r Square Inch.
The l i s t of third charge p r e s s u r e readings for ce l l s 001 through 010 is representa t ive of the readings taken fo r a l l normal ce l l s ' du r ing the third charge. A l l ce l l s , with the exception of those with blocked p r e s s u r e gauges, exhibited s i m i l a r pat terns of p r e s s u r e movement during the th i rd charge half-cycle of the capacity tes t . Since ce l l p r e s s u r e s did not change appreciably during the f i r s t 10 hours of charge, only the readings taken during the last 6 hours of charge were recorded.
In pract ical ly all c a s e s a significant change in te rmina l p re s su re was noted between charge No. 1 and charges No. 2 and 3. The difference in ini t ia l charge conditions, mentioned in para . 3. 2. 2, w a s mos t probably the cause of this increas ing pressure with increas ing charge number.
A wide distribution in charge No. 3 t e rmina l p r e s s u r e s is i l lustrated in the Te rmina l P r e s s u r e Distribution Graph, Graph No. 3. It should be noted, however, that init ial p re s su re readings, those taken a t the beginning of the th i rd charge , var ied f rom ce l l to ce l l by a s much a s 1 4 inches of Mercury. p res s u r e - charge cha rac t e r i s t i c s for t h ree cel ls , N o ' s 1, 5 and 1 9 a r e i l lus t ra ted in Graph No. 4.
Typical
111- 1 3

8 I ’ I I 1 I I I 1 I I I I I I I I I I
Table 3
Capacity Test Pressure Readings
Typical Capacity Test P r e s s u r e Data Cell Numbers 001 to 010
001 002 003 004 005 006 007 008 009 010
+O 4 +o 9
-1 8 -1 8 -1 7 -1 6 -1 5 -1 5 -1 4 -1 4 -10 -10 -07 -04 +o 0 +O 3 +oo +O 6 +O 6 +O 8 +o 9 +09 +o 9 +o 9 +o 9 +o 9 +10 +11 +11 +11
-10 -08
- 25 - 24 -22 - 22 - 21 - 20 -1 4 -1 4 -1 8 -1 6 -1 6 -1 5 -1 5 -1 0 -1 0 -1 0 -06 -05 -05 -02 - 01 +oo +o 0 +oo +oo +oo +oo +oo
t o o +O 3
-1 9 -1 8 -1 6 -1 7 -1 6 -1 6 -1 5 -1 6 -1 3 -1 4 -1 4 -10 -1 0 -05 +O 3 +oo +oo +01 +O 3 -03 .to1 +O 3 +06 +06 +O 4 +O 5 +O 5 +O 5
+01 +oo +05 +04
-18 -24 -16 -21 -16 -20 -16 -19 -16 -19 -15 -20 -15 -20 -15 -18 - 1 2 -16 -10 -15 -15 -15 -08 -15 -05 -15 -03 -10 -05 -05 -05 -02 -03 -05 +00 -03 +oo +oo +03 +03 +01 t o o +03 +03 +06 +03 +06 +03 +06 +04 +05 +04 +05 +04 +05 +04
to1 -01 to7 +05
-22 -20 -20 -20 -20 -20 -18 -18 -18 -18 -16 -16 -16 -16 -15 -15 -14 -15 -12 -15 -10 -14 -09 - 1 2 -07 -10 -05 -07 -03 -05 +00 -04 +01 +oo t o 3 -01 +03 +02 t o 3 +03 t o 6 +03 +06 +03 +07 +03 +07 +05 +08 +05 +08 +05 +08 +05 +08 +06
-11 +oo -09 +04
-30 -20 -25 -20 -25 -20 -22 -1 8 -21 -18 -17 -17 -20 -16 -20 -15 -19 -15 -20 -15 -20 -17 -18 -10 -17 -10 -15 -05 -15 -03 -15 +00 - 1 2 t o 1 -10 +03 - i O i 3 3 -07 +06 -05 +06 -05 +06 -02 +06 -01 +06 -03 +05 -02 +05 -01 +06 -01 +06
-00 +O 3
-20 - 20 -20 -1 8 -1 8 -20 - 20 -1 8 -1 5 -1 5 -1 5 -1 4 -10 -1 0 -05 -05 -05 +o 0 -93 +O 3 +o 0 +O 3 +O 3 +O 3 +O 4 +04 +04 +O 4
Tim e
Chg. 1 Term. Chg. 2 Te rm.
10-1 10-2 10-3 10-4 11 -1 11-2 11-3 11-4 1 2 - 1 12-2 12-3 12-4 13-1 13-2 13-3 13-4 14-1 14-2 14-3 14-4 15-1 15-2 15-3 15-4 16-1 16-2 16-3 Chg. 3 Term.
I Cell Numbers 11 to 20 I [ 011 F012L F013G 014 015 016 017 018 019 020 1 T i m e - -1
+oo +01 -25 -09 +Ol -05 +OO +O2 1.03 +OO +03 +05 - 25 -05 +03 +00 +02 +04 +06 +oo +04 +06 -25 -01 +03 +o2 +03 +05 +08 +01 1 Chg. 1 Term.
Chg. 2 Term. Chg. 3 Term,
III- 14

Table 3 (continued)
Cell Numbers 21 to 30
021 022 023 024 025 026 027 028 029 030 Time
-02 +03 -09 +02 +01 +03 -09 -05 +13 +00 Chg. 1 T e r m +01 +13 +00 +05 +03 +05 -04 +00 +16 +02 Chg. 2 T e r m +o 2 +14 +00 +06 +04 +05 -01 +01 +17 +03 Chg. 3 T e r m
Cell Numbers 31 to 40
031 032 033 034 035 036 037 038 039 040
-07 +03 -09 +03 +15 +15 +06 +00 +08 - 0 3 Chg. 1 Term +06 -05 +06 +22 +21 +08 +O1 +13 +03 Chg. 2 Term
- 01 +09 -05 +06 +24 +22 +12 +02 +15 +04 Chg. 3 Term
-05
Cell Numbers 41 to 50
041 042 043 044 F045L 046 047 F048L 049 050
+O 5 +02 -05 +11 -05 -05 +05 - - - +00 -05 Chg. 1 Term +O 7 +09 +01 +15 +01 +01 +09 - - - +01 +00 Chg. 2 T e r m +O 8 +10 +02 +17 +02 +02 +10 - - - +03 +02 Chg. 3 Term
Cell Numbers 51 to 60
051 052 053 054 F055L 056 057 F058L 053 969
+01 $01 -06 +07 -10 + O O +01 -08 +06 +00 Chg. 1 Term +04 +04 +01 +12 -05 +03 +04 +04 +11 +01 Chg. 2 Term +04 +Os +02 3-15 to0 +02 +04 +07 +12 +02 Chg. 3 Term
Cell Numbers 61 to 70
F061X 062 063 064 065 066 067 068 F069S 070
-15 Chg. 1 Term +O 8 +06 +12 +06 +03 +19 +16 +05 +02 +06 Chg. 2 Term
+12 +15 +12 +05 +26 +18 + l o +03 +08 Chg. 3 Term
-25 -1 2 - 20 - 1 2 -26 -25 -20 -17 - 2 2
- - -
Cell Numbers 71 to 80
071 072 073 074 074 F076L F077X 078 078 080
- 20 -1 5 -1 7 - 20 -20 -22 +02 -17 -20 -05 Chg. 1 Term +13 +07 +04 +06 +03 - - - +04 +05 +17 Chg. 2 T e r m +15 +08 +06 +OS +04 - - - +05 +06 +19 Chg. 3 Term
- - - ---
111- 1 5

Table 3 (continued)
Cel l Numbers 81 to 90
I FO81X 082 F083X F084L 085 086 F087S 088 089 090
- - - +12 - - - - - - +04 +05 - - - -07 +02 +12 C h g l T e r m - - - +20 - - - - - - +09 +09 - - - -03 +10 +20 Chg 2 T e r m - - - +24 - - - - - - +12 +13 - - - +06 +13 +22 Chg 3 T e r m
Cell Numbers 91 to 100
091 092 093 094 095 096 097 098 099 100
+12 -06 +02 +00 +13 +06 -05 +04 -04 Chg 1 T e r m Chg 2 T e r m
+16 +01 +07 +G4 t25 + I 3 t 0 2 +O? +O? Chg 3 T e r m
+15
+2 7 - - - - - - - - - - - - - - _ _ _ _ - - - - - - - - - - - -
Cell Numbers 101 to 11 0
F lOlX 102 103 F104L 105 106 107 108 109 110
+oo +00 +02 +03 +00 +04 -1-05 Chg 1 T e r m +16 -10 +26 +02 +05 +03 +07 +04 +02 +12 +09 Chg 2 Te rm +28 +03 +06 +03 +09 +05 +03 +12 +09 Chg 3 T e r m
- - - - - - - - -
Ceii Numbers 11 1 to 120
111 F112G F113X F114X 115 F116X F117X F118X F119X 120
- 1 2 Chg 1 Term -1 5 -30 -07 -30 +O 6 -04 Chg 2 T e r m -01
- - - - - - 4 0 - - - - - - - - - - - -
+14 - - - +O 5 -30 - - - - - -
A!! rcmzicing cells either failed acceptance tes t s o r were not equipped with p re s su re gauges.
Legend
Pref ix F failed cel l "+" values in PSIA Suffix S internal short
values in in. of Hg. II- I 1
X overvoltage L caustic leak G blocked gauge
111-1 6

I I I I I I
I
I
I I I
I I
4 4 w u E 5 3 n
i
4 u 4
u z
P w P w <
w u u 4
cn
111-1 7

I - I . I I I I I I I 1 I I 1 I I I I I I 111-1 8
I - I - I I I I I I I I I I I I I I I I I
3. 3 Cell Short Tes t
Nine ce l l s were rejected because of in te rna l s h o r t c i rcu i t s . These ce l l s a r e l is ted below with the i r open c i rcu i t voltage a f t e r the specified 2 4 hour s tand period. to note that mos t of these internal ly shor ted ce l l s appeared normal in other respec ts such as ampere -hour capacity, internal p r e s s u r e and terminal voltage.
I t is in te res t ing
MFG'S SERIAL NO. CONTRACTORS CELL ASSIGNED VOLTAGE.
CELL NUMBER VOLTS
31 27 69 0. 984 2839 76 0.375 2844 87 0. 760 2094 1 3 0 0. 767 2110 1 3 5 0.734 21 30 1 7 0 0. 621
1 7 4 0.220 21 32 2904 204 0. 054 2923 220 0. 845
111-1 9
I ' I ' I I I I I I I I I I I I I I I I I
L
3. 4 Internal Resis tance
F igure 10 is a photograph of the CRT display of a ce l l voltage as the ce l l w a s subjected to the in te rna l r e s i s t ance tes t . The left hand portion (6. 5 c m ) of the t r ace , r ep resen t s the ce l l voltage under 0. 3 a m p discharge and the right hand portion. r ep resen t s the ce l l voltage action during 6 a m p discharge. The inc rease in voltage level displayed in the photograph is caused by the net resultant of the positive bucking cel l voltage, which is constant, and the decreas ing nickel-cadmium ce l l voltage as it is subjected to the 6 amp. discharge. F igure 9). the one shown in F igure 10.
( see A l l ce l l s tested exhibited a waveform s i m i l a r to
During the f i r s t two o r three mill iseconds a f t e r application of the 6 a m p discharge pulse, cel l voltages dec reased v e r y rapidly and then recovered exponentionally to about the half- way point of the f i r s t excursion. the scope t r ace period aii ce l l voltages displayed a n a v e r a g e decay of approximately 5 mill ivolts.
During the r ema inde r of
F igure 11 shows a photograph of the CRT display with a Weston shunt (50 MV/amp) connected in place of the nickel-cadmium cell. The first portion of the t r a c e , a f t e r 6 amp. discharge initiation, shows a t ransient c u r r e n t pulse approximately 200 u sec . wide, caused by switch-in action of the re ference supply in the Internal Resistance T e s t Unit. The difference in the voltage levels betwee. the left and right hand portions of the t r a c e is 280 mill ivolts which can be expres sed a s a change in cu r ren t of 5. 6 a m p s (0. 3 a m p s to 5. 9 ai-i-ipa)
The internal res i s tance distribution pat tern f o r all 133 init ially accepted ce l l s i s shown in Graph No. 5.
111-20

I . I ' I I
I I I I
I I I I
Vert . 10 M V / C M Horz. 5 M S / C M
C e l l Voltage during C/20 to C Discharge
FIGURE 10
Ver t . 100 M V / C M Horz. 5 M S / C M
shunt Voltage d u r i n g C / 2 0 to C Discharge
FIGURE 11
111- 21

I I ' I I I I I I I I 1 I I I I I I I I
Internal Resistance Measurements
Cell No. 001 002 003 004 005 006 007 008 009 01 0 Int. Res. 3. 5 § 3. 5 3 .7 3 . 5 3.7 3 .7 4.0 3.7 3.9 3 .9
Cell No. 011 F012L F013G 014 015 016 017 018 019 020 Int. Res. 3. 9 3. 7 4.2 4.0 3.9 3.7 4.2 3 .7 4.2 3 .7
Cel l No. 021 022 023 024 025 026 027 028 029 030 Int. Res. 3. 5 3. 5 3 .7 3.3 3 .7 3 . 7 3 .5 3 .7 3 .7 4 . 0
Cell No. 031 032 033 034 035 036 037 038 039 040 Int. Res. 3. 5 3. 3 3.7 3 .9 4.9 4 .2 3.5 4.2 3 .7 3.7
Cel l No. 041 042 043 044 FC45 046 047 F048 049 050 Int. Res. 3. 9 4. 6 4. 4 3. 9 3. 9 4. 2 3. 7 - - 3. 7 3. 5
Cell No. 051 052 053 054 F055L 056 057 F058L 059 060 Int. Res. 3. 9 3. 9 4. 2 3. 9 3. 9 3. 9 3. 5 4. 2 4. 0 3. 7
Cel l No. F061X 062 063 064 065 066 067 068 F069S 070 Int. Res. - - 4. 7 4. 7 3. 9 3. 5 4. 0 3. 9 3. 7 3. 7 3. 9
Cel l No. 071 072 073 074 075 F076L F077X 078 079 080 3. 3 4. 2 4. 2 Int. Res. 3. 9 4. 0 3. 9 4. 7 4. 9 4. 2
Cell No. F081 082 F083 F084 085 086 F087 088 089 090 Int. Res. 4. 4 3. 7 4. 4 3. 9 4. 4 4. 2 - - - 4. 2 4. 4 4. 2
Cel l No. 091 092 093 094 095 096 097 098 099 100 Int. Res. 3. 9 4. 6 4. 9 4. 0 4. 4 3. 9 4. 7 4. 6 4. 4 4. 6
Cel l No. F lOlX 102 103 F104L 105 106 107 108 109 110 Int. Ees. - - - 4. 6 4. 9 4. 0 3. 9 4. 6 4. 4 3. 9 4. 2 3. 9
Cel lNo. 111 F112G F113X F114X 115 F116X F117XF118X F119X 120 Int. Res. 3. 9 3. 7 4. 0 3. 9 3. 9 4. 0
Cel l No. F131X F132X F133X F134X F135X F136X F137X F138X F139X F140X Int. R e s . 4. 6 4. 0 4. 9 4 .6 - - - 4. 6 3. 9 3. 7 4. 4 3. 7
Cel l No. 193 194 195 196 197 198 F199T 200 4. 0 Int. R e s 3. 7 3. 9 3. 7 3. 9 4. 0 3. 9 - - -
- - - ~-
3. 9 - - - - - - - - -
-
Table 4
111-22

I
Table 4 (continued)
Cell No. 201 202 203 F204 205 206 207 208 209 21 0 Int. Res. 3. 9 3. 7 3 .9 - - - 4. 2 4. 2 4. 6 3. 7 4. 4 5. 1
Cell No. 211 21 2 213 214 215 216 217 218 219 F220 Int. R e s . 4. 2 3. 9 3 .7 3 .3 3.5 3.7 3.5 3.7 3.3 - - - -
Cell No. 221 222 223 224 225 226 227 2 2 8 229 230 Int. R e s . 4. 7 3. 9 3.7 3 .9 4 .4 4 .2 3 .9 3.9 3.9 3 . 7
Cell No. F121X through F192X failed acceptance tes t
Cell No. 231 F232X F233X F234X F235X F236X F237X F238X F239X F240X Int. Res. 3. 5
4 A11 internal res i s tance values in milliohms. Legend
Prefix Suffix
F- failed cel l S- internal shor t X - overvoltage G- blocked gauge L- caustic leak T -malformed te rmina l
111-23

111-24

I * I ' I I I I I I I I I I I I I I I I I
3. 5 Cell Selection
Final selection of all cel ls t o be used in the phase two portion of this project cannot be made until the previously mentioned p r e s s u r e t ransducer equipped ce l l s have been received and processed through the acceptance t e s t s .
A prel iminary ce l l selection has been made , however, using the s tandard deviation of ce l l capacity and the average cell capacity as a cr i te r ia . init ially accepted ce l l s were rejected.
Using this data the following 1 5
MFG'S SERIAL NO. CONTRACTORS ASSIGNED
C E L L NUMBER
2869 1 31 24 22 3110 39 31 28 35 31 62 50 31 56 51 31 21 82 3111 98 2925 1 3 4 2891 201 2927 202 2924 207 2900 21 9 2901 222 2892 223
After rejection of the above ce l l s , the Pverage ampere -hour capacity of all rLmaining ce l l s w a s 6. 3 29 ampere -hour s .
111-25

B b I ’ I I I I I I B I u I I I I I I U 1
4 . 0 Summary
The average ampere-hour capacity of a l l 1 3 3 init ially accepted cel ls was 6. 340 ampere-hours . cel ls on the bas i s of capacity deviation, the average dec reased to 6. 329 ampere hours.
After re ject ion of 15 of these
The average positive ( P S I A ) t e rmina l p r e s s u r e for Capacity Tes t charge no. 3 was 8. 86 P S I A , (88 ce l l s ) and the average negative (IN. of Hg. ) terminal p r e s s u r e for this charge was -1. 66 IN. of Hg. (6 cel ls) .
The Capacity Tes t charge no. 3 ave rage terminal voltage was 1. 420 volts, and the average internal r e s i s t ance for a l l 1 3 3 initially accepted cel ls was 3. 9 8 mill iohms.
Of the 239 ce l l s received f rom the government, 121 were rejected. cause of failure. Table 5 is condensed below:
Table 5 identifies each rejected cel l along with the
Reason for Rejection No. of Cells
Caustic Leak 6 Internal Short 4 Blocked Gauge 2 Overvoltage 85 Malformed Termina l 1 Internal Short and Overvoltage 4 Capacity Deviation 15 Caustic Leak and Internal Shorr 1 Caustic Leak and Overvoltage 3
The r e su l t s of testing on the expected twelve p r e s s u r e - t r a n s d u c e r equipped ce l l s will be furnished a t a l a t e r date in a supplemental repor t .
IV- 1

Table 5
Tes t Cel l No.
Rejected Cel ls
Reason for Rejection
1 Capacity deviation 12 Leak a t + termilia1 1 3 22 35 39
~
50 51 55 58 61 69 76 77 81 -___
82 83 84 87 98 101 104 1 1 2 113 114 116 117 118 119 1 2 1 thru 192
194 199 201
Blocked p r e s s u r e gauge Capacity deviation Capacity deviation Capacity deviation Leak a t + t e rmina l Overvoltage Capacity deviation Capacity deviation Leak a t + t e rmina l Leak a t - t e rmina l Over v ol t a g e Shorted internal ly Leak a t + t e rmina l and int. sho r t Overvoltage Overvoltage Capacity deviation Overvoltage Leak a t + t e rmina l Shorted iiiterna!!y Capacity deviation Overvoltage Leak a t + t e rmina l Blocked p r e s s u r e gauge Overvoltage Over volt age Overvoltage Overvoltage Overvoltage Overvoltage Overvoltage: a l s o no. 130, 135, 170 and 174 shorted internal ly , and 142 leaking. Capacity devi a ti on Malformed negative t e rmina l Capacity deviation
IV-2

I I ' I I I I I I I I I I I I I I I I I
Test Cel l No.
Table 5 (continued)
Reason for Reject ion
IV- 3

I . I ' I I I I I I I I I I I I I I I I I
Table 6
Manufacturer ' s Cel l Ser ia l Numbers V e r s e s Test Assigned Numbers
II T e s t Cel l No.
Mfg's Serial No.
00001 00002 00003 00004 00005 00006 00007 00008 00009 0001 0 0 0 0 l l 0001 2 0001 3 0001 4 0001 5 0001 6 0001 7 0001 8 0001 9 00020 00021 00022 00023 00024 00025 00026 00027 00028 00029 00030 00031 00032 00033 00034 00035 00036 00037 00038 00039 00040
2869 2874 2858 2854 2852 2887 2870 2884 2851 2853 3 i 45 2863 2856 2882 31 29 31 42 31 51 31 49 2872 31 30 2871 31 24 2865 31 20 2886 31 31 2878 2888 31 09 31 39 2879 31 59 2860 311 8 31 2 8 3126 3117 31 53 3110 2867
Test Cel l No.
Mfg's Serial No.
00041 00042 00043 00044 00045 00046 00047 00048 00049 00050 0005i 00052 00053 00054 00055 00056 00057 00058 000 59 00060 00061 00062 00063 00064 00065 00066 00067 00068 00069 00070 00071 00072 00073 00074 00075 00076 00077 00078 00079 00080
31 55 31 54 2862 3114 2873 31 41 31 25 2027 31 48 31 62 31 56 3116 2861 3112 2876 31 44 3113 2850 31 08 31 60 2025 2881 31 58 2831 2848 2866 31 23 2826 31 27 2825 2838 31 64 2836 2877 2829 2839 21 42 31 65 2841 31 43
i l
IV-4

I - I ' I I I I I I I 'I I U I U I I U 1 I
Table 6 (continued)
T e s t Cel l No.
00081 000 82 000 83 00084 00085 00086 00087 00088 00089 00090 G O O 9 i 00092 00093 00094 00095 00096 00097 00098 000 99 001 00 001 01 001 02 00103 001 04 001 05 001 06 001 07 001 08 001 09 001 i 0 001 11 001 12 001 13 00114 001 16 001 15 001 17 001 18 001 19 001 20
Mfg's Ser ia l No.
31 47 31 21 2 843 31 46 31 66 2846 2844 2842 2828 2855 31 $1 2845 2837 2827 2830 31 32 2880 3111 31 50 3115 2248B 2868 2 840 2833 2835 3119 3458 2849 2832 2883 2847 3457 2090 2323 2325 31 22 2328C 2242B 2367 2834
IV- 5
Tes t Cel l No.
001 21 001 22 001 23 001 24 001 25 001 26 001 27 001 28 001 29 001 30 O O i 3 i 001 32 001 33 001 34 001 35 001 36 001 37 001 38 001 39 001 40 001 41 001 42 001 43 001 44 001 45 001 46 001 47 001 48 001 49 001 50 001 51 001 52 001 53 001 54 001 55 001 56 001 57 001 58 001 59 001 60
Mfg's Se r i a l NO.
22 50B 2062 21 02 2244B 2246B 21 78A 21 96B 2057 2360 2094 2040 2063 2368 21 34 2110 2067 2331 C 2048 2096 2059 2358 %i 83B 2371 21 81A 2200B 21 95B 2361 2058 2357 2 i 37 2115 21 92B 2326 221 3A 2022 2352 2258B 2363 2053 2033

I I I I I I I I I I I I I I I I I I I
Table 6 (continued)
Test Cel l No.
001 61 001 62 001 63 001 64 001 65 001 66 001 67 001 68 001 69 001 70 301 71 001 72 001 73 001 74 001 75 001 76 001 77 001 78 001 79 001 80 001 81 O O i 82 001 83 001 84 001 85 001 86 001 87 001 88 001 89 O O i 90 001 91 001 92 001 93 001 94 001 95 001 96 001 97 001 98 001 99 00200
Mfg's Se r i a l No.
2082 2297C 2088 21 24 2028 2023 21 46 2038 21 33 21 30 21 29 2036 2238B 21 32 21 40 21 21 21 31 21 27 2226A 21 39 2117 21 14 21 04 2029 21 41 21 35 2241B 2251B 21 44 2026 2118 21 25 2894 2925 2898 29 31 2926 2929 291 5 2896
IV- 6
Test Cel l No.
Mfg's S e r i a l No.
00201 00202 00203 00204 00205 00206 00207 00208 00209 0021 0 0021 1 0021 2 0021 3 0021 4 0021 5 0021 6 00217 0021 8 0021 9 00220 00221 00222 00223 00224 00225 00226 00227 00228 00229 on230 00231 00232 00233 00234 00235 00236 00237 00238 00239
2891 2927 2902 2904 291 1 2895 2924 2907 2934 2928 2922 2930 2932 291 4 2935 291 0 2890 2906 2900 2923 291 2 2901 2892 2905 2899 2920 291 6 2908 2909 2893 291 9 2355 241 2 2534 2407 1273 2406 2527 2-29