i. names, titles, phone numbers, and e-mail · i. names, titles, phone numbers, and e-mail...
TRANSCRIPT
I. Names, titles, phone numbers, and e-mail addresses of spokesman and acting Spokesman Name of spokesman: Welch Lin Title: Chief Financial Officer Tel: 886-2- 5576-1888E-mail address: [email protected]
Acting spokesman: Wilson Chou Title: Senior Vice President Tel: 886-2-5576-2568E-mail address: [email protected]
II. Addresses and phone number of Taishin Financial Holding Company and subsidiaries ■ Taishin Financial Holding Co., Ltd. Address: 9F, 12F, 13F, 16F, 20F~23F, No.118, Sec. 4, Ren-ai
Rd., Da-an Dist., Taipei City 106, Taiwan (R.O.C.) Tel: 886-2-2326-8888 Website: http://www.taishinholdings.com.tw
■ Taishin International Bank Co., Ltd. Address: B1&1F, No.44, Sec. 2, Jhongshan N. Rd., Jhongshan
Dist., Taipei City 104, Taiwan (R.O.C.) Tel: 886-2-2568-3988 Website: http://www.taishinbank.com.tw
■ Taishin Securities Co., Ltd. Address: 2F, No.44, Sec. 2, Jhongshan N. Rd., Jhongshan
Dist., Taipei City 104, Taiwan (R.O.C.) Tel: 886-2-2181-5888 Website: http://www.tssco.com.tw
■ Taishin Asset Management Co., Ltd. Address: 2F-3, No.9, Dehui St., Jhongshan Dist., Taipei City
104, Taiwan (R.O.C.) Tel: 886-2-2596-9388 Website: None.
■ Taishin Venture Capital Investment Co., Ltd. Address: 18F, No.118, Sec. 4, Ren-ai Rd., Da-an Dist., Taipei
City 106, Taiwan (R.O.C.) Tel: 886-2-2706-6919 Website: None.
■ Taishin Securities Investment Trust Co., Ltd. Address: 13F, No.96, Sec. 1, Jianguo N. Rd., Jhongshan Dist.,
Taipei City 104, Taiwan (R.O.C.) Tel: 886-2-2501-1000 Website: http://www.tsit.com.tw
■ Taishin Securities Investment Advisory Co., Ltd. Address: 16F, No.118, Sec. 4, Ren-ai Rd., Da-an Dist., Taipei
City 106, Taiwan (R.O.C.) Tel: 886-2-5589-9558 Website: http://www.tss-c.com.tw
■ Taishin Holdings Insurance Brokers Co., Ltd. Address: 11F, No.44, Sec. 2, Jhongshan N. Rd., Jhongshan
Dist., Taipei City 104, Taiwan (R.O.C.) Tel: 886-2-2562-1867 Website: http://www.thib.tw
III. Name, address, website, and phone number of the institution for handling stock register
Name: Stock Affairs Agency Department of Taishin International commercial Bank
Address: B1, No. 96, Sec. 1, Jianguo N. Rd., Jhongshan Dist., Taipei city.
Website: http://www.taishinbank.com.tw Tel: 886-2-2504-8125
IV. Names, addresses, and phone numbers of credit rating institutions
Name: Fitch Ratings Address: 13F, No.205, Dunhua N. Rd., Songshan Dist., Taipei
City 105, Taiwan (R.O.C.) Website: http://www.fitchratings.com.tw Tel: 886-2-8175-7600
Name: Taiwan Ratings Address: 49F, Taipei 101 Tower, No.7, Sec. 5, Xinyi Rd., Xinyi
Dist., Taipei City 110, Taiwan (R.O.C.) Website: http://www.taiwanratings.com Tel: 886-2-8722-5800
V. Name, address, website, and phone number of certified public accountant and accounting firm for the financial statement in the recent year
CPAs: Qinzhen Yang , Jerry Gung Name of accounting firm: Deloitte & Touche Tax Consulting Co.,
Ltd. Address: 12F, No. 156, Sec. 3, Minsheng E. Rd., Songshan Dist.,
Taipei City 105, Taiwan (R.O.C.) Website: http://www.deloitte.com.tw Tel: 886-2-2545-9988
VI. Names of Exchanges Where Overseas Securities Are Listed and Methods of Inquiry: None.
CONTENTS
1. Message to Shareholders 03
2. Brief Introduction to the Financial Holding Company 08
3. Corporate Governance 12
4. Fund-Raising Activities 57
5. Operating Status 71
6. Financial Status 117
7. Financial Status, Review of Business Performance, 305
and Risk Management
8. Special Notes 322
9. Itemswithmajoreffectonshareholders’benefitsor 331
securities prices in 2014 and as of the date for the
publication of the 2015 annual report


01Message to Shareholders
4
I. Message to Shareholders
Dear shareholders,
The global economy as a whole exhibited mild recovery in 2014, despite significant diversity in the performances of major economies. The U.S. economy expanded by 2.4%, achieving its highest growth in nearly four years; the Eurozone, though undergoing recovery, posted a growth rate of only 0.8% due to structural problems and uneven competitiveness among EU members. The increase of consumption tax in Japan has had a direct impact on private consumption; although the country was able to avoid a recession by the 4th quarter, economic growth for the full year was marginal at 0.1%. China has posted a full-year growth of 7.4%, the lowest in 24 years. In light of the reforms and structural changes that the nation is going through, this slowdown should endure over the next few years.
Mass production of shale gas in the United States led to a series of price cuts from OPEC; furthermore, the dwindling demands for oil had caused oil prices to fall since the second half of the year, which significantly reduced global inflationarypressures.Inanattempttostabilizepricesandavoiddeflation,EuropeandJapanhadbothsteppeduptheirexpansionarymonetarypolicies,causingamajorshiftofcapitalthatcreatedmorevolatilitytothefinancialmarket.Asoftoday, more than 20 countries have reduced interest rates and joined the race in currency depreciation. Businesses will have to adapt to lower margins as the world enters the age of “New Mediocre” characterized by low interest rate, low growthandlowinflation.
Taiwan’s economic performance is largely determined by the rest of the world. Although Europe, China and Japan had achieved lower than expected growth, growth in the U.S. had driven Taiwan’s export volume to a new height of US$313.8 billion for the whole year. Meanwhile, sales of Trade and Food Service held steady and contributed to a total business revenue of NT$14 trillion, which also set a new record. Driven by domestic and foreign demand, Taiwan achievedaneconomicgrowthof3.74%in2014,outperformingKorea,HongKongandSingaporeforthefirsttimesince1999. The stock market performed well, with the weighted average index closing at 9,307 at the end of 2014, up 8.1% from the previous year and set a new year-end record (the previous high was 9,624 in 1989). Apart from improved fundamentals,thisperformancewasalsocontributedbythepoliciesofFinancialSupervisoryCommissionandaninflowof foreign capital.
Withmorecompetitiveinglobalfinancialmarketsandfurthercross-straitbankingderegulationunderway,theFinancialSupervisory Commission (FSC) has opened the banking industry to more offshore opportunities including OBU (offshore banking unit), OSU (offshore securities unit) and OIU (offshore insurance unit), and promote financial services and products importsubstitution thatcontributed to thegrowthofprofitability in the localbanking industry. In2014, localbanks as a whole produced cumulative pre-tax earnings of MT$320.1 billion, ROA of 0.79%, and ROE of 11.65% while maintaining NPL ratio at 0.25% and coverage ratio at 516.4%; all the aforementioned metrics have shown improvement fromtheyearbefore.InresponsetoFSC’sambitionofbuildingTaiwan’sstatureasanAsiaPacificbankinghub,localbanks have been actively venturing into overseas market including China, and searching for merger opportunities as a quick means to grow.
A one-time loss of $14.8 billion was recognized during the year following the company's loss of control over Chang Hwa Bank. In2014,consolidatedafter-taxprofitamountedtoNT$9.648billion,ofwhichNT$1.624billionwereattributableto shareholders of Taishin Financial Holdings. This represented an EPS of NT$0.08, an ROE of 0.73%, and net worth per ordinary share of NT$11.21.If the one-time loss was excluded, the company would have delivered record-highperformancewithconsolidatedafter-taxprofitamounting toNT$24.423billion,ofwhichNT$16.374billionwere
5
Message to Shareholders 2014 ANNUAL REPORT 01
attributable to shareholders of Taishin Financial Holdings; this would have represented a growth of 18.7% and 18.3%, respectively, an EPS of NT$1.78, an ROE of 14.74%, and net worth per share of NT$12.89.
In November 2014, Fitch Ratings gave the company a long-term credit rating of A+(twn) and a short-term credit rating of F1(twn), while Taiwan Ratings Corp. gave the company a long-term rating of “twA “ and a short-term rating of “twA-1;” both rating agencies had concluded a “Stable” outlook for the company.
In terms of capital structure, the company was able to maintain its capital adequacy ratio at a healthy 122.70%, and reduce debt ratio from 23.4% at the end of 2013 to 21.5% at the end of 2014.
With regards to international banking businesses, the company has established one financial leasing company in Nanjing and one in Tianjin to provide leasing, trade and insurance agency services. Once the Cross-Strait Service Trade Agreement takes effect, the company will accelerate its branch and subsidiary deployments in Mainland China. Following its success with the Hong Kong Branch, Taishin Bank had opened its second overseas branch in June 2014 at oneoftheworld’smostprominentfinancialhubs-Singapore.Meanwhile,theBrisbane,TokyoandMyanmarBranchesare currently in the midst of preparation, and an application for opening a Vietnam Branch is scheduled to be submitted in 2015. In the future, the company will continue to expand its overseas presence, offering more comprehensive and higher quality services to customers.
Performances of the company’s two major business units, retail banking group and wholesale banking group, follow:
Retail Banking Group
As at the end of 2014, the size of Taishin Bank’s mortgage portfolio stood at NT$346.7 billion, representing a 5.7% marketshare; itsauto loanbalanceamountedtoNT$30.9billion,rankingfirst in themarketwithashareof26.5%; ithad 3.5 million credit cards outstanding, ranking 4th with a 9.4% market share; total credit card purchases amounted to NT$175.5 billion for the year, ranking 5th with an 8.5% market share; lastly, Taishin Bank had 74,000 credit card merchants nationwide, ranking 2nd with a 20.7% market share.
Payment services: This year marks the 20th anniversary of the Rose Card. For 20 years, Taishin Bank has continuously brought new values into the classic brand through innovative marketing; and now, Taishin Bank has targeted the consumption needs of general customers by launching an iPass co-brand card in partnership with Shinkong Mitsukoshi - Taiwan’s largest departmental store chain, and TKEC - a local retailer of tourism, telecommunication, and dining services. This all-in-one card gives customers exceptional value in transportation as well as entertainment. An Ever RichInfiniteCardwasalso introducedtooffervaluestopremiumcustomerswhoenjoyoverseastravelandboutiqueshopping. To provide consumers with more convenient means of paying for online purchases, Taishin Bank has been working with Mastercard in launching the MasterPass service that enables Taishin customers to make online payments easily, conveniently and securely at 40,000 merchants in 21 countries worldwide. Taishin Bank is applying its creativity to the Internet online market in the meantime. The bank has partnered with two more payment institutions - “Neweb” and “Pay2go” in 2014 following its success with “PChomePay” and “AllPay” last year. Today, Taishin is the only bank that is concurrently working with all four major third-party payment institutions; it has reached a new milestone in terms of payment services, and is well-positioned to offer win-win solutions to consumers, sellers, payment institutions and acquiring banks.
Mobile banking: After being awarded “Excellence in Mobile Banking” by Retail Banker International in early 2014, the bank was later credited as the “Best Mobile Banking Platform” by MILSTE in November 2014.
6
Wealthmanagement:TaishinBankwasnamed“HighlyCommendedOutstandingPrivateBankAsiaPacificRegionalPlayers” by Private Banker International (PBI) in October 2014, making it the only Taiwanese financial institution to receive this honor. On its latest innovation, Taishin Bank offers a wealth management solution that accommodates businesses and their owners, as well as a family membership scheme. This new solution aims to provide customers with the most suitable asset allocation through a number of services such as product customization, overseas asset planning, taxplanning,andhealthcheckups. Italso involves the launchofanext-generationfinancialmanagementsystem that delivers asset planning solutions with greater objectivity and professionalism. This one-stop shopping experience is what earned the bank its recognition from customers and professional institutions local and abroad.
Securities brokerage (Taishin Securities): The company will continue working closely with Taishin Bank to provide more comprehensive services to individual and corporate customers. It is also committed to refining the ease and convenience of its electronic platforms, in order to satisfy customer demand for easier and quicker e-trades. In 2014, Taishin Securities was able to grow the market share of its brokerage business by 56.5% and margin trade balance by 63.3% over the previous year. It continues to work towards becoming the market’s leading brand.
Wholesale Banking Group
Corporate lending: Loans to state-owned and private institutions totaled NT$206.2 billion at the end of 2014, which ranked 14th among the 39 local banks and represented a 15.1% growth over the previous year, compared to the peer average growth of merely 3%. As a result of its support to the government’s SME credit extension policy and successes achieved in expanding its customer base, Taishin Bank’s lending to SMEs had grown by 28.9% to NT$90.8 billion by the end of 2014, which far exceeded the peer average growth of merely 8.5%.
Other wholesale banking services: Taishin Bank continued to lead the market in factoring services, with volume totaling NT$234.5billion in2014;financialderivativesamounted toUS$111.1billion in termsofnominal terms, ranking thirdamong market peers; lastly, Taishin Bank provided share administration services to a total of 192 companies traded on TSEC, GTSM and the Emerging Stock Market, ranking 4th among market peers.
In terms of new services, the offshore banking unit (OBU) opened foreign currency services over the Internet in September 2014, which enabled OBU customers to remit funds, issue LCs, and request for export/import collection in a timelier manner using Internet banking. Furthermore, Taishin Bank was licensed to underwrite international bonds by theCentralBanktowardstheendofSeptember2014; followingthebank’ssuccessunderwriting itsfirst internationalbond in November 2014, more efforts will be devoted to underwriting international bonds for foreign issuers.
Securities underwriting (Taishin Securities): Taishin Securities spearheaded 14 securities underwriting cases in 2014, ranking fourth in the market.
Asia has become the focus of global capitalism following the emergence of the Chinese economy. The Bank 3.0 initiative and various other policies introduced by the government at this critical juncture may help to guide banks into the next phase of transformation; they may also encourage deployment of branches throughout Asia as part of the banks’effort tobecomeregionalbanking institutions.Meanwhile, introductionof the“financialservicesandproductsimport substitution” solution improves banks’ ability with regards to investment management and innovation; whereas availabilityofOBU,OSUandOIUhelpsestablishTaiwan’spositionasthefinancialhubinAsiaPacific.Lastly,thelatestderegulations targeted at mobile Internet users will open up more opportunities for banks to deliver services online.
Going forward, the company will take advantage of ongoing deregulation to expand its business scope while committing to stringent risk management. We will research on and develop new financial products and establish a presence

7
Message to Shareholders 2014 ANNUAL REPORT 01
throughout Asia to provide customers with a transnational banking experience. In the retail banking segment, the company will leverage on the latest Internet and mobile technologies to develop payment solutions and collaborate with third party payment institutions. In addition, the bank will continue exploring opportunities to co-operate with overseas and Chinese counterparts, while incorporating risk management into our operating platforms to minimize credit and operationalriskasweprovideourcustomerswithoptimalservicequalityandefficiency.
Every Taishin employee has long dedicated themselves to delivering the best banking services with “integrity, commitment,innovationandcooperation”inmind.Eveninthepursuitofprofitability,wehavebeenabletodemonstratethe innovation and customer-centric values that have helped shape Taiwan’s banking industry as a whole. Looking ahead, Taishin will continue to adhere to this mission and adopt a visionary approach to build up its competitiveness as aregionalfinancialinstitutioninAsia,whilestrivingtodelivercomprehensiveservicesandmaximizingprofitstobenefitcustomers, shareholders and employees alike.
ChairmanTaishin Financial Holding
April 2015
02
Brief Introduction to theFinancial Holding Company
9
Brief Introduction to the Financial Holding Company 2014 ANNUAL REPORT 02
II. Brief Introduction to the Financial Holding Company
A. Date of establishment
Feb. 18, 2002
B.Originofthefinancialholdingfirm
In the wake of the enactment of the Financial Institutions Merger Law and the Financial Holding Company Law, financial-institution merger and the cross selling of financial products have become an industrial trend. Taishin Financial Holding Co., Ltd. was established on Feb. 18, 2002 via share swap with Taishin International Bank following the latter’s merger with Da An Commercial Bank. Subsequently, Taishing Financial Holding put Taishin Securities and Taishin Bills Finance under its fold on Dec. 31, 2002, via the respective share-swap ratios of 1:1.2 and 1:1.3.
Inaddition,inordertohelpdomesticfinancialinstitutionsalleviatethepressureofhighNPL(non-performingloan)ratio and liquidate their bad assets, the company set up a 100% venture Taishin Asset Management Co., Ltd. in Aug. 2002. In Oct. 2002, with the approval of the Ministry of Finance (MOF), it put under its auspices Taishin Marketing Consultant Co., Ltd., which became its subsidiary, with the aim of enhancing marketing efficacy and lowering marketing cost. Moreover, in September 2002 the company established Taishin Venture Capital, making its business structure even more complete and enabling it to offer clients plural product lineup, so as to help staff achieve even better performance by enriching the depth and magnitude of their industrial knowledge.
On Oct. 18, 2004, the company’s subsidiary Taishin International Bank took over the Tenth Credit Cooperative of Hsinchu, further expanding the company’s banking branches deployment and business scale and winning it an advantageousmarketposition,soastofacilitateitseffortinboostingprofitandachievingthemaximumbenefitsforshareholders, clients, and employees.
On Oct. 3, 2005, the company obtained 22.5% controlling stake in Chang Hwa Bank at cost of NT$36.5 billion before reshuffling the latter’s board of directors and making the bank its subsidiary. The move boosted the company’stotalassetstoNT$2.35trillion,thesecondlargestamongdomesticfinancialholdingfirms,andmadeitoneofthedomesticfinancialfirmswiththelargestamountofbankingbranches,pavingthewayforthecompanytobecome a domestic leading brand.
In 2006, the company introduced three strategic foreign partners, Newbridge Capital of the U.S., Nomura Group, and QE International (L) Ltd., which together invested NT$35 billion in the company by private placement, strengthening the company’s capital structure and boosting its capital adequacy ratio.
On March 18, 2009, the company’s subsidiary Taishin Securities acquired a 55% stake in Taishin Investment Trust, thereby transforming the latter into its 100%-owned subsidiary. The buyout has enabled Taishin Securities to expand its produce resources and offer clients more comprehensive wealth-management services, facilitating its efforts to seekthemaximumsynergyeffectundertheprincipleof“clientfirst,”inthehopeofcreatingawin-winoutcomeforshareholders and clients.
10
On Dec. 19, 2009, Taishin Securities, the company’s subsidiary, completed its merger with KGI Securities, enabling Taishin Financial Holding to concentrate its resources on banking business.
On April 9, 2010, the company took over Tung Hsing Securities and subsequently renamed it Taishin Securities, therebyofferingcustomersevenmorecompleteandcomprehensivefinancialservices.
On July 26, 2010, Taishin Investment Trust and Taishing Securities Investment Advisory were put into the fold of the financialholdingcompanyagain,becomingitssubsidiaries.OnDec.18,inthesameyear,TaishinInvestmentTrustacquired Taiwan Industrial Bank Securities Investment Trust, further expanding the scale and market share of the assets under its management.
On Jan. 22, 2011, subsidiary Taishin Bank took over Taishin Bills Finance, in order to cut costs, effectively integrate thefinancialholdingcompany’sinternalresources,andcreatehighyield,makingthecompanyafinancialholdingcompany centering on a quality bank.
On April 27, 2011, the company acquired Franklin Insurance Brokers Co., Ltd. (renamed as Taishin Holdings Insurance Brokers on May 16, 2011), thereby enabling other subsidiaries to access property and life insurance products and provide complete product lineup for sales service.
On October 17, 2011, Taishin Financial Leasing (China) under Taishin Financial Holdings opened its door in Nanjing andobtainedanationalleasinglicensetoprovidefinancialleasingservicesforcorporateclients.
OnJuly5,2012,TaishinFinancialLeasing(Tianjin)wasfounded inTianjinandofficiallyobtaineda three-in-onelicensetoprovideleasing,factoring,installmentsales.Itwasthefirstforeigncompanytoobtainthistypeoflicense.
The opening of Taishin Bank’s Singapore Branch on June 24, 2014 was not only a new milestone in Taishin group’s overseas expansion, but also serves as an important gateway to the regional and global economy. The branch will be working closely with Singapore and Southeast Asian banks to actively participate in syndicated lending. It will alsodevelopotherbankingservicessuchasbilateral lending, tradefinancing,accountsreceivablefinancingetc,and offer customers a broad range of wealth management solutions involving mutual funds and bond investments. The branch’s future customer focus will be in China and Southeast Asia.
Honors of the Company-
■ 2014.12 [Taishin Holdings] was awarded the Excellence in Management and Corporate Governance Award - Gold Award, by The Asset
■ 2014.12 [Taishin Bank] was named by The Asset as Best in Financial Services – Retail Banking
■ 2014.11 [Taishin Holdings] was awarded the Taiwan Top 50 Corporate Sustainability Report Awards – Financial Industry - Silver Award by Taiwan Institute for Sustainable Energy
■ 2014.11 [Taishin Bank] was nominated by Taiwan Academy of Banking and Finance for the Taiwan Banking and Finance Best Practice Award- Best Human Resources Development Award
■ 2014.11 [Taishin Bank] was awarded the Best Mobile Banking Platform – Taiwan by MILSTE
■ 2014.10 [Taishin Bank] was named Highly Commended Outstanding Private Bank - Asia Pacific Regional Players, by Private Banker International (PBI)
11
Brief Introduction to the Financial Holding Company 2014 ANNUAL REPORT 02
■ 2014.09 [Taishin Bank] was named one of the “Outstanding Banks in Credit Guarantee Financing” by the Ministry of Economic Affairs
■ 2014.09 [Taishin Bank] was awarded Affinity/Co-Branded Card Programme of the Year by Cards & Electric Payments International
■ 2014.09 [Taishin Bank] was awarded Card Benefits Programme of the Year by Cards & Electric Payments International
■ 2014.07 [Taishin Bank] received the Best Product Award from Business Today
■ 2014.07 [Taishin Bank] was named “Domestic Retail Bank of the Year - Taiwan” by Asian Banking & Finance
■ 2014.07 [Taishin Bank] was awarded “Online Banking Initiative of the Year - Taiwan” by Asian Banking & Finance
■ 2014.07 [Taishin Bank] was awarded “Website of the Year – Taiwan” by Asian Banking & Finance
■ 2014.06 [Taishin Bank] was awarded “Best Loyalty Programme” in Taiwan by Asian Banker
■ 2014.06 [Taishin Bank] was awarded “Best Customer Relationship Management” in Taiwan by Asian Banker
■ 2014.06 [Taishin Bank] was awarded “Best Cloud Based Project” in Taiwan by Asian Banker
■ 2014.05 [Taishin Bank] was named Best Private Bank in Taiwan by PBI
■ 2014.04 [Taishin Bank] was awarded Best Mortgage and Home Loans Product Initiative by Asian Banker
■ 2014.03 [Taishin Bank] was ranked by Finance Asia amongst the “Best Managed Companies” (10) in Taiwan
■ 2014.03 [Taishin Bank] was ranked by Finance Asia amongst the “Best Corporate Governance” (10) in Taiwan
■ 2014.03 [Taishin Bank] was ranked by Finance Asia amongst the “Best Corporate Social Responsibility” (9) in Taiwan
■ 2014.03 [Taishin Bank] was awarded “Excellence in Mobile Banking” by RBI (Retail Banker International)
■ 2014.02 [Taishin Holdings] was named Best Private Banking for Innovation in Asia by IAIR Awards
■ 2014.02 [Taishin Bank] was recognized by The Asset as one of the winning companies in Best LBO/Best Privatization
■ 2014.01 [Taishin Bank] was recognized by Finance Asia as one of the winning companies in Best Leveraged Loan

03Corporate Governance
13
03Corporate Governance2014 ANNUAL REPORT
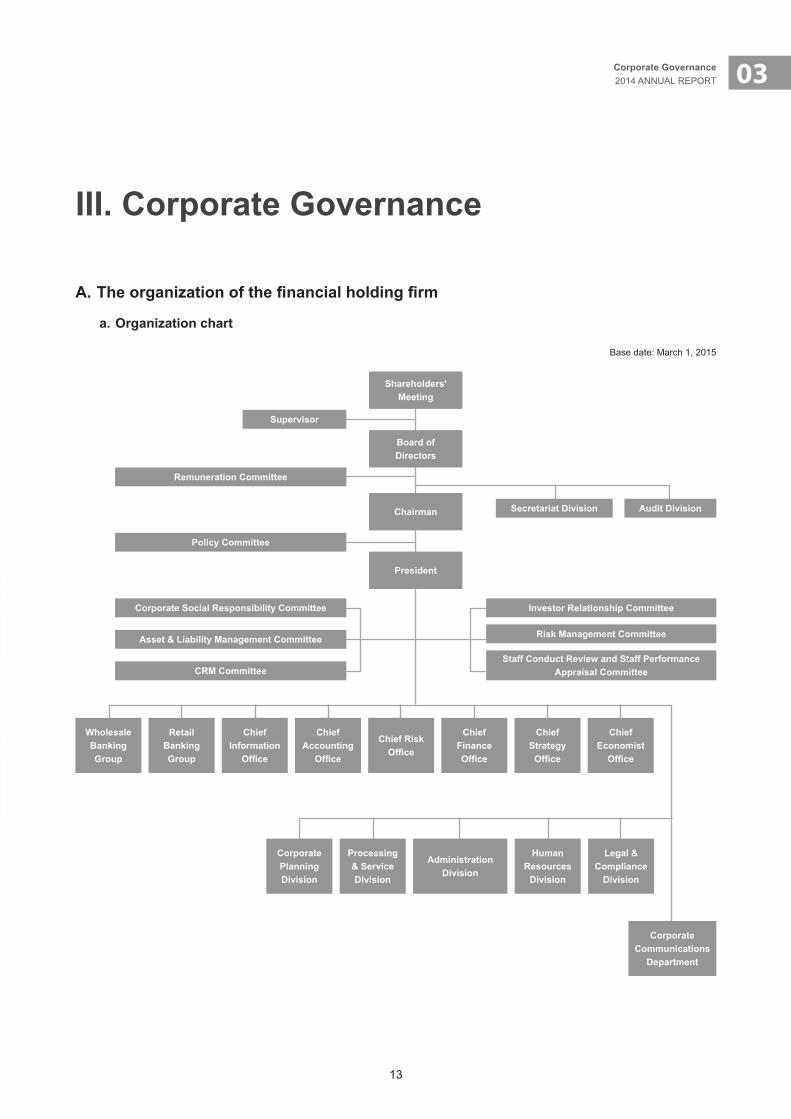
III. Corporate Governance
A.Theorganizationofthefinancialholdingfirm
a. Organization chart
Base date: March 1, 2015
Shareholders'Meeting
Remuneration Committee
Supervisor
Secretariat Division Audit Division
Policy Committee
Corporate Social Responsibility Committee
Asset & Liability Management Committee
CRM Committee
Investor Relationship Committee
Risk Management Committee
Staff Conduct Review and Staff Performance Appraisal Committee
Board ofDirectors
Chairman
President
WholesaleBankingGroup
RetailBankingGroup
ChiefInformation
Office
ChiefAccounting
Office
ChiefFinanceOffice
ChiefStrategyOffice
ChiefEconomistOffice
Chief RiskOffice
CorporateCommunications
Department
CorporatePlanningDivision
Processing& ServiceDivision
AdministrationDivision
HumanResources
Division
Legal & Compliance
Division
14
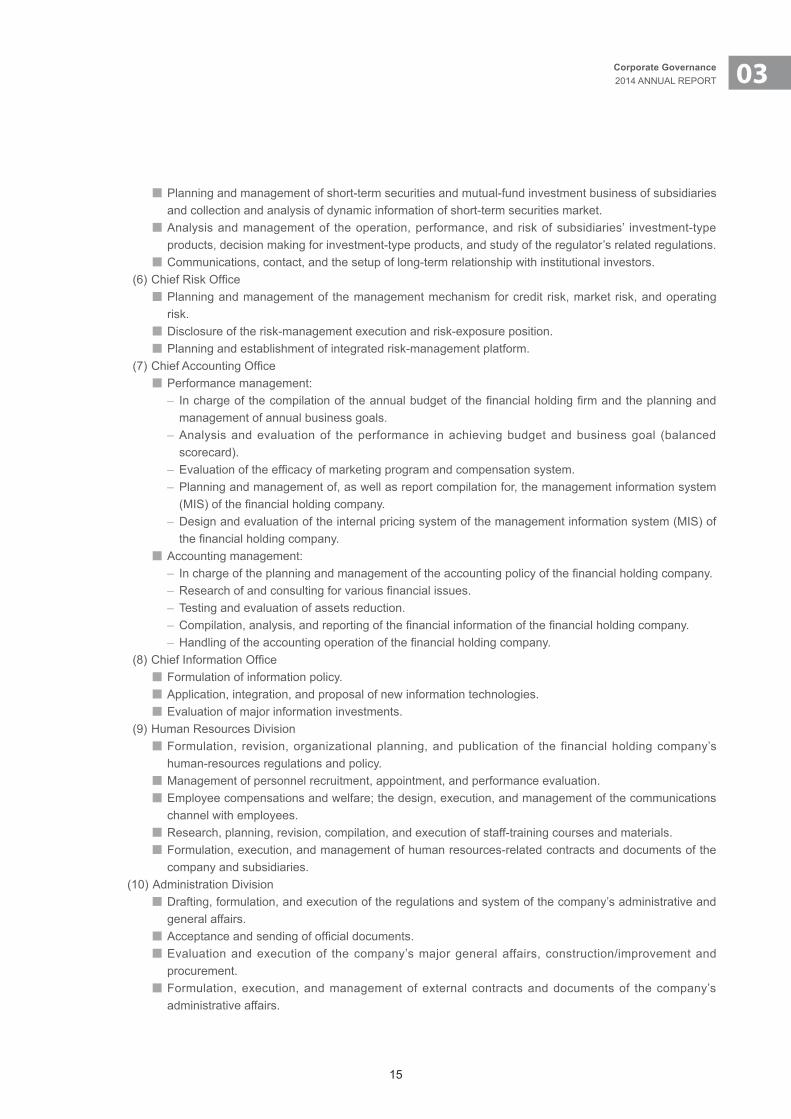
1. Responsibilities of major units
(1)ChiefEconomistOffice ■ Provide analytical information on regional economies, industrial trend, as well as prospects of general global economy, exchange rate, interest rate, and the world’s major stock markets and industries to Taishin Financial Holding Group, including the company and its subsidiaries.
■ In response to the need of the board of directors and managerial units of the company and subsidiaries for decision making and business need, provide expert analysis, evaluation, and opinions, to assist with risk assessment and business promotion, in addition tracking the status and prospects of companies with public share offering in Taiwan and proposing industrial assessment and analytical report.
(2) Wholesale Banking Group ■ Research, marketing strategy, and management of corporate-banking products and system for the company and subsidiaries.
■ Preparation, planning, and business management of the overseas branches and invested companies of the company and subsidiaries.
■ Management of corporate-banking assets and credit extension of the company and subsidiaries. ■ Assistance for subsidiaries in providing financial consulting service for corporate syndicated loan, merger, and restructuring.
■ Assistance for subsidiaries in providing service for share listing on the centralized market, over-the-counter market, and emerging enterprise market.
■ Planning for the development and marketing of capital-market products. ■ R&D for forex, field-yield products (bills and bonds) and derivatives, assistance for subsidiaries to manage sales and tractions related corporate banking.
■ Formulation, execution, and management of external contracts and documents related corporate banking business of the company and subsidiaries.
(3) Retail Banking Group ■ Assist subsidiaries in planning the marketing strategy of credit card, cash card, and customers of personal wealth-management and fortune management branches (including investment and consumer banking products).
■ Assist subsidiaries in product R&D and management of overdue debt collection. ■ Assist subsidiaries in the planning and execution of consumer-banking businesses, such as CRM (customer relationship management) marketing and phone/database marketing.
■ Formulation, execution, and management of external contracts and documents for consumer-banking business of the company and subsidiaries.
(4)ChiefStrategyOffice ■ In charge of formulating medium- and long-term development strategies for the financial holding company and subsidiaries.
■ Track the execution of the existing strategies of the company and subsidiaries and analyze, assess, and evaluate its performance.
(5)ChiefFinanceOffice ■ Planning and management of the bank’s liquidity risk and bankbook interest risk,as well as supervi-sion and evaluation of subsidiaries.
■ Planning and management of the structural deployment of assets and liabilities and the deployment of fund utilization。
■ Planning, implementation, and management of asset-based securities business,as well as supervision and evaluation of subsidiaries.
■ Implementation of credit ranking,and assistance for subsidiaries to undertake credit rating. ■ Planning, execution, and management of the company’s non-strategic long-term investment; execution and management of strategic long-term investment; and supervision and evaluation of subsidiaries.
15
03Corporate Governance2014 ANNUAL REPORT
■ Planning and management of short-term securities and mutual-fund investment business of subsidiaries and collection and analysis of dynamic information of short-term securities market.
■ Analysis and management of the operation, performance, and risk of subsidiaries’ investment-type products, decision making for investment-type products, and study of the regulator’s related regulations.
■ Communications, contact, and the setup of long-term relationship with institutional investors.(6)ChiefRiskOffice
■ Planning and management of the management mechanism for credit risk, market risk, and operating risk.
■ Disclosure of the risk-management execution and risk-exposure position. ■ Planning and establishment of integrated risk-management platform.
(7)ChiefAccountingOffice ■ Performance management:
– Inchargeofthecompilationoftheannualbudgetofthefinancialholdingfirmandtheplanningandmanagement of annual business goals.
– Analysis and evaluation of the performance in achieving budget and business goal (balanced scorecard).
– Evaluationoftheefficacyofmarketingprogramandcompensationsystem. – Planning and management of, as well as report compilation for, the management information system (MIS)ofthefinancialholdingcompany.
– Design and evaluation of the internal pricing system of the management information system (MIS) of thefinancialholdingcompany.
■ Accounting management: – Inchargeoftheplanningandmanagementoftheaccountingpolicyofthefinancialholdingcompany. – Researchofandconsultingforvariousfinancialissues. – Testing and evaluation of assets reduction. – Compilation,analysis,andreportingofthefinancialinformationofthefinancialholdingcompany. – Handlingoftheaccountingoperationofthefinancialholdingcompany.
(8)ChiefInformationOffice ■ Formulation of information policy. ■ Application, integration, and proposal of new information technologies. ■ Evaluation of major information investments.
(9) Human Resources Division ■ Formulation, revision, organizational planning, and publication of the financial holding company’s human-resources regulations and policy.
■ Management of personnel recruitment, appointment, and performance evaluation. ■ Employee compensations and welfare; the design, execution, and management of the communications channel with employees.
■ Research, planning, revision, compilation, and execution of staff-training courses and materials. ■ Formulation, execution, and management of human resources-related contracts and documents of the company and subsidiaries.
(10) Administration Division ■ Drafting, formulation, and execution of the regulations and system of the company’s administrative and general affairs.
■ Acceptanceandsendingofofficialdocuments. ■ Evaluation and execution of the company’s major general affairs, construction/improvement and procurement.
■ Formulation, execution, and management of external contracts and documents of the company’s administrative affairs.
16
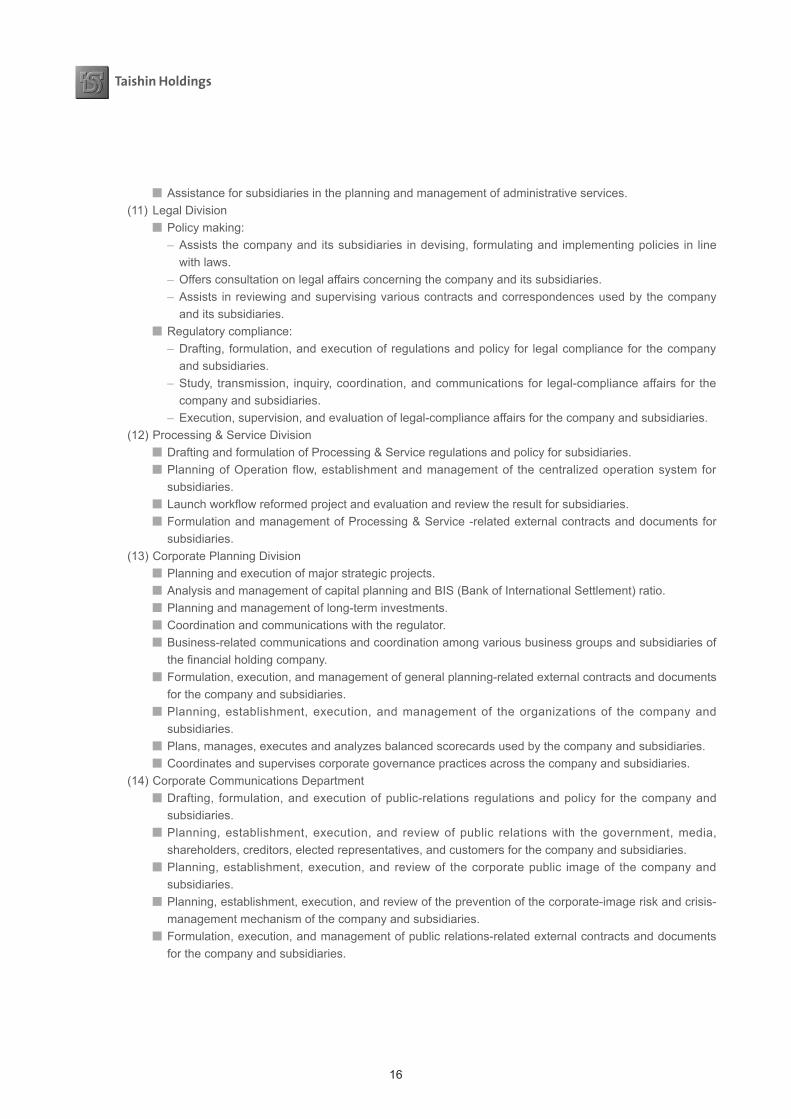
■ Assistance for subsidiaries in the planning and management of administrative services. (11) Legal Division
■ Policy making: – Assists the company and its subsidiaries in devising, formulating and implementing policies in line with laws.
– Offers consultation on legal affairs concerning the company and its subsidiaries. – Assists in reviewing and supervising various contracts and correspondences used by the company and its subsidiaries.
■ Regulatory compliance: – Drafting, formulation, and execution of regulations and policy for legal compliance for the company and subsidiaries.
– Study, transmission, inquiry, coordination, and communications for legal-compliance affairs for the company and subsidiaries.
– Execution, supervision, and evaluation of legal-compliance affairs for the company and subsidiaries. (12) Processing & Service Division
■ Drafting and formulation of Processing & Service regulations and policy for subsidiaries. ■ Planning of Operation flow, establishment and management of the centralized operation system for subsidiaries.
■ Launchworkflowreformedprojectandevaluationandreviewtheresultforsubsidiaries. ■ Formulation and management of Processing & Service -related external contracts and documents for subsidiaries.
(13) Corporate Planning Division ■ Planning and execution of major strategic projects. ■ Analysis and management of capital planning and BIS (Bank of International Settlement) ratio. ■ Planning and management of long-term investments. ■ Coordination and communications with the regulator. ■ Business-related communications and coordination among various business groups and subsidiaries of thefinancialholdingcompany.
■ Formulation, execution, and management of general planning-related external contracts and documents for the company and subsidiaries.
■ Planning, establishment, execution, and management of the organizations of the company and subsidiaries.
■ Plans, manages, executes and analyzes balanced scorecards used by the company and subsidiaries. ■ Coordinates and supervises corporate governance practices across the company and subsidiaries.
(14) Corporate Communications Department ■ Drafting, formulation, and execution of public-relations regulations and policy for the company and subsidiaries.
■ Planning, establishment, execution, and review of public relations with the government, media, shareholders, creditors, elected representatives, and customers for the company and subsidiaries.
■ Planning, establishment, execution, and review of the corporate public image of the company and subsidiaries.
■ Planning, establishment, execution, and review of the prevention of the corporate-image risk and crisis-management mechanism of the company and subsidiaries.
■ Formulation, execution, and management of public relations-related external contracts and documents for the company and subsidiaries.
17
03Corporate Governance2014 ANNUAL REPORT
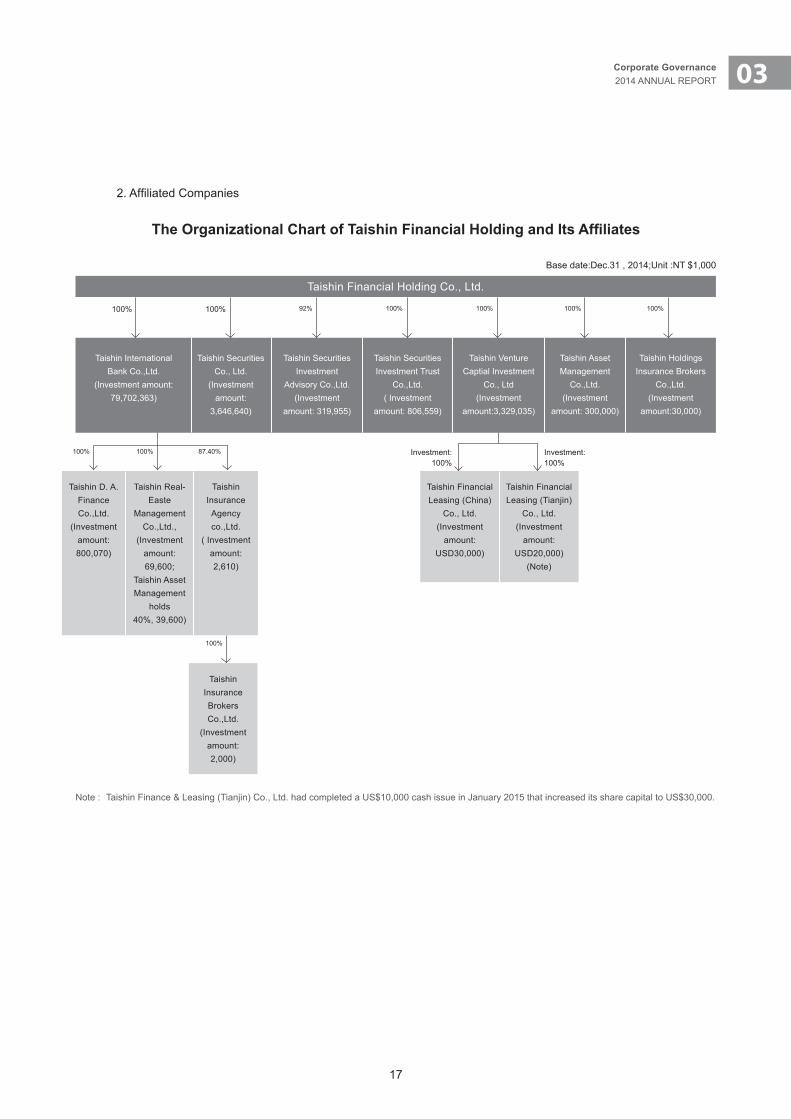
Taishin D. A.Finance Co.,Ltd.
(Investmentamount:800,070)
Taishin Real-Easte
ManagementCo.,Ltd.,
(Investmentamount: 69,600;
Taishin AssetManagement
holds40%, 39,600)
TaishinInsuranceAgency co.,Ltd.
( Investmentamount: 2,610)
Taishin FinancialLeasing (China)
Co., Ltd.(Investment
amount:USD30,000)
Taishin FinancialLeasing (Tianjin)
Co., Ltd.(Investment
amount:USD20,000)
(Note)
Taishin InsuranceBrokers Co.,Ltd.
(Investmentamount: 2,000)
100% 100% 87.40% Investment:100%
Investment:100%
100%
TheOrganizationalChartofTaishinFinancialHoldingandItsAffiliates
Base date:Dec.31 , 2014;Unit :NT $1,000
Taishin Financial Holding Co., Ltd.
Taishin International Bank Co.,Ltd.
(Investment amount: 79,702,363)
Taishin SecuritiesCo., Ltd.
(Investmentamount:
3,646,640)
Taishin SecuritiesInvestment
Advisory Co.,Ltd.(Investment
amount: 319,955)
Taishin SecuritiesInvestment Trust
Co.,Ltd.( Investment
amount: 806,559)
Taishin VentureCaptial Investment
Co., Ltd(Investment
amount:3,329,035)
Taishin AssetManagement
Co.,Ltd.(Investment
amount: 300,000)
Taishin HoldingsInsurance Brokers
Co.,Ltd.(Investment
amount:30,000)
100%100% 92% 100% 100% 100% 100%
Note : Taishin Finance & Leasing (Tianjin) Co., Ltd. had completed a US$10,000 cash issue in January 2015 that increased its share capital to US$30,000.
2.AffiliatedCompanies
18
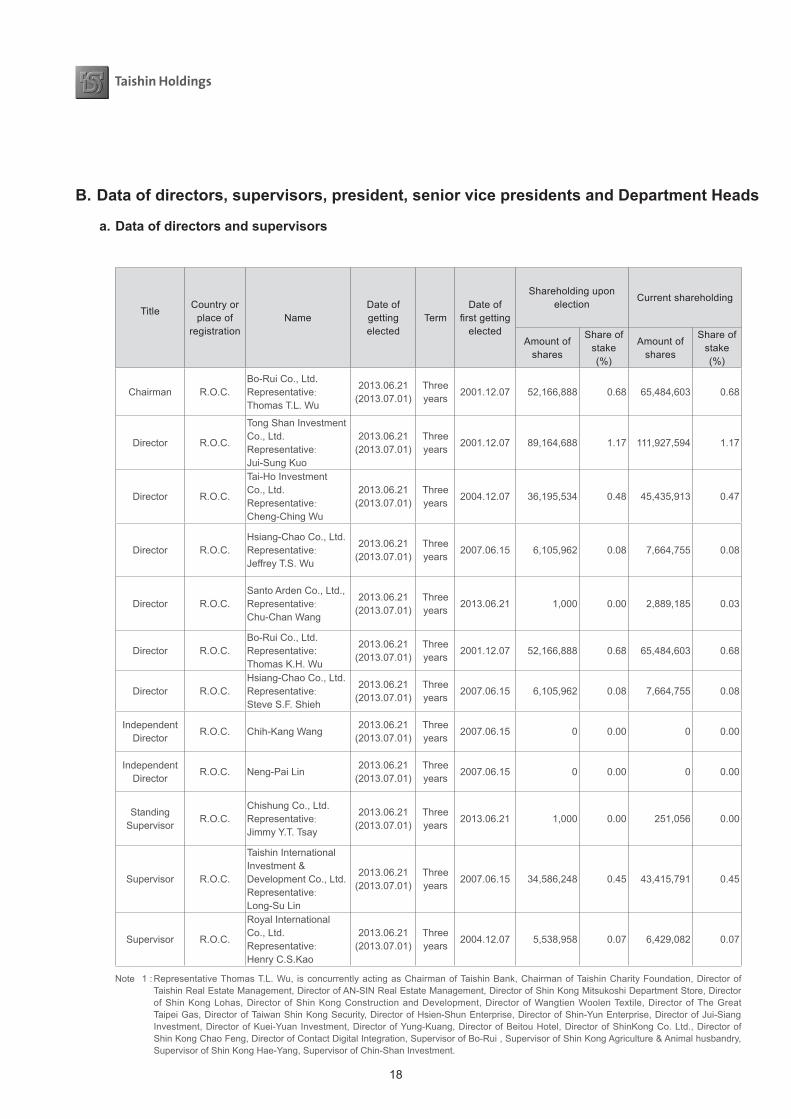
B. Data of directors, supervisors, president, senior vice presidents and Department Heads
a. Data of directors and supervisors
Base date: Feb. 28, 2015
TitleCountry or
place ofregistration
Name Date of gettingelected
TermDate of
firstgettingelected
Shareholding upon election
Current shareholding
Stake of spouse and offspring before age of
majority
Shareholding in the name of
others Education and working experience
Current jobs with the bank and other
companies
Spouse or relatives within second-degree kinship who serve managerial posts or
seats of board directors/ supervisors of the company
Amount of shares
Share of stake(%)
Amount of shares
Share of stake(%)
Amount of
shares
Share of
stake
Amount of
shares
Share of stake
(%)Title Name Relationship
Chairman R.O.C.Bo-Rui Co., Ltd.Representative:
Thomas T.L. Wu
2013.06.21(2013.07.01)
Three years
2001.12.07 52,166,888 0.68 65,484,603 0.68 0 0.00 0 0.00Director, First Bank, Supervisor, Hua Nan Bank MBA, University of California, LA
Note 1DirectorSupervisor
Jui-Sung Kuo Long-Su Lin
Brother-in-law Brother-in-law
Director R.O.C.
Tong Shan Investment Co., Ltd.Representative:
Jui-Sung Kuo
2013.06.21(2013.07.01)
Three years
2001.12.07 89,164,688 1.17 111,927,594 1.17 0 0.00 0 0.00
Director, International Bank of Taipei,Professor, Department of Information Science, Business School, Soochow University,Ph.D. in Physics, New Hampshire University
Note 2ChairmanSupervisor
Thomas T.L. WuLong-Su Lin
Brother-in-lawBrother-in-law
Director R.O.C.
Tai-Ho Investment Co., Ltd.Representative:
Cheng-Ching Wu
2013.06.21(2013.07.01)
Three years
2004.12.07 36,195,534 0.48 45,435,913 0.47 0 0.00 0 0.00Manging Director of Chang Hwa Commercial Bank, Chairman of TASCO,Chemical Ph.D. in Engineering, Tokyo University
Note 3 None None None
Director R.O.C.Hsiang-Chao Co., Ltd.Representative:
Jeffrey T.S. Wu
2013.06.21(2013.07.01)
Three years
2007.06.15 6,105,962 0.08 7,664,755 0.08 0 0.00 0 0.00
Chairman of Taishin Asset Management, Supervisor of TECO Image System Co., Ltd.,Department of Accounting and Statistics, National Chengchi University
Note 4 None None None
Director R.O.C.Santo Arden Co., Ltd.,Representative:
Chu-Chan Wang
2013.06.21(2013.07.01)
Three years
2013.06.21 1,000 0.00 2,889,185 0.03 0 0.00 0 0.00
Standing Supervisor, Taishin Financial Holdings, Taishin Bank, Director and Supervisor of The Great Taipei Gas Co., Pharmaceutical department, Kaohsiung Medical College
Note 5 None None None
Director R.O.C.Bo-Rui Co., Ltd. Representative: Thomas K.H. Wu
2013.06.21(2013.07.01)
Three years
2001.12.07 52,166,888 0.68 65,484,603 0.68 0 0.00 0 0.00President, Taiwan Stock Exchange CorporationChairman, Chairman of Taishin Securities,MBA, National ChengChi University
Note 6 None None None
Director R.O.C.Hsiang-Chao Co., Ltd.Representative:
Steve S.F. Shieh
2013.06.21(2013.07.01)
Three years
2007.06.15 6,105,962 0.08 7,664,755 0.08 0 0.00 0 0.00President, Taishin Financial Holdings, Taishin BankAccounting Department, National Cheng Kung University
Note 7 None None None
Independent Director
R.O.C. Chih-Kang Wang2013.06.21
(2013.07.01)Three years
2007.06.15 0 0.00 0 0.00 0 0.00 0 0.00Minister of Ministry of Economic Affairs, Chairman of Taiwan External Trade Development Councit,Ph.D. in Marketing, Texas A&M University
Note 8 None None None
Independent Director
R.O.C. Neng-Pai Lin2013.06.21
(2013.07.01)Three years
2007.06.15 0 0.00 0 0.00 0 0.00 0 0.00Chairman, Taiwan Power Co. Dean, College of Management at National Taiwan UniversityPh.D. in Business, Ohio State University
Note 9 None None None
Standing Supervisor
R.O.C.Chishung Co., Ltd.Representative:
Jimmy Y.T. Tsay
2013.06.21(2013.07.01)
Three years
2013.06.21 1,000 0.00 251,056 0.00 0 0.00 0 0.00
Standing Director, Bank of Taiwan Director, Graduate School of Accounting, National Taiwan University, Ph.D. in Business Management and Commerce, U. of Maryland
Note 10 None None None
Supervisor R.O.C.
Taishin International Investment & Development Co., Ltd.Representative:
Long-Su Lin
2013.06.21(2013.07.01)
Three years
2007.06.15 34,586,248 0.45 43,415,791 0.45 0 0.00 0 0.00Director, Taishin Financial Holding, Taishin BankPh.D. in Chemistry, Virginia State University
Note 11ChairmanDirector
Thomas T.L. WuJui-Sung Kuo
Brother-in-law Brother-in-law
Supervisor R.O.C.
Royal International Co., Ltd.Representative:
Henry C.S.Kao
2013.06.21(2013.07.01)
Three years
2004.12.07 5,538,958 0.07 6,429,082 0.07 0 0.00 0 0.00
Standing Supervisor of Chang Hwa Commercial Bank, Chairman of I-Mei Food Co., Ltd.University of San Francisco, USA, Master of Public Administration
Note12 None None None
Note 1 : Representative Thomas T.L. Wu, is concurrently acting as Chairman of Taishin Bank, Chairman of Taishin Charity Foundation, Director of Taishin Real Estate Management, Director of AN-SIN Real Estate Management, Director of Shin Kong Mitsukoshi Department Store, Director of Shin Kong Lohas, Director of Shin Kong Construction and Development, Director of Wangtien Woolen Textile, Director of The Great Taipei Gas, Director of Taiwan Shin Kong Security, Director of Hsien-Shun Enterprise, Director of Shin-Yun Enterprise, Director of Jui-Siang Investment, Director of Kuei-Yuan Investment, Director of Yung-Kuang, Director of Beitou Hotel, Director of ShinKong Co. Ltd., Director of Shin Kong Chao Feng, Director of Contact Digital Integration, Supervisor of Bo-Rui , Supervisor of Shin Kong Agriculture & Animal husbandry, Supervisor of Shin Kong Hae-Yang, Supervisor of Chin-Shan Investment.

19
03Corporate Governance2014 ANNUAL REPORT
B. Data of directors, supervisors, president, senior vice presidents and Department Heads
a. Data of directors and supervisors
Base date: Feb. 28, 2015
TitleCountry or
place ofregistration
Name Date of gettingelected
TermDate of
firstgettingelected
Shareholding upon election
Current shareholding
Stake of spouse and offspring before age of
majority
Shareholding in the name of
others Education and working experience
Current jobs with the bank and other
companies
Spouse or relatives within second-degree kinship who serve managerial posts or
seats of board directors/ supervisors of the company
Amount of shares
Share of stake(%)
Amount of shares
Share of stake(%)
Amount of
shares
Share of
stake
Amount of
shares
Share of stake
(%)Title Name Relationship
Chairman R.O.C.Bo-Rui Co., Ltd.Representative:
Thomas T.L. Wu
2013.06.21(2013.07.01)
Three years
2001.12.07 52,166,888 0.68 65,484,603 0.68 0 0.00 0 0.00Director, First Bank, Supervisor, Hua Nan Bank MBA, University of California, LA
Note 1DirectorSupervisor
Jui-Sung Kuo Long-Su Lin
Brother-in-law Brother-in-law
Director R.O.C.
Tong Shan Investment Co., Ltd.Representative:
Jui-Sung Kuo
2013.06.21(2013.07.01)
Three years
2001.12.07 89,164,688 1.17 111,927,594 1.17 0 0.00 0 0.00
Director, International Bank of Taipei,Professor, Department of Information Science, Business School, Soochow University,Ph.D. in Physics, New Hampshire University
Note 2ChairmanSupervisor
Thomas T.L. WuLong-Su Lin
Brother-in-lawBrother-in-law
Director R.O.C.
Tai-Ho Investment Co., Ltd.Representative:
Cheng-Ching Wu
2013.06.21(2013.07.01)
Three years
2004.12.07 36,195,534 0.48 45,435,913 0.47 0 0.00 0 0.00Manging Director of Chang Hwa Commercial Bank, Chairman of TASCO,Chemical Ph.D. in Engineering, Tokyo University
Note 3 None None None
Director R.O.C.Hsiang-Chao Co., Ltd.Representative:
Jeffrey T.S. Wu
2013.06.21(2013.07.01)
Three years
2007.06.15 6,105,962 0.08 7,664,755 0.08 0 0.00 0 0.00
Chairman of Taishin Asset Management, Supervisor of TECO Image System Co., Ltd.,Department of Accounting and Statistics, National Chengchi University
Note 4 None None None
Director R.O.C.Santo Arden Co., Ltd.,Representative:
Chu-Chan Wang
2013.06.21(2013.07.01)
Three years
2013.06.21 1,000 0.00 2,889,185 0.03 0 0.00 0 0.00
Standing Supervisor, Taishin Financial Holdings, Taishin Bank, Director and Supervisor of The Great Taipei Gas Co., Pharmaceutical department, Kaohsiung Medical College
Note 5 None None None
Director R.O.C.Bo-Rui Co., Ltd. Representative: Thomas K.H. Wu
2013.06.21(2013.07.01)
Three years
2001.12.07 52,166,888 0.68 65,484,603 0.68 0 0.00 0 0.00President, Taiwan Stock Exchange CorporationChairman, Chairman of Taishin Securities,MBA, National ChengChi University
Note 6 None None None
Director R.O.C.Hsiang-Chao Co., Ltd.Representative:
Steve S.F. Shieh
2013.06.21(2013.07.01)
Three years
2007.06.15 6,105,962 0.08 7,664,755 0.08 0 0.00 0 0.00President, Taishin Financial Holdings, Taishin BankAccounting Department, National Cheng Kung University
Note 7 None None None
Independent Director
R.O.C. Chih-Kang Wang2013.06.21
(2013.07.01)Three years
2007.06.15 0 0.00 0 0.00 0 0.00 0 0.00Minister of Ministry of Economic Affairs, Chairman of Taiwan External Trade Development Councit,Ph.D. in Marketing, Texas A&M University
Note 8 None None None
Independent Director
R.O.C. Neng-Pai Lin2013.06.21
(2013.07.01)Three years
2007.06.15 0 0.00 0 0.00 0 0.00 0 0.00Chairman, Taiwan Power Co. Dean, College of Management at National Taiwan UniversityPh.D. in Business, Ohio State University
Note 9 None None None
Standing Supervisor
R.O.C.Chishung Co., Ltd.Representative:
Jimmy Y.T. Tsay
2013.06.21(2013.07.01)
Three years
2013.06.21 1,000 0.00 251,056 0.00 0 0.00 0 0.00
Standing Director, Bank of Taiwan Director, Graduate School of Accounting, National Taiwan University, Ph.D. in Business Management and Commerce, U. of Maryland
Note 10 None None None
Supervisor R.O.C.
Taishin International Investment & Development Co., Ltd.Representative:
Long-Su Lin
2013.06.21(2013.07.01)
Three years
2007.06.15 34,586,248 0.45 43,415,791 0.45 0 0.00 0 0.00Director, Taishin Financial Holding, Taishin BankPh.D. in Chemistry, Virginia State University
Note 11ChairmanDirector
Thomas T.L. WuJui-Sung Kuo
Brother-in-law Brother-in-law
Supervisor R.O.C.
Royal International Co., Ltd.Representative:
Henry C.S.Kao
2013.06.21(2013.07.01)
Three years
2004.12.07 5,538,958 0.07 6,429,082 0.07 0 0.00 0 0.00
Standing Supervisor of Chang Hwa Commercial Bank, Chairman of I-Mei Food Co., Ltd.University of San Francisco, USA, Master of Public Administration
Note12 None None None
Note 2 : Representative Jui-Sung Kuo, is concurrently acting as Chairman of Jui-Fang Co., Director of Taishin Bank, Director of An-Long Enterprise, Director of TECO Image Systems, Director of Cheng Xin Development, Director of Century Development, Director of Shin-Hai Gas Co,Ltd., Director of Xing An Enterprise, Supervisor of Taiwan Shin Kong Security, Supervisor of SerComm, Supervisor of Chun-Hsiang Enterprise Consultants.
Note 3 : Representative Cheng-Ching Wu, is concurrently acting as Chairman of TASCO Chemical, Chairman of EXCEL Chemical, Chairman of Ming-Xing Chemical, Chairman of Tuntex Petrochemical Inc., Chairman of SAFEWAY GAS Co., Chairman of Ho-Shin Co., Chairman of Chang-Fong Transportation, Chairman of TNS Logistics International Corp, Director of Chang Hwa Commrecial Bank, Director of China Investment & Development, Directro of CIDC Consultants, Directro of Shun-Li-Tong Transportation.
20
Note 4 : Representative Jeffrey T.S. Wu, is concurrently acting as Chairman of Taishin Venture capital, Chairman of Taishin Asset Management Co., Ltd., Chairman of Taishin Real-Estate Management Co., Ltd., Director of Taishin International Bank Co., Ltd., Director of An-Tung Asset Development Management Co., Ltd, Director of Taiwan Hotforg Co., Ltd, Supervisor of Taishin Securities Co., Ltd., Supervisor of Taishin Insurance Agency Co., Ltd., Supervisor of Taishin Insurance Brokers Co., Ltd., Supervisor of Tung-Yu Technology Co., Ltd.
Note 5 : Representative Chu-Chan Wang, is concurrently acting as Chairman of Pan City Co., Chairman of Hsien-Shun Enterprise, Chairman of Santo Arden Co., Director of Taishin International Bank, Supervisor of Tai-Wa Co.and The Great Taipei Gas Co.
Note 6 : Representative Thomas K.H. Wu, is concurrently acting as Chairman of Taishin Investment Advisory Co., Ltd.Note 7 : Representative Steve S.F. Shieh, is concurrently acting as Director of Taishin Holdings Insurance Brokers, Director of Taishin Insurance Agency,
Director of Taishin D.A Finance Leasing Co., Director of PayEasy Travel Service.Note 8 : Chih-Kang Wang, is concurrently acting as Chairman of CTBC Investment, Chairman of The Shiner Education Foundation, Independent Director
of Taishin Bank, Standing/Independent Director of Nan Ya Plastics, Independent Director of Formosa Sumco Technology.Note 9 : Neng-Pai Lin, is concurrently acting as Independent Director of Taishin Bank, Independent Director of Darfon Electronics, Director of TECO Image
Systems. Note 10 : Representative Jimmy Y.T. Tsay is concurrently acting as Independent Director of E-Ton Solar Technology Corp., Independent Director of OBI
Pharma, Inc., Standing supervisor of Taishin Bank, Supervisor of Shin Zu Shing Co,Ltd., Supervisor of Coremax Corporation. Note 11 : Representative Long-Su Lin, is concurrently acting as Chairman of MiTAC Construction and Development, Chairman of Chun-Ying Interior Design,
Director of Nica-Orient Development, Director of Virgin Enterprise, Director of Gyu-Kaku, Director of International Advanced Music, Director of Music Duck, Chairman of Ennead Inc., Chairman of Ennead Leasing, Supervisor of Taishin Bank.
Note 12 : Representative Henry C.S.Kao is concurrently the Chairman of Royal International Co., Ltd., Chairman of I-Mei Foods, Chairman of I-Mei Co., Ltd., Chairman of Fu May Co., Ltd., Chairman of Chi-tun Inc., Chairman of Golden Saddle Machinery, Chairman of Xiong May Food, Chairman of I-Mei Organic Food, Chairman of An-Sin Real Estate Management, Chairman of Motif Management, Chairman of Tai-Yue Technical Advising, Chairman of Ray Ten Asset Management, Chairman of Devel Dessert, Chairman of Mu-Kong Biotech, Chairman of San Ho May Enterprise, Chairman of Chi Yue Investment, Chairman of Yu Ching Investment, Director of Kun Chi Venture Capital, Director of Pizzavest, Director of An-Sin Real Estate Management, Supervisor of Formosa International Hotel, Supervisor of Van Den Invest, Supervisor of I-Mei Dairy, and Supervisor of Shang Ho Hsing Enterprise.
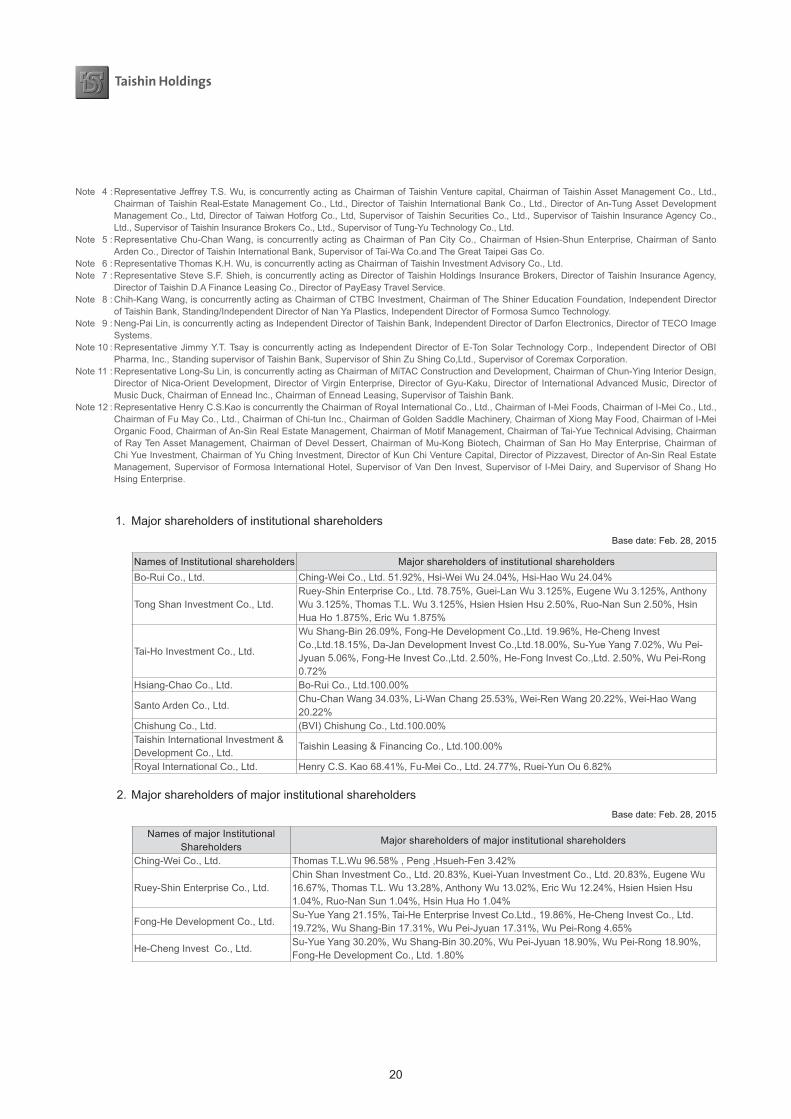
1. Major shareholders of institutional shareholders Base date: Feb. 28, 2015
Names of Institutional shareholders Major shareholders of institutional shareholdersBo-Rui Co., Ltd. Ching-Wei Co., Ltd. 51.92%, Hsi-Wei Wu 24.04%, Hsi-Hao Wu 24.04%
Tong Shan Investment Co., Ltd.Ruey-Shin Enterprise Co., Ltd. 78.75%, Guei-Lan Wu 3.125%, Eugene Wu 3.125%, Anthony Wu 3.125%, Thomas T.L. Wu 3.125%, Hsien Hsien Hsu 2.50%, Ruo-Nan Sun 2.50%, Hsin Hua Ho 1.875%, Eric Wu 1.875%
Tai-Ho Investment Co., Ltd.
Wu Shang-Bin 26.09%, Fong-He Development Co.,Ltd. 19.96%, He-Cheng Invest Co.,Ltd.18.15%, Da-Jan Development Invest Co.,Ltd.18.00%, Su-Yue Yang 7.02%, Wu Pei-Jyuan 5.06%, Fong-He Invest Co.,Ltd. 2.50%, He-Fong Invest Co.,Ltd. 2.50%, Wu Pei-Rong 0.72%
Hsiang-Chao Co., Ltd. Bo-Rui Co., Ltd.100.00%
Santo Arden Co., Ltd.Chu-Chan Wang 34.03%, Li-Wan Chang 25.53%, Wei-Ren Wang 20.22%, Wei-Hao Wang 20.22%
Chishung Co., Ltd. (BVI) Chishung Co., Ltd.100.00%Taishin International Investment & Development Co., Ltd.
Taishin Leasing & Financing Co., Ltd.100.00%
Royal International Co., Ltd. Henry C.S. Kao 68.41%, Fu-Mei Co., Ltd. 24.77%, Ruei-Yun Ou 6.82%
2. Major shareholders of major institutional shareholdersBase date: Feb. 28, 2015
Names of major Institutional Shareholders
Major shareholders of major institutional shareholders
Ching-Wei Co., Ltd. Thomas T.L.Wu 96.58% , Peng ,Hsueh-Fen 3.42%
Ruey-Shin Enterprise Co., Ltd.Chin Shan Investment Co., Ltd. 20.83%, Kuei-Yuan Investment Co., Ltd. 20.83%, Eugene Wu 16.67%, Thomas T.L. Wu 13.28%, Anthony Wu 13.02%, Eric Wu 12.24%, Hsien Hsien Hsu 1.04%, Ruo-Nan Sun 1.04%, Hsin Hua Ho 1.04%
Fong-He Development Co., Ltd.Su-Yue Yang 21.15%, Tai-He Enterprise Invest Co.Ltd., 19.86%, He-Cheng Invest Co., Ltd. 19.72%, Wu Shang-Bin 17.31%, Wu Pei-Jyuan 17.31%, Wu Pei-Rong 4.65%
He-Cheng Invest Co., Ltd.Su-Yue Yang 30.20%, Wu Shang-Bin 30.20%, Wu Pei-Jyuan 18.90%, Wu Pei-Rong 18.90%, Fong-He Development Co., Ltd. 1.80%
21
03Corporate Governance2014 ANNUAL REPORT
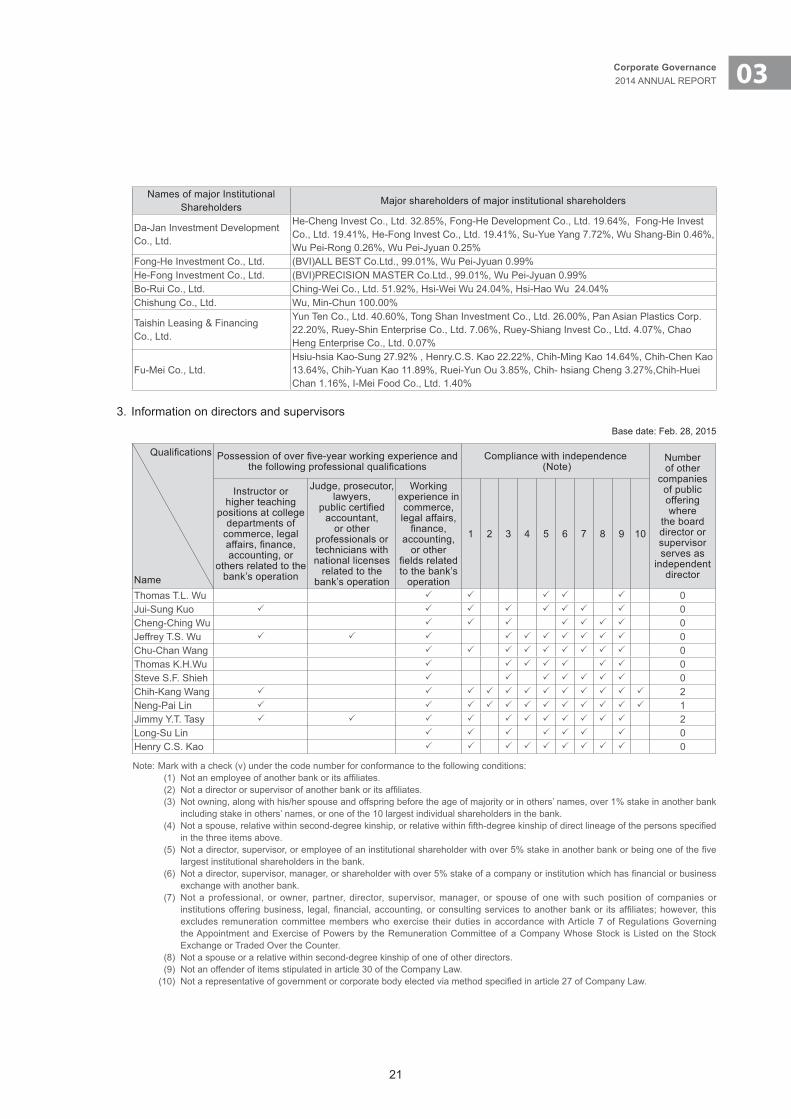
Names of major Institutional Shareholders
Major shareholders of major institutional shareholders
Da-Jan Investment Development Co., Ltd.
He-Cheng Invest Co., Ltd. 32.85%, Fong-He Development Co., Ltd. 19.64%, Fong-He Invest Co., Ltd. 19.41%, He-Fong Invest Co., Ltd. 19.41%, Su-Yue Yang 7.72%, Wu Shang-Bin 0.46%, Wu Pei-Rong 0.26%, Wu Pei-Jyuan 0.25%
Fong-He Investment Co., Ltd. (BVI)ALL BEST Co.Ltd., 99.01%, Wu Pei-Jyuan 0.99%He-Fong Investment Co., Ltd. (BVI)PRECISION MASTER Co.Ltd., 99.01%, Wu Pei-Jyuan 0.99%Bo-Rui Co., Ltd. Ching-Wei Co., Ltd. 51.92%, Hsi-Wei Wu 24.04%, Hsi-Hao Wu 24.04%Chishung Co., Ltd. Wu, Min-Chun 100.00%
Taishin Leasing & Financing Co., Ltd.
Yun Ten Co., Ltd. 40.60%, Tong Shan Investment Co., Ltd. 26.00%, Pan Asian Plastics Corp. 22.20%, Ruey-Shin Enterprise Co., Ltd. 7.06%, Ruey-Shiang Invest Co., Ltd. 4.07%, Chao Heng Enterprise Co., Ltd. 0.07%
Fu-Mei Co., Ltd.Hsiu-hsia Kao-Sung 27.92% , Henry.C.S. Kao 22.22%, Chih-Ming Kao 14.64%, Chih-Chen Kao 13.64%, Chih-Yuan Kao 11.89%, Ruei-Yun Ou 3.85%, Chih- hsiang Cheng 3.27%,Chih-Huei Chan 1.16%, I-Mei Food Co., Ltd. 1.40%
3. Information on directors and supervisorsBase date: Feb. 28, 2015
Qualifications
Name
Possessionofoverfive-yearworkingexperienceandthefollowingprofessionalqualifications
Compliance with independence (Note)
Number of other
companies of public offering where
the board director or supervisor serves as
independent director
Instructor or higher teaching
positions at college departments of
commerce, legal affairs,finance,accounting, or
others related to the bank’s operation
Judge, prosecutor, lawyers,
publiccertifiedaccountant,
or other professionals or technicians with national licenses
related to the bank’s operation
Working experience in commerce, legal affairs, finance,
accounting, or other
fieldsrelatedto the bank’s
operation
1 2 3 4 5 6 7 8 9 10
Thomas T.L. Wu P P P P P 0Jui-Sung Kuo P P P P P P P P 0Cheng-Ching Wu P P P P P P P 0Jeffrey T.S. Wu P P P P P P P P P P 0Chu-Chan Wang P P P P P P P P P 0Thomas K.H.Wu P P P P P P P 0Steve S.F. Shieh P P P P P P P 0Chih-Kang Wang P P P P P P P P P P P P 2Neng-Pai Lin P P P P P P P P P P P P 1Jimmy Y.T. Tasy P P P P P P P P P P P 2Long-Su Lin P P P P P P P 0Henry C.S. Kao P P P P P P P P P 0
Note: Mark with a check (v) under the code number for conformance to the following conditions: (1) Notanemployeeofanotherbankoritsaffiliates. (2) Notadirectororsupervisorofanotherbankoritsaffiliates. (3) Not owning, along with his/her spouse and offspring before the age of majority or in others’ names, over 1% stake in another bank
including stake in others’ names, or one of the 10 largest individual shareholders in the bank. (4) Notaspouse,relativewithinsecond-degreekinship,orrelativewithinfifth-degreekinshipofdirectlineageofthepersonsspecified
in the three items above. (5) Notadirector,supervisor,oremployeeofaninstitutionalshareholderwithover5%stakeinanotherbankorbeingoneofthefive
largest institutional shareholders in the bank. (6) Notadirector,supervisor,manager,orshareholderwithover5%stakeofacompanyorinstitutionwhichhasfinancialorbusiness
exchange with another bank. (7) Not a professional, or owner, partner, director, supervisor, manager, or spouse of one with such position of companies or
institutionsofferingbusiness, legal,financial,accounting,orconsultingservices toanotherbankor itsaffiliates;however, thisexcludes remuneration committee members who exercise their duties in accordance with Article 7 of Regulations Governing the Appointment and Exercise of Powers by the Remuneration Committee of a Company Whose Stock is Listed on the Stock Exchange or Traded Over the Counter.
(8) Not a spouse or a relative within second-degree kinship of one of other directors. (9) Not an offender of items stipulated in article 30 of the Company Law. (10) Notarepresentativeofgovernmentorcorporatebodyelectedviamethodspecifiedinarticle27ofCompanyLaw.
22
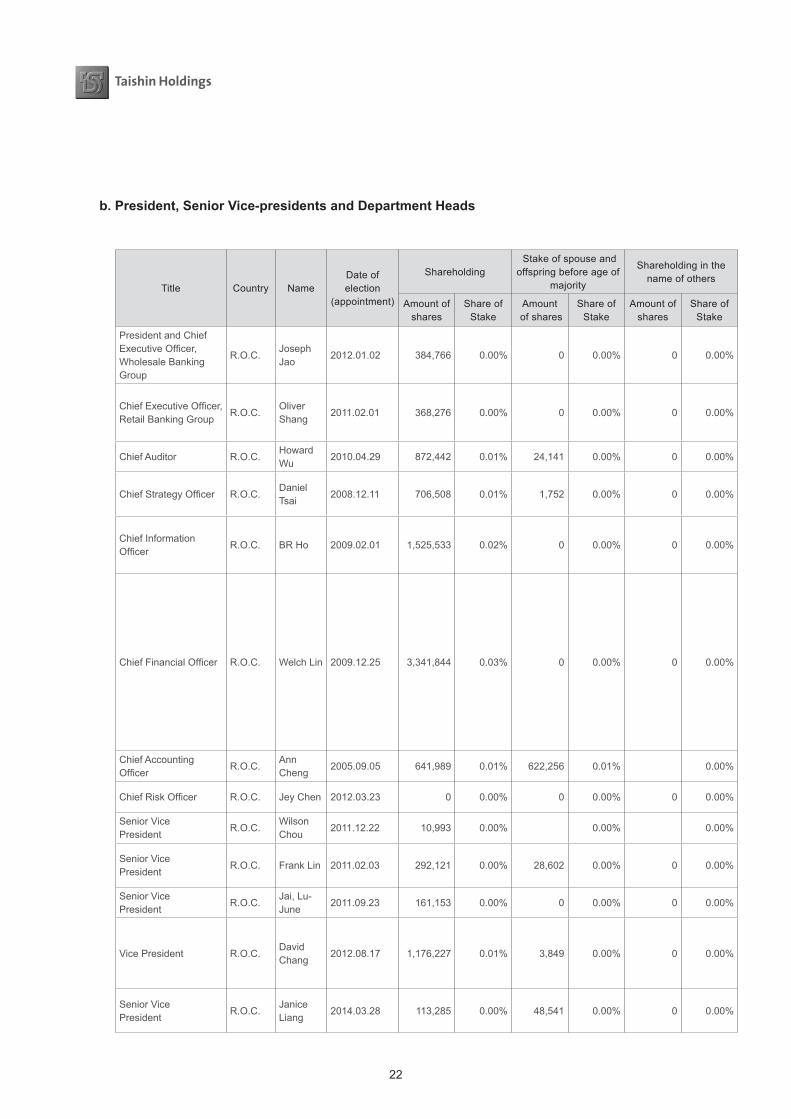
b. President, Senior Vice-presidents and Department Heads
Base date: Feb. 28, 2015
Title Country NameDate of election
(appointment)
Shareholding Stake of spouse and
offspring before age of majority
Shareholding in the name of others
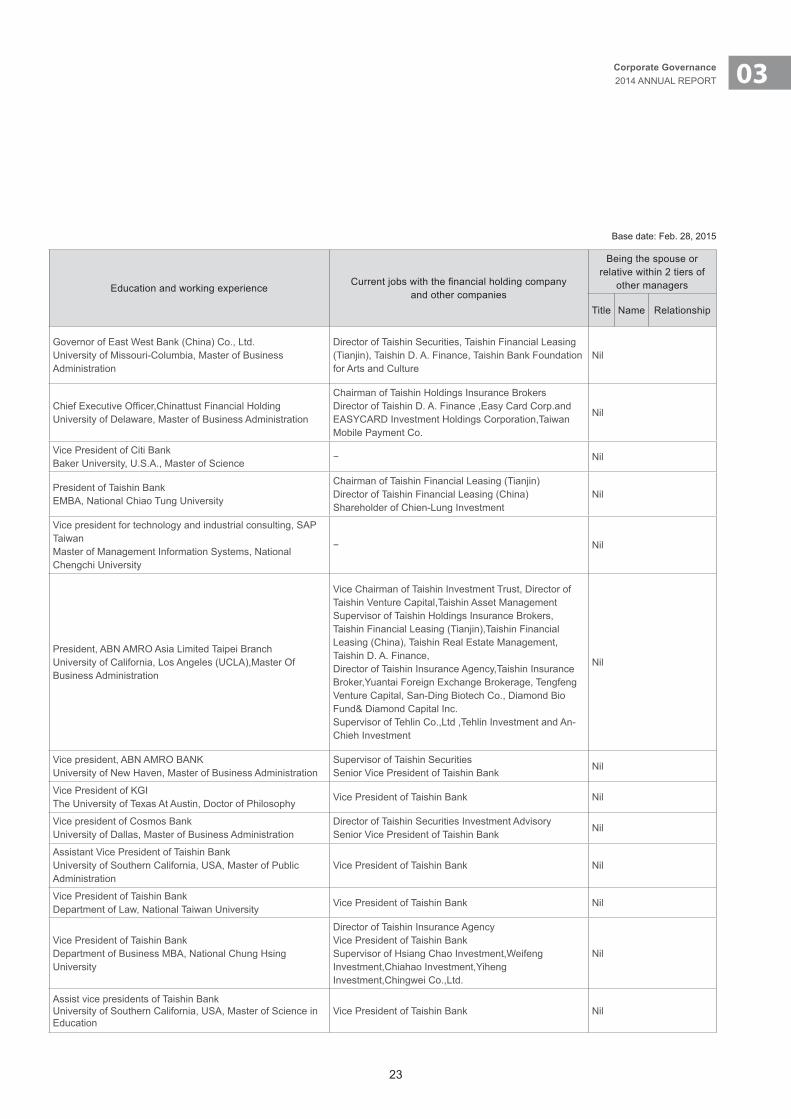
Education and working experience Currentjobswiththefinancialholdingcompany
and other companies
Being the spouse or relative within 2 tiers of
other managers
Amount of shares
Share of Stake
Amount of shares
Share of Stake
Amount of shares
Share of Stake
Title Name Relationship
President and Chief ExecutiveOfficer,Wholesale Banking Group
R.O.C.Joseph Jao
2012.01.02 384,766 0.00% 0 0.00% 0 0.00%Governor of East West Bank (China) Co., Ltd. University of Missouri-Columbia, Master of Business Administration
Director of Taishin Securities, Taishin Financial Leasing (Tianjin), Taishin D. A. Finance, Taishin Bank Foundation for Arts and Culture
Nil
ChiefExecutiveOfficer,Retail Banking Group
R.O.C.Oliver Shang
2011.02.01 368,276 0.00% 0 0.00% 0 0.00% ChiefExecutiveOfficer,ChinattustFinancialHolding University of Delaware, Master of Business Administration
Chairman of Taishin Holdings Insurance BrokersDirector of Taishin D. A. Finance ,Easy Card Corp.and EASYCARD Investment Holdings Corporation,Taiwan Mobile Payment Co.
Nil
Chief Auditor R.O.C.Howard Wu
2010.04.29 872,442 0.01% 24,141 0.00% 0 0.00%Vice President of Citi Bank Baker University, U.S.A., Master of Science
− Nil
ChiefStrategyOfficer R.O.C.Daniel Tsai
2008.12.11 706,508 0.01% 1,752 0.00% 0 0.00%President of Taishin Bank EMBA, National Chiao Tung University
Chairman of Taishin Financial Leasing (Tianjin)Director of Taishin Financial Leasing (China)Shareholder of Chien-Lung Investment
Nil
Chief Information Officer
R.O.C. BR Ho 2009.02.01 1,525,533 0.02% 0 0.00% 0 0.00%
Vice president for technology and industrial consulting, SAP TaiwanMaster of Management Information Systems, National Chengchi University
− Nil
ChiefFinancialOfficer R.O.C. Welch Lin 2009.12.25 3,341,844 0.03% 0 0.00% 0 0.00%President, ABN AMRO Asia Limited Taipei Branch University of California, Los Angeles (UCLA),Master Of Business Administration
Vice Chairman of Taishin Investment Trust, Director of Taishin Venture Capital,Taishin Asset ManagementSupervisor of Taishin Holdings Insurance Brokers, Taishin Financial Leasing (Tianjin),Taishin Financial Leasing (China), Taishin Real Estate Management, Taishin D. A. Finance,Director of Taishin Insurance Agency,Taishin Insurance Broker,Yuantai Foreign Exchange Brokerage, Tengfeng Venture Capital, San-Ding Biotech Co., Diamond Bio Fund& Diamond Capital Inc.Supervisor of Tehlin Co.,Ltd ,Tehlin Investment and An-Chieh Investment
Nil
Chief Accounting Officer
R.O.C.Ann Cheng
2005.09.05 641,989 0.01% 622,256 0.01% 0.00% Vice president, ABN AMRO BANK University of New Haven, Master of Business Administration
Supervisor of Taishin SecuritiesSenior Vice President of Taishin Bank
Nil
ChiefRiskOfficer R.O.C. Jey Chen 2012.03.23 0 0.00% 0 0.00% 0 0.00%Vice President of KGI The University of Texas At Austin, Doctor of Philosophy
Vice President of Taishin Bank Nil
Senior VicePresident
R.O.C.Wilson Chou
2011.12.22 10,993 0.00% 0.00% 0.00% Vice president of Cosmos BankUniversity of Dallas, Master of Business Administration
Director of Taishin Securities Investment Advisory Senior Vice President of Taishin Bank
Nil
Senior VicePresident
R.O.C. Frank Lin 2011.02.03 292,121 0.00% 28,602 0.00% 0 0.00%Assistant Vice President of Taishin Bank University of Southern California, USA, Master of Public Administration
Vice President of Taishin Bank Nil
Senior VicePresident
R.O.C.Jai, Lu-June
2011.09.23 161,153 0.00% 0 0.00% 0 0.00% Vice President of Taishin Bank Department of Law, National Taiwan University
Vice President of Taishin Bank Nil
Vice President R.O.C.David Chang
2012.08.17 1,176,227 0.01% 3,849 0.00% 0 0.00%Vice President of Taishin Bank Department of Business MBA, National Chung Hsing University
Director of Taishin Insurance AgencyVice President of Taishin BankSupervisor of Hsiang Chao Investment,Weifeng Investment,Chiahao Investment,Yiheng Investment,Chingwei Co.,Ltd.
Nil
Senior VicePresident
R.O.C.Janice Liang
2014.03.28 113,285 0.00% 48,541 0.00% 0 0.00%Assist vice presidents of Taishin BankUniversity of Southern California, USA, Master of Science in Education
Vice President of Taishin Bank Nil
23
03Corporate Governance2014 ANNUAL REPORT
b. President, Senior Vice-presidents and Department Heads
Base date: Feb. 28, 2015
Title Country NameDate of election
(appointment)
Shareholding Stake of spouse and
offspring before age of majority
Shareholding in the name of others
Education and working experience Currentjobswiththefinancialholdingcompany
and other companies
Being the spouse or relative within 2 tiers of
other managers
Amount of shares
Share of Stake
Amount of shares
Share of Stake
Amount of shares
Share of Stake
Title Name Relationship
President and Chief ExecutiveOfficer,Wholesale Banking Group
R.O.C.Joseph Jao
2012.01.02 384,766 0.00% 0 0.00% 0 0.00%Governor of East West Bank (China) Co., Ltd. University of Missouri-Columbia, Master of Business Administration
Director of Taishin Securities, Taishin Financial Leasing (Tianjin), Taishin D. A. Finance, Taishin Bank Foundation for Arts and Culture
Nil
ChiefExecutiveOfficer,Retail Banking Group
R.O.C.Oliver Shang
2011.02.01 368,276 0.00% 0 0.00% 0 0.00% ChiefExecutiveOfficer,ChinattustFinancialHolding University of Delaware, Master of Business Administration
Chairman of Taishin Holdings Insurance BrokersDirector of Taishin D. A. Finance ,Easy Card Corp.and EASYCARD Investment Holdings Corporation,Taiwan Mobile Payment Co.
Nil
Chief Auditor R.O.C.Howard Wu
2010.04.29 872,442 0.01% 24,141 0.00% 0 0.00%Vice President of Citi Bank Baker University, U.S.A., Master of Science
− Nil
ChiefStrategyOfficer R.O.C.Daniel Tsai
2008.12.11 706,508 0.01% 1,752 0.00% 0 0.00%President of Taishin Bank EMBA, National Chiao Tung University
Chairman of Taishin Financial Leasing (Tianjin)Director of Taishin Financial Leasing (China)Shareholder of Chien-Lung Investment
Nil
Chief Information Officer
R.O.C. BR Ho 2009.02.01 1,525,533 0.02% 0 0.00% 0 0.00%
Vice president for technology and industrial consulting, SAP TaiwanMaster of Management Information Systems, National Chengchi University
− Nil
ChiefFinancialOfficer R.O.C. Welch Lin 2009.12.25 3,341,844 0.03% 0 0.00% 0 0.00%President, ABN AMRO Asia Limited Taipei Branch University of California, Los Angeles (UCLA),Master Of Business Administration
Vice Chairman of Taishin Investment Trust, Director of Taishin Venture Capital,Taishin Asset ManagementSupervisor of Taishin Holdings Insurance Brokers, Taishin Financial Leasing (Tianjin),Taishin Financial Leasing (China), Taishin Real Estate Management, Taishin D. A. Finance,Director of Taishin Insurance Agency,Taishin Insurance Broker,Yuantai Foreign Exchange Brokerage, Tengfeng Venture Capital, San-Ding Biotech Co., Diamond Bio Fund& Diamond Capital Inc.Supervisor of Tehlin Co.,Ltd ,Tehlin Investment and An-Chieh Investment
Nil
Chief Accounting Officer
R.O.C.Ann Cheng
2005.09.05 641,989 0.01% 622,256 0.01% 0.00% Vice president, ABN AMRO BANK University of New Haven, Master of Business Administration
Supervisor of Taishin SecuritiesSenior Vice President of Taishin Bank
Nil
ChiefRiskOfficer R.O.C. Jey Chen 2012.03.23 0 0.00% 0 0.00% 0 0.00%Vice President of KGI The University of Texas At Austin, Doctor of Philosophy
Vice President of Taishin Bank Nil
Senior VicePresident
R.O.C.Wilson Chou
2011.12.22 10,993 0.00% 0.00% 0.00% Vice president of Cosmos BankUniversity of Dallas, Master of Business Administration
Director of Taishin Securities Investment Advisory Senior Vice President of Taishin Bank
Nil
Senior VicePresident
R.O.C. Frank Lin 2011.02.03 292,121 0.00% 28,602 0.00% 0 0.00%Assistant Vice President of Taishin Bank University of Southern California, USA, Master of Public Administration
Vice President of Taishin Bank Nil
Senior VicePresident
R.O.C.Jai, Lu-June
2011.09.23 161,153 0.00% 0 0.00% 0 0.00% Vice President of Taishin Bank Department of Law, National Taiwan University
Vice President of Taishin Bank Nil
Vice President R.O.C.David Chang
2012.08.17 1,176,227 0.01% 3,849 0.00% 0 0.00%Vice President of Taishin Bank Department of Business MBA, National Chung Hsing University
Director of Taishin Insurance AgencyVice President of Taishin BankSupervisor of Hsiang Chao Investment,Weifeng Investment,Chiahao Investment,Yiheng Investment,Chingwei Co.,Ltd.
Nil
Senior VicePresident
R.O.C.Janice Liang
2014.03.28 113,285 0.00% 48,541 0.00% 0 0.00%Assist vice presidents of Taishin BankUniversity of Southern California, USA, Master of Science in Education
Vice President of Taishin Bank Nil
24
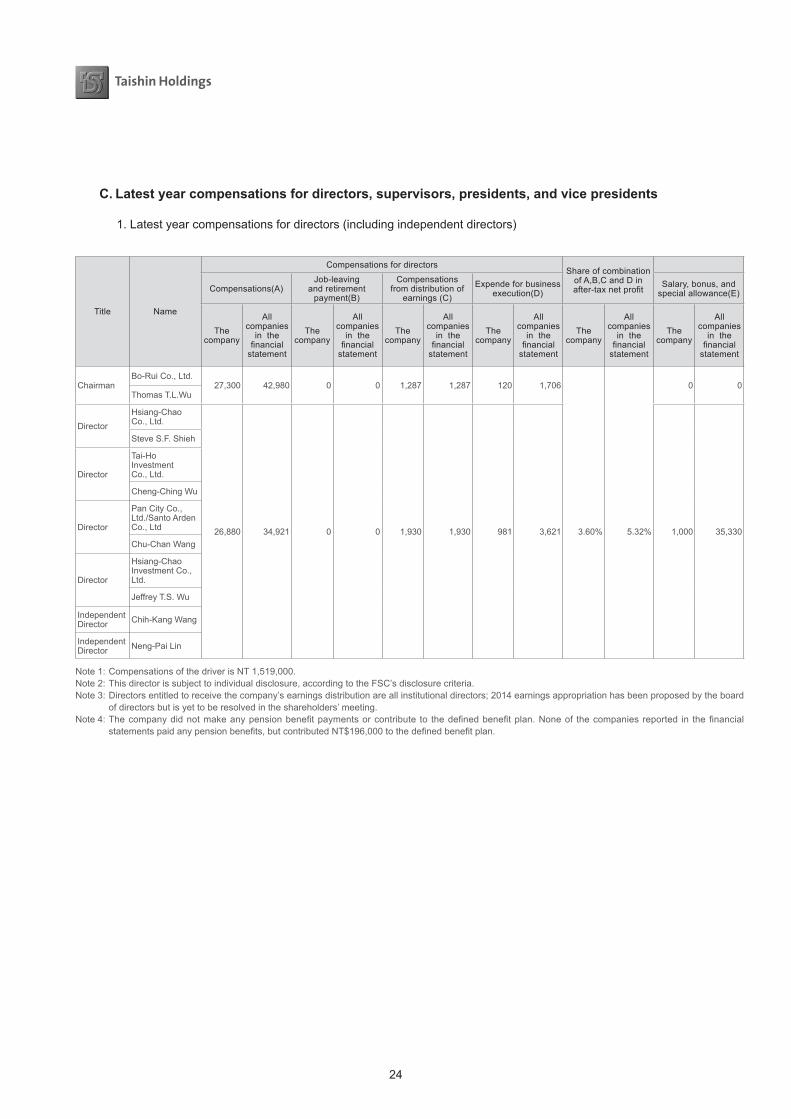
C. Latest year compensations for directors, supervisors, presidents, and vice presidents
1. Latest year compensations for directors (including independent directors) Base date: Dec 31, 2014; Unit: NT$1,000
Title Name
Compensations for directorsShare of combination
of A,B,C and D in after-taxnetprofit
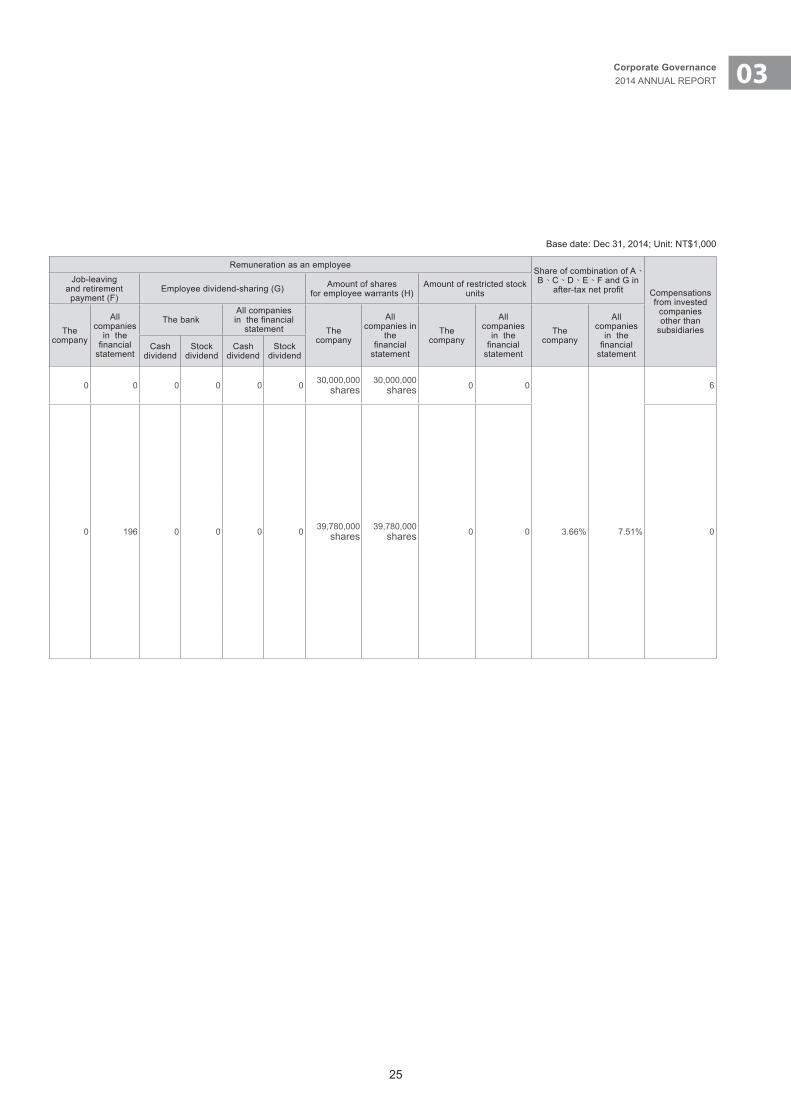
Remuneration as an employeeShare of combination of A、B、C、D、E、F and G in
after-taxnetprofit Compensations from invested
companiesother than
subsidiaries
Compensations(A)Job-leaving
and retirement payment(B)
Compensations from distribution of
earnings (C)Expende for business
execution(D)Salary, bonus, and
special allowance(E)Job-leaving
and retirement payment (F)
Employee dividend-sharing (G) Amount of shares for employee warrants (H)
Amount of restricted stock units
The company
Allcompanies
in thefinancial
statement
The company
Allcompanies
in thefinancial
statement
The company
Allcompanies
in thefinancial
statement
The company
Allcompanies
in thefinancial
statement
The company
Allcompanies
in thefinancial
statement
The company
Allcompanies
in thefinancial
statement
The company
Allcompanies
in thefinancial
statement
The bankAll companiesinthefinancial
statement The company
Allcompanies in
thefinancial
statement
The company
Allcompanies
in thefinancial
statement
The company
Allcompanies
in thefinancial
statement Cash
dividendStock
dividendCash
dividendStock
dividend
ChairmanBo-Rui Co., Ltd.
27,300 42,980 0 0 1,287 1,287 120 1,706 0 0 0 0 0 0 0 0 30,000,000shares
30,000,000shares 0 0 6
Thomas T.L.Wu
DirectorHsiang-Chao Co., Ltd.
26,880 34,921 0 0 1,930 1,930 981 3,621 3.60% 5.32% 1,000 35,330 0 196 0 0 0 0 39,780,000shares
39,780,000shares 0 0 3.66% 7.51% 0
Steve S.F. Shieh
Director
Tai-Ho Investment Co., Ltd.
Cheng-Ching Wu
Director
Pan City Co., Ltd./Santo Arden Co., Ltd
Chu-Chan Wang
Director
Hsiang-Chao Investment Co., Ltd.
Jeffrey T.S. Wu
Independent Director Chih-Kang Wang
Independent Director Neng-Pai Lin
Note 1: Compensations of the driver is NT 1,519,000.Note 2: This director is subject to individual disclosure, according to the FSC’s disclosure criteria. Note 3: Directors entitled to receive the company’s earnings distribution are all institutional directors; 2014 earnings appropriation has been proposed by the board
of directors but is yet to be resolved in the shareholders’ meeting. Note4:Thecompanydidnotmakeanypensionbenefitpaymentsorcontribute to thedefinedbenefitplan.Noneof thecompaniesreported in thefinancial
statementspaidanypensionbenefits,butcontributedNT$196,000tothedefinedbenefitplan.
25
03Corporate Governance2014 ANNUAL REPORT
C. Latest year compensations for directors, supervisors, presidents, and vice presidents
1. Latest year compensations for directors (including independent directors) Base date: Dec 31, 2014; Unit: NT$1,000
Title Name
Compensations for directorsShare of combination
of A,B,C and D in after-taxnetprofit
Remuneration as an employeeShare of combination of A、B、C、D、E、F and G in
after-taxnetprofit Compensations from invested
companiesother than
subsidiaries
Compensations(A)Job-leaving
and retirement payment(B)
Compensations from distribution of
earnings (C)Expende for business
execution(D)Salary, bonus, and
special allowance(E)Job-leaving
and retirement payment (F)
Employee dividend-sharing (G) Amount of shares for employee warrants (H)
Amount of restricted stock units
The company
Allcompanies
in thefinancial
statement
The company
Allcompanies
in thefinancial
statement
The company
Allcompanies
in thefinancial
statement
The company
Allcompanies
in thefinancial
statement
The company
Allcompanies
in thefinancial
statement
The company
Allcompanies
in thefinancial
statement
The company
Allcompanies
in thefinancial
statement
The bankAll companiesinthefinancial
statement The company
Allcompanies in
thefinancial
statement
The company
Allcompanies
in thefinancial
statement
The company
Allcompanies
in thefinancial
statement Cash
dividendStock
dividendCash
dividendStock
dividend
ChairmanBo-Rui Co., Ltd.
27,300 42,980 0 0 1,287 1,287 120 1,706 0 0 0 0 0 0 0 0 30,000,000shares
30,000,000shares 0 0 6
Thomas T.L.Wu
DirectorHsiang-Chao Co., Ltd.
26,880 34,921 0 0 1,930 1,930 981 3,621 3.60% 5.32% 1,000 35,330 0 196 0 0 0 0 39,780,000shares
39,780,000shares 0 0 3.66% 7.51% 0
Steve S.F. Shieh
Director
Tai-Ho Investment Co., Ltd.
Cheng-Ching Wu
Director
Pan City Co., Ltd./Santo Arden Co., Ltd
Chu-Chan Wang
Director
Hsiang-Chao Investment Co., Ltd.
Jeffrey T.S. Wu
Independent Director Chih-Kang Wang
Independent Director Neng-Pai Lin
26
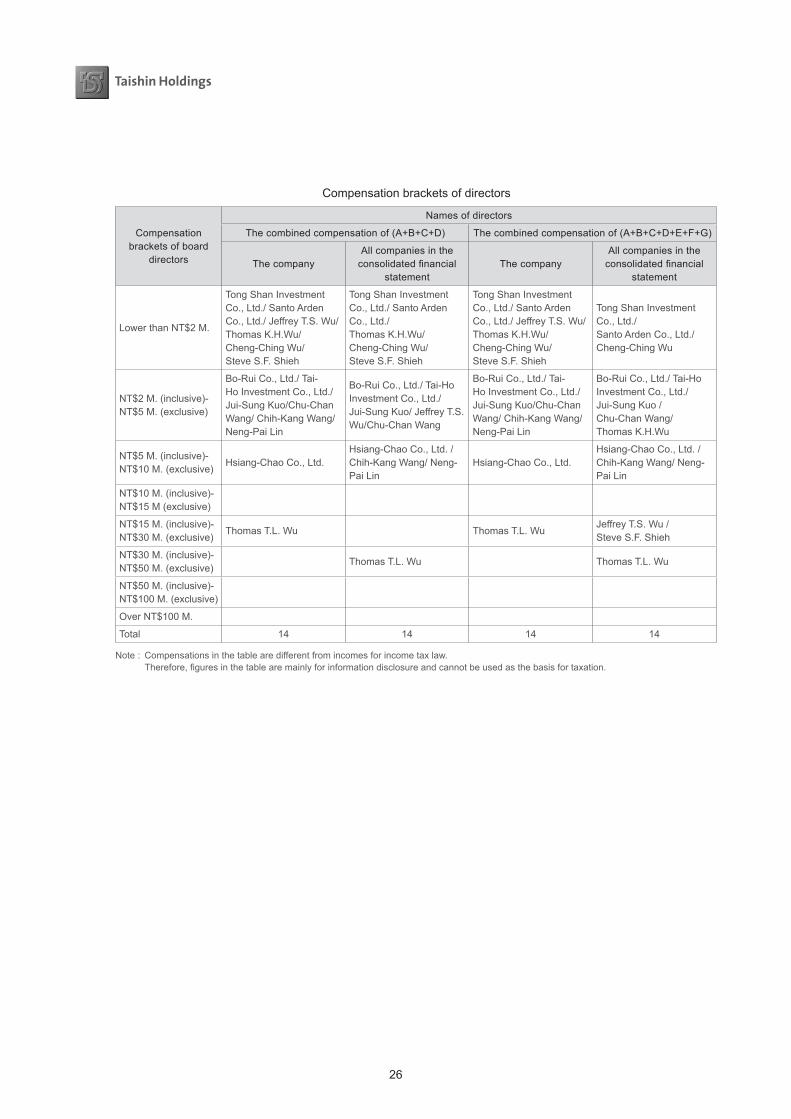
Compensation brackets of directors
Compensation brackets of board
directors
Names of directors
The combined compensation of (A+B+C+D) The combined compensation of (A+B+C+D+E+F+G)
The company All companies in the consolidatedfinancial
statement The company
All companies in the consolidatedfinancial
statement
Lower than NT$2 M.
Tong Shan Investment Co., Ltd./ Santo Arden Co., Ltd./ Jeffrey T.S. Wu/Thomas K.H.Wu/Cheng-Ching Wu/ Steve S.F. Shieh
Tong Shan Investment Co., Ltd./ Santo Arden Co., Ltd./ Thomas K.H.Wu/Cheng-Ching Wu/ Steve S.F. Shieh
Tong Shan Investment Co., Ltd./ Santo Arden Co., Ltd./ Jeffrey T.S. Wu/Thomas K.H.Wu/Cheng-Ching Wu/ Steve S.F. Shieh
Tong Shan Investment Co., Ltd./ Santo Arden Co., Ltd./ Cheng-Ching Wu
NT$2 M. (inclusive)-NT$5 M. (exclusive)
Bo-Rui Co., Ltd./ Tai-Ho Investment Co., Ltd./ Jui-Sung Kuo/Chu-Chan Wang/ Chih-Kang Wang/ Neng-Pai Lin
Bo-Rui Co., Ltd./ Tai-Ho Investment Co., Ltd./Jui-Sung Kuo/ Jeffrey T.S. Wu/Chu-Chan Wang
Bo-Rui Co., Ltd./ Tai-Ho Investment Co., Ltd./ Jui-Sung Kuo/Chu-Chan Wang/ Chih-Kang Wang/ Neng-Pai Lin
Bo-Rui Co., Ltd./ Tai-Ho Investment Co., Ltd./Jui-Sung Kuo /Chu-Chan Wang/Thomas K.H.Wu
NT$5 M. (inclusive)-NT$10 M. (exclusive)
Hsiang-Chao Co., Ltd.Hsiang-Chao Co., Ltd. /Chih-Kang Wang/ Neng-Pai Lin
Hsiang-Chao Co., Ltd.Hsiang-Chao Co., Ltd. /Chih-Kang Wang/ Neng-Pai Lin
NT$10 M. (inclusive)-NT$15 M (exclusive)
NT$15 M. (inclusive)-NT$30 M. (exclusive)
Thomas T.L. Wu Thomas T.L. WuJeffrey T.S. Wu / Steve S.F. Shieh
NT$30 M. (inclusive)-NT$50 M. (exclusive)
Thomas T.L. Wu Thomas T.L. Wu
NT$50 M. (inclusive)-NT$100 M. (exclusive)
Over NT$100 M.
Total 14 14 14 14
Note : Compensations in the table are different from incomes for income tax law. Therefore,figuresinthetablearemainlyforinformationdisclosureandcannotbeusedasthebasisfortaxation.
27
03Corporate Governance2014 ANNUAL REPORT
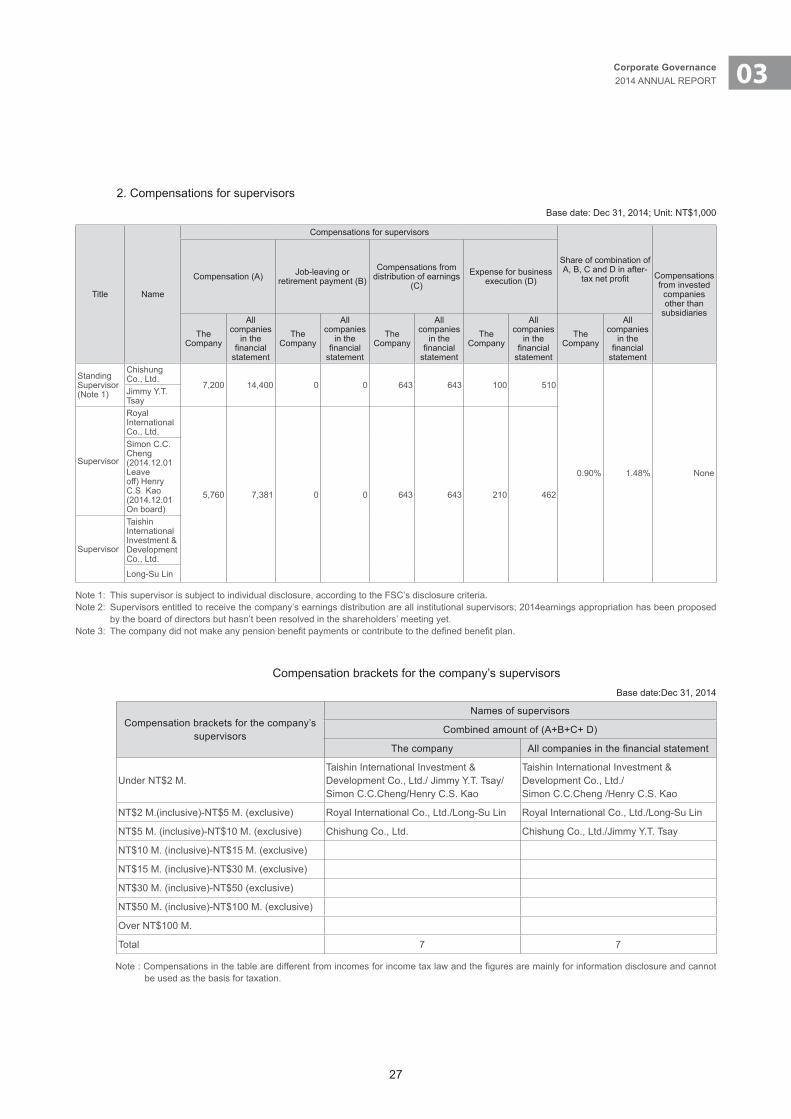
2. Compensations for supervisorsBase date: Dec 31, 2014; Unit: NT$1,000
Title Name
Compensations for supervisors
Share of combination of A, B, C and D in after-
taxnetprofit Compensations from invested
companiesother than
subsidiaries
Compensation (A) Job-leaving or retirement payment (B)
Compensations from distribution of earnings
(C)Expense for business
execution (D)
The Company
All companies
in the financial
statement
The Company
All companies
in the financial
statement
The Company
All companies
in the financial
statement
The Company
All companies
in the financial
statement
The Company
All companies
in the financial
statement
Standing Supervisor(Note 1)
Chishung Co., Ltd.
7,200 14,400 0 0 643 643 100 510
0.90% 1.48% None
Jimmy Y.T. Tsay
Supervisor
Royal International Co., Ltd.
5,760 7,381 0 0 643 643 210 462
Simon C.C. Cheng(2014.12.01 Leave off) Henry C.S. Kao (2014.12.01 On board)
Supervisor
Taishin International Investment & Development Co., Ltd.
Long-Su Lin
Note 1: This supervisor is subject to individual disclosure, according to the FSC’s disclosure criteria. Note 2: Supervisors entitled to receive the company’s earnings distribution are all institutional supervisors; 2014earnings appropriation has been proposed
by the board of directors but hasn’t been resolved in the shareholders’ meeting yet. Note3:Thecompanydidnotmakeanypensionbenefitpaymentsorcontributetothedefinedbenefitplan.
Compensation brackets for the company’s supervisorsBase date:Dec 31, 2014
Compensation brackets for the company’s supervisors
Names of supervisors
Combined amount of (A+B+C+ D)
The company Allcompaniesinthefinancialstatement
Under NT$2 M. Taishin International Investment & Development Co., Ltd./ Jimmy Y.T. Tsay/Simon C.C.Cheng/Henry C.S. Kao
Taishin International Investment & Development Co., Ltd./Simon C.C.Cheng /Henry C.S. Kao
NT$2 M.(inclusive)-NT$5 M. (exclusive) Royal International Co., Ltd./Long-Su Lin Royal International Co., Ltd./Long-Su Lin
NT$5 M. (inclusive)-NT$10 M. (exclusive) Chishung Co., Ltd. Chishung Co., Ltd./Jimmy Y.T. Tsay
NT$10 M. (inclusive)-NT$15 M. (exclusive)
NT$15 M. (inclusive)-NT$30 M. (exclusive)
NT$30 M. (inclusive)-NT$50 (exclusive)
NT$50 M. (inclusive)-NT$100 M. (exclusive)
Over NT$100 M.
Total 7 7
Note:Compensationsinthetablearedifferentfromincomesforincometaxlawandthefiguresaremainlyforinformationdisclosureandcannotbe used as the basis for taxation.
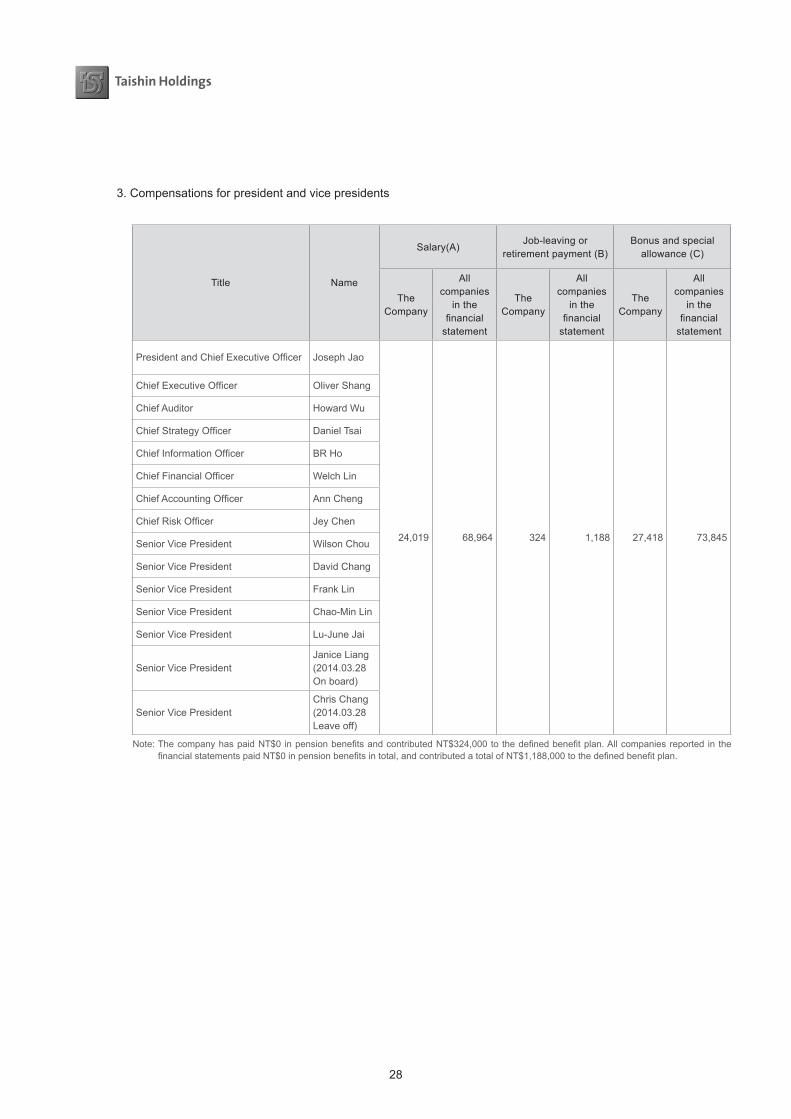
28
3. Compensations for president and vice presidentsBase date: Dec.31, 2014; Unit: NT$1,000
Title Name
Salary(A)Job-leaving or
retirement payment (B)Bonus and special
allowance (C)Employee dividend-sharing(D)
Share of the combined value of A.B. C and D inafter-taxnetprofit(%)
Amount of employee warrants(shares)
Amount of restricted stock units
Compensations from invested
companies other than subsidiariesThe
Company
All companies
in the financial
statement
The Company
All companies
in the financial
statement
The Company
All companies
in the financial
statement
The CompanyAll companies in the financialstatement The
Company
All companies
in the financial
statement
The Company
All companies
in the financial
statement
The Company
All companies
in the financial
statementCash
dividendStock
dividendCash
dividendStock
dividend
PresidentandChiefExecutiveOfficer Joseph Jao
24,019 68,964 324 1,188 27,418 73,845 0 0 0 0 3.19 8.867,585,500
shares7,585,500
shares0 0 156
ChiefExecutiveOfficer Oliver Shang
Chief Auditor Howard Wu
ChiefStrategyOfficer Daniel Tsai
ChiefInformationOfficer BR Ho
ChiefFinancialOfficer Welch Lin
ChiefAccountingOfficer Ann Cheng
ChiefRiskOfficer Jey Chen
Senior Vice President Wilson Chou
Senior Vice President David Chang
Senior Vice President Frank Lin
Senior Vice President Chao-Min Lin
Senior Vice President Lu-June Jai
Senior Vice President Janice Liang (2014.03.28 On board)
Senior Vice President Chris Chang (2014.03.28 Leave off)
Note:ThecompanyhaspaidNT$0inpensionbenefitsandcontributedNT$324,000tothedefinedbenefitplan.Allcompaniesreported inthefinancialstatementspaidNT$0inpensionbenefitsintotal,andcontributedatotalofNT$1,188,000tothedefinedbenefitplan.

29
03Corporate Governance2014 ANNUAL REPORT
3. Compensations for president and vice presidentsBase date: Dec.31, 2014; Unit: NT$1,000
Title Name
Salary(A)Job-leaving or
retirement payment (B)Bonus and special
allowance (C)Employee dividend-sharing(D)
Share of the combined value of A.B. C and D inafter-taxnetprofit(%)
Amount of employee warrants(shares)
Amount of restricted stock units
Compensations from invested
companies other than subsidiariesThe
Company
All companies
in the financial
statement
The Company
All companies
in the financial
statement
The Company
All companies
in the financial
statement
The CompanyAll companies in the financialstatement The
Company
All companies
in the financial
statement
The Company
All companies
in the financial
statement
The Company
All companies
in the financial
statementCash
dividendStock
dividendCash
dividendStock
dividend
PresidentandChiefExecutiveOfficer Joseph Jao
24,019 68,964 324 1,188 27,418 73,845 0 0 0 0 3.19 8.867,585,500
shares7,585,500
shares0 0 156
ChiefExecutiveOfficer Oliver Shang
Chief Auditor Howard Wu
ChiefStrategyOfficer Daniel Tsai
ChiefInformationOfficer BR Ho
ChiefFinancialOfficer Welch Lin
ChiefAccountingOfficer Ann Cheng
ChiefRiskOfficer Jey Chen
Senior Vice President Wilson Chou
Senior Vice President David Chang
Senior Vice President Frank Lin
Senior Vice President Chao-Min Lin
Senior Vice President Lu-June Jai
Senior Vice President Janice Liang (2014.03.28 On board)
Senior Vice President Chris Chang (2014.03.28 Leave off)
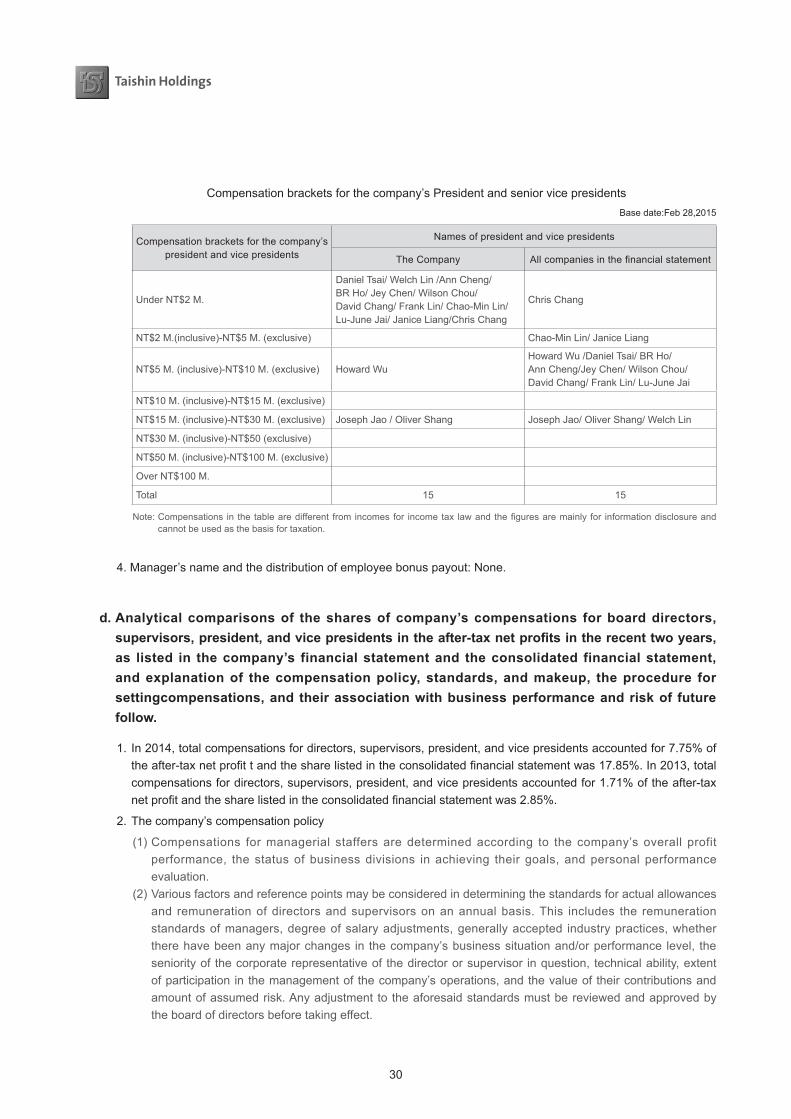
30
Compensation brackets for the company’s President and senior vice presidentsBase date:Feb 28,2015
Compensation brackets for the company’s president and vice presidents
Names of president and vice presidents
The Company Allcompaniesinthefinancialstatement
Under NT$2 M.
Daniel Tsai/ Welch Lin /Ann Cheng/ BR Ho/ Jey Chen/ Wilson Chou/ David Chang/ Frank Lin/ Chao-Min Lin/ Lu-June Jai/ Janice Liang/Chris Chang
Chris Chang
NT$2 M.(inclusive)-NT$5 M. (exclusive) Chao-Min Lin/ Janice Liang
NT$5 M. (inclusive)-NT$10 M. (exclusive) Howard WuHoward Wu /Daniel Tsai/ BR Ho/Ann Cheng/Jey Chen/ Wilson Chou/ David Chang/ Frank Lin/ Lu-June Jai
NT$10 M. (inclusive)-NT$15 M. (exclusive)
NT$15 M. (inclusive)-NT$30 M. (exclusive) Joseph Jao / Oliver Shang Joseph Jao/ Oliver Shang/ Welch Lin
NT$30 M. (inclusive)-NT$50 (exclusive)
NT$50 M. (inclusive)-NT$100 M. (exclusive)
Over NT$100 M.
Total 15 15
Note:Compensations in thetablearedifferent fromincomesfor incometax lawandthefiguresaremainly for informationdisclosureandcannot be used as the basis for taxation.
4. Manager’s name and the distribution of employee bonus payout: None.
d. Analytical comparisons of the shares of company’s compensations for board directors, supervisors,president,andvicepresidentsintheafter-taxnetprofitsintherecenttwoyears,as listed in the company’s financial statement and the consolidated financial statement, and explanation of the compensation policy, standards, and makeup, the procedure for settingcompensations, and their association with business performance and risk of future follow.
1. In 2014, total compensations for directors, supervisors, president, and vice presidents accounted for 7.75% of theafter-taxnetprofittandthesharelistedintheconsolidatedfinancialstatementwas17.85%.In2013,totalcompensations for directors, supervisors, president, and vice presidents accounted for 1.71% of the after-tax netprofitandthesharelistedintheconsolidatedfinancialstatementwas2.85%.
2. The company’s compensation policy
(1) Compensations for managerial staffers are determined according to the company’s overall profit performance, the status of business divisions in achieving their goals, and personal performance evaluation.
(2) Various factors and reference points may be considered in determining the standards for actual allowances and remuneration of directors and supervisors on an annual basis. This includes the remuneration standards of managers, degree of salary adjustments, generally accepted industry practices, whether there have been any major changes in the company’s business situation and/or performance level, the seniority of the corporate representative of the director or supervisor in question, technical ability, extent of participation in the management of the company’s operations, and the value of their contributions and amount of assumed risk. Any adjustment to the aforesaid standards must be reviewed and approved by the board of directors before taking effect.
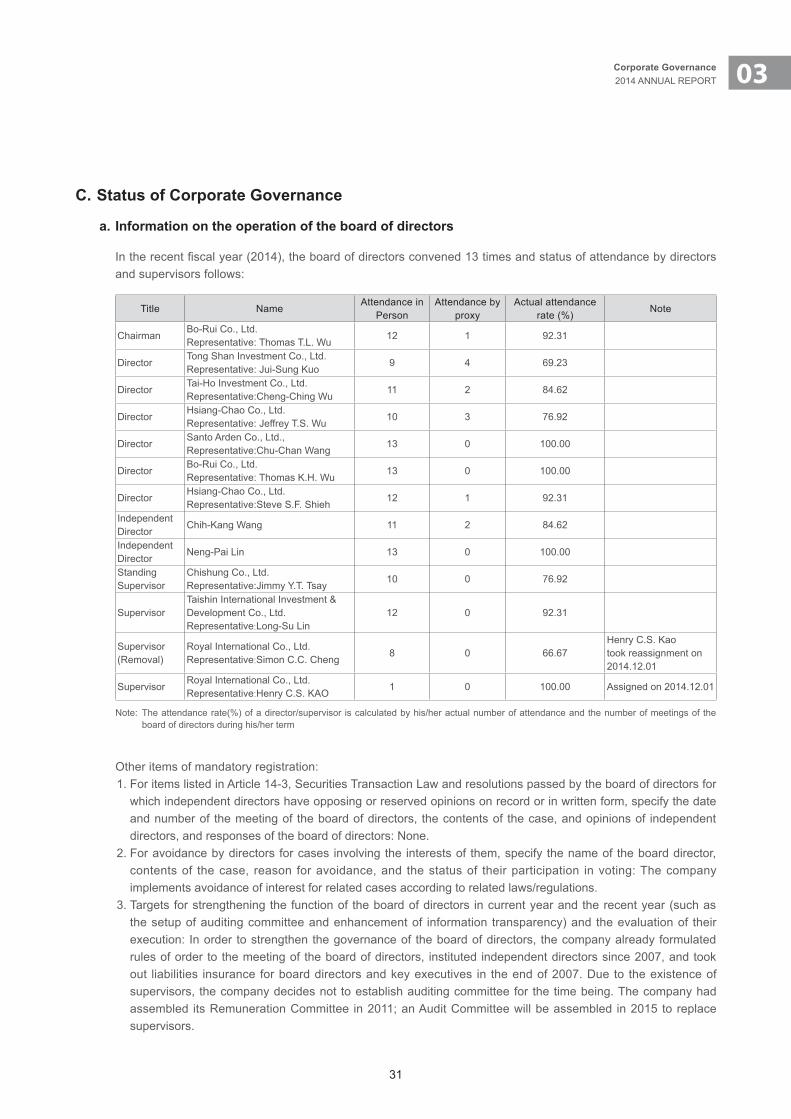
31
03Corporate Governance2014 ANNUAL REPORT
C. Status of Corporate Governance
a. Information on the operation of the board of directors
Intherecentfiscalyear(2014),theboardofdirectorsconvened13timesandstatusofattendancebydirectorsand supervisors follows:
Title NameAttendance in
PersonAttendance by
proxy Actual attendance
rate (%)Note
ChairmanBo-Rui Co., Ltd.Representative: Thomas T.L. Wu
12 1 92.31
Director Tong Shan Investment Co., Ltd.Representative: Jui-Sung Kuo
9 4 69.23
Director Tai-Ho Investment Co., Ltd.Representative:Cheng-Ching Wu
11 2 84.62
Director Hsiang-Chao Co., Ltd.Representative: Jeffrey T.S. Wu
10 3 76.92
Director Santo Arden Co., Ltd.,Representative:Chu-Chan Wang
13 0 100.00
Director Bo-Rui Co., Ltd. Representative: Thomas K.H. Wu
13 0 100.00
Director Hsiang-Chao Co., Ltd.Representative:Steve S.F. Shieh
12 1 92.31
Independent Director
Chih-Kang Wang 11 2 84.62
Independent Director
Neng-Pai Lin 13 0 100.00
Standing Supervisor
Chishung Co., Ltd.Representative:Jimmy Y.T. Tsay
10 0 76.92
Supervisor Taishin International Investment & Development Co., Ltd.Representative:Long-Su Lin
12 0 92.31
Supervisor(Removal)
Royal International Co., Ltd.Representative:Simon C.C. Cheng
8 0 66.67Henry C.S. Kaotook reassignment on 2014.12.01
SupervisorRoyal International Co., Ltd.Representative:Henry C.S. KAO
1 0 100.00 Assigned on 2014.12.01
Note: The attendance rate(%) of a director/supervisor is calculated by his/her actual number of attendance and the number of meetings of the board of directors during his/her term
Other items of mandatory registration: 1. For items listed in Article 14-3, Securities Transaction Law and resolutions passed by the board of directors for
which independent directors have opposing or reserved opinions on record or in written form, specify the date and number of the meeting of the board of directors, the contents of the case, and opinions of independent directors, and responses of the board of directors: None.
2. For avoidance by directors for cases involving the interests of them, specify the name of the board director, contents of the case, reason for avoidance, and the status of their participation in voting: The company implements avoidance of interest for related cases according to related laws/regulations.
3. Targets for strengthening the function of the board of directors in current year and the recent year (such as the setup of auditing committee and enhancement of information transparency) and the evaluation of their execution: In order to strengthen the governance of the board of directors, the company already formulated rules of order to the meeting of the board of directors, instituted independent directors since 2007, and took out liabilities insurance for board directors and key executives in the end of 2007. Due to the existence of supervisors, the company decides not to establish auditing committee for the time being. The company had assembled its Remuneration Committee in 2011; an Audit Committee will be assembled in 2015 to replace supervisors.

32
b. Operation of the auditing committee or the participation of supervisors in the operation of board of directors
1. Information on the operation of auditing committee: Not established yet.
2. Supervisors attendance the practice of Board of Directors
Intherecentfiscalyear(2014)theboardofdirectorsconvened13timesandstatusofattendance:
Title Name Actual number of
attendance Attendance
rate (%) Note
Standing Supervisor
Chishung Co., Ltd.Representative:Jimmy Y.T. Tsay
10 76.92
Supervisor Taishin International Investment & Development Co., Ltd.Representative: Long-Su Lin
12 92.31
Supervisor(Removal)
Royal International Co., Ltd.Representative: Simon C.C. Cheng
8 66.67Henry C.S. Kao took reassignment on 2014.12.01
SupervisorRoyal International Co., Ltd.Representative: Henry C.S. Kao
1 100.00 Assigned on 2014.12.01
Note: The attendance rate(%) of a director/supervisor is calculated by his/her actual number of attendance and the number of meetings of the board of directors during his/her term.
Other items which should be recorded:
1. The makeup and responsibilities of supervisors:(1) Communication between supervisors and employees/shareholders (such as communications channel and
method) Supervisors can communicate with employees anytime in the exercise of their duties and employee can
reflectandexpresstheiropinionstothehumanresourcesdivisionviathecompany’sinternalwebsite.(2) Status of the communication of supervisors with in-house auditing chief and CPA
a. Status of the communication between supervisors and in-house auditing chief(a) The company’s supervisors regularly hold communications meetings with the general auditor and
minutes of the meeting are submitted to the board of directors. (b) Supervisors and chief auditor of the bank attend the meetings of the board of directors and
communicate with directors during and before the meetings over various affairs of the bank.(c) The auditing reports for the company and its subsidiaries auditing division are submitted to
supervisors for inspection.(d) The company’s auditing division regularly submits “auditing report” in the meeting of the board of
directors by quarterly, with the contents of the report including the conducting of auditing operation and major audited items, both internal and external ones. Attending supervisors, therefore, can also understand the contents of the report.
(e) Investigation reports on major incidents of the company and its subsidiaries (such as irregularities, natural disaster, and major losses) are all submitted to supervisors.
(f) Supervisors can communicate and discuss with chief auditor over the aforementioned affairs or other affairs anytime.
b. Status of the communications between supervisors and CPAs Thecompany’ssupervisorscandiscusswithCPAsovertheholdingcompany’sfinance,businessstatus,
andauditingfindingsofCPAs.2. Opinions expressed by supervisors in the meetings of the board of directors which should be put on record,
including the date and number of the meeting, contents of the case, resolutions of the meeting, and response of the board to the opinions: None.
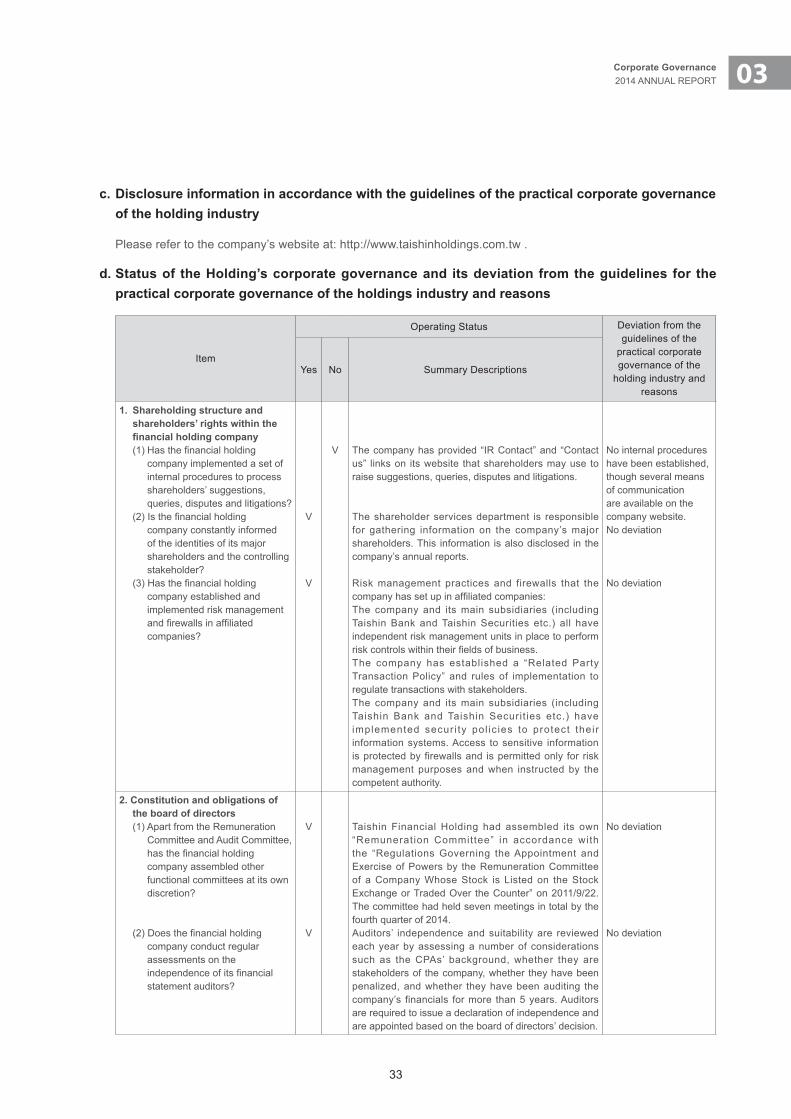
33
03Corporate Governance2014 ANNUAL REPORT
c. Disclosure information in accordance with the guidelines of the practical corporate governance of the holding industry
Please refer to the company’s website at: http://www.taishinholdings.com.tw .
d. Status of the Holding’s corporate governance and its deviation from the guidelines for the practical corporate governance of the holdings industry and reasons
Item
Operating Status Deviation from the guidelines of the
practical corporate governance of the
holding industry and reasons
Yes No Summary Descriptions
1. Shareholding structure and shareholders’ rights within the financialholdingcompany(1)Hasthefinancialholding
company implemented a set of internal procedures to process shareholders’ suggestions, queries, disputes and litigations?
(2)Isthefinancialholdingcompany constantly informed of the identities of its major shareholders and the controlling stakeholder?
(3)Hasthefinancialholdingcompany established and implemented risk management andfirewallsinaffiliatedcompanies?
V
V
V The company has provided “IR Contact” and “Contact us” links on its website that shareholders may use to raise suggestions, queries, disputes and litigations.
The shareholder services department is responsible for gathering information on the company’s major shareholders. This information is also disclosed in the company’s annual reports.
Risk management practices and firewalls that the companyhassetupinaffiliatedcompanies:The company and its main subsidiaries (including Taishin Bank and Taishin Securities etc.) all have independent risk management units in place to perform riskcontrolswithintheirfieldsofbusiness.The company has established a “Related Party Transaction Policy” and rules of implementation to regulate transactions with stakeholders. The company and its main subsidiaries (including Taishin Bank and Taishin Securit ies etc.) have implemented secur i ty pol ic ies to protect their information systems. Access to sensitive information is protected by firewalls and is permitted only for risk management purposes and when instructed by the competent authority.
No internal procedures have been established, though several means of communication are available on the company website. No deviation
No deviation
2. Constitution and obligations of the board of directors (1) Apart from the Remuneration
Committee and Audit Committee, hasthefinancialholdingcompany assembled other functional committees at its own discretion?
(2)Doesthefinancialholdingcompany conduct regular assessments on the independenceofitsfinancialstatement auditors?
V
V
Taishin Financial Holding had assembled its own “Remuneration Committee” in accordance with the “Regulations Governing the Appointment and Exercise of Powers by the Remuneration Committee of a Company Whose Stock is Listed on the Stock Exchange or Traded Over the Counter” on 2011/9/22. The committee had held seven meetings in total by the fourth quarter of 2014. Auditors’ independence and suitability are reviewed each year by assessing a number of considerations such as the CPAs’ background, whether they are stakeholders of the company, whether they have been penalized, and whether they have been auditing the company’s financials for more than 5 years. Auditors are required to issue a declaration of independence and are appointed based on the board of directors’ decision.
No deviation
No deviation
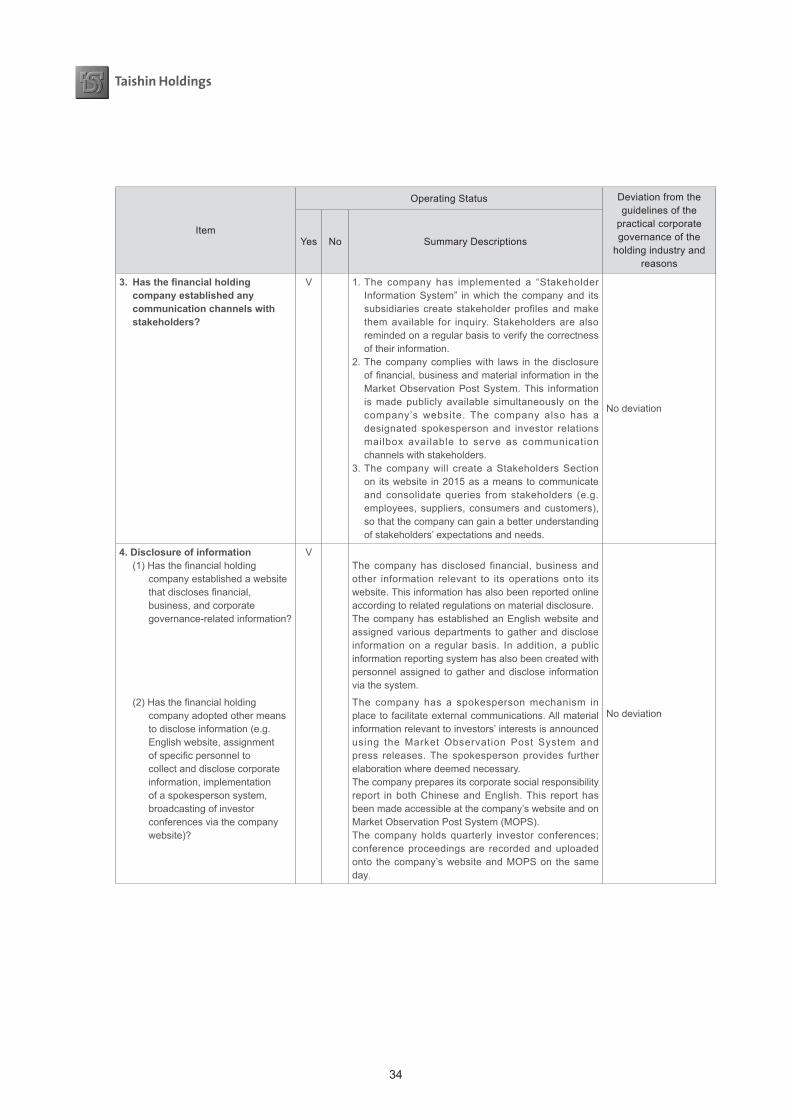
34
Item
Operating Status Deviation from the guidelines of the
practical corporate governance of the
holding industry and reasons
Yes No Summary Descriptions
3. Hasthefinancialholdingcompany established any communication channels with stakeholders?
V 1. The company has implemented a “Stakeholder Information System” in which the company and its subsidiaries create stakeholder profiles and make them available for inquiry. Stakeholders are also reminded on a regular basis to verify the correctness of their information.
2. The company complies with laws in the disclosure offinancial,businessandmaterialinformationintheMarket Observation Post System. This information is made publicly available simultaneously on the company’s website. The company also has a designated spokesperson and investor relations mailbox available to serve as communication channels with stakeholders.
3. The company will create a Stakeholders Section on its website in 2015 as a means to communicate and consolidate queries from stakeholders (e.g. employees, suppliers, consumers and customers), so that the company can gain a better understanding of stakeholders’ expectations and needs.
No deviation
4. Disclosure of information (1)Hasthefinancialholding
company established a website thatdisclosesfinancial,business, and corporate governance-related information?
(2)Hasthefinancialholdingcompany adopted other means to disclose information (e.g. English website, assignment ofspecificpersonneltocollect and disclose corporate information, implementation of a spokesperson system, broadcasting of investor conferences via the company website)?
VThe company has disclosed financial, business and other information relevant to its operations onto its website. This information has also been reported online according to related regulations on material disclosure. The company has established an English website and assigned various departments to gather and disclose information on a regular basis. In addition, a public information reporting system has also been created with personnel assigned to gather and disclose information via the system.
The company has a spokesperson mechanism in place to facilitate external communications. All material information relevant to investors’ interests is announced using the Market Observation Post System and press releases. The spokesperson provides further elaboration where deemed necessary. The company prepares its corporate social responsibility report in both Chinese and English. This report has been made accessible at the company’s website and on Market Observation Post System (MOPS). The company holds quarterly investor conferences; conference proceedings are recorded and uploaded onto the company’s website and MOPS on the same day.
No deviation
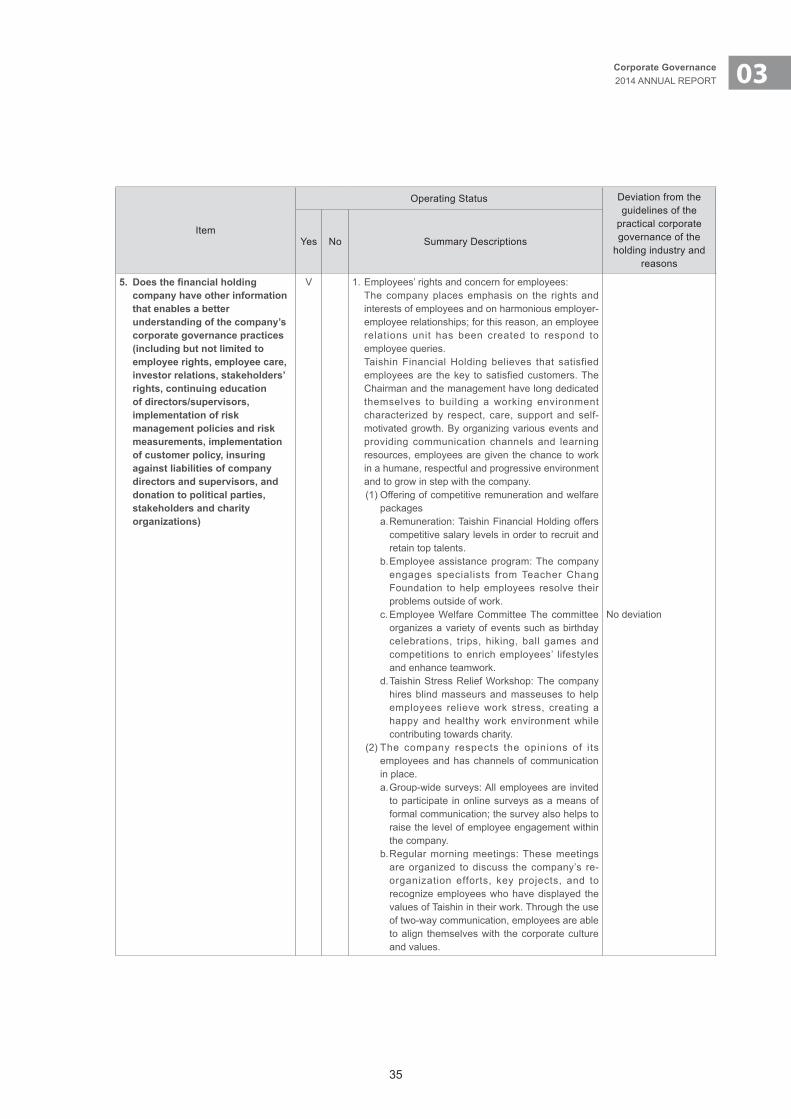
35
03Corporate Governance2014 ANNUAL REPORT
Item
Operating Status Deviation from the guidelines of the
practical corporate governance of the
holding industry and reasons
Yes No Summary Descriptions
5. Doesthefinancialholdingcompany have other information that enables a better understanding of the company’s corporate governance practices (including but not limited to employee rights, employee care, investor relations, stakeholders’ rights, continuing education of directors/supervisors, implementation of risk management policies and risk measurements, implementation of customer policy, insuring against liabilities of company directors and supervisors, and donation to political parties, stakeholders and charity organizations)
V 1. Employees’ rights and concern for employees: The company places emphasis on the rights and
interests of employees and on harmonious employer-employee relationships; for this reason, an employee relations unit has been created to respond to employee queries.
Taishin Financial Holding believes that satisfied employees are the key to satisfied customers. The Chairman and the management have long dedicated themselves to building a working environment characterized by respect, care, support and self-motivated growth. By organizing various events and providing communication channels and learning resources, employees are given the chance to work in a humane, respectful and progressive environment and to grow in step with the company. (1) Offering of competitive remuneration and welfare
packages a. Remuneration: Taishin Financial Holding offers
competitive salary levels in order to recruit and retain top talents.
b. Employee assistance program: The company engages specialists from Teacher Chang Foundation to help employees resolve their problems outside of work.
c. Employee Welfare Committee The committee organizes a variety of events such as birthday celebrations, trips, hiking, ball games and competitions to enrich employees’ lifestyles and enhance teamwork.
d. Taishin Stress Relief Workshop: The company hires blind masseurs and masseuses to help employees relieve work stress, creating a happy and healthy work environment while contributing towards charity.
(2) The company respects the opinions of its employees and has channels of communication in place. a. Group-wide surveys: All employees are invited
to participate in online surveys as a means of formal communication; the survey also helps to raise the level of employee engagement within the company.
b. Regular morning meetings: These meetings are organized to discuss the company’s re-organization efforts, key projects, and to recognize employees who have displayed the values of Taishin in their work. Through the use of two-way communication, employees are able to align themselves with the corporate culture and values.
No deviation
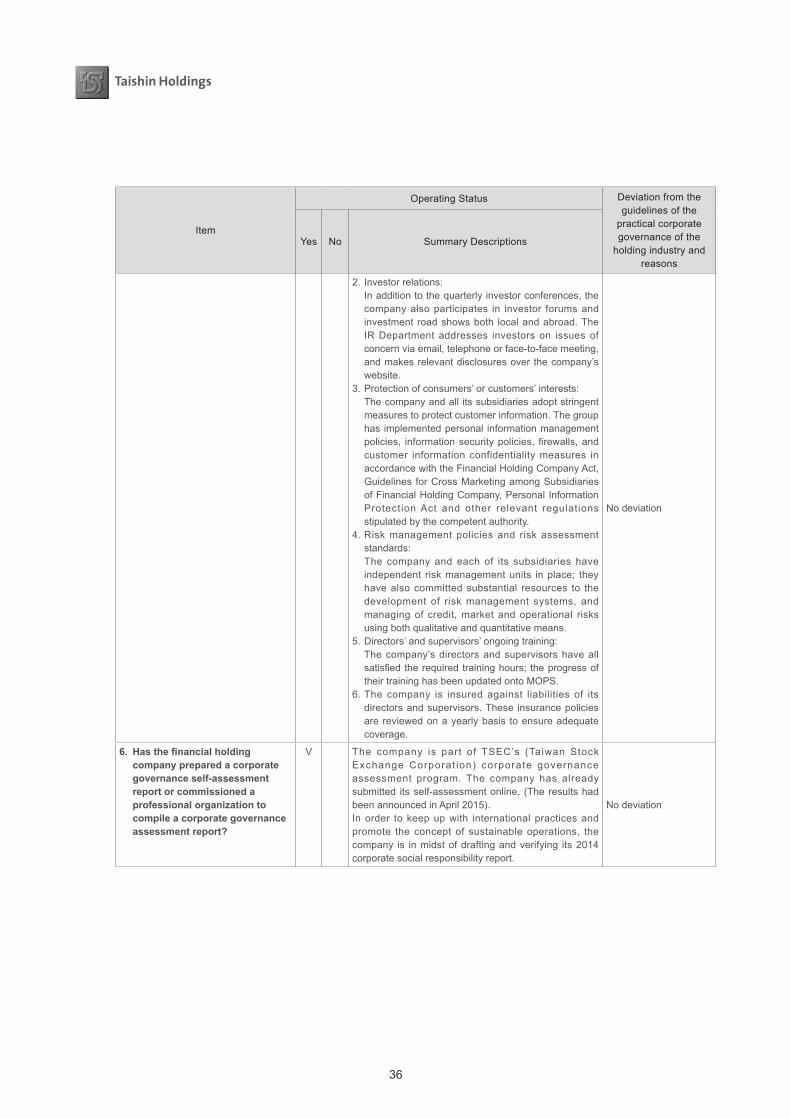
36
Item
Operating Status Deviation from the guidelines of the
practical corporate governance of the
holding industry and reasons
Yes No Summary Descriptions
2. Investor relations: In addition to the quarterly investor conferences, the
company also participates in investor forums and investment road shows both local and abroad. The IR Department addresses investors on issues of concern via email, telephone or face-to-face meeting, and makes relevant disclosures over the company’s website.
3. Protection of consumers’ or customers’ interests: The company and all its subsidiaries adopt stringent
measures to protect customer information. The group has implemented personal information management policies, informationsecuritypolicies,firewalls,andcustomer information confidentiality measures in accordance with the Financial Holding Company Act, Guidelines for Cross Marketing among Subsidiaries of Financial Holding Company, Personal Information Protection Act and other relevant regulations stipulated by the competent authority.
4. Risk management policies and risk assessment standards:
The company and each of its subsidiaries have independent risk management units in place; they have also committed substantial resources to the development of risk management systems, and managing of credit, market and operational risks using both qualitative and quantitative means.
5. Directors’ and supervisors’ ongoing training: The company’s directors and supervisors have all
satisfiedtherequiredtraininghours; theprogressoftheir training has been updated onto MOPS.
6. The company is insured against liabilities of its directors and supervisors. These insurance policies are reviewed on a yearly basis to ensure adequate coverage.
No deviation
6. Hasthefinancialholdingcompany prepared a corporate governance self-assessment report or commissioned a professional organization to compile a corporate governance assessment report?
V The company is part of TSEC’s (Taiwan Stock Exchange Corporat ion) corporate governance assessment program. The company has already submitted its self-assessment online, (The results had been announced in April 2015). In order to keep up with international practices and promote the concept of sustainable operations, the company is in midst of drafting and verifying its 2014 corporate social responsibility report.
No deviation
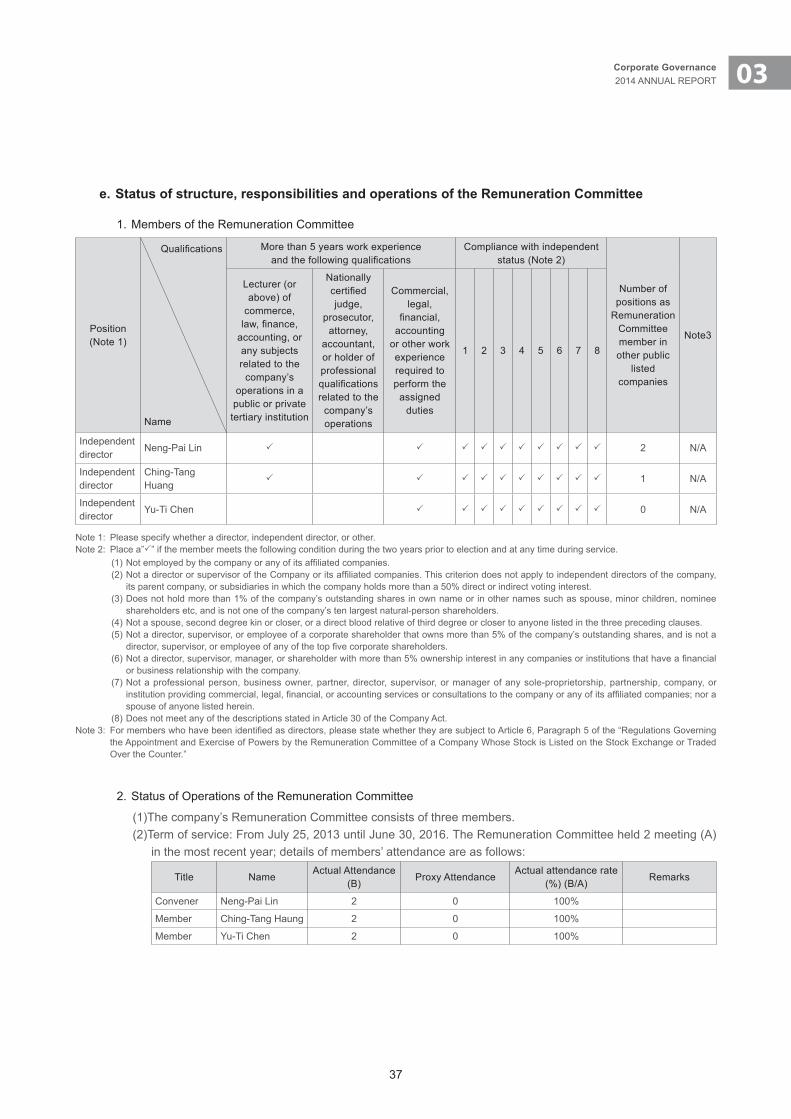
37
03Corporate Governance2014 ANNUAL REPORT
e. Status of structure, responsibilities and operations of the Remuneration Committee
1. Members of the Remuneration Committee
Position (Note 1)
Qualifications
Name
More than 5 years work experience andthefollowingqualifications
Compliance with independent status (Note 2)
Number of positions as
Remuneration Committee member inother public
listed companies
Note3
Lecturer (or above) of
commerce, law,finance,
accounting, or any subjects related to the
company’s operations in a public or private tertiary institution
Nationally certifiedjudge,
prosecutor, attorney,
accountant, or holder of professional qualificationsrelated to the
company’s operations
Commercial, legal,
financial,accounting
or other work experience required to perform the
assigned duties
1 2 3 4 5 6 7 8
Independentdirector
Neng-Pai Lin P P P P P P P P P P 2 N/A
Independentdirector
Ching-TangHuang
P P P P P P P P P P 1 N/A
Independentdirector
Yu-Ti Chen P P P P P P P P P 0 N/A
Note 1: Please specify whether a director, independent director, or other. Note 2: Place a”P” if the member meets the following condition during the two years prior to election and at any time during service.
(1)Notemployedbythecompanyoranyofitsaffiliatedcompanies.(2)NotadirectororsupervisoroftheCompanyoritsaffiliatedcompanies.Thiscriteriondoesnotapplytoindependentdirectorsofthecompany,
its parent company, or subsidiaries in which the company holds more than a 50% direct or indirect voting interest. (3) Does not hold more than 1% of the company’s outstanding shares in own name or in other names such as spouse, minor children, nominee
shareholders etc, and is not one of the company’s ten largest natural-person shareholders. (4) Not a spouse, second degree kin or closer, or a direct blood relative of third degree or closer to anyone listed in the three preceding clauses. (5) Not a director, supervisor, or employee of a corporate shareholder that owns more than 5% of the company’s outstanding shares, and is not a
director,supervisor,oremployeeofanyofthetopfivecorporateshareholders.(6)Notadirector,supervisor,manager,orshareholderwithmorethan5%ownershipinterestinanycompaniesorinstitutionsthathaveafinancial
or business relationship with the company. (7) Not a professional person, business owner, partner, director, supervisor, or manager of any sole-proprietorship, partnership, company, or
institutionprovidingcommercial,legal,financial,oraccountingservicesorconsultationstothecompanyoranyofitsaffiliatedcompanies;noraspouse of anyone listed herein.
(8) Does not meet any of the descriptions stated in Article 30 of the Company Act. Note3: Formemberswhohavebeenidentifiedasdirectors,pleasestatewhethertheyaresubjecttoArticle6,Paragraph5ofthe“RegulationsGoverning
the Appointment and Exercise of Powers by the Remuneration Committee of a Company Whose Stock is Listed on the Stock Exchange or Traded Over the Counter.”
2. Status of Operations of the Remuneration Committee
(1)The company’s Remuneration Committee consists of three members. (2)Term of service: From July 25, 2013 until June 30, 2016. The Remuneration Committee held 2 meeting (A)
in the most recent year; details of members’ attendance are as follows:
Title Name Actual Attendance
(B)Proxy Attendance
Actual attendance rate (%) (B/A)
Remarks
Convener Neng-Pai Lin 2 0 100%
Member Ching-Tang Haung 2 0 100%
Member Yu-Ti Chen 2 0 100%

38
Other remarks: 1. In the event where a Remuneration Committee proposal is rejected or amended in a board of directors
meeting, please describe the date and session of the meeting, details of the agenda, the board’s resolution, and the way the company processed the Remuneration Committee’s proposals (describe the differences and reasons, if any, should the board of directors approve a solution that was more favorable than the one proposed by the Remuneration Committee): None.
2. ShouldanymemberobjectorexpressqualifiedopinionstoaresolutionmadebytheRemunerationCommittee, whether on-record or in writing, please describe the date and session of the meeting, details of the agenda, the entire members’ opinions, and how their opinions were addressed: None.
f. Fulfillmentofsocialresponsibilities
Item
Operating status Deviations from “Corporate Social
Responsibility Best Practice Principles for TWSE/GTSM
Listed Companies “ and reason
Yes No Summary description
1. Implementation of corporate
governance(1) Does the company have a
corporate social responsibility policy or system in place? Is progress reviewed on a regular basis?
V
The company adheres to four principles in planning and administration of its corporate social responsibility: implementing corporate governance, contributing to the development of sustainable environment, supporting public interest and charity activities, and disclosing information on corporate social responsibility. The company had developed a corporate social responsibility code of conduct in 2014; it was approved by the board of directors and implemented with immediate effect. This policy applies to all operations of the holding company, the bank and other subsidiaries. Relevant campaigns encompass economic, societal, and eco-environmental aspects such as stakeholder communication, corporate social responsibility, arts promotion, energy conservation and carbon reduction, energy management, green space development, employee benefits,employeetraining,workplacehealthandsafety,andsupplier management. Details of implementation and results such as the establishment of the Corporate Sustainability Committee and various guidelines, the strengthened corporate governance practice, the addition CSR section on thecompanywebsite,andplansfor ISO50001certificationand IDP agreements can be found under p.34-36 of the annual reports and the company’s 2014 Corporate Social Responsibility Report. In addition, the company had established a corporate governance code of conduct and integrity policy in 2014 to guide its corporate governance practices.
In accordance with “Corporate Social Responsibility Best Practice Principles for TWSE/GTSM Listed Companies “.
(2) Does the company organize social responsibility training on a regular basis?
The company arranges for its directors, supervisors, accounting,financeandauditpersonneltoattendcorporategovernance courses both on a regular and irregular basis. Courses on corporate ethics, banking regulations and code of conduct are mandatory to attend for all new recruits.
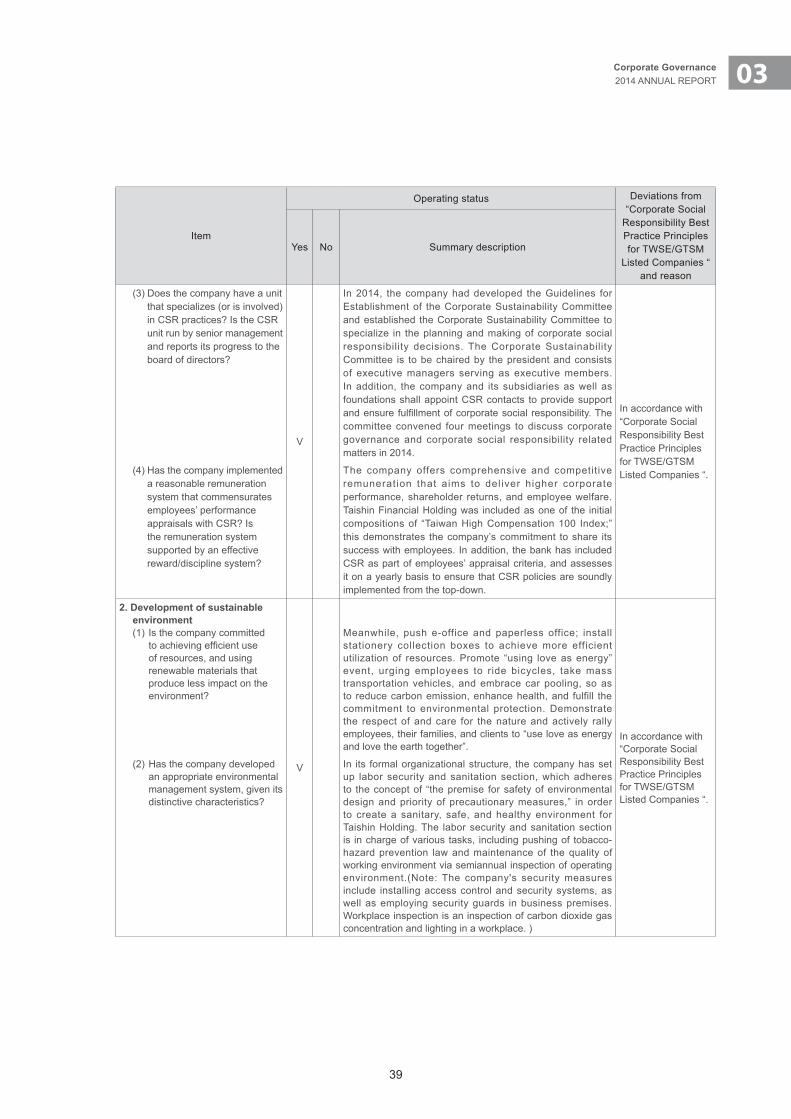
39
03Corporate Governance2014 ANNUAL REPORT
Item
Operating status Deviations from “Corporate Social
Responsibility Best Practice Principles for TWSE/GTSM
Listed Companies “ and reason
Yes No Summary description
(3) Does the company have a unit that specializes (or is involved) in CSR practices? Is the CSR unit run by senior management and reports its progress to the board of directors?
V
In 2014, the company had developed the Guidelines for Establishment of the Corporate Sustainability Committee and established the Corporate Sustainability Committee to specialize in the planning and making of corporate social responsibility decisions. The Corporate Sustainability Committee is to be chaired by the president and consists of executive managers serving as executive members. In addition, the company and its subsidiaries as well as foundations shall appoint CSR contacts to provide support andensurefulfillmentofcorporatesocialresponsibility.Thecommittee convened four meetings to discuss corporate governance and corporate social responsibility related matters in 2014.
In accordance with “Corporate Social Responsibility Best Practice Principles for TWSE/GTSM Listed Companies “.(4) Has the company implemented
a reasonable remuneration system that commensurates employees’ performance appraisals with CSR? Is the remuneration system supported by an effective reward/discipline system?
The company offers comprehensive and competitive remuneration that aims to deliver higher corporate performance, shareholder returns, and employee welfare. Taishin Financial Holding was included as one of the initial compositions of “Taiwan High Compensation 100 Index;” this demonstrates the company’s commitment to share its success with employees. In addition, the bank has included CSR as part of employees’ appraisal criteria, and assesses it on a yearly basis to ensure that CSR policies are soundly implemented from the top-down.
2. Development of sustainable environment(1) Is the company committed
toachievingefficientuseof resources, and using renewable materials that produce less impact on the environment?
V
Meanwhile, push e-office and paperless office; install stationery collection boxes to achieve more efficient utilization of resources. Promote “using love as energy” event, urging employees to ride bicycles, take mass transportation vehicles, and embrace car pooling, so as to reduce carbon emission, enhance health, and fulfill the commitment to environmental protection. Demonstrate the respect of and care for the nature and actively rally employees, their families, and clients to “use love as energy and love the earth together”.
In accordance with “Corporate Social Responsibility Best Practice Principles for TWSE/GTSM Listed Companies “.
(2) Has the company developed an appropriate environmental management system, given its distinctive characteristics?
In its formal organizational structure, the company has set up labor security and sanitation section, which adheres to the concept of “the premise for safety of environmental design and priority of precautionary measures,” in order to create a sanitary, safe, and healthy environment for Taishin Holding. The labor security and sanitation section is in charge of various tasks, including pushing of tobacco-hazard prevention law and maintenance of the quality of working environment via semiannual inspection of operating environment.(Note: The company's security measures include installing access control and security systems, as well as employing security guards in business premises. Workplace inspection is an inspection of carbon dioxide gas concentration and lighting in a workplace. )

40
Item
Operating status Deviations from “Corporate Social
Responsibility Best Practice Principles for TWSE/GTSM
Listed Companies “ and reason
Yes No Summary description
(3) Is the company aware of how climate changes affect its business activities? Are there any actions taken to measure and reduce greenhouse gas emission and energy use?
V
For environmental protection and anti-global warming, Taishin has dedicated to the environmental protection and energy conservation. During summertime, it pushes “Cool Biz”event,askingemployeestoshedgarmentduringofficetime and set air-conditioning temperature at 26 Celsius degrees. In line with the measures of Taiwan power, terminate the function of air conditioning irregularly and regularlycheckthecontractpowercapacityofvariousofficebuildings. During off hours, control the use of elevators t one side at various buildings, to cut power consumption. Install T5 energy-saving lighting fixtures for office lighting and regional power circuit, to reduce power consumption and achieve the goal of environmental protection.
In accordance with “Corporate Social Responsibility Best Practice Principles for TWSE/GTSM Listed Companies “.
3. Upholdpublicbenefits(1) Has the company developed
its policies and procedures in accordance with laws and the International Bill of Human Rights?
V
The company’s working rules have been approved by the regulator and publicized. The personnel rules are formulated according to the regulations of labor laws/decrees, for the purpose of protecting the labor rights of employees.In addition to offering fair compensation, recruitment, training and promotion opportunities and introducing safety measures for female employees, the company has issued declarations over the intranet with regards to workers’ rights and human rights, and organized physical as well as online training to raise employees’ awareness on work-life balance.
In accordance with “Corporate Social Responsibility Best Practice Principles for TWSE/GTSM Listed Companies “.
(2) Does the company have means through which employees may raise complaints? Are employee complaints being handled properly?
The company has implemented mail boxes (physical and e-mail) and phone lines exclusively for processing employees’ complaints. These complaints are handled by dedicatedemployeerelationsofficers.
(3) Does the company provide employees with a safe and healthy work environment? Are employees trained regularly on safety and health issues?
The company has a safety and health policy in place that complies with relevant laws. Safety of the work place is inspectedtwiceayear,fireequipmentandexitsareservicedyearly, and public safety is inspected every two years. First-aid kits, certified medical staff, as well as health and safety supervisors have been deployed throughout the business premises. With regards to regular health checks, the company offers benefits that exceed legal requirement standards, and subsidizes health checkups once every two years for general staff and once per year for managerial staff. In terms of training, all new recruits are required to undergo safety and health orientation upon arrival, whereas existing employees need to be re-trained once every three years.
(4) Does the company have channels to communicate with employees on a regular basis, and inform them of operational changes that may be of a significantimpact?
The company has appointed representatives as required by law to hold regular employer-employee meetings. In addition, it publishes details of internal communication onto the intranet to keep employees informed of management decisions that may be of significant impact to them. Meanwhile, employee mail boxes and hotlines have been made available as a private means to express opinions.
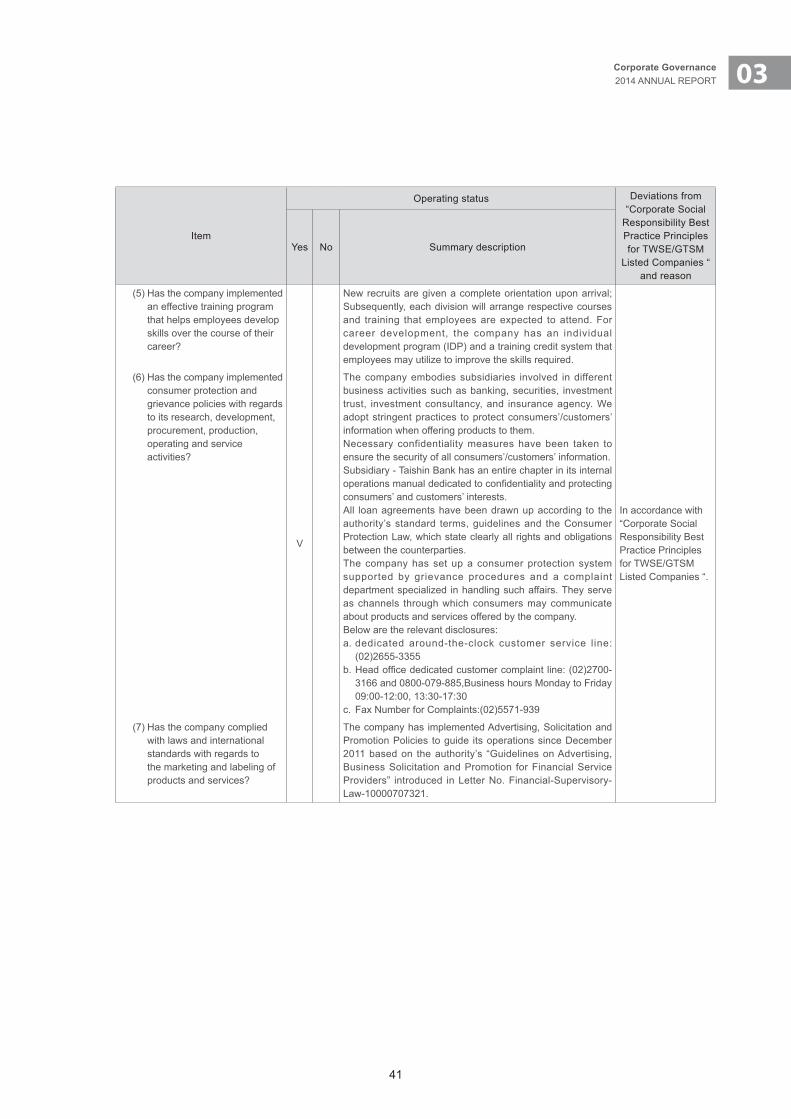
41
03Corporate Governance2014 ANNUAL REPORT
Item
Operating status Deviations from “Corporate Social
Responsibility Best Practice Principles for TWSE/GTSM
Listed Companies “ and reason
Yes No Summary description
(5) Has the company implemented an effective training program that helps employees develop skills over the course of their career?
V
New recruits are given a complete orientation upon arrival; Subsequently, each division will arrange respective courses and training that employees are expected to attend. For career development, the company has an individual development program (IDP) and a training credit system that employees may utilize to improve the skills required.
In accordance with “Corporate Social Responsibility Best Practice Principles for TWSE/GTSM Listed Companies “.
(6) Has the company implemented consumer protection and grievance policies with regards to its research, development, procurement, production, operating and service activities?
The company embodies subsidiaries involved in different business activities such as banking, securities, investment trust, investment consultancy, and insurance agency. We adopt stringent practices to protect consumers’/customers’ information when offering products to them. Necessary confidentiality measures have been taken to ensure the security of all consumers’/customers’ information.Subsidiary - Taishin Bank has an entire chapter in its internal operationsmanualdedicatedtoconfidentialityandprotectingconsumers’ and customers’ interests.All loan agreements have been drawn up according to the authority’s standard terms, guidelines and the Consumer Protection Law, which state clearly all rights and obligations between the counterparties.The company has set up a consumer protection system supported by grievance procedures and a complaint department specialized in handling such affairs. They serve as channels through which consumers may communicate about products and services offered by the company.Below are the relevant disclosures:a. dedicated around-the-clock customer service line:
(02)2655-3355b.Headofficededicatedcustomercomplaintline:(02)2700-
3166 and 0800-079-885,Business hours Monday to Friday 09:00-12:00, 13:30-17:30
c. Fax Number for Complaints:(02)5571-939
(7) Has the company complied with laws and international standards with regards to the marketing and labeling of products and services?
The company has implemented Advertising, Solicitation and Promotion Policies to guide its operations since December 2011 based on the authority’s “Guidelines on Advertising, Business Solicitation and Promotion for Financial Service Providers” introduced in Letter No. Financial-Supervisory-Law-10000707321.
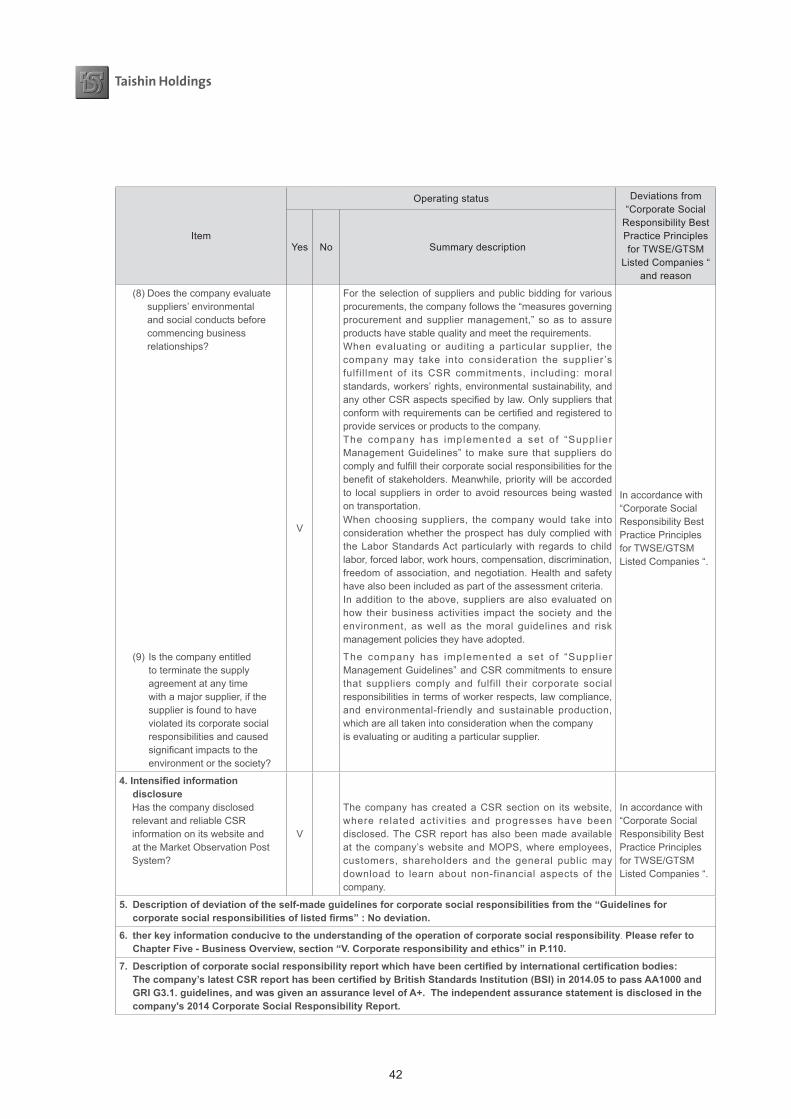
42
Item
Operating status Deviations from “Corporate Social
Responsibility Best Practice Principles for TWSE/GTSM
Listed Companies “ and reason
Yes No Summary description
(8) Does the company evaluate suppliers’ environmental and social conducts before commencing business relationships?
V
For the selection of suppliers and public bidding for various procurements, the company follows the “measures governing procurement and supplier management,” so as to assure products have stable quality and meet the requirements.When evaluating or auditing a particular supplier, the company may take into consideration the supplier ’s fulfil lment of its CSR commitments, including: moral standards, workers’ rights, environmental sustainability, and anyotherCSRaspectsspecifiedbylaw.Onlysuppliersthatconformwithrequirementscanbecertifiedandregisteredtoprovide services or products to the company. The company has implemented a set of “Suppl ier Management Guidelines” to make sure that suppliers do complyandfulfilltheircorporatesocialresponsibilitiesforthebenefitofstakeholders.Meanwhile,prioritywillbeaccordedto local suppliers in order to avoid resources being wasted on transportation.
In accordance with “Corporate Social Responsibility Best Practice Principles for TWSE/GTSM Listed Companies “.
When choosing suppliers, the company would take into consideration whether the prospect has duly complied with the Labor Standards Act particularly with regards to child labor, forced labor, work hours, compensation, discrimination, freedom of association, and negotiation. Health and safety have also been included as part of the assessment criteria. In addition to the above, suppliers are also evaluated on how their business activities impact the society and the environment, as well as the moral guidelines and risk management policies they have adopted.
(9) Is the company entitled to terminate the supply agreement at any time with a major supplier, if the supplier is found to have violated its corporate social responsibilities and caused significantimpactstotheenvironment or the society?
The company has implemented a set of “Suppl ier Management Guidelines” and CSR commitments to ensure that suppliers comply and fulfill their corporate social responsibilities in terms of worker respects, law compliance, and environmental-friendly and sustainable production, which are all taken into consideration when the companyis evaluating or auditing a particular supplier.
4.IntensifiedinformationdisclosureHas the company disclosed relevant and reliable CSR information on its website and at the Market Observation Post System?
V
The company has created a CSR section on its website, where related activit ies and progresses have been disclosed. The CSR report has also been made available at the company’s website and MOPS, where employees, customers, shareholders and the general public may download to learn about non-financial aspects of the company.
In accordance with “Corporate Social Responsibility Best Practice Principles for TWSE/GTSM Listed Companies “.
5. Description of deviation of the self-made guidelines for corporate social responsibilities from the “Guidelines for corporatesocialresponsibilitiesoflistedfirms”:Nodeviation.
6. ther key information conducive to the understanding of the operation of corporate social responsibility. Please refer to ChapterFive-BusinessOverview,section“V.Corporateresponsibilityandethics”inP.110.
7. Descriptionofcorporatesocialresponsibilityreportwhichhavebeencertifiedbyinternationalcertificationbodies: Thecompany’slatestCSRreporthasbeencertifiedbyBritishStandardsInstitution(BSI)in2014.05topassAA1000and
GRI G3.1. guidelines, and was given an assurance level of A+. The independent assurance statement is disclosed in the company's2014CorporateSocialResponsibilityReport.
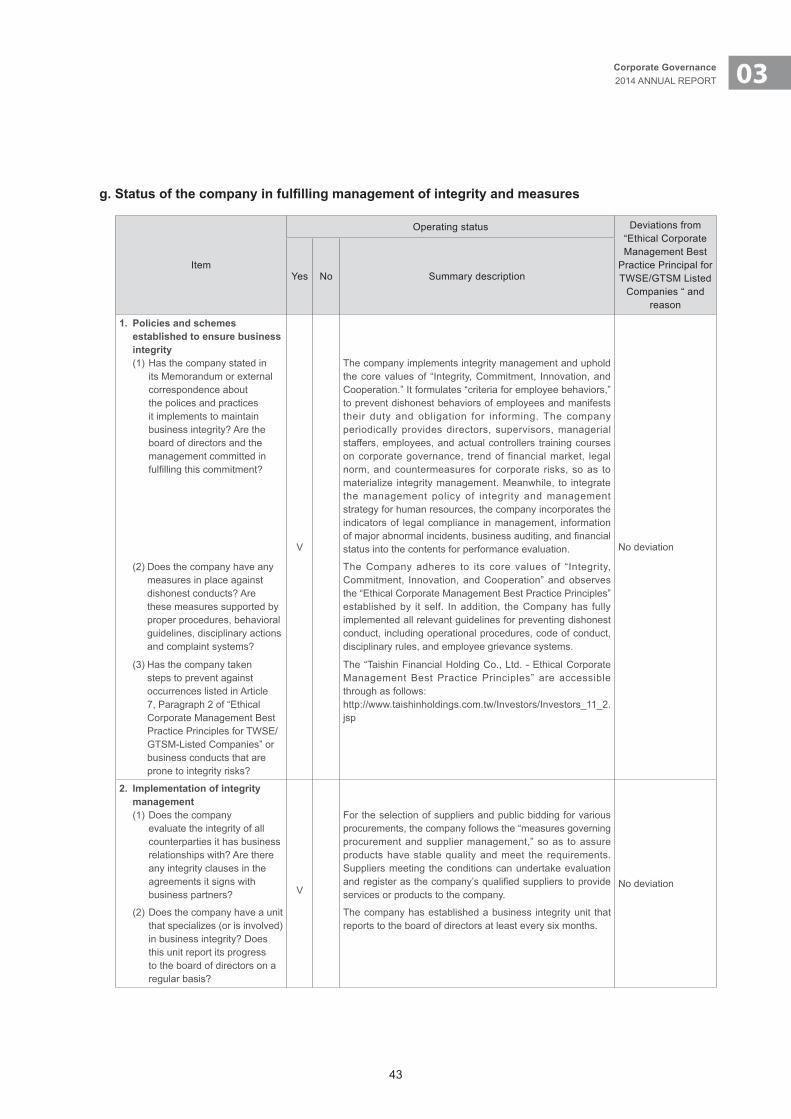
43
03Corporate Governance2014 ANNUAL REPORT
g.Statusofthecompanyinfulfillingmanagementofintegrityandmeasures
Item
Operating status Deviations from “Ethical Corporate Management Best
Practice Principal for TWSE/GTSM Listed
Companies “ and reason
Yes No Summary description
1. Policies and schemes
established to ensure business integrity(1) Has the company stated in
its Memorandum or external correspondence about the polices and practices it implements to maintain business integrity? Are the board of directors and the management committed in fulfillingthiscommitment?
V
The company implements integrity management and uphold the core values of “Integrity, Commitment, Innovation, and Cooperation.” It formulates “criteria for employee behaviors,” to prevent dishonest behaviors of employees and manifests their duty and obligation for informing. The company periodically provides directors, supervisors, managerial staffers, employees, and actual controllers training courses on corporate governance, trend of financial market, legal norm, and countermeasures for corporate risks, so as to materialize integrity management. Meanwhile, to integrate the management policy of integrity and management strategy for human resources, the company incorporates the indicators of legal compliance in management, information ofmajorabnormalincidents,businessauditing,andfinancialstatus into the contents for performance evaluation. No deviation
(2) Does the company have any measures in place against dishonest conducts? Are these measures supported by proper procedures, behavioral guidelines, disciplinary actions and complaint systems?
The Company adheres to its core values of “Integrity, Commitment, Innovation, and Cooperation” and observes the “Ethical Corporate Management Best Practice Principles” established by it self. In addition, the Company has fully implemented all relevant guidelines for preventing dishonest conduct, including operational procedures, code of conduct, disciplinary rules, and employee grievance systems.
(3) Has the company taken steps to prevent against occurrences listed in Article 7, Paragraph 2 of “Ethical Corporate Management Best Practice Principles for TWSE/GTSM-Listed Companies” or business conducts that are prone to integrity risks?
The “Taishin Financial Holding Co., Ltd. - Ethical Corporate Management Best Practice Principles” are accessible through as follows:http://www.taishinholdings.com.tw/Investors/Investors_11_2.jsp
2. Implementation of integrity management(1) Does the company
evaluate the integrity of all counterparties it has business relationships with? Are there any integrity clauses in the agreements it signs with business partners? V
For the selection of suppliers and public bidding for various procurements, the company follows the “measures governing procurement and supplier management,” so as to assure products have stable quality and meet the requirements. Suppliers meeting the conditions can undertake evaluation andregisterasthecompany’squalifiedsupplierstoprovideservices or products to the company.
No deviation
(2) Does the company have a unit that specializes (or is involved) in business integrity? Does this unit report its progress to the board of directors on a regular basis?
The company has established a business integrity unit that reports to the board of directors at least every six months.
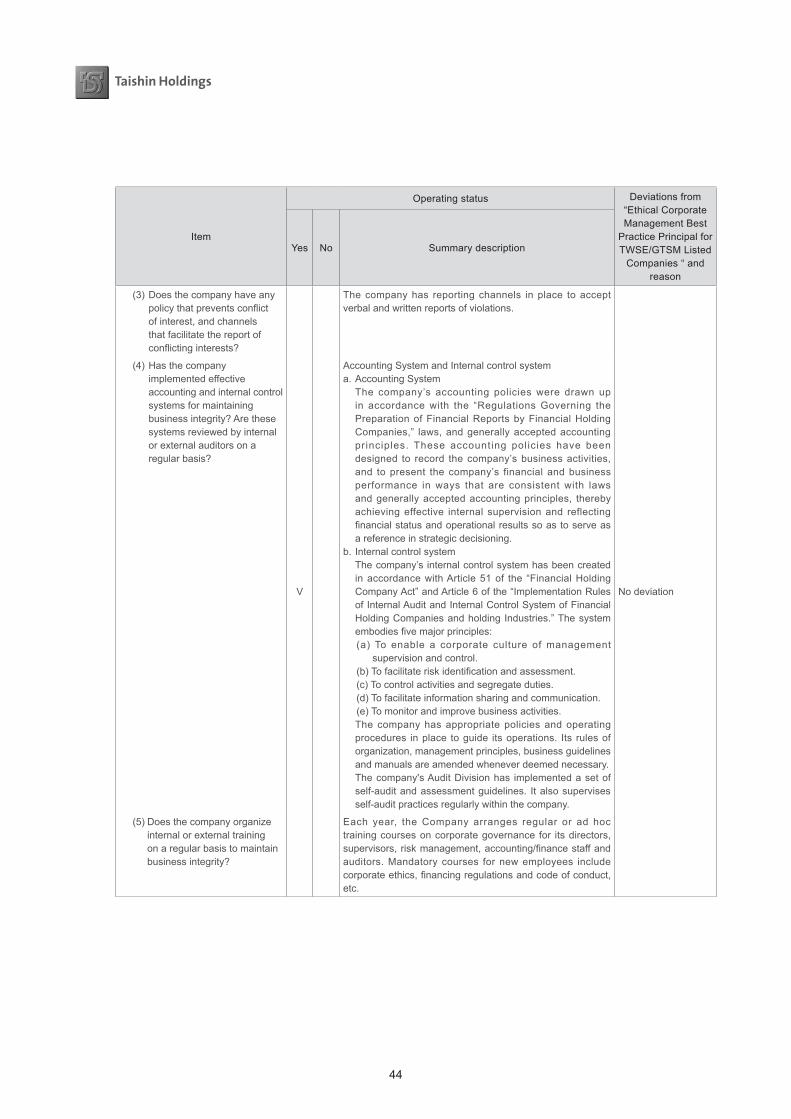
44
Item
Operating status Deviations from “Ethical Corporate Management Best
Practice Principal for TWSE/GTSM Listed
Companies “ and reason
Yes No Summary description
(3) Does the company have any policythatpreventsconflictof interest, and channels that facilitate the report of conflictinginterests?
V
The company has reporting channels in place to accept verbal and written reports of violations.
No deviation
(4) Has the company implemented effective accounting and internal control systems for maintaining business integrity? Are these systems reviewed by internal or external auditors on a regular basis?
Accounting System and Internal control systema. Accounting System The company’s accounting policies were drawn up
in accordance with the “Regulations Governing the Preparation of Financial Reports by Financial Holding Companies,” laws, and generally accepted accounting principles. These accounting policies have been designed to record the company’s business activities, and to present the company’s financial and business performance in ways that are consistent with laws and generally accepted accounting principles, thereby achieving effective internal supervision and reflecting financialstatusandoperationalresultssoastoserveasa reference in strategic decisioning.
b. Internal control system The company’s internal control system has been created
in accordance with Article 51 of the “Financial Holding Company Act” and Article 6 of the “Implementation Rules of Internal Audit and Internal Control System of Financial Holding Companies and holding Industries.” The system embodiesfivemajorprinciples:(a) To enable a corporate culture of management
supervision and control.(b)Tofacilitateriskidentificationandassessment.(c) To control activities and segregate duties.(d) To facilitate information sharing and communication.(e) To monitor and improve business activities.
The company has appropriate policies and operating procedures in place to guide its operations. Its rules of organization, management principles, business guidelines and manuals are amended whenever deemed necessary.
The company's Audit Division has implemented a set of self-audit and assessment guidelines. It also supervises self-audit practices regularly within the company.
(5) Does the company organize internal or external training on a regular basis to maintain business integrity?
Each year, the Company arranges regular or ad hoc training courses on corporate governance for its directors, supervisors,riskmanagement,accounting/financestaffandauditors. Mandatory courses for new employees include corporateethics,financingregulationsandcodeofconduct,etc.
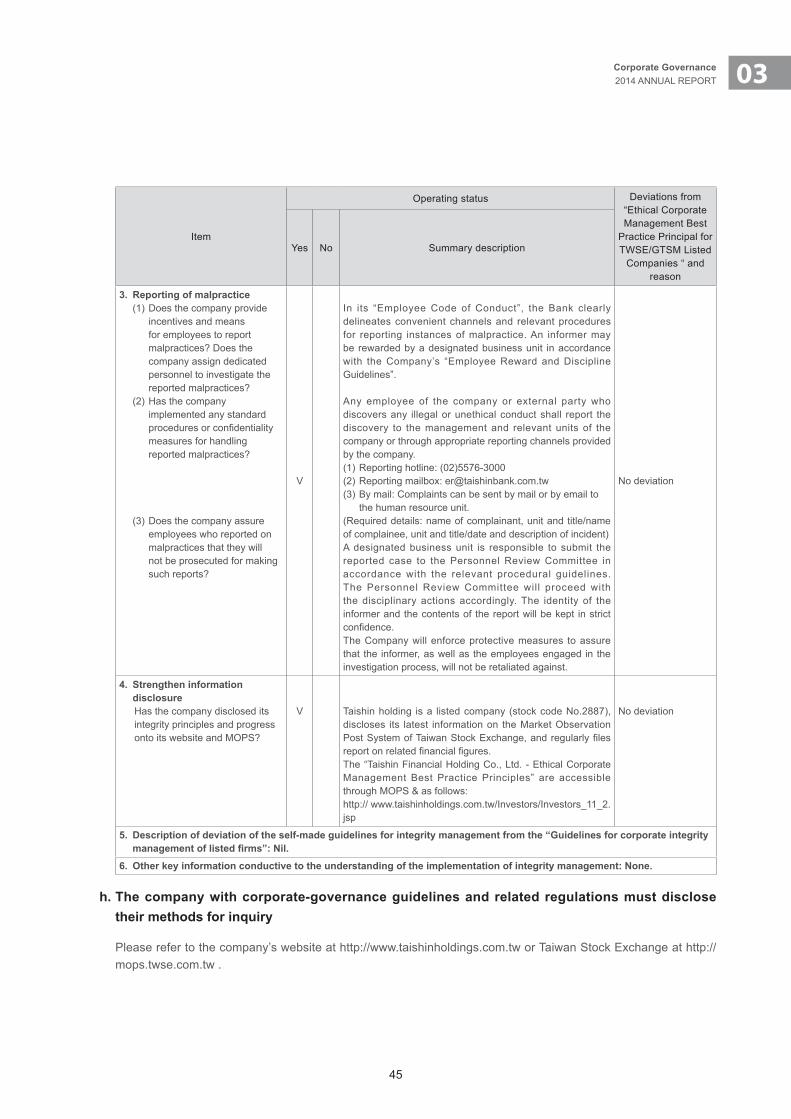
45
03Corporate Governance2014 ANNUAL REPORT
Item
Operating status Deviations from “Ethical Corporate Management Best
Practice Principal for TWSE/GTSM Listed
Companies “ and reason
Yes No Summary description
3. Reporting of malpractice (1) Does the company provide
incentives and means for employees to report malpractices? Does the company assign dedicated personnel to investigate the reported malpractices?
(2) Has the company implemented any standard proceduresorconfidentialitymeasures for handling reported malpractices?
(3) Does the company assure employees who reported on malpractices that they will not be prosecuted for making such reports?
V
In its “Employee Code of Conduct”, the Bank clearly delineates convenient channels and relevant procedures for reporting instances of malpractice. An informer may be rewarded by a designated business unit in accordance with the Company’s “Employee Reward and Discipline Guidelines”.
Any employee of the company or external party who discovers any illegal or unethical conduct shall report the discovery to the management and relevant units of the company or through appropriate reporting channels provided by the company.(1) Reporting hotline: (02)5576-3000(2) Reporting mailbox: [email protected](3) By mail: Complaints can be sent by mail or by email to
the human resource unit.(Required details: name of complainant, unit and title/name of complainee, unit and title/date and description of incident)A designated business unit is responsible to submit the reported case to the Personnel Review Committee in accordance with the relevant procedural guidelines. The Personnel Review Committee will proceed with the disciplinary actions accordingly. The identity of the informer and the contents of the report will be kept in strict confidence.The Company will enforce protective measures to assure that the informer, as well as the employees engaged in the investigation process, will not be retaliated against.
No deviation
4. Strengthen information disclosureHas the company disclosed its integrity principles and progress onto its website and MOPS?
V Taishin holding is a listed company (stock code No.2887), discloses its latest information on the Market Observation PostSystemofTaiwanStockExchange,andregularlyfilesreportonrelatedfinancialfigures.The “Taishin Financial Holding Co., Ltd. - Ethical Corporate Management Best Practice Principles” are accessible through MOPS & as follows:http:// www.taishinholdings.com.tw/Investors/Investors_11_2.jsp
No deviation
5. Description of deviation of the self-made guidelines for integrity management from the “Guidelines for corporate integrity managementoflistedfirms”:Nil.
6. Otherkeyinformationconductivetotheunderstandingoftheimplementationofintegritymanagement:None.
h. The company with corporate-governance guidelines and related regulations must disclose their methods for inquiry
Please refer to the company’s website at http://www.taishinholdings.com.tw or Taiwan Stock Exchange at http://mops.twse.com.tw .
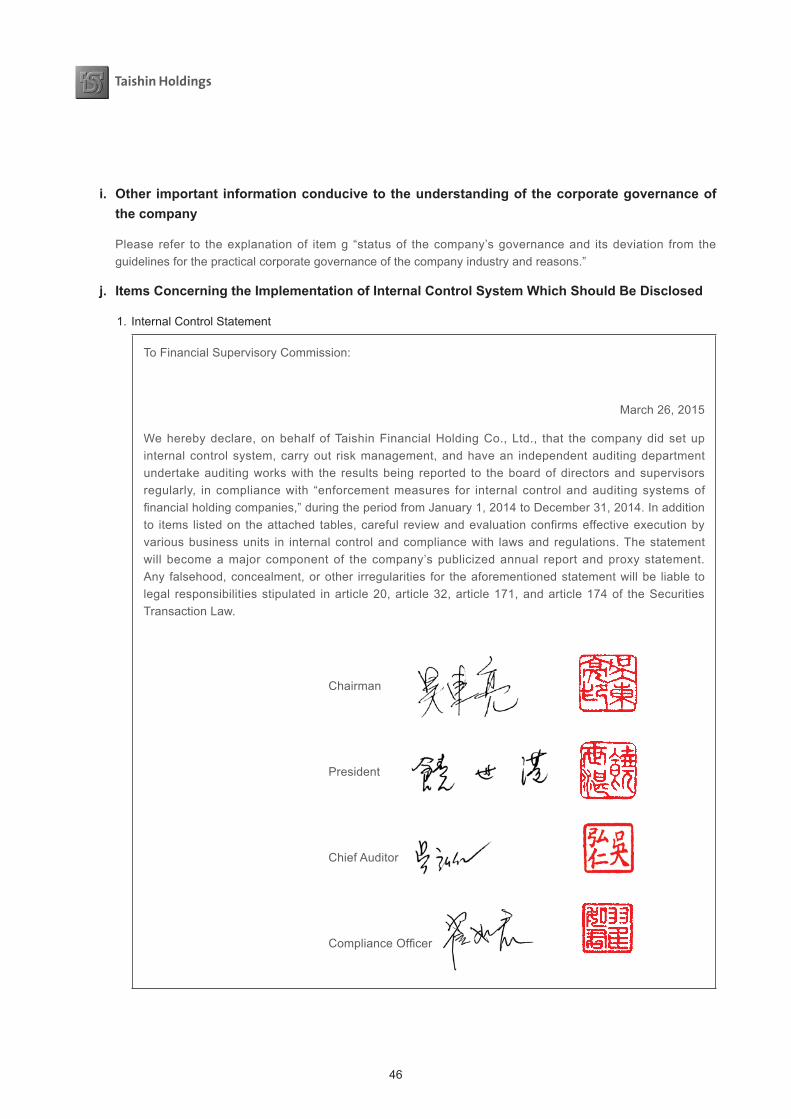
46
i. Other important information conducive to the understanding of the corporate governance of the company
Please refer to the explanation of item g “status of the company’s governance and its deviation from the guidelines for the practical corporate governance of the company industry and reasons.”
j. Items Concerning the Implementation of Internal Control System Which Should Be Disclosed
1. Internal Control Statement
To Financial Supervisory Commission:
March 26, 2015
We hereby declare, on behalf of Taishin Financial Holding Co., Ltd., that the company did set up internal control system, carry out risk management, and have an independent auditing department undertake auditing works with the results being reported to the board of directors and supervisors regularly, in compliance with “enforcement measures for internal control and auditing systems of financialholdingcompanies,”duringtheperiodfromJanuary1,2014toDecember31,2014.Inadditionto items listed on the attached tables, careful review and evaluation confirms effective execution by various business units in internal control and compliance with laws and regulations. The statement will become a major component of the company’s publicized annual report and proxy statement. Any falsehood, concealment, or other irregularities for the aforementioned statement will be liable to legal responsibilities stipulated in article 20, article 32, article 171, and article 174 of the Securities Transaction Law.
Chairman
President
Chief Auditor
ComplianceOfficer
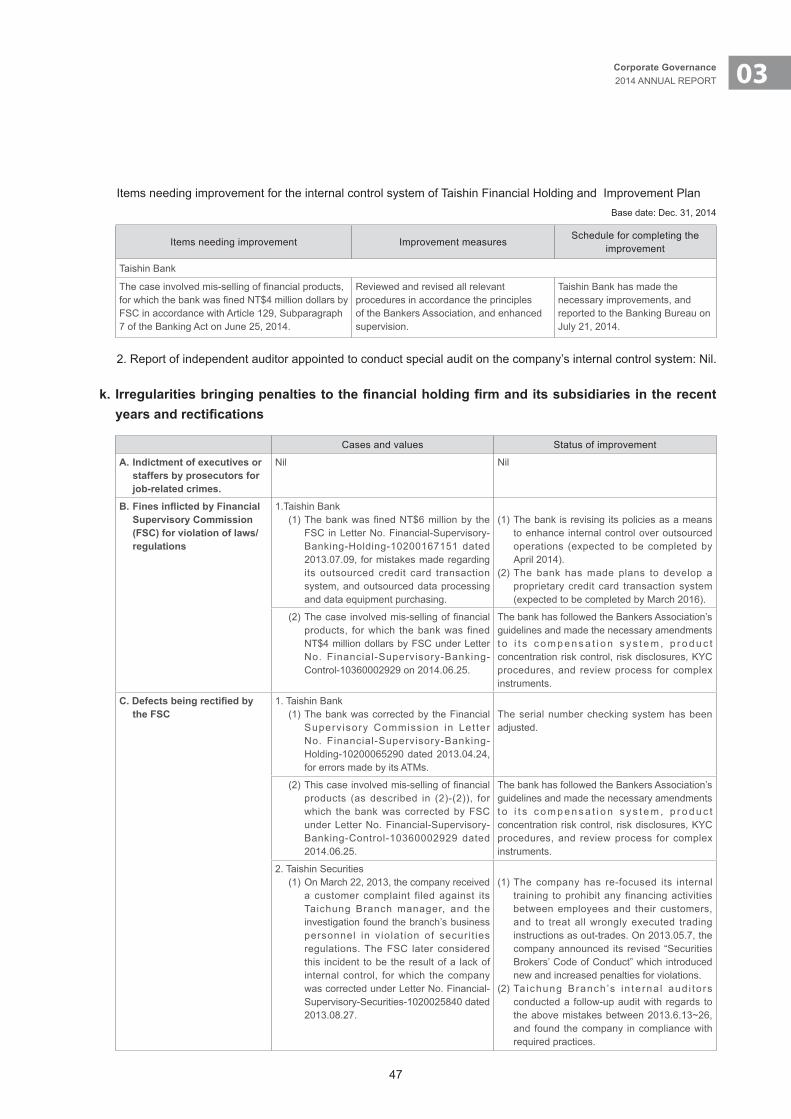
47
03Corporate Governance2014 ANNUAL REPORT
Items needing improvement for the internal control system of Taishin Financial Holding and Improvement PlanBase date: Dec. 31, 2014
Items needing improvement Improvement measuresSchedule for completing the
improvement
Taishin Bank
Thecaseinvolvedmis-sellingoffinancialproducts,forwhichthebankwasfinedNT$4milliondollarsbyFSC in accordance with Article 129, Subparagraph 7 of the Banking Act on June 25, 2014.
Reviewed and revised all relevant procedures in accordance the principles of the Bankers Association, and enhanced supervision.
Taishin Bank has made the necessary improvements, and reported to the Banking Bureau on July 21, 2014.
2. Report of independent auditor appointed to conduct special audit on the company’s internal control system: Nil.
k.Irregularitiesbringingpenaltiestothefinancialholdingfirmanditssubsidiariesintherecentyearsandrectifications
Cases and values Status of improvement
A. Indictment of executives or staffers by prosecutors for job-related crimes.
Nil Nil
B.FinesinflictedbyFinancialSupervisory Commission (FSC) for violation of laws/regulations
1.Taishin Bank(1) The bank was fined NT$6 million by the
FSC in Letter No. Financial-Supervisory-Banking-Holding-10200167151 dated 2013.07.09, for mistakes made regarding its outsourced credit card transaction system, and outsourced data processing and data equipment purchasing.
(1) The bank is revising its policies as a means to enhance internal control over outsourced operations (expected to be completed by April 2014).
(2) The bank has made plans to develop a proprietary credit card transaction system (expected to be completed by March 2016).
(2)Thecaseinvolvedmis-sellingoffinancialproducts, for which the bank was fined NT$4 million dollars by FSC under Letter No. Financial-Supervisory-Banking-Control-10360002929 on 2014.06.25.
The bank has followed the Bankers Association’s guidelines and made the necessary amendments t o i t s c o m p e n s a t i o n s y s t e m , p r o d u c t concentration risk control, risk disclosures, KYC procedures, and review process for complex instruments.
C.Defectsbeingrectifiedbythe FSC
1. Taishin Bank(1) The bank was corrected by the Financial
Superv isory Commiss ion in Let ter No. Financial-Supervisory-Banking-Holding-10200065290 dated 2013.04.24, for errors made by its ATMs.
The serial number checking system has been adjusted.
(2)Thiscaseinvolvedmis-sellingoffinancialproducts (as described in (2)-(2)), for which the bank was corrected by FSC under Letter No. Financial-Supervisory-Banking-Control-10360002929 dated 2014.06.25.
The bank has followed the Bankers Association’s guidelines and made the necessary amendments t o i t s c o m p e n s a t i o n s y s t e m , p r o d u c t concentration risk control, risk disclosures, KYC procedures, and review process for complex instruments.
2. Taishin Securities(1) On March 22, 2013, the company received
a customer complaint filed against its Taichung Branch manager, and the investigation found the branch’s business personnel in violat ion of securi t ies regulations. The FSC later considered this incident to be the result of a lack of internal control, for which the company was corrected under Letter No. Financial-Supervisory-Securities-1020025840 dated 2013.08.27.
(1) The company has re-focused its internal training to prohibit any financing activities between employees and their customers, and to treat all wrongly executed trading instructions as out-trades. On 2013.05.7, the company announced its revised “Securities Brokers’ Code of Conduct” which introduced new and increased penalties for violations.
(2) Ta ichung Branch ’s in te rna l aud i to rs conducted a follow-up audit with regards to the above mistakes between 2013.6.13~26, and found the company in compliance with required practices.
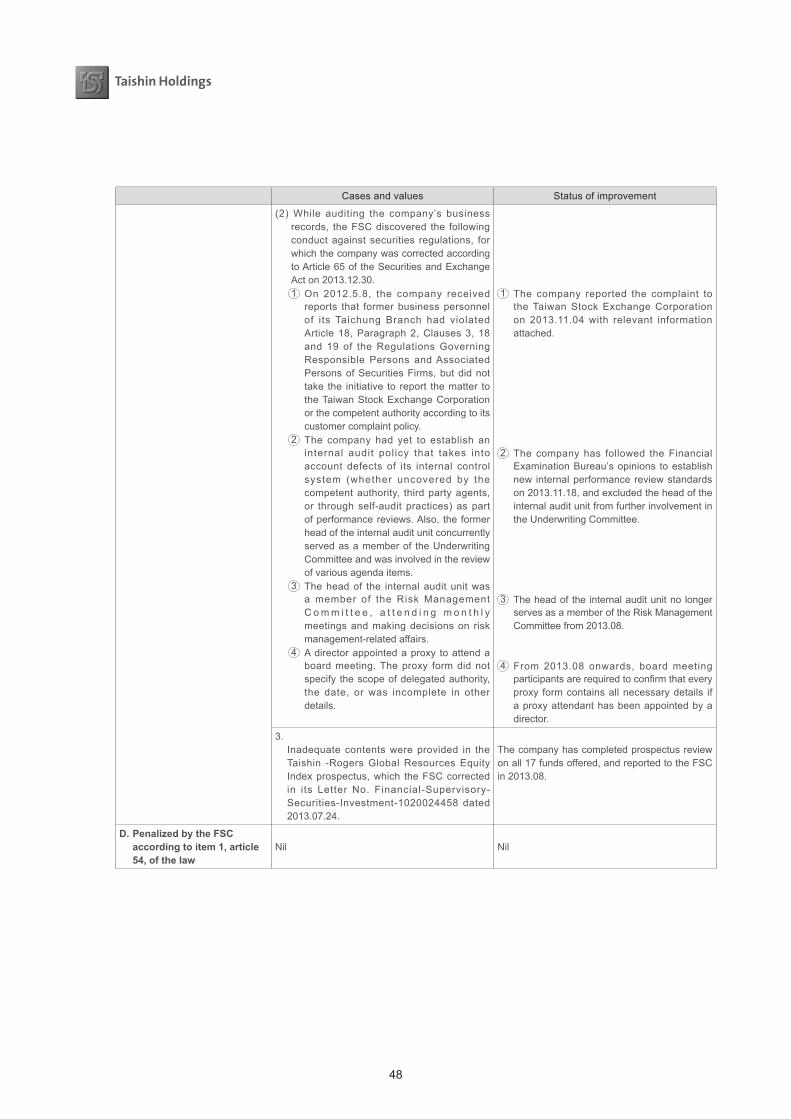
48
Cases and values Status of improvement
(2) While auditing the company’s business records, the FSC discovered the following conduct against securities regulations, for which the company was corrected according to Article 65 of the Securities and Exchange Act on 2013.12.30. 1 On 2012.5.8, the company received
reports that former business personnel of its Taichung Branch had violated Article 18, Paragraph 2, Clauses 3, 18 and 19 of the Regulations Governing Responsible Persons and Associated Persons of Securities Firms, but did not take the initiative to report the matter to the Taiwan Stock Exchange Corporation or the competent authority according to its customer complaint policy.
2 The company had yet to establish an internal audit policy that takes into account defects of its internal control system (whether uncovered by the competent authority, third party agents, or through self-audit practices) as part of performance reviews. Also, the former head of the internal audit unit concurrently served as a member of the Underwriting Committee and was involved in the review of various agenda items.
3 The head of the internal audit unit was a member of the Risk Management C o m m i t t e e , a t t e n d i n g m o n t h l y meetings and making decisions on risk management-related affairs.
4 A director appointed a proxy to attend a board meeting. The proxy form did not specify the scope of delegated authority, the date, or was incomplete in other details.
1 The company reported the complaint to the Taiwan Stock Exchange Corporation on 2013.11.04 with relevant information attached.
2 The company has followed the Financial Examination Bureau’s opinions to establish new internal performance review standards on 2013.11.18, and excluded the head of the internal audit unit from further involvement in the Underwriting Committee.
3 The head of the internal audit unit no longer serves as a member of the Risk Management Committee from 2013.08.
4 From 2013.08 onwards, board meeting participantsarerequiredtoconfirmthateveryproxy form contains all necessary details if a proxy attendant has been appointed by a director.
3. Inadequate contents were provided in the
Taishin -Rogers Global Resources Equity Index prospectus, which the FSC corrected in its Letter No. Financial-Supervisory-Securities-Investment-1020024458 dated 2013.07.24.
The company has completed prospectus review on all 17 funds offered, and reported to the FSC in 2013.08.
D. Penalized by the FSC according to item 1, article 54, of the law
Nil Nil

49
03Corporate Governance2014 ANNUAL REPORT
Cases and values Status of improvement
E. For individual or combined lossexceedingNT$50million in value which results of personnel corruption, major incidents (fraud, burglary, embezzlement and stealth of assets, fraudulent transaction, forged certificatesandsecurities,collection of feedback, damage of natural disaster, damage of external force, hacker attack and stealth of information, and leakage of confidentialbusinessandcustomer information) or security incidents resulting from failing to abide by guidelines for security maintenanceoffinancialinstitutions, disclose its nature and loss amount.
Nil Nil
G. Other items mandated by the FSC for disclosure
Taishin bankAn application submitted by a DBU of the bank to the Central Bank to be a foreign exchange branch contained false information regarding employees’ backgrounds, for which the Central Bank suspended foreign currency transactions between 2013.05.29 and 2013.11.28, in its Letter No. ROC-Central Bank-Foreign-VII-1020022757 dated 2013.05.27.
The re levant operat ing procedures and management practices have been adjusted.
l. Major resolutions of the shareholder’s meeting and the board of directors in the recent year and as of the date of the publication of the annual report
1. Key resolutions of the 2014 annual general meeting (dated 2014.06.06) and execution progress
ResolutionVotes
Current progressVotes in favor % Votes against % Votes in favor %
1. Acknowledged the company’s 2013 business report and financialstatements.
4,438,174,170 83.95 593,483 0.01 848,080,614 16.04Submitted to the authority for acknowledgment on 2014.06.13.
2. Acknowledged the company’s 2013 earnings appropriation.
4,467,596,195 84.50 629,065 0.01 818,623,007 15.48Cash and stock dividends distributed on 2014.09.05.
3. Discussion regarding issuance of new shares against capitalized earnings.
4,467,318,758 84.48 770,839 0.01 819,641,624 15.50
Resolution has been approved by and registered with the Ministry of Economic Affairs on 2014.08.29.
4. Changes to the company’s “Articles of Incorporation.”
4,459,958,952 84.35 7,069,344 0.13 820,702,925 15.52
Resolution has been approved by and registered with the Ministry of Economic Affairs on 2014.07.02.
5. Amendments to the company’s “Asset Acquisition or Disposal Procedures.”
4,466,316,423 84.47 725,010 0.01 820,689,788 15.52Information was published onto the Market Observation Post System on 2014.06.06.

50
2. Major resolutions of the the board of directors on 2014
2014.01.23 Passed the company’s 2014 operating plans and budgets. 2014.01.23 Passed the company’s “Personal Information Security Policy.” 2014.02.20 Passed to convene the 2014 annual general meeting on 2014.06.06 (including Class D preferred
shareholders). 2014.03.27 Appointed Fu-Hui Liang as the head of the company’s Human Resources Division. 2014.03.27 Passedthecompany’s2013financialstatements.2014.04.24 Passedthecompany’s2013auditedfinancialstatements.2014.04.24 Passed the partial amendments made to the company’s “Articles of Incorporation.” 2014.04.24 Passed the company’s 2013 business report. 2014.04.24 Passed the company’s 2013 earnings appropriation. 2014.04.24 Passed the issuance of new shares against capitalized earnings. 2014.04.24 Passed amendments to the company’s“Handling Procedures for Acquisition or Disposal of
Assets.”2014.04.24 Passed to subscribe all new ordinary shares issued by subsidiary - Taishin Bank in a private
placement. 2014.05.22 Made changes to the previous decision of subscribing all new ordinary shares issued by
subsidiary - Taishin Bank in a private placement in 2014. 2014.07.24 Passed to set the ex-right date, ex-dividend date, cash issue date, and payment date for the
company’s 2013 earnings appropriation, for ordinary shares and preferred shares D. 2014.08.21 Passed to subscribe to new ordinary shares issued by subsidiary - Taishin Venture Capital, up to
a maximum of NT$500 million. 2014.10.30 Passed to subscribe to all new ordinary shares issued by subsidiary - Taishin Securities. 2014.10.30 Passed to subscribe to all new ordinary shares issued by subsidiary - Taishin Venture Capital. 2014.10.30 Passed to establish the company’s “Corporate Governance Principles,” “Business Integrity
Principles,” “Corporate Social Responsibility Principles,” and “Regulatory Compliance Policy.” 2014.11.13 Passed to appoint representatives to participate in Chang Hwa Bank’s 24th board of directors
election. 2014.11.27 Passed to establish the company’s “Anti-money Laundering and Counter Terrorist Financing
Policy.” 2014.12.25 Passed to recognize NT$14,775,666,267 of investment losses in Chang Hwa Bank.
3. Major resolutions of the the board of directors on 2015
2015.01.22 Passed the company’s 2015 operating plans and budgets. 2015.03.05 Passed the company’s statements and plans regarding its loss of control over Chang Hwa Bank. 2015.03.05 Passed to convene the 2015 annual general meeting on 2015.06.12 (including Class D preferred
shareholders). 2015.03.26 Passedthecompany’s2014financialstatements.2015.04.30 Passed2014financialstatements,2014businessreport,2014dividenddistributionproposaland
cash dividends to be paid by capital surplus.2015.04.30 Passed amendments to the company’s “Articles of Incorporation,” “Rules of Procedure for
Shareholder Meetings,” “Director and Supervisor Election Policy,” and “Handling Procedures for Acquisition or Disposal of Assets.”
2015.04.30 Passed a resolution to elect six directors and three independent directors (sixth board) during the shareholders meeting. Passed a resolution to submit proposals to the shareholders meeting to remove the non-competition restriction for directors (on the sixth board of directors) and to review qualificationsofindependentdirectors.
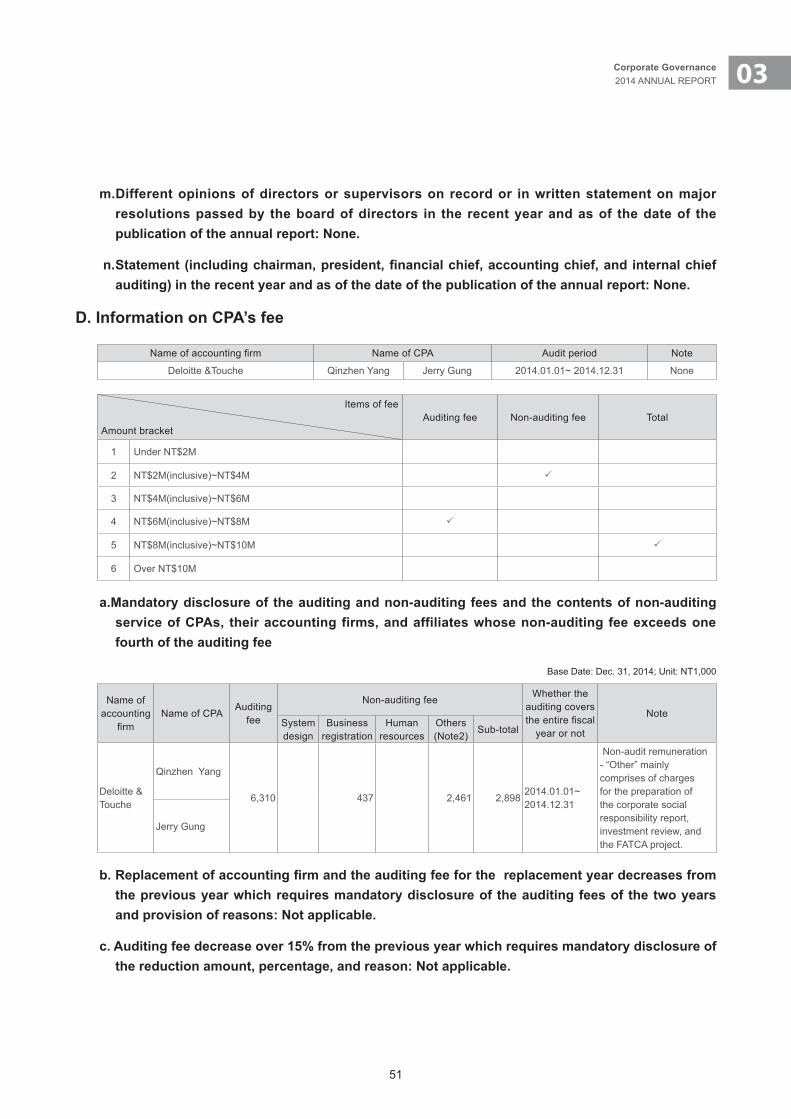
51
03Corporate Governance2014 ANNUAL REPORT
m.Different opinions of directors or supervisors on record or in written statement on major resolutions passed by the board of directors in the recent year and as of the date of the publicationoftheannualreport:None.
n.Statement(includingchairman,president,financialchief,accountingchief,andinternalchiefauditing)intherecentyearandasofthedateofthepublicationoftheannualreport:None.
D. Information on CPA’s fee
Nameofaccountingfirm Name of CPA Audit period Note
Deloitte &Touche Qinzhen Yang Jerry Gung 2014.01.01~ 2014.12.31 None
Items of fee
Amount bracketAuditing fee Non-auditing fee Total
1 Under NT$2M
2 NT$2M(inclusive)~NT$4M P
3 NT$4M(inclusive)~NT$6M
4 NT$6M(inclusive)~NT$8M P
5 NT$8M(inclusive)~NT$10M P
6 Over NT$10M
a.Mandatory disclosure of the auditing and non-auditing fees and the contents of non-auditing service of CPAs, their accounting firms, and affiliates whose non-auditing fee exceeds one fourth of the auditing fee
Base Date: Dec. 31, 2014; Unit: NT1,000
Name of accounting
firmName of CPA
Auditing fee
Non-auditing fee Whether the auditing covers theentirefiscal
year or not
NoteSystem design
Business registration
Human resources
Others (Note2)
Sub-total
Deloitte & Touche
Qinzhen Yang
6,310 437 2,461 2,8982014.01.01~2014.12.31
Non-audit remuneration - “Other” mainly comprises of charges for the preparation of the corporate social responsibility report, investment review, and the FATCA project.
Jerry Gung
b.Replacementofaccountingfirmandtheauditingfeeforthereplacementyeardecreasesfromthe previous year which requires mandatory disclosure of the auditing fees of the two years andprovisionofreasons:Notapplicable.
c. Auditing fee decrease over 15% from the previous year which requires mandatory disclosure of thereductionamount,percentage,andreason:Notapplicable.
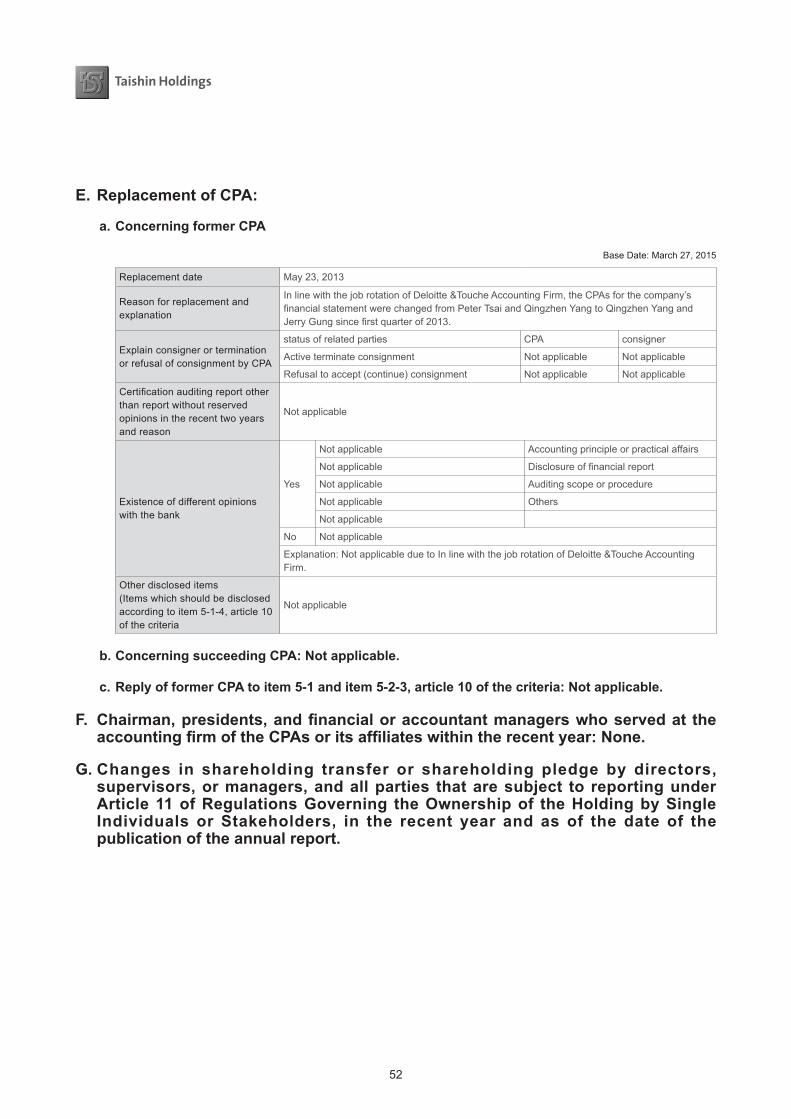
52
E.ReplacementofCPA:
a. Concerning former CPA
Base Date: March 27, 2015
Replacement date May 23, 2013
Reason for replacement and explanation
In line with the job rotation of Deloitte &Touche Accounting Firm, the CPAs for the company’s financialstatementwerechangedfromPeterTsaiandQingzhenYangtoQingzhenYangandJerryGungsincefirstquarterof2013.
Explain consigner or termination or refusal of consignment by CPA
status of related parties CPA consigner
Active terminate consignment Not applicable Not applicable
Refusal to accept (continue) consignment Not applicable Not applicable
Certificationauditingreportotherthan report without reserved opinions in the recent two years and reason
Not applicable
Existence of different opinions with the bank
Yes
Not applicable Accounting principle or practical affairs
Not applicable Disclosureoffinancialreport
Not applicable Auditing scope or procedure
Not applicable Others
Not applicable
No Not applicable
Explanation: Not applicable due to In line with the job rotation of Deloitte &Touche Accounting Firm.
Other disclosed items (Items which should be disclosed according to item 5-1-4, article 10 of the criteria
Not applicable
b.ConcerningsucceedingCPA:Notapplicable.
c.ReplyofformerCPAtoitem5-1anditem5-2-3,article10ofthecriteria:Notapplicable.
F. Chairman,presidents,andfinancialoraccountantmanagerswhoservedattheaccountingfirmoftheCPAsoritsaffiliateswithintherecentyear:None.
G. Changes in shareholding transfer or shareholding pledge by directors, supervisors, or managers, and all parties that are subject to reporting under Article 11 of Regulations Governing the Ownership of the Holding by Single Individuals or Stakeholders, in the recent year and as of the date of the publication of the annual report.
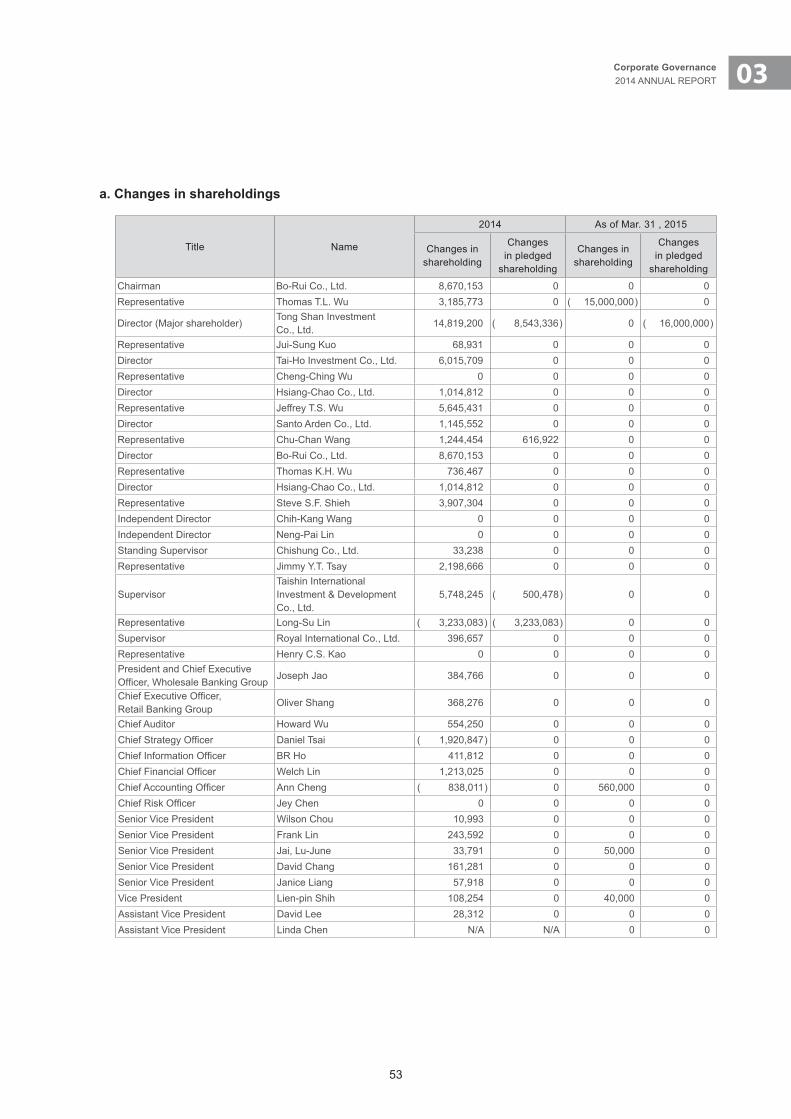
53
03Corporate Governance2014 ANNUAL REPORT
a. Changes in shareholdings
Title Name
2014 As of Mar. 31 , 2015
Changes in shareholding
Changes in pledged
shareholding
Changes in shareholding
Changes in pledged
shareholding
Chairman Bo-Rui Co., Ltd. 8,670,153 0 0 0Representative Thomas T.L. Wu 3,185,773 0 ( 15,000,000 ) 0
Director (Major shareholder)Tong Shan Investment Co., Ltd.
14,819,200 ( 8,543,336 ) 0 ( 16,000,000 )
Representative Jui-Sung Kuo 68,931 0 0 0Director Tai-Ho Investment Co., Ltd. 6,015,709 0 0 0Representative Cheng-Ching Wu 0 0 0 0Director Hsiang-Chao Co., Ltd. 1,014,812 0 0 0Representative Jeffrey T.S. Wu 5,645,431 0 0 0Director Santo Arden Co., Ltd. 1,145,552 0 0 0Representative Chu-Chan Wang 1,244,454 616,922 0 0Director Bo-Rui Co., Ltd. 8,670,153 0 0 0Representative Thomas K.H. Wu 736,467 0 0 0Director Hsiang-Chao Co., Ltd. 1,014,812 0 0 0Representative Steve S.F. Shieh 3,907,304 0 0 0Independent Director Chih-Kang Wang 0 0 0 0Independent Director Neng-Pai Lin 0 0 0 0Standing Supervisor Chishung Co., Ltd. 33,238 0 0 0Representative Jimmy Y.T. Tsay 2,198,666 0 0 0
SupervisorTaishin International Investment & Development Co., Ltd.
5,748,245 ( 500,478 ) 0 0
Representative Long-Su Lin ( 3,233,083 ) ( 3,233,083 ) 0 0Supervisor Royal International Co., Ltd. 396,657 0 0 0Representative Henry C.S. Kao 0 0 0 0President and Chief Executive Officer,WholesaleBankingGroup
Joseph Jao 384,766 0 0 0
ChiefExecutiveOfficer,Retail Banking Group
Oliver Shang 368,276 0 0 0
Chief Auditor Howard Wu 554,250 0 0 0ChiefStrategyOfficer Daniel Tsai ( 1,920,847 ) 0 0 0ChiefInformationOfficer BR Ho 411,812 0 0 0ChiefFinancialOfficer Welch Lin 1,213,025 0 0 0ChiefAccountingOfficer Ann Cheng ( 838,011 ) 0 560,000 0ChiefRiskOfficer Jey Chen 0 0 0 0Senior Vice President Wilson Chou 10,993 0 0 0Senior Vice President Frank Lin 243,592 0 0 0Senior Vice President Jai, Lu-June 33,791 0 50,000 0Senior Vice President David Chang 161,281 0 0 0Senior Vice President Janice Liang 57,918 0 0 0Vice President Lien-pin Shih 108,254 0 40,000 0Assistant Vice President David Lee 28,312 0 0 0Assistant Vice President Linda Chen N/A N/A 0 0
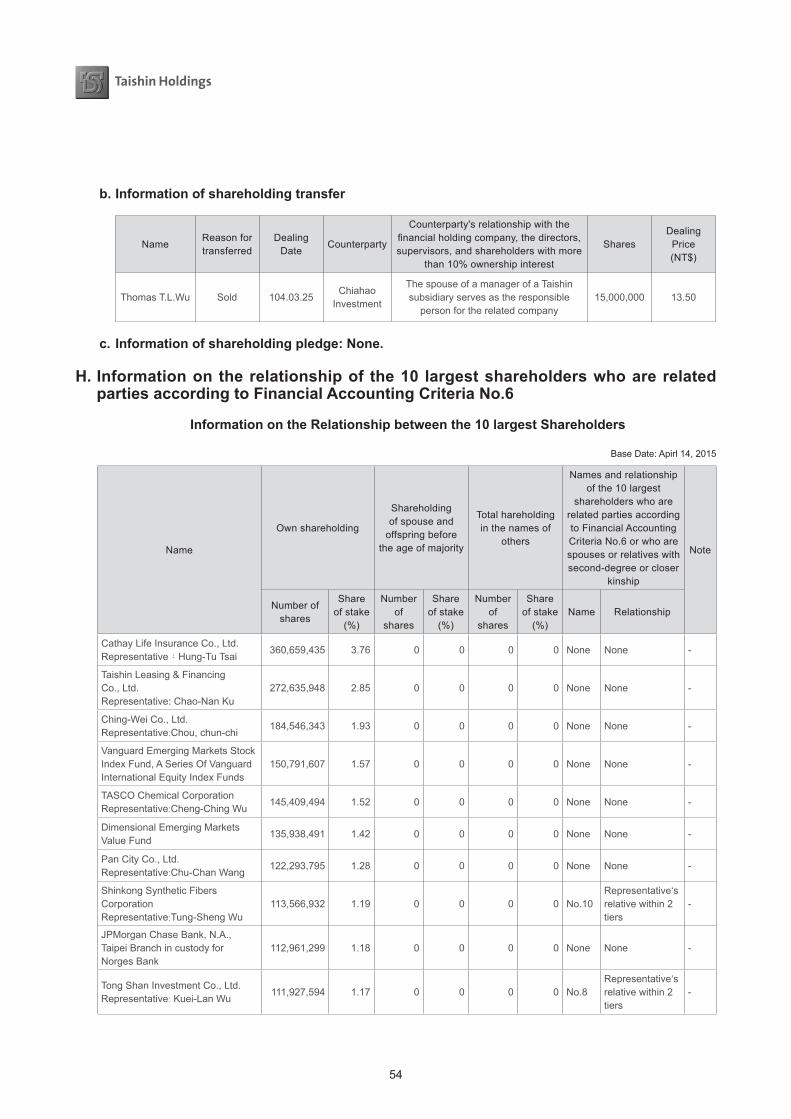
54
b. Information of shareholding transfer
NameReason fortransferred
DealingDate
Counterparty
Counterparty's relationship with the financialholdingcompany,thedirectors,supervisors, and shareholders with more
than 10% ownership interest
SharesDealing
Price(NT$)
Thomas T.L.Wu Sold 104.03.25Chiahao
Investment
The spouse of a manager of a Taishin subsidiary serves as the responsible
person for the related company15,000,000 13.50
c.Informationofshareholdingpledge:None.
H.Informationontherelationshipof the10 largestshareholderswhoarerelatedparties according to Financial Accounting Criteria No.6
InformationontheRelationshipbetweenthe10largestShareholders
Base Date: Apirl 14, 2015
Name
Own shareholding
Shareholding of spouse and
offspring before the age of majority
Total hareholding in the names of
others
Names and relationship of the 10 largest
shareholders who are related parties according to Financial Accounting Criteria No.6 or who are spouses or relatives with second-degree or closer
kinship
Note
Number of shares
Share of stake
(%)
Number of
shares
Share of stake
(%)
Number of
shares
Share of stake
(%)Name Relationship
Cathay Life Insurance Co., Ltd.Representative:Hung-Tu Tsai
360,659,435 3.76 0 0 0 0 None None -
Taishin Leasing & Financing Co., Ltd.Representative: Chao-Nan Ku
272,635,948 2.85 0 0 0 0 None None -
Ching-Wei Co., Ltd.Representative:Chou, chun-chi
184,546,343 1.93 0 0 0 0 None None -
Vanguard Emerging Markets Stock Index Fund, A Series Of Vanguard International Equity Index Funds
150,791,607 1.57 0 0 0 0 None None -
TASCO Chemical CorporationRepresentative:Cheng-Ching Wu
145,409,494 1.52 0 0 0 0 None None -
Dimensional Emerging Markets Value Fund
135,938,491 1.42 0 0 0 0 None None -
Pan City Co., Ltd. Representative:Chu-Chan Wang
122,293,795 1.28 0 0 0 0 None None -
Shinkong Synthetic Fibers CorporationRepresentative:Tung-Sheng Wu
113,566,932 1.19 0 0 0 0 No.10Representative‘s relative within 2 tiers
-
JPMorgan Chase Bank, N.A., Taipei Branch in custody for Norges Bank
112,961,299 1.18 0 0 0 0 None None -
Tong Shan Investment Co., Ltd.Representative: Kuei-Lan Wu
111,927,594 1.17 0 0 0 0 No.8Representative‘s relative within 2 tiers
-
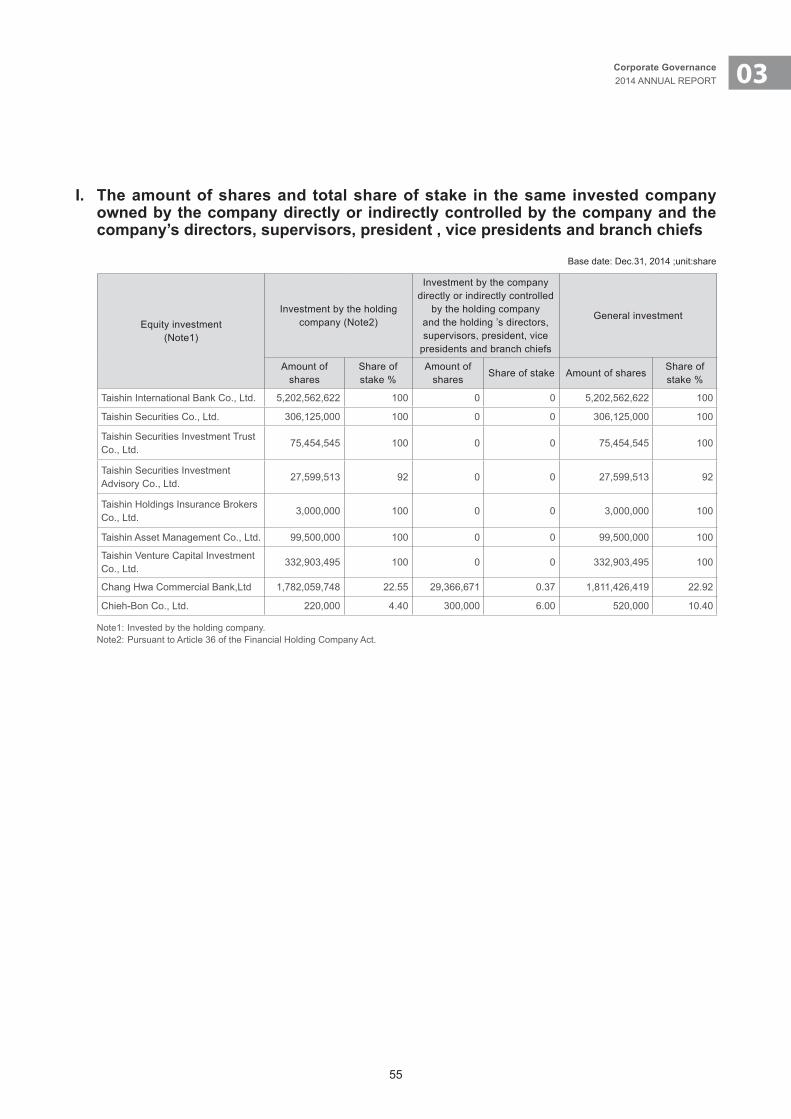
55
03Corporate Governance2014 ANNUAL REPORT
I. The amount of shares and total share of stake in the same invested company owned by the company directly or indirectly controlled by the company and the company’s directors, supervisors, president , vice presidents and branch chiefs
Base date: Dec.31, 2014 ;unit:share
Equity investment(Note1)
Investment by the holding company (Note2)
Investment by the companydirectly or indirectly controlled
by the holding company and the holding ’s directors, supervisors, president, vice
presidents and branch chiefs
General investment
Amount of shares
Share of stake %
Amount of shares
Share of stake Amount of shares Share of stake %
Taishin International Bank Co., Ltd. 5,202,562,622 100 0 0 5,202,562,622 100
Taishin Securities Co., Ltd. 306,125,000 100 0 0 306,125,000 100
Taishin Securities Investment Trust Co., Ltd.
75,454,545 100 0 0 75,454,545 100
Taishin Securities Investment Advisory Co., Ltd.
27,599,513 92 0 0 27,599,513 92
Taishin Holdings Insurance Brokers Co., Ltd.
3,000,000 100 0 0 3,000,000 100
Taishin Asset Management Co., Ltd. 99,500,000 100 0 0 99,500,000 100
Taishin Venture Capital Investment Co., Ltd.
332,903,495 100 0 0 332,903,495 100
Chang Hwa Commercial Bank,Ltd 1,782,059,748 22.55 29,366,671 0.37 1,811,426,419 22.92
Chieh-Bon Co., Ltd. 220,000 4.40 300,000 6.00 520,000 10.40
Note1: Invested by the holding company.Note2: Pursuant to Article 36 of the Financial Holding Company Act.


04Fund-Raising Activities
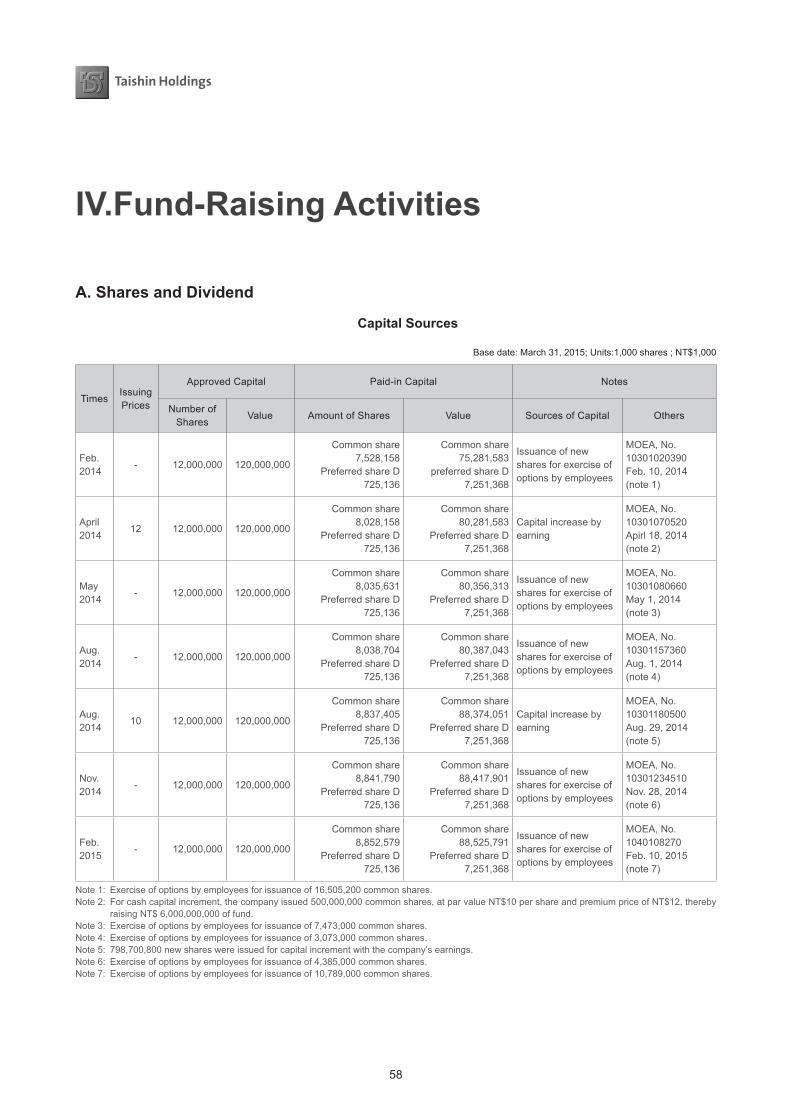
58
IV.Fund-Raising Activities
A. Shares and Dividend
Capital Sources
Base date: March 31, 2015; Units:1,000 shares ; NT$1,000
TimesIssuing Prices
Approved Capital Paid-in Capital Notes
Number of Shares
Value Amount of Shares Value Sources of Capital Others
Feb.2014
- 12,000,000 120,000,000
Common share 7,528,158
Preferred share D725,136
Common share 75,281,583
preferred share D7,251,368
Issuance of new shares for exercise of options by employees
MOEA, No. 10301020390Feb. 10, 2014(note 1)
April 2014
12 12,000,000 120,000,000
Common share 8,028,158
Preferred share D725,136
Common share 80,281,583
Preferred share D7,251,368
Capital increase by earning
MOEA, No. 10301070520Apirl 18, 2014(note 2)
May2014
- 12,000,000 120,000,000
Common share 8,035,631
Preferred share D725,136
Common share 80,356,313
Preferred share D7,251,368
Issuance of new shares for exercise of options by employees
MOEA, No. 10301080660May 1, 2014(note 3)
Aug.2014
- 12,000,000 120,000,000
Common share 8,038,704
Preferred share D725,136
Common share 80,387,043
Preferred share D7,251,368
Issuance of new shares for exercise of options by employees
MOEA, No. 10301157360Aug. 1, 2014(note 4)
Aug.2014
10 12,000,000 120,000,000
Common share 8,837,405
Preferred share D725,136
Common share 88,374,051
Preferred share D7,251,368
Capital increase by earning
MOEA, No. 10301180500Aug. 29, 2014(note 5)
Nov.2014
- 12,000,000 120,000,000
Common share 8,841,790
Preferred share D725,136
Common share 88,417,901
Preferred share D7,251,368
Issuance of new shares for exercise of options by employees
MOEA, No. 10301234510Nov. 28, 2014(note 6)
Feb.2015
- 12,000,000 120,000,000
Common share 8,852,579
Preferred share D725,136
Common share 88,525,791
Preferred share D7,251,368
Issuance of new shares for exercise of options by employees
MOEA, No. 1040108270Feb. 10, 2015(note 7)
Note 1: Exercise of options by employees for issuance of 16,505,200 common shares. Note 2: For cash capital increment, the company issued 500,000,000 common shares, at par value NT$10 per share and premium price of NT$12, thereby
raising NT$ 6,000,000,000 of fund.Note 3: Exercise of options by employees for issuance of 7,473,000 common shares.Note 4: Exercise of options by employees for issuance of 3,073,000 common shares.Note 5: 798,700,800 new shares were issued for capital increment with the company’s earnings.Note 6: Exercise of options by employees for issuance of 4,385,000 common shares.Note 7: Exercise of options by employees for issuance of 10,789,000 common shares.

59
04Fund-Raising Activities 2014 ANNUAL REPORT
Base date: April 14, 2015; Unit:share
Share CategoriesApproved Capital
NotesShares in circulation Shares without issuance Total shares
Common Shares 8,856,913,928 2,417,949,252 12,000,000,000
Listed shares
Preferred Shares D 725,136,820 Unlisted shares
B. Structure of Shareholders
Structure of Shareholders (Common share)
Base date: April 14, 2015
Structure of Shareholders
Quantity
Government Institutions
Financial Institutions
Other Institutional
Shareholders
Personal Shareholders
Foreign Institutions
and Personal Shareholders
Total
Number of Shareholders 13 164 563 217,555 808 219,103
Shares 175,574,428 628,595,945 1,700,073,770 3,422,227,894 2,930,441,891 8,856,913,928
Share of stake (%) 1.98 7.10 19.19 38.64 33.09 100.00
Structure of Shareholders (Preferred share D)
Base date: April 14, 2015
Structure of Shareholders
Quantity
Government Institutions
Financial Institutions
Other Institutional
Shareholders
Personal Shareholders
Foreign Institutions
and Personal Shareholders
Total
Number of Shareholders 0 1 15 0 0 16
Shares 0 258,977,435 466,159,385 0 0 725,136,820
Share of stake (%) 0.00 35.71 64.29 0.00 0.00 100.00
C. Distribution of Shareholding
Distribution of Shareholding (Common share)
Base date: April 14, 2015; Par Value NT$10
Classification of Shareholding Number of Shareholders Shares %
1~ 999 72,392 22,593,565 0.26
1,000~ 5,000 71,556 168,758,862 1.91
5,001~ 10,000 25,561 185,145,182 2.09
10,001~ 15,000 14,423 178,360,576 2.01
15,001~ 20,000 7,317 127,701,213 1.44
20,001~ 30,000 9,337 230,622,110 2.60
30,001~ 50,000 6,959 267,260,842 3.01
50,001~ 100,000 5,598 389,365,523 4.40
100,001~ 200,000 2,924 405,513,136 4.58
200,001~ 400,000 1,445 401,693,034 4.54
400,001~ 600,000 481 235,503,193 2.66
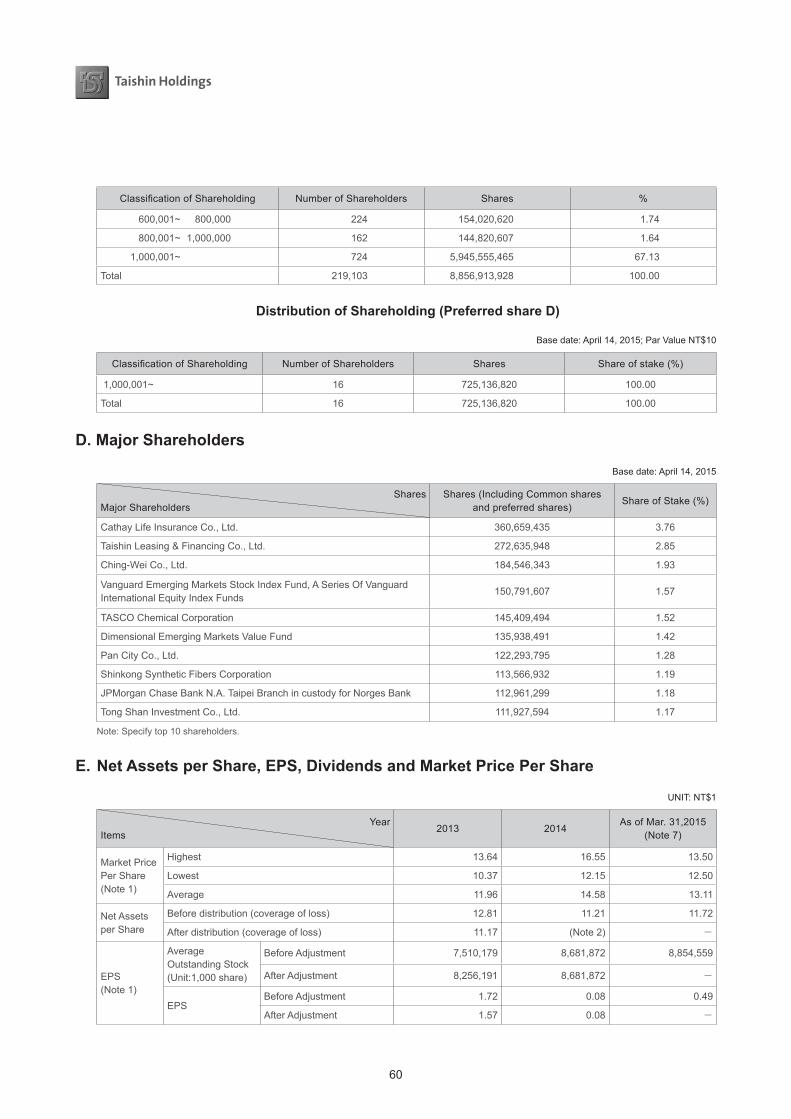
60
Classification of Shareholding Number of Shareholders Shares %
600,001~ 800,000 224 154,020,620 1.74
800,001~ 1,000,000 162 144,820,607 1.64
1,000,001~ 724 5,945,555,465 67.13
Total 219,103 8,856,913,928 100.00
Distribution of Shareholding (Preferred share D)
Base date: April 14, 2015; Par Value NT$10
Classification of Shareholding Number of Shareholders Shares Share of stake (%)
1,000,001~ 16 725,136,820 100.00
Total 16 725,136,820 100.00
D. Major Shareholders
Base date: April 14, 2015
Shares Major Shareholders
Shares (Including Common shares and preferred shares)
Share of Stake (%)
Cathay Life Insurance Co., Ltd. 360,659,435 3.76
Taishin Leasing & Financing Co., Ltd. 272,635,948 2.85
Ching-Wei Co., Ltd. 184,546,343 1.93
Vanguard Emerging Markets Stock Index Fund, A Series Of Vanguard International Equity Index Funds
150,791,607 1.57
TASCO Chemical Corporation 145,409,494 1.52
Dimensional Emerging Markets Value Fund 135,938,491 1.42
Pan City Co., Ltd. 122,293,795 1.28
Shinkong Synthetic Fibers Corporation 113,566,932 1.19
JPMorgan Chase Bank N.A. Taipei Branch in custody for Norges Bank 112,961,299 1.18
Tong Shan Investment Co., Ltd. 111,927,594 1.17
Note: Specify top 10 shareholders.
E. Net Assets per Share, EPS, Dividends and Market Price Per Share
UNIT: NT$1
YearItems
2013 2014As of Mar. 31,2015
(Note 7)
Market Price Per Share(Note 1)
Highest 13.64 16.55 13.50
Lowest 10.37 12.15 12.50
Average 11.96 14.58 13.11
Net Assets per Share
Before distribution (coverage of loss) 12.81 11.21 11.72
After distribution (coverage of loss) 11.17 (Note 2) -
EPS(Note 1)
Average Outstanding Stock (Unit:1,000 share)
Before Adjustment 7,510,179 8,681,872 8,854,559
After Adjustment 8,256,191 8,681,872 -
EPSBefore Adjustment 1.72 0.08 0.49
After Adjustment 1.57 0.08 -

61
04Fund-Raising Activities 2014 ANNUAL REPORT
YearItems
2013 2014As of Mar. 31,2015
(Note 7)
Dividends
Cash Dividend 0.4258 (Note 2) -
Stock grantAllotment by Earning 0.9933 (Note 2) -
Allotment by Capital Surplus 0 (Note 2) -
Accumulated Undistributed Dividends (NT$1,000) (Note 3)
0 0 0
Analysis for Return onInvestment
Price to Earning Ratio (Note 4) 7.65 181.50 -
Price to Profit Ratio (Note 5) 31.12 (Note 2) -
Yield Rate of Cash Dividend (Note 6) 3.21% (Note 2) -
Note 1:Market Price per Share and EPS calculation has been retroactively adjusted for the Capital increase by earning. Note 2:The Earning distribution for year 2014 hasn’t been approved by the 2015 General Shareholders’ Meeting.Note 3:Refer to accumulated dividend payable for preferred shares.Note 4:Price to earnings ratio=Average closing price of the said year/Earning per share.Note 5:Price to dividends ratio=Average closing price of the said year/Cash dividends per share.Note 6:Cash dividends yield= Cash dividends per share/Average closing price of the said year.Note 7:The financial data as of Mar. 31, 2015 has not been reviewed by CPA.
F. The Policy and Implementation of Dividends
a. Dividend Policy
Any earnings concluded in a financial year shall first make up for loss of previous years, right after statutory taxation and accounting adjustments. Any surplus is subject to provision of a 10% legal reserve and special reserve according to law. The remainder plus reversals of special reserves shall be available for distribution of a preferred share dividend according to the priority specified in the Articles of Incorporation, followed by a 0.01% provision for employee bonus and a 1% provision for directors’ and supervisors’ remuneration. The remaining balance plus undistributed earnings in begin of period are available for distribution as an ordinary share dividend, for which the board of directors may propose to distribute 30% to 100% of the available balance for approval in the shareholders’ meeting. The board of directors is authorized to decide on distribution methods of employee bonus and actual percentage applied. Where employee bonuses are paid with shares, they can also be distributed to employees of affiliated companies that meet certain criteria.
For the purposes of continuing expansion and increasing profitability while considering overall cash flow requirements and keeping the capital adequacy ratio at level that meets the regulatory requirements and is internationally accepted, the company adopts a residual dividend policy to accommodate the dilution by share dividends for common shares while the number of outstanding preferred share D is 200,000,000 or above.
With respect to dividend distribution, the company focuses on the requirements of business operations, capital planning, cash flow requirements for subsidiary investments and mergers and acquisitions, and material regulatory changes, and chooses to distribute share dividends to retain the needed cash as a principle and any balance can be distributed as cash dividends.
b. Items on the agenda of the shareholders’ meeting
1. Distribution of earnings according to Article 40 of the company’s Articles of Incorporation.2. The company’s 2014 audited after-tax profit amounted to NT$1,624,375,864; after adding on unappropriated
earnings adjustments, earnings available for distribution for 2014 was totaled at NT$1,511,460,766. The following distributions have been proposed according to the Articles of Incorporation:
62
(1) A 10% legal reserve of totally NT$151,146,077 has been provided according to the Company Act and the Articles of Incorporation;
(2) Next, a total of NT$910,000,001 cash dividends shall be distributed to Class D preferred shareholders.(3) And then, A total of NT$450,314,688 cash dividends shall be distributed to common shareholders
(approximately NT$0.051 per share based on the 8,856,390,533 common shares outstanding as of March 31, 2015. The amount per share actually distributed will vary due to any treasury stock transactions, exercise of employee warrants, and conversion of Class D preferred shares. The final distribution of amount per share will be adjusted according to the actual number of outstanding common shares as of the ex-dividend date.)
3. The final distribution of cash dividends to common shareholders is based on the sum of cash dividends from 2014 earnings distribution and cash dividends distribution from the capital reserve and set at NT$0.10 per share. Aforementioned cash dividends distribution from the capital reserve shall be discussed in a separate agenda item.
4. The board of directors has authorized the chairman to determine the ex-dividend date and the date of payment on cash dividends.
G. Effect of resolution of the shareholders’ meeting to issue stock dividend on the bank’s business performance and earnings per share
Pursuant to Letter No. Taiwan-Finance-Securities-I-00371 dated February 1, 2000; the Company is not required to disclose this information because it does not publish financial forecasts.
H. Employee bonus and compensations for directors and supervisors
a. Percentages and scope of employee bonus and compensations for directors and supervisors
Please refer to the descriptions on “Dividend policy and execution,” presented under the “Dividend policy” section.
b. Accounting treatment for the difference between accrual and actual payment for employee bonus and compensation for directors and supervisors
Employees’ bonuses for the current period have been estimated based on the criteria laid out in the Articles of Incorporation. Should the actual amount differ from the amount estimated, the difference will be treated as changes in accounting estimates and recognized as an expense in the year of distribution. There is no difference between the estimated employee bonus and compensations for directors and supervisors and the actual amount of payout for the current period.
c. Information on proposal of the board of directors to issue employee bonus
1. Payout of cash bonus for employees, stock dividend, and compensations for board directors and supervisors. If there is a difference between accrual and actual payment, please explain the reason.(1) Payment of NT$45 thousand in cash bonus to employee and NT$ 4,503 thousand in compensation to
directors and supervisors.(2) There is no difference between the estimated employee bonus and compensations for directors and
supervisors and the actual amount of payout for the current period. 2. Amount of employees’ bonus to be paid in stock, and as a percentage to net profit after tax plus employees’
total bonus for the current period: Nil.
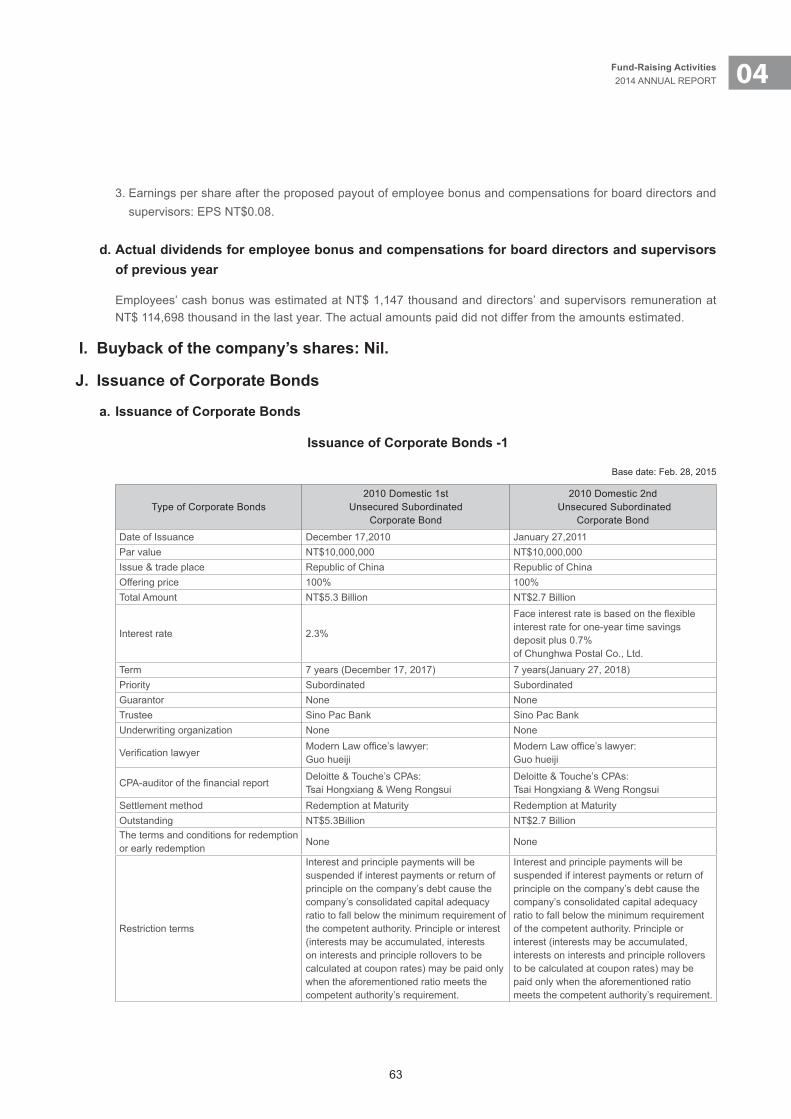
63
04Fund-Raising Activities 2014 ANNUAL REPORT
3. Earnings per share after the proposed payout of employee bonus and compensations for board directors and supervisors: EPS NT$0.08.
d. Actual dividends for employee bonus and compensations for board directors and supervisors of previous year
Employees’ cash bonus was estimated at NT$ 1,147 thousand and directors’ and supervisors remuneration at NT$ 114,698 thousand in the last year. The actual amounts paid did not differ from the amounts estimated.
I. Buyback of the company’s shares: Nil.
J. Issuance of Corporate Bonds
a. Issuance of Corporate Bonds
Issuance of Corporate Bonds -1
Base date: Feb. 28, 2015
Type of Corporate Bonds2010 Domestic 1st
Unsecured Subordinated Corporate Bond
2010 Domestic 2nd Unsecured Subordinated
Corporate Bond
Date of Issuance December 17,2010 January 27,2011Par value NT$10,000,000 NT$10,000,000Issue & trade place Republic of China Republic of ChinaOffering price 100% 100%Total Amount NT$5.3 Billion NT$2.7 Billion
Interest rate 2.3%
Face interest rate is based on the flexible interest rate for one-year time savings deposit plus 0.7%of Chunghwa Postal Co., Ltd.
Term 7 years (December 17, 2017) 7 years(January 27, 2018) Priority Subordinated SubordinatedGuarantor None NoneTrustee Sino Pac Bank Sino Pac BankUnderwriting organization None None
Verification lawyerModern Law office’s lawyer:Guo hueiji
Modern Law office’s lawyer:Guo hueiji
CPA-auditor of the financial reportDeloitte & Touche’s CPAs:Tsai Hongxiang & Weng Rongsui
Deloitte & Touche’s CPAs:Tsai Hongxiang & Weng Rongsui
Settlement method Redemption at Maturity Redemption at MaturityOutstanding NT$5.3Billion NT$2.7 BillionThe terms and conditions for redemption or early redemption
None None
Restriction terms
Interest and principle payments will be suspended if interest payments or return of principle on the company’s debt cause the company’s consolidated capital adequacy ratio to fall below the minimum requirement of the competent authority. Principle or interest (interests may be accumulated, interests on interests and principle rollovers to be calculated at coupon rates) may be paid only when the aforementioned ratio meets the competent authority’s requirement.
Interest and principle payments will be suspended if interest payments or return of principle on the company’s debt cause the company’s consolidated capital adequacy ratio to fall below the minimum requirement of the competent authority. Principle or interest (interests may be accumulated, interests on interests and principle rollovers to be calculated at coupon rates) may be paid only when the aforementioned ratio meets the competent authority’s requirement.
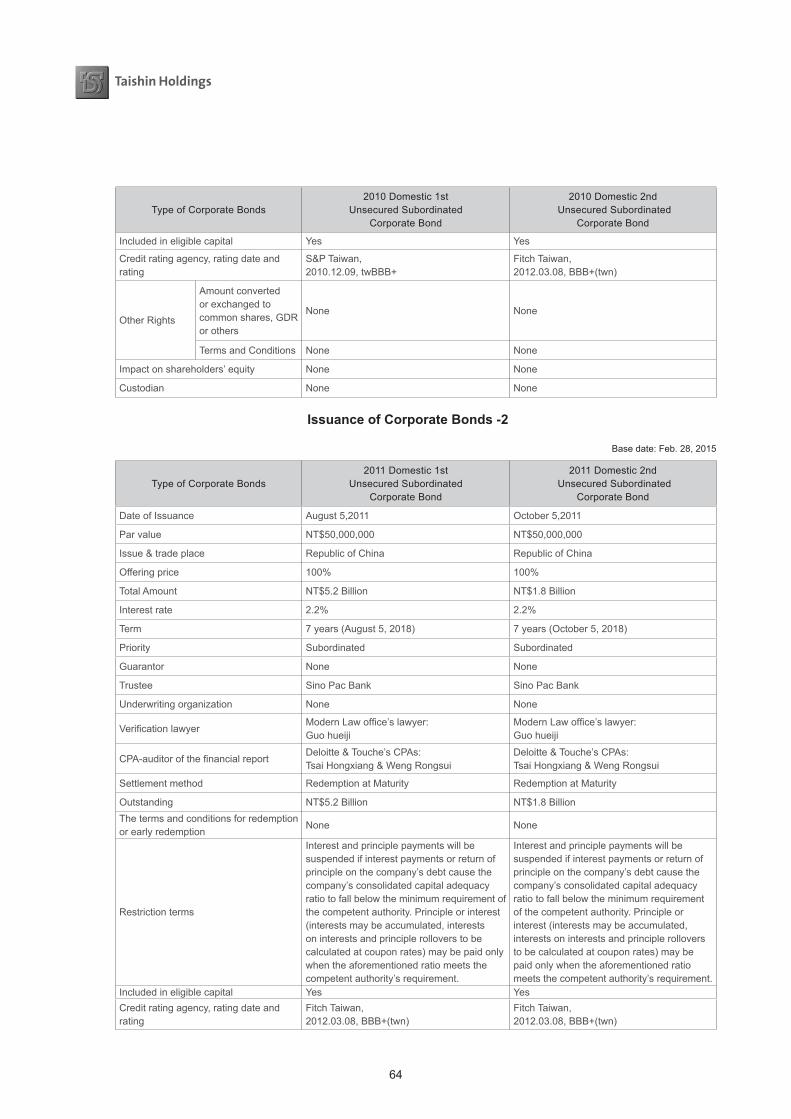
64
Type of Corporate Bonds2010 Domestic 1st
Unsecured Subordinated Corporate Bond
2010 Domestic 2nd Unsecured Subordinated
Corporate Bond
Included in eligible capital Yes Yes
Credit rating agency, rating date and rating
S&P Taiwan,2010.12.09, twBBB+
Fitch Taiwan,2012.03.08, BBB+(twn)
Other Rights
Amount converted or exchanged to common shares, GDR or others
None None
Terms and Conditions None None
Impact on shareholders’ equity None None
Custodian None None
Issuance of Corporate Bonds -2
Base date: Feb. 28, 2015
Type of Corporate Bonds2011 Domestic 1st
Unsecured Subordinated Corporate Bond
2011 Domestic 2nd Unsecured Subordinated
Corporate Bond
Date of Issuance August 5,2011 October 5,2011
Par value NT$50,000,000 NT$50,000,000
Issue & trade place Republic of China Republic of China
Offering price 100% 100%
Total Amount NT$5.2 Billion NT$1.8 Billion
Interest rate 2.2% 2.2%
Term 7 years (August 5, 2018) 7 years (October 5, 2018)
Priority Subordinated Subordinated
Guarantor None None
Trustee Sino Pac Bank Sino Pac Bank
Underwriting organization None None
Verification lawyerModern Law office’s lawyer:Guo hueiji
Modern Law office’s lawyer:Guo hueiji
CPA-auditor of the financial reportDeloitte & Touche’s CPAs:Tsai Hongxiang & Weng Rongsui
Deloitte & Touche’s CPAs:Tsai Hongxiang & Weng Rongsui
Settlement method Redemption at Maturity Redemption at Maturity
Outstanding NT$5.2 Billion NT$1.8 BillionThe terms and conditions for redemption or early redemption
None None
Restriction terms
Interest and principle payments will be suspended if interest payments or return of principle on the company’s debt cause the company’s consolidated capital adequacy ratio to fall below the minimum requirement of the competent authority. Principle or interest (interests may be accumulated, interests on interests and principle rollovers to be calculated at coupon rates) may be paid only when the aforementioned ratio meets the competent authority’s requirement.
Interest and principle payments will be suspended if interest payments or return of principle on the company’s debt cause the company’s consolidated capital adequacy ratio to fall below the minimum requirement of the competent authority. Principle or interest (interests may be accumulated, interests on interests and principle rollovers to be calculated at coupon rates) may be paid only when the aforementioned ratio meets the competent authority’s requirement.
Included in eligible capital Yes YesCredit rating agency, rating date and rating
Fitch Taiwan,2012.03.08, BBB+(twn)
Fitch Taiwan,2012.03.08, BBB+(twn)
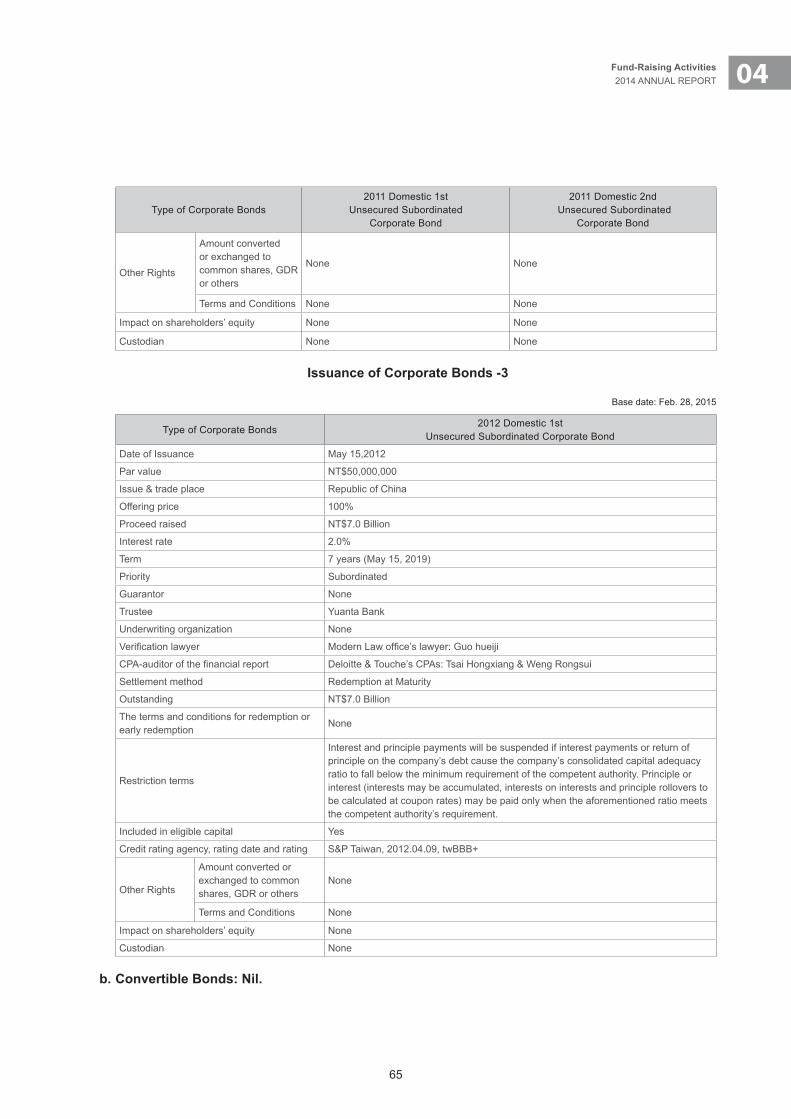
65
04Fund-Raising Activities 2014 ANNUAL REPORT
Type of Corporate Bonds2011 Domestic 1st
Unsecured Subordinated Corporate Bond
2011 Domestic 2nd Unsecured Subordinated
Corporate Bond
Other Rights
Amount converted or exchanged to common shares, GDR or others
None None
Terms and Conditions None None
Impact on shareholders’ equity None None
Custodian None None
Issuance of Corporate Bonds -3
Base date: Feb. 28, 2015
Type of Corporate Bonds2012 Domestic 1st
Unsecured Subordinated Corporate Bond
Date of Issuance May 15,2012
Par value NT$50,000,000
Issue & trade place Republic of China
Offering price 100%
Proceed raised NT$7.0 Billion
Interest rate 2.0%
Term 7 years (May 15, 2019)
Priority Subordinated
Guarantor None
Trustee Yuanta Bank
Underwriting organization None
Verification lawyer Modern Law office’s lawyer: Guo hueiji
CPA-auditor of the financial report Deloitte & Touche’s CPAs: Tsai Hongxiang & Weng Rongsui
Settlement method Redemption at Maturity
Outstanding NT$7.0 Billion
The terms and conditions for redemption or early redemption
None
Restriction terms
Interest and principle payments will be suspended if interest payments or return of principle on the company’s debt cause the company’s consolidated capital adequacy ratio to fall below the minimum requirement of the competent authority. Principle or interest (interests may be accumulated, interests on interests and principle rollovers to be calculated at coupon rates) may be paid only when the aforementioned ratio meets the competent authority’s requirement.
Included in eligible capital Yes
Credit rating agency, rating date and rating S&P Taiwan, 2012.04.09, twBBB+
Other Rights
Amount converted or exchanged to common shares, GDR or others
None
Terms and Conditions None
Impact on shareholders’ equity None
Custodian None
b. Convertible Bonds: Nil.
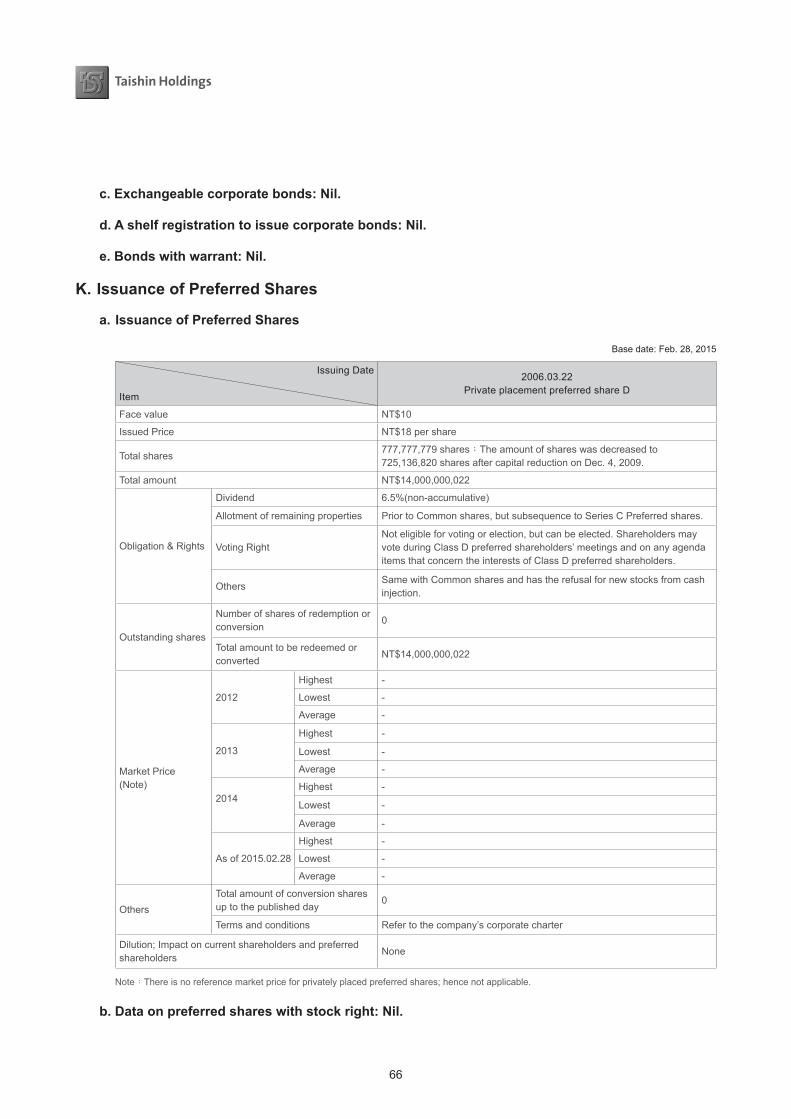
66
c. Exchangeable corporate bonds: Nil.
d. A shelf registration to issue corporate bonds: Nil.
e. Bonds with warrant: Nil.
K. Issuance of Preferred Shares
a. Issuance of Preferred Shares
Base date: Feb. 28, 2015
Issuing Date
Item
2006.03.22Private placement preferred share D
Face value NT$10
Issued Price NT$18 per share
Total shares777,777,779 shares;The amount of shares was decreased to 725,136,820 shares after capital reduction on Dec. 4, 2009.
Total amount NT$14,000,000,022
Obligation & Rights
Dividend 6.5%(non-accumulative)
Allotment of remaining properties Prior to Common shares, but subsequence to Series C Preferred shares.
Voting RightNot eligible for voting or election, but can be elected. Shareholders may vote during Class D preferred shareholders’ meetings and on any agenda items that concern the interests of Class D preferred shareholders.
OthersSame with Common shares and has the refusal for new stocks from cash injection.
Outstanding shares
Number of shares of redemption or conversion
0
Total amount to be redeemed or converted
NT$14,000,000,022
Market Price(Note)
2012
Highest -
Lowest -
Average -
2013
Highest -
Lowest -
Average -
2014Highest -
Lowest -
Average -
As of 2015.02.28
Highest -
Lowest -
Average -
OthersTotal amount of conversion shares up to the published day
0
Terms and conditions Refer to the company’s corporate charter
Dilution; Impact on current shareholders and preferred shareholders
None
Note:There is no reference market price for privately placed preferred shares; hence not applicable.
b. Data on preferred shares with stock right: Nil.
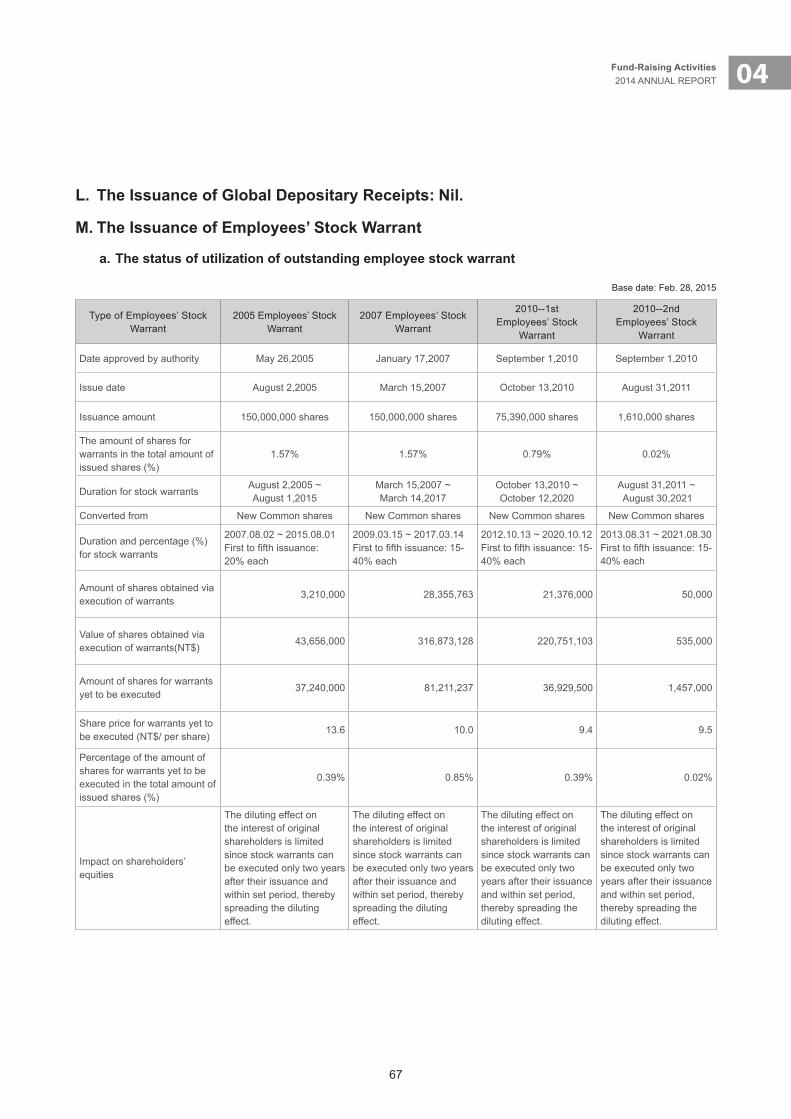
67
04Fund-Raising Activities 2014 ANNUAL REPORT
L. The Issuance of Global Depositary Receipts: Nil.
M. The Issuance of Employees’ Stock Warrant
a. The status of utilization of outstanding employee stock warrant
Base date: Feb. 28, 2015
Type of Employees’ Stock Warrant
2005 Employees’ Stock Warrant
2007 Employees’ Stock Warrant
2010--1stEmployees’ Stock
Warrant
2010--2ndEmployees’ Stock
Warrant
Date approved by authority May 26,2005 January 17,2007 September 1,2010 September 1,2010
Issue date August 2,2005 March 15,2007 October 13,2010 August 31,2011
Issuance amount 150,000,000 shares 150,000,000 shares 75,390,000 shares 1,610,000 shares
The amount of shares for warrants in the total amount of issued shares (%)
1.57% 1.57% 0.79% 0.02%
Duration for stock warrantsAugust 2,2005 ~ August 1,2015
March 15,2007 ~ March 14,2017
October 13,2010 ~ October 12,2020
August 31,2011 ~ August 30,2021
Converted from New Common shares New Common shares New Common shares New Common shares
Duration and percentage (%) for stock warrants
2007.08.02 ~ 2015.08.01First to fifth issuance: 20% each
2009.03.15 ~ 2017.03.14First to fifth issuance: 15-40% each
2012.10.13 ~ 2020.10.12First to fifth issuance: 15-40% each
2013.08.31 ~ 2021.08.30First to fifth issuance: 15-40% each
Amount of shares obtained via execution of warrants
3,210,000 28,355,763 21,376,000 50,000
Value of shares obtained via execution of warrants(NT$)
43,656,000 316,873,128 220,751,103 535,000
Amount of shares for warrants yet to be executed
37,240,000 81,211,237 36,929,500 1,457,000
Share price for warrants yet to be executed (NT$/ per share)
13.6 10.0 9.4 9.5
Percentage of the amount of shares for warrants yet to be executed in the total amount of issued shares (%)
0.39% 0.85% 0.39% 0.02%
Impact on shareholders’ equities
The diluting effect on the interest of original shareholders is limited since stock warrants can be executed only two years after their issuance and within set period, thereby spreading the diluting effect.
The diluting effect on the interest of original shareholders is limited since stock warrants can be executed only two years after their issuance and within set period, thereby spreading the diluting effect.
The diluting effect on the interest of original shareholders is limited since stock warrants can be executed only two years after their issuance and within set period, thereby spreading the diluting effect.
The diluting effect on the interest of original shareholders is limited since stock warrants can be executed only two years after their issuance and within set period, thereby spreading the diluting effect.

68
b. Managers who have acquired employee stock warrants and the top ten employees with the highest number of convertible rights
Base date: Feb. 28, 2015
Item Position NameConvertible rights
acquired (1,000 Shares)
Convertible rights as a
percentage of total outstanding
shares
Exercised Not exercised
Number of rights (1000 Shares)
Price of rights (NT$/Per Share)
Value of rights (NT$1,000)
Rights as a percentage of
total outstanding shares
Number of rights (1,000 Shares)
Price of rights(NT$/Per Share)
Value of rights(NT$1,000)
Rights as a percentage of
total outstanding shares
Managers
President and Chief Executive Officer, Wholesale Banking Group
Joseph Jao
Chief Executive Officer,Retail Banking Group
Oliver Shang
Chief Auditor Howard Wu 94 option 94 option 94 option 94 option 94 option 94 option 94 option 94 option 94 option 94 option
Chief Strategy Officer Daniel Tsai 37,400 0.39% 730 13.6 9,928 0.01% 4,470 13.6 60,792 0.05%
Chief Information Officer BR Ho
Chief Financial Officer Welch Lin 96 option 96 option 96 option 96 option 96 option 96 option 96 option 96 option 96 option 96 option
Chief Accounting Officer Ann Cheng 39,390 0.41% 8,641 10.6 91,204.3 0.09% 30,499 10 304,990 0.32%
Chief Risk Officer Jey Chen 99 option- 99 option- 99 option- 99 option- 99 option- 99 option- 99 option- 99 option- 99 option- 99 option-
Senior Vice President Wilson Chou 1st 1st 1st 1st 1st 1st 1st 1st 1st 1st
Senior Vice President David Cheng 7,800 0.08% 3,334.5 10 33,389.7 0.03% 4,321.5 9.4 40,622 0.05%
Senior Vice President Frank Lin
Senior Vice President Jai, Lu-June 99 option- 99 option- 99 option- 99 option- 99 option- 99 option- 99 option- 99 option- 99 option- 99 option-
Senior Vice President Janice Liang (2014.03.28 On board) 2nd 2nd 2nd 2nd 2nd 2nd 2nd 2nd 2nd 2nd
Senior Vice President Chao-Min Lin (2015.01.23 Leave off) 104 0.00% - - - - 104 9.5 988 0.00%
Senior Vice President Chris Chang (2014.03.28 Leave off)
Employees
Chief Consultant Jeffrey T.S. Wu
Executive Consultant Steve S.F. Shieh
Executive Consultant Helena Kuo
Assistant Vice President Lee,shying
Assistant Vice President Lin ching yin
Manger Chen szu han
c. Issuance of restricted right shares for employees: Nil.

69
04Fund-Raising Activities 2014 ANNUAL REPORT
Base date: Feb. 28, 2015
Item Position NameConvertible rights
acquired (1,000 Shares)
Convertible rights as a
percentage of total outstanding
shares
Exercised Not exercised
Number of rights (1000 Shares)
Price of rights (NT$/Per Share)
Value of rights (NT$1,000)
Rights as a percentage of
total outstanding shares
Number of rights (1,000 Shares)
Price of rights(NT$/Per Share)
Value of rights(NT$1,000)
Rights as a percentage of
total outstanding shares
Managers
President and Chief Executive Officer, Wholesale Banking Group
Joseph Jao
Chief Executive Officer,Retail Banking Group
Oliver Shang
Chief Auditor Howard Wu 94 option 94 option 94 option 94 option 94 option 94 option 94 option 94 option 94 option 94 option
Chief Strategy Officer Daniel Tsai 37,400 0.39% 730 13.6 9,928 0.01% 4,470 13.6 60,792 0.05%
Chief Information Officer BR Ho
Chief Financial Officer Welch Lin 96 option 96 option 96 option 96 option 96 option 96 option 96 option 96 option 96 option 96 option
Chief Accounting Officer Ann Cheng 39,390 0.41% 8,641 10.6 91,204.3 0.09% 30,499 10 304,990 0.32%
Chief Risk Officer Jey Chen 99 option- 99 option- 99 option- 99 option- 99 option- 99 option- 99 option- 99 option- 99 option- 99 option-
Senior Vice President Wilson Chou 1st 1st 1st 1st 1st 1st 1st 1st 1st 1st
Senior Vice President David Cheng 7,800 0.08% 3,334.5 10 33,389.7 0.03% 4,321.5 9.4 40,622 0.05%
Senior Vice President Frank Lin
Senior Vice President Jai, Lu-June 99 option- 99 option- 99 option- 99 option- 99 option- 99 option- 99 option- 99 option- 99 option- 99 option-
Senior Vice President Janice Liang (2014.03.28 On board) 2nd 2nd 2nd 2nd 2nd 2nd 2nd 2nd 2nd 2nd
Senior Vice President Chao-Min Lin (2015.01.23 Leave off) 104 0.00% - - - - 104 9.5 988 0.00%
Senior Vice President Chris Chang (2014.03.28 Leave off)
Employees
Chief Consultant Jeffrey T.S. Wu
Executive Consultant Steve S.F. Shieh
Executive Consultant Helena Kuo
Assistant Vice President Lee,shying
Assistant Vice President Lin ching yin
Manger Chen szu han
c. Issuance of restricted right shares for employees: Nil.
70
N. Merger and acquisitions or transfer of other financial institutions
a. Taishin Holding
1. Any opinions by accountants that should be disclosed regarding the reasonable share swap ratio for mergers & acquisitions or sale of financial institutions over the past year: Not applicable.
2. State of mergers & acquisitions or sale of financial institutions over the past five years. Methods of issuing new shares in such M&A or sale, and opinions issued by the leading underwriter: (1) On April 9, 2010, the company took over Tung Hsing Securities and subsequently renamed it Taishin
Securities, thereby offering customers even more complete and comprehensive financial services.(2) On April 27, 2011, the company acquired Franklin Insurance Brokers Co., Ltd. (renamed as Taishin
Holdings Insurance Brokers on May 16, 2011), thereby enabling other subsidiaries to access non-life and life insurance products and provide complete product lineup for sales service.
3. In the most recent financial year and up to the printing of this annual report, disclosure of the basic data of mergers & acquisitions or sale of other financial institutions in which the Board of Directors has approved such M&D or sale that involves the issuance of new shares: Not applicable.
b. Taishin Bank
1. Any opinions by accountants that should be disclosed regarding the reasonable share swap ratio for mergers & acquisitions or sale of financial institutions over the past year: Not applicable.
2. State of mergers & acquisitions or sale of financial institutions over the past five years. Methods of issuing new shares in such M&A or sale, and opinions issued by the leading underwriter:
On Jan. 22, 2011, subsidiary Taishin Bank took over Taishin Bills Finance, in order to cut cost, effectively integrate the financial holding company’s internal resources, and create high yield, making the company a financial holding company centering on a quality bank.
3. In the most recent financial year and up to the printing of this annual report, disclosure of the basic data of mergers & acquisitions or sale of other financial institutions in which the Board of Directors has approved such M&D or sale that involves the issuance of new shares: Not applicable.
c. Taishin Investment Trust
1. Any opinions by accountants that should be disclosed regarding the reasonable share swap ratio for mergers & acquisitions or sale of financial institutions over the past year: Not applicable.
2. State of mergers & acquisitions or sale of financial institutions over the past five years. Methods of issuing new shares in such M&A or sale, and opinions issued by the leading underwriter:
On Dec. 18, 2011 Taishin Investment Trust acquired Taiwan Industrial Bank Securities Investment Trust, further expanding the scale and market share of the assets under its management.
3. In the most recent financial year and up to the printing of this annual report, disclosure of the basic data of mergers & acquisitions or sale of other financial institutions in which the Board of Directors has approved such M&D or sale that involves the issuance of new shares: Not applicable.
O. The Execution of Fund Utilization Plan
a. Contents of the plan
1. Incomplete issue or private offering of securities: Nil.2. Completed in last three years but without apparent benefits: Nil.
b. Implementation description: Nil.

05Operating Status
72
V. Operating Status
A. Business Contents
Taishin Financial Holding Co., Ltd.
a. Business scope
According to article 36 of the Financial Holding Company Law, the company’s operation is confined to investment and the management of invested businesses.
The company is allowed to invest in the following businesses: 1. Financial Holdings 2. Banking 3.Billsfinance 4. Credit card 5. Trust 6. Insurance 7. Securities 8. Futures 9. Venture capital10.Foreignfinancialinstitutionswiththeregulator’sapproval11.Otherfinancialindustry-relatedbusinessesacknowledgedbytheregulator
b. Business plan of the current year
1.EnhancecorebusinessesandintegrateresourcesthroughoutthefinancialholdingcompanyFocus on growing core businesses such as wholesale banking and retail banking through a balanced risk approach,whileinthemeantimeintegrateresourcesthroughoutthefinancialholdingcompanytoexpandthescaleofsecuritiessubsidiariesanddevelopalternativeprofitsources.
2.ExpandoverseaspresenceforgreaterglobalcompetitivenessAs part of the company’s goal to become a regional financial institution, more efforts will be devoted to expandingoverseaspresences,starting fromChina,NortheastAsia,SoutheastAsiaand theAsiaPacific.Meanwhile, the company will take initiative in developing global talents and aim to achieve early success in Asia.
3. Utilize new technologies to drive innovation and transformation in Banking 3.0Inadditionto improvingthestabilityofexistingsystems, thecompanywillalsobedevelopingnewsystemswith new technologies to introduce innovative services that open up whole new opportunities.
4. Infrastructure and talent developmentThecompanywillseek to reducecostofcapitalbyexercisinggreater riskcontrol,andprovide thebestinfrastructureandmanpowerbyimprovingitsexistingtalentmanagementpractices.
73
05Operating Status 2014 ANNUAL REPORT
c. Industry status
1. Market statusBasedon IMF’s2015globaleconomic forecast, theU.S.economy isexpected toachieveagrowthof3.1%,whereasJapanandtheEurozonearelikelytoexperiencemarginalgrowthofmerely0.8%and1.3%,respectively, with China slowing down to 7.1%. Meanwhile, The Economist considered the plummet in oil prices,theRussianfinancialcrisis,andweakeconomicgrowthinGermanyandJapantobesimilartowhattheworldhadexperiencedtowardstheendofthe1990s,whichsignifiestheupcomingofyetanotherglobalcrisisin 2015.
The Economist has pointed out three recurring phenomenons that are of utmost concern at this point. Firstly, onlytheU.S.economyisexperiencingrisinggrowthrateswhilealmosteveryothereconomyisslowingdown.AlthoughtheU.S. isexperiencingarapid improvementto itsunemploymentproblem,aswellas increasedconsumer spending and commercial investments due to a fall in oil prices, the price fall may be just as likely tobankruptmanyshalegasexplorers,whereasthestrengtheningoftheU.S.dollarcoupledwithweakeningeconomiesinotherpartsoftheworldwilleventuallyhurtU.S.exports.
Secondly, theGermanandJapaneseeconomiesare facingpessimisticoutlooks.Germanyhasseen itseconomic growth dropped to 1.3% and is currently suffering from a lack of investments, failure of its energy initiative, and the government’s persistence on austerity measures. In the meantime, Japan has repeated the mistakeitmadein1997,raisingitsconsumptiontaxtooearlywhichhaspushedtheeconomytothebrinkofrecession.
Thirdly, emerging markets especially Russia are showing signs of decline, whereas countries that rely heavily oncommodityexports,particularlyAfrica,arealsoinafragilestate.Companiesinsomeofthesecountriesareheavily burdened by debts denominated in U.S. dollar. This bankruptcy wave may not be as severe as what wasexperiencedinthe1990s,but itwillstillcausepanicto investorsnonethelessandstrengthentheU.S.dollar even further.
Taiwan, on the other hand, is showing signs of recovery after a strong performance in 2014. Driven by a rise indomesticdemand,realGDPgrowthhit3.64%in thefirst threequarters.AccordingtoAcademiaSinica,Taiwan’s economic growth for the full year of 2014 is estimated at 3.42%. As for 2015, the fall of commodity prices worldwide coupled with the strengthening of the U.S. dollar will favor growth in international trade in the coming year. However, Taiwan’s growth potential will be limited by weakening trade demands from China, resulting in a slightly reduced growth rate of 3.38%.
2.DevelopmenttrendofvariousfinancialproductsWithfinancial-industrycompetitionexpectedtobecomeincreasinglyacute,non-interest incomewillemergeasamajor incomesourceforbanksunder theuser-payprincipleandmanynewfinancialproductswillbeintroduced into the domestic market from abroad, leading to market pluralization.
Thanks to thegovernmentsuccessively lifting financialcontrol,expanding theparticipation inbankingmanagement,andpushingtheprivatizationofstatefinancialenterprises, thefinancial-industrycompetitionwill,inadditiontopricecompetition,includesuchfactorsasservicequality,personnelcultivation,andproductdevelopment,boostingthematurityandstabilityofthedomesticfinancialindustry.
d. Research and development
1. R&D achievements in the recent two yearsAccordingtoArticle36of theFinancialHoldingCompanyAct, thebusinessofafinancialholdingcompany
74
shallbelimitedtoinvestmentin,andmanagementof,itsinvestedenterprises.RelatedR&DexpensesshallbeasspecifiedintheR&DprojectsbytheBank’ssubsidiaries.
TheBank’sR&Dexpensesintherecenttwoyears:NT$4,588,150in2013andNT$28,556,500in2014.(RelatedinformationpleaserefertoP.80)
2. Future R&D planThe company will integrate the R&D resources and manpower of various subsidiaries, thereby enabling clients andemployees toaccessvarious informationonstockmarket,bondmarket,exchangerate, interest rate,mutual fund, and insurance via a single window or platform.
e. Long- and short-term business development plans
As a financial holding firm, the company’s operation is confined investment and management, and as such, itsshort-termplan is tostrengthenthemanagementof the investedfirmsand its long-termgoal is todevelopintoaqualityfinancialinstitutioncapableofprovidingcompletefinancialservicestoChineseclientsworldwide.Forachievingthatgoal,thecompanywillembracethreestrategies:developingintoalargefinancial institutionwith international competitiveness, making deployment at Chinese communities worldwide, and continuously cultivatingqualityfinancialtalentsanddevelopingcompleteproductlineup.
Taishin International Bank Co.,Ltd.
a. Business contents
1.Growthandchangeinvariousbusinessitems(1)WealthManagement The bank’s wealth management services mainly provide customized financial solutions to customers
whomaintainassetsundermanagement (AUM)ofNT$1millionorabove,orhaveperformedfrequenttransaction in salary account, retail banking, credit card or securities. For customers who have less than NT$1million,thebankprovidesthemwithprofessionalinformationtobuildupbusinessrelationships.
Thebank’swealthmanagement operation covers sound financial planning, investment portfoliomanagement,assetallocationrecommendationsandabroadrangeoffinancialproducts, like localandforeign currency deposits, derivatives, insurances and loans.
Thebank’swealth-managementoperationprovidesvariouspreferential treatments to customersaccording to thedifferent levelsofentrustedassets.ForcustomerswithentrustedassetsexceedingNT$10million, thebankwill providededicated treatmentandevents forpayback tocustomers. Inaddition,providededicatedphysicalexaminationtocustomers,sothattheycantakecareoftheirhealth.
(2)Retailbanking Thebank’sretailbankingoperationcoversconsumptionloans(housingloan,autoloan,unsecuredloan,
andsubordinatedhousing loan),creditcard,microcorporate loans,e-cashflowandonlinepaymentserviceforsmallandmediumenterprises. Itprovidesvariousfinancialproductsdevelopedaccordingtomarket differentiation and the needs of various client groups, as well as various loaning programs to meet thefinancialneedsofclients.
(3)Wholesalebanking Thebank’swholesalebankingoperationprovidesanarrayoffinancialproductsandservicestovarious
institutionalclients, includingcorporations,government-ownedcompaniesandfinancial institutions.Thebusinessscope includes thebusinessesofcommercialand investmentbank,suchasdeposits,short-
75
05Operating Status 2014 ANNUAL REPORT
andlong-termfinancing,guarantee,tradefinance,syndicatedloans,bondtransaction,short-termpaper,factoring,cashmanagement,e-banking forcorporatefinancialnetwork, foreignexchangeand interest-ratederivatives,financialadvisory,assetsecuritization,anddiscretionaryassetsmanagement,etc.
(4)E-financialbusiness In 2014, the Electronic Banking Department delivered stunning performances in all three banking
services: ATM, Internet banking and mobile banking. With regards to the ATM, Taishin Bank not only has 2,600 units deployed throughout Taiwan, but has also taken the initiative to provide them with newer functionalities, faster withdrawal turnaround, and optimized interfaces and processes that have beendesignedto improveuserexperienceaswellascustomersatisfaction.Oneof thenewfunctionsthatTaishinBankhas introducedwasallowingcustomersofNanshanLife Insurancetoborrowagainstinsurance policies and repay loans over its ATM, making financial services more convenient and accessible.
As for Internetbanking, thebankhasbeenableexpand itscustomerbaseand increase transactionvolume over previous years to a total of 1.15 million by 2014, which represented an annual growth of 12%. Taishin’s Internet banking services have been able to attract and retain a larger number of customersmainlybecauseof theuser-friendly interfaceand its innovativemarketingcampaigns.Asaresult, transactionvolumeand fee incomehave increasedby138%year-on-year. Inaddition,TaishinBank has utilized the cost advantage and wide coverage of the Internet to build a personalized investment platform, and introduced “investment preference analysis” ahead of other peers. Customers simply need tofillinbasicinformationandthesystemwillrecommendafinancialproductthatmatchesthecustomer’sinvestment preference and risk tolerance. This gives customers the freedom of satisfying their investment needs in their own capacity.
TaishinBank’smobilebankingserviceshavealsoexperiencedaquicksurge incustomerbaseandtransaction volume, as a result of growing popularity in smartphone usage. The number of users in this regardhas increasedbynearly54%,whereas transactionvolumehas increasedby94%.Given thegrowing range of cellphone applications, Tashin Bank has devised two main strategies in 2014 for its mobilebankingservices:1.exploitcellphoneportability todelivercustomerswith themostappropriateinformationat the right time thatsatisfies theirneeds;and2.offercustomer-exclusive informationregarding their banking privileges. These strategies have led to the introduction of lifestyle banking servicessuchas: taxi calling,movie information, food recommendations,petrolpriceupdate,andweather forecast. In addition, the bank has introduced functions such as fund transfer advice, city parking privileges etc to mobile banking. The bank has earned itself the recognition of “Best Mobile Banking Platform inTaiwan” fromMILSTE.Weareproud tosay that2014hasbeen themost fruitfulyear formobile banking.
In an attempt to boost automated transaction volume, Taishin Bank has integrated ATM, Internet banking, mobilebanking,webATM,andTaishinPayplatformsallunderone rewardpointprogramsinceMay2013.Oursustainedefforts inservingcustomershaverewardeduswithhigherprofitability,customers’preference,and the recognitionof “BestLoyaltyProgramme”byAsianBanker in2014. In2014, thebank surged ahead of its peers by launching credit card cashback among other concessions that reward customers’ usage, which helped raise customers’ loyalty to the bank.
(5)TrustFinancialService For planned trust business, the bank continued to push “money trust” and assist customers to undertake
taxsavingand lendstockholdingvia“securitiestrust.”Tosatisfycorporatebankingcustomers’diverseneeds for trust services, the bank has also been active in promoting trust services as solutions to employee remuneration, such as trusts for shares, bonuses and restricted shares. Furthermore, the bank expectstolaunchanew“EmployeeWelfareandSavingsTrust”servicetowardsthesecondhalfof2014to help companies retain their top talents.
76
Forcollectivemanagement, thebankpioneered therolloutof “SoEasy targetedwealth-managementplan,”whichcovers targeteddate-typecollectivemanagementaccounts (with theseriesconsistingofTaishin2015/2020/2050collectivemanagementaccounts)andglobal (right-payout type)collectivemanagementaccount featuring fixedyield, toas toprovidecustomerscomplete life-targetwealthmanagement plan.
The bank offers “overseas investor custodian” services which foreign individuals and institutions mayutilize togainexposure to thegrowthofTaiwan’sstockmarket.Furthermore, inorder tocaptureopportunitiesonthereturn-listingofoverseasTaiwaneseenterprises,thebankhaslaunchedits“Foreignand Mainland Employee Consolidated Investment Account” service, which foreign and Mainland employeesmayusetoacquiresharesfromtheiremployersoncetheyhavebeenlistedinTaiwan.
With regards to mutual fund services, the bank continued to broaden the diversity of its product line, introducing investments from different kinds of industries and different parts of the world to satisfy customers’ diverse needs. Meanwhile, we kept customers refreshed with new product varieties and themes,alldifferentiatedtosuittheirprofiles.Inthemeantime,thebankalsoallocatesassetsflexiblytotake advantage of the changing market.
Intermsoffixedyieldsproducts,thebankoffersqualityoverseascorporatebondsandfinancialbondsforcustomers favoringfixedyields in theirassetsallocation.Thebankalsoacceptsprofessional investorstoentrustoffshorestructurednotes,soas toprovidemoreopportunities tohigh-assetsprofessionalinvestors.
2.Shares of the bank’s major income sources and their growth/ changes
Netincomeshare(%) 2013 2014
Retail banking 60 61
Wealth management 27 30
Consumptionfinancing 23 22
Credit card 10 9
Wholesale banking 40 39
Total 100 100
b. Business plan for the current year
1. Wealth Management (1)Committoourbrandvalueof“professionalismandinnovation”;taketheutmostcareofeveryassetthat
customers have entrusted to us, and aim to become the most preferred wealth management bank.(2)Introducediverseandinnovativeproductstocomplementourgoalsofbecomingasustainable,all-round
asset manager, bringing consistent returns and wealth growth to investors regardless of which direction the market progresses.
(3)Satisfy theneedsofsub-segmentcustomersby takingacustomer-centricapproach;developefficientandrobustbusinessmodelsthatworkwitheachsub-segment.IntegrateresourcesfromvariouspartsofTaishinFinancialGrouptodelivertheultimateOne-Stop-Shoppingexperience.
(4)Raiseemployees’servicequalityandcustomers’satisfaction;exerciseproperriskmanagementandcrisismanagement.
(5)MaintainrelationshipswithcustomerswithAUMbelowNT$1millionandtreat themaspotentialwealthmanagement customers. Increase the number of wealth management customers and improve product penetration among them.
(6)Conductcontinuoustestingtodevelopthemosteffectivesalesmodelfortheautomatedchannelsandthebest customer communication system. Offer corresponding privileges to ensure the loyalty of customers.

77
05Operating Status 2014 ANNUAL REPORT
(7)Useprecisiondataanalysistoassistproductsalestocustomerswithextensiveservicerelationshipssuchassalaryaccount, retailbanking,creditcardsandsecurities.Provide themwithsuitableproductsandservicesthatincreasewealthandsatisfytheirrequirements.
(8)Incorporate theuseof investmentpreferencescorecard inwealthmanagementservices(theAdvisorysystem):offerportfoliosthatmatchcustomers’preferenceandrisktolerance,whilehelpingthemtoreviewand adjust on a regular basis.
(9)Introduce“family-based”wealthmanagementservicetoaccommodatecustomers’needs.(10)Developanopenplatformthat introducesthebestproductson themarketcomplementedbyTaishin’s
proprietary products such as securities lending trust, So Easy funds etc...(11) Introduceabroaderproduct rangeforprofessional investors(PI)andattracthighnetworthcustomers
withtheavailabilityofFreeEconomicPilotZones.(12)Maintain loyaltymembers:offer“wealthmanagementrewardpoints” forevery transactionmade,which
customers can accumulate and spend on the various concessions the bank has to offer, therefore strengthening customer relations.
2. Retail Banking(1)Developproductcompetitiveness throughdifferentiation; integrate resources throughout thebank to
explorebroaderbusinessopportunities.(2)InitiateBank3.0;establishonlineapplicationsystemsforhigherserviceefficiency.(3)Utilizedatabaseanalysistechniquestoenhanceproductpenetrationandcustomerattachment.(4)Developnewpayment tools thatenablecustomers to transactonlineandoffline.Engagecustomers in
more active interactions through the use of mobile marketing technology. 3. Wholesale Banking
(1)Leveragethebank’sinnovativenesstoenrichproductlinesandprovidecustomerswithfinancialsolutions.(2)IntroduceintegratedNTDandforeigncurrencycashmanagement;promotecashservices(collectionand
payment)asmeansofsourcingcurrentdeposits;anchorcustomerrelationshipandminimizecreditrisks.(3)Extendtheexistingcollaborationbetweenretailandwholesalebankingsegments;utilizeretailbanking
channels toexploreexportfinancingbusiness;aimtoachievehighergrowth inSMEfinancing;explorepotentialSME(smallandmediumenterprise)customers.
(4)ExplorecollaborativeopportunitieswithChinesebanksontradefinancingservices.(5)Expandbranchpresence inChinaandAsia.TheSingaporeBranchhasbegunoperationssince the
middle of 2014, whereas the Brisbane Branch is scheduled to begin operations in 2015. Meanwhile, the TokyoBranchiscurrentlyinmidstofpreparationsandarepresentativeofficeisbeingappliedinYangon,Myanmar.
(6)UtilizeTaishinGroup’sChinese leasingplatformtoengage inRMB-denominated leasingandfactoringservices for lending spreads.
(7)Optimizecredit-extensionunderwritingproceduresandenhanceriskmanagementtoensuresoundassetquality.
(8)Developacomprehensivetalenttrainingsystemtosupportgrowingbusinesses;buildthebank’soverseastalent pool through regular job rotation.
4.E-financialbusinessTofurtherimproveuserexperience,thebankwillbeinitiatingamajorupgradetoitsInternet/mobilebankingsystems in the coming year. Apart from introducing a more intuitive interface, the bank will also revise its transactionflowsothatcustomerscancomplete transactions in just threeclicks.Agraphicalmenuwillbeused to help customers choose the functions they need easily. The above features will be designed to support multiple operating systems and browsers.
Thismobilebankingupgradeisexpectedtobecompletedbythefirsthalfofthisyear,andwillfeaturemoreuser friendly interfaces designed from users’ perspective. Apart from allowing customers to customize their

78
personal homepage, the upgrade also comes with a useful Account Assistant that helps customers to set goals on cash management.
MuchexpectationhasbeenplacedonTaishinBank’smobilebankingplatformtoserveasabridge to itscustomers wherever they go. As a result, the mobile platform will be integrated with virtually all information and servicesthebankhastooffer, fromonlineapplications,VIPupgrades,onlineadvisors, transactionadvices,topushmessages.Given themobilityofmoderncellphones, themobilebankingnetworkcanservemuchmore than just a transaction media, but also as a means through which customers may access Taishin Bank services wherever they go.
In the last few years, banks and convenience store chains have worked closely to incorporate ATMs into retail services,whichnotonlybroughtaboutgreaterconveniencetocustomers’ lifestylesbutalsoprovidedawin-win solution. In 2015, Taishin Bank will continue working closely with convenient store chains and deploy ATMs outside branch premise with broader features such as product application, foreign currency withdrawal, andcouponsalesincollaborationwithstrategicallies.Thesevalue-addingserviceshelpblendATMservicesinto customers’ lives.
Taishin Bank’s Electronic Banking Department has become the link to customers’ daily banking activities wherevertheygo.Apartfrommakingbankingservicesmoreflexibleandaccessibletousers,thedepartmenthasalsobeenconnectingautomatedbankingtoconsumers’lifestyles.AsBrettKingmentionedinBANK3.0:“Banking is no longer just somewhere you go to, it’s something you do,” and Taishin Bank has done just that bybuildinganenvironmentwherecustomersareprivilegedtoenjoythebestpersonalizedbankingexperience.
5.Trustfinancialservice(1)Push“yield-typesecurities”activelyengageinsecuritieslendingmarket,anddeveloppotentialcustomer
groupsforsecurities-deliverydeposits,soastocreatesecuritieslendingincomeforclients.(2)Introduce“customizedmoneytrust”servicesthatcanbetailoredtosatisfyabroadvarietyofneedssuch
as children’s education, business ventures, retirement planning, and care of disadvantaged families.(3)Develop“employeewelfare trust”business,soas tosatisfyenterprisesneed for talent retentionand
strengthen the relationship with corporate customers.(4)Push thecustodianbusinessof “Collective InvestmentAccount for foreignandOverseasChinese
employees” so as to tap the tremendous business potential connected with share listing of overseas enterprises on the local bourse and the growing internationalization of domestic listed companies.
(5)Incorporatemarketinformationandproductinformationservicesintotheonlinetradingplatform,therebyoffering customers greater convenience in fund selections.
(6)Promotefundswithavarietyofthemes;providecustom-tailoredservicestocustomersofdifferentprofilesand segments.
(7)Modifytheproductlineofdomesticandoffshorefunds,soastosatisfythecustomers’needsaboutassetallocation planning.
(8)Introducefavorablepriceoncertainfundsubscriptionsasmeansofexploringcustomersandanchoringbanking relationship.
(9)Exploremutual fundopportunities throughoffshorebankingunits(OBU); introduceRQFII funds,hedgefunds and other funds that are not yet available in Taiwan.
(10)Introducemulti-themedETFs, therebyofferingcustomerssuitable instruments to invest inunderanymarket condition.
(11)Offeroffshorebondsingreatervarietiesandcurrencies(includingRMB).(12)IntroduceprofessionalinvestorstooffshorestructuredinvestmentsthroughOBUs,therebysatisfyingthe
requirementsofhighnetworthinvestors.
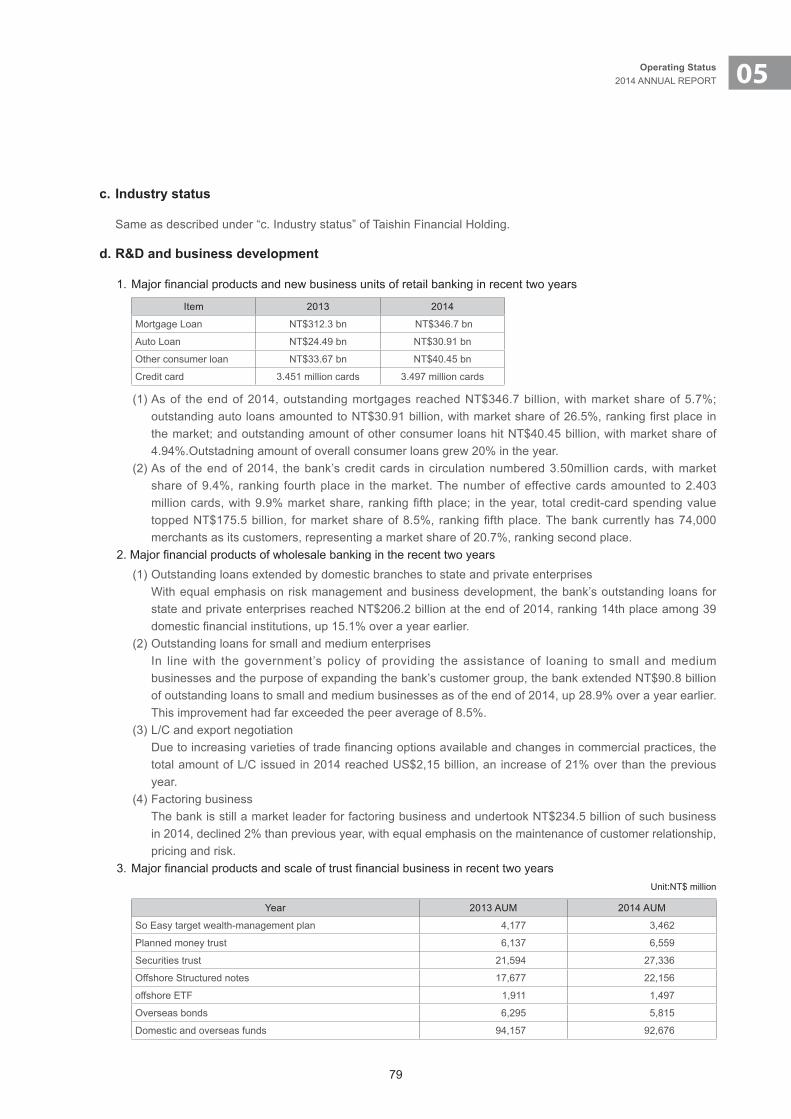
79
05Operating Status 2014 ANNUAL REPORT
c. Industry status
Same as described under “c. Industry status” of Taishin Financial Holding.
d. R&D and business development
1.Majorfinancialproductsandnewbusinessunitsofretailbankinginrecenttwoyears
Item 2013 2014
Mortgage Loan NT$312.3bn NT$346.7bn
Auto Loan NT$24.49bn NT$30.91bn
Other consumer loan NT$33.67bn NT$40.45bn
Credit card 3.451 million cards 3.497 million cards
(1)Asof theendof2014,outstandingmortgagesreachedNT$346.7billion,withmarketshareof5.7%;outstandingautoloansamountedtoNT$30.91billion,withmarketshareof26.5%,rankingfirstplaceinthemarket;andoutstandingamountofotherconsumer loanshitNT$40.45billion,withmarketshareof4.94%.Outstadning amount of overall consumer loans grew 20% in the year.
(2)Asof theendof2014, thebank’screditcards incirculationnumbered3.50millioncards,withmarketshare of 9.4%, ranking fourth place in the market. The number of effective cards amounted to 2.403 millioncards,with9.9%marketshare, rankingfifthplace; in theyear, totalcredit-cardspendingvaluetoppedNT$175.5billion, formarketshareof8.5%,rankingfifthplace.Thebankcurrentlyhas74,000merchants as its customers, representing a market share of 20.7%, ranking second place.
2.Majorfinancialproductsofwholesalebankingintherecenttwoyears(1)Outstandingloansextendedbydomesticbranchestostateandprivateenterprises Withequalemphasisonriskmanagementandbusinessdevelopment, thebank’soutstanding loansfor
stateandprivateenterprisesreachedNT$206.2billionattheendof2014,ranking14thplaceamong39domesticfinancialinstitutions,up15.1%overayearearlier.
(2)Outstandingloansforsmallandmediumenterprises In line with the government’s policy of providing the assistance of loaning to small and medium
businessesandthepurposeofexpandingthebank’scustomergroup,thebankextendedNT$90.8billionof outstanding loans to small and medium businesses as of the end of 2014, up 28.9% over a year earlier. Thisimprovementhadfarexceededthepeeraverageof8.5%.
(3)L/Candexportnegotiation Duetoincreasingvarietiesoftradefinancingoptionsavailableandchangesincommercialpractices,the
totalamountofL/Cissuedin2014reachedUS$2,15billion,anincreaseof21%overthanthepreviousyear.
(4)Factoringbusiness ThebankisstillamarketleaderforfactoringbusinessandundertookNT$234.5billionofsuchbusiness
in2014,declined2%thanpreviousyear,withequalemphasisonthemaintenanceofcustomerrelationship,pricing and risk.
3.MajorfinancialproductsandscaleoftrustfinancialbusinessinrecenttwoyearsUnit:NT$million
Year 2013 AUM 2014 AUM
SoEasytargetwealth-managementplan 4,177 3,462
Plannedmoneytrust 6,137 6,559
Securities trust 21,594 27,336
Offshore Structured notes 17,677 22,156
offshore ETF 1,911 1,497
Overseas bonds 6,295 5,815
Domestic and overseas funds 94,157 92,676
80
4. R&D achievements in the recent two yearsTheBank’sR&Dexpensesintherecenttwoyears:NT$4,588,150in2013andNT$28,556,500in2014.R&D results are described as follows: (1)Constructvirtualservercloudstoreplaceoutdatedservers.(2)Buildserverstocreateavirtuallocalbackupenvironmentandimproveapplicationservicequality.(3)Establishavirtualtwin-centerstructuretoeffectivelyallocatevirtualsystemresources.(4)Createamobileofficeplatformtohelp tellersperformnormalofficeduties,suchassending/receiving
officeemailviavariousequipment.(5)Implementanadditional two-factorauthenticationprotocol for themobileofficesystem tostrengthen
system security. (6)Accesscentrallycontrolledmobileequipmentandoperatebusinessapplicationsviamobileoffices in
response to progress in wholesale banking. (7)Reinforceprotectionofpersonaldataonmobileoffice topreventunauthorizeddisclosureofsensitive
data. (8)Assignasoftwaredevelopmentcloud to reduce thecostof installingpersonalequipmentunder the
development environment. (9)Results from thedevelopment environment are subject to a standard set of controls to prevent
unauthorized disclosure of testing data and parameters. (10)Reducethenumberofvendoremployeesstationedinsidethecompanytoavoidexcessiveuseofoffice
resources. The other business results are described as follows:(1)ThebankjoinedChunghwaTelecominaSIM-BasedNFCmobilecreditcardtrialproject.Throughtheuse
ofTSM(TrustedServiceLaunchofTaishin-TKECco-brandcardthatcombinesbankingandmembershipprivileges all in one.
(2)Upgradedcardholders’benefitswiththelaunchofMercedes-Benzsignaturecard.(3)TaishinbecamethesecondbanktohavecreditcardsacceptedatPXMART.(4)ThebankhasbeenapprovedtoengageinmPOSservices,andisnowabletoventureintotheacquirer
market for mobile transactions.(5)TaishinbecameoneofthefirstbankstobeapprovedbyNCCCforcreditcardonlinepremiumpayments.(6)ThebankworkedwithMasterCard in launching theMasterPassservice,givingcustomersamore
convenient and safer means of making online payments.(7)AftercollaboratingwithChunghwaTelecomonTSM(TrustedServiceManagement),TaishinBankhas
furtherreplicatedthissuccesswithTWMP’sTSM,offeringcardholderstheoptiontopayfortransactionsusingOTA(OvertheAir)technology.
(8)Exercisecardmanagementtoincreasethenumberandpercentageofactivecards.(9)RebuilttheRoseCardbrandthatconveyedthemessage-“Dedicationmakesawomanbeautiful.”(10)Replaced theold leadselectionapproachwithadvancedmodelanalysis,andapply theanalysis in
behavioral forecasts and loss predictions to enable product customization and precision marketing.(11)Workedacrossdepartments todevelopasalesmodel that incorporatesunsecured loan,mortgageand
auto loan all in one. Adopted a Test & Learn strategy to constantly align the bank’s marketing approach to customers’needs,andimprovedoperatingprocedurestoreducecostsandmaximizeNPV.
5. Future R&D plan(1)Retailbanking
(a)Continueoptimizing loanapplicationprocedures in linewith theauthority’sBank3.0 initiativeandenhance customers’ satisfaction.
(b)Applydifferentiatedcustomermanagement;developacompetitiveedgebyofferingdifferenttypesofretail banking products.
81
05Operating Status 2014 ANNUAL REPORT
(c)UtilizeBigDatatoenhanceperformanceofdevelopedmodels,andimprovecustomerresponseanddealratesthroughdiversifieddistributionchannels.
(d)Activelydevelopmobilepaymentservices(e.g.HCESolution,ApplePay)toprovidecustomerswiththemostsecuredandinnovativebankingexperience.
(e)Developproprietaryonlinepaymentsolutionstocapitalizeontherapidgrowthofonlinepurchases,while in the meantime offer online merchants more diverse user interfaces through which they may conduct business.
(2)Wholesalebanking(a)Combine interest rate,exchangerate,bond,commodityandequity instruments intonewproduct
varieties.(b)Developanewbankingsystemand improveexistingprocess flowand transactioncapacity to
accommodate more product varieties.(c)LaunchRMBservicesinlinewiththeongoingexternalderegulation,whilestrikingtherightbalance
between risk and return.(d)TaishinBankwasgrantedthelicensetounderwriteinternationalbondsbytheCentralBanktowards
theendofSeptember2014;followingthebank’ssuccessinunderwritingitsfirstinternationalbondinNovember2014,moreeffortswillbedevotedtounderwritinginternationalbondsforforeignissuers.
(e)Exploreoffshorebankingopportunitiesandexpand thebank’soverseaspresence;enhance theelectronictradingplatformtosatisfycustomers’needsforcross-borderfundtransfers.
e. Short- and long-term business development plans
1. Wealth management (1)Short-termbusinessdevelopmentplan
(a)ApplyprecisiondataanalysisandintegrateresourcesthroughoutTaishinFinancialGrouptoenablecustomizedmarketingandmaximizecosteffectiveness.Providecustomerswithtailor-madefinanceand debt solutions which in turn result in greater satisfaction and higher AUM.
(b)Integrateresourcesacrosswholesaleandretailbankingto introduceacomprehensiveproduct lineandOBUexclusives,thatcompletelyaddressassetallocationandwealthmanagementconcernsofcompanies and their owners.
(c)Introducefamily-orientedsolutionstoaddresscustomers’inheritanceconcerns.(d)Promotewealthmanagement loyaltyprograms;stimulateactivebanking relationshipsusing the
“wealth management reward points” program.(e)Adopta localizedapproachforcustomermanagement.Aimtoprovide“thebestservice” forhigher
customer satisfaction. Target neighboring residents, shops, SME entrepreneurs and salary account holders for opportunities.
(f)Maintainourcustomer-orientedserviceapproachandstringentriskpractices;eliminateinappropriatesellingbehaviorsandprovidewealthmanagementcustomerswithcustomizedtaxplanningandassetallocation solutions.
(g)Offerenhancedprivilegesasrewardstowealthmanagementcustomers.(h)Strengthenthewealthmanagementteam,enhanceemployee’sexpertise.(i)Developstandardizedprocedures forprecisionmarketing;enhancecustomeranalysisandoffer
productsthataddresstheirspecificneeds.(2)Long-termbusinessdevelopmentplan
(a)Offercomprehensiveproduct ranges in linewith theupcomingFreeEconomicPilotZones;utilizeOBUs to assist corporate customers in their local and overseas capital planning.
82
(b)Improveadvisors’serviceefficiencywiththeuseoftheAdvisorysystem.(c)Viasegmentedcustomergroupmanagement,enhance theperformanceof thebankandenhance
customer satisfaction. (d)Achievebreakthroughinprivatebankingbusinessamongdomesticbanks.(e)Activelydevelopoverseasmarkets.
2. Retail banking (1)Short-termbusinessdevelopmentplan
(a)Attractnewcustomersbyofferingexclusiveprivilegesthroughco-brandcards.Offercustomersthefreedom to customize and choose between card packages; increase the number and percentage of activecardstoachievehigherprofitability.
(b)Includefeaturessuchas“electronic ticketandRFIDIC” in thebank’screditcardproducts,offeringcustomers a more convenient form of payment.
(c)Conductbrandingforournewpaymentservicesandcontinuouslyengagemerchants,onlinestores,andelectronicpaymentinstitutionsindevelopinginnovativecashflowandpaymenttools.
(d)Applydatabasemarketingonphysicalandvirtualchannels toserveourexistingcustomerbase,raisingsatisfactionandprofitability.
(e)Developcross-sellingabilitiesamongsalespeopleandbroadentherangeofproductstheysell.Aimto enrich customers’ product holding for higher revenue potentials.
(2)Long-termbusinessdevelopmentplan(a)Following theenactmentofelectronicpayment regulations, thebankwillbeworkingcloselywith
paymentserviceproviderstoextendcashflowservicestomicro-sizemerchants.(b)Refinemodelingandanalysis techniques;explorenewcustomersandnewbusinessopportunities
throughconstantinnovationsandexperiments.(c)Develop new retail banking products; explore profitmargins and competitiveness through
differentiation.(d)Makeefficientuseofcapital;refineriskmanagementpractices;raiseproductprofitabilitybystriking
the right balance between risk and revenue.3. Wholesale Banking
(1)Short-termbusinessdevelopmentplan(a)Materializesegmentedcustomergroupmanagement.Allocategroupresourcestodeliver themost
comprehensivefinancialservices.(b)Enforceupper limitcontrol throughout thegroup toensureoptimalallocationofcredit riskamong
subsidiaries.(c)Expand relationshipswithsecuritiescustomers throughcash flowservicesanddemanddeposit
privileges; increase the percentage of customers’ demand deposits for lower funding costs.(d)Enhancecollaborationbetween retail andwholesalebankingsegments; replicate successful
experiences;explorepotentialSMEcustomers.(e)Buildthebank’soverseastalentpoolthroughregularjobrotation,inordertoaccommodategrowing
businesses.(f)Financepotentialbusinesses inresponseto thegovernment’sculturalandcreativitypolicies,while
paying close attention to risk control.(2)Long-termbusinessdevelopmentplan
(a)Consolidate thefinancialgroup’sdistributionchannelsandresourcestooffer theultimateone-stopshoppingexperience,andaimtobecomecustomers’mostpreferredbank.
(b)Allocategroup resourceswithgreater efficiency; deliver all-round financial services throughsynergisticuseofexistingproductlines.
83
05Operating Status 2014 ANNUAL REPORT
(c)Activelyexploreoverseasmarkets; increaseprofitcontributions fromoverseasandbroaden thebank’spresenceinChinaandtheAsiaPacificregion.
(d)Continue focusingonproduct innovation. Increaseproductpenetrationbyexploringnewanddifferentiated forms of services/products.
4.Trustfinancialservice(1)Short-termbusinessdevelopmentplan
(a)OrganizeInternetbankingpromotionstoconsolidatedinvestmentaccountholders,soastodevelopmassive online customer groups.
(b)Activelystrive formoneyandsecurities trustofcorporatebankingand thebusinessof “CollectiveInvestment Account for Mainland China or Overseas Foreign Employees”, and restricted employees therighttonewshares”soastoexpandthechannelforcorporatebanking.
(c)Provideplanning-typetrustcustomerswithsystematizedtransactionandelectronicservicestosatisfycustomer’s need.
(d)Develop“employeewelfaretrust”businessandprovidecorporate-bankingcustomersdiversifiedtrustproducts,soastodeveloppersonalwealth-managementbusinessforemployees.
(e)Developadigitalbankingenvironmentwithmoreconvenientservicessuchaselectronicaccountopening and transaction services.
(f)Expand thesalesvolumeoffinancialproductsand thescaleofassetsundermanagementon thebasis of asset allocation.
(g)DevelopanoverseasETForderplacementplatformwherecustomerscanplace limit orders.Introduce80kindsofETFsandpreferredstockonaregularbasis,givingcustomerstheflexibilitytorespond to market changes.
(h)Continue toprovidequalityoverseasfinancialbondsandcorporatebondsdenominated invariousforeigncurrencies (includingRMB), introducehigh-yieldDimSumbondsandcorporatebondswith theopeningof theFreeEconomicPilotZones, tohelpwithassetallocationofcustomerswithpreferenceforfixedyields.
(i)Offerstructured investmentssuited toprofessional investorsandexclusive toOBUcustomers toenhance the bank’s relations with high net worth customers.
(j)Reachpotentialcustomersand increase theamountofassetsundermanagementbypublishingperiodicals, organizing investment seminars and marketing campaigns etc.
(k)Carefullyselectand introducenewthematic fundsaheadof themarket;aimtosatisfycustomers’needs for variety and proper asset allocation.
(l)Provideabundant financial informationover the Internet,andaim todeliver theultimateone-stopshoppingexperienceviatheInternetplatform.
(m)Consolidatecustomers’ financialgoalsat variousstagesof their lives to introducesystematicinvestment plans, which help accumulate asset base over time.
(2)Long-termbusinessdevelopmentplan(a)Developvarious “securities trust” tosatisfy themultipleneedsofcustomers for taxsavingsand
revenue creation, so as to increase market share and gain leadership in the market.(b)Establishsystemplatformforselfselectionofinvestmenttargetsforemployeewelfaretrust,soasto
tap the business opportunities related to self selection of investment targets by laborers for pension funds.
(c)Continueconcerningaboutchangeinregulations,soastodevelopnewtrustbusiness.(d)Inpromotingfinancialproduct,itisnecessarytoperiodicallyreviewneworrevisedannouncedbythe
government.(e)Continuetrackanddeveloprisk-management indices,soastograspproductperformanceandrisk
for customers.(f)Continue introducingpluralizednewproductsandbusiness, inorder tobringsteady returns to
investors in both bullish and bearish markets.
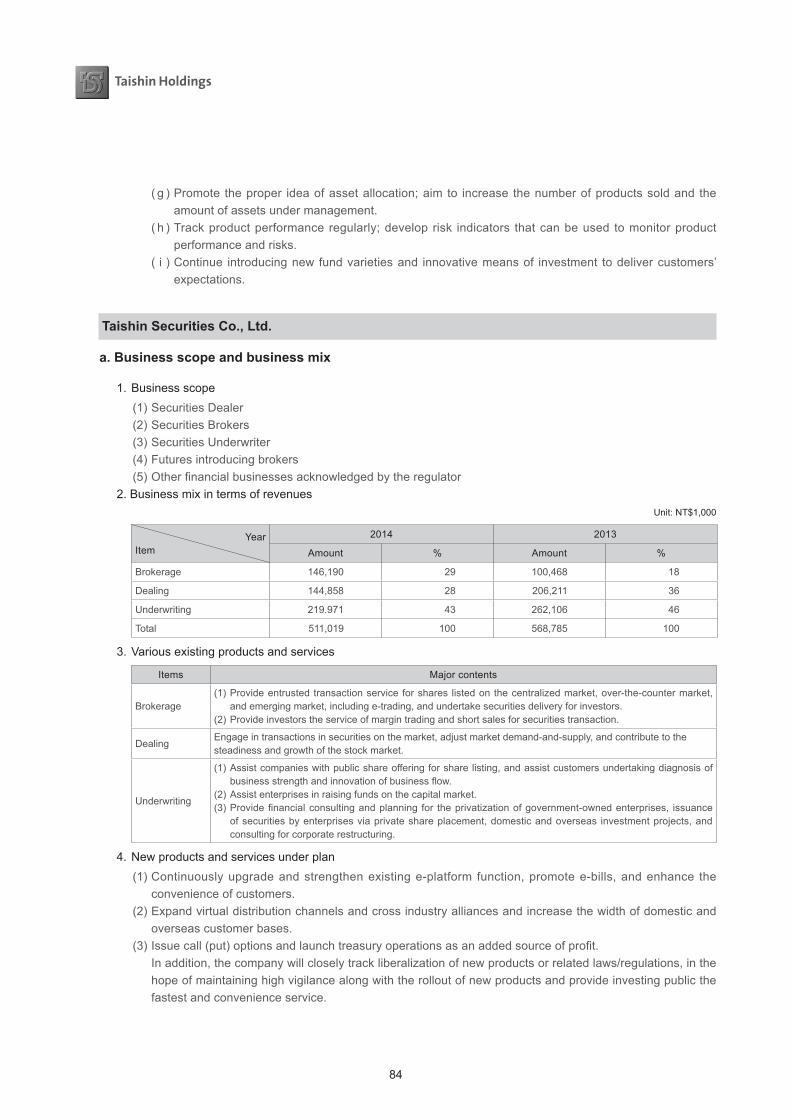
84
(g)Promote theproper ideaofassetallocation;aimto increase thenumberofproductssoldand theamount of assets under management.
(h)Trackproductperformanceregularly;developrisk indicators thatcanbeused tomonitorproductperformance and risks.
(i)Continue introducingnewfundvarietiesand innovativemeansof investment todelivercustomers’expectations.
Taishin Securities Co., Ltd.
a. Business scope and business mix
1. Business scope(1)SecuritiesDealer(2)SecuritiesBrokers(3)SecuritiesUnderwriter(4)Futuresintroducingbrokers(5)Otherfinancialbusinessesacknowledgedbytheregulator
2.Businessmixintermsofrevenues Unit:NT$1,000
YearItem
2014 2013
Amount % Amount %
Brokerage 146,190 29 100,468 18
Dealing 144,858 28 206,211 36
Underwriting 219.971 43 262,106 46
Total 511,019 100 568,785 100
3.Variousexistingproductsandservices
Items Major contents
Brokerage(1)Provideentrustedtransactionserviceforshares listedonthecentralizedmarket,over-the-countermarket,
andemergingmarket,includinge-trading,andundertakesecuritiesdeliveryforinvestors.(2)Provideinvestorstheserviceofmargintradingandshortsalesforsecuritiestransaction.
DealingEngageintransactionsinsecuritiesonthemarket,adjustmarketdemand-and-supply,andcontributetothesteadiness and growth of the stock market.
Underwriting
(1)Assistcompanieswithpublicshareofferingforsharelisting,andassistcustomersundertakingdiagnosisofbusinessstrengthandinnovationofbusinessflow.
(2)Assistenterprisesinraisingfundsonthecapitalmarket.(3)Providefinancialconsultingandplanning for theprivatizationofgovernment-ownedenterprises, issuance
of securities by enterprises via private share placement, domestic and overseas investment projects, and consulting for corporate restructuring.
4.Newproductsandservicesunderplan(1)Continuouslyupgradeandstrengthenexistinge-platform function,promotee-bills,andenhance the
convenience of customers.(2)Expandvirtualdistributionchannelsandcrossindustryalliancesandincreasethewidthofdomesticand
overseas customer bases.(3)Issuecall(put)optionsandlaunchtreasuryoperationsasanaddedsourceofprofit. In addition, the company will closely track liberalization of new products or related laws/regulations, in the
hope of maintaining high vigilance along with the rollout of new products and provide investing public the fastest and convenience service.
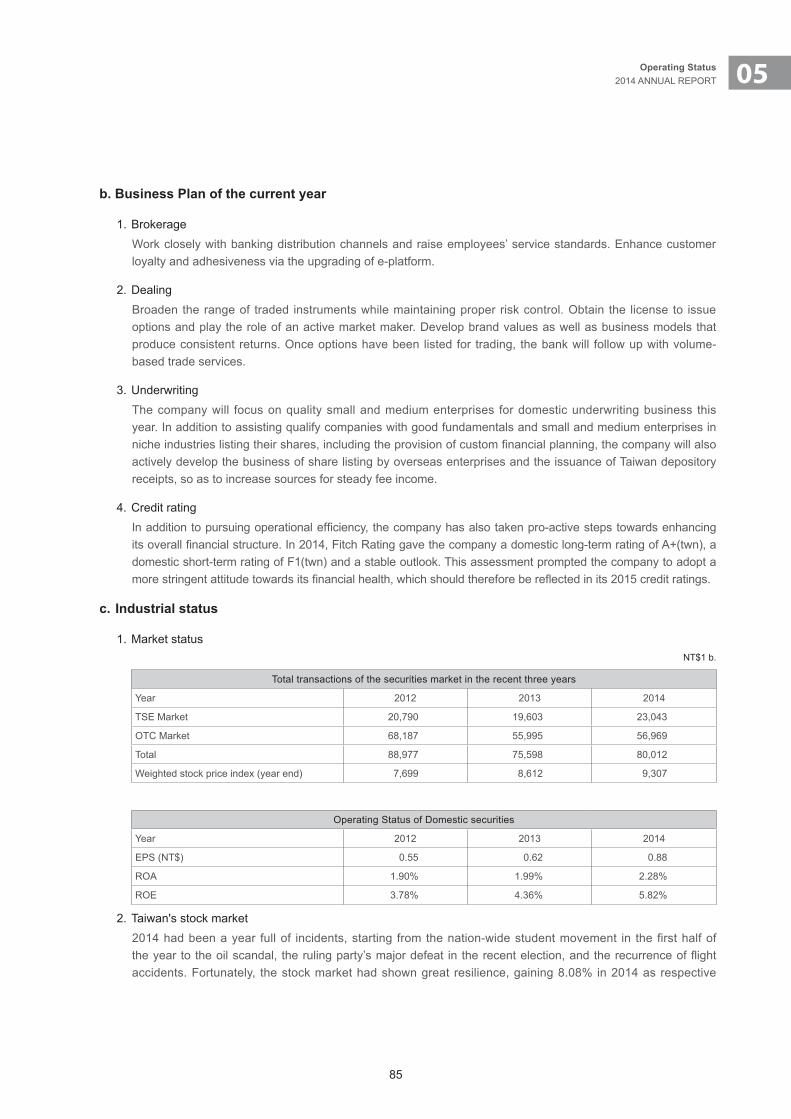
85
05Operating Status 2014 ANNUAL REPORT
b. Business Plan of the current year
1. Brokerage Work closely with banking distribution channels and raise employees’ service standards. Enhance customer loyaltyandadhesivenessviatheupgradingofe-platform.
2. DealingBroaden the range of traded instruments while maintaining proper risk control. Obtain the license to issue options and play the role of an active market maker. Develop brand values as well as business models that produceconsistentreturns.Onceoptionshavebeen listedfor trading, thebankwill followupwithvolume-based trade services.
3. Underwriting Thecompanywill focusonqualitysmallandmediumenterprises fordomesticunderwritingbusiness thisyear.Inadditiontoassistingqualifycompanieswithgoodfundamentalsandsmallandmediumenterprisesinnicheindustrieslistingtheirshares,includingtheprovisionofcustomfinancialplanning,thecompanywillalsoactively develop the business of share listing by overseas enterprises and the issuance of Taiwan depository receipts, so as to increase sources for steady fee income.
4. Credit rating Inadditiontopursuingoperationalefficiency,thecompanyhasalsotakenpro-activestepstowardsenhancingitsoverallfinancialstructure.In2014,FitchRatinggavethecompanyadomesticlong-termratingofA+(twn),adomesticshort-termratingofF1(twn)andastableoutlook.Thisassessmentpromptedthecompanytoadoptamorestringentattitudetowardsitsfinancialhealth,whichshouldthereforebereflectedinits2015creditratings.
c. Industrial status
1. Market statusNT$1b.
Total transactions of the securities market in the recent three years
Year 2012 2013 2014
TSE Market 20,790 19,603 23,043
OTC Market 68,187 55,995 56,969
Total 88,977 75,598 80,012
Weightedstockpriceindex(yearend) 7,699 8,612 9,307
Operating Status of Domestic securities
Year 2012 2013 2014
EPS(NT$) 0.55 0.62 0.88
ROA 1.90% 1.99% 2.28%
ROE 3.78% 4.36% 5.82%
2. Taiwan's stock market2014hadbeenayear fullof incidents,starting fromthenation-widestudentmovement in the firsthalfoftheyeartotheoilscandal, therulingparty’smajordefeat intherecentelection,andtherecurrenceofflightaccidents. Fortunately, the stock market had shown great resilience, gaining 8.08% in 2014 as respective
86
companiesreportedrecord-highearnings.Theelectronicssectorwasthetopperformer,havingdeliveredastaggeringgainof22%thatwasfarbetter thanthefinancialsector’s6.07%.Non-electronics,ontheotherhand, had been stagnant in 2014.
Manyof thegovernment’spolicieswilldeterminehow thestockmarketperforms in2015.Forexample,suspensionofcapitalgains taxaddendumthatworksagainst the favorof large-volumetraderssinceendof 2014 and the widening of daily gain/loss limits by the FSC at the end of February are likely to increase market tradevolumessignificantlyandattractcapital inflow.However, there is likely tobea50%reductionin imputationcreditcoupledwith increases inbankingbusiness taxesandwealth taxes in2015 thatwillundermine stock market performance. The reduction of imputation credit is believed to have the largest impact.
Overall,theTWSEindexclosedat9,307attheendof2014,withtradevolume(TSEC>SM)increasingby5% over 2013. For the electronics sector, much of that growth was attributed to Apple’s new products, whereas forthefinancialsector,interestandfeeincomehadaccountedformuchofthegrowth.However,earningsofconventional industries had slumped in 2014 due to the slowdown of the Chinese economy, and the fall of commoditypricesespeciallyoil. In2015,corporateearningsarestillexpectedtogrowbutataslowerrate,meaning that there is limited upside gain in the stock market.
d. Research and development
Securitiesisalicensedbusiness.Allsecuritiesfirmsrequiretheapprovalofthecompetentauthorityforservicesand products offered before commencing business. As a result, the company will follow the direction of future deregulation to design products and services that best accommodate customers’ needs.
e. Short- and long-term business development plan
1.Short-termbusinessdevelopmentplan(1)Activelycapitalizeonthefinancialholding’sresourcesviacooperationwithotherunits(suchaswholesale
bankingunit,infinite-cardunit).(2)Continuestrengtheninge-tradingplatform,upgradetheconvenienceandfunctionofoperating-platform
interface,andsteadilyincreasetheshareofe-trading.(3)Investmentriskswereplacedunderstrictcontroltoavoidlosses.(4)Establishoverseasunderwritingbusinessplatform,soastodevelopoverseasunderwritingbusiness.(5)Strengthenpartnershipswithintermediariestoexpandthesourcesforunderwritingcases.(6)Issuecall(put)optionssupportedbyvolume-basedtradeservices.
2.Long-terminvestmentplan(1)Inviewof thegrowing importantof institutional investors in themarket,especiallyqualifieddomestic
institutionalinvestors,thecompanywillcombinetheR&Dresourcesande-tradingsystemofinvestmentconsulting, to develop institutional client business with integrated services.
(2)Arrangevarious trainingcourses foremployeesaccording to theirnatureand types, toenhance theircapability and upgrade the company’s overall competitiveness.
(3)Continuecultivatingenterpriseswithgrowthpotentialandexecutecustomerdeep-cultivationplan, tofacilitatelong-termdevelopmentofunderwritingbusiness.
(4)AsbothsidesofthestraitagreetosupportcompaniesfromMainlandChinatoapplyforlistinginTaiwan,theresourcesundertheholdingcompanywillbeusedtoseekgrowthintheT-sharemarket.
(5)FormtimelystrategicallianceswithChinesesecuritiesdealersinsupportofECFAonderegulatingcrossstrait securities trading.
(6)Developafulllineofspecializedbusinessesandcreateacompletedatabase.
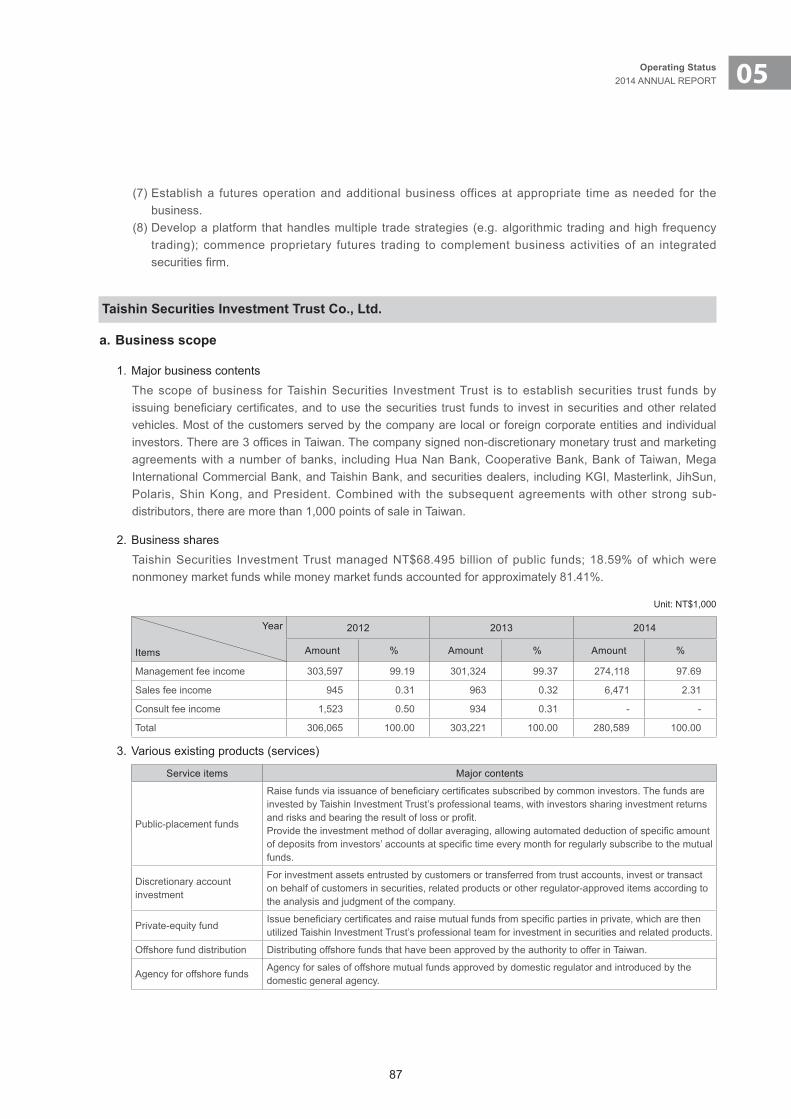
87
05Operating Status 2014 ANNUAL REPORT
(7)Establisha futuresoperationandadditionalbusinessofficesatappropriate timeasneeded for thebusiness.
(8)Developaplatformthathandlesmultiple tradestrategies(e.g.algorithmic tradingandhigh frequencytrading); commenceproprietary futures trading tocomplementbusinessactivitiesofan integratedsecuritiesfirm.
Taishin Securities Investment Trust Co., Ltd.
a. Business scope
1. Major business contentsThe scope of business for Taishin Securities Investment Trust is to establish securities trust funds by issuingbeneficiarycertificates,andtousethesecuritiestrust fundsto invest insecuritiesandotherrelatedvehicles. Most of the customers served by the company are local or foreign corporate entities and individual investors.Thereare3officesinTaiwan.Thecompanysignednon-discretionarymonetarytrustandmarketingagreementswithanumberofbanks, includingHuaNanBank,CooperativeBank,BankofTaiwan,MegaInternationalCommercialBank,andTaishinBank,andsecuritiesdealers, includingKGI,Masterlink,JihSun,Polaris,ShinKong,andPresident.Combinedwith thesubsequentagreementswithotherstrongsub-distributors, there are more than 1,000 points of sale in Taiwan.
2. Business sharesTaishinSecurities InvestmentTrustmanagedNT$68.495billionofpublic funds;18.59%ofwhichwerenonmoneymarketfundswhilemoneymarketfundsaccountedforapproximately81.41%.
Unit:NT$1,000
Year
Items
2012 2013 2014
Amount % Amount % Amount %
Management fee income 303,597 99.19 301,324 99.37 274,118 97.69
Sales fee income 945 0.31 963 0.32 6,471 2.31
Consult fee income 1,523 0.50 934 0.31 - -
Total 306,065 100.00 303,221 100.00 280,589 100.00
3.Variousexistingproducts(services)
Service items Major contents
Public-placementfunds
Raisefundsviaissuanceofbeneficiarycertificatessubscribedbycommoninvestors.Thefundsareinvested by Taishin Investment Trust’s professional teams, with investors sharing investment returns andrisksandbearingtheresultoflossorprofit.Providetheinvestmentmethodofdollaraveraging,allowingautomateddeductionofspecificamountofdepositsfrominvestors’accountsatspecifictimeeverymonthforregularlysubscribetothemutualfunds.
Discretionary account investment
For investment assets entrusted by customers or transferred from trust accounts, invest or transact onbehalfofcustomersinsecurities,relatedproductsorotherregulator-approveditemsaccordingtothe analysis and judgment of the company.
Private-equityfundIssuebeneficiarycertificatesandraisemutualfundsfromspecificpartiesinprivate,whicharethenutilized Taishin Investment Trust’s professional team for investment in securities and related products.
Offshore fund distribution Distributing offshore funds that have been approved by the authority to offer in Taiwan.
Agency for offshore funds Agency for sales of offshore mutual funds approved by domestic regulator and introduced by the domestic general agency.
88
4.Newproducts(service)underplanTaishinSITCwillcontinuetobroadenitsoverseasproductline,introducequalityoffshorefunds,andenhanceelectronictradingservicesparticularlywithregardstoefficiencyandsecurity.Inadditiontotradingconvenienceandonlinetradingplatformwithcompleteinformation,itwillalsoactivelyplantailor-madeservicefunctionforcustomersandimprovetheefficiencyandsecurityofonlinetrading.Basedontheblueprintof“takerootonnewChinaanddeep-cultivateneweconomy,” thecompanywilldedicateto“thediscoveryofnewvalueandcreation of new fortune” for clients, with the goal of tapping the markets of greater China, assets allocation, andpensionfunds,soastocreateaqualitybrand,worthyofthetrustofinvestorsandthesupportofbusinesspartners.
b. Business plan of the current year
1. Offer premium fund selections and increase AUMEnrichtheexistingportfolioofTaiwanequityfundsandGreaterChinaseries,whileinthemeantimedevelopproductlinesinotheroverseasmarkets.Combineresearchresourcestodeliverconsistentlong-termreturns.FocusonincreasingtheAUMofnon-monetaryfundsandimprovingthecompany’sbusinessperformance.
2. Enhance customer management and reinforce business partnershipsPromoteproductawareness through theuseofmarketingandadvertisingcampaigns.Applyeffectiverelationshipmanagementandprovidecustomerswithbetterfinancialservices,andinthemeantimestrengthencollaborativerelationshipswithbanks,securitiesfirmsandotherbusinesspartners.
c. Industrial status
Asof theendofDecember2014, therewere37domestic investment trustfirms,with646 fundsunder theirmanagement, totalingNT$1,975billion inscale,1,377contracts fordiscretionaryaccountoperations, totalingNT$1,256.4billioninmanagementscale,and59private-equityfunds,totalingNT$13.2billioninscale.
d. Technology and R&D Status
InJune2014,TaishinSITC introducedanewumbrella fundwith twosub-fundsthatprovideexposure to theChinesemarket.These twosub-fundswerenamelyTaishinCSILeadingConsumptionandServices Index,which isanNTD-denominated fund that tracks theperformanceofCSILeadingConsumptionandServicesIndex,andTaishinRMBMoneyMarketFund.TaishinSITCplacesgreatemphasisonconsolidatingandsharingtheresearchteam’sexperiencetodeliverbetterperformance.Itsresearchteamcurrentlycomprisesofdifferentnichessuchasdomesticequities,greatChinaequities,derivatives,fixedincome,anddiscretionaryinvestment.Theresearchteamandfundmanagersareallwell-experienced in thefieldof investment,andtheirexpertisecoverseverythingfrom:globalmacroeconomics,investmentstrategies,tolocal/foreignequitiesanddebts.
e. Short and long-term development plan
Taishin Investment Trust focuses on customers, talents, products, performance, and brand in its management, withthegoalofbecomingaqualitybrandwiththetrustofinvestors,thesupportofbusinesspartners,loyaltyofemployees and shareholders, and the compliment of social public.
1.Short-termdevelopmentplanMaintain thestableperformanceofmutual funds,expandthesynergyofproduct lineupaftermerger,andraiseemerging-market funds,soas toobtain thequalificationforundertakingtheoutsourcedoperationforgovernment funds and assure the smooth operation after the merger.

89
05Operating Status 2014 ANNUAL REPORT
2.Long-termdevelopmentplanActivelyenhance themarketshareandmanagementscale, increasenon-bondmutual fundclients,andstrengthen capability for allocation of assets, so as to upgrade the visibility and good image of the brand.
Taishin Securities Investment Advisory Co., Ltd.
a. Business Scope
Taishin Securities Investment Advisory Co., Ltd. undertakes two major businesses, research and analysis and general agency for Jupiter Fund.
1. Research and Analysis Division(1)Businesscontents ProvideR&Dresourcestothefinancialholdingcompanyandsubsidiaries.(2)Businessratio In 2014, consulting fee of the Research and Analysis Division accounts for78% of the company’s total
revenue, while general agency of the Jupiter Fund generates the remaining 22%.2.GeneralagencyoftheJupiterFund
(1)Businesscontents Business contents: Introduce offshore fund and serve as its general agency in Taiwan.(2)Businessshares Various sales channels of Taishin group account for 69% of the total sales of the fund, while other
channels account for 31%.
b. Business Plan of the current year
1.Duetothegrowingrelianceof thefinancialholdingcompanyanditssubsidiariesonresearchinformationinformulating business and strategic direction, in the future the research and analysis division will gradually expanditsbusinessscopetomeettheneedofthefinancialholdingcompany.
2.Plantointroducenewseriesfundandnewfundcompaniestomeettheneedsofinvestors.
c. Industrial status
Taiwan“offshore-fundgeneralagency”systemhittheroadinAugust2006,thelargestsystematicchangesincethe introduction of offshore mutual funds to Taiwan, which produces major impact on investors, agents, and domestic managers of offshore funds. The implementation of the general agency system makes the information on offshore funds more transparent and gives investors more protection. The general agent must publicize related fund information, such as the daily book value of funds, net value of subscription and redemption, and investment portfolio and scale. The general agent can also push offshore fund via advertisement and must solve any problem related to the fund wherever the place for subscription. In other words, after the implementation of the general agency system, investors have more channels to buy offshore funds and are entitled to more protection,duetotheexistenceoftransparentinformation.
d. Technological and R&D status: Nil.
e. Short- and long-term business development plans
Sameasdescribedunder“b.BusinessPlanofthecurrentyear”.
90
Taishin Asset Management Co., Ltd.
a. Business scope
1. Business contentsThecompany’smajorbusinessitemsincludethepurchaseofmoney-debtclaimsfromfinancialinstitutions,theappraisalandauctioningofmoney-debtclaimsoffinancial institutions,andthemanagementofmoney-debtclaimsandoverdueaccountsreceivablesforfinancialinstitutions.
2.BusinessmixThecompanyfocusesonthepurchaseanddisposalofmoney-debtclaimsfromfinancialinstitutions.
b. Business development plan of the current year
1.Bidforwhole-packagebad-debtclaimsoffinancialinstitutions2.Negotiatewithpeersonacase-by-casebasisforthepurchaseofbad-debtclaims.3.Thecompanywillbeeying tobuy foreclosedproperties inTaipeiCityandNewTaipeiCityatdiscountedprices,andinvestsmallsumstoimprovepropertyconditionsbeforesellingataprofit.
4.ThecompanywillfollowFSC’sresolutionsdatedDecember2014andmakemorevaluableuseofitsexistingrealestateproperties.ThecompanyalsoplanstomakemoreefficientuseofidleassetsownedbyothersubsidiariesofTaishinFinancialGroup,andenablenewlyacquiredpropertiestoappreciatebeforesellingforprofit.
c. Industry status
For thedomesticbad-debtclaimmarket,alongwith theupturnof thegeneraleconomyandplunge innon-performing loanration,bad-debtclaimsreleasedby thefinancial institutionsplummetedtoNT$60billionperyear in2008and2009,down fromthepeakofNT$236.8billion in2007,whichdropped further toNT$58.4billionin2010,NT$50.4billionin2011,NT$40billionin2012&NT$9.3billionin2013&NT$0.9billionin2014.Itisapparentthatthedomesticbad-debtclaimmarkethascontractedandwinningbiddingpricesforsalesofbad-debtclaimsontheblockfrequentlyreachnewhighs,greatlyboostingtheriskofinvestmentloss.
What was more challenging was the fact that the Financial Supervisory Commission issued an instruction in May 2013tolimitthesaleofnon-performingloansbyfinancialinstitutionswithoverdueloanratiosabove3%.Later,inAugust2013,theFSCannouncedthatcorporatedebtwouldbetreatedinthesamemannerasnon-corporatedebt,sothatdebtentitlementcannotbetransferredtothirdparties.Furthermore,theFSCalsorequiredassetmanagement companies to renegotiate borrowing terms with debtors according to the Statute for Consumer DebtReform.Thesemeasureshavelimiteddebtmanagers’abilitiestoacquireviableinvestmentsanddisposeofunder-performers,andthereforethreatenthesurvivalofthedebtmanagementbusiness.
Competitionamongvariousassetsmanagementcompaniesnextyearwillbecomeeven fiercernextyear,aggravatingtheirbusinessdifficulty.However,withtheintroductionoftheLuxuryTaxinJuly2011accompaniedbyCentralBank limitsonconstruction loans, taxeson luxurypropertiesetc, thegovernmenthasbeenableto suppress speculative activity in the real estate market. With housing prices showing signs of decline after prolonged periods of reduced trade volume and lengthened deal cycles, it is likely that investors may undergo awaveof foreclosuresand increasethesupplyofcourt-auctionedproperties. InterestratehikesfollowingthescalebackofQEarealsoexpectedtoaffectTaiwantoacertaindegree.Therise inmarket interestrateswilleventuallyputfinancialpressureonconstructors,andcompelthemtoforce-sellunsoldpropertiesresultinginadownturnintherealestatemarket;certaindevelopmentsmayevenbecomenon-performingdebtsasaresult.Either way, Taishin Asset Management will follow up closely on market changes.
91
05Operating Status 2014 ANNUAL REPORT
Inanattempt togiveAMCsmore rooms tooperate, theFSCheldameeting inNovember2014and laterannounced in December 2014 a number of business activities that have been allowed for AMCs. This deregulation may provide AMCs with added sources of income.
d. Research and development: Nil.
e. Short- and long-term business development plans
1.Biddingforbad-debtclaims(1)Continuehandlingbad-debtclaimspurchasedfromTaishinBank(forbothwholesalebankingandretail
bankingbaddebtclaims).(2)Continuehandlingbad-debtclaimspurchasedfromKuoHuaNon-Life insurance(mainly forconsumer-
bankingandinsurancedebtclaims)(3)Continuehandlingofbad-debtclaimspurchased fromMegaBankandFarEasternBank (Corporate
bankingbad-debtclaims)(4)Continuebiddingforbad-debtclaimswithpeersinpublicbidding(5)Purchasebad-debtclaimsvianegotiationandcooperatewithprivateAMCfirmsforindividualcases,an
arrangement enabling the company to have easier grasp of the capital planning, risk assessment, and investment cases via participation in the selection of cases.
(6)Purchaseclaims tonon-performing loanssecuredbyplotsof land ingreaterTaipeiandexpand landdevelopment business via arrangement of debt claims.
(7)Turnbaddebtintosyndicatedloansorintegratereliefloanstocompanies.2. Bidding at foreclosure auctions
BidatlowpricesforitemsatforeclosureauctionsthataretheresultofbaddebtfromfinancialinstitutionsintheGreaterTaipeiareaandresellforprofitafterprocessingtheownershipandtheproperty.
3. The OthersThecompanywillfollowFSC’sresolutionsdatedDecember2014andmakemorevaluableuseofitsexistingrealestateproperties.ThecompanyalsoplanstomakemoreefficientuseofidleassetsownedbyothersubsidiariesofTaishinFinancialGroup,andenablenewlyacquiredpropertiestoappreciatebeforesellingforprofit.
Taishin Venture Capital Co., Ltd.
a. Business scope
1. Business contentsTaishinVentureCapitalwillcarryoutventure-capitalbusinessaccordingto“measuresfor thescopeofandassistances for venture capital business” and the “guidelines for investment policy” formulated by the company. TaishinVentureCapitalwill seek topinpoint investment targetswith long-termdevelopmentandprofitpotential, as well as lower risks via proper industrial and regional deployment, in order to form an investment portfoliocapableofgeneratingbothshort-andlong-termprofits.Thecompanywillfocusitsinvestmentsonthefollowing industries and technologies with development potential:(1)Venturecapitalindustry(2)Informationtechnologyindustry(3)Bio-techindustry(4)Traditionalindustry(5)serviceindustry(6)otherindustries

92
Among the aforementioned investment targets, focuses will be put on companies with both good management and investment performance in venture capital industry; energy and optoelectronics, wireless and mobile communications, semiconductor, advanced materials, digital contents, online security, and application software ininformationtechnologyindustry;thedevelopmentofnewmedicines,specialmedicines,medicalequipmentandappliances,andmedical/healthcare inbio-tech industry;andniche linescapableofcreating industrialstatus and entry threshold in traditional and service industries.
2.NewfinancialproductsandservicestobedevelopedinthefutureVenturecapitalcanbesaidtobethevanguardofcorporatefinancialservices.Aventurecapitalistidentifiesanewstartupwithpotentialandacommercialbankprovidesfinancing,followedbyasecuritiesunderwritertoassistwith listing/OTClisting inordertocreategreatersynergyforafinancialholdingcompany.Inaddition,whenthegovernmenthasderegulatedventurecapitalbusinesses, thecompanywillactivelyexplore listed/OTCcompanieswithunderpricedsharesandapositiveoutlooktoinvestandcreateprofitableopportunities.
b. Business development plan of the current year
Thecompanywas incorporated towards theendofSeptember2003withsharecapitalofNT$1billion. Inanattempt tostrengthen its financialstructure, thecompanyunderwentcapital reductionofNT$180,965,050in2010 tooffsetaccumulated lossesandsubsequently raisedcapitalofNT$800,000,000,NT$600,000,000andNT$1,110,000,000 in2012,2013and2014, respectively.Sharecapitalat theendof2014amounted toNT$3,329,034,950.
In2014,thecompanyearnedNT$30,734,000inrevenueandincurredNT$75,602,000inlossesandexpenses,whichresulted inanafter-tax lossofNT$44,859,000.This losswasmainlyattributedtothenon-profitabilityoffinancialleasingsubsidiariesestablishedinNanjingandTianjin,astheywerebothintheirinitialstages,andtherecognitionofimpairmentlossesonlong-terminvestments.
In 2014, the company had increased investment and strengthened its holding position in Diamond BioFund Inc., Innostor Technology Corporation, and 5 offshore companies including China Financial Leasing Co., Ltd. and StemCyte fora totalofNT$867,790,000.Thecompanygeneratedcash inflowstotalingNT$98,494,000 frominvestments,ofwhichNT$3,910,000werecontributedbycashdividends,NT$33,850,000by liquidationandcapital reduction,andNT$60,734,000bydisposingofZhongyangVentureCapital,PrimaxElectronics,DoubleEdge Entertainment, and Systems & Technology Corp.
As at the end of 2014, the company had 21 investees on book.
The company’s investment strategies in 2015 will still largely involve disposing shares held by Taishin Venture Capital,andshifting focus towards theGreaterChina region, returning IPOs,andcompetitivehigh-tech,biotechandhealthcarecompanies inTaiwan.Thecompanyexpects toadd1~3 local/foreign investments intotheportfolio,orsubscribetocashissuesofferedbycompaniesofitsexistingportfolioin2015.AsumbetweenNT$100million~NT$300millionisexpectedtobeinvested.ThisinvestmentwillmostlycompriseofassetsfromtheGreaterChinaregion,andpartiallyfromforeigncountries.
The listed companies in the company’s investment portfolio include: Li Kang Biomedical Co., Ltd. and Darfon ElectronicCorp,PrimaxTechnologies,BAFOTechnologies,andMicrobio. Inaddition, the finance leasingsubsidiary inChina inwhichthecompanyinvestswillstart toexpanditsoperationsthisyear,andisexpectedtocreatepositivebenefits.Thecompany’sportfoliocomprisesofseveralinvestmentsthatarelikelytobelistedorbecomeliquidoverthenext1to3years,including:StemCyteInc.,JHLBiotechInc.andInnostorTechnologyCorporation. These investments should result in gains once they are openly traded on the market.
93
05Operating Status 2014 ANNUAL REPORT
c. Industry Status
ThefirstventurecapitalfirminTaiwanwasestablishedin1984.Inalmost30yearsofdevelopment,accordingtoasurveybytheTaiwanVentureCapitalAssociation,theindustryinvestedmorethanNT$260billioninmorethan14,000projectsinTaiwan,helping400companiesbecomelistedcompanies,andfacilitatedNT$2.3trillionincapital investment.However, theventurecapital industry inTaiwanhadfacedchallengesfromthedot-combubble in theUnitedStates, theglobalfinancialcrisis,andthecancellationof investmentcredits fordomesticventurecapital investorssince2000.Theventurecapital industryiscurrentlyfacingcashflowsthataredryingup at an alarming speed. According to statistics released by the Taiwan Venture Capital Association, the number ofnewlyestablishedventurecapitalfirmsbetween2001and2007was48%of thatbetween1995and2000,and the new capital increase on average fell to only 80% of that between 1995 and 2000.
Based on the latest statistics published by Taiwan Venture Capital Association, a total of 14 new venture capital firmshadbeenestablishedbetweenJanuaryandAugust2014, representingNT$8.911billion innewsharecapital.ShengtaVentureCapitalwasperhapsthemostprominentestablishmentofall;foundedbyHuangQing-Yuan(independentdirectorofCathayFinancialHolding)andGaryKuo(formerExecutiveDirectorofMorganStanleyTaiwan),thenewventurecapitalfirmhasraisedNT$5billiontoinvestinanythingrangingfrommedicalelectronics,electriccars,healthcare,toe-commerceintheGreaterChinaregion.AsattheendofAugust2014,there were 233 venture capital companies still in operation.
AccordingtoastudypublishedbyU.S.researchinstitutionPitchBook,theworld’sventurecapitalindustryasawholehadgrownin thefirst threequartersof2014,whether in termsofamountsraisedoramounts invested.This growth shows that venture capital investment remains favorable to investors worldwide.
Amountofcapitalraised:Inthefirst threequartersof2014,atotalofUS$25.1billionhadbeenraisedby153venturecapitalfunds,whichmorethandoubledcomparedtolastyear’sUS$11.15billion.Therewere5venturecapitalfundsthatraisedmorethanUS$1billionontheirown.
Amountofcapitalinvested:Inthefirstthreequartersof2014,theworld’sventurecapitalfundsinvestedasumofUS$43.47billion in3,879 investments,setting thehighest recordofamounts investedoverQ1~Q3sincethe Internet bubble in 2000. The most active venture capital companies were entirely of U.S. origin, including well-knownnamessuchas:SequoiaCapital,AndreessenHorowitz,AccelPartners,andKleinerPerkinsCaufield&Byers.43%of investmentsweresoftware-related,whereas5%wereassociatedwithmedicineandbiotechnology.
Exits:Theexodusofinvestmentsalsoreacheditspeakinthefirstthreequartersof2014,asUS$49.38billionwerewithdrawn froma totalof609cases, farexceeding theUS$34.51billionayearago.Thiswas largelyattributedtoFacebook’sacquisitionofWhatsAppforUS$19billioninthesecondquarter.
Meanwhile, in view of the overall competitiveness of Taiwanese enterprises deriving from the clustering effect, substantial investmentreturnscanbeexpectedfrominvesting inTaiwaneseoroverseasTaiwanese-investedcompanies and urging them to pursue growth in Taiwan. Therefore, Taishin Venture Capital has invested 80% of itsfundinhi-techindustriesinTaiwan.
d. Research and Development
Venturecapitalcanoftenserveasapioneerofwholesale-bankingbusiness, firstpinpointingstartupswithdevelopmentpotentialforcommercialbanktoprovidefundingsupportlateronandsecuritiesunderwritingfirmto assist them in share listing, thereby generating greater integrated benefits for financial holding firm. Over
94
thepastfiveyears,duetotheover-supplyoftheglobalindustryandlowPE(price/earnings)ratiooftechfirms,venturecapitalfirmsworldwidehavebeen looking fornew industrialdirection. In recentyears, thanks to theexpansionof the investmentscopeofventurecapital firmsby thegovernment,venturecapitalcanactivelypinpointand invest in listedTaiwanesefirmswithundervaluedstocksandgoodbusinessprospects, therebyincreasingtheirprofit-makingopportunities.
e. Short- and Long-term Business Development Plan
Investment strategy over the short term will be focused on disposal of shares held by Taishin Venture Capital, and investing intoundervaluedassetswithgood liquidityover thenext2-3years.Thesemay include IPOsof Taiwanese enterprises and industries in which Taiwan has a competitive advantage such as green energy, optoelectronics,biotech,andhealthcare.ThecompanyplanstoinvestNT$100million-NT$300millioninto1-3newbusinesses,orsubscribetocashissuesofferedbyexistinginvestees.
Formedium-andshort-termstrategy, thecompanywillutilize theresourcesandnetworkofTaishinFinancialHoldinginTaiwanandgreaterChina,aswellasitsprofessionalismandexperienceinfinancialinvestmentandcapitalmarket,toexploregoodinvestmentopportunitiesandwillhelptheinvestedcompanytomakeprofitsbycapitalizingonthesynergybetweenTaishinFinancialHoldingGroupandtheinvestedcompanies.Meanwhile,inresponse to the liberalization of regulations, the company plans to set up a leasing subsidiary in China as part of itslong-terminvestmentstrategy.
The leasingsubsidiarywill initially focusonprovisionofmachineryandequipment toTaiwanese-investedcompaniesvia loaning-oriented leasingmethodandtheoperatingscalewill increasegraduallyalongwith themarketexpansion,productdevelopment,andenhancementofoperatingefficacy.
Taishin Holdings Insurance Brokers Co., Ltd.
a. Business scope
The business scope of Taishin Holdings Insurance Brokers is life insurance brokerage and property and casualty insurance brokerage.
1. Life insurance brokerage (1)Description: Including insuranceproductssuchas lifeandhealth insurance,annuities,andaccident
insurance. (2)Businesssources:Thecommissionincomefromlifeinsurancebrokeragein2014accountedfor99%of
the total commission income. 2.Propertyandcasualtyinsurancebrokerage
(1)Description: Including insuranceproductssuchasfire insurance,motor insurance,accident insurance,and liability insurance.
(2)Businesssources:Thecommission income frompropertyandcasualty insurancebrokerage in2014accounted for 1% of the total commission income.
b. Current year business plan
1. Continue development of distinctive and innovative products that satisfy customers’ needs.2.Workinlinewithgovernmentpoliciestointroducelong-terminsuranceproductssuchasaccidentalcoverage,
nursing care, and retirement planning.
95
05Operating Status 2014 ANNUAL REPORT
3.Enhanceprofessionalqualitiesandskillsof the insurancesales teamby introducingavarietyof trainingcourses.
4.Promote insuranceawarenessthroughtheuseofmedia.Familiarizeemployeeswith insuranceregulationsand ensure that their sales behaviors are compliant with laws.
c. Industry overview
According to statistics prepared by the Life Insurance Association of R.O.C, Taiwanese life insurance companies earnedfirstyearpremiumstotalingNT$1,169.7billionin2014(includingamountsthathavebeenclassifiedasliabilities),whichrepresenteda6%growthover2013.After theFSC imposedmorestringent regulationsonsurrenderchargesandpremiumcollectionsofvariable-interestannuitypolicies, thecompanyshifted itssalesfocusfromvariable-interestannuitytovariable-interestlifeinsurance,onlytobepresentedwithanewregulationthatstoppedthesaleofvariable-interestpoliciesaltogether.Asaresult,premiumson life insurancepoliciesincreasedby27%overthepreviousyeartoNT$923.6billion,whereaspremiumsonannuitypoliciesdecreasedby41%fromthepreviousyear toNT$201.4billion.Premiumsonhealth insurancepolicies increasedby15%over2013toNT$34.1billion.Thiswas largelyduetobroaderacceptance towardshealthcare insurance,andlonger lifeexpectancy thatgaverise toneeds formedicalcare.Premiumsonaccidental insuranceremainedunchangedfrom2013atNT$10.6billion,largelybecauseofthefactthatsuchinsurancepoliciesofferrelativelyhigh coverage at low premiums. In terms of distribution channels, the life insurance company had accounted for43%oftotalsalesalone.Bankingandtheinsurancebrokeragesubsidiaryaccountedforapproximately52%ofsales,whileconventional insurancebrokersandagenciesrepresentedmerely5%.Theamountoffirstyearpremiums delivered by the bank and the insurance brokerage subsidiary still surpassed what the life insurance company was able to achieve through its own channel, though they were the only channels that posted a negative growth.
According toTaiwan Insurance Institute,property insurancepremiumstotaledNT$132.2billion inTaiwan forthe year of 2014, representing a growth of 6% over 2013. Driven by growth in new car sales, premiums on auto insuranceincreased9%toNT$70.2billion,whichaccountedfor53%oftotalunderwrittenpremiums.However,premiumsonmotorcycleinsurancehadfallenasregularlicenserenewalswerenolongerrequired.PremiumsonfireinsuranceandnaturaldisasterinsuranceamountedtoNT$22.7billion,representinga4%growthover2013.Healthcare and accidental insurance have also been a major part of the property insurance segment in recent years,contributingNT$15.5billioninrevenues(5%growthover2013).Premiumsonaccidentalinsurancegrewmerely1%over2013toNT$15.7billion;thiswaslargelycausedbyareductioninpublicinfrastructureprojects.Lastly, premiums on marine insurance had fallen by 4% compared to 2013.
By the end of 2014, there had been more than 800 insurance brokerage companies and agencies in Taiwan hiring a sales force of more than 220,000 people. In an attempt to institute sound corporate governance practices and maintain discipline within the insurance profession, the FSC implemented its latest amendments of “RegulationsGoverningInsuranceAgents”and“RegulationsGoverningInsuranceBrokers”in2014thatrequiredsignificantlyhigherduediligencetorunaninsurancebrokerage/agencycompany.
d. Research and development: Nil.
e. Long- and short-term business plans
1.Short-termbusinessplan(1)Assistcustomerswiththeirassetallocationandinsuranceplans.(2)Developinnovativeproductfeaturesandmodularizedportfoliosasinordertoincreasecustomers’holding
positions.
96
(3)Increase theweightofprotectionpolicies incustomers’portfoliosand focuson introducinghealthcarecoverage to satisfy customers’ needs in different stages of life.
(4)Developpolicies thataim toprovide long-termnursingcare, following the introductionof the latestgovernment regulations.
(5)Raise the intensityanddepthof training to improveemployees’professionalstandardsandservicequality.
(6)Continuouslypromoteemployees’awarenesstowardsregulatorycomplianceandprotectionofpersonalinformation.
2.Long-termbusinessplan(1)Tocontinuetosimplifythesalesprocessandachieveinformationintegrationinordertoprovidepremium
customer services. (2)Toensurelegalcomplianceandprotectcustomerrightsandcorporateimage.(3)Enhanceinformationsecurity.
B.Cross-lineandJointMarketingEfficacy
Accordingtoarticles43of theFinancialHoldingCompanyLaw,financialholdingfirmsandtheirsubsidiariescancarryout jointmarketing,achievingtheefficacyof integratedmanagementvia jointbusinesspushing, informationexchange,orthejointuseofbusinessfacilitiesoroutlets.
SubsidiaryTaishinSecuritiesalreadyinstitutedfromMay2010“specialsecuritiescounters”attheofficesofTaishinBank’s major branches for joint marketing and the undertaking of following businesses:
a. Account opening for securities brokerage business.
b. Agency for sales and redemption of domestic funds.
c.Installationofterminalsforonlineorderplacement,allowinginvestorstoplaceorderswithsecuritiesfirms.
d.Acceptanceofstock-affairsdocumentsforcompanieswithpublicshareoffering.
e. Acceptance of application forms for subscription to the public offering of securities.
The company passed the “measures governing the integrated marketing of Taishin Financial Holding Co.” with the approvalof thechairmanonJuly31,2003,aswellas the“enforcementrules for themarketing-listmanagementof Taishin Financial Holding Co.” and “rules governing the use of client data by the employees of Taishin Financial Holding Co.” in September and December 2003, respectively, and the “measures and enforcement rules governing thewarehousingofclientdataofTaishinFinancialHoldingCo.”inJuly2005,settingupguidelinesforcross-sellingandclientrecommendationforfinancialproductsamongtheemployeesofvarioussubsidiariesorbusinessgroups,so as to facilitate constant monitoring and management.
C. Market and Business Status
Taishin Financial Holding Co., Ltd.
a. Market analysis
1.ThequalitativechangeofthemarketDerivingfromtheconceptofcross-linemanagement,financialholdingcompaniesareexpectedtomanifestasystemintegrating theresourcesandservicesofbusinessgroups, leading toqualitativechanges in the
97
05Operating Status 2014 ANNUAL REPORT
financial markets, including the blurring of the borders among individual markets, the switch from product orientation to customer orientation in the operations of market competitors, and the creation of new integrates servicesandtheexpansionofmarketscalefollowingthejoiningofnewfinancialholdingfirms.
2. Major domestic and foreign competitorsThere are 16 financial holding companies in Taiwan now, with those boasting major banking subsidiaries includingTaishinFinancialHolding,TaiwanFinancialHolding,FirstFinancialHolding,HuaNanFinancialHolding,ChinatrustFinancialHolding,FubonFinancialHolding,YushanFinancialHolding,andSinoPacFinancialHolding,whichenjoystrongedgeinbusinessexpansion.
Foreign competitions consist mainly of U.S. and European banks, including Citibank, Standard Chartered Bank,andHSBC,whichhaveacquired,respectively, theBankofOverseasChinese,HsinchuInternationalBank,andtheChineseBank.Thoseforeignbankshaveposedmajorchallengestodomesticfinancialholdingcompanies, thanks to their enhanced operational scale on the domestic market, niche positions in the greater China market, mature operating mode, and edge in product lineup and marketing.
b. Competitive strategy
Thecompany’scompetitivestrategyfocusesonrebuildingagoodfinancial-servicebrandexternallyandpushinglean processing internally, via the following concrete measures:
1.ExpandingbusinessscopeandcreatingsynergyAchievethefollowinggoalsviaM&A(mergerandacquisition),cross-linealliances,or theestablishmentofoverseasplatform:1)expandbusinessdomainandcreatebusinessopportunities;2)engage incross-linemanagementtoenhanceassetsmanagementcapability,profit-makingcapability,andinvestmentreturnsrate;3)createbusiness integrationandenhancemarketingefficiency;4)achieveeconomyofscaleandprovideclientsbetter-than-expectationservicequalityatreasonablecost.
2. Strengthen management and strictly control riskStrengthenriskmanagement,upholdassetsquality, implementassets/liabilitymanagement,monitorandcontrol liquidityrisk,effectivelyutilizeshort-termfund,intensifytheevaluationandmanagementof long-terminvestments, raise fund yield, and carry out auditing and internal control system.
3.Strengthenproductandall-roundservicesInstituteall-roundfinancialservices, includingbanking,commercialpaper(bond),securities, insurance,andassets management, strive for retail and wholesale banking business opportunities, and carry out cross selling and the integration of operating platform.
4.Embraceclientgroup-orientationanddivision-of-laboroperationCarryout in-depthmanagementofclientdata,differentiateclientgroups,embraceclientgroup-orientedoperation,developwhole-package tailor-madeproducts fordifferentclientgroups, instituteproprietarybusiness teams for different client groups, train salesmen to obtain complete product knowledge, service clientsvia3S(Simple,Sincere,Superior),andmanageriskandcreatefortuneforclients.
5. Strengthen human resources and cultivate talentsEnhancemanpowerquality,cultivatetalents,stressthecareerdevelopment,workingflexibility,andsatisfactionof employees, and foster a cooperative corporate culture.

98
c. Competitive niches
1. Integrated channelTaishin Financial Holding puts under its auspices various subsidiaries, including Taishin International Bank, Taishin Securities, Taishin Securities, Taishin Investment Trust / Investment Advisory and Taishin Holdings Insurance Brokers boasting different kinds of sales channels, whose integration can cover different client groupsandoffermoreservicepointsfortheprovisionofrelatedfinancialconsulting.
2.ProvisionofpluralproductsProductmultiplicationisindispensableinordertomeetclients’needsfordifferentproductsatdifferenttimes.“Making Taishin a treasury bowl of clients” has been an enduring vision of the company. The company aims toprovideclientsone-stopshoppingservicewiththeappealsof timesavingandhighservicequality. Inthefuture,thecompanywilldifferentiateexistingclientsandprovidethemcustomproducts,therebyachievingthegoal of cross selling.
d. Favorable and unfavorable factors for development outlook
1. Favorable factors(1)Government’sopeningstanceforcross-Straitfinancialservice(2)TaishinFinancialHoldingboastscompleteproduct lineupcoveringbanking, securities, insurance,
commercialpaper(bond),andwealthmanagement.(3)TaishinBankcanofferclientsbestservicestomeettheirneedsviatheirextensivechannels.(4)Amid the financial-institutionmerger trend in thedomesticmarket,TaishinFinancialHoldingcanoffer
clientssatisfactoryservices,meetingtheirdemandsforlong-termpartnership.2. Unfavorable factors
(1)Thereare16domesticfinancialholdingcompanies, leadingtoacutecompetition,especially inviewoftheir homogeneity in product development and packaging.
(2)TheexpansionofoperationalscalesviaM&A(mergerandacquisition)bysomedomesticfinancialholdingfirmsandforeignbanks,suchasTaiwanFinancialHolding,YuantaFinancialHolding,Citibank,StandardChartered Bank, and HSBC, has posed rigorous challenges to other players. Foreign banks will become formidable competitors on the domestic market, adding their indigenous presence and channel to their internationalbrandandexpertiseinbusinessexpansion.
Taishin International Bank Co.,Ltd.
a. Major products and services
Thebank’smajorbusiness items includedeposit reception, loanextension,export/import foreignexchange,foreign-currencydeposits,discountofnegotiable instruments,currencyconversion,guarantee,surrogatecollection/payment,custody,trust,creditcard,tradinginderivatives,brokerageofshort-termcommercialpaper,brokerageofshort-termbills,securitiesdealer,certificationandunderwriting, factoring,securities investmentandunderwriting,offshorebanking,andtheissuanceoffinancialbonds.
Sinceitsestablishment,thebankhasbeenconstantlyexpandingbusinessitemsandoperatingnetwork,activelyexercisingtheintermediaryroleforthesupplyanddemandoffundsinthesociety,soastosupporteconomicprosperity. Regarding business network, the bank has set up branches in major cities in Taiwan and has been actively establishing overseas units, in compliance with the trend of financial internationalization, including offshorebankingunit,thebankboasts98domesticbranches,testifyingtoextensivenessofitsservicenetwork.
99
05Operating Status 2014 ANNUAL REPORT
b. Future supply and demand
Basedon IMF’s2015global economic forecast, theU.S.economy isexpected toachieveagrowthof3.1%,whereasJapanand theEurozoneare likely toexperiencemarginalgrowthofmerely0.8%and1.3%,respectively, with China slowing down to 7.1%. Meanwhile, The Economist considered the plummet in oil prices, theRussianfinancialcrisis,andweakeconomicgrowthinGermanyandJapantobesimilartowhattheworldhadexperiencedtowardstheendofthe1990s,whichsignifiestheupcomingofyetanotherglobalcrisisin2015.
The Economist has pointed out three recurring phenomenons that are of utmost concern at this point. Firstly, onlytheU.S.economyisexperiencingrisinggrowthrateswhilealmosteveryothereconomyisslowingdown.Although theU.S. isexperiencinga rapid improvement to itsunemploymentproblem,aswellas increasedconsumer spending and commercial investments due to a fall in oil prices, the price fall may be just as likely tobankruptmanyshalegasexplorers,whereas thestrengtheningof theU.S.dollarcoupledwithweakeningeconomiesinotherpartsoftheworldwilleventuallyhurtU.S.exports.
Secondly, theGermanandJapaneseeconomiesare facingpessimisticoutlooks.Germanyhasseen itseconomic growth dropped to 1.3% and is currently suffering from a lack of investments, failure of its energy initiative, and the government’s persistence on austerity measures. In the meantime, Japan has repeated the mistake itmade in1997,raising itsconsumptiontax tooearlywhichhaspushedtheeconomyto thebrinkofrecession.
Thirdly, emerging markets especially Russia are showing signs of decline, whereas countries that rely heavily oncommodityexports,particularlyAfrica,arealsoinafragilestate.Companiesinsomeofthesecountriesareheavily burdened by debts denominated in U.S. dollar. This bankruptcy wave may not be as severe as what was experienced in the1990s,but itwillstillcausepanic to investorsnonethelessandstrengthen theU.S.dollareven further.
Taiwan, on the other hand, is showing signs of recovery after a strong performance in 2014. Driven by a rise in domesticdemand,realGDPgrowthhit3.64%inthefirstthreequarters.AccordingtoAcademiaSinica,Taiwan’seconomic growth for the full year of 2014 is estimated at 3.42%. As for 2015, the fall of commodity prices worldwide coupled with the strengthening of the U.S. dollar will favor growth in international trade in the coming year. However, Taiwan’s growth potential will be limited by weakening trade demands from China, resulting in a slightly reduced growth rate of 3.38%.
c. Business goal
In2015,thebankwillcontinuepursueasteadygrowthemphasizingbothqualityandquantity,soastoachievea balance between risk management and market profit. In addition to the provision of pluralized packaged products,subsidiariesof thefinancialholdingcompanywillcarryoutcrossselling improveoperatingflow,andupgradebrandimage,inordertostrengthentheirleadingstatusonthemarket.Materializationofthe“customer-centered” business model and continuation of launching innovative products and service to meet customer needs will also be a major goal for upgrading corporate value.
d. Favorable and unfavorable factors for development outlook
1. Competitive niches (1)Ability to integrateamultitudeofproductsofferedunder the financialholdinggroup;commitment to
financial product/service innovation; attention to customers’ multidimensional needs; and the ability to deliverone-stopfinancialshoppingexperience.
100
(2)Comprehensiveanddiverselineofretailbankingproductsthatsatisfyvariouscustomers’needs.(3)Optimizedpracticesanddigitizedproceduresthatgeneratestrongcompetitiveness.(4)Ability tocollaboratewith industry leadersandutilize resourceswithin the financialholdinggroup to
capture market share.(5)Abilitytoanalyzedatabaseandmarketinformationforprecisionmarketingandriskcontrol,andabilityto
serve customers through various channels available at its disposal.(6)Equippedwithastringentriskmanagementsystemtohelpensuresoundassetquality.(7)OutstandingcashmanagementandE-bankingplatforms thatcanbeused tooffercashcollection/
payment services.2. Favorable factors
(1)Therapidgrowthofonlinetransactionsbringsnewopportunitiesonceelectronicpaymentregulationsareenacted.
(2)Onlineapplicationsystemprovidesconsumerswithamoreconvenientmeansofrequestingtheservicestheywant.Inreturn,thebankisabletosavecostsandimproveefficiencythroughtheuseofsimplifiedprocesses.
(3)GiventheongoingliberalizationandrapidgrowthofemergingAsianeconomies,therewillbesubstantialgrowth in overseas banking services.
(4)China’songoingfinancialreformsandRMBinternationalizationwillgiverisetomanyinnovativeservicesandproducts,andthegovernment’spolicyonfeaturedfinancialserviceswillhelpboostfinancialactivitybetween China and Taiwan.
(5)Possesspluralproductresourcesanddevelopmentcapabilityofthefinancialholdingfirmtoprovideone-stop-shoppingfinancialservicestocustomers.
3. Unfavorable factors (1)Theauthorityhasraisedthedoubtfuldebtprovisionrateonrealestatepropertiesandcappedrevolving
interestsatalowerlevel,directlyaffectingthebank’sprofitability.(2)Thecreditcardmarkethasbecomesocompetitive that thebank is forced to incurhighercostson
privileges and campaigns just to secure its market share.(3)Electronicpayment regulationsalsoenablenon-financial institutions toengage inelectronic ticketing
services, and hence generate intensive competition.(4)Taiwanhasmanybanksthatofferthesameproductsandservices.Itisdifficulttoearnhighmarginson
conventional banking services.(5)Thebankhastoofewoverseasbranches;itsglobalnetworkremainssub-optimal.(6)Financialsupervisionhasbecomemorestringent thanever.The implementationofBasel IIIaccordwill
putfurtherstrainsonthebank’scapitalandliquidity,givingrisetoadditionalcostsandrisks.4. Response measures
(1)Utilizedatabaseanalysis inrisk-basedpricing.Adjustproductstrategiesbasedoncustomerattributes,andoffercustomizedsolutionstocreatedifferentiationandsecureprofitability.
(2)Preventlossofcustomersthroughenhancedrelationshipmanagementandproductinnovation;integratemarketing resources and create better competitiveness, and implement system optimizations to deliver higherserviceefficiencyandquality,whilereducingservicecosts.
(3)Respondquicklytomarketchangesandtechnologicaldevelopmentswithnewproducts;collaboratewithbusinesspartnerstoofferbrandnewbankingexperiences.
(4)Combineresourcesthroughoutthefinancialholdinggrouptoprovidedifferentiatedservicesandproductsbased on customers’ needs, and create service values along the way.
(5)TakeadvantageoftheleasingplatformbeingestablishedbythefinancialholdingfirminmainlandChina,expandcustomergroupsandconsolidateexistingcustomerrelationship.
101
05Operating Status 2014 ANNUAL REPORT
(6)Deploy in theAsia-Pacificmarketbyacceleratingtheupgradingofrepresentative’sofficetoVietnamtobranch and the preparation for the setup of Brisbane and Singaporean branches.
Taishin Securities Co., Ltd
a. Major products and services
The company’s services target domestic and overseas institutional investors and general investing public. As of the end of 2014, the company had three business bases, in Taipei city, Taichung city, and Kaohsiung city. In addition, thecompanyhassetup98 joint-marketingcountersat thebranchesofTaishinBank,providing theservices of account opening, account cancellation, and change of customers’ basis data.
b. Future supply and demand
1. Market overview Asoftheendof2014thereare82headquartersofsecuritiesdealers,931branches,37securitiesdealersthathave been approved for margin trading and short selling of securities by the Securities and Futures Bureau of theFinancialSupervisoryCommissionof theExecutiveYuan,and17branchesestablishedinTaiwanbyforeign securities dealers.
2. Market supply The government’s deregulation on the listing of foreign companies in Taiwan and simplified procedures for purchasing Formosa Bonds will present great potential in the securities underwriting service sector. As the securities trading services become more deregulated overseas, the government continues to promote expansion in thecapitalmarketandnew financialproductsarebeingconstantly introduced,allofwhichcontribute to more activities in the issuing market. The fast growth of electronic commerce has driven the securitiesservicesandfundraisingfinancialplanningproductstobecomemorediversified.Securitiesdealerswillbeabletoprovideone-stopservicesfor investors, thesecuritiesmarketwillbecomemoreefficient,andthemarketwillgrowsignificantlyinsize.Theoutlookofthesecuritiesmarketcontinuestoremainpositive.
3. Market demand Asthecapitalmarketbecomesmorecomplete in termsofefficiencyandfunctions,companieswillhaveasignificantlygreaterneedfordirectmeanstoraisecapital.Meanwhile,thecombinationofafasterinformationspreadingprocess,abettereducatedpopulation,andmorediversifiedinvestmentactivitieshasmadepeopleinTaiwanpaymoreattentiontoinvestmentandfinancialplanning.Accompaniedbyarecoveringeconomyandincreasingly loosened capital control, investors’ needs both for securities related information and for services provided by securities dealers will continue to grow.
4. Market growth Althoughthefirsthalfof2014hadbeenlargelytroubledbyconflicts inUkraine,collapseofF-shareprices,anddisputesregardingTaiwan’sfourthnuclearplant,thestockmarketindexwasabletoclimbtoitssix-yearhighinlightofstrongeconomicperformanceinkeypartsoftheworldsincethesecondquarter.However,thestock market was once again troubled by geopolitical concerns, falling oil prices, food safety scandals and lossofmajorinvestorsinthesecondhalfoftheyear,untilDecemberwhentheupsidemomentumfinallyborefruit following FED’s assurance and the government’s decision to postpone new regulations. Taiwan’s stock marketaveragedatradevolumeofNT$119.9billionperdayin2014,whilemargintradesaveragedabalanceofNT$263.4billion.TheTWSEindexclosed696pointsor8.08%upfromtheendof2013,whereastheGTEXclosed 10.81 points or 8.34% up from the end of 2013.
102
Sincethestartof2015, theQEannouncementby theEuropeanUnionhadgivenmuch incentive tostockmarketsaroundtheworld;however,thechangeofpoliticalregimeinGreeceandvolatileoilpricesstillpresentan uncertain future. In Taiwan, FSC’s stock market stimulative measures should be considered favorable to securitiesfirmsindevelopingnewbusinesses.Furthermore,theFSC’sdecisiontoincreasetheissuancelimitof Formosa Bonds for Chinese banks will give Taiwan the advantage to attract capital from all over the world, andgivethebankingindustrymuchtoexpectinthecomingyear.
c. Business goal
As a general securities firm, Taishin Securities engages in such businesses as brokerage, dealership, and underwriting, and provides a complete electronic trading platform with complete functions. It combines the resourcesofthefinancialholdingcompanyandutilizenear100bankingchannels,toprovideinvestorsall-roundandpluralizedfinancialwealth-managementservice. Itofferspluralizedtailor-madefinancialproducts tomeetthedifferentneedsofcustomersand,therebyrealizingtheserviceofone-stopshopping.
In the future,TaishinSecuritieswillbuildquality imageandachieveoptimalprofits,andestablishhighqualityandvalue-addedfinancialserviceoperatingplatformforpluralizedbusinessfields,onthebasisofthefinancialholdingfirm,soastobecomealeadingbrandinthesecuritiese-commerce.
With respect to the underwriting business, the operation brings together the resources under the financial holdingcompanyinanactiveefforttosecureasmanydomesticunderwritingcasesaspossiblewhileexploringopportunities overseas by attracting more foreign companies to participate in the capital market in Taiwan. The aimistodevelopTaishinSecurities intoafinancialserviceplatformthatofferspremiumservices,adiversifiedrange of businesses, and high added value.
In termsofderivatives, thecompanywillactively issuecall (put)optionsandplay its roleasamarketmakerto develop brand values as well as business models that produce consistent returns. In the future, Taishin Securities will aim to take the lead in derivative innovations by broadening its product lines and introducing volume-basedtradeserviceswithriskawarenessinmind.
d. Favorable and unfavorable factors for development outlook
1. Favorable factors(1)Integrate theresourcesof thefinancialholdingcompany tomanifestbrandvalueandupgradeoverall
competitiveness. (2)GovernmentwillactivelypushCross-Straitexchanges,buildupaplatformofSecurities,allowsecurities
to investment in China, and open the domestic market to Chinese investors. (3)The regulatoractivelypushes the liberalizationand internationalizationof the securitiesmarket,
successivelyopensupvariousbusinesses,andexpands trading targets, therebyofferingabroaderdevelopmentleewayforsecuritiesfirms.
(4)Thecapitalmarket inTaiwan ismademorecompliantwith internationalstandardsby issuesofRMBdenominated bonds via the monetary settlement mechanism.
(5)ItwillbeeasiertoexploretheunderwritingcustomerbasesinChinaforfinancialholdingcompaniesthatalready have leasing operations.
(6)TheprimaryunderwritersinthecapitalmarketinTaiwanarestaffedwithwellexperiencedsalespersonsand underwriters.
(7)The laws for foreigncompaniesseekingprimaryandsecondary listing/OTC listing inTaiwanare fullydevelopedandhelpexpandtheunderwritingcustomerbase.
(8)The transformationofmainstream industries fromelectronics to traditional industries facilitates theexpansionofthedomesticunderwritingbusiness.
103
05Operating Status 2014 ANNUAL REPORT
(9)High-techandconventional industriesaregrowing inamorebalancedstate,which is favorable to thecompany’s securities underwriting services.
(10)Afiercelycompetitive industryanda fastchangingenvironmentcreatemoreopportunities formergersandacquisitions.
(11)Theoptionsmarkethasgrownconsistently tohouseabroader rangeof instruments,while investorshave also become accustomed to derivatives. Both conditions favor the company’s development of new derivatives.
(12)Thefinancialholdinggroupnowoffersavastlydiverserangeofproductsthatcanbecross-soldtoprovidecustomerstheultimateone-stopshoppingexperience.
(13)Byworkingcloselywith thewholesalebankingsegment, thecompanywouldbepresentedwithgreatopportunities in capital market services.
(14)Underwritingofficersandspecialistshavehadextensiveexperiences in their lineofwork,andhavemaintained good track records to convince new customers.
2. unfavorable factors (1)Theexistenceofnumerousbusinessoutletsandbranches,cross-lineoperationoffinancial institutions,
and the entry of major foreign securities into the market aggravate the competition and affect the space of securitiesfirmforsurvival.
(2)Successiveopeningupofderivativesentailshighrisks,whichmaygreatlyaffectprofits,should therelacksagoodrisk-managementmechanism.
(3)Manyofthenewservicesrecentlypermittedbytheauthority(e.g.OSU)aremoreeasilyavailabletolargesecuritiesfirms.Thesesizablecompetitorsalsoencounter less troublewhenapplyingfornewservicesand establishing overseas branches.
(4)ItisdifficulttodeployinChina,onestepaheadofcompetitors.(5)Theregulatorgraduallyopensupvariousbusinesseswhichmayoverstrainthesupplyoftalents.(6)Therelativelysmallcapitalsizeisatacompetitivedisadvantageamongcompetitors.(7)Thecompanyhasyet toestablishabondsdepartment,andhence isunabletoservecustomers in this
regard.(8)Fiercecompetitionintheindustrypromptsstateownedbankscreatesecuritiesunderwritingdepartments
toexercisepowerfulcompetitivestrengthbywieldingtheirfinancialresources.(9)Theauthorityisstilltakingaconservativeapproachtoopenupunderwritingservices.Itfocusesmoreon
fraud prevention than business potentials, and is limiting the growth of the industry.3. Response measures
(1)Utilize thebank’sextensivechannel to transferqualityandhigh-assetsclients, toextend thereachofbusiness scope.
(2)Creatingadifferentiatede-tradingplatformtoprovidemoreaccurate,realtimemobiletransactions.(3)Forbrokeragebusiness, inadditiontomanualserviceatphysicalbusinessoutlets,continuestrengthen
the joint-marketingcountersatTaishinBank’soutlets, soas to tap thebusinessofmedium-sizedinvestors.Meanwhile,providesophisticatedonlineorderplacementservice,viauniquee-tradingplatform.
(4)Withregardstounderwritingservices, thecompanywillbeworkingcloselywithwholesalebankingandventurecapitalentitieswithinandoutsidethefinancialgrouptoexploreunderwritingopportunities.
(5)VisitChinesesecurities firmsandbanks;search foropportunities tocollaborate inbusinessandsignMOU.
(6)Improve thesuccessrateofunderwritingcaseswithwellexperiencedunderwritersand thecorporatenetwork system of Taishin bank.
(7)Broadendistributionchannelslocalandabroad;increasethecompany’scapacitytoundertakecases.(8)TheCapitalMarketDepartmentwillengage theResearchDepartmentandCorporateDepartment in
organizingforumsandseminarsforgreaterexposure.(9)Thecompanywillexploreopportunitiesinnewderivativesstartingwiththeissuanceofcall(put)options.
104
Taishin Securities Investment Trust Co.,Ltd.
a. Major product and services
(Sameasa.Businessscope1.Majorbusinesscontents)
b. Future supply and demand
TaishinInvestmentTrustcanalsotaptheopportunitiesconnectedwith thegradualopeningupofCross-Straitfinance,thepensionfundmarket,andchangeintaxationforoffshorefunds.Facedwithgradualrecoveryoftheglobal economy and the growth momentum of emerging economies, assets management companies, such as Taishin Investment Trust, still harbors a rosy outlook.
c. Business goal
Taishin InvestmentTrust’sshort-termgoal includesmaintenanceofastableperformance,expandproduct-linesynergyaftermerger, raiseemerging-market funds,obtain thequalification for theoutsourcingoperationof government funds, and assure the integration and smoothness of operation after the merger. In the medium and long-term, itwillactivelyenhancemarketshareandmanagementscale, increasenon-bond fundclients,strengthencapabilityforassetsallocation,andcontinueexpandingthereachandgoodimageofthebrand.
d. Favorable and unfavorable factors for development outlook
1. Favorable factors Financial interactions between Taiwan and China have become more active than ever, as both sides have takenstepstoderegulateanddevelopthefinancialenvironment.Investorshaveturnedoptimistictowardstheeconomy,anda low-interestrateenvironmentworks infavorofsecurities investment trustenterpriseswhenit comes to structuring fund products. Deregulation of pension services may present substantial business opportunities over the medium and long term.
2. Unfavorable factors Intensivecompetitionamonglocalsecuritiesinvestmenttrustenterprises,causinglargerfirmstodominatethemarket. To compete with dominant channels and offshore fund issuers, Taishin SITC will respond by building acompleteproductlinesupportedwithdisciplinedpracticesandwell-trainedtalents,andaimstoincreasethesize of assets under management in order to achieve sustainability.
Taishin Securities Investment Advisory Co.,Ltd.
a. Major products and services
1. Investment and analytical divisionProvide researchservices toTaishinFinancialHolding,TaishinBank,TaishinSecurities,andTaishinInvestment Trust.
2.GeneralagencyforoffshorefundsPresently, thecompanyhas introduced11Jupiter-seris fundsofJupiterAssetsManagementof theU.K. InadditiontoTaishinBank,theyarealsosoldviaotherbankingchannels,insurancefirms,securitiesfirms,andinvestmenttrustfirms.
105
05Operating Status 2014 ANNUAL REPORT
b. Future supply and demand
1. Investment analytical divisionDuetothegrowingrelianceof thefinancialholdingcompanyanditssubsidiariesonresearchinformation informulating business and strategic direction, in the future the research and analysis division will gradually expanditsbusinessscopetomeettheneedofthefinancialholdingcompany.
2.GeneralagencyforoffshorefundsOffshorefundshaveenteredtheTaiwanesemarketfor20years.Aftertheimplementationoftheoffshore-fundgeneral agency system, general agents can promote or push the sales of offshore funds via advertisement orothermanners,andthesameoffshorefundcanbesoldviamanyfinancialfirms.Investorscanpurchaseoffshore funds via more channels and are entitled to more protection, thanks to transparency of information. Higher familiarityand trustof investors towardsoffshore funds isconducive to theexpansionofbusinessscale.
c. Business goal
1. Investment and analytical divisionProvidecorrectresearchinformationtoassistthefinancialholdingcompanyanditssubsidiariesinformulatingstrategic direction and planning products with good investment prospects and assist Taishin Financial Holding andaffiliateexpandbusinesswithexcellentresearchresult.
2.Generalagencyforoffshorefunds:Plan the introductionofnewseries fundsandnewfundcompanies tomeet theneedof investors for fundinvestment.
d. Favorable and unfavorable factors for development outlook
1. Favorable factorsWith the government’s ongoing efforts in financial liberalization, innovation, education and wealth/asset management,weexpectmorefavorableprospectsinthefinancialsectorasderegulationcontinues.
2. Unfavorable factorsGivenchangingregulations,newbusinessentrantsneedtocontinuouslyimprovetheircompetitiveadvantagesand innovative abilities in order to overcome new challenges and opportunities.
Taishin Asset Management Co., Ltd.
a. Major products and services
Thecompany’smajorbusinessitemsincludebiddingforthebad-debtclaimsoffinancialinstitutionsinTaiwan,subjecting them to management and restructuring, and disposing of them within reasonable time, so as to attain maximumreturns.
b. Future supply and demand
With realty-mortgagedbad-debtclaimshavingbeenmostly released,assetsmanagementcompanieshavegraduallyswitchedtheirbiddingtargetsfromcorporate-debtclaimstoconsumer-debtclaims.Duetothegradualshrinkageof thedomesticmarketscale,quiteanumberof foreignpeershavetransformedtheiroperationsor
106
exitthedomesticmarket,withsomepeershavingbeguntosellthebad-debtclaimstheypurchased.Thetrendhasledtotheemergenceofsecondary-markettrading,facilitatingthedivisionorcombinationofsingleorsmallbad-debtclaims,conducivetothedisposalofbad-debtclaimsandenhancementofinvestmentreturns.
c. Business goal
Inadditiontocontinuingthepurchaseanddisposalofbad-debtclaims,thecompanyalsoaimstopurchaseNPL(non-performing loans)securedbyconstructionplots ingreaterTaipei, therebyexpanding landdevelopmentbusiness via the restructuring of the debt claims. Meanwhile, in response to market changes, the company will activelybid forconsumerbad-debtclaims. In thedirectionofpluralizeddevelopment, thecompanywillstepinto thefieldofcorporaterestructuringvia integratingbankingandsecuritiesplatformsandcapitalizingon itsabundantfundsandtalents,therebycontributingtodomesticfinancialandcorporatereform.
d. Favorable and unfavorable factors for development outlook
1. Favorable factorsThecompany’sedgeliesinthecompleteperipheralplatformsandabundantresourcesofthefinancialholdingcompany,enabling it tohelpaffiliatesdisposeof theirbad-debtclaimsandgraduallydevelopotherassets-managementbusinessesalongwith thebusinessdevelopmentof thefinancialholdingcompanyandothersubsidiaries.
2. Unfavorable factorsWith domestic financial holding companies and foreign firms having successively established assets managementcompanies,therehaveexistednumerouscompetitorsscramblingforthemarketpiece,leadingtopricecompetition,whichhasbeenaggravatedbythereluctanceoffinancialinstitutionstosellofftheirbad-debt claims in the wake of the economic recovery.
Taishin Venture Capital Co., Ltd.
a. Major products and services
The company invests 80% of its fund in Taiwan and 20% overseas, mainly the U.S., Europe, and Asia, featuring strategicallianceopportunitiesforTaiwaneseindustriesandeconomicbenefitsforTaiwan.
b. Future supply and demand
Judging from the current trends in the venture capital industry in Taiwan, there has been an overall increase in the number and size of investments as economic prospects turned favorable once again. Although the globaleconomyisexpectedtoseeonlyslowrecoveryin2014,TaiwanandChinashouldbeabletosparknewopportunities with ECFA in play. Opportunities in new investment categories will start appearing soon and now may be the best time for venture capitalists focusing on medium and long term investments. The investment returnsinthenextfewyearswillalsoberelativelyhigh.
c. Business goal
With regards to use of capital, the venture capital fund aims to invest no more than 60% in new startup businesses,nomorethan60%ingrowingbusinesses,andnomorethan40%inmaturedbusinesses(includingundervaluedcompanieswithpotentiallistedonEmergingStock,TSECandGTSMboards).Intermsofindustry
107
05Operating Status 2014 ANNUAL REPORT
allocation, the fund places its focus on the energy industry, the optoelectronics industry, communications, IT, IC, software, biotech and healthcare. In terms of company types, the fund will primarily invest in unlisted companies in Taiwan or new startups or growing companies incorporated in Taiwan or the U.S.; the fund may even introduce EuropeanorU.S.venturesintoTaiwanandexplorelocalIPOopportunities.
d. Favorable and unfavorable factors for development outlook
1. Favorable factorsWithTaiwan’sventurecapitalindustryhavingreachedamaturestage,thegovernmenthasexpandedthefundsourcesforventurecapitalfirms,inordertosustaintheindustry’sfurtherdevelopment,raisingtheceilingsfortheinvestmentsofinsurancefirms,banks,andsecuritiesfirmsinventurecapitalcompanies,andopenupnewgrowthbyallowingbroadervariety inportfolioandfundingsources.Giventhefact that technologyremainsthe driving force behind the world’s industrial development, the role of venture capitalists has become more essential thanever.Withworldwiderecoveryand increasedcapitalspendingexpected in the future, localventure capitalists should undergo yet another wave of growth.
2. Unfavorable factors(1)Taiwaneseeconomyslackens,drivingdowninvestmentwillingness Investment activities hinge on economic performance, as a strong economy leads to a bullish market,
facilitating fund raising and creating major returns for venture capital funds, while a sluggish economic dampens investment gains, making it difficult for fund raising. As the global economy gets ready to bouncebackandthedemandforhi-techproductshasnotexpanded inanysignificantway,companiesare slow in increasing capital and the industries are relatively conservative in their investment strategies.
(2)Thescrappingoftaxincentivesforventurecapitalfirms Following the revision of the ‘Statute for Industrial Upgrading” in 2000, the government scrapped the
investmenttaxcreditfortheshareholdersofventurecapitalfirms.
Taishin Holdings Insurance Brokers Co., Ltd.
a. Major products and services
The key areas of business for Taishin Holdings Insurance Brokers are life and property and casualty insurance brokerage services. It has signed agreements with 16 life insurers and 15 property and casualty insurers, and sells insurance related products through Taishin Bank branches across Taiwan and by telemarketing.
b. Future supply and demand
AlthoughsaleofRMB-denominated life insurancepolicieshasbeenunderwhelmingsince the initial launchin April 2014, there is still potential in the product considering how locals have favored RMB deposits and the likelihood that RMB may be included by IMF as one of the international reserve currencies in 2015. Furthermore, with the introductionofOffshore InsuranceUnit (OIU), therehavebeenplanswithin the industry topackageinvestment-linkedpolicies that foreigners (includingChinese tourists)canpurchase inTaiwanusing foreigncurrencies,andhencegainexposure toabroadercustomerbase. In lightof therapidlyagingpopulation inTaiwan,moreandmorepeopleareexpectedtobeinneedoflong-termnursingcare.Thenursingcarepackagelaunchedbythegovernmentisinsufficientinbridgingfinancialgapsoverthelongrun.Forthisreason,insurancecompaniesareactivelyofferingnursing/quasi-nursingcareanddisabilitycoveragestocapitalizeonthegrowingopportunity.
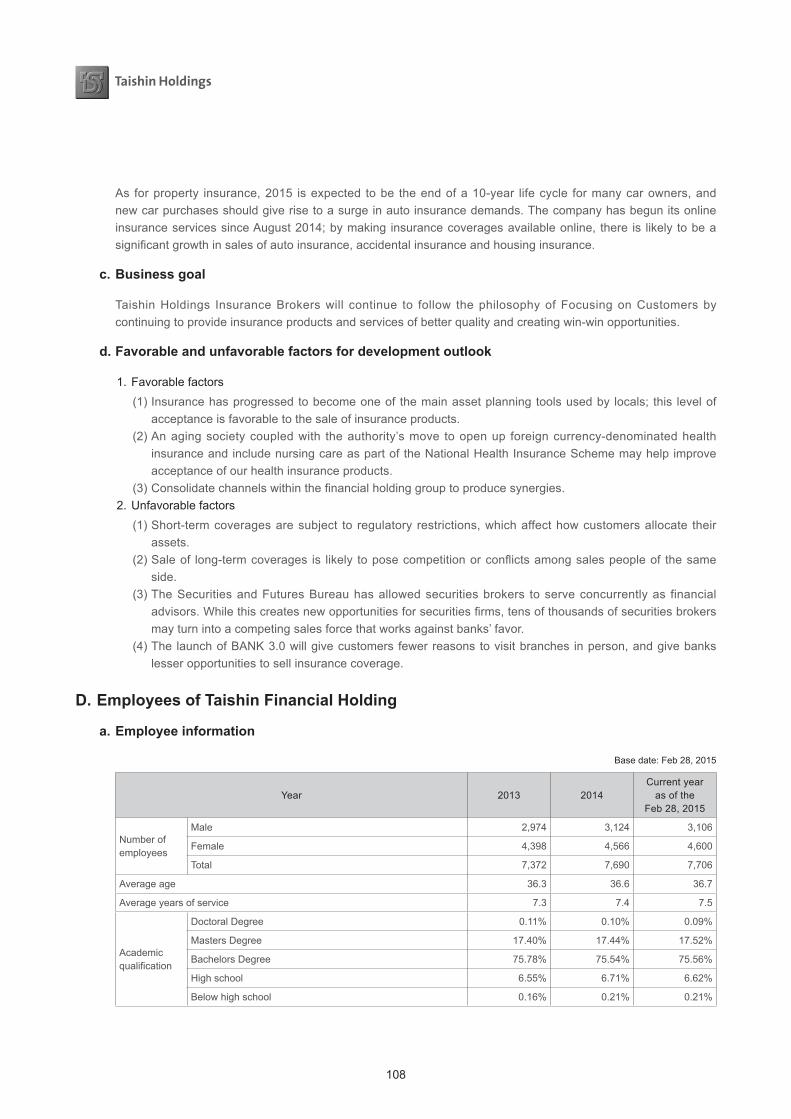
108
As forproperty insurance,2015 isexpected tobe theendofa10-year lifecycle formanycarowners,andnew car purchases should give rise to a surge in auto insurance demands. The company has begun its online insurance services since August 2014; by making insurance coverages available online, there is likely to be a significantgrowthinsalesofautoinsurance,accidentalinsuranceandhousinginsurance.
c. Business goal
Taishin Holdings Insurance Brokers will continue to follow the philosophy of Focusing on Customers by continuingtoprovideinsuranceproductsandservicesofbetterqualityandcreatingwin-winopportunities.
d. Favorable and unfavorable factors for development outlook
1. Favorable factors (1)Insurancehasprogressedtobecomeoneof themainassetplanningtoolsusedby locals; this levelof
acceptance is favorable to the sale of insurance products.(2)Anagingsocietycoupledwith theauthority’smove toopenup foreigncurrency-denominatedhealth
insuranceandincludenursingcareaspartoftheNationalHealthInsuranceSchememayhelpimproveacceptance of our health insurance products.
(3)Consolidatechannelswithinthefinancialholdinggrouptoproducesynergies.2. Unfavorable factors
(1)Short-termcoveragesaresubject to regulatory restrictions,whichaffecthowcustomersallocate theirassets.
(2)Saleof long-termcoverages is likely toposecompetitionorconflictsamongsalespeopleof thesameside.
(3)TheSecuritiesandFuturesBureauhasallowedsecuritiesbrokers toserveconcurrentlyas financialadvisors.Whilethiscreatesnewopportunitiesforsecuritiesfirms,tensofthousandsofsecuritiesbrokersmay turn into a competing sales force that works against banks’ favor.
(4)The launchofBANK3.0willgivecustomers fewerreasonstovisitbranches inperson,andgivebankslesser opportunities to sell insurance coverage.
D. Employees of Taishin Financial Holding
a. Employee information
Base date: Feb 28, 2015
Year 2013 2014Current year
as of the Feb 28, 2015
Numberofemployees
Male 2,974 3,124 3,106
Female 4,398 4,566 4,600
Total 7,372 7,690 7,706
Average age 36.3 36.6 36.7
Average years of service 7.3 7.4 7.5
Academic qualification
Doctoral Degree 0.11% 0.10% 0.09%
Masters Degree 17.40% 17.44% 17.52%
Bachelors Degree 75.78% 75.54% 75.56%
High school 6.55% 6.71% 6.62%
Below high school 0.16% 0.21% 0.21%
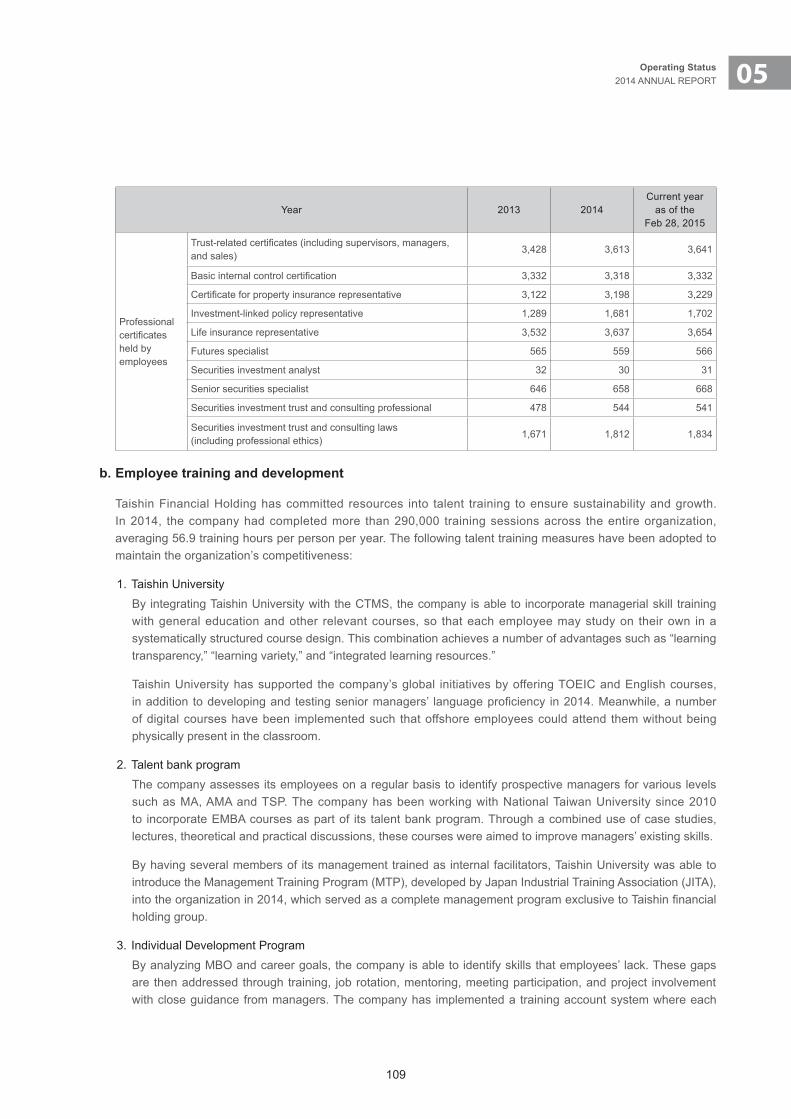
109
05Operating Status 2014 ANNUAL REPORT
Year 2013 2014Current year
as of the Feb 28, 2015
Professionalcertificatesheld by employees
Trust-relatedcertificates(includingsupervisors,managers,andsales)
3,428 3,613 3,641
Basicinternalcontrolcertification 3,332 3,318 3,332
Certificateforpropertyinsurancerepresentative 3,122 3,198 3,229
Investment-linkedpolicyrepresentative 1,289 1,681 1,702
Life insurance representative 3,532 3,637 3,654
Futures specialist 565 559 566
Securities investment analyst 32 30 31
Senior securities specialist 646 658 668
Securities investment trust and consulting professional 478 544 541
Securities investment trust and consulting laws (includingprofessionalethics)
1,671 1,812 1,834
b. Employee training and development
Taishin Financial Holding has committed resources into talent training to ensure sustainability and growth. In 2014, the company had completed more than 290,000 training sessions across the entire organization, averaging 56.9 training hours per person per year. The following talent training measures have been adopted to maintain the organization’s competitiveness:
1. Taishin University By integrating Taishin University with the CTMS, the company is able to incorporate managerial skill training with general education and other relevant courses, so that each employee may study on their own in a systematically structured course design. This combination achieves a number of advantages such as “learning transparency,” “learning variety,” and “integrated learning resources.”
Taishin University has supported the company’s global initiatives by offering TOEIC and English courses, inaddition todevelopingandtestingseniormanagers’ languageproficiency in2014.Meanwhile,anumberof digital courses have been implemented such that offshore employees could attend them without being physically present in the classroom.
2. Talent bank program The company assesses its employees on a regular basis to identify prospective managers for various levels suchasMA,AMAandTSP.ThecompanyhasbeenworkingwithNationalTaiwanUniversitysince2010to incorporate EMBA courses as part of its talent bank program. Through a combined use of case studies, lectures,theoreticalandpracticaldiscussions,thesecourseswereaimedtoimprovemanagers’existingskills.
By having several members of its management trained as internal facilitators, Taishin University was able to introducetheManagementTrainingProgram(MTP),developedbyJapanIndustrialTrainingAssociation(JITA),intotheorganizationin2014,whichservedasacompletemanagementprogramexclusivetoTaishinfinancialholding group.
3. IndividualDevelopmentProgramBy analyzing MBO and career goals, the company is able to identify skills that employees’ lack. These gaps are then addressed through training, job rotation, mentoring, meeting participation, and project involvement with close guidance from managers. The company has implemented a training account system where each
110
employee is given 10,000 training points to spend each year; furthermore, employees are subsidized for their efforts ingainingprofessionalqualifications,secondaryskills, languageandcomputerskillsetc,sothattheirpersonal goals are congruent with those of the company.
E. Corporate Responsibility and Ethical Behaviors
Inadditiontodedicationto itscorefinancialbusiness,TaishinFinancialHoldingCo.,Ltd(TaishinFHC)hasbeenawareofitscorporateresponsibilityforthesociety.Therefore,exceptlong-termengagementintheissuesofsocialcare, public services, and environmental protection, the company has also been actively participating in events related to charity and public service, environment protection, and culture/art, in the hope of capitalizing on its corporate strength to provide substantial paybacks to the society, community, and underprivileged groups, so as to contributetothewell-beingofthenationandsociety.
a. Charity
1. “Care for Taiwan” seriesTaishinFinancialHoldinghas joinedhandswith famousshoppingwebsitePayEasy.comtocarryout“CareforTaiwan”serieseventssince2002,helpingdisastervictims inHsinyivillage,Chungliaovillage,Yuchihvillage, and Kuohsing village to develop local economy. Based on the concept of “giving fishing pole and teachingfishing,” it ralliespeopletosponsoragriculturalproducts,pushescredit-carddonation,andpushescharacteristicproductsandtravelsatbackwardareas,successfullyhelpingwiththereconstructionofdisaster-stricken areas and posing as a paradigm for corporate participation in public services.
From2005, “Care forTaiwan”serieshas targeted“Kuohsing-villagekarate teenager team,”helping thoseteenagers raise training fund via the establishment of theme website and the utilization of media reporting. In2014,TashincontinueditssponsorshiptotheperformanceofTaiwaneseathletesinAsianPacificShitoryuKarate Championship held in Singapore. The sponsored athletes delivered stunning results, claiming a total of75medals(33gold,21silverand21bronze)invariouslocalandinternationalcompetitionsheldthroughout2014.TaishinFinancialHoldingwasespeciallyproudwhenKuTsui-Ping,oneofthesponsoredathletes,wonhergoldmedalinwomen’s50kgclassduringthe2014IncheonAsianGames,makinghertheyoungestkaratechampioninthehistoryoftheAsianGames.
In2008,“CareforTaiwan”seriesextendeditsreachtoriceplantationinTaiwan.InordertosustainTaiwan’spriceplantationandenablepeople toeachpureTaiwaneserice,TaishinFinancialHoldingandPayEasy.com established brand new platform for production and marketing of Taiwanese rice, pushing corporate sponsorshipof“one-acrericepaddy”andfamilysponsorshipof“one-acrericepaddyofmyfamily”programs,sothatTaiwan’sgoodricecanpenetratelocalfamilies.Inadditiontobenefitingthehealthoflocalpeopleandboosting the income of farmers, the program has created more working opportunities in Taiwan villages. In total,TaishinFinancialHoldinghassponsoredriceprocurementforover120units,equivalentto60hectaresofricepaddies.Ithasgiven50,000ricegiftboxestoover10,000Taishincustomersandstaffers,whichhaveeatenover200,000kilosofqualityTaiwaneserice.Inadditiontobenefitingricefarmers,ithasalsocarriedoutexcellentmarketingforgoodTaiwaneserice.
2. Taishin Charity FoundationIn2010,TaishinBanksetup“TaishinCharityFoundation,”mainlyforengagementinpublic-serviceandcharityevents, including assistance for underprivileged groups to enhance their skills for livelihood and improve life,andsponsorship for theeventsofotherpublic-servicegroupsandseminars forsociety-related issues,andothersocialwelfare-relatedcharityevents,with thegoalofhelpingunderprivilegedgroupsachieve“independence in economy and daily life.”
111
05Operating Status 2014 ANNUAL REPORT
Afteritsestablishment,thefoundationrolledout“yourballotdecidesthestrengthoflove”event,thefirstonlinepublic-serviceeventinTaiwan.Undertheevent,smallandmediumsocial-welfareinstitutionswereinvitedtoput forth proposals online for voting by online social groups, in deciding the recipients of donations. A total of 1,253proposalswerereceivedoverthefouryearsitwasheld,andweinvitedpublic-servicepartners,suchasAdvantech Foundation and Chunghwa Telecom Foundation to join the event, the scope of donation recipients wereexpandedfrom“socialwelfare”to“culturaleducation”and“digitallearning”.
The5th“YourBallotDecidestheStrengthofLove”eventreceivedoverwhelmingresponseas300,000onlinevoters casted more than 1,140,000 votes in total. In addition to the public service partners mentioned above, the event also received donations from Taishin managers, employees, customers and the general public,which boostedthecharityfundtoNT$16millionandbenefitedatotalof333charityorganizations.
In addition to running the “your ballot decides the strength of love” campaign, Taishin Charity Foundation has also reached out using the Internet to partners who were willing to provide resources to the cause. In 2014, Taishin Bank Foundation for Arts and Culture joined Taishin Charity Foundation in launching an “Arts for Charity” campaign that invited artists, advertising companies and students to participate in product designs, improvements and public art productions. In the future, the foundation will continue visiting welfare groupswithineachcommunity,andtrytomatchthemwithresourcesavailableinthesocietytobecomeself-dependent.
b. Academics and Art
1. Academic promotion Taishin is actively involved in major academic events. By engaging industry, government and academia representatives in discussions, we hope to contribute our efforts to the development of Taiwan’s financial environment. Academic events that we previously participated in include: AIESEC International Congress, TaiwanFinanceAssociationAnnualGeneralMeeting&InternationalAcademicForum,CorporateGovernanceSummitForum,ConferenceonTheoriesandPracticesofSecuritiesandFinancialMarkets,BankingPolicyForum,Cross-StraitConferenceonTurnaroundManagement,ConferenceonCross-StraitFinancialDevelopment...Taishinalsoorganizescross-straitexchangesofacademictalents,whichhelpbuildfinancialexpertiseinTaiwan.
2. Art Taishin Bank donated to establish “Taishin Bank Culture and Art Foundation” in 2001, with the theme of “promotingcultural lifequalityandstrengtheningartistic-developmentenvironment.” Itsupportsartsasanonprofit institution, intensifiesexchangesbetweenartistic innovationandprivate industry,and realizesthe corporate social responsibility of payback to the society. 2014 marks the 12th anniversary of this event. Starting in2013,anonlinecommentaryplatformnamedARTalkswasdeveloped toserveasa two-waycommunication between artists and to inspire creative energy. Meanwhile, Taishin Financial Holdings also arrangesmulti-functionalperformingandexhibitionspaceat itsheadquartersbuilding to inviteartistsandmusicianstoholdartisticexhibitionsandnoontimemusicalconcerts.
c. Sports sponsorship
In2011,TaishinsponsoredYaniTseng,LPGAfemalegolfingchampion,thefirstTaiwanesefinancialinstitutiontodo so. Taishin had also mobilized its customers and employees to cheer for the champion using banners, online messagesetc,whilesomehadevenpaidtheirvisitstotheLPGATourinTaiwan.ItalsoinvitedYaniTsengtobecome the endorser of Taishin Charity Foundation, to help with promoting the “your ballot decides the strength oflove”event,soastoaugmentTaishin’ssocialinfluence.
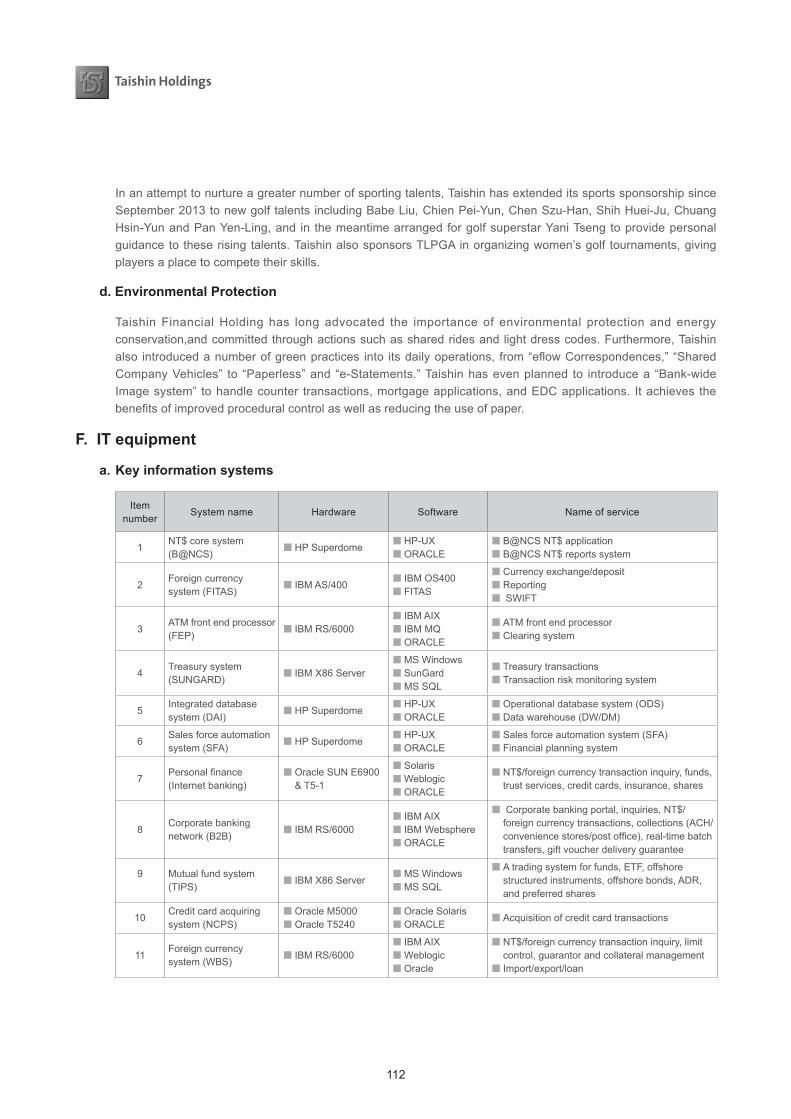
112
Inanattempttonurtureagreaternumberofsportingtalents,TaishinhasextendeditssportssponsorshipsinceSeptember2013tonewgolftalentsincludingBabeLiu,ChienPei-Yun,ChenSzu-Han,ShihHuei-Ju,ChuangHsin-YunandPanYen-Ling,and in themeantimearrangedforgolfsuperstarYaniTsengtoprovidepersonalguidancetotheserisingtalents.TaishinalsosponsorsTLPGAinorganizingwomen’sgolf tournaments,givingplayers a place to compete their skills.
d. Environmental Protection
Taishin Financial Holding has long advocated the importance of environmental protection and energy conservation,and committed through actions such as shared rides and light dress codes. Furthermore, Taishin also introducedanumberofgreenpractices into itsdailyoperations, from“eflowCorrespondences,” “SharedCompanyVehicles” to “Paperless”and“e-Statements.”Taishinhasevenplanned to introducea “Bank-wideImage system” to handle counter transactions, mortgage applications, and EDC applications. It achieves the benefitsofimprovedproceduralcontrolaswellasreducingtheuseofpaper.
F. IT equipment
a. Key information systems
Item number
System name Hardware Software Nameofservice
1NT$coresystem(B@NCS)
■HPSuperdome ■HP-UX ■ ORACLE
■B@NCSNT$application ■B@NCSNT$reportssystem
2Foreign currency system(FITAS)
■ IBM AS/400 ■ IBM OS400 ■ FITAS
■Currencyexchange/deposit ■ Reporting ■ SWIFT
3ATM front end processor (FEP)
■ IBM RS/6000 ■ IBMAIX ■ IBMMQ ■ ORACLE
■ ATM front end processor ■ Clearing system
4Treasury system (SUNGARD)
■ IBMX86Server ■ MS Windows ■SunGard ■MSSQL
■ Treasury transactions ■ Transaction risk monitoring system
5Integrated database system(DAI)
■HPSuperdome ■HP-UX ■ ORACLE
■Operationaldatabasesystem(ODS) ■Datawarehouse(DW/DM)
6Sales force automation system(SFA)
■HPSuperdome ■HP-UX ■ ORACLE
■Salesforceautomationsystem(SFA) ■ Financial planning system
7Personalfinance(Internetbanking)
■OracleSUNE6900&T5-1
■ Solaris ■ Weblogic ■ ORACLE
■NT$/foreigncurrencytransactioninquiry,funds,trust services, credit cards, insurance, shares
8Corporate banking network(B2B)
■ IBM RS/6000 ■ IBMAIX ■ IBM Websphere ■ ORACLE
■ Corporatebankingportal,inquiries,NT$/foreigncurrencytransactions,collections(ACH/conveniencestores/postoffice),real-timebatchtransfers, gift voucher delivery guarantee
9 Mutual fund system (TIPS)
■ IBMX86Server ■ MS Windows ■MSSQL
■ A trading system for funds, ETF, offshore structured instruments, offshore bonds, ADR, and preferred shares
10Creditcardacquiringsystem(NCPS)
■ Oracle M5000 ■ Oracle T5240
■ Oracle Solaris ■ ORACLE
■Acquisitionofcreditcardtransactions
11Foreign currency system(WBS)
■ IBM RS/6000 ■ IBMAIX ■ Weblogic ■ Oracle
■NT$/foreigncurrencytransactioninquiry,limitcontrol, guarantor and collateral management ■ Import/export/loan

113
05Operating Status 2014 ANNUAL REPORT
Item number
System name Hardware Software Nameofservice
12Image process management system (IPMS)
■HPUnix ■ Oracle Solaris
■ Weblogic ■ Oracle SOA ■ Oracle UCM
■ Management of imaged processes such as NTDservices(account/remittance/applications/accountopening/negotiableinstruments/KYC/CIFupdate/officialcorrespondence),merchantapplication,debtcollection(attestationletters/property ownership/household transcript/overduedocuments),retailmortgage/unsecuredcredit,corporatebanking(debtentitlementcertificates/scorecards)etc
13Factoring system (OAEFB)
■ IBM RS/6000 ■ IBMAIX ■ Weblogic ■ Oracle
■ Accounts receivable system
14Corporate credit assessment system (OAECR)
■ IBMX86Server ■ MS Windows ■MSSQL
■ Corporate credit assessment system
15Trade Finance System (Murex)
■ Oracle Solaris Server
■UnixSolaris ■Murex ■ TAS ■MSSQL
■ Treasury,FXandMMtransactions ■ Transaction risk monitoring system
16Singapore Credit system(SGECR)
■ IBMX86Server ■ MS Windows ■MSSQL
■ Credit assessment system used in Singapore
17Singapore Trade Finance System(SGFITAS)
■ IBM AS/400 ■ IBM OS400 ■ FITAS
■ Import/export/currencyexchange/deposits/loans ■ SWIFT
18Singapore Wholesale Banking System (SGWBS)
■ IBM RS/6000 ■ IBMAIX ■ Weblogic ■ Oracle
■ CIF, limit control, guarantor and collateral management
19 Cloudoffice ■HPBladeServer ■HPX86Server
■ MS Windows ■ Asus Omniapp ■ VMware
■Amobileofficebasedoncloudtechnology ■ Software development tools based on cloud technology
b. Future development or procurement plans
1.Applycloud technology toachieveresource integration;maximumuseof ITresources to improveservicequality.Createacloud-basedmobileofficeandsoftwaredevelopmenttoolswithenhanceddataprotectiontoeffectively support business and management activities.
2.AimtobuildnewTierIII(internationalgrade)computerserversforoptimalstabilityandsecurity. 3.Developanoverseasbranchinformationsystem-forBrisbane,SingaporeandTokyobranches. 4. Increase use of global trade services by small and medium enterprises; improve local market share. 5.Implementabank-wide foreigncurrencysystemandapply tooverseasbranches;optimizeexisting
operations involving foreign currency deposits and loans, and the product platform. 6.ExploremobilebankingapplicationsforiPhone,iPad,Androidandothermobiledevices. 7.Integrate front-end,mid-endandback-endof the treasurysystemforgreatercompetitiveness in treasury
transactions. 8. Upgrade the customer credit risk assessment system for more effective control over customers’ default risks. 9.ReplacetheexistingATMsystem(FEP)withonethatoffersgreaterstability.10.AcquirenewATMmodelsand replaceoutdatedequipment.Offer servicessuchas foreigncurrency
withdrawalsandinter-bankcashdeposits.
114
11.Continuereplacementofcustomerservicesystem; implement localandoff-sitesupport; improveefficiencyand service capability of customer service personnel.
c. Emergency backup and security
1. Implement standardizeddatamanagement practicesand systems in accordancewith thePersonalInformationProtectionActforaddedprotection.
2. Comply with ISO27001 ISMS standards. Ensure proper protection to data operations and information systems.Prevent incidentssuchasdatacorruption, theft, leakage,alteration,abuse,and infringement.Enhancetheconfidentiality,completenessandusabilityofstoredinformation.
3. Introducetheuseofinfiltrationtoolstoscanfornetworkweaknesses.4. Enhance current information protection mechanisms for better security management. 5. Enhance encryption mechanisms used for wireless transmissions of mobile devices for higher security. 6. Improveoff-sitesupporttoaccommodatebusinessrequirements.7.Continuallyunderstandoff-sitesupportneedsandmakeimprovementsaccordingly.8. ImplementMobileDeviceManagementforenhancedsecurityinaccessingbusiness-relatedinformation.9. Follow instructions issued by the Bankers Association and conduct security assessments on all computer
systems used.
G. Labor relations
a. Availability and execution of employee welfare and retirement policies. Elaborate on employer/employee agreements and protection of employee rights.
1. Employee insurance (1)Laborinsurance:70%ofpremiumcoveredbythecompanywhile20%isbornebytheemployee.(2)Healthinsurance:60%ofpremiumcoveredbythecompanywhile30%isbornebytheemployee.(3)Groupinsurance:employeesarecoveredbygrouplife,accidental,healthcare,surgery,injury,cancer,and
work hazard insurance; premiums are borne by the company. (4)Travel insurance:employeesarecoveredby travel insurancewhengoingonoverseasbusiness trips;
premiums are borne by the company.
2. Employee welfare Thecompanyhasan“EmployeeWelfareCommittee” inplacetosupervisetheexecutionofwelfare-relatedactivities.Thecompanyalso implementsan“EmployeeWelfareCommitteeSubsidyPolicy” thatprovidesemployees with subsidies for various occasions such as wedding, child birth, funeral, hospitalization, festivity, birthday, travel, private associations, and children’s education.
In addition to the various subsidies offered by the Employee Welfare Committee, the company also subsidizes employeesforhealthcheckups,weddings,funerals,self-development(suchaslearningofforeignlanguages,computerclasses,professionalqualificationsetc),andrewardsthemforlongservice.
With regards to employee assistance, the company is working with the Teacher Chang Foundation to provide “EmployeeLivingAssistance,”andhasan“EmployeeMailbox”and“EmployeeHotline”inplaceasameansofcommunication.
With regards to employee assistance, the company is working with Teacher Chang Foundation to provide “EmployeeLivingAssistance,”andhas“EmployeeMailbox”and“EmployeeHotline” inplaceasmeansofcommunication.
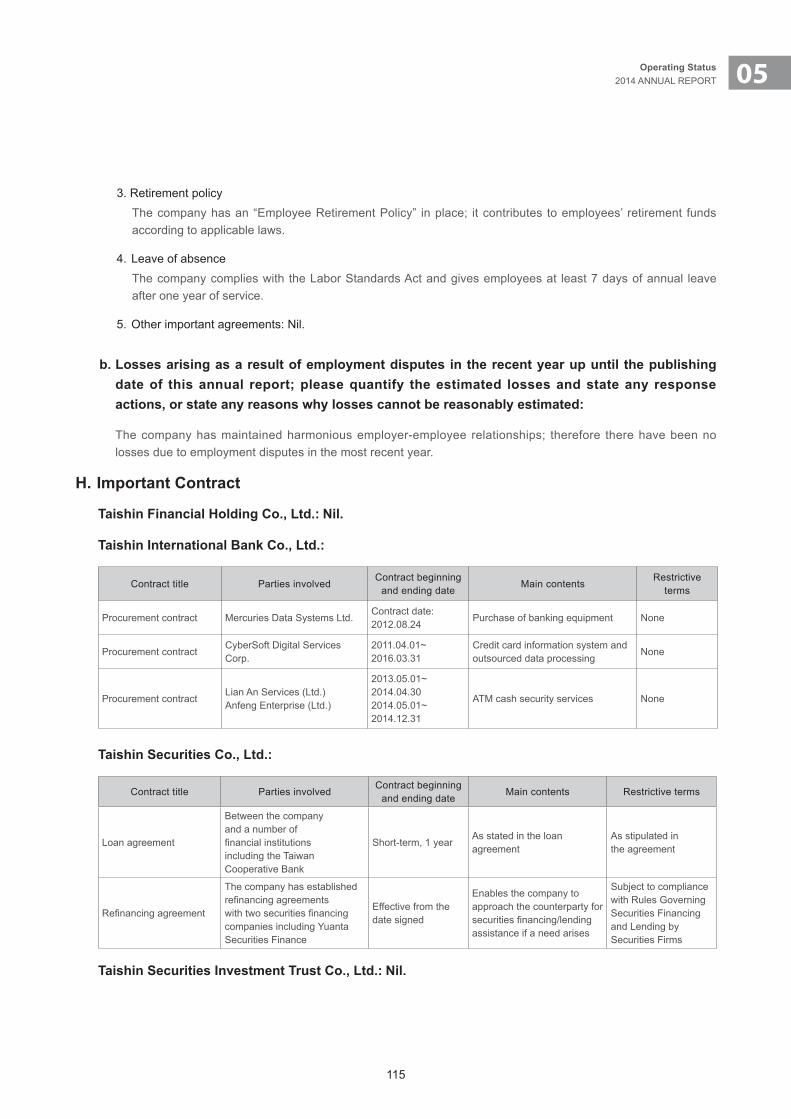
115
05Operating Status 2014 ANNUAL REPORT
3. Retirement policy Thecompanyhasan“EmployeeRetirementPolicy” inplace; itcontributes toemployees’ retirement fundsaccording to applicable laws.
4. Leave of absence The company complies with the Labor Standards Act and gives employees at least 7 days of annual leave after one year of service.
5.Otherimportantagreements:Nil.
b. Losses arising as a result of employment disputes in the recent year up until the publishing date of this annual report; please quantify the estimated losses and state any response actions, or state any reasons why losses cannot be reasonably estimated:
Thecompanyhasmaintainedharmoniousemployer-employee relationships; therefore therehavebeennolosses due to employment disputes in the most recent year.
H. Important Contract
Taishin Financial Holding Co., Ltd.:Nil.
Taishin International Bank Co., Ltd.:
Contract title PartiesinvolvedContract beginning
and ending date Main contents
Restrictive terms
Procurementcontract Mercuries Data Systems Ltd. Contract date:2012.08.24
Purchaseofbankingequipment None
ProcurementcontractCyberSoft Digital Services Corp.
2011.04.01~2016.03.31
Credit card information system and outsourced data processing
None
ProcurementcontractLianAnServices(Ltd.)AnfengEnterprise(Ltd.)
2013.05.01~2014.04.302014.05.01~2014.12.31
ATM cash security services None
Taishin Securities Co., Ltd.:
Contract title PartiesinvolvedContract beginning
and ending date Main contents Restrictive terms
Loan agreement
Between the companyand a number offinancialinstitutionsincluding the TaiwanCooperative Bank
Short-term,1yearAs stated in the loan agreement
As stipulated inthe agreement
Refinancingagreement
The company has established refinancingagreementswithtwosecuritiesfinancingcompaniesincludingYuantaSecurities Finance
Effective from the date signed
Enables the company to approach the counterparty for securitiesfinancing/lendingassistance if a need arises
Subject to compliance withRulesGoverningSecurities Financing and Lending by Securities Firms
Taishin Securities Investment Trust Co., Ltd.:Nil.

116
Taishin Securities Investment Advisory Co., Ltd.:Nil.
Taishin Asset Management Co., Ltd.: Nil.
Taishin Venture Capital Investment Co., Ltd.: Nil.
Taishin Holdings Insurance Brokers Co., Ltd.: Nil.
06Financial Status
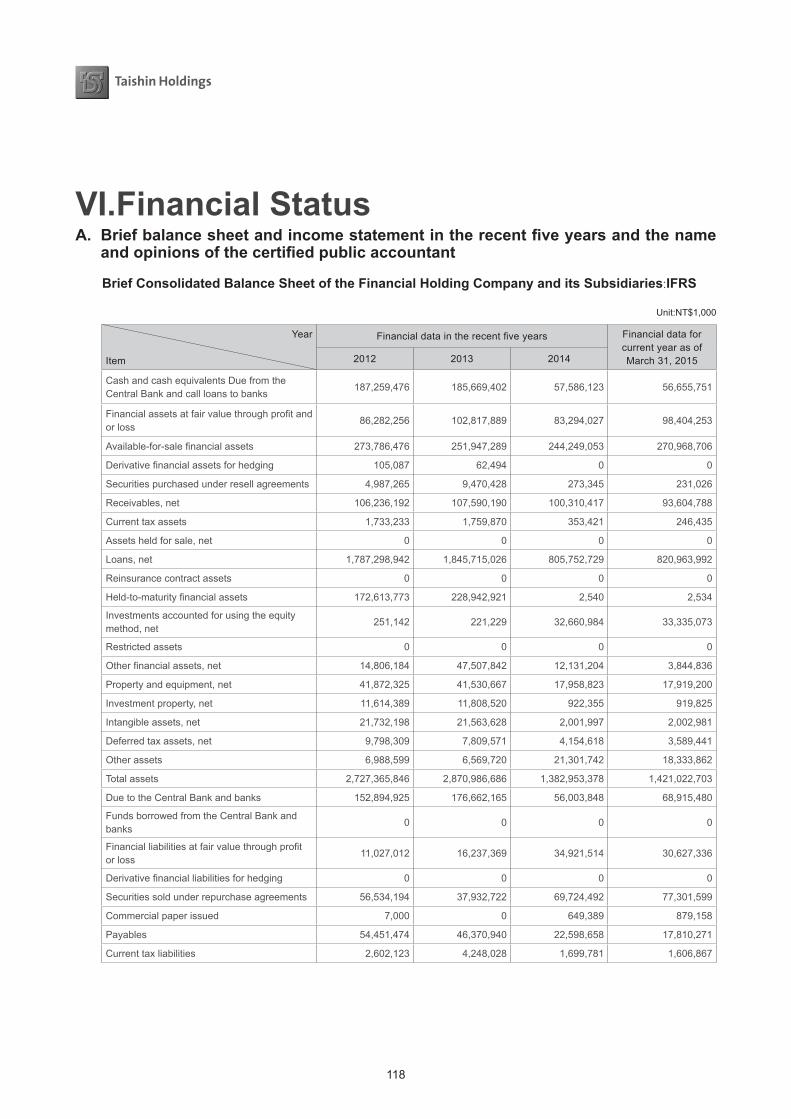
118
VI.Financial StatusA. Briefbalancesheetandincomestatementintherecentfiveyearsandthename
andopinionsofthecertifiedpublicaccountant
BriefConsolidatedBalanceSheetoftheFinancialHoldingCompanyanditsSubsidiaries:IFRS
Unit:NT$1,000
Year
Item
Financial data in the recent five years Financial data for current year as of March 31, 20152012 2013 2014
Cash and cash equivalents Due from the Central Bank and call loans to banks
187,259,476 185,669,402 57,586,123 56,655,751
Financial assets at fair value through profit and or loss
86,282,256 102,817,889 83,294,027 98,404,253
Available-for-sale financial assets 273,786,476 251,947,289 244,249,053 270,968,706
Derivative financial assets for hedging 105,087 62,494 0 0
Securities purchased under resell agreements 4,987,265 9,470,428 273,345 231,026
Receivables, net 106,236,192 107,590,190 100,310,417 93,604,788
Current tax assets 1,733,233 1,759,870 353,421 246,435
Assets held for sale, net 0 0 0 0
Loans, net 1,787,298,942 1,845,715,026 805,752,729 820,963,992
Reinsurance contract assets 0 0 0 0
Held-to-maturity financial assets 172,613,773 228,942,921 2,540 2,534
Investments accounted for using the equity method, net
251,142 221,229 32,660,984 33,335,073
Restricted assets 0 0 0 0
Other financial assets, net 14,806,184 47,507,842 12,131,204 3,844,836
Property and equipment, net 41,872,325 41,530,667 17,958,823 17,919,200
Investment property, net 11,614,389 11,808,520 922,355 919,825
Intangible assets, net 21,732,198 21,563,628 2,001,997 2,002,981
Deferred tax assets, net 9,798,309 7,809,571 4,154,618 3,589,441
Other assets 6,988,599 6,569,720 21,301,742 18,333,862
Total assets 2,727,365,846 2,870,986,686 1,382,953,378 1,421,022,703
Due to the Central Bank and banks 152,894,925 176,662,165 56,003,848 68,915,480
Funds borrowed from the Central Bank and banks
0 0 0 0
Financial liabilities at fair value through profit or loss
11,027,012 16,237,369 34,921,514 30,627,336
Derivative financial liabilities for hedging 0 0 0 0
Securities sold under repurchase agreements 56,534,194 37,932,722 69,724,492 77,301,599
Commercial paper issued 7,000 0 649,389 879,158
Payables 54,451,474 46,370,940 22,598,658 17,810,271
Current tax liabilities 2,602,123 4,248,028 1,699,781 1,606,867
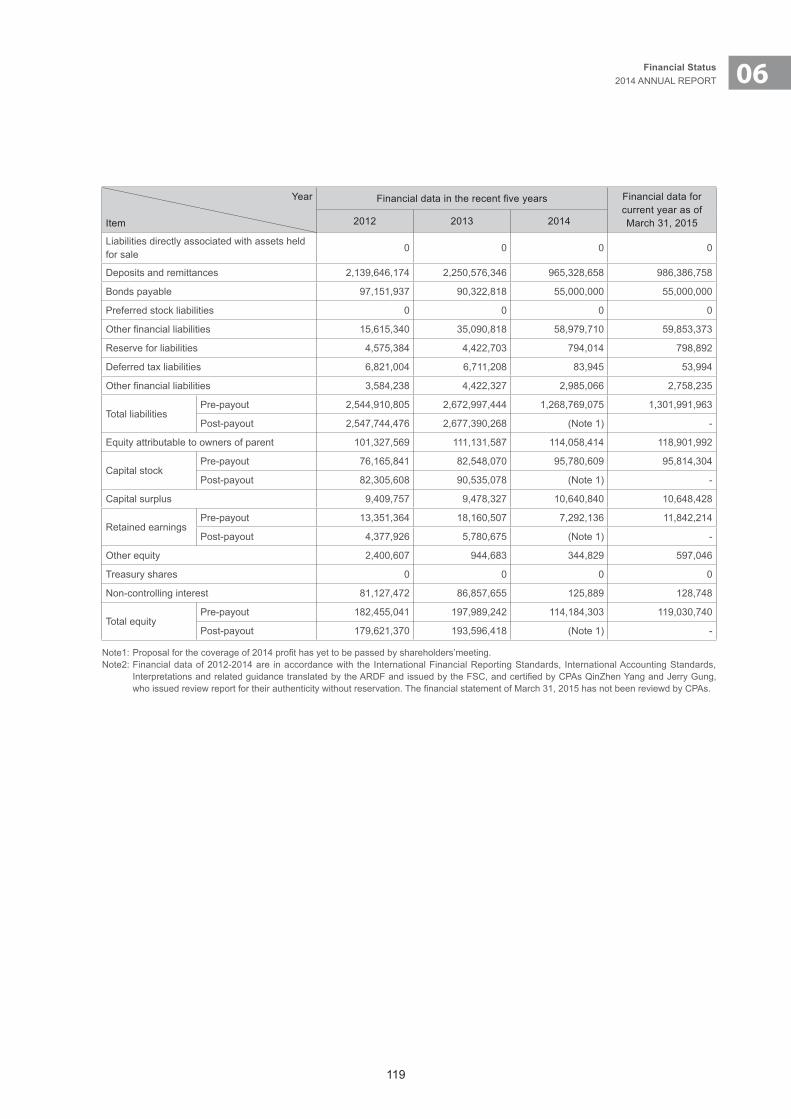
119
06Financial Status2014 ANNUAL REPORT
Year
Item
Financial data in the recent five years Financial data for current year as of March 31, 20152012 2013 2014
Liabilities directly associated with assets held for sale
0 0 0 0
Deposits and remittances 2,139,646,174 2,250,576,346 965,328,658 986,386,758
Bonds payable 97,151,937 90,322,818 55,000,000 55,000,000
Preferred stock liabilities 0 0 0 0
Other financial liabilities 15,615,340 35,090,818 58,979,710 59,853,373
Reserve for liabilities 4,575,384 4,422,703 794,014 798,892
Deferred tax liabilities 6,821,004 6,711,208 83,945 53,994
Other financial liabilities 3,584,238 4,422,327 2,985,066 2,758,235
Total liabilitiesPre-payout 2,544,910,805 2,672,997,444 1,268,769,075 1,301,991,963
Post-payout 2,547,744,476 2,677,390,268 (Note 1) -
Equity attributable to owners of parent 101,327,569 111,131,587 114,058,414 118,901,992
Capital stockPre-payout 76,165,841 82,548,070 95,780,609 95,814,304
Post-payout 82,305,608 90,535,078 (Note 1) -
Capital surplus 9,409,757 9,478,327 10,640,840 10,648,428
Retained earningsPre-payout 13,351,364 18,160,507 7,292,136 11,842,214
Post-payout 4,377,926 5,780,675 (Note 1) -
Other equity 2,400,607 944,683 344,829 597,046
Treasury shares 0 0 0 0
Non-controlling interest 81,127,472 86,857,655 125,889 128,748
Total equityPre-payout 182,455,041 197,989,242 114,184,303 119,030,740
Post-payout 179,621,370 193,596,418 (Note 1) -
Note1: Proposal for the coverage of 2014 profit has yet to be passed by shareholders’meeting.Note2: Financial data of 2012-2014 are in accordance with the International Financial Reporting Standards, International Accounting Standards,
Interpretations and related guidance translated by the ARDF and issued by the FSC, and certified by CPAs QinZhen Yang and Jerry Gung, who issued review report for their authenticity without reservation. The financial statement of March 31, 2015 has not been reviewd by CPAs.

120
BriefConsolidatedBalanceSheetoftheFinancialHoldingCompanyanditsSubsidiaries
Unit:NT$1,000
Year
Item2010 2011 2012
Cash and cash equivalents due from the Central Bank and placement to other banks
173,815,849 174,005,940 190,290,983
Financial assets stated as gain (loss) due to change in fair value 57,650,706 67,515,650 85,988,202
Investment in RS bills and bonds 5,328,210 9,734,993 4,987,265
Available-for-sale financial assets 221,514,265 248,786,716 270,722,899
Accounts receivable 126,326,832 110,761,564 107,547,734
Loans 1,577,700,288 1,723,226,715 1,787,298,942
Financial assets held to maturity 196,737,057 182,797,810 172,613,773
Equity investments under equity method 240,925 252,698 251,278
Fixed assets (Note 1) 41,962,513 41,204,451 41,596,338
Intangible assets 22,113,932 21,951,779 21,729,019
Other financial assets 21,125,873 18,005,451 12,885,644
Other assets 24,615,976 23,734,229 24,834,645
Total assets 2,469,132,426 2,621,977,996 2,720,746,722
Deposits by the Central Bank and other banks 152,360,876 174,583,880 152,894,925
Deposits 1,918,169,580 2,024,212,177 2,139,646,174
Financial liabilities stated as gain (loss) due to change in fair value 21,586,408 10,388,922 11,027,012
RP bill and bond liabilities 44,194,464 52,249,552 56,534,194
Accounts payable 50,038,751 57,275,084 57,162,211
Financing from the Central Bank and other banks 0 0 0
Bonds payable 91,302,139 97,146,086 97,151,937
Special stock liabilities 0 0 0
Reserve for operations and liabilities 1,309,483 779,673 806,938
Other financial liabilities 14,820,619 15,327,948 15,622,340
Other liabilities 8,908,066 9,671,492 9,907,860
Total liabilities 2,302,690,386 2,441,634,814 2,540,753,591
Equity of parent firm
Capital stockPre-payout 71,009,688 75,163,436 76,165,841
Post-payout 75,147,569 80,827,436 82,305,608
Additional paid-in capital 19,102,143 19,217,299 9,303,228
Retained earningsPre-payout 8,981,537 11,749,407 13,157,682
Post-payout 2,049,066 3,234,407 4,184,244
Other items of shareholders’ equity 110,911 88,787 1,073,198
Minority shareholding 67,237,761 74,124,253 80,293,182
Total shareholders’ equityPre-payout 166,442,040 180,343,182 179,993,131
Post-payout 163,647,450 177,492,182 177,159,460
Note 1: The subsidiary conducted land reevaluation of fixed assets in 2011 and 2012, which adjusted the book values upward to by NT$2,548,796,000 and NT$1,212,751,000.
Note 2: The 2010 financial statement was audited by CPAs Tsai Hongxiang and Weng Rongsui, who issued auditing report for their authenticity without reservation. The 2011 financial statement was certified by CPAs Tsai Hongxiang and Yang Qinzhen, who issued auditing report for their authenticity without reservation. The 2012 financial statement was certified by CPAs Tsai Hongxiang and Yang Qinzhen, who issued auditing report for their authenticity without reservation.

121
06Financial Status2014 ANNUAL REPORT
BriefConsolidatedComprehensive IncomeStatementof theFinancialHoldingCompanyandsubsidiaries-IFRS
Unit:NT$1,000
Year
Item
Financial data in the recent five years Financial data for current year as of March 31, 20152012 2013 2014
Interest income 48,768,964 50,532,658 55,785,260 7,205,317
Interest expenses ( 19,207,071 ) ( 19,252,887 ) ( 22,087,679 ) ( 2,870,050 )
Net interest income 29,561,893 31,279,771 33,697,581 4,335,267
Net income other than net interest income
19,862,868 24,547,462 10,942,105 5,575,311
Net revenue and gains 49,424,761 55,827,233 44,639,686 9,910,578
Reversed allowance for bad debts expenses and guarantee liability provisions
1,549,930 546,409 750,255 57,957
Net change in provisions for insurance liabilities
0 0 0 0
Operating expenses ( 30,307,392 ) ( 30,970,190 ) ( 32,221,529 ) ( 4,839,614 )
Income before income tax from continuing operations
20,667,299 25,403,452 13,168,412 5,128,921
Income tax (expense) benefit ( 3,796,314 ) ( 4,829,829 ) ( 3,520,673 ) ( 576,000 )
Net income from continuing operations 16,870,985 20,573,623 9,647,739 4,552,921
Net income from discontinued operations
0 0 0 0
Consolidated net income 16,870,985 20,573,623 9,647,739 4,552,921
Other comprehensive income, net of tax
1,667,001 ( 1,958,354 ) ( 325,670 ) 252,217
Total comprehensive income 18,537,986 18,615,269 9,322,069 4,805,138
Net income attributable to Owners of parent
10,386,660 13,836,248 1,624,376 4,550,079
Net income attributable to Non-controlling interests
6,484,325 6,737,375 8,023,363 2,842
Total comprehensive income attributable to Owners of parent
11,686,867 12,326,139 911,607 4,802,297
Total comprehensive income attributable to Non-controlling interests
6,851,119 6,289,130 8,410,462 2,841
Earnings per common share 1.10 1.57 0.08 0.49
Note1: Earnings per share for common shares is based on the unit of NT$1 and the effect of capital increase by earning has been taken into account retroactively in the calculation of the figure.
Note 2: Financial data of 2012-2014 are in accordance with the International Financial Reporting Standards, International Accounting Standards, Interpretations and related guidance translated by the ARDF and issued by the FSC, and certified by CPAs QinZhen Yang and Jerry Gung, who issued review report for their authenticity without reservation. The financial statement of March 31, 2015 has not been reviewd by CPAs.
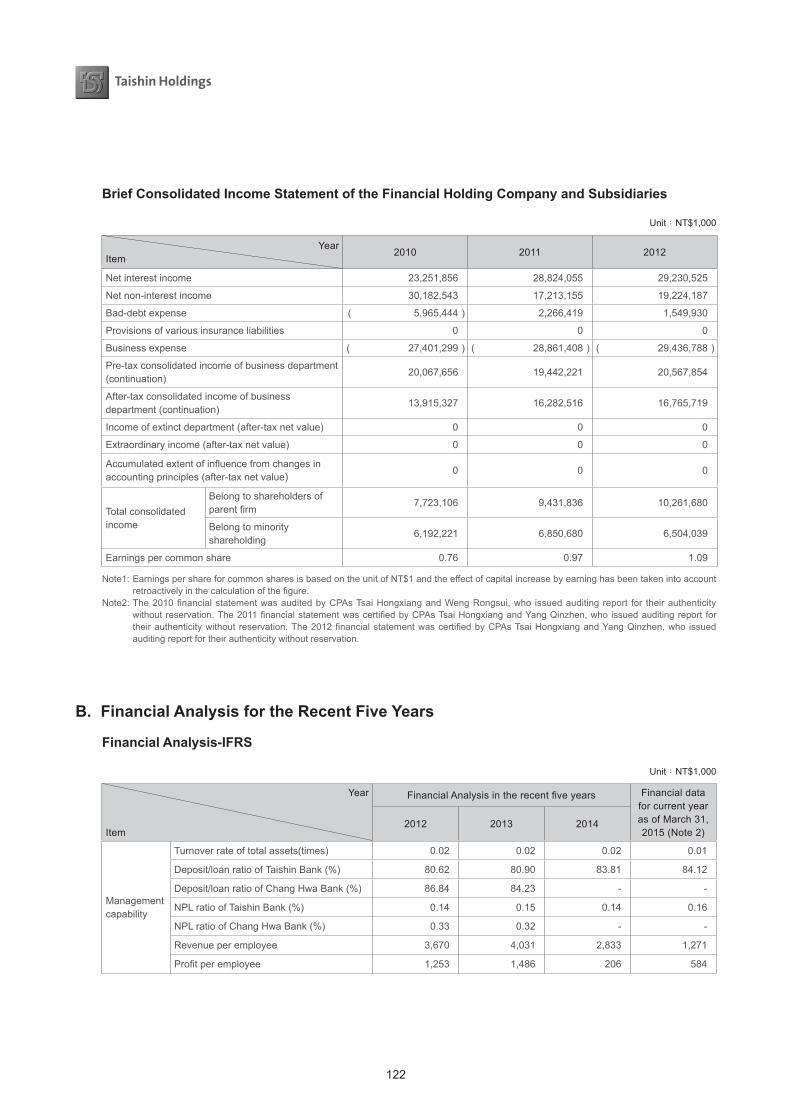
122
BriefConsolidatedIncomeStatementoftheFinancialHoldingCompanyandSubsidiaries
Unit:NT$1,000
YearItem
2010 2011 2012
Net interest income 23,251,856 28,824,055 29,230,525
Net non-interest income 30,182,543 17,213,155 19,224,187
Bad-debt expense ( 5,965,444 ) 2,266,419 1,549,930
Provisions of various insurance liabilities 0 0 0
Business expense ( 27,401,299 ) ( 28,861,408 ) ( 29,436,788 )
Pre-tax consolidated income of business department (continuation)
20,067,656 19,442,221 20,567,854
After-tax consolidated income of business department (continuation)
13,915,327 16,282,516 16,765,719
Income of extinct department (after-tax net value) 0 0 0
Extraordinary income (after-tax net value) 0 0 0
Accumulated extent of influence from changes in accounting principles (after-tax net value)
0 0 0
Total consolidated income
Belong to shareholders of parent firm
7,723,106 9,431,836 10,261,680
Belong to minority shareholding
6,192,221 6,850,680 6,504,039
Earnings per common share 0.76 0.97 1.09
Note1: Earnings per share for common shares is based on the unit of NT$1 and the effect of capital increase by earning has been taken into account retroactively in the calculation of the figure.
Note2: The 2010 financial statement was audited by CPAs Tsai Hongxiang and Weng Rongsui, who issued auditing report for their authenticity without reservation. The 2011 financial statement was certified by CPAs Tsai Hongxiang and Yang Qinzhen, who issued auditing report for their authenticity without reservation. The 2012 financial statement was certified by CPAs Tsai Hongxiang and Yang Qinzhen, who issued auditing report for their authenticity without reservation.
B.FinancialAnalysisfortheRecentFiveYears
FinancialAnalysis-IFRS
Unit:NT$1,000
Year
Item
Financial Analysis in the recent five years Financial data for current year as of March 31, 2015 (Note 2)
2012 2013 2014
Management capability
Turnover rate of total assets(times) 0.02 0.02 0.02 0.01
Deposit/loan ratio of Taishin Bank (%) 80.62 80.90 83.81 84.12
Deposit/loan ratio of Chang Hwa Bank (%) 86.84 84.23 - -
NPL ratio of Taishin Bank (%) 0.14 0.15 0.14 0.16
NPL ratio of Chang Hwa Bank (%) 0.33 0.32 - -
Revenue per employee 3,670 4,031 2,833 1,271
Profit per employee 1,253 1,486 206 584
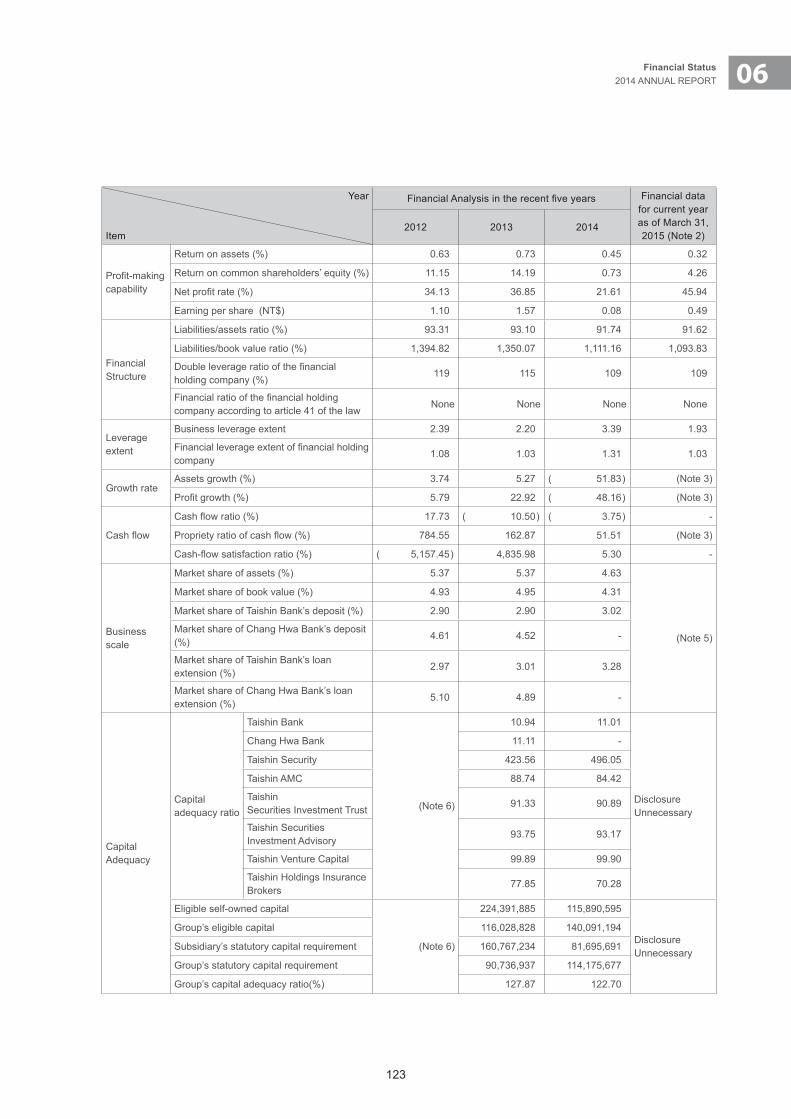
123
06Financial Status2014 ANNUAL REPORT
Year
Item
Financial Analysis in the recent five years Financial data for current year as of March 31, 2015 (Note 2)
2012 2013 2014
Profit-making capability
Return on assets (%) 0.63 0.73 0.45 0.32
Return on common shareholders’ equity (%) 11.15 14.19 0.73 4.26
Net profit rate (%) 34.13 36.85 21.61 45.94
Earning per share (NT$) 1.10 1.57 0.08 0.49
Financial Structure
Liabilities/assets ratio (%) 93.31 93.10 91.74 91.62
Liabilities/book value ratio (%) 1,394.82 1,350.07 1,111.16 1,093.83
Double leverage ratio of the financial holding company (%)
119 115 109 109
Financial ratio of the financial holding company according to article 41 of the law
None None None None
Leverage extent
Business leverage extent 2.39 2.20 3.39 1.93
Financial leverage extent of financial holding company
1.08 1.03 1.31 1.03
Growth rateAssets growth (%) 3.74 5.27 ( 51.83 ) (Note 3)
Profit growth (%) 5.79 22.92 ( 48.16 ) (Note 3)
Cash flow
Cash flow ratio (%) 17.73 ( 10.50 ) ( 3.75 ) -
Propriety ratio of cash flow (%) 784.55 162.87 51.51 (Note 3)
Cash-flow satisfaction ratio (%) ( 5,157.45 ) 4,835.98 5.30 -
Business scale
Market share of assets (%) 5.37 5.37 4.63
(Note 5)
Market share of book value (%) 4.93 4.95 4.31
Market share of Taishin Bank’s deposit (%) 2.90 2.90 3.02
Market share of Chang Hwa Bank’s deposit (%)
4.61 4.52 -
Market share of Taishin Bank’s loan extension (%)
2.97 3.01 3.28
Market share of Chang Hwa Bank’s loan extension (%)
5.10 4.89 -
Capital Adequacy
Capital adequacy ratio
Taishin Bank
(Note 6)
10.94 11.01
DisclosureUnnecessary
Chang Hwa Bank 11.11 -
Taishin Security 423.56 496.05
Taishin AMC 88.74 84.42
TaishinSecurities Investment Trust
91.33 90.89
Taishin Securities Investment Advisory
93.75 93.17
Taishin Venture Capital 99.89 99.90
Taishin Holdings Insurance Brokers
77.85 70.28
Eligible self-owned capital
(Note 6)
224,391,885 115,890,595
DisclosureUnnecessary
Group’s eligible capital 116,028,828 140,091,194
Subsidiary’s statutory capital requirement 160,767,234 81,695,691
Group’s statutory capital requirement 90,736,937 114,175,677
Group’s capital adequacy ratio(%) 127.87 122.70
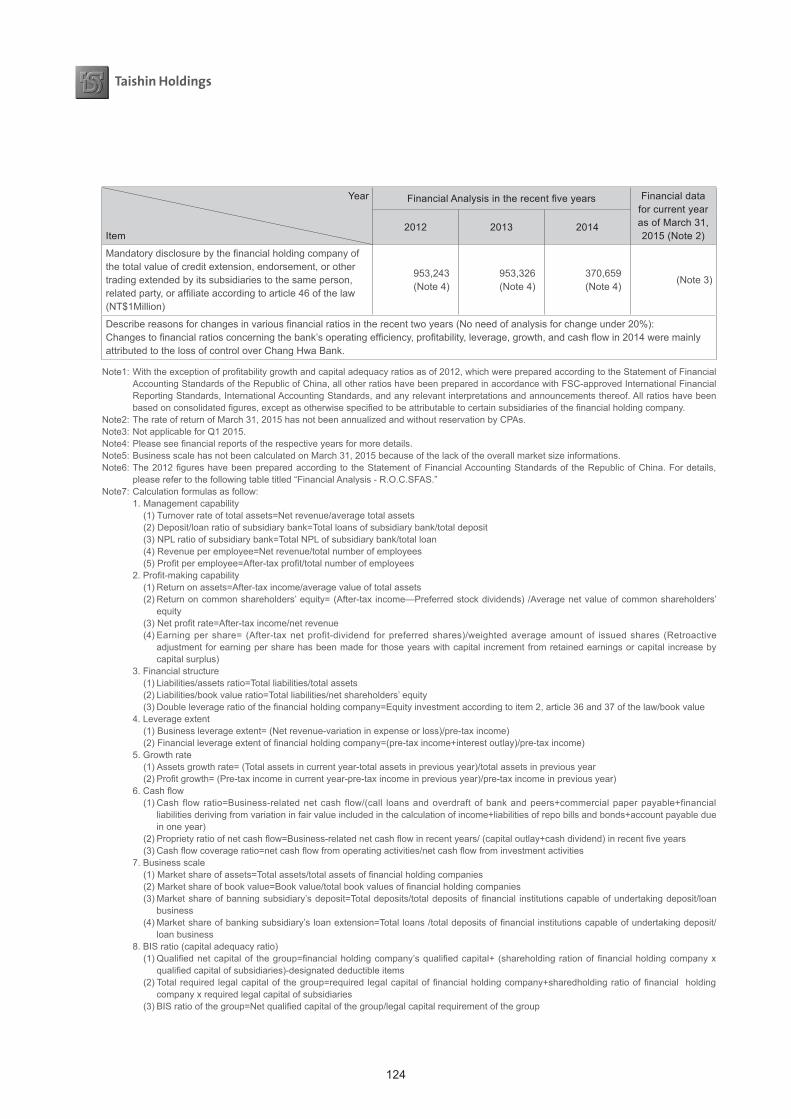
124
Year
Item
Financial Analysis in the recent five years Financial data for current year as of March 31, 2015 (Note 2)
2012 2013 2014
Mandatory disclosure by the financial holding company of the total value of credit extension, endorsement, or other trading extended by its subsidiaries to the same person, related party, or affiliate according to article 46 of the law (NT$1Million)
953,243 (Note 4)
953,326 (Note 4)
370,659 (Note 4)
(Note 3)
Describe reasons for changes in various financial ratios in the recent two years (No need of analysis for change under 20%):Changes to financial ratios concerning the bank’s operating efficiency, profitability, leverage, growth, and cash flow in 2014 were mainly attributed to the loss of control over Chang Hwa Bank.
Note1: With the exception of profitability growth and capital adequacy ratios as of 2012, which were prepared according to the Statement of Financial Accounting Standards of the Republic of China, all other ratios have been prepared in accordance with FSC-approved International Financial Reporting Standards, International Accounting Standards, and any relevant interpretations and announcements thereof. All ratios have been based on consolidated figures, except as otherwise specified to be attributable to certain subsidiaries of the financial holding company.
Note2: The rate of return of March 31, 2015 has not been annualized and without reservation by CPAs.Note3: Not applicable for Q1 2015.Note4: Please see financial reports of the respective years for more details.Note5: Business scale has not been calculated on March 31, 2015 because of the lack of the overall market size informations.Note6: The 2012 figures have been prepared according to the Statement of Financial Accounting Standards of the Republic of China. For details,
please refer to the following table titled “Financial Analysis - R.O.C.SFAS.”Note7: Calculation formulas as follow:
1. Management capability(1) Turnover rate of total assets=Net revenue/average total assets(2) Deposit/loan ratio of subsidiary bank=Total loans of subsidiary bank/total deposit(3) NPL ratio of subsidiary bank=Total NPL of subsidiary bank/total loan(4) Revenue per employee=Net revenue/total number of employees(5) Profit per employee=After-tax profit/total number of employees
2. Profit-making capability(1) Return on assets=After-tax income/average value of total assets(2) Return on common shareholders’ equity= (After-tax income—Preferred stock dividends) /Average net value of common shareholders’
equity(3) Net profit rate=After-tax income/net revenue(4) Earning per share= (After-tax net profit-dividend for preferred shares)/weighted average amount of issued shares (Retroactive
adjustment for earning per share has been made for those years with capital increment from retained earnings or capital increase by capital surplus)
3. Financial structure(1) Liabilities/assets ratio=Total liabilities/total assets(2) Liabilities/book value ratio=Total liabilities/net shareholders’ equity(3) Double leverage ratio of the financial holding company=Equity investment according to item 2, article 36 and 37 of the law/book value
4. Leverage extent(1) Business leverage extent= (Net revenue-variation in expense or loss)/pre-tax income)(2) Financial leverage extent of financial holding company=(pre-tax income+interest outlay)/pre-tax income)
5. Growth rate(1) Assets growth rate= (Total assets in current year-total assets in previous year)/total assets in previous year(2) Profit growth= (Pre-tax income in current year-pre-tax income in previous year)/pre-tax income in previous year)
6. Cash flow(1) Cash flow ratio=Business-related net cash flow/(call loans and overdraft of bank and peers+commercial paper payable+financial
liabilities deriving from variation in fair value included in the calculation of income+liabilities of repo bills and bonds+account payable due in one year)
(2) Propriety ratio of net cash flow=Business-related net cash flow in recent years/ (capital outlay+cash dividend) in recent five years(3) Cash flow coverage ratio=net cash flow from operating activities/net cash flow from investment activities
7. Business scale(1) Market share of assets=Total assets/total assets of financial holding companies(2) Market share of book value=Book value/total book values of financial holding companies(3) Market share of banning subsidiary’s deposit=Total deposits/total deposits of financial institutions capable of undertaking deposit/loan
business(4) Market share of banking subsidiary’s loan extension=Total loans /total deposits of financial institutions capable of undertaking deposit/
loan business8. BIS ratio (capital adequacy ratio)
(1) Qualified net capital of the group=financial holding company’s qualified capital+ (shareholding ration of financial holding company x qualified capital of subsidiaries)-designated deductible items
(2) Total required legal capital of the group=required legal capital of financial holding company+sharedholding ratio of financial holding company x required legal capital of subsidiaries
(3) BIS ratio of the group=Net qualified capital of the group/legal capital requirement of the group
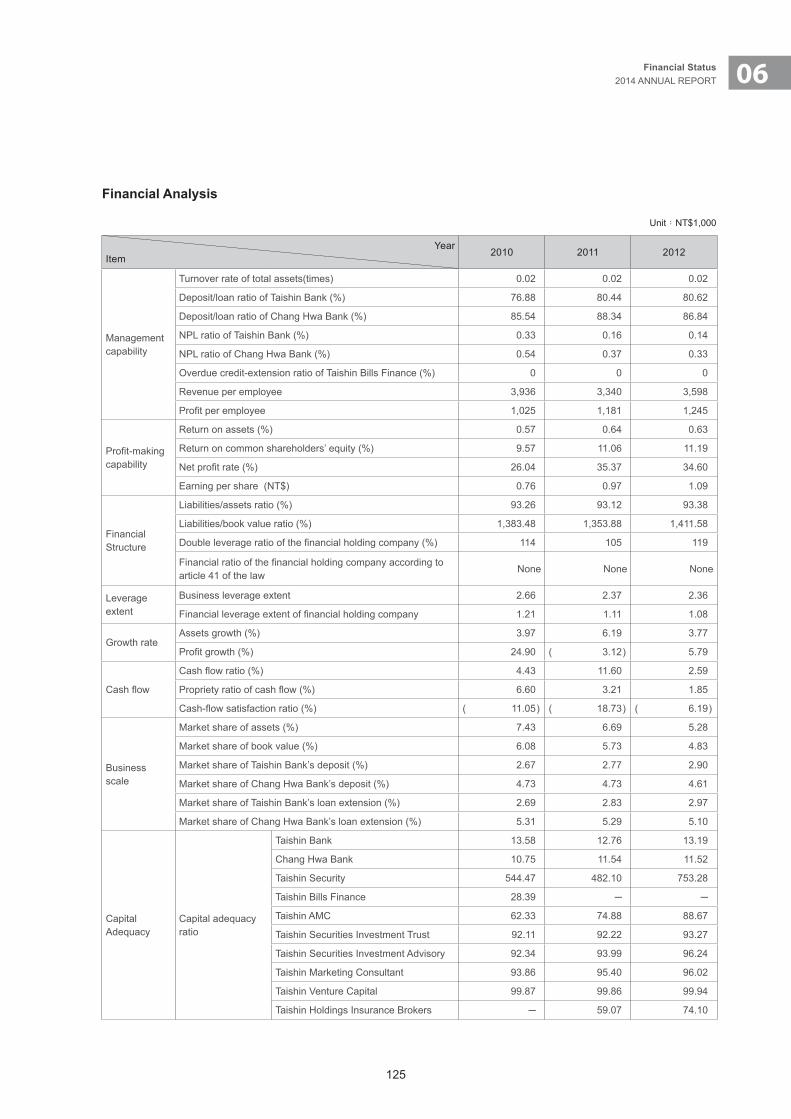
125
06Financial Status2014 ANNUAL REPORT
FinancialAnalysis
Unit:NT$1,000
YearItem
2010 2011 2012
Management capability
Turnover rate of total assets(times) 0.02 0.02 0.02
Deposit/loan ratio of Taishin Bank (%) 76.88 80.44 80.62
Deposit/loan ratio of Chang Hwa Bank (%) 85.54 88.34 86.84
NPL ratio of Taishin Bank (%) 0.33 0.16 0.14
NPL ratio of Chang Hwa Bank (%) 0.54 0.37 0.33
Overdue credit-extension ratio of Taishin Bills Finance (%) 0 0 0
Revenue per employee 3,936 3,340 3,598
Profit per employee 1,025 1,181 1,245
Profit-making capability
Return on assets (%) 0.57 0.64 0.63
Return on common shareholders’ equity (%) 9.57 11.06 11.19
Net profit rate (%) 26.04 35.37 34.60
Earning per share (NT$) 0.76 0.97 1.09
Financial Structure
Liabilities/assets ratio (%) 93.26 93.12 93.38
Liabilities/book value ratio (%) 1,383.48 1,353.88 1,411.58
Double leverage ratio of the financial holding company (%) 114 105 119
Financial ratio of the financial holding company according to article 41 of the law
None None None
Leverage extent
Business leverage extent 2.66 2.37 2.36
Financial leverage extent of financial holding company 1.21 1.11 1.08
Growth rateAssets growth (%) 3.97 6.19 3.77
Profit growth (%) 24.90 ( 3.12 ) 5.79
Cash flow
Cash flow ratio (%) 4.43 11.60 2.59
Propriety ratio of cash flow (%) 6.60 3.21 1.85
Cash-flow satisfaction ratio (%) ( 11.05 ) ( 18.73 ) ( 6.19 )
Business scale
Market share of assets (%) 7.43 6.69 5.28
Market share of book value (%) 6.08 5.73 4.83
Market share of Taishin Bank’s deposit (%) 2.67 2.77 2.90
Market share of Chang Hwa Bank’s deposit (%) 4.73 4.73 4.61
Market share of Taishin Bank’s loan extension (%) 2.69 2.83 2.97
Market share of Chang Hwa Bank’s loan extension (%) 5.31 5.29 5.10
Capital Adequacy
Capital adequacy ratio
Taishin Bank 13.58 12.76 13.19
Chang Hwa Bank 10.75 11.54 11.52
Taishin Security 544.47 482.10 753.28
Taishin Bills Finance 28.39 ─ ─
Taishin AMC 62.33 74.88 88.67
Taishin Securities Investment Trust 92.11 92.22 93.27
Taishin Securities Investment Advisory 92.34 93.99 96.24
Taishin Marketing Consultant 93.86 95.40 96.02
Taishin Venture Capital 99.87 99.86 99.94
Taishin Holdings Insurance Brokers ─ 59.07 74.10
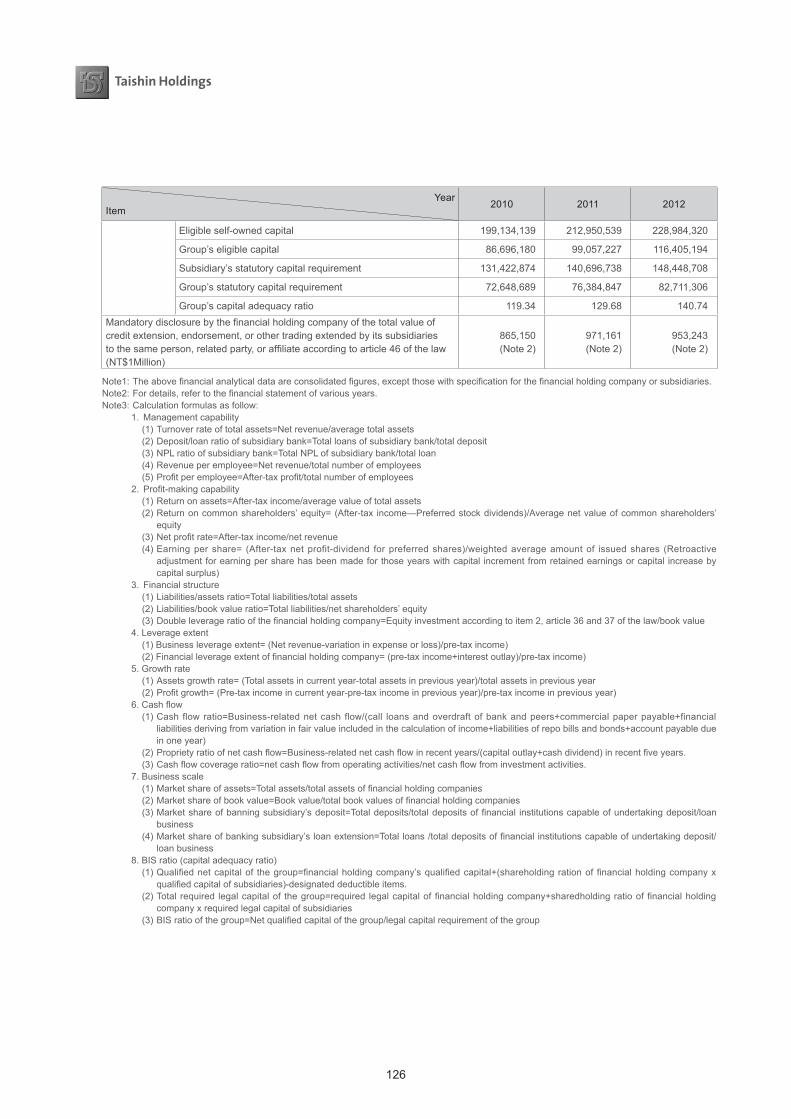
126
YearItem
2010 2011 2012
Eligible self-owned capital 199,134,139 212,950,539 228,984,320
Group’s eligible capital 86,696,180 99,057,227 116,405,194
Subsidiary’s statutory capital requirement 131,422,874 140,696,738 148,448,708
Group’s statutory capital requirement 72,648,689 76,384,847 82,711,306
Group’s capital adequacy ratio 119.34 129.68 140.74Mandatory disclosure by the financial holding company of the total value of credit extension, endorsement, or other trading extended by its subsidiaries to the same person, related party, or affiliate according to article 46 of the law (NT$1Million)
865,150 (Note 2)
971,161 (Note 2)
953,243 (Note 2)
Note1: The above financial analytical data are consolidated figures, except those with specification for the financial holding company or subsidiaries.Note2: For details, refer to the financial statement of various years.Note3: Calculation formulas as follow:
1. Management capability(1) Turnover rate of total assets=Net revenue/average total assets(2) Deposit/loan ratio of subsidiary bank=Total loans of subsidiary bank/total deposit(3) NPL ratio of subsidiary bank=Total NPL of subsidiary bank/total loan(4) Revenue per employee=Net revenue/total number of employees(5) Profit per employee=After-tax profit/total number of employees
2. Profit-making capability(1) Return on assets=After-tax income/average value of total assets(2) Return on common shareholders’ equity= (After-tax income—Preferred stock dividends)/Average net value of common shareholders’
equity(3) Net profit rate=After-tax income/net revenue(4) Earning per share= (After-tax net profit-dividend for preferred shares)/weighted average amount of issued shares (Retroactive
adjustment for earning per share has been made for those years with capital increment from retained earnings or capital increase by capital surplus)
3. Financial structure(1) Liabilities/assets ratio=Total liabilities/total assets(2) Liabilities/book value ratio=Total liabilities/net shareholders’ equity(3) Double leverage ratio of the financial holding company=Equity investment according to item 2, article 36 and 37 of the law/book value
4. Leverage extent(1) Business leverage extent= (Net revenue-variation in expense or loss)/pre-tax income)(2) Financial leverage extent of financial holding company= (pre-tax income+interest outlay)/pre-tax income)
5. Growth rate(1) Assets growth rate= (Total assets in current year-total assets in previous year)/total assets in previous year(2) Profit growth= (Pre-tax income in current year-pre-tax income in previous year)/pre-tax income in previous year)
6. Cash flow(1) Cash flow ratio=Business-related net cash flow/(call loans and overdraft of bank and peers+commercial paper payable+financial
liabilities deriving from variation in fair value included in the calculation of income+liabilities of repo bills and bonds+account payable due in one year)
(2) Propriety ratio of net cash flow=Business-related net cash flow in recent years/(capital outlay+cash dividend) in recent five years.(3) Cash flow coverage ratio=net cash flow from operating activities/net cash flow from investment activities.
7. Business scale(1) Market share of assets=Total assets/total assets of financial holding companies(2) Market share of book value=Book value/total book values of financial holding companies(3) Market share of banning subsidiary’s deposit=Total deposits/total deposits of financial institutions capable of undertaking deposit/loan
business(4) Market share of banking subsidiary’s loan extension=Total loans /total deposits of financial institutions capable of undertaking deposit/
loan business8. BIS ratio (capital adequacy ratio)
(1) Qualified net capital of the group=financial holding company’s qualified capital+(shareholding ration of financial holding company x qualified capital of subsidiaries)-designated deductible items.
(2) Total required legal capital of the group=required legal capital of financial holding company+sharedholding ratio of financial holding company x required legal capital of subsidiaries
(3) BIS ratio of the group=Net qualified capital of the group/legal capital requirement of the group
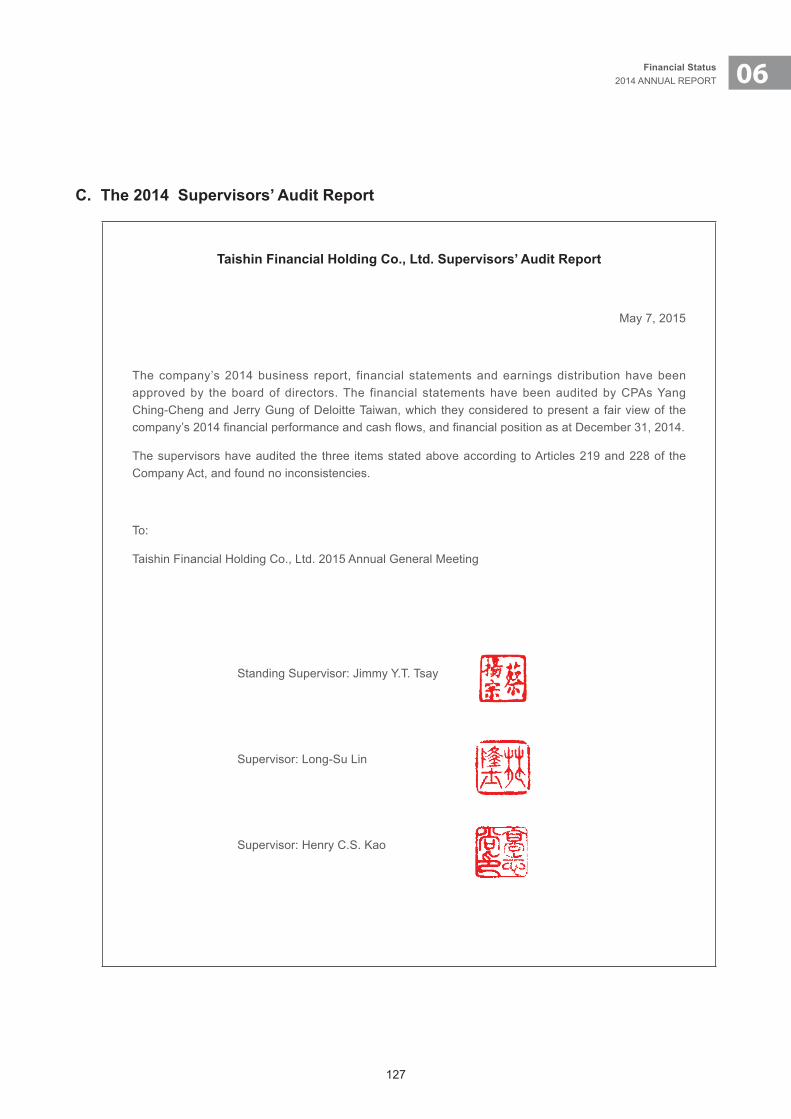
127
06Financial Status2014 ANNUAL REPORT
C. The 2014 Supervisors’ Audit Report
Taishin Financial Holding Co., Ltd. Supervisors’ Audit Report
May 7, 2015
The company’s 2014 business report, financial statements and earnings distribution have been approved by the board of directors. The financial statements have been audited by CPAs Yang Ching-Cheng and Jerry Gung of Deloitte Taiwan, which they considered to present a fair view of the company’s 2014 financial performance and cash flows, and financial position as at December 31, 2014.
The supervisors have audited the three items stated above according to Articles 219 and 228 of the Company Act, and found no inconsistencies.
To:
Taishin Financial Holding Co., Ltd. 2015 Annual General Meeting
Standing Supervisor: Jimmy Y.T. Tsay
Supervisor: Long-Su Lin
Supervisor: Henry C.S. Kao
128
D. The LatestConsolidated Financial Statements of theCompany and ItsSubsidiariesAuditedandCertifiedbyCPAs
INDEPENDENTAUDITORS’REPORT
The Board of Directors and StockholdersTaishin Financial Holding Co., Ltd.
We have audited the accompanying consolidated balance sheets of Taishin Financial Holding Co., Ltd. (“Taishin Financial Holding”) and its subsidiaries (collectively referred to as the “Group”) as of December 31, 2014 and December 31, 2013, and the related consolidated statements of comprehensive income, and changes in equity and cash flows for the years ended December 31, 2014 and 2013. These consolidated financial statements are the responsibility of Taishin Financial Holding and subsidiaries’ management. Our responsibility is to express an opinion on these consolidated financial statements based on our audits.
We conducted our audits in accordance with the Rules Governing the Audit of Financial Statements by Certified Public Accountants, Rules Governing the Audit of Financial Statements of Financial Institutions by Certified Public Accountants, and auditing standards generally accepted in the Republic of China (“ROC”). Those rules and standards require that we plan and perform the audit to obtain reasonable assurance about whether the consolidated financial statements are free of material misstatement. An audit includes examining, on a test basis, evidence supporting the amounts and disclosures in the consolidated financial statements. An audit also includes assessing the accounting principles used and significant estimates made by management, as well as evaluating the overall consolidated financial statements presentation. We believe that our audits provide a reasonable basis for our opinion.
In our opinion, the consolidated financial statements referred to above present fairly, in all material respects, the consolidated financial position of Taishin Financial Holding Co., Ltd. and its subsidiaries as of December 31, 2014 and December 31, 2013, and their consolidated financial performance and their consolidated cash flows for the years ended December 31, 2014 and 2013, in conformity with the Regulations Governing the Preparation of Financial Statements by Financial Holding Companies, Regulations Governing the Preparation of Financial Reports by Public Banks, Regulations Governing the Preparation of Financial Reports by Securities Firms, Regulations Governing the Preparation of Financial Reports by Securities Issuers, and International Financial Reporting Standards (IFRS), International Accounting Standards (IAS), IFRIC Interpretations (IFRIC), and SIC Interpretations (SIC) endorsed by the Financial Supervisory Commission of the Republic of China.
We have also audited the accompanying schedules of significant accounts, provided for supplementary analysis, by applying the same procedures described above. In our opinion, such schedules are consistent, in all material respects, with the financial statements referred to above.
March 27, 2015
129
06Financial Status2014 ANNUAL REPORT
Notice to Readers
The accompanying consolidated financial statements are intended only to present the financial position, results of operations and cash flows in accordance with accounting principles and practices generally accepted in the ROC and not those of any other jurisdictions. The standards, procedures and practices to audit such consolidated financial statements are those generally accepted and applied in the ROC.
For the convenience of readers, the independent auditors’ report and the accompanying consolidated financial statements have been translated into English from the original Chinese version prepared and used in the ROC. If there is any conflict between the English version and the original Chinese version or any difference in the interpretation of the two versions, the Chinese-language independent auditors’ report and consolidated financial statements shall prevail.
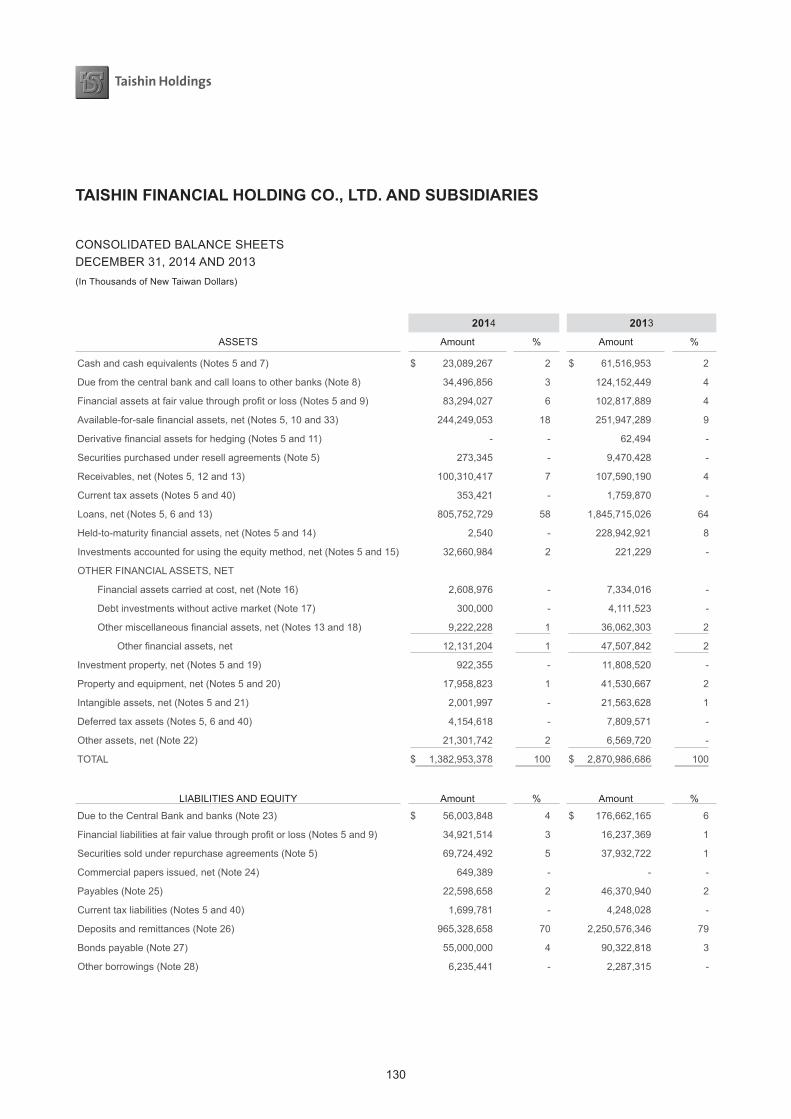
130
TAISHINFINANCIALHOLDINGCO.,LTD.ANDSUBSIDIARIES
CONSOLIDATED BALANCE SHEETSDECEMBER 31, 2014 AND 2013(In Thousands of New Taiwan Dollars)
2014 2013
ASSETS Amount % Amount %
Cash and cash equivalents (Notes 5 and 7) $ 23,089,267 2 $ 61,516,953 2
Due from the central bank and call loans to other banks (Note 8) 34,496,856 3 124,152,449 4
Financial assets at fair value through profit or loss (Notes 5 and 9) 83,294,027 6 102,817,889 4
Available-for-sale financial assets, net (Notes 5, 10 and 33) 244,249,053 18 251,947,289 9
Derivative financial assets for hedging (Notes 5 and 11) - - 62,494 -
Securities purchased under resell agreements (Note 5) 273,345 - 9,470,428 -
Receivables, net (Notes 5, 12 and 13) 100,310,417 7 107,590,190 4
Current tax assets (Notes 5 and 40) 353,421 - 1,759,870 -
Loans, net (Notes 5, 6 and 13) 805,752,729 58 1,845,715,026 64
Held-to-maturity financial assets, net (Notes 5 and 14) 2,540 - 228,942,921 8
Investments accounted for using the equity method, net (Notes 5 and 15) 32,660,984 2 221,229 -
OTHER FINANCIAL ASSETS, NET
Financial assets carried at cost, net (Note 16) 2,608,976 - 7,334,016 -
Debt investments without active market (Note 17) 300,000 - 4,111,523 -
Other miscellaneous financial assets, net (Notes 13 and 18) 9,222,228 1 36,062,303 2
Other financial assets, net 12,131,204 1 47,507,842 2
Investment property, net (Notes 5 and 19) 922,355 - 11,808,520 -
Property and equipment, net (Notes 5 and 20) 17,958,823 1 41,530,667 2
Intangible assets, net (Notes 5 and 21) 2,001,997 - 21,563,628 1
Deferred tax assets (Notes 5, 6 and 40) 4,154,618 - 7,809,571 -
Other assets, net (Note 22) 21,301,742 2 6,569,720 -
TOTAL $ 1,382,953,378 100 $ 2,870,986,686 100
LIABILITIES AND EQUITY Amount % Amount %
Due to the Central Bank and banks (Note 23) $ 56,003,848 4 $ 176,662,165 6
Financial liabilities at fair value through profit or loss (Notes 5 and 9) 34,921,514 3 16,237,369 1
Securities sold under repurchase agreements (Note 5) 69,724,492 5 37,932,722 1
Commercial papers issued, net (Note 24) 649,389 - - -
Payables (Note 25) 22,598,658 2 46,370,940 2
Current tax liabilities (Notes 5 and 40) 1,699,781 - 4,248,028 -
Deposits and remittances (Note 26) 965,328,658 70 2,250,576,346 79
Bonds payable (Note 27) 55,000,000 4 90,322,818 3
Other borrowings (Note 28) 6,235,441 - 2,287,315 -
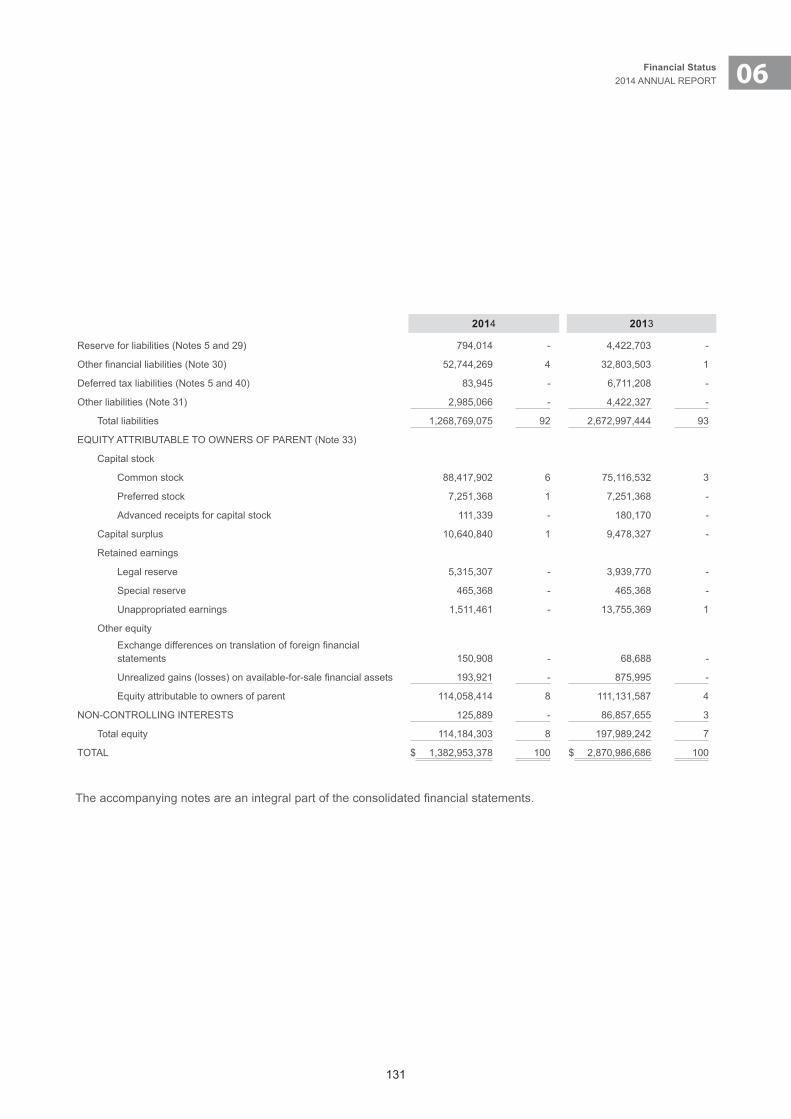
131
06Financial Status2014 ANNUAL REPORT
2014 2013
Reserve for liabilities (Notes 5 and 29) 794,014 - 4,422,703 -
Other financial liabilities (Note 30) 52,744,269 4 32,803,503 1
Deferred tax liabilities (Notes 5 and 40) 83,945 - 6,711,208 -
Other liabilities (Note 31) 2,985,066 - 4,422,327 -
Total liabilities 1,268,769,075 92 2,672,997,444 93
EQUITY ATTRIBUTABLE TO OWNERS OF PARENT (Note 33)
Capital stock
Common stock 88,417,902 6 75,116,532 3
Preferred stock 7,251,368 1 7,251,368 -
Advanced receipts for capital stock 111,339 - 180,170 -
Capital surplus 10,640,840 1 9,478,327 -
Retained earnings
Legal reserve 5,315,307 - 3,939,770 -
Special reserve 465,368 - 465,368 -
Unappropriated earnings 1,511,461 - 13,755,369 1
Other equity
Exchange differences on translation of foreign financial statements 150,908 - 68,688 -
Unrealized gains (losses) on available-for-sale financial assets 193,921 - 875,995 -
Equity attributable to owners of parent 114,058,414 8 111,131,587 4
NON-CONTROLLING INTERESTS 125,889 - 86,857,655 3
Total equity 114,184,303 8 197,989,242 7
TOTAL $ 1,382,953,378 100 $ 2,870,986,686 100
The accompanying notes are an integral part of the consolidated financial statements.
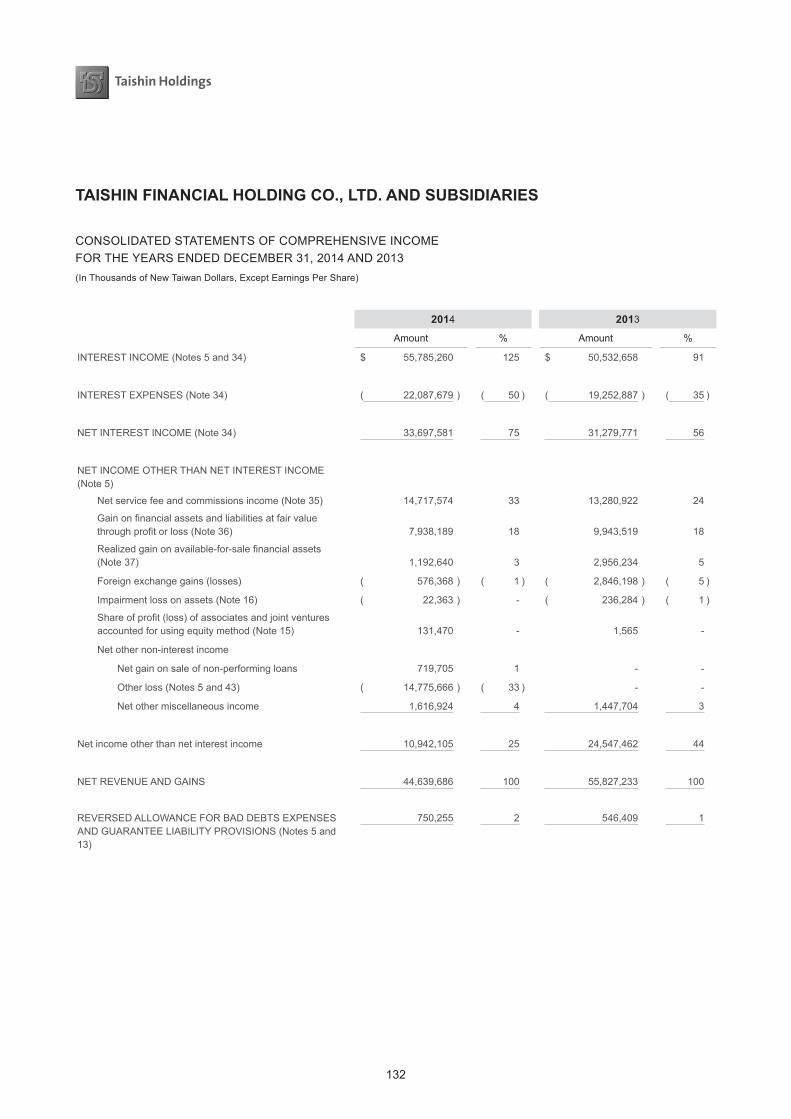
132
TAISHINFINANCIALHOLDINGCO.,LTD.ANDSUBSIDIARIES
CONSOLIDATED STATEMENTS OF COMPREHENSIVE INCOMEFOR THE YEARS ENDED DECEMBER 31, 2014 AND 2013(In Thousands of New Taiwan Dollars, Except Earnings Per Share)
2014 2013
Amount % Amount %
INTEREST INCOME (Notes 5 and 34) $ 55,785,260 125 $ 50,532,658 91
INTEREST EXPENSES (Note 34) ( 22,087,679 ) ( 50 ) ( 19,252,887 ) ( 35 )
NET INTEREST INCOME (Note 34) 33,697,581 75 31,279,771 56
NET INCOME OTHER THAN NET INTEREST INCOME (Note 5)
Net service fee and commissions income (Note 35) 14,717,574 33 13,280,922 24
Gain on financial assets and liabilities at fair value through profit or loss (Note 36) 7,938,189 18 9,943,519 18
Realized gain on available-for-sale financial assets (Note 37) 1,192,640 3 2,956,234 5
Foreign exchange gains (losses) ( 576,368 ) ( 1 ) ( 2,846,198 ) ( 5 )
Impairment loss on assets (Note 16) ( 22,363 ) - ( 236,284 ) ( 1 )
Share of profit (loss) of associates and joint ventures accounted for using equity method (Note 15) 131,470 - 1,565 -
Net other non-interest income
Net gain on sale of non-performing loans 719,705 1 - -
Other loss (Notes 5 and 43) ( 14,775,666 ) ( 33 ) - -
Net other miscellaneous income 1,616,924 4 1,447,704 3
Net income other than net interest income 10,942,105 25 24,547,462 44
NET REVENUE AND GAINS 44,639,686 100 55,827,233 100
REVERSED ALLOWANCE FOR BAD DEBTS EXPENSES AND GUARANTEE LIABILITY PROVISIONS (Notes 5 and 13)
750,255 2 546,409 1

133
06Financial Status2014 ANNUAL REPORT
2014 2013
Amount % Amount %
OPERATING EXPENSES
Employee benefits expenses (Note 38) ( 19,910,494 ) ( 45 ) ( 19,834,522 ) ( 35 )
Depreciation and amortization expenses (Note 39) ( 1,561,738 ) ( 3 ) ( 1,480,964 ) ( 3 )
Other general and administrative expenses ( 10,749,297 ) ( 24 ) ( 9,654,704 ) ( 17 )
Total operating expenses ( 32,221,529 ) ( 72 ) ( 30,970,190 ) ( 55 )
INCOME BEFORE INCOME TAX 13,168,412 30 25,403,452 46
INCOME TAX EXPENSE (Notes 5 and 40) ( 3,520,673 ) ( 8 ) ( 4,829,829 ) ( 9 )
NET INCOME 9,647,739 22 20,573,623 37
OTHER COMPREHENSIVE INCOME
Exchange differences on translation of foreign financial statements
318,491 1 351,249 1
Unrealized gains (losses) on available-for-sale financial assets
( 619,158 ) ( 2 ) ( 2,430,501 ) ( 4 )
Actuarial gain and loss arising from defined benefit plans
( 77,523 ) - ( 222,260 ) ( 1 )
Share of the other comprehensive income of associates and joint ventures
97,586 - ( 230 ) -
Income tax relating to the components of other comprehensive income (loss)
( 45,066 ) - 343,388 -
Other comprehensive income (loss), net of tax ( 325,670 ) ( 1 ) ( 1,958,354 ) ( 4 )
TOTAL COMPREHENSIVE INCOME $ 9,322,069 21 $ 18,615,269 33
NET INCOME ATTRIBUTABLE TO:
Owners of parent $ 1,624,376 4 $ 13,836,248 25
Non-controlling interests 8,023,363 18 6,737,375 12
$ 9,647,739 22 $ 20,573,623 37
TOTAL COMPREHENSIVE INCOME ATTRIBUTABLE TO:
Owners of parent $ 911,607 2 $ 12,326,139 22
Non-controlling interests 8,410,462 19 6,289,130 11
$ 9,322,069 21 $ 18,615,269 33
EARNINGS PER SHARE (Note 41)
Basic $ 0.08 $ 1.57
Diluted $ 0.08 $ 1.54
The accompanying notes are an integral part of the consolidated financial statements.
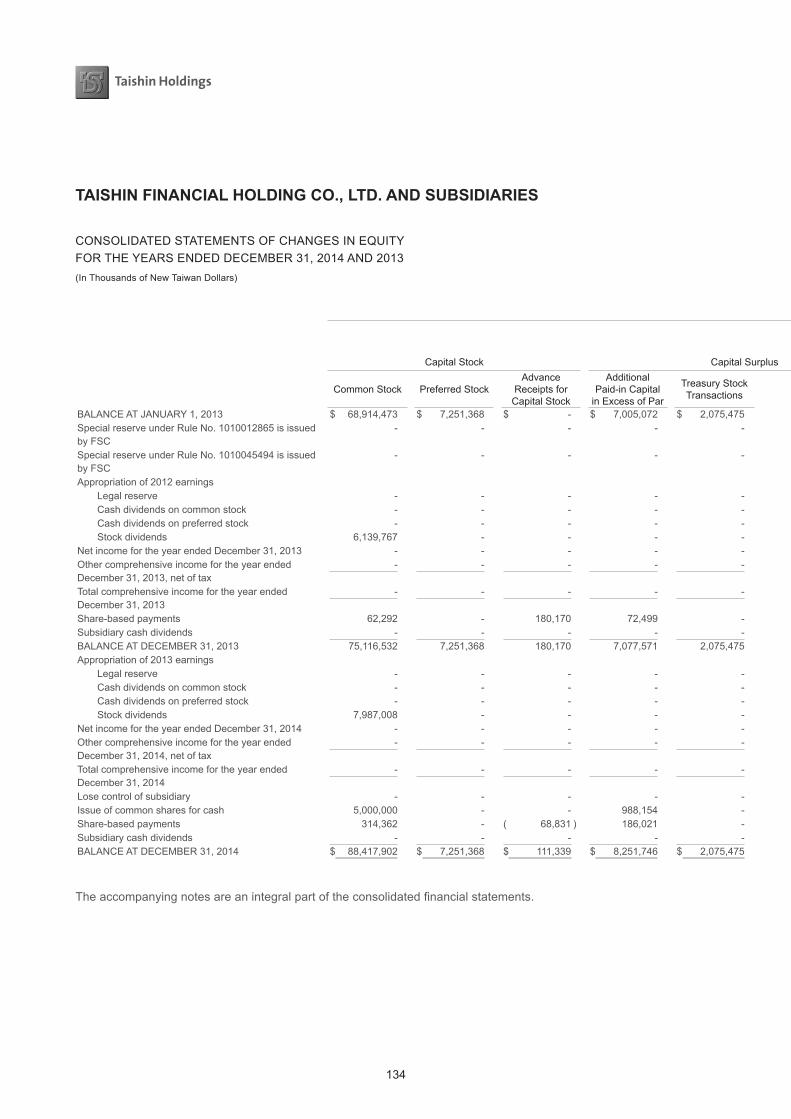
134
TAISHINFINANCIALHOLDINGCO.,LTD.ANDSUBSIDIARIES
CONSOLIDATED STATEMENTS OF CHANGES IN EQUITYFOR THE YEARS ENDED DECEMBER 31, 2014 AND 2013(In Thousands of New Taiwan Dollars)
Equity Attributable to Owners of the ParentOther Equity
ExchangeDifferences onTranslation of
Foreign Financial
Statements
Unrealized Gains
(Losses) onAvailable-for-sale
Financial Assets
Capital Stock Capital Surplus Retained Earnings
Common Stock Preferred StockAdvance
Receipts for Capital Stock
AdditionalPaid-in Capital
in Excess of Par
Treasury StockTransactions
Stock-basedCompensation Legal Reserve Special Reserve Unappropriated
EarningsNon-controlling
Interests Total Equity
BALANCE AT JANUARY 1, 2013 $ 68,914,473 $ 7,251,368 $ - $ 7,005,072 $ 2,075,475 $ 329,210 $ 2,942,721 $ 244,474 $ 10,164,169 ($ 58,334 ) $ 2,458,941 $ 81,127,472 $ 182,455,041Special reserve under Rule No. 1010012865 is issued by FSC
- - - - - - - 220,376 ( 220,376 ) - - - -
Special reserve under Rule No. 1010045494 is issued by FSC
- - - - - - - 518 - - - - 518
Appropriation of 2012 earnings Legal reserve - - - - - - 997,049 - ( 997,049 ) - - - - Cash dividends on common stock - - - - - - - - ( 1,534,942 ) - - - ( 1,534,942 ) Cash dividends on preferred stock - - - - - - - - ( 1,298,729 ) - - - ( 1,298,729 ) Stock dividends 6,139,767 - - - - - - - ( 6,139,767 ) - - - -Net income for the year ended December 31, 2013 - - - - - - - - 13,836,248 - - 6,737,375 20,573,623Other comprehensive income for the year ended December 31, 2013, net of tax
- - - - - - - - ( 54,185 ) 127,022 ( 1,582,946 ) ( 448,245 ) ( 1,958,354 )
Total comprehensive income for the year ended December 31, 2013
- - - - - - - - 13,782,063 127,022 ( 1,582,946 ) 6,289,130 18,615,269
Share-based payments 62,292 - 180,170 72,499 - ( 3,929 ) - - - - - 58 311,090Subsidiary cash dividends - - - - - - - - - - - ( 559,005 ) ( 559,005 )BALANCE AT DECEMBER 31, 2013 75,116,532 7,251,368 180,170 7,077,571 2,075,475 325,281 3,939,770 465,368 13,755,369 68,688 875,995 86,857,655 197,989,242Appropriation of 2013 earnings Legal reserve - - - - - - 1,375,537 - ( 1,375,537 ) - - - - Cash dividends on common stock - - - - - - - - ( 3,423,308 ) - - - ( 3,423,308 ) Cash dividends on preferred stock - - - - - - - - ( 969,516 ) - - - ( 969,516 ) Stock dividends 7,987,008 - - - - - - - ( 7,987,008 ) - - - -Net income for the year ended December 31, 2014 - - - - - - - - 1,624,376 - - 8,023,363 9,647,739Other comprehensive income for the year ended December 31, 2014, net of tax
- - - - - - - - ( 112,915 ) 82,220 ( 682,074 ) 387,099 ( 325,670 )
Total comprehensive income for the year ended December 31, 2014
- - - - - - - - 1,511,461 82,220 ( 682,074 ) 8,410,462 9,322,069
Lose control of subsidiary - - - - - - - - - - - ( 91,553,576 ) ( 91,553,576 )Issue of common shares for cash 5,000,000 - - 988,154 - - - - - - - - 5,988,154Share-based payments 314,362 - ( 68,831 ) 186,021 - ( 11,662 ) - - - - - 158 420,048Subsidiary cash dividends - - - - - - - - - - - ( 3,588,810 ) ( 3,588,810 )BALANCE AT DECEMBER 31, 2014 $ 88,417,902 $ 7,251,368 $ 111,339 $ 8,251,746 $ 2,075,475 $ 313,619 $ 5,315,307 $ 465,368 $ 1,511,461 $ 150,908 $ 193,921 $ 125,889 $ 114,184,303
The accompanying notes are an integral part of the consolidated financial statements.
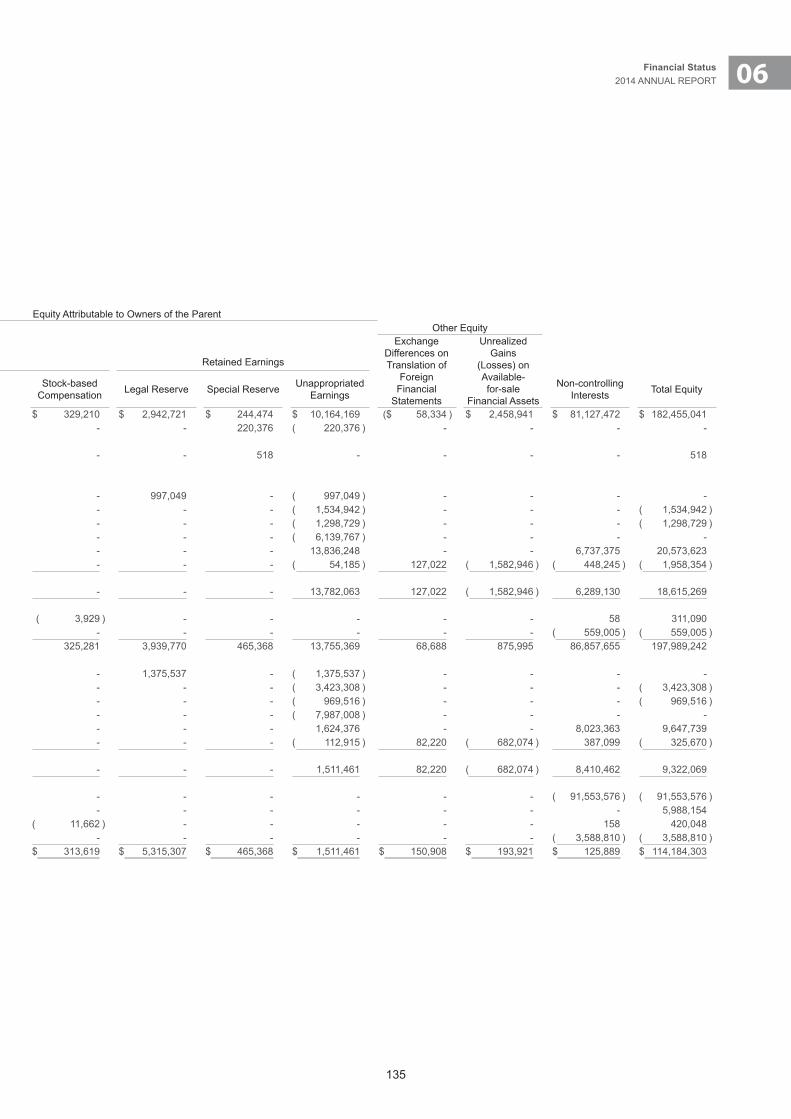
135
06Financial Status2014 ANNUAL REPORT
TAISHINFINANCIALHOLDINGCO.,LTD.ANDSUBSIDIARIES
CONSOLIDATED STATEMENTS OF CHANGES IN EQUITYFOR THE YEARS ENDED DECEMBER 31, 2014 AND 2013(In Thousands of New Taiwan Dollars)
Equity Attributable to Owners of the ParentOther Equity
ExchangeDifferences onTranslation of
Foreign Financial
Statements
Unrealized Gains
(Losses) onAvailable-for-sale
Financial Assets
Capital Stock Capital Surplus Retained Earnings
Common Stock Preferred StockAdvance
Receipts for Capital Stock
AdditionalPaid-in Capital
in Excess of Par
Treasury StockTransactions
Stock-basedCompensation Legal Reserve Special Reserve Unappropriated
EarningsNon-controlling
Interests Total Equity
BALANCE AT JANUARY 1, 2013 $ 68,914,473 $ 7,251,368 $ - $ 7,005,072 $ 2,075,475 $ 329,210 $ 2,942,721 $ 244,474 $ 10,164,169 ($ 58,334 ) $ 2,458,941 $ 81,127,472 $ 182,455,041Special reserve under Rule No. 1010012865 is issued by FSC
- - - - - - - 220,376 ( 220,376 ) - - - -
Special reserve under Rule No. 1010045494 is issued by FSC
- - - - - - - 518 - - - - 518
Appropriation of 2012 earnings Legal reserve - - - - - - 997,049 - ( 997,049 ) - - - - Cash dividends on common stock - - - - - - - - ( 1,534,942 ) - - - ( 1,534,942 ) Cash dividends on preferred stock - - - - - - - - ( 1,298,729 ) - - - ( 1,298,729 ) Stock dividends 6,139,767 - - - - - - - ( 6,139,767 ) - - - -Net income for the year ended December 31, 2013 - - - - - - - - 13,836,248 - - 6,737,375 20,573,623Other comprehensive income for the year ended December 31, 2013, net of tax
- - - - - - - - ( 54,185 ) 127,022 ( 1,582,946 ) ( 448,245 ) ( 1,958,354 )
Total comprehensive income for the year ended December 31, 2013
- - - - - - - - 13,782,063 127,022 ( 1,582,946 ) 6,289,130 18,615,269
Share-based payments 62,292 - 180,170 72,499 - ( 3,929 ) - - - - - 58 311,090Subsidiary cash dividends - - - - - - - - - - - ( 559,005 ) ( 559,005 )BALANCE AT DECEMBER 31, 2013 75,116,532 7,251,368 180,170 7,077,571 2,075,475 325,281 3,939,770 465,368 13,755,369 68,688 875,995 86,857,655 197,989,242Appropriation of 2013 earnings Legal reserve - - - - - - 1,375,537 - ( 1,375,537 ) - - - - Cash dividends on common stock - - - - - - - - ( 3,423,308 ) - - - ( 3,423,308 ) Cash dividends on preferred stock - - - - - - - - ( 969,516 ) - - - ( 969,516 ) Stock dividends 7,987,008 - - - - - - - ( 7,987,008 ) - - - -Net income for the year ended December 31, 2014 - - - - - - - - 1,624,376 - - 8,023,363 9,647,739Other comprehensive income for the year ended December 31, 2014, net of tax
- - - - - - - - ( 112,915 ) 82,220 ( 682,074 ) 387,099 ( 325,670 )
Total comprehensive income for the year ended December 31, 2014
- - - - - - - - 1,511,461 82,220 ( 682,074 ) 8,410,462 9,322,069
Lose control of subsidiary - - - - - - - - - - - ( 91,553,576 ) ( 91,553,576 )Issue of common shares for cash 5,000,000 - - 988,154 - - - - - - - - 5,988,154Share-based payments 314,362 - ( 68,831 ) 186,021 - ( 11,662 ) - - - - - 158 420,048Subsidiary cash dividends - - - - - - - - - - - ( 3,588,810 ) ( 3,588,810 )BALANCE AT DECEMBER 31, 2014 $ 88,417,902 $ 7,251,368 $ 111,339 $ 8,251,746 $ 2,075,475 $ 313,619 $ 5,315,307 $ 465,368 $ 1,511,461 $ 150,908 $ 193,921 $ 125,889 $ 114,184,303
The accompanying notes are an integral part of the consolidated financial statements.
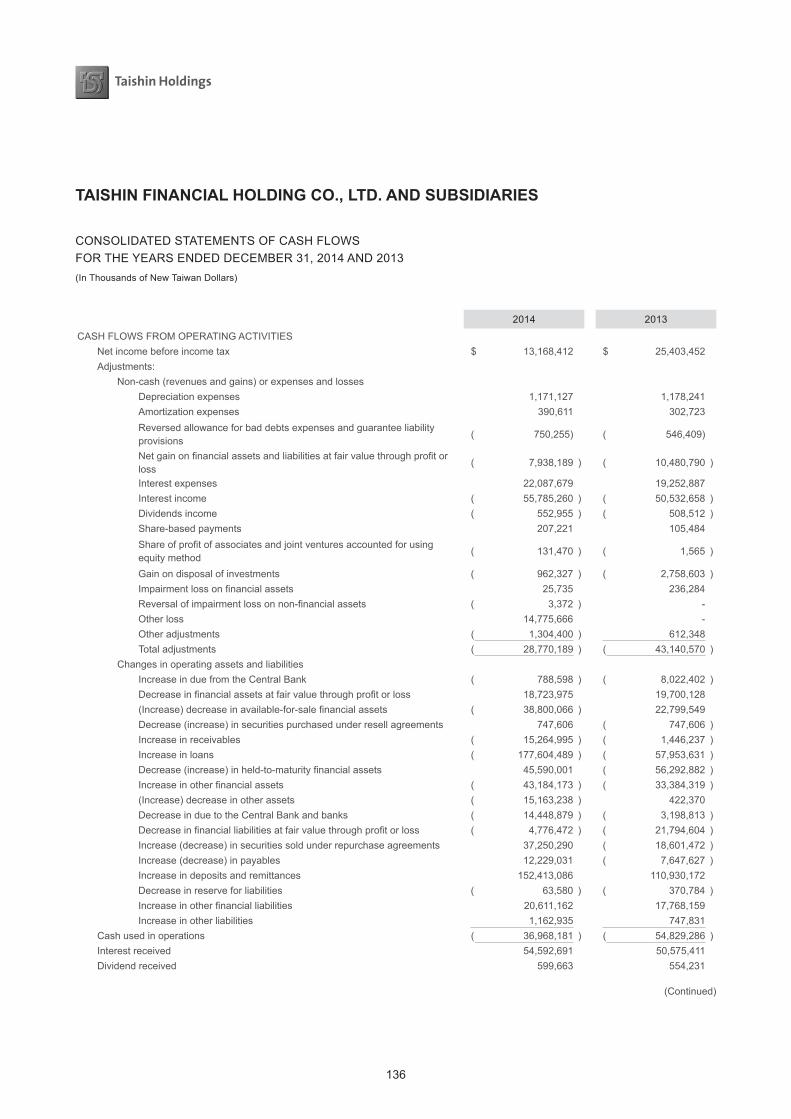
136
TAISHINFINANCIALHOLDINGCO.,LTD.ANDSUBSIDIARIES
CONSOLIDATED STATEMENTS OF CASH FLOWSFOR THE YEARS ENDED DECEMBER 31, 2014 AND 2013(In Thousands of New Taiwan Dollars)
2014 2013
CASH FLOWS FROM OPERATING ACTIVITIES Net income before income tax $ 13,168,412 $ 25,403,452 Adjustments: Non-cash (revenues and gains) or expenses and losses Depreciation expenses 1,171,127 1,178,241 Amortization expenses 390,611 302,723 Reversed allowance for bad debts expenses and guarantee liability provisions
( 750,255) ( 546,409)
Net gain on financial assets and liabilities at fair value through profit or loss
( 7,938,189 ) ( 10,480,790 )
Interest expenses 22,087,679 19,252,887 Interest income ( 55,785,260 ) ( 50,532,658 ) Dividends income ( 552,955 ) ( 508,512 ) Share-based payments 207,221 105,484 Share of profit of associates and joint ventures accounted for using equity method
( 131,470 ) ( 1,565 )
Gain on disposal of investments ( 962,327 ) ( 2,758,603 ) Impairment loss on financial assets 25,735 236,284 Reversal of impairment loss on non-financial assets ( 3,372 ) - Other loss 14,775,666 - Other adjustments ( 1,304,400 ) 612,348 Total adjustments ( 28,770,189 ) ( 43,140,570 ) Changes in operating assets and liabilities Increase in due from the Central Bank ( 788,598 ) ( 8,022,402 ) Decrease in financial assets at fair value through profit or loss 18,723,975 19,700,128 (Increase) decrease in available-for-sale financial assets ( 38,800,066 ) 22,799,549 Decrease (increase) in securities purchased under resell agreements 747,606 ( 747,606 ) Increase in receivables ( 15,264,995 ) ( 1,446,237 ) Increase in loans ( 177,604,489 ) ( 57,953,631 ) Decrease (increase) in held-to-maturity financial assets 45,590,001 ( 56,292,882 ) Increase in other financial assets ( 43,184,173 ) ( 33,384,319 ) (Increase) decrease in other assets ( 15,163,238 ) 422,370 Decrease in due to the Central Bank and banks ( 14,448,879 ) ( 3,198,813 ) Decrease in financial liabilities at fair value through profit or loss ( 4,776,472 ) ( 21,794,604 ) Increase (decrease) in securities sold under repurchase agreements 37,250,290 ( 18,601,472 ) Increase (decrease) in payables 12,229,031 ( 7,647,627 ) Increase in deposits and remittances 152,413,086 110,930,172 Decrease in reserve for liabilities ( 63,580 ) ( 370,784 ) Increase in other financial liabilities 20,611,162 17,768,159 Increase in other liabilities 1,162,935 747,831 Cash used in operations ( 36,968,181 ) ( 54,829,286 ) Interest received 54,592,691 50,575,411 Dividend received 599,663 554,231
(Continued)

137
06Financial Status2014 ANNUAL REPORT
Interest paid ( 20,376,775 ) ( 19,737,249 ) Income taxes refund 543,050 271,789 Income taxes paid ( 4,152,659 ) ( 1,260,020 ) Net cash flows used in operating activities ( 5,762,211 ) ( 24,425,124 )CASH FLOWS FROM INVESTING ACTIVITIES Capital reduction of financial assets carried at cost $ 39,439 $ 656,652 Acquisition of property and equipment ( 1,151,162 ) ( 953,057 ) Proceeds from disposal of property and equipment 1,432 6,731 Acquisition of intangible assets ( 720,408 ) ( 127,951 ) Cash received through merger 145,448 - Acquisition of investment property ( 133 ) ( 124,757 ) Proceeds from disposal of investment property 83,500 37,311 Other investing activities - effect on losing control of subsidiary, net ( 107,063,045 ) - Net cash used in investing activities ( 108,664,929 ) ( 505,071 )
CASH FLOWS FROM FINANCING ACTIVITIES Increase in due to the Central Bank and call loans from banks 21,435,703 26,966,053 Increase (decrease) in commercial papers payable 499,389 ( 7,000 ) Proceeds from issuance of bank debentures 18,000,000 4,879,000 Repayments of bank debentures ( 5,000,000 ) ( 11,700,000 ) Increase in other borrowings 3,898,166 1,707,319 Cash dividends distributed ( 4,392,824 ) ( 2,833,671 ) Issuance of common stock for cash 5,988,154 - Exercise of employee stock options 278,880 249,331 Cash dividends distributed from subsidiary ( 3,588,810 ) ( 559,005 ) Net cash flows generated from financing activities 37,118,658 18,702,027
EFFECT OF EXCHANGE RATE CHANGES ON CASH AND CASH EQUIVALENTS 318,491 351,249
NET INCREASE IN CASH AND CASH EQUIVALENTS ( 76,989,991 ) ( 5,876,919 )
CASH AND CASH EQUIVALENTS AT BEGINNING OF PERIOD 101,748,195 107,625,114
CASH AND CASH EQUIVALENTS AT END OF PERIOD $ 24,758,204 $ 101,748,195
Reconciliation of cash and cash equivalents:
2014 2013
Cash and cash equivalents in consolidated balance sheet $ 23,089,267 $ 61,516,953
Call loans to banks qualifying as cash and cash equivalents under the definition of IAS 7 permitted by the Financial Supervisory Commission
1,395,592 31,508,420
Securities purchased under resell agreements qualifying as cash and cash equivalents under the definition of IAS 7 permitted by the Financial Supervisory Commission
273,345 8,722,822
Cash and cash equivalents at end of period $ 24,758,204 $ 101,748,195
(Concluded)
The accompanying notes are an integral part of the consolidated financial statements.
138
TAISHINFINANCIALHOLDINGCO.,LTD.ANDSUBSIDIARIES
NOTES TO CONSOLIDATED FINANCIAL STATEMENTSFOR THE YEARS ENDED DECEMBER 31, 2014 AND 2013(In Thousands of New Taiwan Dollars, Unless Stated Otherwise)
1. GENERALINFORMATION
Taishin Financial Holding Co., Ltd. (“Taishin Financial Holding” or the “Company”) was established by Taishin International Bank Co., Ltd. (“Taishin Bank”) and Dah An Commercial Bank Co., Ltd. (“Dah An Bank”) pursuant to the ROC Financial Holding Company Act and related regulations through a share swap on February 18, 2002. Taishin Financial Holding’s main business activities are investing and managing its invested financial institutions.
Taishin Bank and Dah An Bank established Taishin Financial Holding through a share swap. In forming the holding company, Taishin Bank merged with Dah An Bank, with Taishin Bank as the survivor company. In addition, Taishin Securities Co., Ltd. (“Taishin Securities A”) and Taishin Bills Finance Co., Ltd. (“Taishin Bills Finance”) became wholly-owned subsidiaries of Taishin Financial Holding through a share swap effective on December 31, 2002.
In order to integrate corporate resources, Taishin Financial Holding sold all of the equity of Taishin Securities A as of December 19, 2009 and Taishin Bank merged with Taishin Bills Finance, and the base date of merger was January 22, 2011. Taishin Bank acquired total assets, liabilities and operations of Taishin Bills Finance.
In the fourth quarter of 2005, Taishin Financial Holding acquired 1,400,000 thousand shares of preferred stock - B issued by Chang Hwa Commercial Bank, Ltd. (“Chang Hwa Bank”) through private placements. The 22.55% ownership interest with voting rights allows Taishin Financial Holding to take over half of the seats in the Board of Directors of Chang Hwa Bank. Accordingly, Taishin Financial Holding had controlling power over Chang Hwa Bank. On October 3, 2008, this preferred stock - B had been converted into 1,400,000 thousand shares of common stock. Chang Hwa Bank held the election of its directors on December 8, 2014. Taishin Financial Holding obtained only two directors in the election. Therefore, Taishin Financial Holding did not account Chang Hwa Bank as its subsidiary in accordance with the Financial Holding Company Act. The ownership interest with voting rights in Chang Hwa Bank held by Taishin Financial Holding and subsidiaries was 22.81% as of December 31, 2014.
Taishin Financial Holding acquired 100% equity interest of Donshin Securities Co., Ltd. (“Donshin Securities”) by cash investments on April 6, 2010. Donshin Securities became a subsidiary of Taishin Financial Holding and changed the company name to Taishin Securities Co., Ltd. (“Taishin Securities B”).
Taishin Financial Holding acquired 100% equity interest of Taishin Securities Investment Trust Co., Ltd. (“Taishin Securities Investment Trust”) and 92% equity interest of Taishin Securities Investment Advisory Co., Ltd. (“Taishin Securities Investment Advisory”) by cash investments on July 26, 2010. Taishin Securities Investment Trust and Taishin Securities Investment Advisory became subsidiaries of Taishin Financial Holding.
Taishin Financial Holding acquired 100% equity interest of Franklin Insurance Brokers Co., Ltd. (“Franklin Insurance Brokers”) by cash investments on April 27, 2011. Franklin Insurance Brokers became a subsidiary of Taishin Financial Holding and changed the company name to Taishin Holdings Insurance Brokers Co., Ltd. (“Taishin Holdings Insurance Brokers”). Taishin Financial Holding invested in Taishin Holdings Insurance Brokers $29,500 thousand on April 29, 2011.
139
06Financial Status2014 ANNUAL REPORT
Taishin Bank started its business operations on March 23, 1992. Taishin Bank provides customers with (a) general commercial banking services - commercial lending, foreign exchange transactions, installment and term loans, wire transfers, marketable security investments, receivable factoring, offshore banking business, etc. as well as (b) various financial instruments - letters of credit, bankers’ acceptances, checking and savings accounts, credit cards, derivative instruments, etc.
Taishin Real-Estate Management Co., Ltd. (“Taishin Real-Estate”) was established in August 1995 and its operations include audits and consultations of construction plans, contract witness, and assessments and trades of real estate, etc.
Taishin Insurance Agency Co., Ltd. (“Taishin Insurance Agency”) was established in September 1996 and provides life insurance agent service. Taishin Insurance Agency owned 100% equity interest of Taishin Insurance Brokers Co., Ltd. (“Taishin Insurance Brokers”).
Taishin D.A. Finance was established in October 1997. Its operations include the lease, wholesale and retail sale of machinery, precision machinery, motor vehicle, aircraft, and vessel and its components.
Chang Hwa Bank was established on March 1, 1947 and got licensed by the Ministry of Economic Affairs in July 1950. It mainly engages in the following businesses: (a) all commercial banking operations allowed by the Banking Act; (b) trust operations; (c) international banking operations; (d) overseas branch operations authorized by the respective foreign governments; and (e) other operations as authorized by the central authority.
CHB Insurance Agency Co., Ltd. (“CHB Insurance Agency”) was established on October 3, 2001 to provide life insurance agent service.
CHB Insurance Brokerage Co., Ltd. (“CHB Insurance Brokerage”) was established on April 7, 2003 to provide property insurance broker service.
Taishin Securities B originally named Donshin Securities was incorporated on January 15, 1990 and its operations include services dealing with futures, securities underwriting, brokerage, margin lending and security transfer services.
Taishin Asset Management Co., Ltd. (“Taishin AMC”) was established on August 14, 2002 in accordance with the Company Law and other related laws. Taishin AMC’s operations include acquisition, evaluation, auction, and management of delinquent loans.
Taishin Marketing Consultant Co., Ltd. (“Taishin Marketing”) was established on November 20, 1998. Its operations include investment and enterprise consulting, agent services, acquisition of accounts receivable, real estates and leasing. Taishin Financial Holding had approved to dissolve its subsidiary Taishin Marketing in the board meeting on March 21, 2013 and Taishin Marketing had been liquidated in September 2013.
Taishin Venture Capital Co., Ltd. (“Taishin Venture Capital”) was approved to establish on December 25, 2002. Its operations include engagement in investment start-up.
Taishin Financial Leasing (China) Co., Ltd. (“Taishin Financial Leasing (China)”) was approved to establish on July 12, 2011 to provide financial leasing service.
Taishin Financial Leasing (Tianjin) Co., Ltd. (“Taishin Financial Leasing (Tianjin)”) was approved to establish on March 1, 2012 to provide financial leasing service.
140
Taishin Securities Investment Advisory was established in March 1989 and its operations include accepting a mandate from a customer and providing analytical opinions or recommendations on securities investment, acting as an agent for investment consultancy of offshore funds, issuing publications or holding lectures about securities investment and other relevant business permitted by the competent authority.
Taishin Securities Investment Trust, approved by the Securities and Future Bureau, was established on May 31, 2004. Its operations include offering securities investment trust funds and issuing beneficial interest certificates and investing in or trading securities, securities-related products, or other items approved by the competent authority. In addition, Taishin Securities Investment Trust was approved to operate full fiduciary discretionary investment business in 2005.
Taishin Holdings Insurance Brokers was originally named Franklin Insurance Brokers; its operations include property insurance broker service and life insurance broker service.
The consolidated financial statements are presented in the Company’s functional currency, New Taiwan dollars.
2. STATEMENTOFCOMPLIANCE
The consolidated financial statements were prepared in accordance with the Regulations Governing the Preparation of Financial Statements by Financial Holding Companies, Regulations Governing the Preparation of Financial Reports by Public Banks, Regulations Governing the Preparation of Financial Reports by Securities Firms, Regulations Governing the Preparation of Financial Reports by Securities Issuers, International Financial Reporting Standards, International Accounting Standards, and Interpretations permitted by the Financial Supervisory Commission (“FSC-recognized IFRSs”).
3. APPROVALOFFINANCIALSTATEMENTS
The consolidated financial statements were approved by the Board of Directors and authorized for issue on March 26, 2015.
4. APPLICATIONOFNEWANDREVISEDSTANDARDS,AMENDMENTSANDINTERPRETATIONS
a. The amendments to the Regulations Governing the Preparation of Financial Statements by Financial Holding Companies, Regulations Governing the Preparation of Financial Reports by Public Banks, Regulations Governing the Preparation of Financial Reports by Securities Firms, Regulations Governing the Preparation of Financial Reports by Securities Issuers and the 2013 version of FSC-recognized IFRSs in issue but not yet effective.
Rule No. 1030010325 and Rule No 1030006010 issued by the FSC, stipulated that Taishin Financial Holding and entities controlled by Taishin Financial Holding (the “Group”) should apply the 2013 version of FSC-recognized IFRSs and the Regulations Governing the Preparation of Financial Statements by Financial Holding Companies, Regulations Governing the Preparation of Financial Reports by Public Banks, Regulations Governing the Preparation of Financial Reports by Securities Firms, Regulations Governing the Preparation of Financial Reports by Securities Issuers starting January 1, 2015.
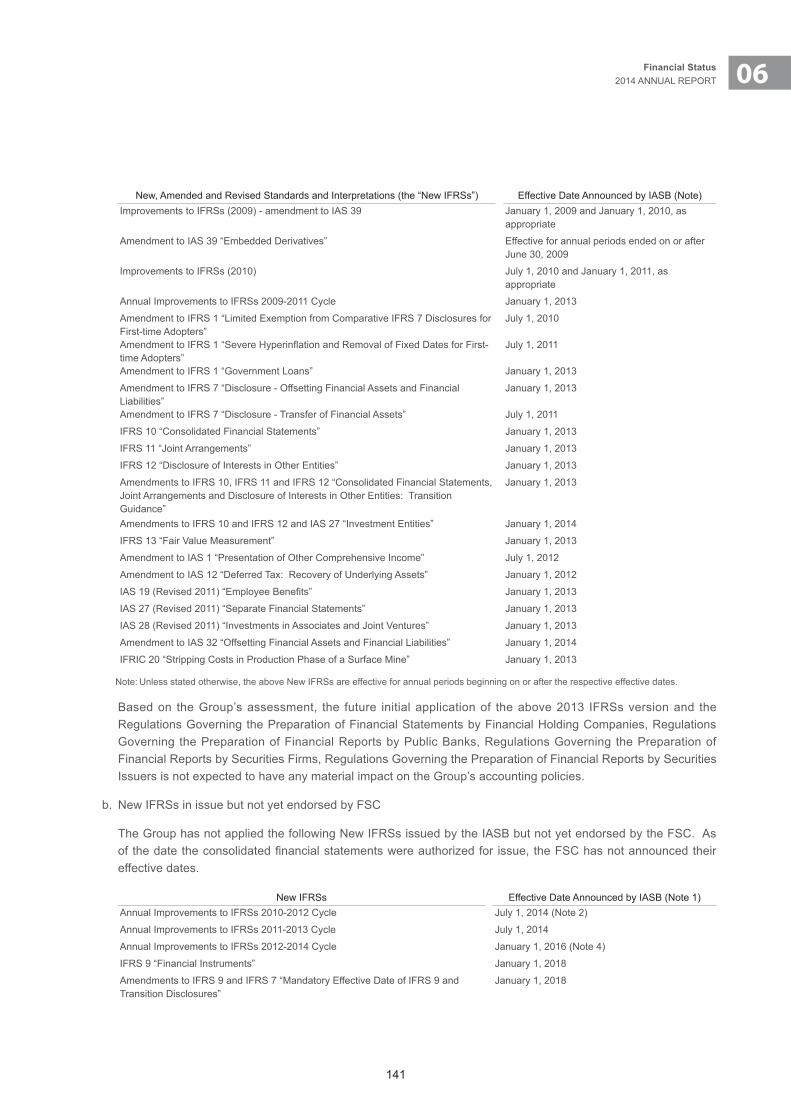
141
06Financial Status2014 ANNUAL REPORT
New, Amended and Revised Standards and Interpretations (the “New IFRSs”) Effective Date Announced by IASB (Note)Improvements to IFRSs (2009) - amendment to IAS 39 January 1, 2009 and January 1, 2010, as
appropriate
Amendment to IAS 39 “Embedded Derivatives” Effective for annual periods ended on or after June 30, 2009
Improvements to IFRSs (2010) July 1, 2010 and January 1, 2011, as appropriate
Annual Improvements to IFRSs 2009-2011 Cycle January 1, 2013
Amendment to IFRS 1 “Limited Exemption from Comparative IFRS 7 Disclosures for First-time Adopters”
July 1, 2010
Amendment to IFRS 1 “Severe Hyperinflation and Removal of Fixed Dates for First-time Adopters”
July 1, 2011
Amendment to IFRS 1 “Government Loans” January 1, 2013
Amendment to IFRS 7 “Disclosure - Offsetting Financial Assets and Financial Liabilities”
January 1, 2013
Amendment to IFRS 7 “Disclosure - Transfer of Financial Assets” July 1, 2011
IFRS 10 “Consolidated Financial Statements” January 1, 2013
IFRS 11 “Joint Arrangements” January 1, 2013
IFRS 12 “Disclosure of Interests in Other Entities” January 1, 2013
Amendments to IFRS 10, IFRS 11 and IFRS 12 “Consolidated Financial Statements, Joint Arrangements and Disclosure of Interests in Other Entities: Transition Guidance”
January 1, 2013
Amendments to IFRS 10 and IFRS 12 and IAS 27 “Investment Entities” January 1, 2014
IFRS 13 “Fair Value Measurement” January 1, 2013
Amendment to IAS 1 “Presentation of Other Comprehensive Income” July 1, 2012
Amendment to IAS 12 “Deferred Tax: Recovery of Underlying Assets” January 1, 2012
IAS 19 (Revised 2011) “Employee Benefits” January 1, 2013
IAS 27 (Revised 2011) “Separate Financial Statements” January 1, 2013
IAS 28 (Revised 2011) “Investments in Associates and Joint Ventures” January 1, 2013
Amendment to IAS 32 “Offsetting Financial Assets and Financial Liabilities” January 1, 2014
IFRIC 20 “Stripping Costs in Production Phase of a Surface Mine” January 1, 2013
Note: Unless stated otherwise, the above New IFRSs are effective for annual periods beginning on or after the respective effective dates.
Based on the Group’s assessment, the future initial application of the above 2013 IFRSs version and the Regulations Governing the Preparation of Financial Statements by Financial Holding Companies, Regulations Governing the Preparation of Financial Reports by Public Banks, Regulations Governing the Preparation of Financial Reports by Securities Firms, Regulations Governing the Preparation of Financial Reports by Securities Issuers is not expected to have any material impact on the Group’s accounting policies.
b. New IFRSs in issue but not yet endorsed by FSC
The Group has not applied the following New IFRSs issued by the IASB but not yet endorsed by the FSC. As of the date the consolidated financial statements were authorized for issue, the FSC has not announced their effective dates.
New IFRSs Effective Date Announced by IASB (Note 1)Annual Improvements to IFRSs 2010-2012 Cycle July 1, 2014 (Note 2)
Annual Improvements to IFRSs 2011-2013 Cycle July 1, 2014
Annual Improvements to IFRSs 2012-2014 Cycle January 1, 2016 (Note 4)
IFRS 9 “Financial Instruments” January 1, 2018
Amendments to IFRS 9 and IFRS 7 “Mandatory Effective Date of IFRS 9 and Transition Disclosures”
January 1, 2018
142
New IFRSs Effective Date Announced by IASB (Note 1)Amendments to IFRS 10 and IAS 28 “Sale or Contribution of Assets between an Investor and its Associate or Joint Venture”
January 1, 2016 (Note 3)
Amendments to IFRS 10, IFRS 12 and IAS 28 “Investment Entities: Applying the Consolidation Exception”
January 1, 2016
Amendments to IFRS 11 “Accounting for Acquisitions of Interests in Joint Operations”
January 1, 2016
IFRS 14 “Regulatory Deferral Accounts” January 1, 2016
IFRS 15 “Revenue from Contracts with Customers” January 1, 2017
Amendments to IAS 16 and IAS 38 “Clarification of Acceptable Methods of Depreciation and Amortization”
January 1, 2016
Amendments to IAS 16 and IAS 41 “Agriculture: Bearer Plants” January 1, 2016
Amendment to IAS 19 “Defined Benefit Plans: Employee Contributions” July 1, 2014
Amendment to IAS 27 “Equity Method in Separate Financial Statements” January 1, 2016
Amendment to IAS 36 “Impairment of Assets: Recoverable Amount Disclosures for Non-financial Assets”
January 1, 2014
Amendment to IAS 39 “Novation of Derivatives and Continuation of Hedge Accounting”
January 1, 2014
IFRIC 21 “Levies” January 1, 2014
Note 1: Unless stated otherwise, the above New IFRSs are effective for annual periods beginning on or after the respective effective dates.Note 2: The amendment to IFRS 2 applies to share-based payment transactions for which the grant date is on or after July 1, 2014; the
amendment to IFRS 3 applies to business combinations for which the acquisition date is on or after July 1, 2014; the amendment to IFRS 13 is effective immediately; the remaining amendments are effective for annual periods beginning on or after July 1, 2014.
Note 3: Prospectively applicable to transactions occurring in annual periods beginning on or after January 1, 2016.Note 4: The amendment to IFRS 5 is applied prospectively to changes in a method of disposal that occur in annual periods beginning on or after
January 1, 2016; the remaining amendments are effective for annual periods beginning on or after January 1, 2016.
Except for the following, the impending initial application of the above “New IFRSs”, whenever applied, would not have any material impact on the Group’s accounting policies:
IFRS 9 “Financial Instruments”
With regards to financial assets, all recognized financial assets that are within the scope of IAS 39 “Financial Instruments: Recognition and Measurement” are subsequently measured at amortized cost or fair value. Under IFRS 9, the requirement for the classification of financial assets is stated below.
For the Group’s debt instruments that have contractual cash flows that are solely payments of principal and interest on the principal amount outstanding, their classification and measurement are as follows:
1) For debt instruments, if they are held within a business model whose objective is to collect the contractual cash flows, the financial assets are measured at amortized cost and are assessed for impairment continuously with impairment loss recognized in profit or loss, if any. Interest revenue is recognized in profit or loss by using the effective interest method;
2) For debt instruments, if they are held within a business model whose objective is achieved by both the collecting of contractual cash flows and the selling of financial assets, the financial assets are measured at fair value through other comprehensive income (FVTOCI) and are assessed for impairment. Interest revenue is recognized in profit or loss by using the effective interest method, and other gain or loss shall be recognized in other comprehensive income, except for impairment gains or losses and foreign exchange gains and losses. When the debt instruments are derecognized or reclassified the cumulative gain or loss previously recognized in other comprehensive income is reclassified from equity to profit or loss.

143
06Financial Status2014 ANNUAL REPORT
Except for above, all other financial assets are measured at fair value through profit or loss. However, the Group may make an irrevocable election to present subsequent changes in the fair value of an equity investment (that is not held for trading) in other comprehensive income, with only dividend income generally recognized in profit or loss. No subsequent impairment assessment is required and the cumulative gain or loss previously recognized in other comprehensive income cannot be reclassified from equity to profit or loss.
IFRS 9 requires that impairment loss on financial assets is recognized by using the “Expected Credit Losses Model”. The credit loss allowance is required for financial assets measured at amortized cost, financial assets mandatorily measured at FVTOCI, lease receivables, contract assets arising from IFRS 15 “Revenue from Contracts with Customers”, certain written loan commitments and financial guarantee contracts. A loss allowance for the 12-month expected credit losses is required for a financial asset if its credit risk has not increased significantly since initial recognition. A loss allowance for full lifetime expected credit losses is required for a financial asset if its credit risk has increased significantly since initial recognition and is not low. However, a loss allowance for full lifetime expected credit losses is required for trade receivables that do not constitute a financing transaction.
For purchased or originated credit-impaired financial assets, the Group takes into account the expected credit losses on initial recognition in calculating the credit-adjusted effective interest rate. Subsequently, any changes in expected losses are recognized as a loss allowance with a corresponding gain or loss recognized in profit or loss.
As of the date the consolidated financial statements were authorized for issue, the Group is continuingly assessing the possible impact that the application of the above New IFRSs will have on the Group’s financial position and operating result, and will disclose the relevant impact when the assessment is complete.
5. SUMMARYOFSIGNIFICANTACCOUNTINGPOLICIES
BasisofPreparation
The consolidated financial statements have been prepared on the historical cost basis except for certain properties and financial instruments that are measured at revalued amounts or fair values, as explained in the accounting policies below. Historical cost is generally based on the fair value of the consideration given in exchange for assets.
The functional currency of Taishin Financial Holding is New Taiwan dollars. Thus, the consolidated financial statements are presented in New Taiwan dollars.
The Group categorized economic activities into operating, investing, and financing activities. The consolidated statements of cash flows reported the change of cash and cash equivalents in the current period based on operating, investing, and financing activities. Please refer to Note 7 for the components of cash and cash equivalents.
The cash flow of operating activities was reported by using indirect method. Under the indirect method, profit or loss is adjusted for the effects of transactions of a non-cash nature, any deferrals or accruals of past or future operating cash receipts or payments, and items of income or expense associated with investing or financing cash flows. Interest paid and interest and dividends received are classified as operating cash flows. Dividends paid are classified as financing cash flow because they are cost of obtaining financial resources.
When preparing the financial statements in accordance with the FSC-recognized IFRSs, the Group has to make certain significant accounting assumptions and estimates based on professional judgments to determine its accounting policies. Change in assumptions may result in significant effects on financial statements. The Group believes that the consolidated financial statements are reported based on appropriate assumptions. For items that required management’s most difficult or complex judgments, or assumptions and estimates that significantly affect the financial statements, please refer to Note 6.

144
ClassificationofCurrent/NoncurrentAssetsandLiabilities
Since the banking companies account for a substantial portion of the consolidated statements and because of banking business characteristics, classification of consolidated assets and liabilities according to the nature and the sequence of liquidity can provide more reliable and relevant information. Therefore, those assets and liabilities are not classified as current or noncurrent, but classified according to the nature and sequence of liquidity. In addition, maturity analysis of liabilities was disclosed in Note 47.
Basis of Consolidation
a. Principles for preparing consolidated financial statementsThe consolidated financial statements incorporate the financial statements of Taishin Financial Holding and the entities controlled by Taishin Financial Holding. Control is achieved when Taishin Financial Holding has the power to govern the financial and operating policies of an entity so as to obtain benefits from its activities.
Income and expenses of subsidiaries acquired or disposed of during the period are included in the consolidated statement of profit or loss and other comprehensive income from the effective date of acquisition and up to the effective date of disposal, as appropriate.
When necessary, adjustments are made to the financial statements of subsidiaries to bring their accounting policies into line with those used by Taishin Financial Holding.
All intra-group transactions, balances, income and expenses are eliminated in full upon consolidation.
Non-controlling interests are presented in the consolidated balance sheets within equity, separate from the equity of the owners of Taishin Financial Holding.
Attribution of total comprehensive income to non-controlling interests
Total comprehensive income of subsidiaries is attributed to the owners of Taishin Financial Holding and to the non-controlling interests even if this results in the non-controlling interests having a deficit balance.
Changes in the Group’s ownership interests in existing subsidiaries
Changes in the Group’s ownership interests in subsidiaries that do not result in the Group losing control over the subsidiaries are accounted for as equity transactions. The carrying amounts of the Group’s interests and the non-controlling interests should be adjusted to reflect the changes in their relative interests in the subsidiaries. Any difference between the amount by which the non-controlling interests are adjusted and the fair value of the consideration paid or received is recognized directly in equity and attributed to the owners of Taishin Financial Holding.
When the Group loses control of a subsidiary, a gain or loss is recognized in profit or loss and is calculated as the difference between (i) the aggregate of the fair value of the consideration received and any investment retained in the former subsidiary at its fair value at the date when control is lost and (ii) the assets (including any goodwill) and liabilities and any non-controlling interests of the former subsidiary at their carrying amounts at the date when control is lost. If the Group loses control of a subsidiary, the Group accounts for all amounts recognized in other comprehensive income in relation to that subsidiary on the same basis as would be required if the Group had directly disposed of the related assets or liabilities (i.e. reclassifies to profit or loss, or transfers directly to retained earnings if required in accordance with other IFRSs).
The fair value of any investment retained in the former subsidiary at the date when control is lost is regarded as the fair value on initial recognition for subsequent accounting under IAS 39 “Financial Instruments: Recognition and Measurement”.
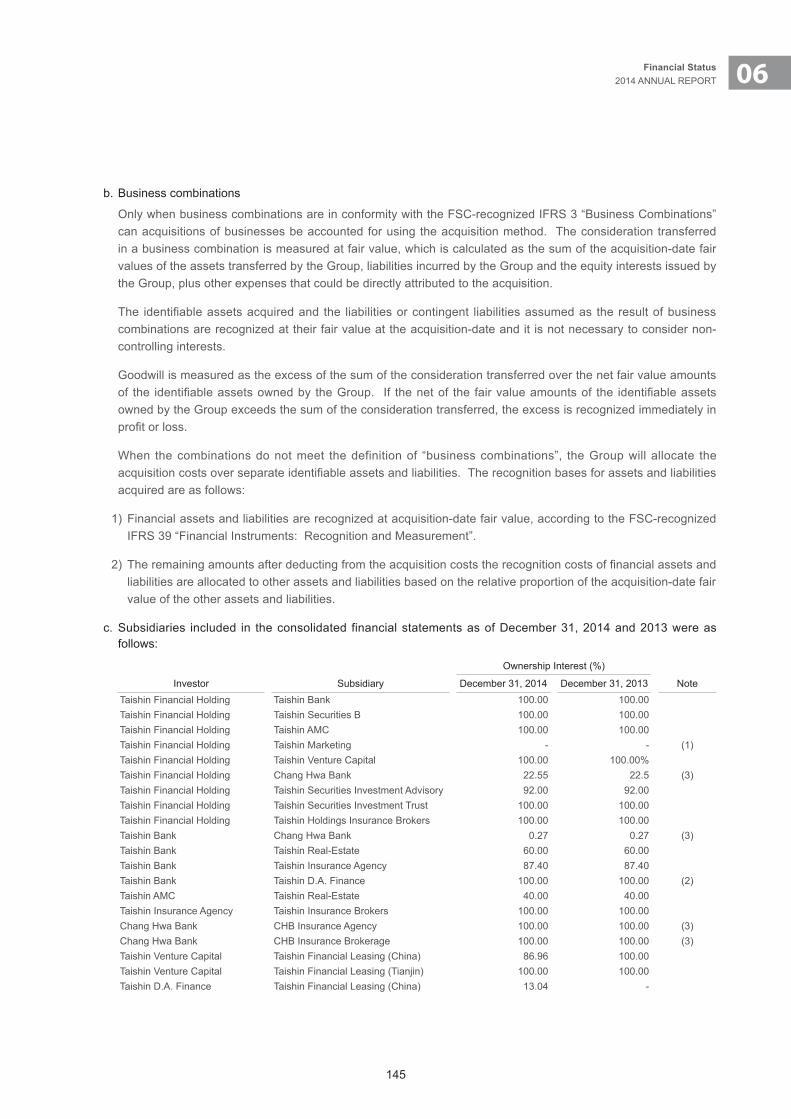
145
06Financial Status2014 ANNUAL REPORT
b. Business combinations
Only when business combinations are in conformity with the FSC-recognized IFRS 3 “Business Combinations” can acquisitions of businesses be accounted for using the acquisition method. The consideration transferred in a business combination is measured at fair value, which is calculated as the sum of the acquisition-date fair values of the assets transferred by the Group, liabilities incurred by the Group and the equity interests issued by the Group, plus other expenses that could be directly attributed to the acquisition.
The identifiable assets acquired and the liabilities or contingent liabilities assumed as the result of business combinations are recognized at their fair value at the acquisition-date and it is not necessary to consider non-controlling interests.
Goodwill is measured as the excess of the sum of the consideration transferred over the net fair value amounts of the identifiable assets owned by the Group. If the net of the fair value amounts of the identifiable assets owned by the Group exceeds the sum of the consideration transferred, the excess is recognized immediately in profit or loss.
When the combinations do not meet the definition of “business combinations”, the Group will allocate the acquisition costs over separate identifiable assets and liabilities. The recognition bases for assets and liabilities acquired are as follows:
1) Financial assets and liabilities are recognized at acquisition-date fair value, according to the FSC-recognized IFRS 39 “Financial Instruments: Recognition and Measurement”.
2) The remaining amounts after deducting from the acquisition costs the recognition costs of financial assets and liabilities are allocated to other assets and liabilities based on the relative proportion of the acquisition-date fair value of the other assets and liabilities.
c. Subsidiaries included in the consolidated financial statements as of December 31, 2014 and 2013 were as follows:
Ownership Interest (%)
Investor Subsidiary December 31, 2014 December 31, 2013 NoteTaishin Financial Holding Taishin Bank 100.00 100.00Taishin Financial Holding Taishin Securities B 100.00 100.00Taishin Financial Holding Taishin AMC 100.00 100.00Taishin Financial Holding Taishin Marketing - - (1)Taishin Financial Holding Taishin Venture Capital 100.00 100.00%Taishin Financial Holding Chang Hwa Bank 22.55 22.5 (3)Taishin Financial Holding Taishin Securities Investment Advisory 92.00 92.00Taishin Financial Holding Taishin Securities Investment Trust 100.00 100.00Taishin Financial Holding Taishin Holdings Insurance Brokers 100.00 100.00Taishin Bank Chang Hwa Bank 0.27 0.27 (3)Taishin Bank Taishin Real-Estate 60.00 60.00Taishin Bank Taishin Insurance Agency 87.40 87.40Taishin Bank Taishin D.A. Finance 100.00 100.00 (2)Taishin AMC Taishin Real-Estate 40.00 40.00Taishin Insurance Agency Taishin Insurance Brokers 100.00 100.00Chang Hwa Bank CHB Insurance Agency 100.00 100.00 (3)Chang Hwa Bank CHB Insurance Brokerage 100.00 100.00 (3)Taishin Venture Capital Taishin Financial Leasing (China) 86.96 100.00Taishin Venture Capital Taishin Financial Leasing (Tianjin) 100.00 100.00Taishin D.A. Finance Taishin Financial Leasing (China) 13.04 -

146
d. Subsidiaries not included in the consolidated financial statements as of December 31, 2014 and 2013 were as follows:
Ownership Interest (%)
Investor Subsidiary December 31, 2014 December 31, 2013 NoteTaishin Bank Taishin D.A. Finance 100.00 100.00 (2)Taishin Financial Holding Chang Hwa Bank 22.55 22.55 (3)Taishin Bank Chang Hwa Bank 0.27 0.27 (3)Chang Hwa Bank CHB Insurance Agency 100.00 100.00 (3)Chang Hwa Bank CHB Insurance Brokerage 100.00 100.00 (3)
Note:1) Taishin Financial Holding had approved to dissolve its subsidiary Taishin Marketing in the board meeting on March 21, 2013 and Taishin
Marketing had been liquidated in September 2013.2) Taishin D.A. Finance was an equity-method investee of Taishin Bank in 2013. Its capital was less than 0.24% of the consolidated capital, and
its total assets were less than 0.01% of the consolidated total assets on December 31, 2013; thus, it was not included in the consolidated financial statements.
3) Chang Hwa Bank held the election of its directors on December 8, 2014. Taishin Financial Holding lost control of Chang Hwa Bank since Taishin Financial Holding can not obtain more than half of Chang Hwa Bank’s directors. Therefore, Taishin Financial Holding did not consolidate Chang Hwa Bank as subsidiary since December 8, 2014.
Foreign Currencies
In preparing the financial statements of each individual group entity, the currency of the primary economic environment in which the entity operates (the “functional currency”) is used. Transactions in currencies other than the entity’s functional currency are recognized at the rates of exchange prevailing at the dates of the transactions. At the end of each reporting period, monetary items denominated in foreign currencies are retranslated at the rates prevailing at that date. When several exchange rates are available, the rate used is that at which the future cash flows, represented by the transaction amount or balance, could have been settled if those cash flows had occurred at the measurement date. Non-monetary items measured at fair value that are denominated in foreign currencies are retranslated at the rates prevailing at the date when the fair value was determined. Non-monetary items that are measured in terms of historical cost in a foreign currency are not retranslated.
Exchange differences arising from settlement are recognized in profit or loss in the period in which they arise. Exchange differences on monetary items arising from translation are recognized in profit or loss in the period in which they arise except items that qualify as hedging instruments in a cash flow hedge are recognized initially in other comprehensive income to the extent that the hedge is effective.
Exchange differences arising on the retranslation of non-monetary assets (such as equity investment) or liabilities measured at fair value are included in profit or loss for the period at the rates prevailing at the end of reporting period except for exchange differences arising on the retranslation of non-monetary items in respect of which gains and losses are recognized directly in other comprehensive income, in which case, the exchange differences are also recognized directly in other comprehensive income.
The results and financial position of an entity whose functional currency is not the currency of a hyperinflationary economy but different from the presentation currency are translated into the presentation currency using the following procedures:
a. Assets and liabilities are translated at the closing rate at the date of the consolidated balance sheets;
b. Income and expenses are translated at the average exchange rates for the period, unless exchange rates fluctuate significantly during that period, in which case the exchange rates at the dates of the transactions are used; and
c. All resulting exchange differences are recognized in other comprehensive income.

147
06Financial Status2014 ANNUAL REPORT
Exchange differences arising from the above procedures are recognized as “Exchange differences from translation of foreign operation” in equity. Exchange differences arising from net investments in foreign operation and hedge of a monetary item regarded as part of the net investments are recognized as other comprehensive income. When the foreign operation or part of the foreign operation is disposed of, exchange differences are recognized initially in other comprehensive income and reclassified from equity to profit or loss. Any goodwill arising on the acquisition of a foreign operation and any fair value adjustments to the carrying amounts of assets and liabilities arising on the acquisition of that foreign operation are treated as assets and liabilities of the foreign operation. Thus, they are expressed in the functional currency of the foreign operation and translated at the closing rate.
CashandCashEquivalents
Cash and cash equivalents are cash in vault, cash in banks, short-term time deposits and short-term financial instruments that must be readily convertible to a known amount of cash and subject to an insignificant risk of changes in value. For the consolidated statement of cash flows, cash and cash equivalents are cash and cash equivalents on the consolidated balance sheet, due from the Central Bank and call loans to banks and securities purchased under resell agreements that are in conformity with the definition of cash and cash equivalents in the FSC-recognized IFRS 7.
InvestmentinAssociates
An associate is an entity over which the Group has significant influence that is neither a subsidiary nor an interest in a joint venture. Significant influence is the power to participate in the financial and operating policy decisions of the investee without having control or joint control over those policies.
The results and assets and liabilities of associates are incorporated in these consolidated financial statements using the equity method of accounting. Under the equity method, an investment in an associate is initially recognized at cost and adjusted thereafter to recognize the Group’s share of the profit or loss and other comprehensive income of the associate. The Group also recognizes its share in the changes in the equity of associates.
When the Group subscribes for additional new shares of the associate, at a percentage different from its existing ownership percentage, the resulting carrying amount of the investment differs from the amount of the Group’s proportionate interest in the associate. The Group records such a difference as an adjustment to investments with the corresponding amount charged or credited to capital surplus. If the Group’s ownership interest is reduced due to the additional subscription of the new shares of associate, the proportionate amount of the gains or losses previously recognized in other comprehensive income in relation to that associate is reclassified to profit or loss on the same basis as would be required if the investee had directly disposed of the related assets or liabilities. When the adjustment should be debited to capital surplus, but the capital surplus recognized from investments accounted for by the equity method is insufficient, the shortage is debited to retained earnings.
When the Group’s share of losses of an associate equals or exceeds its interest in that associate (which includes any carrying amount of the investment accounted for by the equity method and long-term interests that, in substance, form part of the Group’s net investment in the associate), the Group discontinues recognizing its share of further losses. Additional losses and liabilities are recognized only to the extent that the Group has incurred legal obligations, or constructive obligations, or made payments on behalf of that associate.
Any excess of the cost of acquisition over the Group’s share of the net fair value of the identifiable assets and liabilities of an associate recognized at the date of acquisition is recognized as goodwill, which is included in the carrying amount of the investment and is not amortized. Any excess of the Group’s share of the net fair value of the identifiable assets and liabilities over the cost of acquisition, after reassessment, is recognized immediately in profit or loss.
148
The requirements of FSC-recognized IAS 36 “Impairment of Assets” are applied to determine whether it is necessary to recognize any impairment loss with respect to the Group’s investment in an associate. When necessary, the entire carrying amount of the investment (including goodwill) is tested for impairment as a single asset by comparing its recoverable amount (higher of value in use and fair value less costs to sell) with its carrying amount. Any impairment loss recognized is deducted from the carrying amount of the investment. Any reversal of that impairment loss is recognized in accordance with FSC-recognized IAS 36 “Impairment of Assets” to the extent that the recoverable amount of the investment subsequently increases.
The Group discontinues the use of the equity method from the date it ceases to have significant influence over the associate. Any retained investment is measured at fair value at that date and the fair value is regarded as its fair value on initial recognition as a financial asset. The difference between the previous carrying amount of the associate attributable to the retained interest and its fair value is included in the determination of the gain or loss on disposal of the associate. The Group accounts for all amounts previously recognized in other comprehensive income in relation to that associate on the same basis as would be required if that associate had directly disposed of the related assets or liabilities.
When a group entity transacts with its associate, profits and losses resulting from the transactions with the associate are recognized in the Group’ consolidated financial statements only to the extent of interests in the associate that are not related to the Group.
PropertyandEquipment
Property and equipment are stated at cost, less subsequent accumulated depreciation and subsequent accumulated impairment loss. Cost is capitalized when it is probable that future economic benefits associated with the item will flow to the Group and the cost of the item can be measured reliably.
Freehold land is not depreciated.
Depreciation is recognized so as to write off the cost of the assets less their residual values over their estimated useful lives, using the straight-line method. The estimated useful lives, residual values and depreciation method are reviewed at the end of each reporting period, with the effect of any changes in estimate accounted for on a prospective basis in accordance with FSC-recognized IAS 8 “Accounting Policies, Changes in Accounting Estimates and Errors”.
Assets held under finance leases are depreciated over the shorter of the lease term and their useful lives using the straight-line method.
An item of property and equipment is derecognized upon disposal or when no future economic benefits are expected to arise from the continued use of the asset. Any gain or loss arising on the disposal or retirement of an item of property and equipment is determined as the difference between the sales proceeds and the carrying amount of the asset and is recognized in profit or loss.
InvestmentProperties
Investment properties are properties held to earn rentals and/or for capital appreciation and are not owned by other corporations in the Group. Investment properties include office buildings or land held for operating lease.
The investment properties comprise a portion that is self-used by the Group and another portion that is held to earn rentals or for capital appreciation. If a portion of a property owned by the Group can be sold separately, the Group accounts for that portion separately. For self-used properties, the FSC-recognized IAS 16 is adopted. Investment
149
06Financial Status2014 ANNUAL REPORT
properties held to earn rentals or/and for capital appreciation are under the regulation of the FSC-recognized IAS 40. If portions of a property can not be sold separately, the property is investment property only if an insignificant portion is held as self-used asset.
Investment properties are measured initially at cost, including transaction costs. Subsequent to initial recognition, investment properties are measured at cost less accumulated depreciation and accumulated impairment loss.
Depreciation is recognized so as to write off the cost of assets less their residual values over their useful lives, using the straight-line method.
An investment property is derecognized upon disposal or when the investment property is permanently withdrawn from use and no future economic benefits are expected from the asset. Any gain or loss arising on derecognition of the property is calculated as the difference between the net disposal proceeds and the carrying amount of the asset and is included in profit or loss in the period in which the property is derecognized.
Goodwill
Goodwill arising on an acquisition of a business is carried at cost as established at the date of acquisition of the business less accumulated impairment loss.
For the purpose of impairment testing, goodwill is allocated to each of the Group’s cash-generating units (or groups of cash-generating units) that is expected to benefit from the synergies of the combination.
A cash-generating unit to which goodwill has been allocated is tested for impairment annually, or more frequently when there is an indication that the unit may be impaired. If the recoverable amount of the cash-generating unit is less than its carrying amount, the impairment loss is allocated first to reduce the carrying amount of any goodwill allocated to the unit and then to the other assets of the unit pro rata based on the carrying amount of each asset in the unit. Any impairment loss for goodwill is recognized directly in profit or loss. An impairment loss recognized for goodwill is not reversed in subsequent periods.
If goodwill has been allocated to a cash-generating unit and the entity disposes of an operation within that unit, the goodwill associated with the operation disposed of is included in the carrying amount of the operation when determining the gain or loss on disposal, and is measured on the basis of the relative values of the operation disposed of and the portion of the cash-generating unit retained.
Intangible Assets
a. Intangible assets acquired separatelyIntangible assets with finite useful lives that are acquired separately are initially measured at cost and subsequently measured at cost less accumulated amortization and accumulated impairment loss. Amortization is recognized on a straight-line basis over their estimated useful lives. The estimated useful life, residual value, and amortization method are reviewed at the end of each reporting period, with the effect of any changes in estimate being accounted for on a prospective basis which is in accordance with FSC-recognized IAS 8 “Accounting Policies, Changes in Accounting Estimates and Errors”. The residual value of an intangible asset with a finite useful life shall be assumed to be zero unless the Group expects to dispose of the intangible asset before the end of its economic life.
b. Intangible assets acquired in a business combinationIntangible assets acquired in a business combination and recognized separately from goodwill are initially recognized at their fair value at the acquisition date (which is regarded as their cost). Subsequent to initial
150
recognition, intangible assets acquired in a business combination are reported at cost less accumulated amortization and accumulated impairment loss.
c. Derecognition of intangible assetsAn intangible asset is derecognized on disposal, or when no future economic benefits are expected from use or disposal. Gain or loss on the derecognition of an intangible asset, measured as the difference between the net disposal proceeds and the carrying amount of the asset, is recognized in profit or loss.
ImpairmentofNon-financialAssets(ExceptGoodwill)
At the end of each reporting period, the Group reviews the carrying amounts of its non-financial assets, excluding goodwill, to determine whether there is any indication that those assets have suffered an impairment loss. If any such indication exists, the recoverable amount of the asset is estimated in order to determine the extent of the impairment loss. When it is not possible to estimate the recoverable amount of an individual asset, the Group estimates the recoverable amount of the cash-generating unit to which the asset belongs. When a reasonable and consistent basis of allocation can be identified, corporate assets are also allocated to the individual cash-generating units; otherwise they are allocated to the smallest group of cash-generating units for which a reasonable and consistent allocation basis can be identified.
Intangible assets with indefinite useful lives and intangible assets not yet available for use are tested for impairment at least annually, and whenever there is an indication that the asset may be impaired.
Recoverable amount is the higher of fair value less costs to sell and value in use.
If the recoverable amount of an asset or cash-generating unit is estimated to be less than its carrying amount, the carrying amount of the asset or cash-generating unit is reduced to its recoverable amount.
When an impairment loss subsequently is reversed, the carrying amount of the asset or cash-generating unit is increased to the revised estimate of its recoverable amount, but only to the extent of the carrying amount that would have been determined had no impairment loss been recognized for the asset or cash-generating unit in prior years. A reversal of an impairment loss is recognized immediately in profit or loss.
BondsandSecuritiesPurchased/SoldunderSpecificAgreements
Bonds and securities purchased under resell agreements are recorded at purchase price and are accounted for as financing transactions. Bonds and securities sold under repurchase agreements are recorded at sale price. Interest revenue and expenses recognized from the transactions mentioned above are recorded on accrual basis.
Financial Instruments
Financial assets and financial liabilities are recognized when a group entity becomes a party to the contractual provisions of the instruments.
Financial assets and financial liabilities are initially measured at fair value. Transaction costs that are directly attributable to the acquisition or issue of financial assets and financial liabilities (other than financial assets and financial liabilities at fair value through profit or loss) are added to or deducted from the fair value of the financial assets or financial liabilities, as appropriate, on initial recognition. Transaction costs directly attributable to the acquisition of financial assets or financial liabilities at fair value through profit or loss are recognized immediately in profit or loss.
151
06Financial Status2014 ANNUAL REPORT
Financial assets
All regular way purchases or sales of financial assets are recognized and derecognized on a trade date basis. Regular way purchases or sales are purchases or sales of financial assets that require delivery of assets within the time frame established by regulation or convention in the marketplace.
a. Measurement categoryFinancial assets are classified into the following specified categories: Financial assets at fair value through profit or loss, held-to-maturity investments, available-for-sale financial assets and loans and receivables. The classification depends on the nature and purpose of the financial assets and is determined at the time of initial recognition. The categories of financial assets held by the Group are financial assets at fair value through profit or loss, held-to-maturity investment, available-for-sale financial assets and loans and receivables.
1) Financial assets at fair value through profit or loss Financial assets are classified as at fair value through profit or loss when the financial asset is either held for
trading or it is designated as at fair value through profit or loss. A financial asset is classified as held for trading if:
a) It has been acquired principally for the purpose of selling it in the near term; orb) On initial recognition it is part of a portfolio of identified financial instruments that a company manages
together and has a recent actual pattern of short-term profit-taking; orc) It is a derivative that is not designated and effective as a hedging instrument.
A financial asset other than a financial asset held for trading may be designated as at fair value through profit or loss upon initial recognition when doing so results in more relevant information and if:a) Such designation eliminates or significantly reduces a measurement or recognition inconsistency that
would otherwise arise; orb) The financial asset forms part of a group of financial assets or financial liabilities or both, which is
managed and its performance is evaluated on a fair value basis, in accordance with the company’s documented risk management or investment strategy, and information about the grouping is provided internally on that basis.
In addition, if a contract contains one or more embedded derivatives, the entire combined contract (asset or liability) can be designated as at fair value through profit or loss.
Financial assets at fair value through profit or loss are stated at fair value, with any gains or losses arising on remeasurement recognized in profit or loss. The net gain or loss recognized in profit or loss incorporates any dividend or interest earned on the financial asset and is included in the other gains and losses line item. Fair value is determined in the manner described in Note 47.
2) Held-to-maturity investments Held-to-maturity investments are non-derivative financial assets with fixed or determinable payments and
fixed maturity dates that the Group has the positive intent and ability to hold to maturity other than those that the entity upon initial recognition designates as at fair value through profit or loss, or designates as available for sale, or meet the definition of loans and receivables.
Subsequent to initial recognition, held-to-maturity investments are measured at amortized cost using the effective interest method less any impairment.
3) Available-for-sale financial assets Available-for-sale financial assets are non-derivatives that are either designated as available-for-sale or are
not classified as loans and receivables, held-to-maturity investments or financial assets at fair value through profit or loss.
Fair value is determined in the manner described in Note 47. Changes in the carrying amount of available-for-sale monetary financial assets relating to changes in foreign
currency exchange rates, interest income calculated using the effective interest method and dividends on
152
available-for-sale equity investments are recognized in profit or loss. Other changes in the carrying amount of available-for-sale financial assets are recognized in other comprehensive income and accumulated under the heading of investments revaluation reserve. When the investment is disposed of or is determined to be impaired, the cumulative gain or loss that was previously accumulated in the investments revaluation reserve is reclassified to profit or loss.
Dividends on available-for-sale equity instruments are recognized in profit or loss when the company’s right to receive the dividends is established.
Available-for-sale equity investments that do not have a quoted market price in an active market and whose fair value cannot be reliably measured are measured at cost less any identified impairment loss at the end of each reporting period and are recognized in a separate line item as financial assets carried at cost. If, in a subsequent period, the fair value of the financial assets can be reliably measured, the financial assets are remeasured at fair value. The difference between carrying amount and fair value is recognized in other comprehensive income on financial assets.
4) Loans and receivables Loans and receivables are non-derivative financial assets with fixed or determinable payments that are not
quoted in an active market. Loans and receivables (including receivables, loans, delinquent loans and debt investments with no active market) are measured at amortized cost using the effective interest method, less any impairment. In accordance with the “Regulations Governing the Preparation of Financial Reports by Public Banks” Rule No. 10 Item 7 and Item 10, if the effect of discount is insignificant, loans and receivables can be measured at their original amounts.
According to the Regulations Governing the Procedures for Banking Institutions to Evaluate Assets and Deal with Non-performing/Non-accrual Loans, loans or other extensions of credit which are overdue but not repaid, and have been authorized by the board, shall be transferred to the non-accrual loans item together with interest accrued.
The non-accrual loans transferred from loans are reported under loan whereas those not transferred from loans are reported under other miscellaneous financial assets.
b. Impairment of financial assetsFinancial assets, other than those at fair value through profit or loss, are assessed for indicators of impairment at the end of each reporting period. Financial assets are considered to be impaired when there is objective evidence that, as a result of one or more events that occurred after the initial recognition of the financial asset, the estimated future cash flows of the investment have been affected.Objective evidence that a financial asset or group of assets is impaired includes observable data that comes to the attention of the holder of the asset about the following loss events:1) Significant financial difficulty of the issuer or obligor;2) A breach of contract, such as a default or delinquency in interest or principal payments;3) The lender, for economic or legal reasons relating to the borrower’s financial difficulty, granting to the
borrower a concession that the lender would not otherwise consider;4) It becoming probable that the borrower will enter bankruptcy or other financial reorganization;5) The disappearance of an active market for that financial asset because of financial difficulties; or6) Observable data indicating that there is a measurable decrease in the estimated future cash flows from a
group of financial assets since the initial recognition of those assets, although the decrease cannot yet be identified with the individual financial assets in the group, including:a) Adverse changes in the payment status of borrowers in the group; orb) National or local economic conditions that correlate with defaults on the assets in the group.
For certain categories of financial assets, such as loans and receivables, assets are assessed for impairment on a collective basis even if they were assessed as not impaired individually.
153
06Financial Status2014 ANNUAL REPORT
If there is objective evidence that an impairment loss on financial assets carried at amortized cost has been incurred, the amount of the loss is measured as the difference between the asset’s carrying amount and the present value of estimated future cash flows discounted at the financial asset’s original effective interest rate.The assessment procedures above classified loans in accordance with the Regulations Governing the Procedures for Banking Institutions to Evaluate Assets and Deal with Non-performing/Non-accrual Loans. Normal credit assets are classified as “Category One” and provided allowance for loss at 1% of the outstanding balance (excluding assets that represent claims against an ROC government agency). Loans other than “Category One” are classified into “special mentioned (Category Two)”, “substandard (Category Three)”, “doubtful (Category Four)” and “losses (Category Five)” based on the status of credit, the length of time overdue, and the status of the loan collaterals. Loss provision should be made at 2%, 10%, 50% and 100% for each loan category, respectively.For financial assets measured at amortized cost, if, in a subsequent period, the amount of the impairment loss decreases and the decrease can be related objectively to an event occurring after the impairment was recognized, the previously recognized impairment loss is reversed through profit or loss to the extent that the carrying amount of the investment at the date the impairment is reversed does not exceed what the amortized cost would have been had the impairment not been recognized.The carrying amount of accounts receivable is reduced through the use of an allowance account. When accounts receivable are considered uncollectible, they are written off against the allowance account. Recoveries of amounts previously written off are credited to the allowance account. Changes in the carrying amount of the allowance account are recognized as bad debt in profit or loss.For available-for-sale equity investments, a significant or prolonged decline in the fair value of the security below its cost is considered to be objective evidence of impairment.When an available-for-sale financial asset is considered to be impaired, cumulative gains or losses previously recognized in other comprehensive income are reclassified to profit or loss in the period.In respect of available-for-sale equity securities, impairment loss previously recognized in profit or loss are not reversed through profit or loss. Any increase in fair value subsequent to an impairment loss is recognized in other comprehensive income and accumulated under the heading of investments revaluation reserve. In respect of available-for-sale debt securities, impairment loss are subsequently reversed through profit or loss if an increase in the fair value of the investment can be objectively related to an event occurring after the recognition of the impairment loss.For financial assets carried at cost, the amount of impairment loss is measured as the difference between the asset’s carrying amount and the present value of the estimated future cash flows discounted at the current market rate of return for a similar financial asset. Such impairment loss will not be reversed in subsequent periods.
c. Derecognition of financial assets
The Group derecognizes a financial asset only when the contractual rights to the cash flows from the asset expire, or when it transfers the financial asset and substantially all the risks and rewards of ownership of the asset to another party.
On derecognition of a financial asset in its entirety, the difference between the asset’s carrying amount and the sum of the consideration received and receivable and the cumulative gain or loss that had been recognized in other comprehensive income and accumulated in equity is recognized in profit or loss.
Equity instruments
Debt and equity instruments issued by a group entity are classified as either financial liabilities or as equity in accordance with the substance of the contractual arrangements and the definitions of a financial liability and an equity instrument.

154
An equity instrument is any contract that evidences a residual interest in the assets of an entity after deducting all of its liabilities. Equity instruments issued by a group entity are recognized at the proceeds received, net of direct issue costs.
Repurchase of the Group’s own equity instruments is recognized and deducted directly in equity. No gain or loss is recognized in profit or loss on the purchase, sale, issue or cancellation of the Group’s own equity instruments.
Financial liabilities
a. Subsequent measurement
Except the following situation, all the financial liabilities are measured at amortized cost using the effective interest method.
1) Financial liabilities at fair value through profit or loss Financial liabilities are classified as at fair value through profit or loss when the financial liability is either held
for trading or it is designated as at fair value through profit or loss. A financial liability is classified as held for trading if:a) It has been acquired principally for the purpose of repurchasing it in the near term; orb) On initial recognition it is part of a portfolio of identified financial instruments that the Group manages
together and has a recent actual pattern of short-term profit-taking; orc) It is a derivative that is not designated and effective as a hedging instrument.
A financial liability other than a financial liability held for trading may be designated as at fair value through profit or loss upon initial recognition when doing so results in more relevant information and if:a) Such designation eliminates or significantly reduces a measurement or recognition inconsistency that
would otherwise arise; orb) The financial liability forms part of a group of financial assets or financial liabilities or both, which is
managed and its performance is evaluated on a fair value basis, in accordance with the company’s documented risk management or investment strategy, and information about the grouping is provided internally on that basis.
In addition, if a contract contains one or more embedded derivatives, the entire combined contract (asset or liability) can be designated as at fair value through profit or loss.
Financial liabilities at fair value through profit or loss are stated at fair value, with any gains or losses arising on remeasurement recognized in profit or loss. The net gain or loss recognized in profit or loss incorporates any interest paid on the financial liability and is included in the other gains and losses line item. Fair value is determined in the manner described in Note 47.
2) Financial guarantee contracts A financial guarantee contract is a contract that requires the issuer to make specified payments to reimburse
the holder for a loss it incurs because a specified debtor fails to make payments when due in accordance with the terms of a debt instrument.
Financial guarantee contracts issued by the Group are initially measured at their fair values and, if not designated as at fair value through profit or loss, are subsequently measured at the higher of the following and should be coped with based on the Regulations Governing the Procedures for Banking Institutions to Evaluate Assets and Deal with Non-performing/Non-accrual Loans:a) The amount of the obligation under the contract, as determined in accordance with FSC-recognized IAS
37 “Provisions, Contingent Liabilities and Contingent Assets”; andb) The amount initially recognized less, where appropriate, cumulative amortization recognized in
accordance with FSC-recognized IAS 18 the revenue recognition policies.
155
06Financial Status2014 ANNUAL REPORT
3) Commitments to provide a loan at a below-market interest rate Commitments to provide a loan at a below-market interest rate issued by the Group are initially measured at
their fair values and, if not designated as at fair value through profit or loss, are subsequently measured at the higher of:a) The amount of the obligation under the contract, as determined in accordance with FSC-recognized IAS
37 “Provisions, Contingent Liabilities and Contingent Assets”; andb) The amount initially recognized less, where appropriate, cumulative amortization recognized in
accordance with FSC-recognized IAS 18 the revenue recognition policies.
b. Derecognition of financial liabilities
The Group derecognizes financial liabilities when, and only when, the Group’s obligations are discharged, cancelled or they expire. The difference between the carrying amount of the financial liability derecognized and the consideration paid and payable is recognized in profit or loss.
Derivative financial instruments
Derivatives are initially recognized at fair value at the date the derivative contracts are entered into and are subsequently remeasured to their fair value at the end of each reporting period. The resulting gain or loss is recognized in profit or loss immediately unless the derivative is designated and effective as a hedging instrument, in which event the timing of the recognition in profit or loss depends on the nature of the hedge relationship. When the fair value of derivative financial instruments is positive, the derivative is recognized as a financial asset; when the fair value of derivative financial instruments is negative, the derivative is recognized as a financial liability.
Derivatives embedded in non-derivative host contracts are recognized as host contracts and embedded derivative instruments, respectively, when they meet the definition of a derivative, their risks and characteristics are not closely related to those of the host contracts and the contracts are not measured at fair value through profit or loss, unless the hybrid contracts are designated as assets or liabilities at fair value through profit or loss.
SecuritiesTradingMarginPurchaseandShortSale
Margin loans extended to customer by the Group conducting securities trading margin purchase and short sale business are recognized as securities margin loans receivable. Customers provide all the stocks purchased in trading margin operations as collaterals, which the Group records by using memorandum entries. Stocks are returned when customers pay back money.
Margins received from short selling customers by the Group conducting securities trading margin purchase and short sale business are recognized as short sale margins. In addition, short sale proceeds (less securities transaction taxes, handling fees for execution of customer orders and short sale handling fees) received as collateral from short selling customers by the Group conducting securities trading margin purchase and short sale business are recognized as payable for short sale collateral received.
The interest on the payable for short sale collateral received and short sale margins under the preceding paragraph is accrued and paid to customers. The stocks lent to customers are recorded by using memorandum entries. Short sale margins and payable for short sale collateral received are reimbursed when customers return stocks.
Hedge Accounting
The Group designates certain hedging instruments, which include derivatives, embedded derivatives and non-derivatives in respect of foreign currency risk, as either fair value hedges. Hedges of foreign exchange risk on firm commitments are accounted for as fair value hedges.
156
At the inception of the hedge relationship, the entity documents the relationship between the hedging instrument and the hedged item, along with its risk management objectives and its strategy for undertaking various hedge transactions. Furthermore, at the inception of the hedge and on an ongoing basis, the Group documents whether the hedging instrument is highly effective in offsetting the exposure of changes in fair values or cash flows of the hedged item attributable to the hedged risk. Note 11 sets out details of the fair values of the derivative instruments used for hedging purposes.
Changes in the fair value of derivatives that are designated and qualify as fair value hedges are recognized in profit or loss immediately, together with any changes in the fair value of the hedged asset or liability that are attributable to the hedged risk. The change in the fair value of the hedging instrument and the change in the hedged item attributable to the hedged risk are recognized in profit or loss in the line item relating to the hedged item.
Hedge accounting is discontinued prospectively when the Group revokes the designated hedging relationship, or when the hedging instrument expires or is sold, terminated, or exercised, or when it no longer meets the criteria for hedge accounting. The fair value adjustment to the carrying amount of the hedged instrument arising from the hedged risk for which the effective interest method is used is amortized to profit or loss from the date the hedge accounting is discontinued. The adjustment is amortized based on the effective interest rate recalculated at the date the amortization begins and is amortized fully by maturity of the financial instrument.
Provisions,ContingentLiabilitiesandContingentAssets
A provision shall be recognized when:
a. An entity has a present obligation (legal or constructive) as a result of a past event;
b. It is probable that an outflow of resources embodying economic benefits will be required to settle the obligation; and
c. A reliable estimate can be made of the amount of the obligation.
The Group does not recognize provisions for future operating losses. Where there are a number of similar obligations, the probability that an outflow will be required in settlement is determined by considering the class of obligations as a whole. Although the likelihood of outflow for any one item may be small, it may well be probable that some outflow of resources will be needed to settle the class of obligations as a whole. If that is the case, a provision is recognized.
Provisions are subsequently measured by the present value of the expected expenditures to settle the obligations. Discount rate is the pre-tax discount rate and is adjusted in time to reflect current market assessments of the time value of money and the risks specific to the liability.
A contingent liability is:
a. A possible obligation that arises from past events and whose existence will be confirmed only by the occurrence or non-occurrence of one or more uncertain future events not wholly within the control of the entity; or
b. A present obligation that arises from past events but is not recognized because:
1) It is not probable that an outflow of resources embodying economic benefits will be required to settle the obligation; or
2) The amount of the obligation cannot be measured with sufficient reliability.
157
06Financial Status2014 ANNUAL REPORT
The Group does not recognize a contingent liability but disclose it appropriately in accordance with related guidelines.
A contingent asset is a possible asset that arises from past events and whose existence will be confirmed only by the occurrence or non-occurrence of one or more uncertain future events not wholly within the control of the entity. The Group does not recognize a contingent asset. A contingent asset is disclosed appropriately in accordance with related guidelines, where an inflow of economic benefits is probable.
Income Recognition
a. Interest incomeExcept for financial assets at FVTPL, interest income of all financial instruments is accrued on a time basis, by reference to the principal outstanding and at the effective interest rate applicable, and recognized in the consolidated statements of comprehensive income. When the loans become past due and are considered uncollectible, the principal and interest receivable are transferred to delinquent loan accounts and the accrual of interest income is stopped. Interest income will be recognized when the delinquent interest is collected. If the repayment of loan is extended under an agreement, the related interest should be recognized as deferred revenue and recognized as income when collected. Interest income from securities trading margin purchase and short sale is accrued according to the terms stated in the financing and trading contract.
b. Service fee and commissions income
Service revenue and real estate management service revenue are recognized at once after providing loans or other services. If the service revenue belongs to several significant items, it is recognized when the significant items accomplished, such as the service revenue which the lead arranger bank of syndication loan received. If the service revenue is for further loan service and of significant amount, it is allocated during the period of the service or included in the base of calculation the effective interest rate of loans and receivables.
The Group’s customer loyalty program provides customers with award credits, which are handled through diverse factors of revenue transactions. The fair value of the consideration received or receivable in respect of the initial sale shall be allocated between the award credits and the other components of the sale. The consideration allocated to the award credits shall be measured by reference to their fair value, i.e. the amount for which the award credits could be sold separately. The consideration is not recognized as income in the initial sale and is deferred. The Group shall recognize the consideration allocated to award credits as income when award credits are redeemed and it fulfills its obligations to supply awards.
Brokerage commission is recognized on the trading day. Purchasing commission is recognized when the commission is received; underwriting commission is recognized at the completion of the underwriting contracts. The Group engages in futures introducing broker business and receives commission from its mandating futures commission merchants. The commission received is recognized as futures commission income in the consolidated statements of comprehensive income.
Leasing
Leases are classified as finance leases whenever the terms of the lease transfer substantially all the risks and rewards of ownership to the lessee. All other leases are classified as operating leases.
a. The Group as lessorRental income from operating leases is recognized on a straight-line basis over the term of the relevant lease. Contingent rents arising under operating leases are recognized as income in the period in which they are realized.
158
Lease incentives included in the operating lease are recognized as an asset. The aggregate cost of incentives is recognized as a reduction of rental income on a straight-line basis over the lease term unless another systematic basis is more representative of the time pattern over which the benefit of the leased asset is diminished.
b. The Group as lessee
Assets held under finance leases are initially recognized as assets of the Group at their fair value at the inception of the lease or, if lower, at the present value of the minimum lease payments. The corresponding liability to the lessor is included in the consolidated balance sheets as a finance lease obligation.
Minimum lease payments are apportioned between finance expenses and reduction of the lease obligation so as to achieve a constant rate of interest on the remaining balance of the liability. Finance expenses are recognized immediately in profit or loss, unless they are directly attributable to qualifying assets, in which case they are capitalized in accordance with the Group’s general policy on borrowing costs. Contingent rents are recognized as expenses in the periods in which they are incurred.
Operating lease payments are recognized as an expense on a straight-line basis over the lease term. Contingent rents arising under operating leases are recognized as an expense in the period in which they are incurred.
c. Leasehold land for own useWhen a lease includes both land and building elements, the Group assesses the classification of each element as a finance lease or an operating lease separately based on the assessment as to whether substantially all the risks and rewards incidental to ownership of each element have been transferred to the Group. Specifically, the minimum lease payments are allocated between the land and the building elements in proportion to the relative fair values of the leasehold interests in the land element and building element of the lease at the inception of the lease.
EmployeeBenefits
a. Retirement benefit costsPayments to defined contribution retirement benefit plans are recognized as an expense when employees have rendered service entitling them to the contributions.
For defined benefit retirement benefit plans, the cost of providing benefits is determined using the Projected Unit Credit Method, with actuarial valuations being carried out at the end of each reporting period. Actuarial gains and losses on the defined benefit obligation are recognized immediately in other comprehensive income. Past service cost is recognized immediately to the extent that the benefits are already vested, and otherwise is amortized on a straight-line basis over the average period until the benefits become vested.
The retirement benefit obligation recognized in the consolidated balance sheets represents the present value of the defined benefit obligation as adjusted for unrecognized past service cost, and as reduced by the fair value of plan assets. Any asset resulting from this calculation is limited to the unrecognized past service cost, plus the present value of available refunds and reductions in future contributions to the plan.
Curtailment or settlement gains or losses on the defined benefit plan are recognized when the curtailment or settlement occurs.
b. High-yield savings account for employeeThe Group provides employees with high-yield savings account. The premium interest rate applies to a fixed amount of principal and the interest is paid to present employees (within employment and retirement) and retired employees. The difference between the premium rate and the market rate is classified as employee benefits.
159
06Financial Status2014 ANNUAL REPORT
According to the “Regulations Governing the Preparation of Financial Reports by Public Banks” Rule No. 28, the premium interest resulting from the yield between the premium rate and the general market rate shall immediately be actuarially calculated based on the FSC-recognized IAS 19 when employees retire. However, if there are authorized regulations from the government regarding the actuarial assumption parameters, the regulations shall prevail.
Share-basedPaymentArrangements
Equity-settled share-based payment
The fair value determined at the grant date of the employee share options is expensed on a straight-line basis over the vesting period, based on the Group’s estimate of employee share options that will eventually vest, with a corresponding increase in capital surplus - employee share options. The fair value determined at the grant date of the employee share options is recognized as an expense in full at the grant date when the share options granted vest immediately.
The grant date of employee share options, which are reserved when the Company issues new shares, is the date when the number of employee subscription is confirmed. The Company recognized an expense and capital surplus at the fair value of the share options determined at the grant date.
Cash-settled share-based payment
For cash-settled share-based payments, a liability is recognized for the goods or services acquired, measured initially at the fair value of the liability incurred. At the end of each reporting period until the liability is settled, and at the date of settlement, the fair value of the liability is remeasured, with any changes in fair value recognized in profit or loss.
Taxation
Income tax expense represents the sum of the tax currently payable and deferred tax.
a. Current taxAccording to the Income Tax Law, an additional tax at 10% of unappropriated earnings is provided for as income tax in the year the shareholders approve to retain the earnings.
Adjustments of prior years’ tax liabilities are added to or deducted from the current year’s tax provision.
b. Deferred taxDeferred tax is recognized on temporary differences between the carrying amounts of assets and liabilities in the consolidated financial statements and the corresponding tax bases used in the computation of taxable profit. Deferred tax liabilities are generally recognized for all taxable temporary differences. Land revaluation increment tax accrued from the Group’s land revaluation increment in accordance with related regulations is a taxable temporary difference and shall be recognized as a deferred tax liability. Deferred tax assets are generally recognized for all deductible temporary differences, unused loss carryforward, research and development expenditures, and personnel training expenditures to the extent that it is probable that taxable profits will be available against which those deductible temporary differences can be utilized. Such deferred tax assets and liabilities are not recognized if the temporary difference arises from goodwill or from the initial recognition (other than in a business combination) of other assets and liabilities in a transaction that affects neither the taxable profit nor the accounting profit.
160
A deferred tax asset shall be recognized for the unused loss carryforward and unused tax credits to the extent that it is probable that future taxable profit will be available against which the unused tax losses and unused tax credits can be utilized. A previously unrecognized deferred tax asset is also reviewed at the end of each reporting period and recognized to the extent that it has become probable that future taxable profit will allow the deferred tax asset to be realized.
Deferred tax liabilities and assets are measured at the tax rates that are expected to apply in the period in which the liability is settled or the asset realized, based on tax rates (and tax laws) that have been enacted or substantively enacted by the end of the reporting period. The measurement of deferred tax liabilities and assets reflects the tax consequences that would follow from the manner in which the Group expects, at the end of the reporting period, to recover or settle the carrying amount of its assets and liabilities.
The Group does not offset deferred tax assets and deferred tax liabilities from different taxation authorities.
c. Current and deferred tax for the periodCurrent tax and deferred tax are recognized in profit or loss, except when they relate to items that are recognized in other comprehensive income or directly in equity, in which case, the current tax and deferred tax are also recognized in other comprehensive income or directly in equity, respectively. Where current tax or deferred tax arises from the initial accounting for a business combination, the tax effect is included in the accounting for the business combination.
d. Taishin Financial Holding and its more than 90% owned subsidiaries adopt the linked-tax system for tax filings. Differences between current and deferred income tax expenses on consolidated entity basis and those on nonconsolidated entity basis are adjusted in Taishin Financial Holding’s income tax expenses. Related reimbursement and appropriation are recognized as receivables or payables.
6. CRITICALACCOUNTINGJUDGMENTSANDKEYSOURCESOFESTIMATIONUNCERTAINTY
The Group’s accounting policies, accounting assumptions and estimates have significant impact on the consolidated financial statements. Accordingly, the management exercised appropriate professional judgment in the preparation of the consolidated financial statements.
The assumptions and estimates involve significant risks that significant adjustments might result in changes in the carrying amounts of assets and liabilities in the next fiscal year. The assumptions and estimates made were the best estimates based on the FSC-recognized IFRSs. The estimates and assumptions are based on historical experience and other factors, including future expectations and are continuously assessed. The accounting policies and management’s judgment that could have significant impact on the consolidated financial statements were as follows:
a. Impairment of loans
Occurrence of objective evidence of impairment loss on loans will impact the assumptions on cash flows. The amount of impairment loss is measured as the difference between the asset’s carrying amount and the present value of estimated future cash flows (excluding future credit loss that had not yet happened) discounted at its original effective interest rate.
As of December 31, 2014 and 2013, the carrying amounts of loans are illustrated in Note 13.
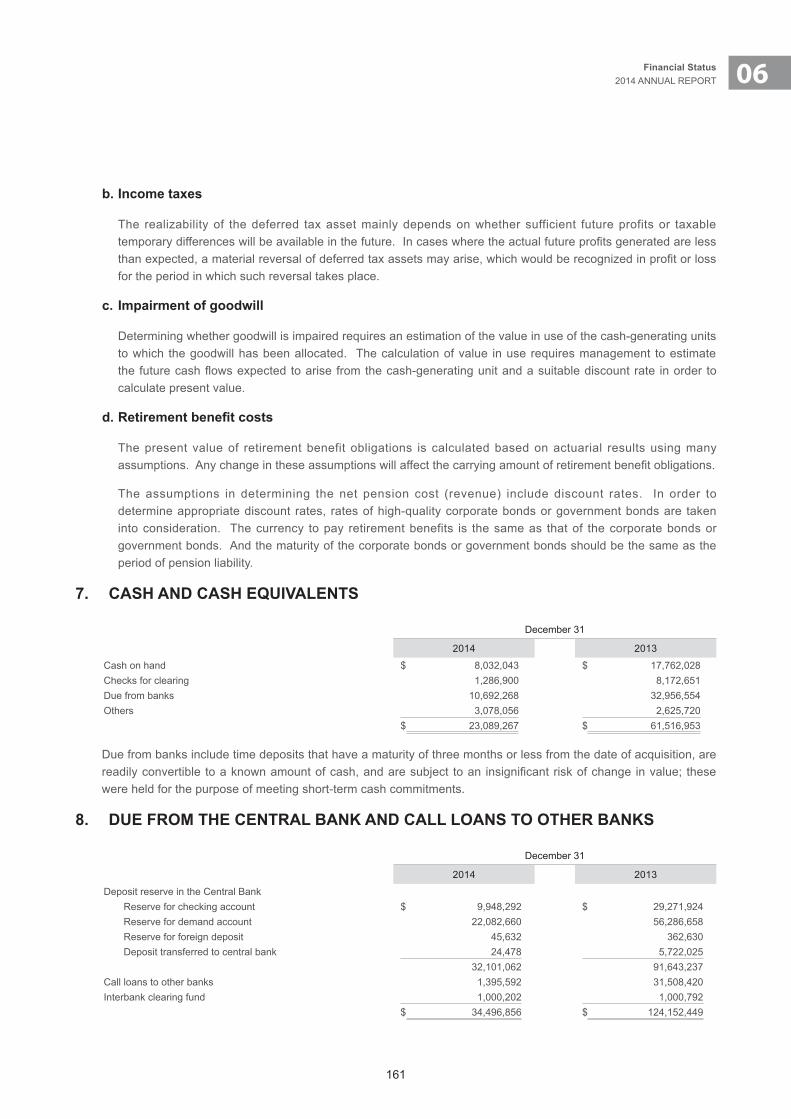
161
06Financial Status2014 ANNUAL REPORT
b.Incometaxes
The realizability of the deferred tax asset mainly depends on whether sufficient future profits or taxable temporary differences will be available in the future. In cases where the actual future profits generated are less than expected, a material reversal of deferred tax assets may arise, which would be recognized in profit or loss for the period in which such reversal takes place.
c.Impairmentofgoodwill
Determining whether goodwill is impaired requires an estimation of the value in use of the cash-generating units to which the goodwill has been allocated. The calculation of value in use requires management to estimate the future cash flows expected to arise from the cash-generating unit and a suitable discount rate in order to calculate present value.
d.Retirementbenefitcosts
The present value of retirement benefit obligations is calculated based on actuarial results using many assumptions. Any change in these assumptions will affect the carrying amount of retirement benefit obligations.
The assumptions in determining the net pension cost (revenue) include discount rates. In order to determine appropriate discount rates, rates of high-quality corporate bonds or government bonds are taken into consideration. The currency to pay retirement benefits is the same as that of the corporate bonds or government bonds. And the maturity of the corporate bonds or government bonds should be the same as the period of pension liability.
7. CASHANDCASHEQUIVALENTS
December 31
2014 2013
Cash on hand $ 8,032,043 $ 17,762,028Checks for clearing 1,286,900 8,172,651Due from banks 10,692,268 32,956,554Others 3,078,056 2,625,720
$ 23,089,267 $ 61,516,953
Due from banks include time deposits that have a maturity of three months or less from the date of acquisition, are readily convertible to a known amount of cash, and are subject to an insignificant risk of change in value; these were held for the purpose of meeting short-term cash commitments.
8. DUEFROMTHECENTRALBANKANDCALLLOANSTOOTHERBANKS
December 31
2014 2013
Deposit reserve in the Central Bank Reserve for checking account $ 9,948,292 $ 29,271,924 Reserve for demand account 22,082,660 56,286,658 Reserve for foreign deposit 45,632 362,630 Deposit transferred to central bank 24,478 5,722,025
32,101,062 91,643,237Call loans to other banks 1,395,592 31,508,420Interbank clearing fund 1,000,202 1,000,792
$ 34,496,856 $ 124,152,449
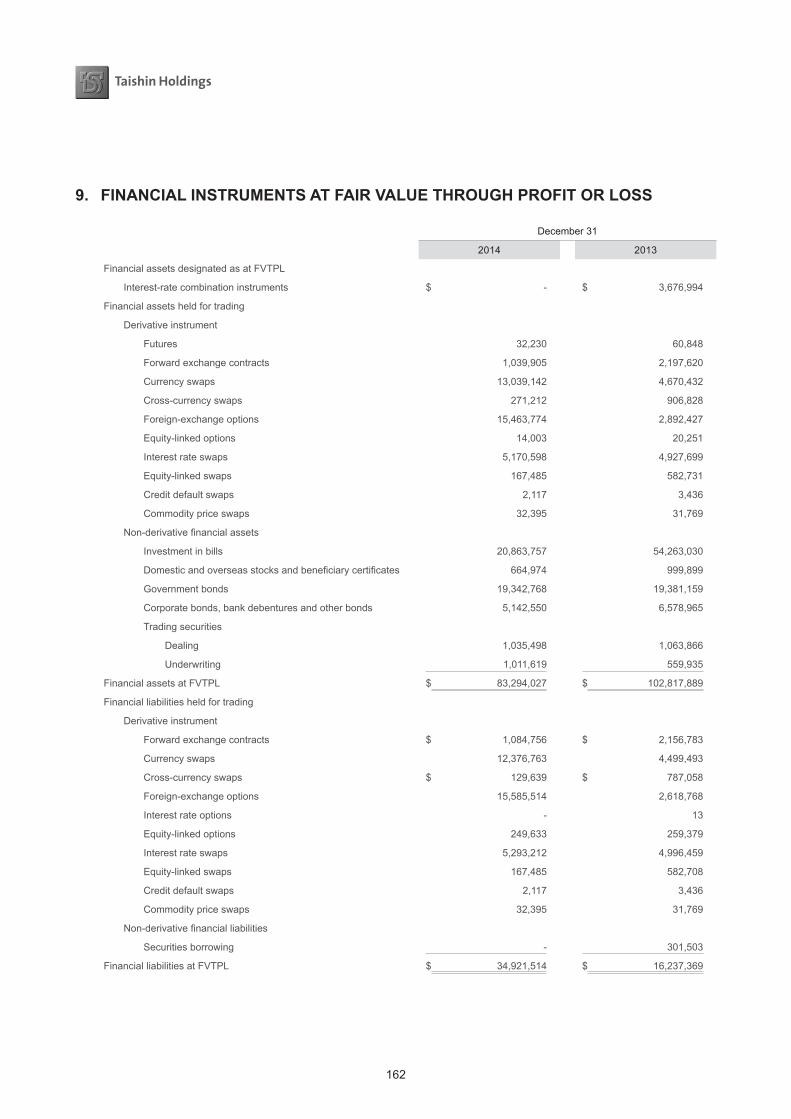
162
9. FINANCIALINSTRUMENTSATFAIRVALUETHROUGHPROFITORLOSS
December 31
2014 2013
Financial assets designated as at FVTPL
Interest-rate combination instruments $ - $ 3,676,994
Financial assets held for trading
Derivative instrument
Futures 32,230 60,848
Forward exchange contracts 1,039,905 2,197,620
Currency swaps 13,039,142 4,670,432
Cross-currency swaps 271,212 906,828
Foreign-exchange options 15,463,774 2,892,427
Equity-linked options 14,003 20,251
Interest rate swaps 5,170,598 4,927,699
Equity-linked swaps 167,485 582,731
Credit default swaps 2,117 3,436
Commodity price swaps 32,395 31,769
Non-derivative financial assets
Investment in bills 20,863,757 54,263,030
Domestic and overseas stocks and beneficiary certificates 664,974 999,899
Government bonds 19,342,768 19,381,159
Corporate bonds, bank debentures and other bonds 5,142,550 6,578,965
Trading securities
Dealing 1,035,498 1,063,866
Underwriting 1,011,619 559,935
Financial assets at FVTPL $ 83,294,027 $ 102,817,889
Financial liabilities held for trading
Derivative instrument
Forward exchange contracts $ 1,084,756 $ 2,156,783
Currency swaps 12,376,763 4,499,493
Cross-currency swaps $ 129,639 $ 787,058
Foreign-exchange options 15,585,514 2,618,768
Interest rate options - 13
Equity-linked options 249,633 259,379
Interest rate swaps 5,293,212 4,996,459
Equity-linked swaps 167,485 582,708
Credit default swaps 2,117 3,436
Commodity price swaps 32,395 31,769
Non-derivative financial liabilities
Securities borrowing - 301,503
Financial liabilities at FVTPL $ 34,921,514 $ 16,237,369
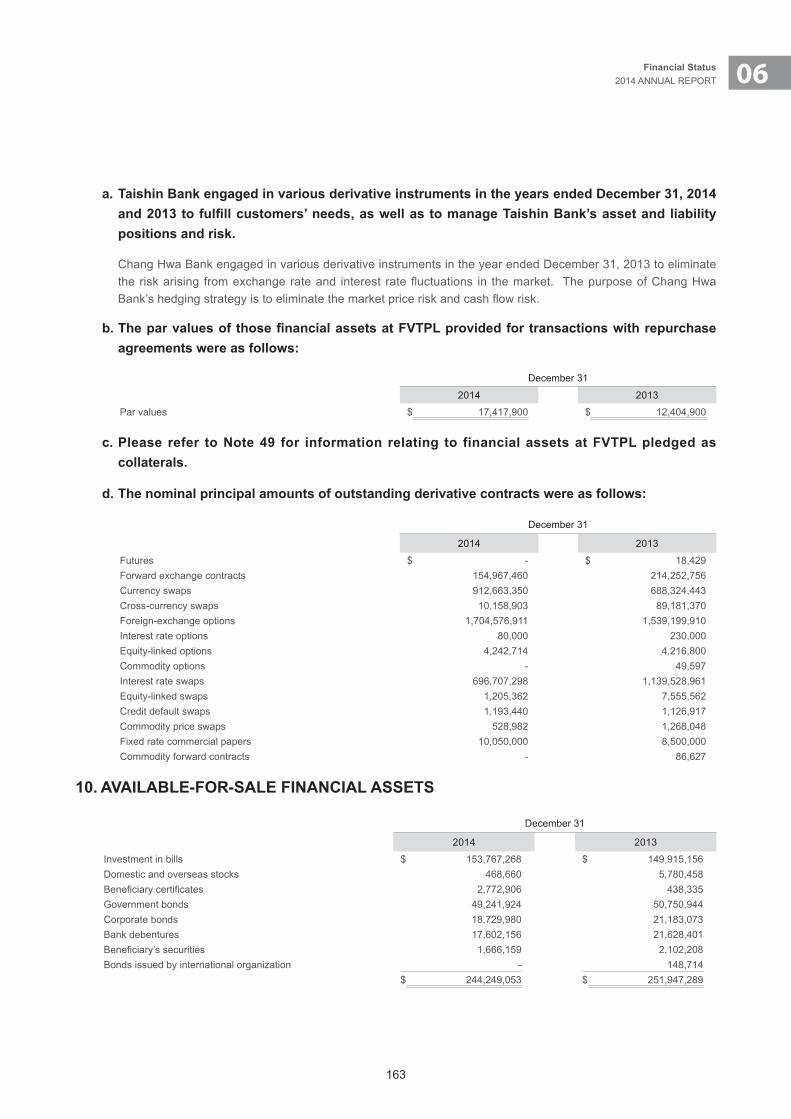
163
06Financial Status2014 ANNUAL REPORT
a.TaishinBankengagedinvariousderivativeinstrumentsintheyearsendedDecember31,2014and2013tofulfillcustomers’needs,aswellastomanageTaishinBank’sassetandliabilitypositions and risk.
Chang Hwa Bank engaged in various derivative instruments in the year ended December 31, 2013 to eliminate the risk arising from exchange rate and interest rate fluctuations in the market. The purpose of Chang Hwa Bank’s hedging strategy is to eliminate the market price risk and cash flow risk.
b.TheparvaluesofthosefinancialassetsatFVTPLprovidedfortransactionswithrepurchaseagreementswereasfollows:
December 31
2014 2013
Par values $ 17,417,900 $ 12,404,900
c.Please refer toNote49 for informationrelating to financialassetsatFVTPLpledgedascollaterals.
d.Thenominalprincipalamountsofoutstandingderivativecontractswereasfollows:
December 31
2014 2013
Futures $ - $ 18,429Forward exchange contracts 154,967,460 214,252,756Currency swaps 912,663,350 688,324,443Cross-currency swaps 10,158,903 89,181,370Foreign-exchange options 1,704,576,911 1,539,199,910Interest rate options 80,000 230,000Equity-linked options 4,242,714 4,216,800Commodity options - 49,597Interest rate swaps 696,707,298 1,139,528,961Equity-linked swaps 1,205,362 7,555,562Credit default swaps 1,193,440 1,126,917Commodity price swaps 528,982 1,268,048Fixed rate commercial papers 10,050,000 8,500,000Commodity forward contracts - 86,627
10.AVAILABLE-FOR-SALEFINANCIALASSETS
December 31
2014 2013
Investment in bills $ 153,767,268 $ 149,915,156Domestic and overseas stocks 468,660 5,780,458Beneficiary certificates 2,772,906 438,335Government bonds 49,241,924 50,750,944Corporate bonds 18,729,980 21,183,073Bank debentures 17,602,156 21,628,401Beneficiary’s securities 1,666,159 2,102,208Bonds issued by international organization - 148,714
$ 244,249,053 $ 251,947,289
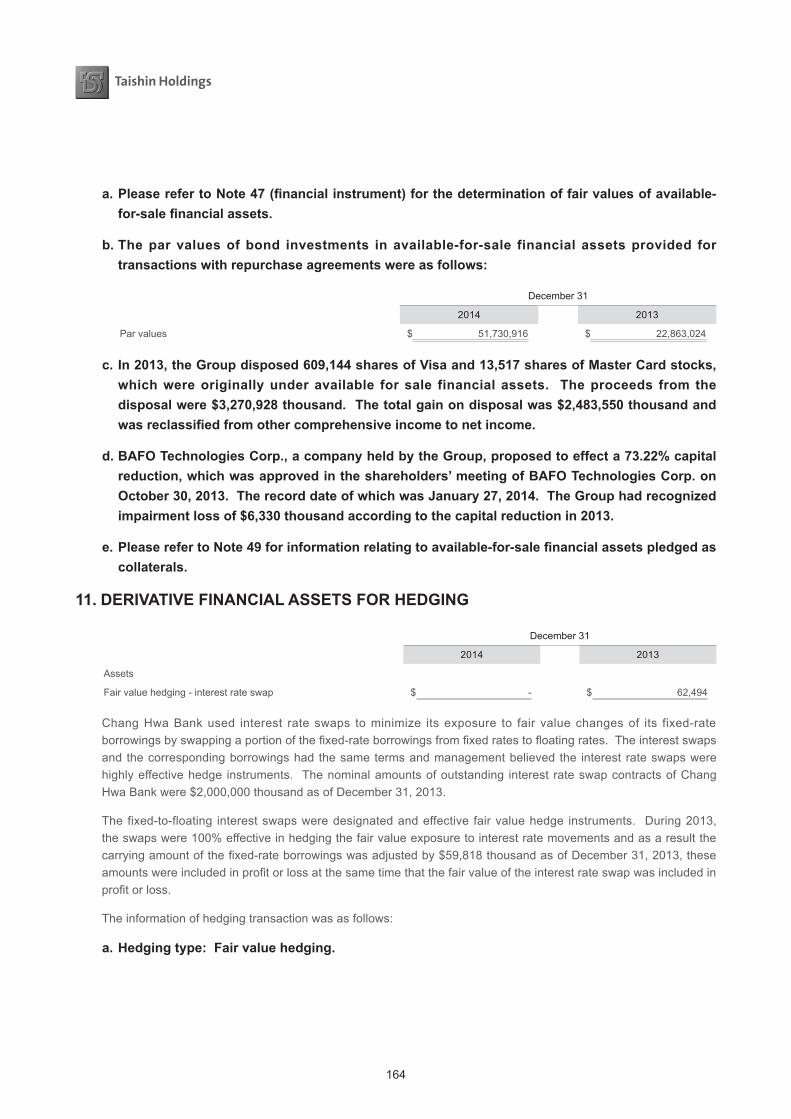
164
a.PleaserefertoNote47(financialinstrument)forthedeterminationoffairvaluesofavailable-for-salefinancialassets.
b.Theparvaluesofbond investments inavailable-for-sale financialassetsprovided fortransactionswithrepurchaseagreementswereasfollows:
December 31
2014 2013
Par values $ 51,730,916 $ 22,863,024
c.In2013,theGroupdisposed609,144sharesofVisaand13,517sharesofMasterCardstocks,whichwereoriginallyunderavailable forsale financialassets. Theproceeds from thedisposalwere$3,270,928thousand.Thetotalgainondisposalwas$2,483,550thousandandwasreclassifiedfromothercomprehensiveincometonetincome.
d.BAFOTechnologiesCorp.,acompanyheldbytheGroup,proposedtoeffecta73.22%capitalreduction,whichwasapprovedintheshareholders’meetingofBAFOTechnologiesCorp.onOctober30,2013.TherecorddateofwhichwasJanuary27,2014.TheGrouphadrecognizedimpairmentlossof$6,330thousandaccordingtothecapitalreductionin2013.
e.PleaserefertoNote49forinformationrelatingtoavailable-for-salefinancialassetspledgedascollaterals.
11.DERIVATIVEFINANCIALASSETSFORHEDGING
December 31
2014 2013
Assets
Fair value hedging - interest rate swap $ - $ 62,494
Chang Hwa Bank used interest rate swaps to minimize its exposure to fair value changes of its fixed-rate borrowings by swapping a portion of the fixed-rate borrowings from fixed rates to floating rates. The interest swaps and the corresponding borrowings had the same terms and management believed the interest rate swaps were highly effective hedge instruments. The nominal amounts of outstanding interest rate swap contracts of Chang Hwa Bank were $2,000,000 thousand as of December 31, 2013.
The fixed-to-floating interest swaps were designated and effective fair value hedge instruments. During 2013, the swaps were 100% effective in hedging the fair value exposure to interest rate movements and as a result the carrying amount of the fixed-rate borrowings was adjusted by $59,818 thousand as of December 31, 2013, these amounts were included in profit or loss at the same time that the fair value of the interest rate swap was included in profit or loss.
The information of hedging transaction was as follows:
a.Hedgingtype:Fairvaluehedging.
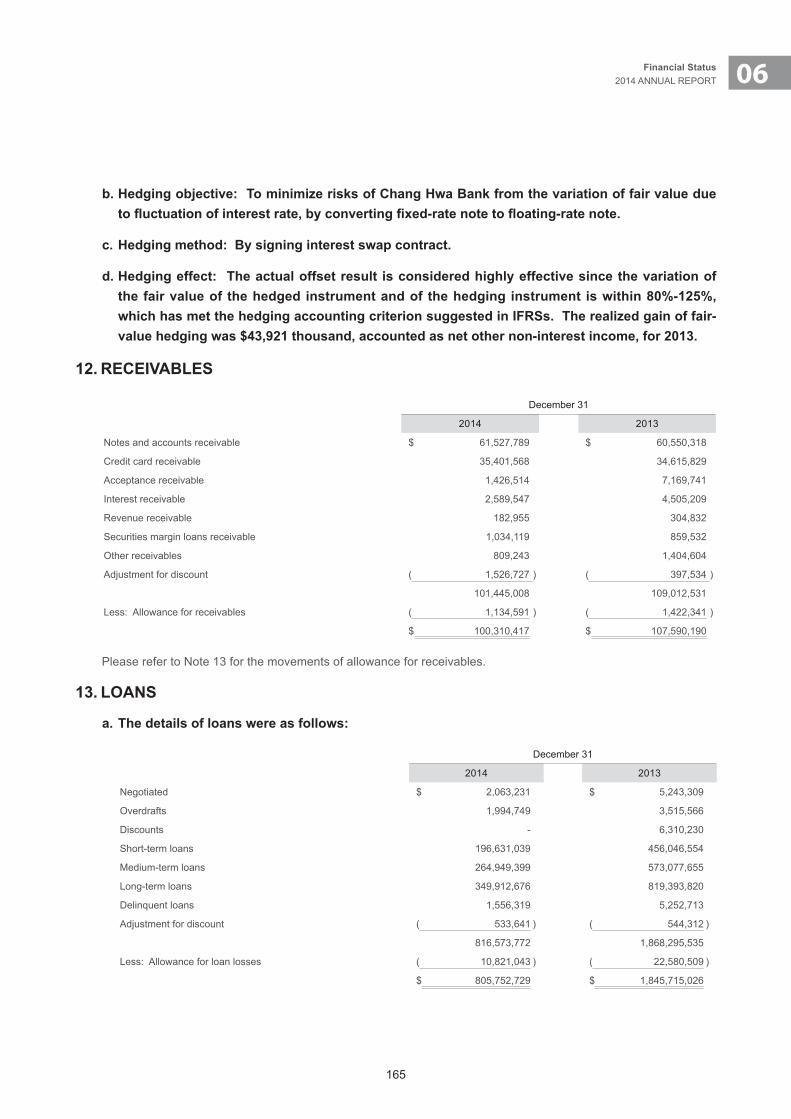
165
06Financial Status2014 ANNUAL REPORT
b.Hedgingobjective:TominimizerisksofChangHwaBankfromthevariationoffairvalueduetofluctuationofinterestrate,byconvertingfixed-ratenotetofloating-ratenote.
c.Hedgingmethod:Bysigninginterestswapcontract.
d.Hedgingeffect: Theactualoffsetresult isconsideredhighlyeffectivesincethevariationofthefairvalueofthehedgedinstrumentandofthehedginginstrument iswithin80%-125%,whichhasmetthehedgingaccountingcriterionsuggestedinIFRSs.Therealizedgainoffair-valuehedgingwas$43,921thousand,accountedasnetothernon-interestincome,for2013.
12. RECEIVABLES
December 31
2014 2013
Notes and accounts receivable $ 61,527,789 $ 60,550,318
Credit card receivable 35,401,568 34,615,829
Acceptance receivable 1,426,514 7,169,741
Interest receivable 2,589,547 4,505,209
Revenue receivable 182,955 304,832
Securities margin loans receivable 1,034,119 859,532
Other receivables 809,243 1,404,604
Adjustment for discount ( 1,526,727 ) ( 397,534 )
101,445,008 109,012,531
Less: Allowance for receivables ( 1,134,591 ) ( 1,422,341 )
$ 100,310,417 $ 107,590,190
Please refer to Note 13 for the movements of allowance for receivables.
13.LOANS
a.Thedetailsofloanswereasfollows:
December 31
2014 2013
Negotiated $ 2,063,231 $ 5,243,309
Overdrafts 1,994,749 3,515,566
Discounts - 6,310,230
Short-term loans 196,631,039 456,046,554
Medium-term loans 264,949,399 573,077,655
Long-term loans 349,912,676 819,393,820
Delinquent loans 1,556,319 5,252,713
Adjustment for discount ( 533,641 ) ( 544,312 )
816,573,772 1,868,295,535
Less: Allowance for loan losses ( 10,821,043 ) ( 22,580,509 )
$ 805,752,729 $ 1,845,715,026
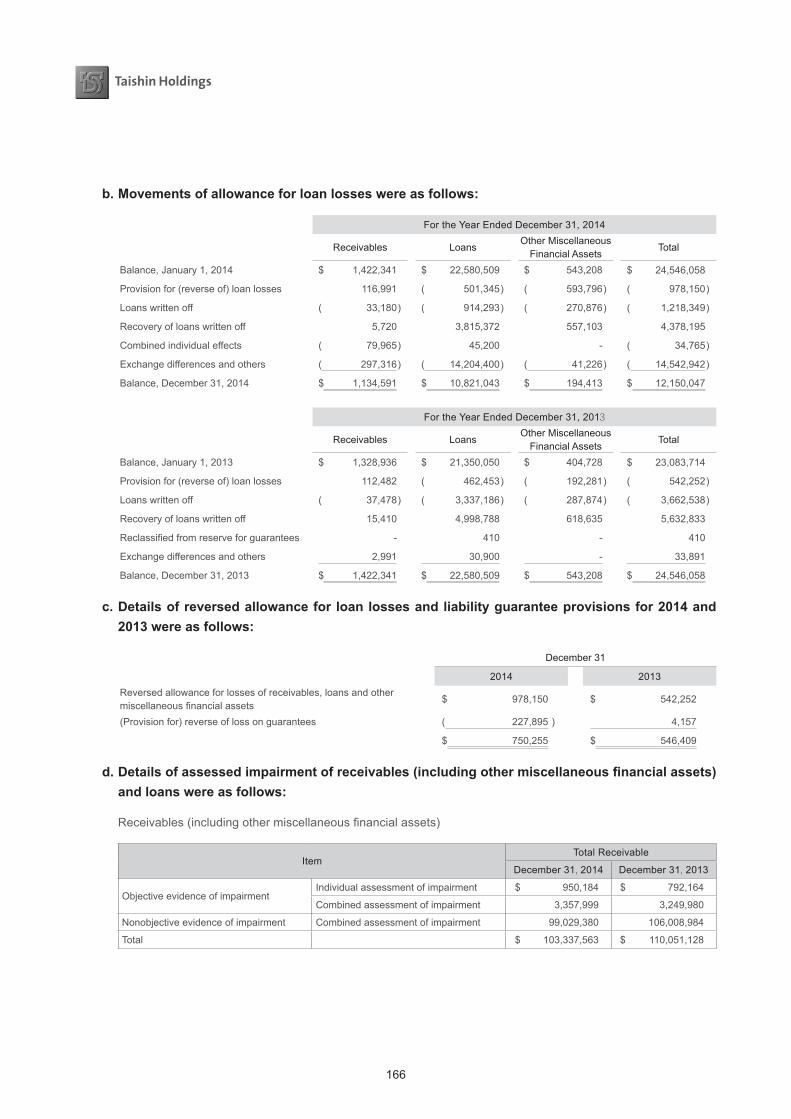
166
b.Movementsofallowanceforloanlosseswereasfollows:
For the Year Ended December 31, 2014
Receivables LoansOther Miscellaneous
Financial AssetsTotal
Balance, January 1, 2014 $ 1,422,341 $ 22,580,509 $ 543,208 $ 24,546,058
Provision for (reverse of) loan losses 116,991 ( 501,345 ) ( 593,796 ) ( 978,150 )
Loans written off ( 33,180 ) ( 914,293 ) ( 270,876 ) ( 1,218,349 )
Recovery of loans written off 5,720 3,815,372 557,103 4,378,195
Combined individual effects ( 79,965 ) 45,200 - ( 34,765 )
Exchange differences and others ( 297,316 ) ( 14,204,400 ) ( 41,226 ) ( 14,542,942 )
Balance, December 31, 2014 $ 1,134,591 $ 10,821,043 $ 194,413 $ 12,150,047
For the Year Ended December 31, 2013
Receivables LoansOther Miscellaneous
Financial AssetsTotal
Balance, January 1, 2013 $ 1,328,936 $ 21,350,050 $ 404,728 $ 23,083,714
Provision for (reverse of) loan losses 112,482 ( 462,453 ) ( 192,281 ) ( 542,252 )
Loans written off ( 37,478 ) ( 3,337,186 ) ( 287,874 ) ( 3,662,538 )
Recovery of loans written off 15,410 4,998,788 618,635 5,632,833
Reclassified from reserve for guarantees - 410 - 410
Exchange differences and others 2,991 30,900 - 33,891
Balance, December 31, 2013 $ 1,422,341 $ 22,580,509 $ 543,208 $ 24,546,058
c.Detailsofreversedallowanceforloanlossesandliabilityguaranteeprovisionsfor2014and2013wereasfollows:
December 31
2014 2013Reversed allowance for losses of receivables, loans and other miscellaneous financial assets
$ 978,150 $ 542,252
(Provision for) reverse of loss on guarantees ( 227,895 ) 4,157
$ 750,255 $ 546,409
d.Detailsofassessedimpairmentofreceivables(includingothermiscellaneousfinancialassets)andloanswereasfollows:
Receivables (including other miscellaneous financial assets)
ItemTotal Receivable
December 31, 2014 December 31, 2013
Objective evidence of impairmentIndividual assessment of impairment $ 950,184 $ 792,164
Combined assessment of impairment 3,357,999 3,249,980
Nonobjective evidence of impairment Combined assessment of impairment 99,029,380 106,008,984
Total $ 103,337,563 $ 110,051,128

167
06Financial Status2014 ANNUAL REPORT
ItemTotal Allowance
December 31, 2014 December 31, 2013
Objective evidence of impairmentIndividual assessment of impairment $ 692,336 $ 683,977
Combined assessment of impairment 356,060 553,734
Nonobjective evidence of impairment Combined assessment of impairment 280,608 727,838
Total $ 1,329,004 $ 1,965,549
Note: The amount of receivable did not include the amount of allowance for receivables and the amount of adjustment for discount (premium).
Loans
ItemTotal Loans
December 31, 2014 December 31, 2013
Objective evidence of impairmentIndividual assessment of impairment $ 7,206,816 $ 26,269,476
Combined assessment of impairment 9,688,148 13,039,249
Nonobjective evidence of impairment Combined assessment of impairment 800,212,449 1,829,531,122
Total $ 817,107,413 $ 1,868,839,847
ItemTotal Allowance
December 31, 2014 December 31, 2013
Objective evidence of impairmentIndividual assessment of impairment $ 3,918,665 $ 8,272,075
Combined assessment of impairment 2,406,513 2,530,574
Nonobjective evidence of impairment Combined assessment of impairment 4,495,865 11,777,860
Total $ 10,821,043 $ 22,580,509
Note: The amount of loans did not include the amount of allowance for loan losses and adjustment for discount (premium).
14.HELD-TO-MATURITYFINANCIALASSETS
December 31
2014 2013
Investment in bills $ - $ 215,841,649
Government bonds 2,540 -
Corporate bonds - 7,210,933
Bank debentures - 5,890,339
$ 2,540 $ 228,942,921
a.Thepar valuesofbond investments inheld-to-maturity financial assetsprovided fortransactionswithrepurchaseagreementswereasfollows:
December 31, 2014 December 31, 2013
Par values $ - $ 1,647,250
b.PleaserefertoNote49forinformationrelatingtoheld-to-maturityfinancialassetspledgedascollaterals.
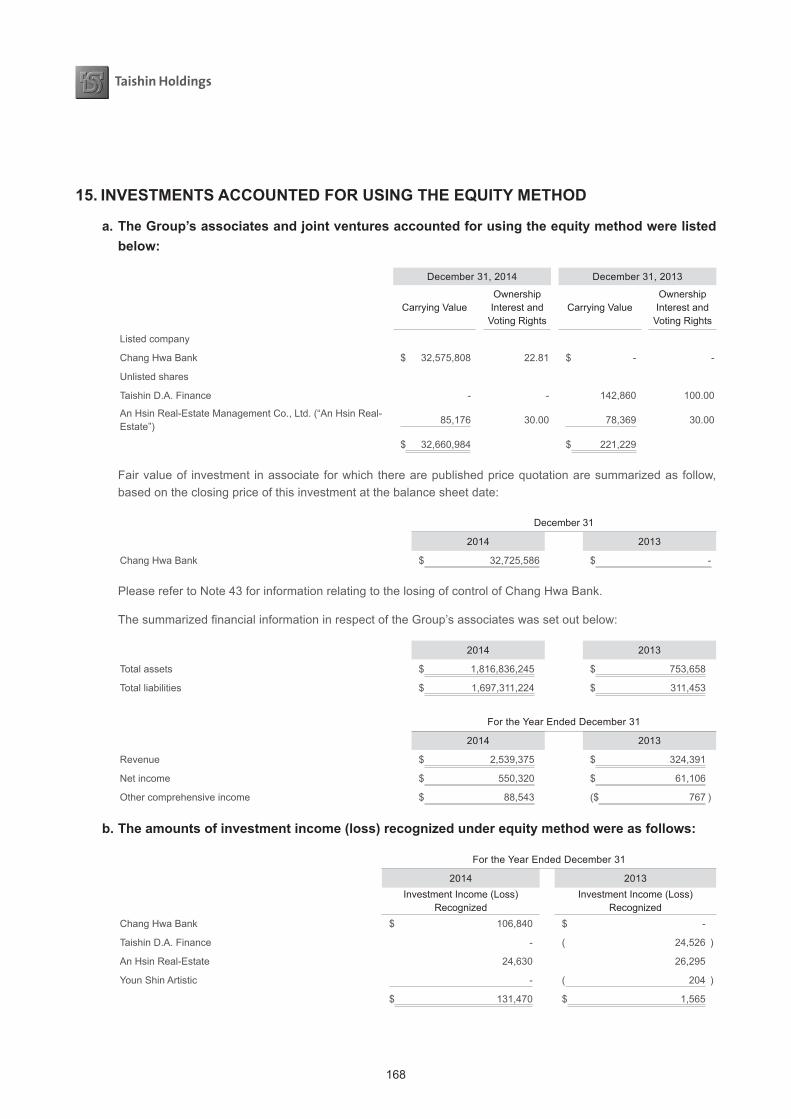
168
15.INVESTMENTSACCOUNTEDFORUSINGTHEEQUITYMETHOD
a.TheGroup’sassociatesandjointventuresaccountedforusingtheequitymethodwerelistedbelow:
December 31, 2014 December 31, 2013
Carrying ValueOwnership Interest and
Voting RightsCarrying Value
Ownership Interest and
Voting Rights
Listed company
Chang Hwa Bank $ 32,575,808 22.81 $ - -
Unlisted shares
Taishin D.A. Finance - - 142,860 100.00
An Hsin Real-Estate Management Co., Ltd. (“An Hsin Real-Estate”)
85,176 30.00 78,369 30.00
$ 32,660,984 $ 221,229
Fair value of investment in associate for which there are published price quotation are summarized as follow, based on the closing price of this investment at the balance sheet date:
December 31
2014 2013
Chang Hwa Bank $ 32,725,586 $ -
Please refer to Note 43 for information relating to the losing of control of Chang Hwa Bank.
The summarized financial information in respect of the Group’s associates was set out below:
2014 2013
Total assets $ 1,816,836,245 $ 753,658
Total liabilities $ 1,697,311,224 $ 311,453
For the Year Ended December 31
2014 2013
Revenue $ 2,539,375 $ 324,391
Net income $ 550,320 $ 61,106
Other comprehensive income $ 88,543 ($ 767 )
b.Theamountsofinvestmentincome(loss)recognizedunderequitymethodwereasfollows:
For the Year Ended December 31
2014 2013Investment Income (Loss)
RecognizedInvestment Income (Loss)
RecognizedChang Hwa Bank $ 106,840 $ -
Taishin D.A. Finance - ( 24,526 )
An Hsin Real-Estate 24,630 26,295
Youn Shin Artistic - ( 204 )
$ 131,470 $ 1,565
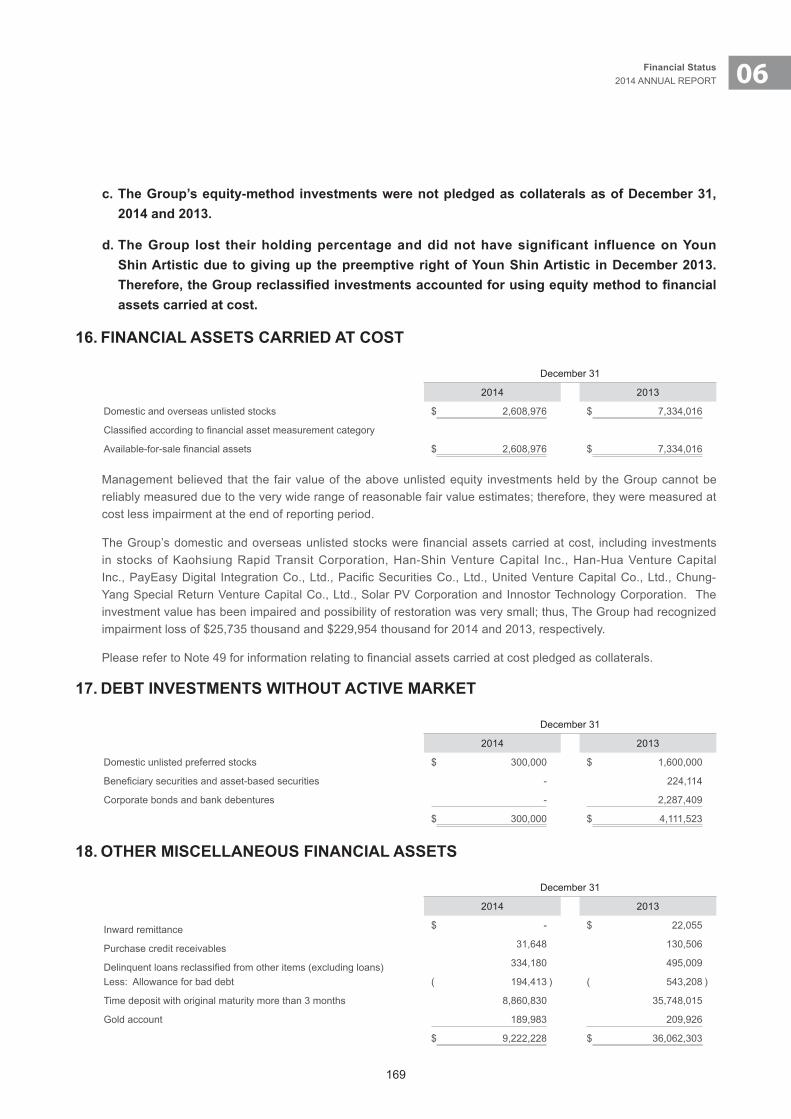
169
06Financial Status2014 ANNUAL REPORT
c.TheGroup’sequity-methodinvestmentswerenotpledgedascollateralsasofDecember31,2014 and 2013.
d.TheGroup lost theirholdingpercentageanddidnothavesignificant influenceonYounShinArtisticduetogivingupthepreemptiverightofYounShinArtistic inDecember2013.Therefore,theGroupreclassifiedinvestmentsaccountedforusingequitymethodtofinancialassets carried at cost.
16.FINANCIALASSETSCARRIEDATCOST
December 31
2014 2013
Domestic and overseas unlisted stocks $ 2,608,976 $ 7,334,016
Classified according to financial asset measurement category
Available-for-sale financial assets $ 2,608,976 $ 7,334,016
Management believed that the fair value of the above unlisted equity investments held by the Group cannot be reliably measured due to the very wide range of reasonable fair value estimates; therefore, they were measured at cost less impairment at the end of reporting period.
The Group’s domestic and overseas unlisted stocks were financial assets carried at cost, including investments in stocks of Kaohsiung Rapid Transit Corporation, Han-Shin Venture Capital Inc., Han-Hua Venture Capital Inc., PayEasy Digital Integration Co., Ltd., Pacific Securities Co., Ltd., United Venture Capital Co., Ltd., Chung-Yang Special Return Venture Capital Co., Ltd., Solar PV Corporation and Innostor Technology Corporation. The investment value has been impaired and possibility of restoration was very small; thus, The Group had recognized impairment loss of $25,735 thousand and $229,954 thousand for 2014 and 2013, respectively.
Please refer to Note 49 for information relating to financial assets carried at cost pledged as collaterals.
17.DEBTINVESTMENTSWITHOUTACTIVEMARKET
December 31
2014 2013
Domestic unlisted preferred stocks $ 300,000 $ 1,600,000
Beneficiary securities and asset-based securities - 224,114
Corporate bonds and bank debentures - 2,287,409
$ 300,000 $ 4,111,523
18.OTHERMISCELLANEOUSFINANCIALASSETS
December 31
2014 2013
Inward remittance $ - $ 22,055
Purchase credit receivables 31,648 130,506
Delinquent loans reclassified from other items (excluding loans) 334,180 495,009
Less: Allowance for bad debt ( 194,413 ) ( 543,208 )
Time deposit with original maturity more than 3 months 8,860,830 35,748,015
Gold account 189,983 209,926
$ 9,222,228 $ 36,062,303
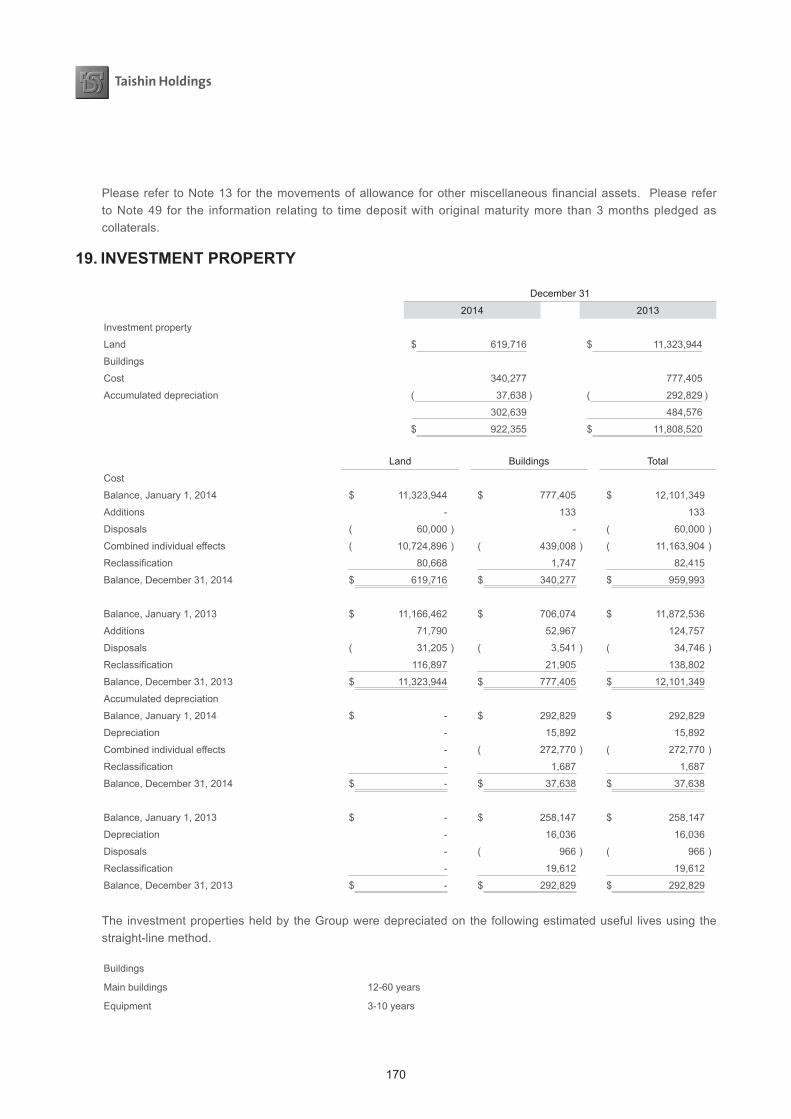
170
Please refer to Note 13 for the movements of allowance for other miscellaneous financial assets. Please refer to Note 49 for the information relating to time deposit with original maturity more than 3 months pledged as collaterals.
19.INVESTMENTPROPERTY
December 31
2014 2013
Investment property
Land $ 619,716 $ 11,323,944
Buildings
Cost 340,277 777,405
Accumulated depreciation ( 37,638 ) ( 292,829 )
302,639 484,576
$ 922,355 $ 11,808,520
Land Buildings Total
Cost
Balance, January 1, 2014 $ 11,323,944 $ 777,405 $ 12,101,349
Additions - 133 133
Disposals ( 60,000 ) - ( 60,000 )
Combined individual effects ( 10,724,896 ) ( 439,008 ) ( 11,163,904 )
Reclassification 80,668 1,747 82,415
Balance, December 31, 2014 $ 619,716 $ 340,277 $ 959,993
Balance, January 1, 2013 $ 11,166,462 $ 706,074 $ 11,872,536
Additions 71,790 52,967 124,757
Disposals ( 31,205 ) ( 3,541 ) ( 34,746 )
Reclassification 116,897 21,905 138,802
Balance, December 31, 2013 $ 11,323,944 $ 777,405 $ 12,101,349
Accumulated depreciation
Balance, January 1, 2014 $ - $ 292,829 $ 292,829
Depreciation - 15,892 15,892
Combined individual effects - ( 272,770 ) ( 272,770 )
Reclassification - 1,687 1,687
Balance, December 31, 2014 $ - $ 37,638 $ 37,638
Balance, January 1, 2013 $ - $ 258,147 $ 258,147
Depreciation - 16,036 16,036
Disposals - ( 966 ) ( 966 )
Reclassification - 19,612 19,612
Balance, December 31, 2013 $ - $ 292,829 $ 292,829
The investment properties held by the Group were depreciated on the following estimated useful lives using the straight-line method.
Buildings
Main buildings 12-60 years
Equipment 3-10 years
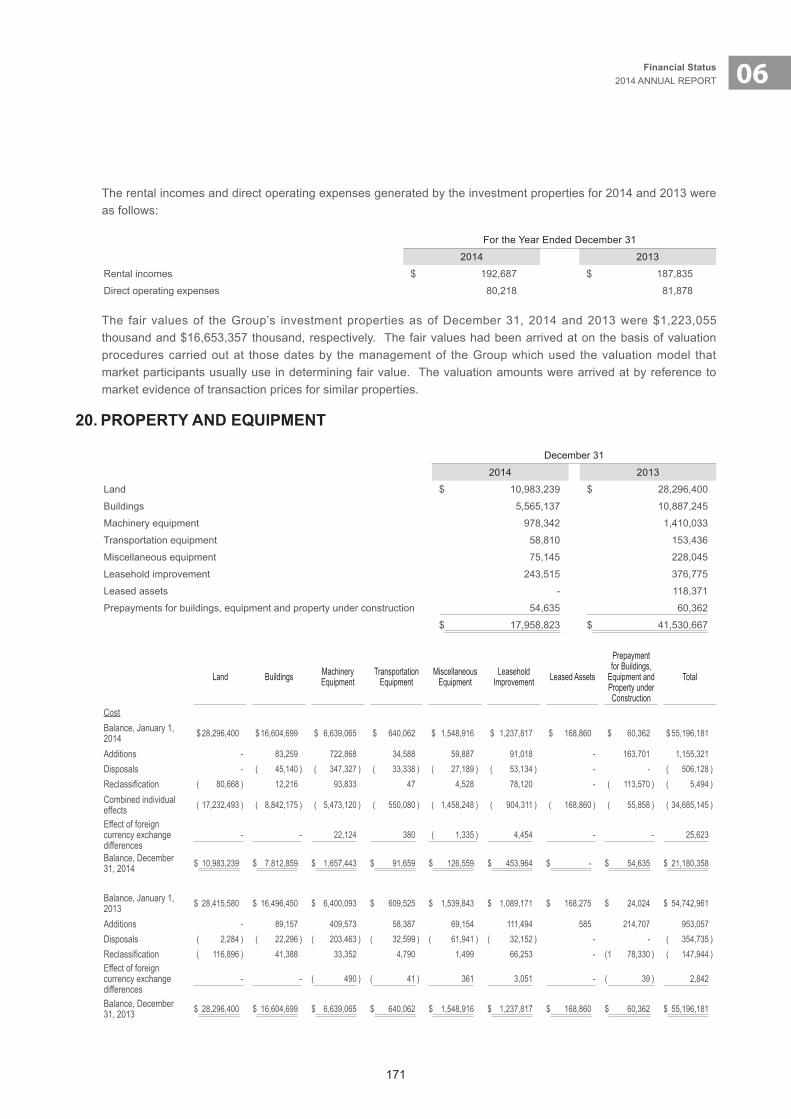
171
06Financial Status2014 ANNUAL REPORT
The rental incomes and direct operating expenses generated by the investment properties for 2014 and 2013 were as follows:
For the Year Ended December 31
2014 2013
Rental incomes $ 192,687 $ 187,835
Direct operating expenses 80,218 81,878
The fair values of the Group’s investment properties as of December 31, 2014 and 2013 were $1,223,055 thousand and $16,653,357 thousand, respectively. The fair values had been arrived at on the basis of valuation procedures carried out at those dates by the management of the Group which used the valuation model that market participants usually use in determining fair value. The valuation amounts were arrived at by reference to market evidence of transaction prices for similar properties.
20.PROPERTYANDEQUIPMENT
December 31
2014 2013
Land $ 10,983,239 $ 28,296,400
Buildings 5,565,137 10,887,245
Machinery equipment 978,342 1,410,033
Transportation equipment 58,810 153,436
Miscellaneous equipment 75,145 228,045
Leasehold improvement 243,515 376,775
Leased assets - 118,371
Prepayments for buildings, equipment and property under construction 54,635 60,362
$ 17,958,823 $ 41,530,667
Land Buildings Machinery Equipment
Transportation Equipment
Miscellaneous Equipment
Leasehold Improvement Leased Assets
Prepayment for Buildings,
Equipment and Property under Construction
Total
CostBalance, January 1, 2014 $ 28,296,400 $ 16,604,699 $ 6,639,065 $ 640,062 $ 1,548,916 $ 1,237,817 $ 168,860 $ 60,362 $ 55,196,181
Additions - 83,259 722,868 34,588 59,887 91,018 - 163,701 1,155,321Disposals - ( 45,140 ) ( 347,327 ) ( 33,338 ) ( 27,189 ) ( 53,134 ) - - ( 506,128 )Reclassification ( 80,668 ) 12,216 93,833 47 4,528 78,120 - ( 113,570 ) ( 5,494 )
Combined individual effects ( 17,232,493 ) ( 8,842,175 ) ( 5,473,120 ) ( 550,080 ) ( 1,458,248 ) ( 904,311 ) ( 168,860 ) ( 55,858 ) ( 34,685,145 )
Effect of foreign currency exchange differences
- - 22,124 380 ( 1,335 ) 4,454 - - 25,623
Balance, December 31, 2014 $ 10,983,239 $ 7,812,859 $ 1,657,443 $ 91,659 $ 126,559 $ 453,964 $ - $ 54,635 $ 21,180,358
Balance, January 1, 2013 $ 28,415,580 $ 16,496,450 $ 6,400,093 $ 609,525 $ 1,539,843 $ 1,089,171 $ 168,275 $ 24,024 $ 54,742,961
Additions - 89,157 409,573 58,387 69,154 111,494 585 214,707 953,057Disposals ( 2,284 ) ( 22,296 ) ( 203,463 ) ( 32,599 ) ( 61,941 ) ( 32,152 ) - - ( 354,735 )Reclassification ( 116,896 ) 41,388 33,352 4,790 1,499 66,253 - ( 1 78,330 ) ( 147,944 )Effect of foreign currency exchange differences
- - ( 490 ) ( 41 ) 361 3,051 - ( 39 ) 2,842
Balance, December 31, 2013 $ 28,296,400 $ 16,604,699 $ 6,639,065 $ 640,062 $ 1,548,916 $ 1,237,817 $ 168,860 $ 60,362 $ 55,196,181
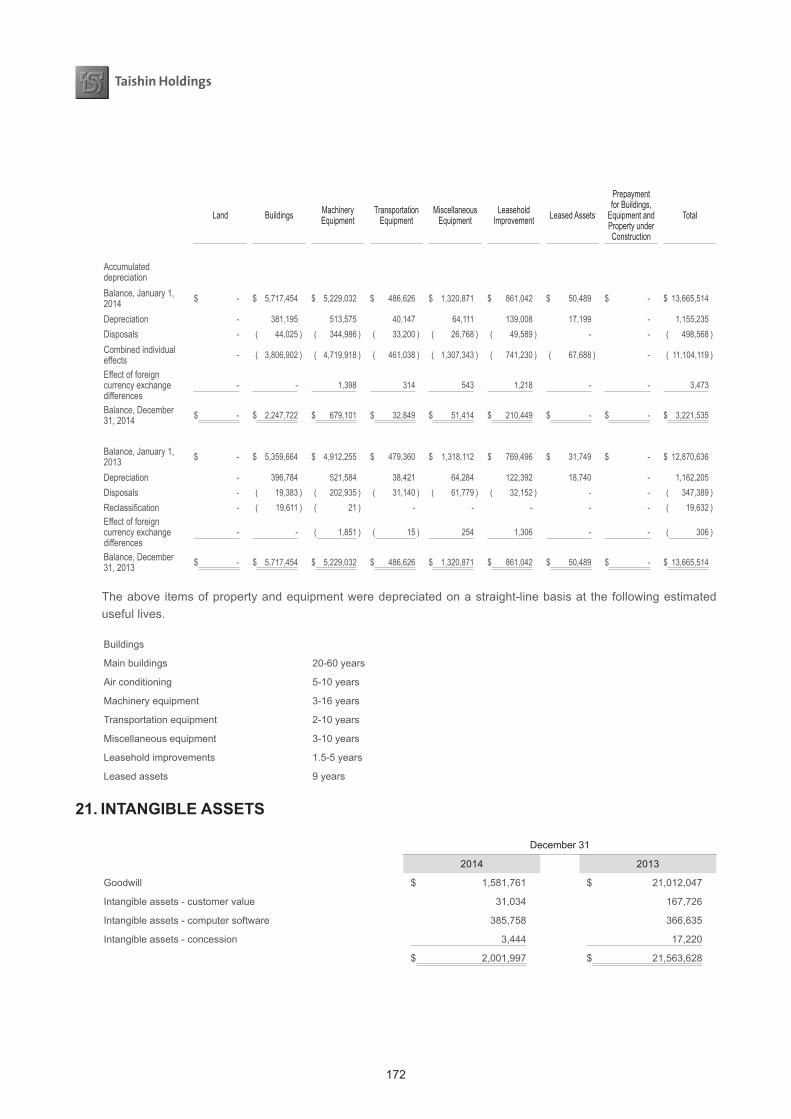
172
Land Buildings Machinery Equipment
Transportation Equipment
Miscellaneous Equipment
Leasehold Improvement Leased Assets
Prepayment for Buildings,
Equipment and Property under Construction
Total
Accumulated depreciationBalance, January 1, 2014 $ - $ 5,717,454 $ 5,229,032 $ 486,626 $ 1,320,871 $ 861,042 $ 50,489 $ - $ 13,665,514
Depreciation - 381,195 513,575 40,147 64,111 139,008 17,199 - 1,155,235Disposals - ( 44,025 ) ( 344,986 ) ( 33,200 ) ( 26,768 ) ( 49,589 ) - - ( 498,568 )
Combined individual effects - ( 3,806,902 ) ( 4,719,918 ) ( 461,038 ) ( 1,307,343 ) ( 741,230 ) ( 67,688 ) - ( 11,104,119 )
Effect of foreign currency exchange differences
- - 1,398 314 543 1,218 - - 3,473
Balance, December 31, 2014 $ - $ 2,247,722 $ 679,101 $ 32,849 $ 51,414 $ 210,449 $ - $ - $ 3,221,535
Balance, January 1, 2013 $ - $ 5,359,664 $ 4,912,255 $ 479,360 $ 1,318,112 $ 769,496 $ 31,749 $ - $ 12,870,636
Depreciation - 396,784 521,584 38,421 64,284 122,392 18,740 - 1,162,205Disposals - ( 19,383 ) ( 202,935 ) ( 31,140 ) ( 61,779 ) ( 32,152 ) - - ( 347,389 )Reclassification - ( 19,611 ) ( 21 ) - - - - - ( 19,632 )Effect of foreign currency exchange differences
- - ( 1,851 ) ( 15 ) 254 1,306 - - ( 306 )
Balance, December 31, 2013 $ - $ 5,717,454 $ 5,229,032 $ 486,626 $ 1,320,871 $ 861,042 $ 50,489 $ - $ 13,665,514
The above items of property and equipment were depreciated on a straight-line basis at the following estimated useful lives.
Buildings
Main buildings 20-60 years
Air conditioning 5-10 years
Machinery equipment 3-16 years
Transportation equipment 2-10 years
Miscellaneous equipment 3-10 years
Leasehold improvements 1.5-5 years
Leased assets 9 years
21.INTANGIBLEASSETS
December 31
2014 2013
Goodwill $ 1,581,761 $ 21,012,047
Intangible assets - customer value 31,034 167,726
Intangible assets - computer software 385,758 366,635
Intangible assets - concession 3,444 17,220
$ 2,001,997 $ 21,563,628
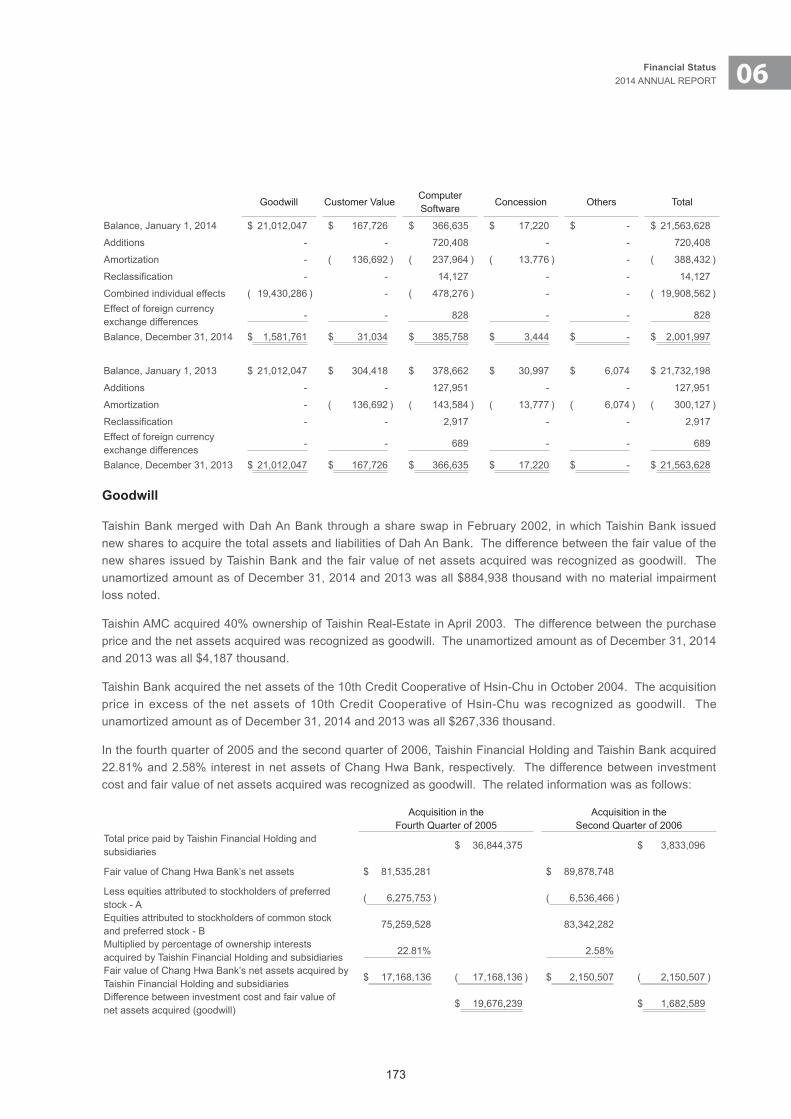
173
06Financial Status2014 ANNUAL REPORT
Goodwill Customer ValueComputer Software
Concession Others Total
Balance, January 1, 2014 $ 21,012,047 $ 167,726 $ 366,635 $ 17,220 $ - $ 21,563,628
Additions - - 720,408 - - 720,408
Amortization - ( 136,692 ) ( 237,964 ) ( 13,776 ) - ( 388,432 )
Reclassification - - 14,127 - - 14,127
Combined individual effects ( 19,430,286 ) - ( 478,276 ) - - ( 19,908,562 )Effect of foreign currency exchange differences
- - 828 - - 828
Balance, December 31, 2014 $ 1,581,761 $ 31,034 $ 385,758 $ 3,444 $ - $ 2,001,997
Balance, January 1, 2013 $ 21,012,047 $ 304,418 $ 378,662 $ 30,997 $ 6,074 $ 21,732,198
Additions - - 127,951 - - 127,951
Amortization - ( 136,692 ) ( 143,584 ) ( 13,777 ) ( 6,074 ) ( 300,127 )
Reclassification - - 2,917 - - 2,917Effect of foreign currency exchange differences
- - 689 - - 689
Balance, December 31, 2013 $ 21,012,047 $ 167,726 $ 366,635 $ 17,220 $ - $ 21,563,628
Goodwill
Taishin Bank merged with Dah An Bank through a share swap in February 2002, in which Taishin Bank issued new shares to acquire the total assets and liabilities of Dah An Bank. The difference between the fair value of the new shares issued by Taishin Bank and the fair value of net assets acquired was recognized as goodwill. The unamortized amount as of December 31, 2014 and 2013 was all $884,938 thousand with no material impairment loss noted.
Taishin AMC acquired 40% ownership of Taishin Real-Estate in April 2003. The difference between the purchase price and the net assets acquired was recognized as goodwill. The unamortized amount as of December 31, 2014 and 2013 was all $4,187 thousand.
Taishin Bank acquired the net assets of the 10th Credit Cooperative of Hsin-Chu in October 2004. The acquisition price in excess of the net assets of 10th Credit Cooperative of Hsin-Chu was recognized as goodwill. The unamortized amount as of December 31, 2014 and 2013 was all $267,336 thousand.
In the fourth quarter of 2005 and the second quarter of 2006, Taishin Financial Holding and Taishin Bank acquired 22.81% and 2.58% interest in net assets of Chang Hwa Bank, respectively. The difference between investment cost and fair value of net assets acquired was recognized as goodwill. The related information was as follows:
Acquisition in the Fourth Quarter of 2005
Acquisition in the Second Quarter of 2006
Total price paid by Taishin Financial Holding and subsidiaries $ 36,844,375 $ 3,833,096
Fair value of Chang Hwa Bank’s net assets $ 81,535,281 $ 89,878,748
Less equities attributed to stockholders of preferred stock - A
( 6,275,753 ) ( 6,536,466 )
Equities attributed to stockholders of common stock and preferred stock - B
75,259,528 83,342,282
Multiplied by percentage of ownership interests acquired by Taishin Financial Holding and subsidiaries
22.81% 2.58%
Fair value of Chang Hwa Bank’s net assets acquired by Taishin Financial Holding and subsidiaries
$ 17,168,136 ( 17,168,136 ) $ 2,150,507 ( 2,150,507 )
Difference between investment cost and fair value of net assets acquired (goodwill)
$ 19,676,239 $ 1,682,589
174
The goodwill was amortized over 20 years by the straight-line method and subject to impairment test before December 31, 2005. Goodwill was no longer amortized since January 1, 2006, but was tested for impairment regularly each year. The amortization for 2005 was $245,953 thousand, and unamortized balance was $21,112,875 thousand as of December 31, 2006. In the second quarter of 2007, Taishin Financial Holding sold 2.58% interest in net assets of Chang Hwa Bank originally acquired in the second quarter of 2006, resulting in a decrease in consolidated goodwill amount by $1,682,589 thousand. The unamortized balance was $19,430,286 thousand on December 31, 2013. Taishin Financial Holding did not consolidate Chang Hwa Bank as subsidiary due to the losing of control of Chang Hwa Bank in 2014. Therefore, there was no goodwill at December 31, 2014.
According to February 24, 2010 ARDF Interpretation 2010-0000000061 and the instructions given by the Financial Supervisory Commission, Executive Yuan, ROC, the assets of Chang Hwa Bank which belongs to Taishin Financial Holding and Taishin Bank due to holding interest, are subject to asset impairment test. Taishin Financial Holding then used business valuation models to calculate the recoverable amount used in the impairment test. The recoverable amounts were based on the value in use which is calculated by the estimation of discounted free cash flow generated from the operating assets of Chang Hwa Bank, plus fair market value of non-operating assets minus the value of subordinated corporate bonds. The assumptions of the growth rate to estimate the future cash flows were based on the data issued by domestic and overseas research institutes and the long term growth rate issued by the Directorate General of Budget, Accounting and Statistics (DGBAS). The discount rate was determined by free cash flow. Based on the result of the test, there was no material impairment of assets.
The key assumption of recoverable amount is based on profit and loss prediction. Under the key assumption, Taishin Financial Holding refers to the past performance and predicts that the profit of Chang Hwa Bank in normal operation is consistent with the past experience. Reasonable variations in key assumption are not supposed to make the fair value exceed the recoverable amount.
Taishin Securities Investment Trust merged with IBT Securities Investment Trust Co., Ltd. on December 18, 2010, in which Taishin Securities Investment Trust acquired the total assets and liabilities of IBT Securities Investment Trust Co., Ltd. The difference between the purchase price and the net assets acquired was recognized as goodwill. The unamortized amount as of December 31, 2014 and 2013 was all $425,300 thousand.
Intangible Assets - Customer Value
To increase the number of customers, credit card usage, revolving balance, and increase profits by enhancing the operation efficiency, Taishin Bank acquired the net assets of Chinfon Bank’s credit card business valued at $3,425,031 thousand and the related customer value stated at $672,969 thousand as of the base date, March 6, 2010 for the price of $4,098,000 thousand. The customer value recognized as intangible asset was amortized; the amount of monthly amortization was $11,216 thousand and the unamortized amount was $22,435 thousand and $157,027 thousand as of December 31, 2014 and 2013, respectively.
Taishin Securities Investment Trust acquired all the net assets of IBT Securities Investment Trust Co., Ltd., and the related customer value that amounted to $16,994 thousand as of the base date, December 18, 2010. The amount of monthly amortization was $175 thousand and the unamortized amount was $8,599 thousand and $10,699 thousand as of December 31, 2014 and 2013, respectively.
Intangible Assets - Concession
To maintain the framework of Taishin Financial Holding, it acquired 100% equity interest of Taishin Securities B and the related concession amounted to $68,881 thousand in 2010. The concession value recognized as intangible asset was amortized; the amount of monthly amortization was $1,148 thousand and the unamortized amounts were $3,444 thousand and $17,220 thousand as of December 31, 2014 and 2013, respectively.
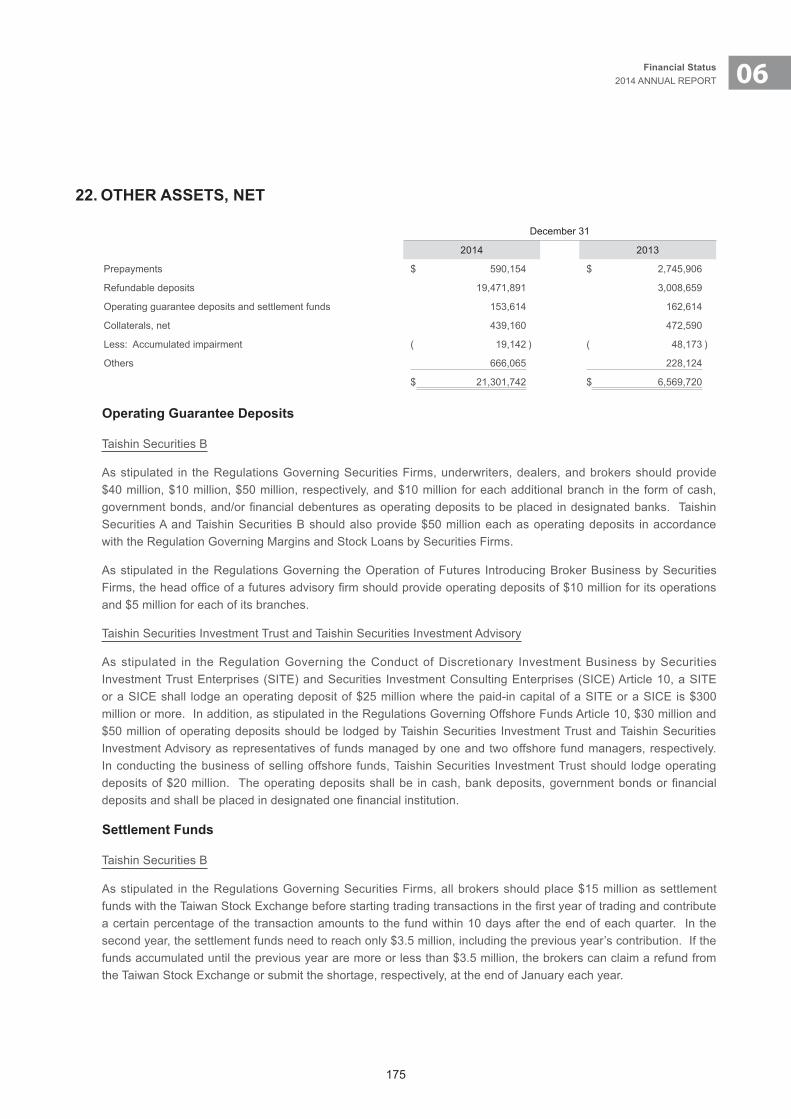
175
06Financial Status2014 ANNUAL REPORT
22.OTHERASSETS,NET
December 31
2014 2013
Prepayments $ 590,154 $ 2,745,906
Refundable deposits 19,471,891 3,008,659
Operating guarantee deposits and settlement funds 153,614 162,614
Collaterals, net 439,160 472,590
Less: Accumulated impairment ( 19,142 ) ( 48,173 )
Others 666,065 228,124
$ 21,301,742 $ 6,569,720
OperatingGuaranteeDeposits
Taishin Securities B
As stipulated in the Regulations Governing Securities Firms, underwriters, dealers, and brokers should provide $40 million, $10 million, $50 million, respectively, and $10 million for each additional branch in the form of cash, government bonds, and/or financial debentures as operating deposits to be placed in designated banks. Taishin Securities A and Taishin Securities B should also provide $50 million each as operating deposits in accordance with the Regulation Governing Margins and Stock Loans by Securities Firms.
As stipulated in the Regulations Governing the Operation of Futures Introducing Broker Business by Securities Firms, the head office of a futures advisory firm should provide operating deposits of $10 million for its operations and $5 million for each of its branches.
Taishin Securities Investment Trust and Taishin Securities Investment Advisory
As stipulated in the Regulation Governing the Conduct of Discretionary Investment Business by Securities Investment Trust Enterprises (SITE) and Securities Investment Consulting Enterprises (SICE) Article 10, a SITE or a SICE shall lodge an operating deposit of $25 million where the paid-in capital of a SITE or a SICE is $300 million or more. In addition, as stipulated in the Regulations Governing Offshore Funds Article 10, $30 million and $50 million of operating deposits should be lodged by Taishin Securities Investment Trust and Taishin Securities Investment Advisory as representatives of funds managed by one and two offshore fund managers, respectively. In conducting the business of selling offshore funds, Taishin Securities Investment Trust should lodge operating deposits of $20 million. The operating deposits shall be in cash, bank deposits, government bonds or financial deposits and shall be placed in designated one financial institution.
Settlement Funds
Taishin Securities B
As stipulated in the Regulations Governing Securities Firms, all brokers should place $15 million as settlement funds with the Taiwan Stock Exchange before starting trading transactions in the first year of trading and contribute a certain percentage of the transaction amounts to the fund within 10 days after the end of each quarter. In the second year, the settlement funds need to reach only $3.5 million, including the previous year’s contribution. If the funds accumulated until the previous year are more or less than $3.5 million, the brokers can claim a refund from the Taiwan Stock Exchange or submit the shortage, respectively, at the end of January each year.
176
All dealers are required to deposit $5 million as settlement fund to the Taiwan Stock Exchange before starting trading activities.
Securities firms are required to deposit $3 million as settlement fund to the Taiwan Stock Exchange before each additional branch starts trading operations, and this deposit will be reduced to $0.5 million from the second year.
As stipulated in GTSM Rules Governing Settlement Funds in the Joint Liability System, except for the $3 million deposited from headquarters, the brokers should continually provide settlement funds based on a specified percentage of the executed value of OTC-listed securities which were traded through GTSM.
As stipulated in GTSM Rules Governing Settlement Reserve in the Electronic Bond Trading System, the headquarters should provide minimum amount of reserve in cash for the participation in the Electronic Bond Trading System.
23.DUETOCENTRALBANKANDBANKS
December 31
2014 2013
Due to Central Bank $ - $ 24,598
Due to other banks 106,330 9,952,204
Deposits transferred from the Postal Bureau 29,973,580 34,551,988
Call loans from other banks 25,226,365 128,082,410
Bank overdraft 697,573 4,050,965
$ 56,003,848 $ 176,662,165
24.COMMERCIALPAPERISSUED
December 31
Guarantee or acceptance institution 2014 2013
China Bills Finance $ 50,000 $ -
Ta Ching Bills Finance 50,000 -
International Bills Finance 50,000 -
Grand Bills Finance 100,000 -
Taiwan Bills Finance 50,000 -
Mega Bills Finance 50,000 -
E.Sun Bank 100,000 -
Industrial Bank of Taiwan 150,000 -
The shanghai Commercial & Savings Bank 50,000 -
Less: Discounts on commercial paper issued ( 611 ) -
$ 649,389 $ -
As of December 31, 2014, the interest rates for commercial paper issued were 1.401%-1.700%.
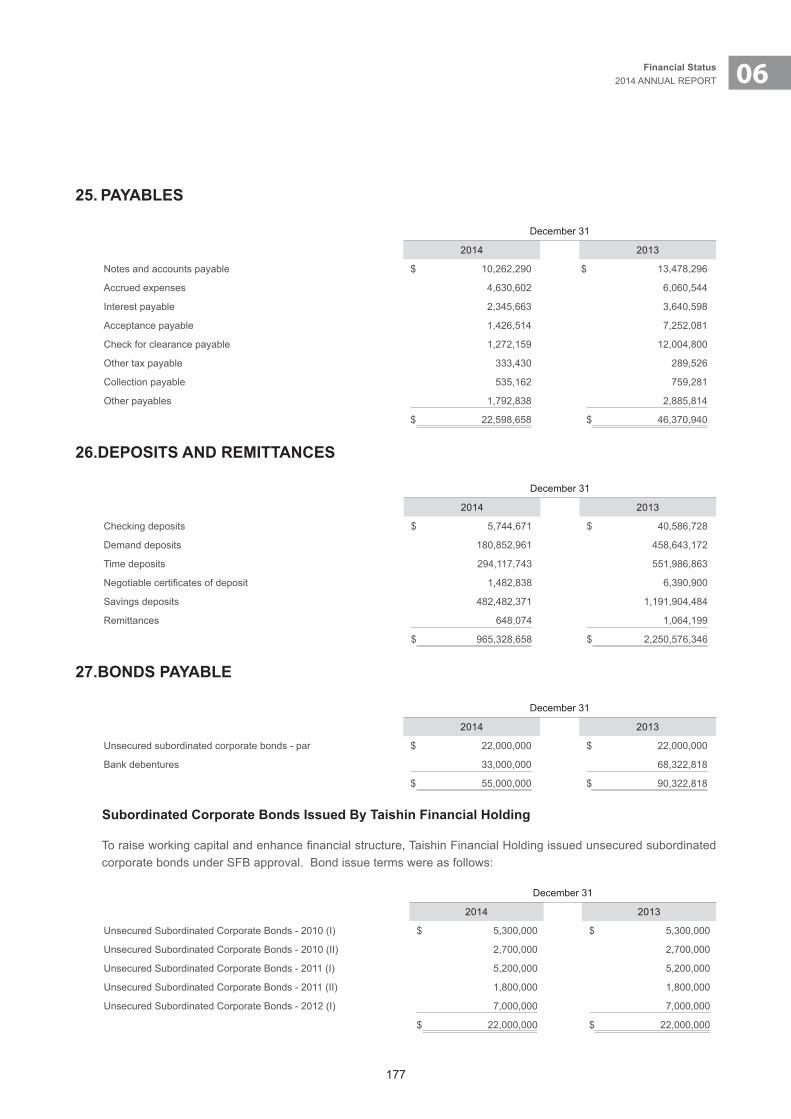
177
06Financial Status2014 ANNUAL REPORT
25.PAYABLES
December 31
2014 2013
Notes and accounts payable $ 10,262,290 $ 13,478,296
Accrued expenses 4,630,602 6,060,544
Interest payable 2,345,663 3,640,598
Acceptance payable 1,426,514 7,252,081
Check for clearance payable 1,272,159 12,004,800
Other tax payable 333,430 289,526
Collection payable 535,162 759,281
Other payables 1,792,838 2,885,814
$ 22,598,658 $ 46,370,940
26.DEPOSITSANDREMITTANCES
December 31
2014 2013
Checking deposits $ 5,744,671 $ 40,586,728
Demand deposits 180,852,961 458,643,172
Time deposits 294,117,743 551,986,863
Negotiable certificates of deposit 1,482,838 6,390,900
Savings deposits 482,482,371 1,191,904,484
Remittances 648,074 1,064,199
$ 965,328,658 $ 2,250,576,346
27.BONDSPAYABLE
December 31
2014 2013
Unsecured subordinated corporate bonds - par $ 22,000,000 $ 22,000,000
Bank debentures 33,000,000 68,322,818
$ 55,000,000 $ 90,322,818
SubordinatedCorporateBondsIssuedByTaishinFinancialHolding
To raise working capital and enhance financial structure, Taishin Financial Holding issued unsecured subordinated corporate bonds under SFB approval. Bond issue terms were as follows:
December 31
2014 2013
Unsecured Subordinated Corporate Bonds - 2010 (I) $ 5,300,000 $ 5,300,000
Unsecured Subordinated Corporate Bonds - 2010 (II) 2,700,000 2,700,000
Unsecured Subordinated Corporate Bonds - 2011 (I) 5,200,000 5,200,000
Unsecured Subordinated Corporate Bonds - 2011 (II) 1,800,000 1,800,000
Unsecured Subordinated Corporate Bonds - 2012 (I) 7,000,000 7,000,000
$ 22,000,000 $ 22,000,000
178
a. Domestic Unsecured Subordinated Corporate Bonds - 2010 (I)1) Issue amount: $5,300,000 thousand.2) Denomination: $10,000 thousand.3) Issue date: December 17, 2010.4) Issue price: 100% of the principal amount of the bonds.5) Maturity: 7 years from the issue date.6) Coupon rate: 2.3% per annum.7) Interest payment: Simple interest per annum from the issue date.8) Redemption on maturity: In cash.9) Other: Taishin Financial Holding should suspend the payment of interest and principal when its capital
adequacy ratio is lower than the lowest limit (100%) until the ratio meets the standards set by relevant authorities (interests could be cumulative and interest of principal in extension period could be calculated at coupon rate).
b. Domestic Unsecured Subordinated Corporate Bonds - 2010 (II)1) Issue amount: $2,700,000 thousand.2) Denomination: $10,000 thousand.3) Issue date: January 27, 2011.4) Issue price: 100% of the principal amount of the bonds.5) Maturity: 7 years from the issue date.6) Coupon rate: “Floating rate of one-year time deposit of Chunghwa Post Co., Ltd.” plus 0.70%.7) Interest payment: Simple interest per annum from the issue date.8) Redemption on maturity: In cash.9) Other: Taishin Financial Holding should suspend the payment of interest and principal when its capital
adequacy ratio is lower than the lowest limit (100%) until the ratio meets the standards set by relevant authorities (interests could be cumulative and interest of principal in extension period could be calculated at coupon rate).
c. Domestic Unsecured Subordinated Corporate Bonds - 2011 (I)1) Issue amount: $5,200,000 thousand.2) Denomination: $50,000 thousand.3) Issue date: August 5, 2011.4) Issue price: 100% of the principal amount of the bonds.5) Maturity: 7 years from the issue date.6) Coupon rate: 2.2% per annum.7) Interest payment: Simple interest per annum from the issue date.8) Redemption on maturity: In cash.9) Other: Taishin Financial Holding should suspend the payment of interest and principal when its capital
adequacy ratio is lower than the lowest limit (100%) until the ratio meets the standards set by relevant authorities (interests could be cumulative and interest of principal in extension period could be calculated at coupon rate).
d. Domestic Unsecured Subordinated Corporate Bonds - 2011 (II)1) Issue amount: $1,800,000 thousand.2) Denomination: $50,000 thousand.3) Issue date: October 5, 2011.4) Issue price: 100% of the principal amount of the bonds.5) Maturity: 7 years from the issue date.6) Coupon rate: 2.2% per annum.7) Interest payment: Simple interest per annum from the issue date.8) Redemption on maturity: In cash.
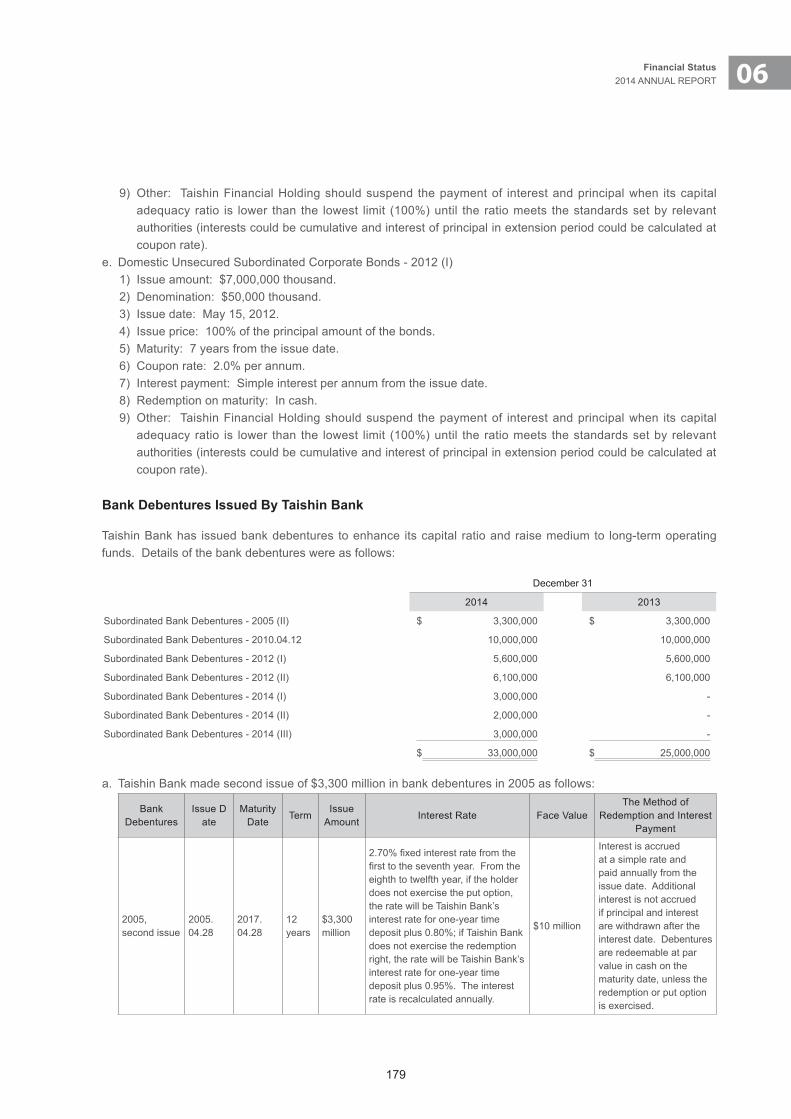
179
06Financial Status2014 ANNUAL REPORT
9) Other: Taishin Financial Holding should suspend the payment of interest and principal when its capital adequacy ratio is lower than the lowest limit (100%) until the ratio meets the standards set by relevant authorities (interests could be cumulative and interest of principal in extension period could be calculated at coupon rate).
e. Domestic Unsecured Subordinated Corporate Bonds - 2012 (I)1) Issue amount: $7,000,000 thousand.2) Denomination: $50,000 thousand.3) Issue date: May 15, 2012.4) Issue price: 100% of the principal amount of the bonds.5) Maturity: 7 years from the issue date.6) Coupon rate: 2.0% per annum.7) Interest payment: Simple interest per annum from the issue date.8) Redemption on maturity: In cash.9) Other: Taishin Financial Holding should suspend the payment of interest and principal when its capital
adequacy ratio is lower than the lowest limit (100%) until the ratio meets the standards set by relevant authorities (interests could be cumulative and interest of principal in extension period could be calculated at coupon rate).
BankDebenturesIssuedByTaishinBank
Taishin Bank has issued bank debentures to enhance its capital ratio and raise medium to long-term operating funds. Details of the bank debentures were as follows:
December 31
2014 2013
Subordinated Bank Debentures - 2005 (II) $ 3,300,000 $ 3,300,000
Subordinated Bank Debentures - 2010.04.12 10,000,000 10,000,000
Subordinated Bank Debentures - 2012 (I) 5,600,000 5,600,000
Subordinated Bank Debentures - 2012 (II) 6,100,000 6,100,000
Subordinated Bank Debentures - 2014 (I) 3,000,000 -
Subordinated Bank Debentures - 2014 (II) 2,000,000 -
Subordinated Bank Debentures - 2014 (III) 3,000,000 -
$ 33,000,000 $ 25,000,000
a. Taishin Bank made second issue of $3,300 million in bank debentures in 2005 as follows:
Bank Debentures
Issue Date
Maturity Date
TermIssue
AmountInterest Rate Face Value
The Method of Redemption and Interest
Payment
2005, second issue
2005.04.28
2017.04.28
12 years
$3,300 million
2.70% fixed interest rate from the first to the seventh year. From the eighth to twelfth year, if the holder does not exercise the put option, the rate will be Taishin Bank’s interest rate for one-year time deposit plus 0.80%; if Taishin Bank does not exercise the redemption right, the rate will be Taishin Bank’s interest rate for one-year time deposit plus 0.95%. The interest rate is recalculated annually.
$10 million
Interest is accrued at a simple rate and paid annually from the issue date. Additional interest is not accrued if principal and interest are withdrawn after the interest date. Debentures are redeemable at par value in cash on the maturity date, unless the redemption or put option is exercised.
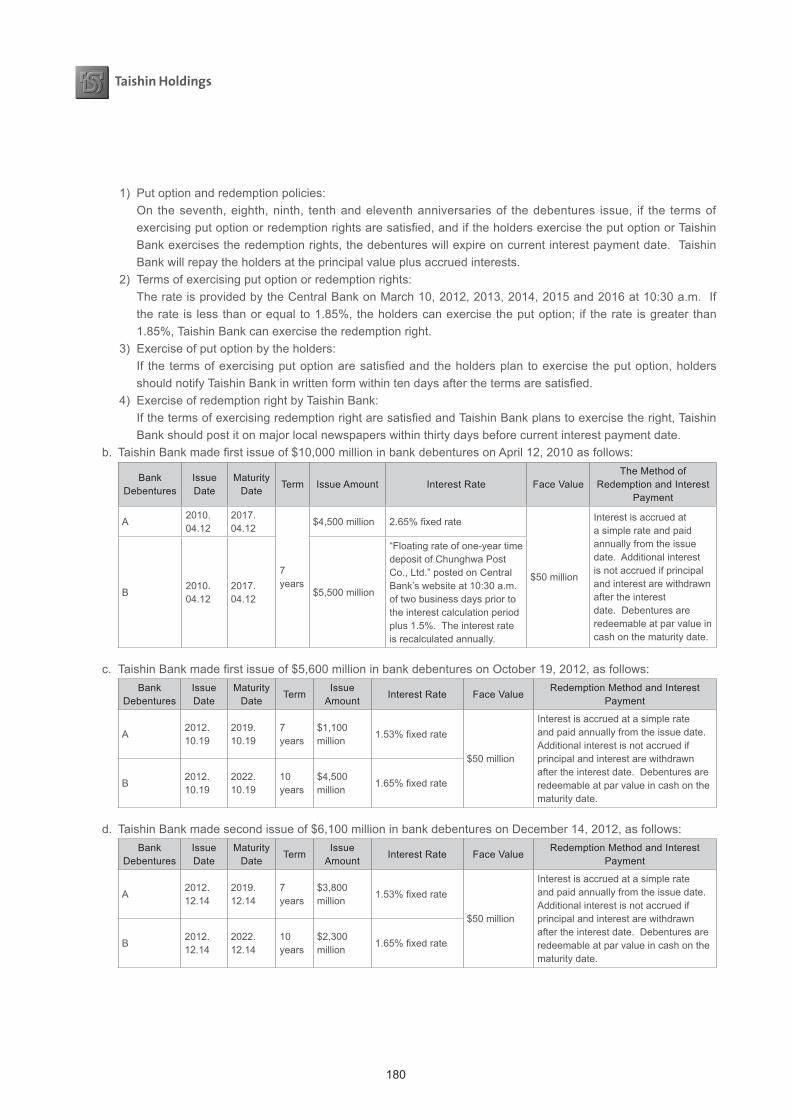
180
1) Put option and redemption policies: On the seventh, eighth, ninth, tenth and eleventh anniversaries of the debentures issue, if the terms of
exercising put option or redemption rights are satisfied, and if the holders exercise the put option or Taishin Bank exercises the redemption rights, the debentures will expire on current interest payment date. Taishin Bank will repay the holders at the principal value plus accrued interests.
2) Terms of exercising put option or redemption rights: The rate is provided by the Central Bank on March 10, 2012, 2013, 2014, 2015 and 2016 at 10:30 a.m. If
the rate is less than or equal to 1.85%, the holders can exercise the put option; if the rate is greater than 1.85%, Taishin Bank can exercise the redemption right.
3) Exercise of put option by the holders: If the terms of exercising put option are satisfied and the holders plan to exercise the put option, holders
should notify Taishin Bank in written form within ten days after the terms are satisfied. 4) Exercise of redemption right by Taishin Bank: If the terms of exercising redemption right are satisfied and Taishin Bank plans to exercise the right, Taishin
Bank should post it on major local newspapers within thirty days before current interest payment date.b. Taishin Bank made first issue of $10,000 million in bank debentures on April 12, 2010 as follows:
Bank Debentures
Issue Date
Maturity Date
Term Issue Amount Interest Rate Face ValueThe Method of
Redemption and Interest Payment
A2010.04.12
2017.04.12
7 years
$4,500 million 2.65% fixed rate
$50 million
Interest is accrued at a simple rate and paid annually from the issue date. Additional interest is not accrued if principal and interest are withdrawn after the interest date. Debentures are redeemable at par value in cash on the maturity date.
B2010.04.12
2017.04.12
$5,500 million
“Floating rate of one-year time deposit of Chunghwa Post Co., Ltd.” posted on Central Bank’s website at 10:30 a.m. of two business days prior to the interest calculation period plus 1.5%. The interest rate is recalculated annually.
c. Taishin Bank made first issue of $5,600 million in bank debentures on October 19, 2012, as follows:Bank
DebenturesIssue Date
Maturity Date
TermIssue
AmountInterest Rate Face Value
Redemption Method and Interest Payment
A2012.10.19
2019.10.19
7 years
$1,100 million
1.53% fixed rate
$50 million
Interest is accrued at a simple rate and paid annually from the issue date. Additional interest is not accrued if principal and interest are withdrawn after the interest date. Debentures are redeemable at par value in cash on the maturity date.
B2012.10.19
2022.10.19
10 years
$4,500 million
1.65% fixed rate
d. Taishin Bank made second issue of $6,100 million in bank debentures on December 14, 2012, as follows:Bank
DebenturesIssue Date
Maturity Date
TermIssue
AmountInterest Rate Face Value
Redemption Method and Interest Payment
A2012.12.14
2019.12.14
7 years
$3,800 million
1.53% fixed rate
$50 million
Interest is accrued at a simple rate and paid annually from the issue date. Additional interest is not accrued if principal and interest are withdrawn after the interest date. Debentures are redeemable at par value in cash on the maturity date.
B2012.12.14
2022.12.14
10 years
$2,300 million
1.65% fixed rate

181
06Financial Status2014 ANNUAL REPORT
e. Taishin Bank made first issue of $3,000 million in unsecured, no-maturity, non-cumulative bank debentures in 2014 as follows:
Bank Debentures
Issue DateMaturity
DateTerm
Issue Amount
Interest Rate Face ValueThe Method of Redemption
and Interest Payment
2014, first issue
2014.04.16
No maturity. (Issuer has redemption right.)
No maturity. (Issuer has redemption right.)
$3,000 million
4.10% fixed interest rate
$50 million
Interest is accrued according to nominal interest rate and actual days, and calculated at a simple rate and paid annually on July 1 from the issue date. Additional interest is not accrued if principal and interest are withdrawn after the interest date. The debentures have no maturity.
1) Dividend distribution Taishin Bank may not distribute the dividend or pay the interest if it had no earnings during the previous
fiscal year and did not distribute common stock dividends. Where the balance of accumulated undistributed earnings after deducting the unamortized loss on the disposal of non-performing loans exceeds the interest payment and such payment does not alter the originally agreed conditions for interest payment, distribution is allowed. The dividends not distributed should not be accumulated or deferred.
Taishin Bank shall defer the payment of principal and interest if the ratio of regulatory capital to risk-weighted assets does not meet the minimum requirements in Regulations Governing the Capital Adequacy and Capital Category of Banks Paragraph 1 of Article 5; the deferred payment of principal or interest shall not be imposed further with interest.
2) Redemption policy After five years of issuance, if the ratio of regulatory capital to risk-weighted assets after redemption will
meet the minimum rate and the redemption has an approval from the competent authority, the debts may be redeemed earlier by Taishin Bank.
f. Taishin Bank made second issue of $2,000 million in unsecured, no-maturity, non-cumulative bank debentures in 2014 as follows:
Bank Debentures
Issue DateMaturity
DateTerm
Issue Amount
Interest Rate Face ValueThe Method of Redemption
and Interest Payment
2014, second issue
2014.05.09
No maturity. (Issuer has redemption right.)
No maturity. (Issuer has redemption right.)
$2,000 million
4.10% fixed interest rate
$50 million
Interest is accrued according to nominal interest rate and actual days, and calculated at a simple rate and paid annually on July 1 from the issue date. Additional interest is not accrued if principal and interest are withdrawn after the interest date. The debentures have no maturity.
1) Dividend distribution Taishin Bank may not distribute the dividend or pay the interest if it had no earnings during the previous
fiscal year and did not distribute common stock dividends. Where the balance of accumulated undistributed earnings after deducting the unamortized loss on the disposal of non-performing loans exceeds the interest payment and such payment does not alter the originally agreed conditions for interest payment, distribution is allowed. The dividends not distributed should not be accumulated or deferred.
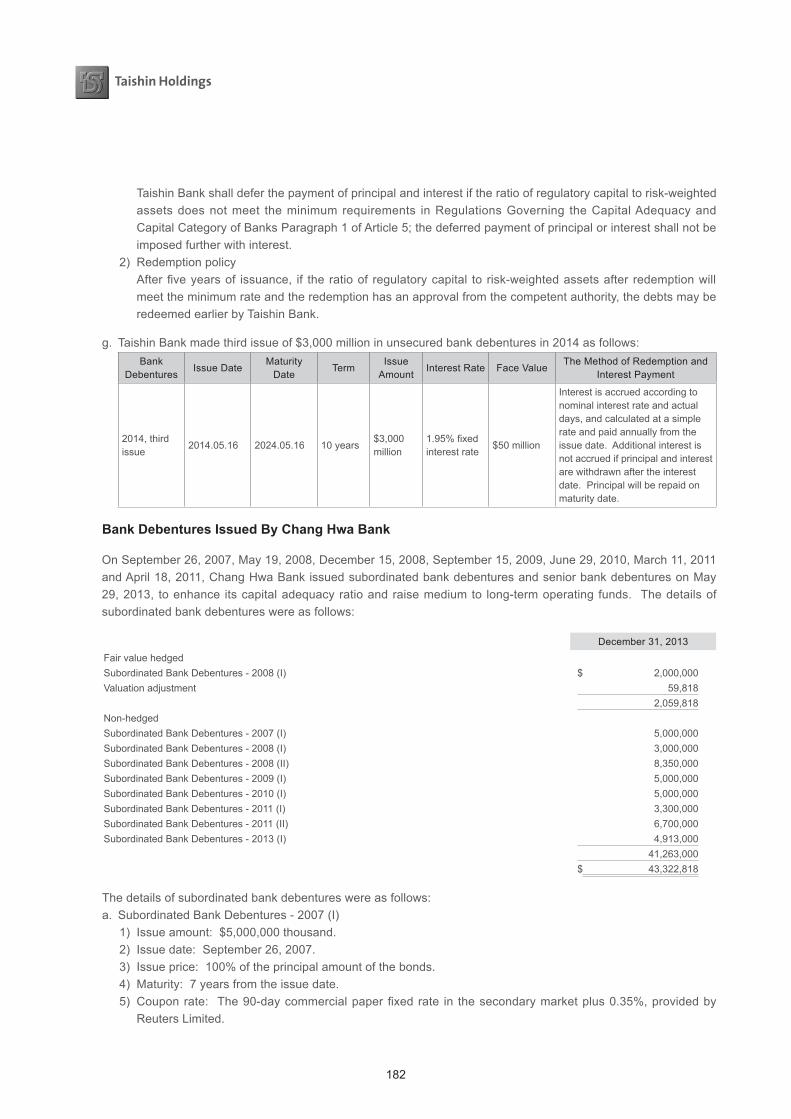
182
Taishin Bank shall defer the payment of principal and interest if the ratio of regulatory capital to risk-weighted assets does not meet the minimum requirements in Regulations Governing the Capital Adequacy and Capital Category of Banks Paragraph 1 of Article 5; the deferred payment of principal or interest shall not be imposed further with interest.
2) Redemption policy After five years of issuance, if the ratio of regulatory capital to risk-weighted assets after redemption will
meet the minimum rate and the redemption has an approval from the competent authority, the debts may be redeemed earlier by Taishin Bank.
g. Taishin Bank made third issue of $3,000 million in unsecured bank debentures in 2014 as follows:Bank
DebenturesIssue Date
Maturity Date
TermIssue
AmountInterest Rate Face Value
The Method of Redemption and Interest Payment
2014, third issue
2014.05.16 2024.05.16 10 years$3,000 million
1.95% fixed interest rate
$50 million
Interest is accrued according to nominal interest rate and actual days, and calculated at a simple rate and paid annually from the issue date. Additional interest is not accrued if principal and interest are withdrawn after the interest date. Principal will be repaid on maturity date.
BankDebenturesIssuedByChangHwaBank
On September 26, 2007, May 19, 2008, December 15, 2008, September 15, 2009, June 29, 2010, March 11, 2011 and April 18, 2011, Chang Hwa Bank issued subordinated bank debentures and senior bank debentures on May 29, 2013, to enhance its capital adequacy ratio and raise medium to long-term operating funds. The details of subordinated bank debentures were as follows:
December 31, 2013Fair value hedgedSubordinated Bank Debentures - 2008 (I) $ 2,000,000Valuation adjustment 59,818
2,059,818Non-hedgedSubordinated Bank Debentures - 2007 (I) 5,000,000Subordinated Bank Debentures - 2008 (I) 3,000,000Subordinated Bank Debentures - 2008 (II) 8,350,000Subordinated Bank Debentures - 2009 (I) 5,000,000Subordinated Bank Debentures - 2010 (I) 5,000,000Subordinated Bank Debentures - 2011 (I) 3,300,000Subordinated Bank Debentures - 2011 (II) 6,700,000Subordinated Bank Debentures - 2013 (I) 4,913,000
41,263,000 $ 43,322,818
The details of subordinated bank debentures were as follows:a. Subordinated Bank Debentures - 2007 (I)
1) Issue amount: $5,000,000 thousand.2) Issue date: September 26, 2007.3) Issue price: 100% of the principal amount of the bonds.4) Maturity: 7 years from the issue date.5) Coupon rate: The 90-day commercial paper fixed rate in the secondary market plus 0.35%, provided by
Reuters Limited.
183
06Financial Status2014 ANNUAL REPORT
6) Interest payment: Interest payable annually from the issue date.b. Subordinated Bank Debentures - 2008 (I)
1) Issue amount: $5,000,000 thousand.2) Issue date: May 19, 2008.3) Issue price: 100% of the principal amount of the bonds.4) Maturity: 7 years from the issue date.5) Coupon rate: 3.10 % per annum.6) Interest payment: Interest payable annually from the issue date.7) Other: To avoid loss on fair value changes of its fixed-rate borrowings, Chang Hwa Bank engaged in interest
rate swaps derivative as hedging instruments under derivative financial instruments for hedging.c. Subordinated Bank Debentures - 2008 (II)
1) Issue amount: $8,350,000 thousand.2) Issue date: December 15, 2008.3) Issue price: 100% of the principal amount of the bonds.4) Maturity: 7 years from the issue date.5) Coupon rate: 3.05% per annum.6) Interest payment: Interest payable annually from the issue date.
d. Subordinated Bank Debentures - 2009 (I)1) Issue amount: $5,000,000 thousand.2) Issue date: September 15, 2009.3) Issue price: 100% of the principal amount of the bonds.4) Maturity: 7 years from the issue date.5) Coupon rate: 2.30% per annum.6) Interest payment: Interest payable annually from the issue date.
e. Subordinated Bank Debentures - 2010 (I)1) Issue amount: $5,000,000 thousand.2) Issue date: June 29, 2010.3) Issue price: 100% of the principal amount of the bonds.4) Maturity: None.5) Coupon rate: From first to tenth year: 3.15% per annum.After tenth year: 4.15% per annum.6) Interest payment: Interest payable annually from the issue date.
f. Subordinated Bank Debentures - 2011 (I)1) Issue amount: $3,300,000 thousand and divided into Bank Debenture A $2,200,000 thousand and Bank
Debenture B $1,100,000 thousand.2) Issue date: March 11, 2011.3) Issue price: 100% of the principal amount of the bonds.4) Maturity: Bank Debenture A matures 7 years from the issue date and Bank Debenture B matures 10 years
from the issue date.5) Coupon rate: 1.65% per annum for Bank Debenture A and 1.72% per annum for Bank Debenture B.6) Interest payment: Interest payable annually from the issue date.
g. Subordinated Bank Debentures - 2011 (II)1) Issue amount: $6,700,000 thousand.2) Issue date: April 18, 2011.3) Issue price: 100% of the principal amount of the bonds.4) Maturity: 10 years from the issue date.5) Coupon rate: The 90-day commercial paper fixed rate in the secondary market plus 0.20%, provided by
Reuters Limited.6) Interest payment: Interest payable annually from the issue date.
184
h. The details of senior bank debentures 2013 (I) were as follows:1) Issue amount: RMB1,000,000 thousand.2) Issue date: May 29, 2013.3) Issue price: 100% of the principal amount of the bonds.4) Maturity: 3 years from the issue date.5) Coupon rate: Fixed rate 2.90% per annum. 6) Interest payment: Interest payable annually from the issue date.
28.OTHERBORROWINGS
December 31
2014 2013
Short-term unsecured borrowings $ 5,999,223 $ 2,156,539
Long-term borrowings 236,218 130,776
$ 6,235,441 $ 2,287,315
As of December 31, 2014 and 2013, the interest rates on short-term unsecured borrowings ranged from 0.97% to 6.72% and from 1.99% to 2.76%, respectively.
As of December 31, 2014 and 2013, the interest rate of long-term borrowings ranged from 2.73% to 6.16% and 6.46%, respectively.
29.RESERVEFORLIABILITIES
December 31
2014 2013
Reserve for employee benefits $ 288,439 $ 3,663,483
Reserve for guarantee liabilities 227,393 451,131
Other reserves 278,182 308,089
$ 794,014 $ 4,422,703
Reserve for Guarantee Liabilities
Other Reserves Total
Balance, January 1, 2014 $ 451,131 $ 308,089 $ 759,220
Provision 227,895 264 228,159
Transfers of reserve for guarantee liabilities 10,000 - 10,000
Payment - ( 30,171 ) ( 30,171 )
Combined individual effects ( 462,207 ) - ( 462,207 )
Exchange differences 574 - 574
Balance, December 31, 2014 $ 227,393 $ 278,182 $ 505,575
Balance, January 1, 2013 $ 456,450 $ 350,488 $ 806,938
Provision (reverse) ( 4,157 ) 194 ( 3,963 )
Transfers of reserve for guarantee liabilities ( 410 ) - ( 410 )
Write-off ( 1,050 ) - ( 1,050 )
Payment - ( 42,593 ) ( 42,593 )
Exchange differences 298 - 298
Balance, December 31, 2013 $ 451,131 $ 308,089 $ 759,220
185
06Financial Status2014 ANNUAL REPORT
Referring to the result of the review of structured notes by the Association of Banks and based on other cases, Taishin Bank has provided reserve for compensation of consigned structured notes issued by international institutions.
30.OTHERFINANCIALLIABILITIES
December 31
2014 2013
Principal of structured products $ 51,892,631 $ 31,484,193
Appropriations for loan fund 660,908 1,023,936
Lease payable - 81,017
Gold account 190,730 214,357
$ 52,744,269 $ 32,803,503
31.OTHERLIABILITIES
December 31
2014 2013
Unearned revenue $ 383,901 $ 888,536
Unearned interest 398,979 297,102
Guarantee deposits 407,691 1,706,699
Deferred income 1,060,065 1,107,335
Temporary credits 666,198 286,028
Others 68,232 136,627
$ 2,985,066 $ 4,422,327
32.POST-EMPLOYMENTBENEFITPLANS
DefinedContributionPlans
The Group adopted a pension plan under the Labor Pension Act (the “LPA”), which is a state-managed defined contribution plan. Based on the LPA, the Group makes monthly contributions to employees’ individual pension accounts at 6% of monthly salaries and wages.
DefinedBenefitPlans
The Group also have defined benefit plan under the Labor Standards Law (the “LSL”). Under the LSL, pension benefits are calculated on the basis of the length of service and average monthly salaries of six months before retirement. The Group contributes amounts equal to 2% to 15% of total monthly salaries and wages to a pension fund administered by the pension fund monitoring committee. Pension contributions are deposited in the Bank of Taiwan in the committee’s name.
The plan assets are invested in domestic (foreign) equity and debt securities, bank deposits, etc. The investment is conducted at the discretion of Bureau of Labor Funds, Ministry of Labor or under the mandated management. However, in accordance with Enforcement Rules of the Labor Pension Act, the return generated by employees’ pension contribution should not be below the interest rate for a 2-year time deposit with local banks.
186
a. The principal assumptions used for the purposes of actuarial valuations were as follows:
Valuation Date
2014 2013
Discount rate used in determining present values 1.625%~2.00% 1.750%~2.125%
Expected rate of return on plan assets 1.625%~2.00% 1.75%~2.00%
Long-term expected rate of average salary increase 2.00%~3.00% 2.00%~3.00%
The assessment of the overall expected rate of return was based on historical return trends and analysts’ predictions of the market for the asset over the life of the related obligation, by reference to the aforementioned use of the plan assets and the impact of the related minimum return.
Amounts recognized in profit or loss in respect of these defined benefit plans are as follows:
For the Year Ended December 31
2014 2013
Current service cost $ 22,687 $ 290,968
Interest cost 32,555 152,711
Expected return on plan assets ( 29,117 ) ( 124,166 )
$ 26,125 $ 319,513
Actuarial gains and losses recognized in other comprehensive income for the years ended December 31, 2014 and 2013 was $64,674 thousand and $183,859 thousand, respectively. The cumulative amount of actuarial gains and losses recognized in other comprehensive income as of December 31, 2014 and 2013 was $568,857 thousand and $504,183 thousand, respectively.
The amount included in the consolidated balance sheet arising from the Group’s obligation in respect of its defined benefit plans was as follows:
December 31
2014 2013
Present value of funded defined benefit obligation ($ 1,841,446 ) ($ 10,296,194 )
Fair value of plan assets 1,575,097 7,924,230
Deficit ( 266,349 ) ( 2,371,964 )
Prepaid pension cost ( 22,090 ) ( 14,477 )
Others - ( 8,747 )
Net liability arising from defined benefit obligation ($ 288,439 ) ($ 2,395,188 )
Movements in the present value of the defined benefit obligations were as follows:
For the Year Ended December 31
2014 2013
Opening defined benefit obligation $ 1,743,909 $ 10,221,094
Current service cost 22,687 290,968
Interest cost 32,555 152,711
Actuarial losses (gains) 84,495 196,682
Liabilities extinguished on settlements - ( 325,545 )
Benefits paid ( 42,201 ) ( 239,716 )
Closing defined benefit obligation $ 1,841,446 $ 10,296,194
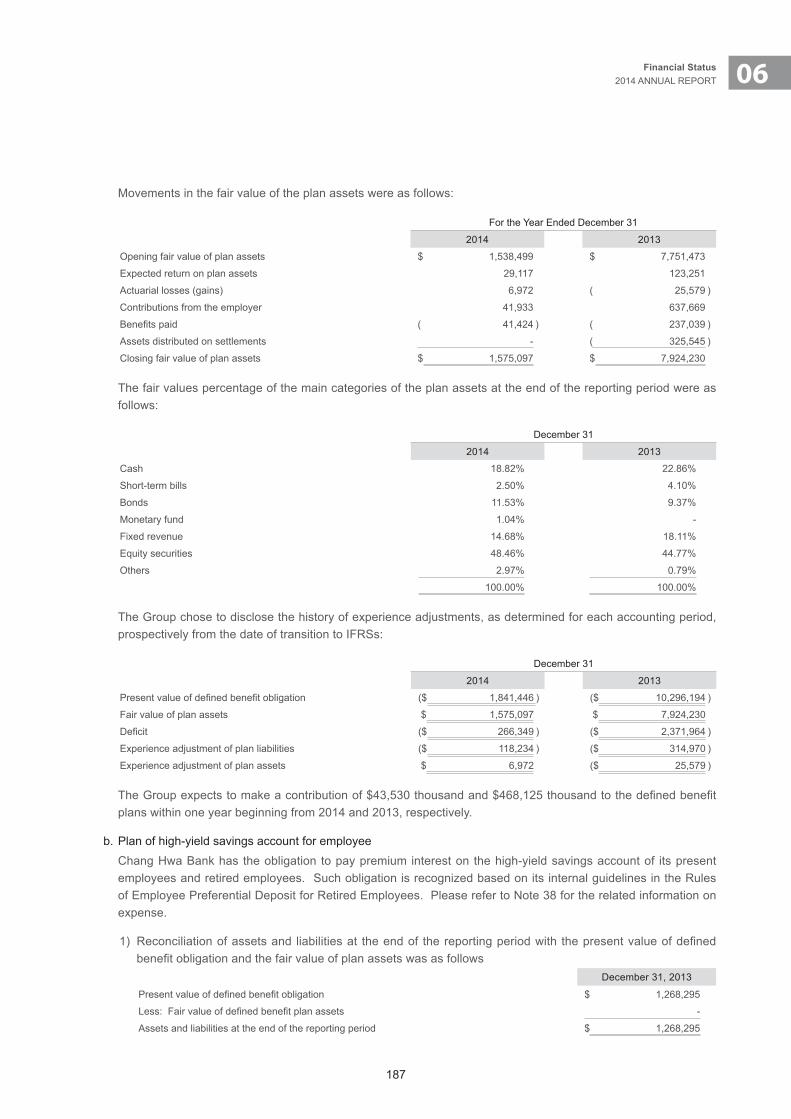
187
06Financial Status2014 ANNUAL REPORT
Movements in the fair value of the plan assets were as follows:
For the Year Ended December 31
2014 2013
Opening fair value of plan assets $ 1,538,499 $ 7,751,473
Expected return on plan assets 29,117 123,251
Actuarial losses (gains) 6,972 ( 25,579 )
Contributions from the employer 41,933 637,669
Benefits paid ( 41,424 ) ( 237,039 )
Assets distributed on settlements - ( 325,545 )
Closing fair value of plan assets $ 1,575,097 $ 7,924,230
The fair values percentage of the main categories of the plan assets at the end of the reporting period were as follows:
December 31
2014 2013
Cash 18.82% 22.86%
Short-term bills 2.50% 4.10%
Bonds 11.53% 9.37%
Monetary fund 1.04% -
Fixed revenue 14.68% 18.11%
Equity securities 48.46% 44.77%
Others 2.97% 0.79%
100.00% 100.00%
The Group chose to disclose the history of experience adjustments, as determined for each accounting period, prospectively from the date of transition to IFRSs:
December 31
2014 2013
Present value of defined benefit obligation ($ 1,841,446 ) ($ 10,296,194 )
Fair value of plan assets $ 1,575,097 $ 7,924,230
Deficit ($ 266,349 ) ($ 2,371,964 )
Experience adjustment of plan liabilities ($ 118,234 ) ($ 314,970 )
Experience adjustment of plan assets $ 6,972 ($ 25,579 )
The Group expects to make a contribution of $43,530 thousand and $468,125 thousand to the defined benefit plans within one year beginning from 2014 and 2013, respectively.
b. Plan of high-yield savings account for employee Chang Hwa Bank has the obligation to pay premium interest on the high-yield savings account of its present employees and retired employees. Such obligation is recognized based on its internal guidelines in the Rules of Employee Preferential Deposit for Retired Employees. Please refer to Note 38 for the related information on expense.
1) Reconciliation of assets and liabilities at the end of the reporting period with the present value of defined benefit obligation and the fair value of plan assets was as follows
December 31, 2013
Present value of defined benefit obligation $ 1,268,295
Less: Fair value of defined benefit plan assets -
Assets and liabilities at the end of the reporting period $ 1,268,295
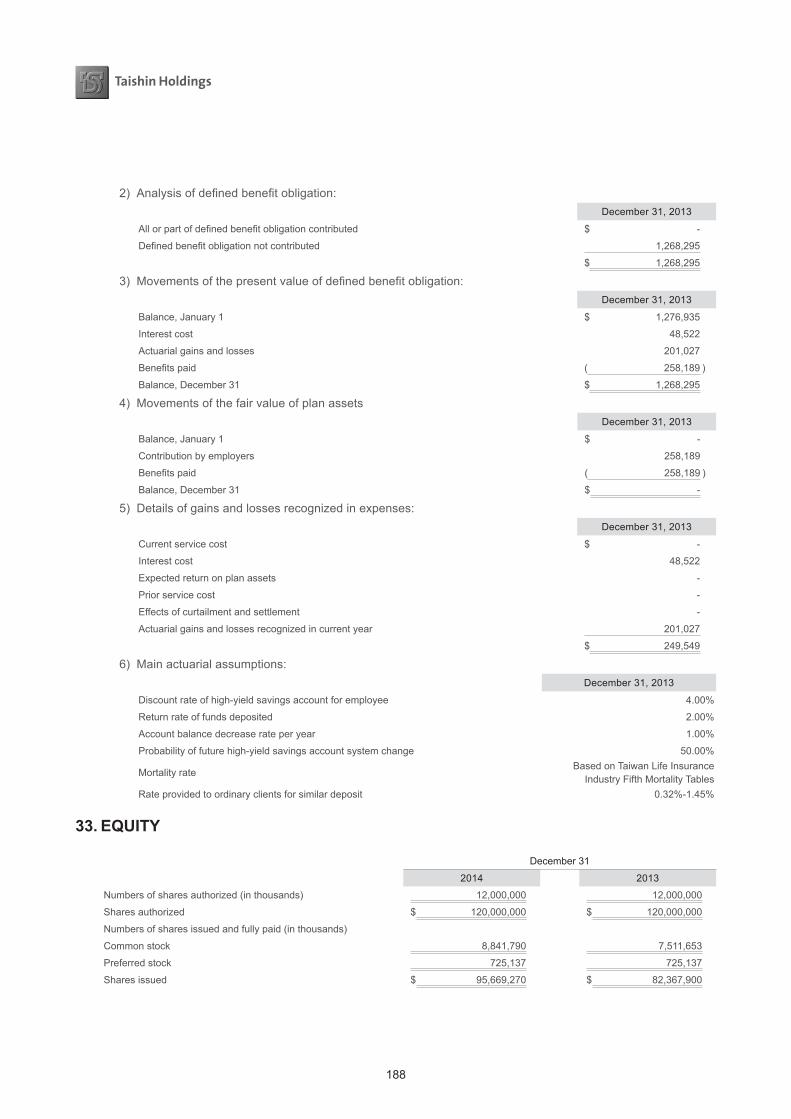
188
2) Analysis of defined benefit obligation:December 31, 2013
All or part of defined benefit obligation contributed $ -
Defined benefit obligation not contributed 1,268,295
$ 1,268,295
3) Movements of the present value of defined benefit obligation:December 31, 2013
Balance, January 1 $ 1,276,935
Interest cost 48,522
Actuarial gains and losses 201,027
Benefits paid ( 258,189 )
Balance, December 31 $ 1,268,295
4) Movements of the fair value of plan assetsDecember 31, 2013
Balance, January 1 $ -
Contribution by employers 258,189
Benefits paid ( 258,189 )
Balance, December 31 $ -
5) Details of gains and losses recognized in expenses:December 31, 2013
Current service cost $ -
Interest cost 48,522
Expected return on plan assets -
Prior service cost -
Effects of curtailment and settlement -
Actuarial gains and losses recognized in current year 201,027
$ 249,549
6) Main actuarial assumptions:December 31, 2013
Discount rate of high-yield savings account for employee 4.00%
Return rate of funds deposited 2.00%
Account balance decrease rate per year 1.00%
Probability of future high-yield savings account system change 50.00%
Mortality rateBased on Taiwan Life Insurance
Industry Fifth Mortality Tables Rate provided to ordinary clients for similar deposit 0.32%-1.45%
33.EQUITY
December 31
2014 2013
Numbers of shares authorized (in thousands) 12,000,000 12,000,000
Shares authorized $ 120,000,000 $ 120,000,000
Numbers of shares issued and fully paid (in thousands)
Common stock 8,841,790 7,511,653
Preferred stock 725,137 725,137
Shares issued $ 95,669,270 $ 82,367,900
189
06Financial Status2014 ANNUAL REPORT
CommonStockandPreferredStock
As of December 31, 2014 and 2013, Taishin Financial Holding’s authorized capital was all $120,000,000 thousand (12,000,000 thousand shares); share issued was all 9,566,927 thousand shares, divided into 8,841,790 thousand common shares and 725,137 thousand preferred shares at NT$10.00 par value. Details of outstanding capital stock as of December 31, 2014 were as follows:
Common Stock Preferred Stock Total
First share swap $ 23,000,000 $ - $ 23,000,000
Second share swap 13,316,236 - 13,316,236
Capital infusion with cash 13,222,223 - 13,222,223
Convertible bonds converted to common stock 5,989,867 - 5,989,867
Issue of preferred stock - D - 7,777,778 7,777,778
Stock dividends distributed 39,093,038 - 39,093,038
Less: Cancellation of treasury stock ( 2,733,505 ) - ( 2,733,505 )
Less: Capital reduction to recover loss ( 3,864,802 ) ( 526,410 ) ( 4,391,212 )
Employee stock options converted to new shares 394,845 - 394,845
Shares issued $ 88,417,902 $ 7,251,368 $ 95,669,270
On February 18, 2002, Taishin Financial Holding issued 2,300,000 thousand shares of common stock of Taishin Bank through a share swap at a 1:1 ratio to exchange for the whole common stock owned by Taishin Bank’s stockholders after consolidation.
As of December 31, 2002, Taishin Financial Holding issued 1,331,624 thousand common shares to acquire all the issued common stocks of Taishin Securities A and Taishin Bills Finance through share swaps at ratios of 1:1.2 and 1:1.3, respectively, with “1” representing Taishin Financial Holding.
On March 22, 2006, Taishin Financial Holding issued through private placement common stock totaling $10,000,000 thousand for 555,556 thousand shares at NT$18.00 per share. The rights and obligations are the same as those of the common stock outstanding. The mentioned common stock has been published in open market by the approval of FSC on May 17, 2011.
On December 27, 2006, Taishin Financial Holding issued through private placement common stock totaling $4,000,000 thousand for 266,667 thousand shares at NT$15.00 per share. The rights and obligations are the same as those of the common stock outstanding. The mentioned common stock has been published in open market by the approval of FSC on May 17, 2011.
Taishin Financial Holding has proposed to effect capital reduction by cancelling 386,480 thousand outstanding common shares (capital reduction ratio 6.7681%) on December 4, 2009.
On December 31, 2013, Taishin Financial Holding’s board of directors resolved to issue 500,000 thousand ordinary shares, with a par value of NT$10 each, for consideration of NT$12 per share. On January 17, 2014, the above transaction was approved by the FSC, and the subscription base date was set by board of directors at April 14, 2014.
Taishin Financial Holding’s shareholders had resolved the transfer of $7,987,008 thousand and $6,139,767 thousand and of earnings to common stock in the shareholders’ meeting on June 6, 2012 and June 21, 2013. The ex-dividend date was August 18, 2012 and August 25, 2013.
190
Taishin Financial Holding’s group capital adequacy ratio was 122.70% and 127.87% as of December 31, 2014 and 2013.
On March 22, 2006, Taishin Financial Holding issued via private placement preferred stock - D totaling 777,778 thousand shares at NT$18 per share in the total amount of $14,000,000 thousand. The stock dividends are fixed at 6.5% per annum based on issue price, participating, but non-cumulative. Taishin Financial Holding’s shareholders should approve the financial statements and appropriation of earnings every year. Then, the Board of Directors set the ex-dividend date of preferred stock - D. Preferred stock - D has preference over common stock but inferior to preferred stock - B and preferred stock - C. The stockholders of preferred stock - D may request to convert the preferred stock - D to common stock at ratio of 1:1 three years from the issue date. Taishin Financial Holding may redeem part or all outstanding preferred stock - D at issue price. Taishin Financial Holding has proposed to effect capital reduction by cancelling 52,641 thousand outstanding preferred shares on December 4, 2009.
Advance receipts for common stock
As of December 31, 2014, advance receipts for capital stock amounted to $111,339 thousand, representing the proceeds of the exercise of employee stock options to convert into 10,789 thousand shares of common stock, of which the registration of the conversion has not been completed.
Capital surplus
The Company recognized a capital surplus of $10,640,840 thousand, in which there’s a part of investees’ unappropriated retained earnings totaled $850,198 thousand. In addition to regulations, Financial Holding Company Act No. 47 (d) stipulates that the appropriation is not limited by company Act No. 241 (a). Furthermore, the capital surplus from preferred stock - D issued in excess of par cannot expand its capital during the issuance of preferred stock - D.
The capital surplus from shares issued in excess of par and donations may be used to offset a deficit; in addition, when the company has no deficit, such capital surplus may be distributed as cash dividends or transferred to capital, limited to a certain percentage of the company’s paid-in capital and once a year.
Retained earnings and dividend policy
Taishin Financial Holding’s Articles of Incorporation provide that annual net income, after payment of taxes and offset of any accumulated deficit should be appropriated in the following order:
a. Legal reserve and, if needed, special reserve;
b. Dividends to holders of preferred stock;
c. 0.01% of the remainder as bonuses to employees and 1% of the remainder as remuneration to directors and supervisors;
d. The remainder, together with the unappropriated retained earnings of previous years, as dividends.
Taishin Financial Holding’s Board of Directors should prepare a proposal on above item (d) for approval in the stockholders’ regular annual meeting. However, under the requirements of the MOF, if the group’s capital adequacy ratio is less than 100%, distributions of dividends may also be restricted.
For the years ended December 31, 2014 and 2013, the bonus to employees was $45 thousand and $1,147 thousand, respectively, and the remuneration to directors and supervisors was $4,503 thousand and $114,698
191
06Financial Status2014 ANNUAL REPORT
thousand, respectively. The bonus to employees and remuneration to directors, and supervisors were calculated based on the rates described above (percentage of net income net of the bonus to employees, directors, and supervisors) and based on the Articles of Incorporation. If the actual amounts subsequently resolved by the shareholders differ from the proposed amounts, the differences are recorded in the year of shareholders’ resolution as a change in accounting estimate. If bonus shares are resolved to be distributed to employees, the number of shares is determined by dividing the amount of bonus by the closing price (after considering the effect of cash and stock dividends) of the shares of the day preceding the shareholders’ meeting.
Under Rule No. 1010012865 issued by the FSC on April 6, 2012 and the directive titled “Questions and Answers for Special Reserves Appropriated Following Adoption of IFRSs”, on the first-time adoption of IFRSs, a company should appropriate to a special reserve the total amount of unrealized revaluation increment and cumulative translation differences (gains) transferred to retained earnings as a result of the Company’s use of exemptions under IFRS 1. However, at the date of transition to IFRSs, if the increase in retained earnings that resulted from all IFRSs adjustments is not enough, i.e. smaller than the total revaluation and translation differences, only the increase in retained earnings that resulted from all IFRSs adjustments is appropriated to special reserve. The special reserve appropriated as above may be reversed to retained earnings in proportion to the usage, disposal or reclassification of the related assets and thereafter distributed. The special reserve appropriated at the first-time adoption of IFRSs may be used to offset deficit in subsequent years. No appropriation of earnings shall be made until the aforementioned special reserve used to offset deficit shall have been appropriated back in subsequent years when the Company has earnings, unless the requirement to appropriate for special reserve is eliminated.
Appropriation of earnings to legal reserve shall be made until the legal reserve equals the corporation’s paid-in capital. Legal reserve may be used to offset deficit. If the corporation has no deficit and the legal reserve has exceeded 25% of the corporation’s paid-in capital, the excess may be transferred to capital or distributed in cash.
Except for non-ROC resident shareholders, all shareholders receiving dividends are allowed a tax credit equal to their proportionate share of the income tax paid by Taishin Financial Holding.
The appropriations of earnings for 2013 and 2012 had been approved in the shareholders’ meetings on June 6, 2014 and June 21, 2013. Where the actual number of common shares outstanding has changed because of exercise of employee share options, the actual appropriation is as follows:
Appropriation of Earnings Dividend Per Share (NT$)
For Year 2013 For Year 2012 For Year 2013 For Year 2012
Legal reserve $ 1,375,537 $ 997,049 $ - $ -
Preferred stock - C cash dividends - 388,729 - -
Preferred stock - D cash dividends 969,516 910,000 - -
Common stock cash dividends 3,423,308 1,534,942 0.42575 0.22273
Common stock dividends 7,987,008 6,139,767 0.99334 0.89092
The bonus to employees and remuneration to directors and supervisors for 2013 and 2012, which were approved by the shareholders in their meetings on June 6, 2014 and June 21, 2013, respectively, were as follows:
For Year 2013 For Year 2012
Bonus to employees $ 1,147 $ 767
Remuneration to directors and supervisors 114,698 76,747

192
The appropriations of earnings for 2012 were proposed according to Taishin Financial Holding’s financial statements for the year ended December 31, 2013, which were prepared in accordance with the Regulations Governing the Preparation of Financial Statements by Financial Holding Companies and ROC GAAP, and by reference to the balance sheet for the year ended December 31, 2012, which was prepared in accordance with the Regulations Governing the Preparation of Financial Statements by Financial Holding Companies (revised) and IFRSs.
There were no differences between the approved amounts of the bonus to employees and the remuneration to directors and supervisors and the accrual amounts reflected in the financial statements for the year ended December 31, 2013 and 2012.
Information about the earnings appropriation, the bonus to employees, directors and supervisors proposed by Taishin Financial Holding’s Board of Directors and shareholders’ meeting is available at the Market Observation Post System website of the Taiwan Stock Exchange.
Special reserves
The increase in retained earnings that resulted from all IFRSs adjustments was not enough, i.e. smaller than the total revaluation and translation differences; therefore, Taishin Financial Holding appropriated to special reserve the amount of $220,376 thousand, the increase in retained earnings that resulted from all IFRSs adjustments on transition to IFRSs.
Other equity items
a. Exchange differences on translation of foreign financial statements
For the Year Ended December 31
2014 2013
Beginning balance $ 68,688 ($ 58,334 )
Exchange differences arising on translating the net assets of foreign operations
82,220 133,355
Income tax relating to exchange differences arising on translating the net assets of foreign operations - ( 6,333 )
Ending balance $ 150,908 $ 68,688
b. Unrealized gains (losses) on available-for-sale financial assets
For the Year Ended December 31
2014 2013
Beginning balance $ 875,995 $ 2,458,941
Unrealized gains (losses) on available-for-sale financial assets 466,792 686,197
Income tax relating to unrealized gains (losses) on available-for-sale financial assets
1,054 334,056
Cumulative gains (losses) reclassified to profit or loss on sale of available-for-sale financial assets
( 1,149,920 ) ( 2,603,199 )
Ending balance $ 193,921 $ 875,995
193
06Financial Status2014 ANNUAL REPORT
Non-controlling interests
For the Year Ended December 31
2014 2013
Beginning balance $ 86,857,655 $ 81,127,472
Attributable to non-controlling interests
Net income 8,023,363 6,737,375
Exchange differences on translation of foreign financial statements 271,207 217,894
Income tax relating to exchange differences arising on translating the foreign operations
( 59,913 ) ( 21,756 )
Unrealized gains (losses) on available-for-sale financial assets 174,848 ( 513,499 )
Income tax relating to unrealized gains (losses) on available-for-sale financial assets
943 ( 980 )
Actuarial gain (loss) on defined benefit plans 11 ( 156,505 )
Income tax related to actuarial gain (loss) 3 26,601
Non-controlling interest relating to outstanding vested share options held by the employees of subsidiaries
158 58
Cash dividends ( 3,588,810 ) ( 559,005 )
Combined individual effects ( 91,553,576 ) -
Ending balance $ 125,889 $ 86,857,655
34.NETINTERESTINCOME
For the Year Ended December 31
2014 2013
Interest income
Loans $ 42,519,826 $ 41,340,537
Due from and call loans to banks 4,528,122 1,533,115
Investment in marketable securities 4,767,270 4,746,430
Revolving interest of credit card 1,289,125 1,361,221
Others 2,680 ,917 1,551,355
55,785,260 50,532,658
Interest expense
Deposits ( 16,414,198 ) ( 14,985,922 )
Due to the Central Bank and call loans from banks ( 1,845,086 ) ( 1,252,727 )
Issuance of bonds and securities ( 2,206,470 ) ( 1,971,323 )
Structured products ( 1,010,434 ) ( 630,664 )
Others ( 611,491 ) ( 412,251 )
( 22,087,679 ) ( 19,252,887 )
Net interest income $ 33,697,581 $ 31,279,771
194
35.NETSERVICEFEEANDCOMMISSIONSINCOME
For the Year Ended December 31
2014 2013
Service fee and commissions income
Fees from import and export $ 332,790 $ 361,681
Remittance fees 548,807 592,130
Interbank fees 798,245 728,049
Loan and guarantees fees 1,296,475 954,647
Fees from certification, underwriting and brokerage 413,074 331,620
Fees from trustee business 3,052,571 2,911,802
Agency fees 5,856,600 6,570,047
Fees from credit card and cash card 3,131,380 2,957,347
Others 2,718,336 1,000,110
18,148,278 16,407,433
Service fee and commissions expense
Interbank fees ( 251,610 ) ( 272,972 )
Fees from trustee business ( 106,974 ) ( 169,118 )
Marketing fees ( 458,628 ) ( 385,638 )
Agency fees ( 568,071 ) ( 456,815 )
Fees from credit card ( 1,261,473 ) ( 1,061,769 )
Others ( 783,948 ) ( 780,199 )
( 3,430,704 ) ( 3,126,511 )
Net service fee and commissions income $ 14,717,574 $ 13,280,922
36.GAINONFINANCIALASSETSANDLIABILITIESATFAIRVALUETHROUGHPROFITORLOSS
For the Year Ended December 31
2014 2013
Disposal gains (losses) on financial assets and liabilities at FVTPL
Stocks and beneficiary certificates $ 208,925 $ 218,136
Bills 6,574 21,535
Bonds 181,293 42,171
Derivative financial instruments 4,612,893 5,288,638
5,009,685 5,570,480
Valuation gains (losses) on financial assets and liabilities at FVTPL
Stocks and beneficiary certificates ( 30,952 ) 16,399
Bills 2,938 ( 10,378 )
Bonds ( 85,383 ) 222,188
Derivative financial instruments 2,440,236 3,474,701
2,326,839 3,702,910
Net interest income 572,780 647,006
Dividend revenue 28,885 23,123
$ 7,938,189 $ 9,943,519
195
06Financial Status2014 ANNUAL REPORT
37.REALIZEDGAINONAVAILABLE-FOR-SALEFINANCIALASSETS
For the Year Ended December 31
2014 2013
Disposal gains
Stock and beneficiary certificates $ 791,860 $ 2,682,352
Bills ( 12,181 ) ( 677 )
Bonds 187,745 92,714
Other - ( 21,713 )
967,424 2,752,676
Dividends and bonuses 225,216 203,558
$ 1,192,640 $ 2,956,234
38.EMPLOYEEBENEFITSEXPENSES
For the Year Ended December 31
2014 2013
Short-term benefits
Salary expenses $ 17,311,293 $ 17,657,578
Labor and health insurance expenses 444,554 514,091
Post-employment benefits (Note 32)
Defined contribution plans 457,591 442,392
Defined benefit plans 447,644 325,513
High-yield savings account for employees 284,774 249,549
Other post-employment benefits 143,029 198,372
Share-based payment
Equity-settled share-based payment 141,168 61,769
Cash-settled share-based payment 66,053 43,715
Other employee benefits expenses 614,388 341,543
$ 19,910,494 $ 19,834,522
Taishin Financial Holding and subsidiaries’ total number of employees is 7,758. The definition of employee is provided in IAS 19 “Employee Benefits” issued by the FSC.
39.DEPRECIATIONANDAMORTIZATIONEXPENSES
For the Year Ended December 31
2014 2013
Property and equipment $ 1,155,235 $ 1,162,205
Investment property 15,892 16,036
Intangible assets and other deferred assets 390,611 302,723
$ 1,561,738 $ 1,480,964
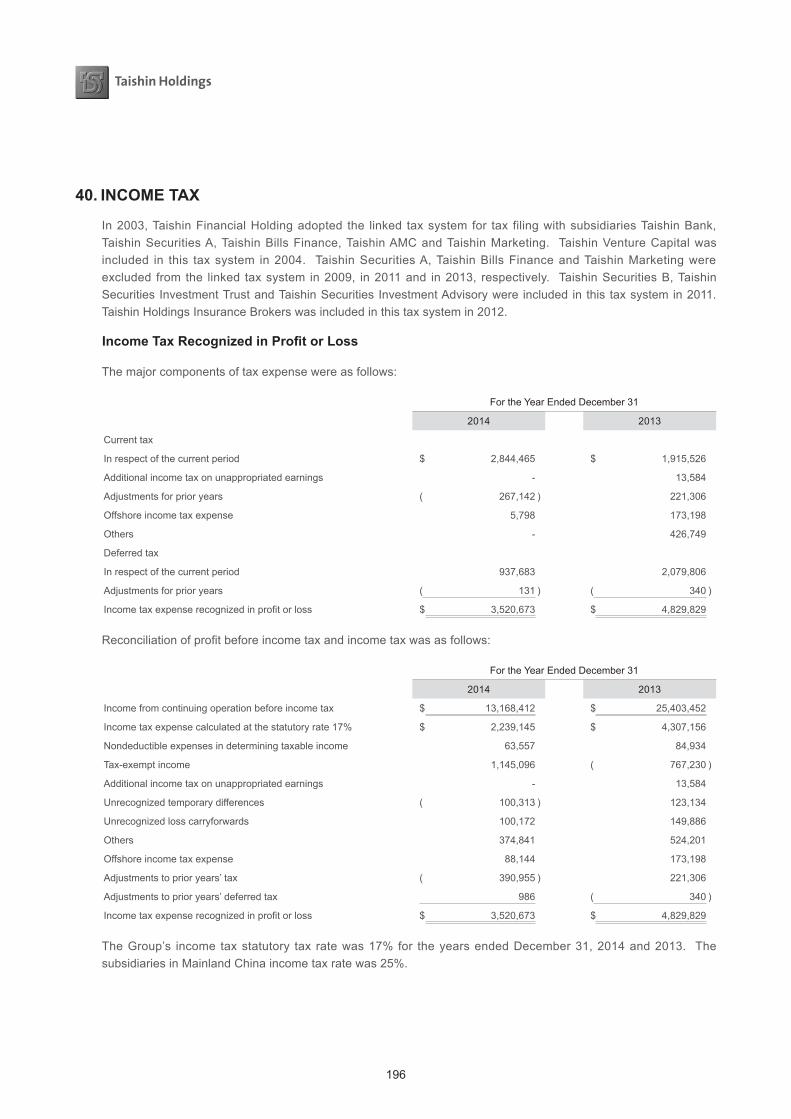
196
40. INCOME TAX
In 2003, Taishin Financial Holding adopted the linked tax system for tax filing with subsidiaries Taishin Bank, Taishin Securities A, Taishin Bills Finance, Taishin AMC and Taishin Marketing. Taishin Venture Capital was included in this tax system in 2004. Taishin Securities A, Taishin Bills Finance and Taishin Marketing were excluded from the linked tax system in 2009, in 2011 and in 2013, respectively. Taishin Securities B, Taishin Securities Investment Trust and Taishin Securities Investment Advisory were included in this tax system in 2011. Taishin Holdings Insurance Brokers was included in this tax system in 2012.
Income Tax Recognized in Profit or Loss
The major components of tax expense were as follows:
For the Year Ended December 31
2014 2013
Current tax
In respect of the current period $ 2,844,465 $ 1,915,526
Additional income tax on unappropriated earnings - 13,584
Adjustments for prior years ( 267,142 ) 221,306
Offshore income tax expense 5,798 173,198
Others - 426,749
Deferred tax
In respect of the current period 937,683 2,079,806
Adjustments for prior years ( 131 ) ( 340 )
Income tax expense recognized in profit or loss $ 3,520,673 $ 4,829,829
Reconciliation of profit before income tax and income tax was as follows:
For the Year Ended December 31
2014 2013
Income from continuing operation before income tax $ 13,168,412 $ 25,403,452
Income tax expense calculated at the statutory rate 17% $ 2,239,145 $ 4,307,156
Nondeductible expenses in determining taxable income 63,557 84,934
Tax-exempt income 1,145,096 ( 767,230 )
Additional income tax on unappropriated earnings - 13,584
Unrecognized temporary differences ( 100,313 ) 123,134
Unrecognized loss carryforwards 100,172 149,886
Others 374,841 524,201
Offshore income tax expense 88,144 173,198
Adjustments to prior years’ tax ( 390,955 ) 221,306
Adjustments to prior years’ deferred tax 986 ( 340 )
Income tax expense recognized in profit or loss $ 3,520,673 $ 4,829,829
The Group’s income tax statutory tax rate was 17% for the years ended December 31, 2014 and 2013. The subsidiaries in Mainland China income tax rate was 25%.
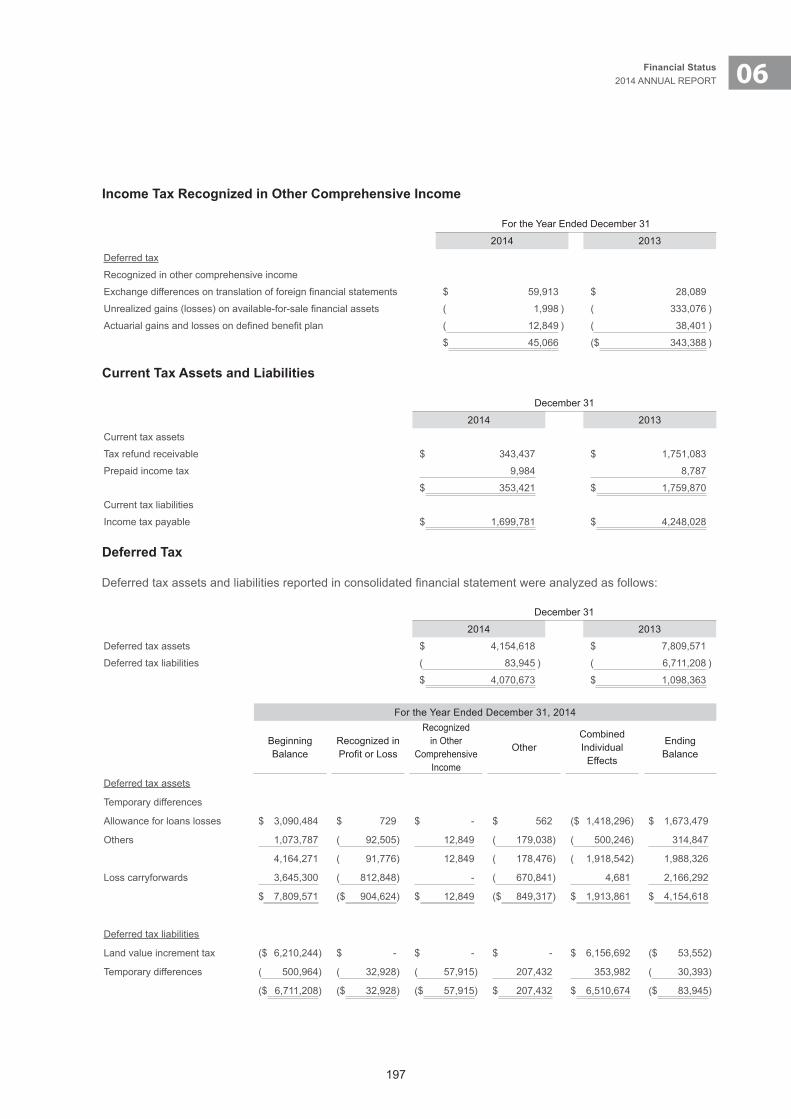
197
06Financial Status2014 ANNUAL REPORT
Income Tax Recognized in Other Comprehensive Income
For the Year Ended December 31
2014 2013
Deferred tax
Recognized in other comprehensive income
Exchange differences on translation of foreign financial statements $ 59,913 $ 28,089
Unrealized gains (losses) on available-for-sale financial assets ( 1,998 ) ( 333,076 )
Actuarial gains and losses on defined benefit plan ( 12,849 ) ( 38,401 )
$ 45,066 ($ 343,388 )
Current Tax Assets and Liabilities
December 31
2014 2013
Current tax assets
Tax refund receivable $ 343,437 $ 1,751,083
Prepaid income tax 9,984 8,787
$ 353,421 $ 1,759,870
Current tax liabilities
Income tax payable $ 1,699,781 $ 4,248,028
Deferred Tax
Deferred tax assets and liabilities reported in consolidated financial statement were analyzed as follows:
December 31
2014 2013
Deferred tax assets $ 4,154,618 $ 7,809,571
Deferred tax liabilities ( 83,945 ) ( 6,711,208 )
$ 4,070,673 $ 1,098,363
For the Year Ended December 31, 2014
Beginning Balance
Recognized in Profit or Loss
Recognized in Other
Comprehensive Income
OtherCombined Individual
Effects
Ending Balance
Deferred tax assets
Temporary differences
Allowance for loans losses $ 3,090,484 $ 729 $ - $ 562 ($ 1,418,296 ) $ 1,673,479
Others 1,073,787 ( 92,505 ) 12,849 ( 179,038 ) ( 500,246 ) 314,847
4,164,271 ( 91,776 ) 12,849 ( 178,476 ) ( 1,918,542 ) 1,988,326
Loss carryforwards 3,645,300 ( 812,848 ) - ( 670,841 ) 4,681 2,166,292
$ 7,809,571 ($ 904,624 ) $ 12,849 ($ 849,317 ) $ 1,913,861 $ 4,154,618
Deferred tax liabilities
Land value increment tax ($ 6,210,244 ) $ - $ - $ - $ 6,156,692 ($ 53,552 )
Temporary differences ( 500,964 ) ( 32,928 ) ( 57,915 ) 207,432 353,982 ( 30,393 )
($ 6,711,208 ) ($ 32,928 ) ($ 57,915 ) $ 207,432 $ 6,510,674 ($ 83,945 )
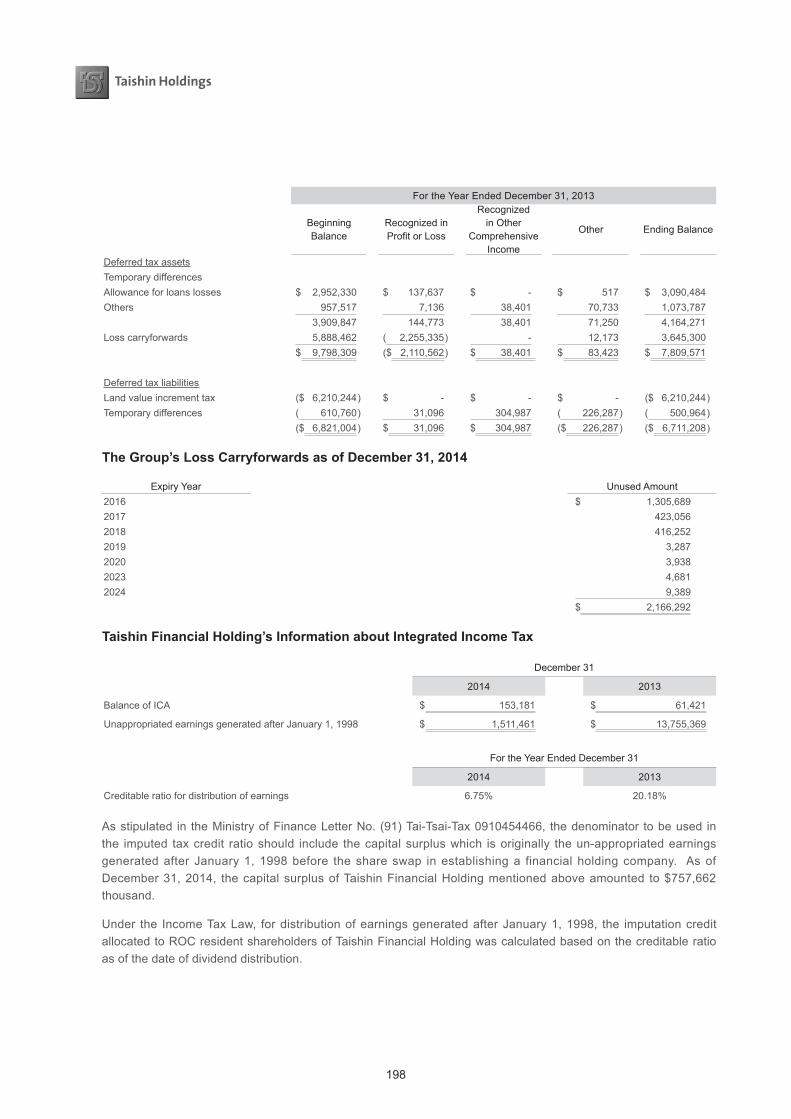
198
For the Year Ended December 31, 2013
Beginning Balance
Recognized in Profit or Loss
Recognized in Other
Comprehensive Income
Other Ending Balance
Deferred tax assetsTemporary differencesAllowance for loans losses $ 2,952,330 $ 137,637 $ - $ 517 $ 3,090,484Others 957,517 7,136 38,401 70,733 1,073,787
3,909,847 144,773 38,401 71,250 4,164,271Loss carryforwards 5,888,462 ( 2,255,335 ) - 12,173 3,645,300
$ 9,798,309 ($ 2,110,562 ) $ 38,401 $ 83,423 $ 7,809,571
Deferred tax liabilitiesLand value increment tax ($ 6,210,244 ) $ - $ - $ - ($ 6,210,244 )Temporary differences ( 610,760 ) 31,096 304,987 ( 226,287 ) ( 500,964 )
($ 6,821,004 ) $ 31,096 $ 304,987 ($ 226,287 ) ($ 6,711,208 )
The Group’s Loss Carryforwards as of December 31, 2014
Expiry Year Unused Amount2016 $ 1,305,6892017 423,0562018 416,2522019 3,2872020 3,9382023 4,6812024 9,389
$ 2,166,292
Taishin Financial Holding’s Information about Integrated Income Tax
December 31
2014 2013
Balance of ICA $ 153,181 $ 61,421
Unappropriated earnings generated after January 1, 1998 $ 1,511,461 $ 13,755,369
For the Year Ended December 31
2014 2013
Creditable ratio for distribution of earnings 6.75% 20.18%
As stipulated in the Ministry of Finance Letter No. (91) Tai-Tsai-Tax 0910454466, the denominator to be used in the imputed tax credit ratio should include the capital surplus which is originally the un-appropriated earnings generated after January 1, 1998 before the share swap in establishing a financial holding company. As of December 31, 2014, the capital surplus of Taishin Financial Holding mentioned above amounted to $757,662 thousand.
Under the Income Tax Law, for distribution of earnings generated after January 1, 1998, the imputation credit allocated to ROC resident shareholders of Taishin Financial Holding was calculated based on the creditable ratio as of the date of dividend distribution.

199
06Financial Status2014 ANNUAL REPORT
The actual imputation credit allocated to shareholders of Taishin Financial Holding was based on the balance of the ICA as of the date of dividend distribution. Therefore, the expected creditable ratio for the 2013 earnings may differ from the actual creditable ratio to be used in allocating imputation credits to the shareholders.
According to legal interpretation No. 10204562810 announced by the Taxation Administration of the Ministry of Finance, when calculating imputation credits in the year of first-time adoption of IFRSs, the cumulative distributable earnings should include the net increase or decrease in retained earnings arising from first-time adoption of IFRSs.
Assessments of The Group’s Income Tax
a. Taishin Financial Holding’s income tax returns through 2009 had been assessed by the tax authorities.
b. Taishin Bank’s income tax returns through 2009 had been assessed by the tax authorities. The income tax returns of Taishin Insurance Agency, Taishin Real-Estate, Taishin D.A. Finance, and Taishin Insurance Brokers through 2012, 2012, 2012, and 2013 had been assessed by the tax authorities.
In regard to the amortization of $758,518 thousand, $758,518 thousand, $758,518 thousand and $758,518 thousand of goodwill from the merger of Dah An Bank reported in the 2004, 2005, 2006 and 2007 income tax returns of Taishin Bank, the tax authorities had disapproved the amortization as deductible because the goodwill resulted from the negotiations of the dealing parties rather than from a purchase in active market. Taishin Bank had filed appeals and litigations to the tax authorities and the administrative courts. In June 2014, National Taxation Bureau of Taipei, Ministry of Finance has agreed part of the recognition of the amortization of the goodwill. The Company had adjusted the estimated income tax expense for the year ended December 31, 2014.
In regard to the amortization of $18,109 thousand, $71,577 thousand, $71,405 thousand, $71,405 thousand and $71,405 thousand on goodwill from the acquisition of the 10th Credit Cooperative of Hsin-Chu in the 2004, 2005, 2006, 2007 and 2008 income tax returns of Taishin Bank, the tax authorities had disapproved the related expense due to the reason that the goodwill was not assessed by applying professional valuation procedures and the identifiable assets and liabilities were not analyzed by fair value. Taishin Bank is filing appeals to the tax authorities. In June 2014, National Taxation Bureau of Taipei, Ministry of Finance has agreed part of the recognition of the amortization of the goodwill. Taishin Bank had adjusted the estimated income tax expense for the year ended December 31, 2014.
c. Taishin AMC’s income tax returns through 2009 had been assessed by the tax authorities. Although Taishin AMC had filed appeals and litigations to the tax authorities and the administrative courts on the income tax returns through 2009, Taishin AMC had recognized income tax expense based on conservative estimate.
d. Taishin Marketing’s income tax returns through 2009 had been assessed by the tax authorities.
e. Taishin Venture Capital’s income tax returns through 2009 had been assessed by the tax authorities.
f. Taishin Securities Investment Trust’s returns through 2010 had been assessed by the tax authorities.
g. Taishin Securities B’s returns through 2010 had been assessed by the tax authorities.
h. Taishin Securities Investment Advisory’s returns through 2010 had been assessed by the tax authorities.
i. Taishin Holdings Insurance Broker’s returns through 2011 had been assessed by the tax authorities.
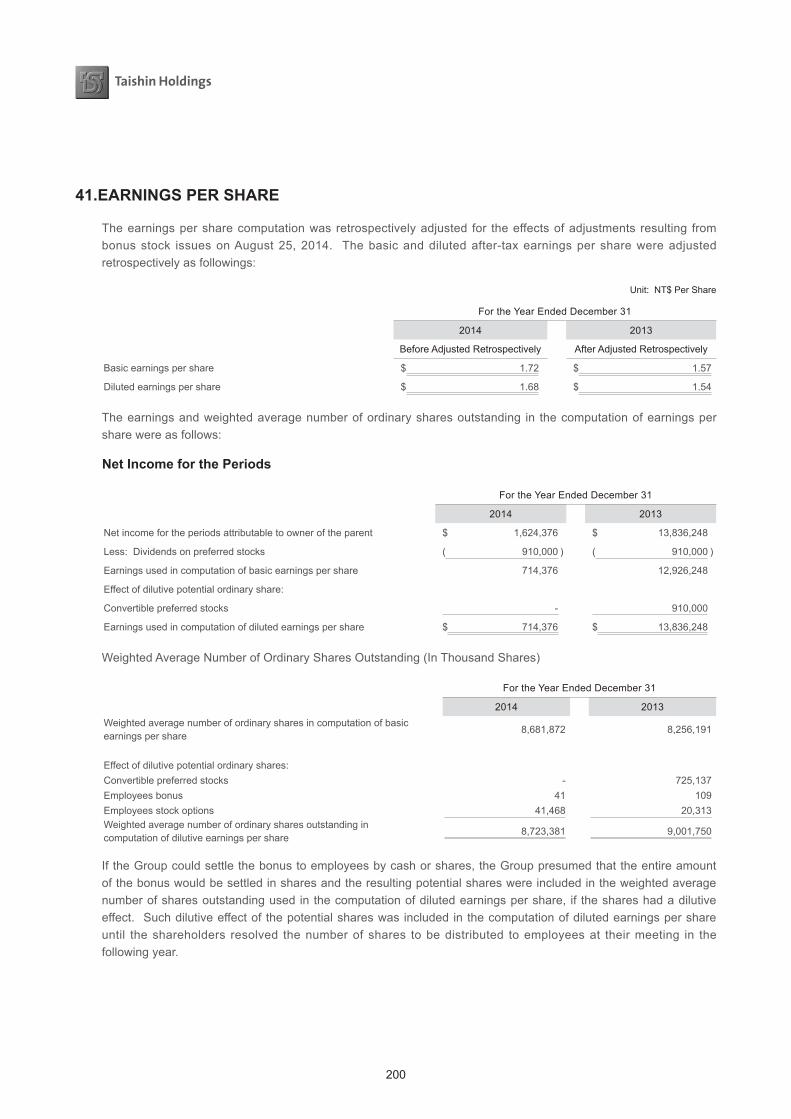
200
41.EARNINGS PER SHARE
The earnings per share computation was retrospectively adjusted for the effects of adjustments resulting from bonus stock issues on August 25, 2014. The basic and diluted after-tax earnings per share were adjusted retrospectively as followings:
Unit: NT$ Per Share
For the Year Ended December 31
2014 2013
Before Adjusted Retrospectively After Adjusted Retrospectively
Basic earnings per share $ 1.72 $ 1.57
Diluted earnings per share $ 1.68 $ 1.54
The earnings and weighted average number of ordinary shares outstanding in the computation of earnings per share were as follows:
Net Income for the Periods
For the Year Ended December 31
2014 2013
Net income for the periods attributable to owner of the parent $ 1,624,376 $ 13,836,248
Less: Dividends on preferred stocks ( 910,000 ) ( 910,000 )
Earnings used in computation of basic earnings per share 714,376 12,926,248
Effect of dilutive potential ordinary share:
Convertible preferred stocks - 910,000
Earnings used in computation of diluted earnings per share $ 714,376 $ 13,836,248
Weighted Average Number of Ordinary Shares Outstanding (In Thousand Shares)
For the Year Ended December 31
2014 2013Weighted average number of ordinary shares in computation of basic earnings per share
8,681,872 8,256,191
Effect of dilutive potential ordinary shares:Convertible preferred stocks - 725,137Employees bonus 41 109Employees stock options 41,468 20,313Weighted average number of ordinary shares outstanding in computation of dilutive earnings per share
8,723,381 9,001,750
If the Group could settle the bonus to employees by cash or shares, the Group presumed that the entire amount of the bonus would be settled in shares and the resulting potential shares were included in the weighted average number of shares outstanding used in the computation of diluted earnings per share, if the shares had a dilutive effect. Such dilutive effect of the potential shares was included in the computation of diluted earnings per share until the shareholders resolved the number of shares to be distributed to employees at their meeting in the following year.
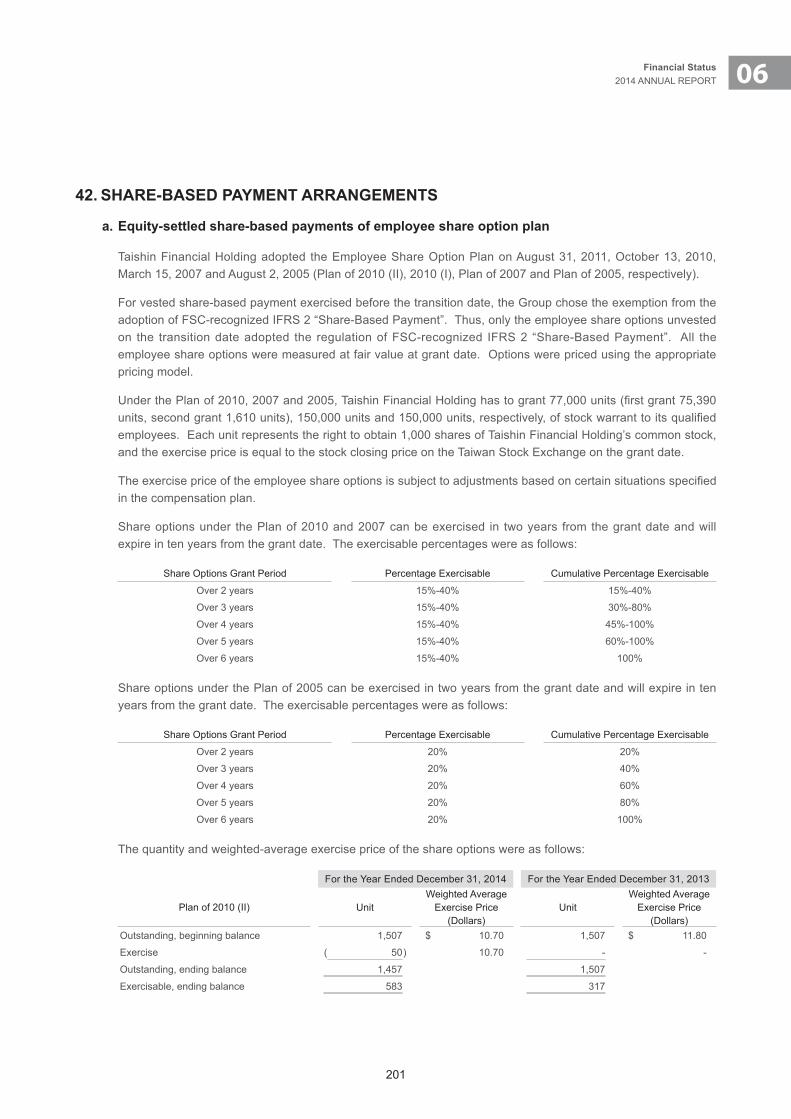
201
06Financial Status2014 ANNUAL REPORT
42. SHARE-BASED PAYMENT ARRANGEMENTS
a. Equity-settled share-based payments of employee share option plan
Taishin Financial Holding adopted the Employee Share Option Plan on August 31, 2011, October 13, 2010, March 15, 2007 and August 2, 2005 (Plan of 2010 (II), 2010 (I), Plan of 2007 and Plan of 2005, respectively).
For vested share-based payment exercised before the transition date, the Group chose the exemption from the adoption of FSC-recognized IFRS 2 “Share-Based Payment”. Thus, only the employee share options unvested on the transition date adopted the regulation of FSC-recognized IFRS 2 “Share-Based Payment”. All the employee share options were measured at fair value at grant date. Options were priced using the appropriate pricing model.
Under the Plan of 2010, 2007 and 2005, Taishin Financial Holding has to grant 77,000 units (first grant 75,390 units, second grant 1,610 units), 150,000 units and 150,000 units, respectively, of stock warrant to its qualified employees. Each unit represents the right to obtain 1,000 shares of Taishin Financial Holding’s common stock, and the exercise price is equal to the stock closing price on the Taiwan Stock Exchange on the grant date.
The exercise price of the employee share options is subject to adjustments based on certain situations specified in the compensation plan.
Share options under the Plan of 2010 and 2007 can be exercised in two years from the grant date and will expire in ten years from the grant date. The exercisable percentages were as follows:
Share Options Grant Period Percentage Exercisable Cumulative Percentage Exercisable
Over 2 years 15%-40% 15%-40%
Over 3 years 15%-40% 30%-80%
Over 4 years 15%-40% 45%-100%
Over 5 years 15%-40% 60%-100%
Over 6 years 15%-40% 100%
Share options under the Plan of 2005 can be exercised in two years from the grant date and will expire in ten years from the grant date. The exercisable percentages were as follows:
Share Options Grant Period Percentage Exercisable Cumulative Percentage Exercisable
Over 2 years 20% 20%
Over 3 years 20% 40%
Over 4 years 20% 60%
Over 5 years 20% 80%
Over 6 years 20% 100%
The quantity and weighted-average exercise price of the share options were as follows:
For the Year Ended December 31, 2014 For the Year Ended December 31, 2013
Plan of 2010 (II) UnitWeighted Average
Exercise Price(Dollars)
UnitWeighted Average
Exercise Price(Dollars)
Outstanding, beginning balance 1,507 $ 10.70 1,507 $ 11.80
Exercise ( 50 ) 10.70 - -
Outstanding, ending balance 1,457 1,507
Exercisable, ending balance 583 317

202
For the Year Ended December 31, 2014 For the Year Ended December 31, 2013
Plan of 2010 (I) UnitWeighted Average
Exercise Price(Dollars)
UnitWeighted Average
Exercise Price(Dollars)
Outstanding, beginning balance 48,306 $ 10.60 61,710 $ 11.70
Exercise ( 9,106 ) 10.10 ( 11,096 ) 10.61
Forfeited ( 1,027 ) - ( 2,308 ) 11.64
Outstanding, ending balance 38,173 48,306
Exercisable, ending balance 27,116 19,129
For the Year Ended December 31, 2014 For the Year Ended December 31, 2013
Plan of 2007 UnitWeighted Average
Exercise Price(Dollars)
UnitWeighted Average
Exercise Price(Dollars)
Outstanding, beginning balance 96,260 $ 11.30 109,118 $ 12.50Exercise ( 13,354 ) 10.69 ( 11,638 ) 11.31Forfeited ( 150 ) ( 1,220 ) 12.34Outstanding, ending balance 82,756 96,260Exercisable, ending balance 82,756 96,260
For the Year Ended December 31, 2014 For the Year Ended December 31, 2013
Plan of 2005 UnitWeighted Average
Exercise Price(Dollars)
UnitWeighted Average
Exercise Price(Dollars)
Outstanding, beginning balance 40,450 $ 15.30 40,450 $ 17.20Exercise ( 3,210 ) 13.60 - Outstanding, ending balance 37,240 40,450Exercisable, ending balance 37,240 40,450
The weighted-average of stock prices at the dates of exercise of share options exercised during the year ended December 31, 2014 was $14.27.
The exercise price and expected weighted-average outstanding period of the share option warrants for the years ended December 31, 2014 and 2013 were as follows:
For the Year Ended December 31, 2014 For the Year Ended December 31, 2013
Exercise Price(Dollars)
Expected Weighted Average Outstanding
Period (Years)
Exercise Price(Dollars)
Expected Weighted Average Outstanding
Period (Years)Plan of 2010 (II) $ 9.50 6.67 $ 10.70 7.67Plan of 2010 (I) 9.40 5.79 10.60 6.79Plan of 2007 10.00 2.20 11.30 3.20Plan of 2005 13.60 0.58 15.50 1.58
The valuation models of the share options for the year ended December 31, 2014 were as follows:
Valuation Model Black-Scholes Options Valuation Model Plan of 2010 (II) Plan of 2010 (I) Plan of 2007Assumption Dividend yield - - 7.00%
Expected price volatility 37.71%-39.71% 38.02%-38.73% 33.26%Risk-free interest rate 1.22%-1.52% 1.06%-1.23% 2.15%Expected outstanding periods 10 years 10 years 10 years

203
06Financial Status2014 ANNUAL REPORT
b. Cash-settled share-based payment of Taishin appreciation rights plan
The Group issued to employees share appreciation rights (the SARs) that require the Group to pay the intrinsic value of the SAR to the qualified people at the date of exercise since 2013. The fair value of the SARs was determined using the Black-Scholes pricing model based on the following assumptions.
December 31, 2013 December 31, 2012
Balance sheet date share price $14.25 $14.25
Exercise price $12.70 $8.80
Outstanding period 2 years, 3 years 2 years, 3 years
Expected volatility 31.15%, 31.15% 31.15%, 31.15%
Risk-free interest rate 0.97%, 0.97% 0.97%, 0.97%
The movements in the appreciation rights plan were as follows:
Plan of 2012
For the Years Ended December 31
2014 2013
Appreciation Rights Plan UnitWeighted Average
Exercise Price(Dollars)
UnitWeighted Average
Exercise Price(Dollars)
Outstanding, beginning 23,743 $ - - $ -Granted - - 24,323 10.97Forfeited ( 480 ) 8.80 ( 580 ) 10.75Outstanding, ending 23,263 23,743Weighted-average fair value of appropriation rights (NT$)
$ 4.8088 $ 4.9384
Plan of 2013
For the Years Ended December 31
2014 2013
Appreciation Rights Plan UnitWeighted Average
Exercise Price(Dollars)
UnitWeighted Average
Exercise Price(Dollars)
Outstanding, beginning - $ - - $ -Granted 26,695 14.50 - -Forfeited ( 240 ) 12.70 - -Outstanding, ending 26,455 -Weighted-average fair value of appropriation rights (NT$)
$ 2.1393 $ -
43. LOSING CONTROL OF SUBSIDIARY
Taishin Financial Holding held 22.55% equity in Chang Hwa Bank. In addition, Taishin Financial Holding was represented by more than half of the total number of directors until the election of directors in late 2014. In December 2014, Chang Hwa Bank held an interim shareholders’ meeting to elect directors and Taishin Financial Holding did not obtain more than half of the total number of directors. Therefore, Taishin Financial Holding lost the control of Chang Hwa Bank. Taishin Financial Holding still owned 22.81% voting share and able to exercise significant influence on Chang Hwa Bank. The calculation of gain or loss from losing control of Chang Hwa Bank is illustrated below in b. loss on losing control of subsidiary, and the loss is accounted under net other non-interest income (loss).
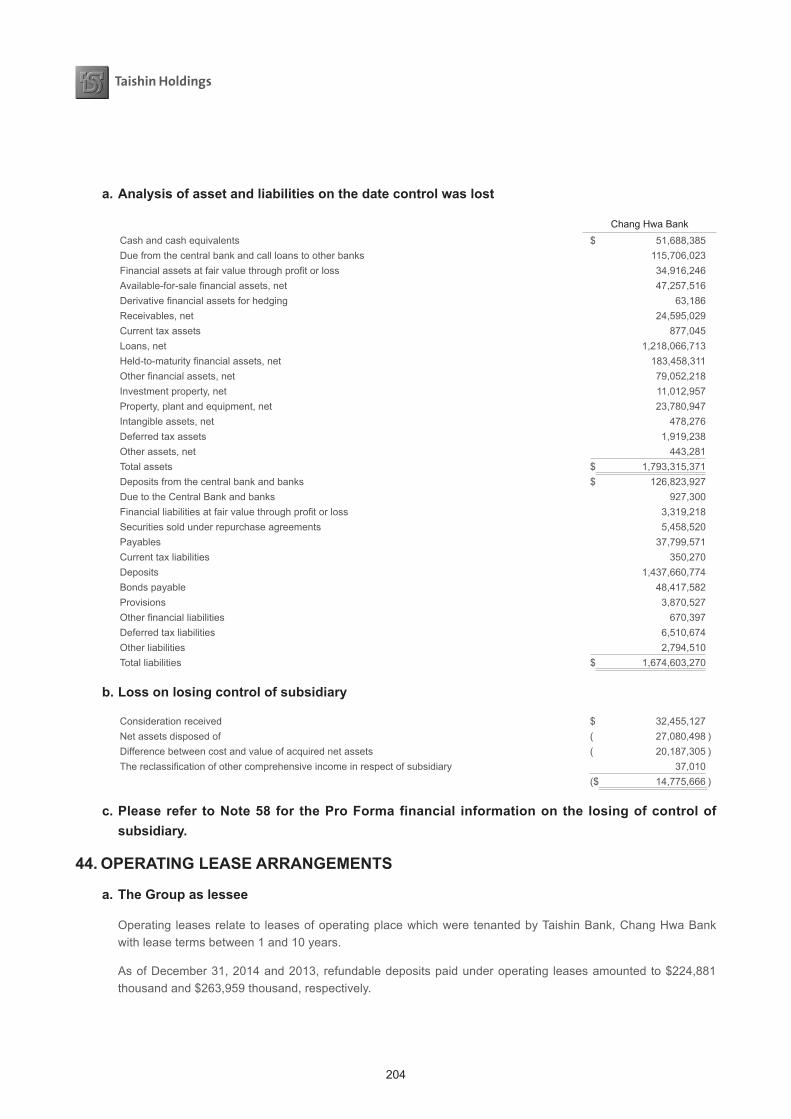
204
a. Analysis of asset and liabilities on the date control was lost
Chang Hwa BankCash and cash equivalents $ 51,688,385Due from the central bank and call loans to other banks 115,706,023Financial assets at fair value through profit or loss 34,916,246Available-for-sale financial assets, net 47,257,516Derivative financial assets for hedging 63,186Receivables, net 24,595,029Current tax assets 877,045Loans, net 1,218,066,713Held-to-maturity financial assets, net 183,458,311Other financial assets, net 79,052,218Investment property, net 11,012,957Property, plant and equipment, net 23,780,947Intangible assets, net 478,276Deferred tax assets 1,919,238Other assets, net 443,281Total assets $ 1,793,315,371Deposits from the central bank and banks $ 126,823,927Due to the Central Bank and banks 927,300Financial liabilities at fair value through profit or loss 3,319,218Securities sold under repurchase agreements 5,458,520Payables 37,799,571Current tax liabilities 350,270Deposits 1,437,660,774Bonds payable 48,417,582Provisions 3,870,527Other financial liabilities 670,397Deferred tax liabilities 6,510,674Other liabilities 2,794,510Total liabilities $ 1,674,603,270
b. Loss on losing control of subsidiary
Consideration received $ 32,455,127Net assets disposed of ( 27,080,498 )Difference between cost and value of acquired net assets ( 20,187,305 )The reclassification of other comprehensive income in respect of subsidiary 37,010
($ 14,775,666 )
c. Please refer to Note 58 for the Pro Forma financial information on the losing of control of subsidiary.
44. OPERATING LEASE ARRANGEMENTS
a. The Group as lessee
Operating leases relate to leases of operating place which were tenanted by Taishin Bank, Chang Hwa Bank with lease terms between 1 and 10 years.
As of December 31, 2014 and 2013, refundable deposits paid under operating leases amounted to $224,881 thousand and $263,959 thousand, respectively.
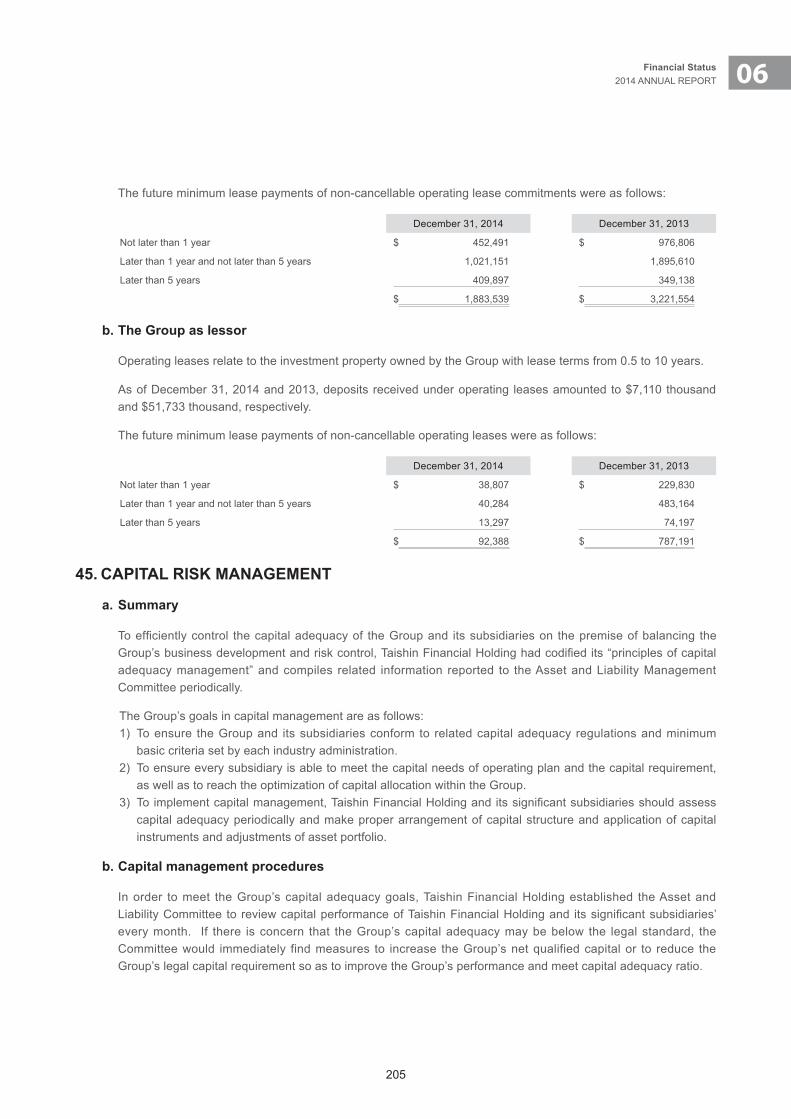
205
06Financial Status2014 ANNUAL REPORT
The future minimum lease payments of non-cancellable operating lease commitments were as follows:
December 31, 2014 December 31, 2013
Not later than 1 year $ 452,491 $ 976,806
Later than 1 year and not later than 5 years 1,021,151 1,895,610
Later than 5 years 409,897 349,138
$ 1,883,539 $ 3,221,554
b. The Group as lessor
Operating leases relate to the investment property owned by the Group with lease terms from 0.5 to 10 years.
As of December 31, 2014 and 2013, deposits received under operating leases amounted to $7,110 thousand and $51,733 thousand, respectively.
The future minimum lease payments of non-cancellable operating leases were as follows:
December 31, 2014 December 31, 2013
Not later than 1 year $ 38,807 $ 229,830
Later than 1 year and not later than 5 years 40,284 483,164
Later than 5 years 13,297 74,197
$ 92,388 $ 787,191
45. CAPITAL RISK MANAGEMENT
a. Summary
To efficiently control the capital adequacy of the Group and its subsidiaries on the premise of balancing the Group’s business development and risk control, Taishin Financial Holding had codified its “principles of capital adequacy management” and compiles related information reported to the Asset and Liability Management Committee periodically.
The Group’s goals in capital management are as follows:1) To ensure the Group and its subsidiaries conform to related capital adequacy regulations and minimum
basic criteria set by each industry administration. 2) To ensure every subsidiary is able to meet the capital needs of operating plan and the capital requirement,
as well as to reach the optimization of capital allocation within the Group.3) To implement capital management, Taishin Financial Holding and its significant subsidiaries should assess
capital adequacy periodically and make proper arrangement of capital structure and application of capital instruments and adjustments of asset portfolio.
b. Capital management procedures
In order to meet the Group’s capital adequacy goals, Taishin Financial Holding established the Asset and Liability Committee to review capital performance of Taishin Financial Holding and its significant subsidiaries’ every month. If there is concern that the Group’s capital adequacy may be below the legal standard, the Committee would immediately find measures to increase the Group’s net qualified capital or to reduce the Group’s legal capital requirement so as to improve the Group’s performance and meet capital adequacy ratio.

206
The Group’s capital adequacy is calculated based on the accounting reports and related data of capital adequacy provided by Taishin Financial Holding and its subsidiaries. Taishin Financial Holding and each of its subsidiaries should respectively report to local administrations using the calculation formula and forms according to the regulations before deadline.
c.
ItemCompany
December 31, 2014
Ownership Interest (%) Group Eligible CapitalGroup’s Statutory Capital
Requirement
Taishin Financial Holding $ 127,481,472 $ 124,931,261
Taishin Bank 100 105,775,325 76,832,433
Taishin Securities B 100 3,168,559 958,145
Taishin Venture Capital 100 3,099,868 1,551,409
Taishin AMC 100 1,547,785 916,675
Taishin Securities Investment Trust 100 843,456 463,976
Taishin Securities Investment Advisory 92 329,124 176,620
Taishin Holdings Insurance Brokers 100 1,097,852 781,071
Exclusive items amounts subtracted ( 103,252,247 ) ( 92,435,913 )
Total 140,091,194 114,175,677
Group’s capital adequacy ratio (Note) 122.70%.
ItemCompany
December 31, 2013
Ownership Interest (%) Group Eligible CapitalGroup’s Statutory Capital
Requirement
Taishin Financial Holding $ 128,950,996 $ 127,499,631
Taishin Bank 100.00 90,295,339 66,037,993
Chang Hwa Bank 22.55 28,399,433 20,444,920
Taishin Securities B 100.00 2,182,995 773,097
Taishin Venture Capital 100.00 1,985,115 993,671
Taishin AMC 100.00 1,883,796 1,061,427
Taishin Securities Investment Trust 100.00 832,027 455,496
Taishin Securities Investment Advisory 92.00 324,076 172,843
Taishin Holdings Insurance Brokers 100.00 899,216 577,510
Exclusive items amounts subtracted ( 139,724,165 ) ( 127,279,651 )
Total 116,028,828 90,736,937
Group’s capital adequacy ratio (Note) 127.87%
d. Financial holding company eligible capital
Item December 31, 2014
Common stock $ 88,417,902Non-cumulative perpetual preferred stocks and non-cumulative subordinated debts without maturity dates which comply with eligible Tier 1 capital
13,397,329
Other preferred stock and subordinated corporate bonds 13,540,000
Advance receipts for capital stock 111,339
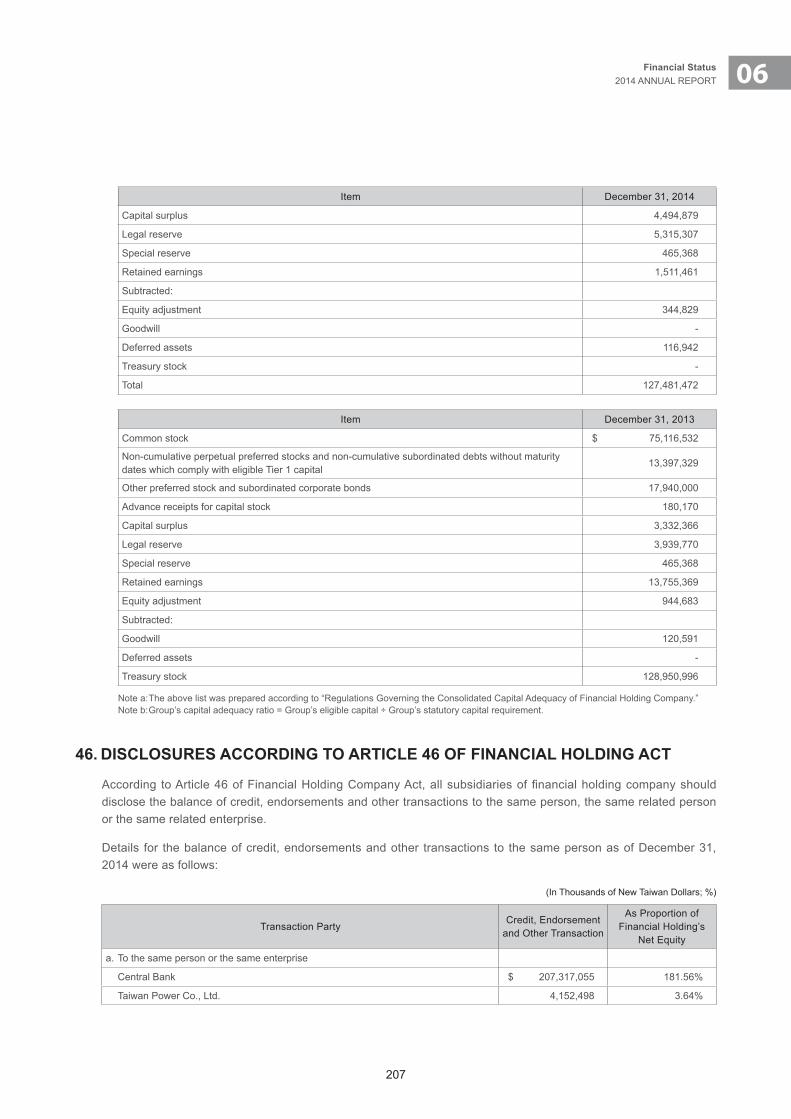
207
06Financial Status2014 ANNUAL REPORT
Item December 31, 2014
Capital surplus 4,494,879
Legal reserve 5,315,307
Special reserve 465,368
Retained earnings 1,511,461
Subtracted:
Equity adjustment 344,829
Goodwill -
Deferred assets 116,942
Treasury stock -
Total 127,481,472
Item December 31, 2013
Common stock $ 75,116,532
Non-cumulative perpetual preferred stocks and non-cumulative subordinated debts without maturity dates which comply with eligible Tier 1 capital
13,397,329
Other preferred stock and subordinated corporate bonds 17,940,000
Advance receipts for capital stock 180,170
Capital surplus 3,332,366
Legal reserve 3,939,770
Special reserve 465,368
Retained earnings 13,755,369
Equity adjustment 944,683
Subtracted:
Goodwill 120,591
Deferred assets -
Treasury stock 128,950,996
Note a: The above list was prepared according to “Regulations Governing the Consolidated Capital Adequacy of Financial Holding Company.”Note b: Group’s capital adequacy ratio = Group’s eligible capital ÷ Group’s statutory capital requirement.
46. DISCLOSURES ACCORDING TO ARTICLE 46 OF FINANCIAL HOLDING ACT
According to Article 46 of Financial Holding Company Act, all subsidiaries of financial holding company should disclose the balance of credit, endorsements and other transactions to the same person, the same related person or the same related enterprise.
Details for the balance of credit, endorsements and other transactions to the same person as of December 31, 2014 were as follows:
(In Thousands of New Taiwan Dollars; %)
Transaction PartyCredit, Endorsement
and Other Transaction
As Proportion of Financial Holding’s
Net Equity
a. To the same person or the same enterprise
Central Bank $ 207,317,055 181.56%
Taiwan Power Co., Ltd. 4,152,498 3.64%
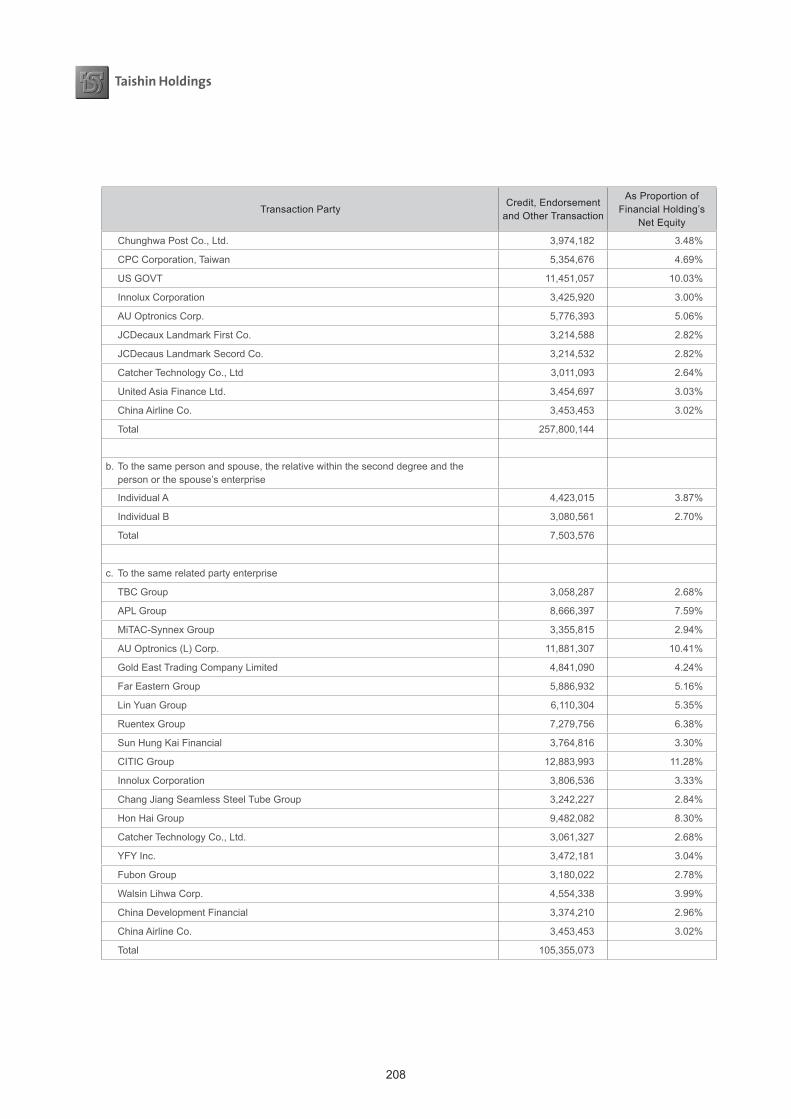
208
Transaction PartyCredit, Endorsement
and Other Transaction
As Proportion of Financial Holding’s
Net Equity
Chunghwa Post Co., Ltd. 3,974,182 3.48%
CPC Corporation, Taiwan 5,354,676 4.69%
US GOVT 11,451,057 10.03%
Innolux Corporation 3,425,920 3.00%
AU Optronics Corp. 5,776,393 5.06%
JCDecaux Landmark First Co. 3,214,588 2.82%
JCDecaus Landmark Secord Co. 3,214,532 2.82%
Catcher Technology Co., Ltd 3,011,093 2.64%
United Asia Finance Ltd. 3,454,697 3.03%
China Airline Co. 3,453,453 3.02%
Total 257,800,144
b. To the same person and spouse, the relative within the second degree and the person or the spouse’s enterprise
Individual A 4,423,015 3.87%
Individual B 3,080,561 2.70%
Total 7,503,576
c. To the same related party enterprise
TBC Group 3,058,287 2.68%
APL Group 8,666,397 7.59%
MiTAC-Synnex Group 3,355,815 2.94%
AU Optronics (L) Corp. 11,881,307 10.41%
Gold East Trading Company Limited 4,841,090 4.24%
Far Eastern Group 5,886,932 5.16%
Lin Yuan Group 6,110,304 5.35%
Ruentex Group 7,279,756 6.38%
Sun Hung Kai Financial 3,764,816 3.30%
CITIC Group 12,883,993 11.28%
Innolux Corporation 3,806,536 3.33%
Chang Jiang Seamless Steel Tube Group 3,242,227 2.84%
Hon Hai Group 9,482,082 8.30%
Catcher Technology Co., Ltd. 3,061,327 2.68%
YFY Inc. 3,472,181 3.04%
Fubon Group 3,180,022 2.78%
Walsin Lihwa Corp. 4,554,338 3.99%
China Development Financial 3,374,210 2.96%
China Airline Co. 3,453,453 3.02%
Total 105,355,073
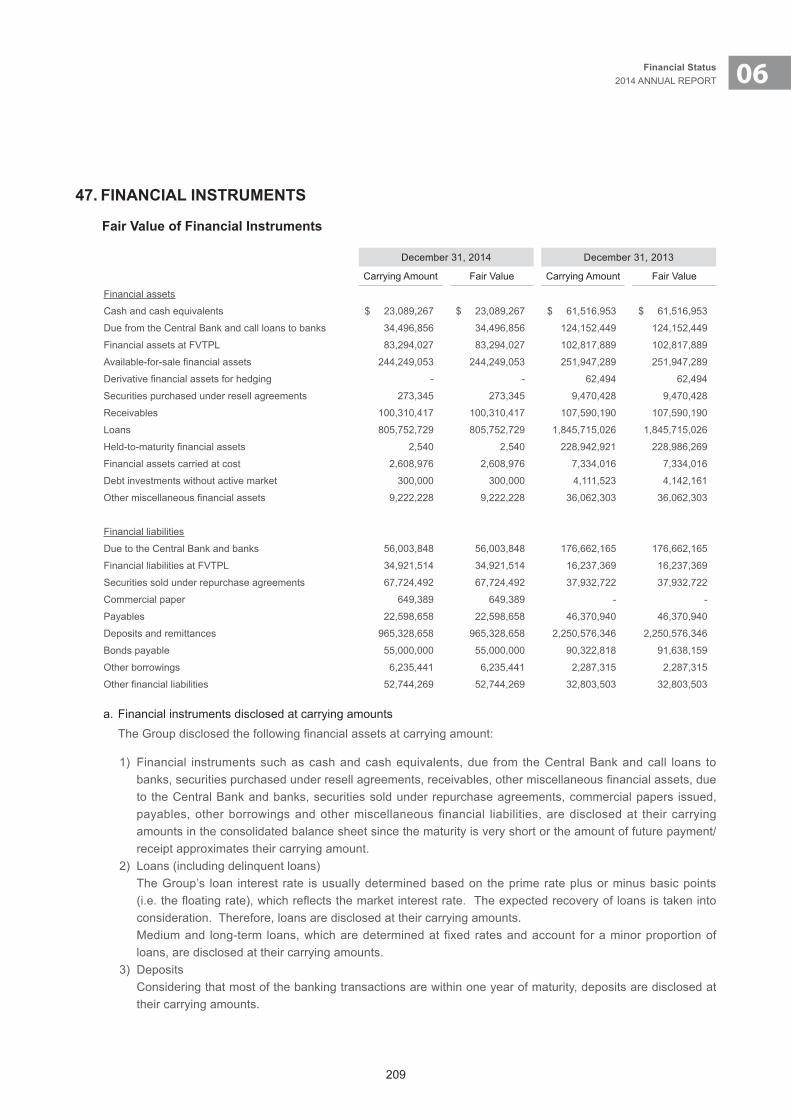
209
06Financial Status2014 ANNUAL REPORT
47. FINANCIAL INSTRUMENTS
Fair Value of Financial Instruments
December 31, 2014 December 31, 2013
Carrying Amount Fair Value Carrying Amount Fair Value
Financial assets
Cash and cash equivalents $ 23,089,267 $ 23,089,267 $ 61,516,953 $ 61,516,953
Due from the Central Bank and call loans to banks 34,496,856 34,496,856 124,152,449 124,152,449
Financial assets at FVTPL 83,294,027 83,294,027 102,817,889 102,817,889
Available-for-sale financial assets 244,249,053 244,249,053 251,947,289 251,947,289
Derivative financial assets for hedging - - 62,494 62,494
Securities purchased under resell agreements 273,345 273,345 9,470,428 9,470,428
Receivables 100,310,417 100,310,417 107,590,190 107,590,190
Loans 805,752,729 805,752,729 1,845,715,026 1,845,715,026
Held-to-maturity financial assets 2,540 2,540 228,942,921 228,986,269
Financial assets carried at cost 2,608,976 2,608,976 7,334,016 7,334,016
Debt investments without active market 300,000 300,000 4,111,523 4,142,161
Other miscellaneous financial assets 9,222,228 9,222,228 36,062,303 36,062,303
Financial liabilities
Due to the Central Bank and banks 56,003,848 56,003,848 176,662,165 176,662,165
Financial liabilities at FVTPL 34,921,514 34,921,514 16,237,369 16,237,369
Securities sold under repurchase agreements 67,724,492 67,724,492 37,932,722 37,932,722
Commercial paper 649,389 649,389 - -
Payables 22,598,658 22,598,658 46,370,940 46,370,940
Deposits and remittances 965,328,658 965,328,658 2,250,576,346 2,250,576,346
Bonds payable 55,000,000 55,000,000 90,322,818 91,638,159
Other borrowings 6,235,441 6,235,441 2,287,315 2,287,315
Other financial liabilities 52,744,269 52,744,269 32,803,503 32,803,503
a. Financial instruments disclosed at carrying amountsThe Group disclosed the following financial assets at carrying amount:
1) Financial instruments such as cash and cash equivalents, due from the Central Bank and call loans to banks, securities purchased under resell agreements, receivables, other miscellaneous financial assets, due to the Central Bank and banks, securities sold under repurchase agreements, commercial papers issued, payables, other borrowings and other miscellaneous financial liabilities, are disclosed at their carrying amounts in the consolidated balance sheet since the maturity is very short or the amount of future payment/receipt approximates their carrying amount.
2) Loans (including delinquent loans) The Group’s loan interest rate is usually determined based on the prime rate plus or minus basic points
(i.e. the floating rate), which reflects the market interest rate. The expected recovery of loans is taken into consideration. Therefore, loans are disclosed at their carrying amounts.
Medium and long-term loans, which are determined at fixed rates and account for a minor proportion of loans, are disclosed at their carrying amounts.
3) Deposits Considering that most of the banking transactions are within one year of maturity, deposits are disclosed at
their carrying amounts.

210
4) Bonds payable Except that Chang Hwa Bank’s fair-value-hedge bonds payable is disclosed at fair value, the rest are
disclosed at their carrying amounts. Those bonds were issued to enhance liquidity or capital management instead of earning short-term profits.
5) Financial assets carried at cost Since the fair value of financial assets carried at cost can not be reliably measured, the carrying amount is
disclosed instead of fair value.b. Financial instruments measured at fair value
The following table provides an analysis of financial instruments that are measured subsequent to initial recognition at fair value, grouped into Levels 1 to 3 based on the degree to which the fair value is observable:
(In Thousands of New Taiwan Dollars)
Fair Value Measurement of Financial Instruments
December 31, 2014Total Level 1 Level 2 Level 3
Non-derivative financial instrumentsAssets Financial assets at FVTPL Stocks and beneficial certificates $ 1,330,945 $ 752,562 $ 578,383 $ - Bond investments 25,866,464 11,549,144 14,317,320 - Others 20,863,757 - 20,863,757 - Available-for-sale financial assets Stocks and beneficial certificates 3,241,566 3,241,566 - - Bond investments 85,574,060 13,807,590. 71,766,470 - Others 155,433,427 335,430 154,623,995 474,002Derivative financial instrumentsAssets Financial assets at FVTPL 35,232,861 32,231 16,559,969 18,640,661Liabilities Financial liabilities at FVTPL 34,921,514 - 16,238,301 18,683,213
(In Thousands of New Taiwan Dollars)
Fair Value Measurement of Financial Instruments
December 31, 2013Total Level 1 Level 2 Level 3
Non-derivative financial instrumentsAssets Financial assets at FVTPL Stocks and beneficiary certificates $ 1,622,851 $ 1,128,744 $ 494,107 $ - Bond investments 26,960,973 13,839,329 13,121,644 - Others 54,263,030 - 54,263,030 - Financial assets designated as at FVTPL 3,676,994 - 124,067 3,552,927 Available-for-sale financial assets Stocks and beneficiary certificates 6,218,793 6,218,793 - - Bond investments 93,711,132 14,624,401 79,086,731 - Others 152,017,364 - 151,284,596 732,768 Liabilities Financial liabilities at FVTPL 301,503 301,503 - -Derivative financial instrumentsAssets Financial assets at FVTPL 16,294,041 60,848 11,105,254 5,127,939 Derivative financial assets for hedging 62,494 - 62,494 -Liabilities Financial liabilities at FVTPL 15,935,866 - 11,029,673 4,906,193

211
06Financial Status2014 ANNUAL REPORT
Note 1: Level 1 inputs are quoted prices in active markets for identical assets or liabilities. Active markets must have the following attributes: (A) assets or liabilities traded in the market are identical, (B) easiness of finding buyers and sellers in the principal (or most advantageous) market for the asset or liability that are both able and willing to transact, (C) pricing information are readily available to the public.
Note 2: Level 2 inputs are inputs other than quoted prices included within Level 1 that are observable for the asset or liability, either directly (e.g. price) or indirectly (e.g. value derived from price), in the active markets.a. Quoted prices of similar financial instruments in active market are the company’s fair value of financial instruments if based on recent
quoted price for similar financial instruments. Similar financial instruments should be decided in accordance with characteristics and transaction conditions of these instruments. Fair value of financial instruments will vary depending on factors specific to the similar asset or liability. The factors include: Prices are not current, price quotations vary substantially, transaction price between related parties, relevance of quoted price of similar instruments and the quoted price of financial instruments.
b. Quoted prices for identical or similar assets or liabilities in markets that are not active.c. Valuation models are used to measure fair value, and the inputs (e.g. interest rate, yield curve, and volatilities) are based on accessible
data from the markets (the observable inputs are inputs that reflect the assumptions market participants would use in pricing the asset or liability developed based on market data).
d. Inputs that are derived principally from or corroborated by observable market data by correlation or other means (market-corroborated inputs).
Note 3: Level 3 inputs are inputs that are not available in the market. Unobservable inputs are inputs such as historical volatilities used in option pricing model since historical volatilities are not representative of the expectation of volatilities of market participants.
c. Reconciliation of Level 3 fair value measurements of financial assets(In Thousands of New Taiwan Dollars)
For the Year Ended December 31, 2014
ItemBeginning Balance
Combined Individual
Effects
Valuation Gains (Losses)
Increase DecreaseEnding BalanceIn Net
Income
In Other Comprehen-sive Income
Buy or Issue
Transfer inSell,
DisposalTransfer
out
Financial assets at FVTPL
$ 8,680,866 ($ 3,552,927 ) $ 6,489,950 $ - $ 8,864,273 $ - ($ 1,841,501 ) $ - $ 18,640,661
Available-for-sale financial assets
732,768 42,852 ( 531 ) - - ( 301,087 ) - 474,002
Total $ 9,413,634 ($ 3,552,927 ) $ 6,532,802 ($ 531) $ 8,864,273 $ - ($ 2,142,588 ) $ - $ 19,114,663
(In Thousands of New Taiwan Dollars)
For the Year Ended December 31, 2013
ItemBeginning Balance
Valuation Gains (Losses) Increase DecreaseEnding BalanceIn Net
Income
In Other Comprehen-sive Income
Buy or Issue Transfer inSell,
DisposalTransfer out
Financial assets at FVTPL
$ 2,772,644 $ 511,744 $ - $ 6,193,533 $ - ($ 797,055 ) $ - $ 8,680,866
Available-for-sale financial assets
2,056,021 50,240 2,739 18,447 - ( 1,394,679 ) - 732,768
Total $ 4,828,665 $ 561,984 $ 2,739 $ 6,211,980 $ - ($ 2,191,734 ) $ - $ 9,413,634
Valuation gains (losses) above recognized in current profits or losses in the amounts of $(266,204) thousand and $244,709 thousand were attributed to gains (losses) on assets owned during the years ended December 31, 2014 and 2013, respectively.
Valuation gains (losses) above recognized in other comprehensive income in the amounts of $(531) thousand and $2,331 thousand were attributed to gains (losses) on assets owned during the years ended December 31, 2014 and 2013, respectively.
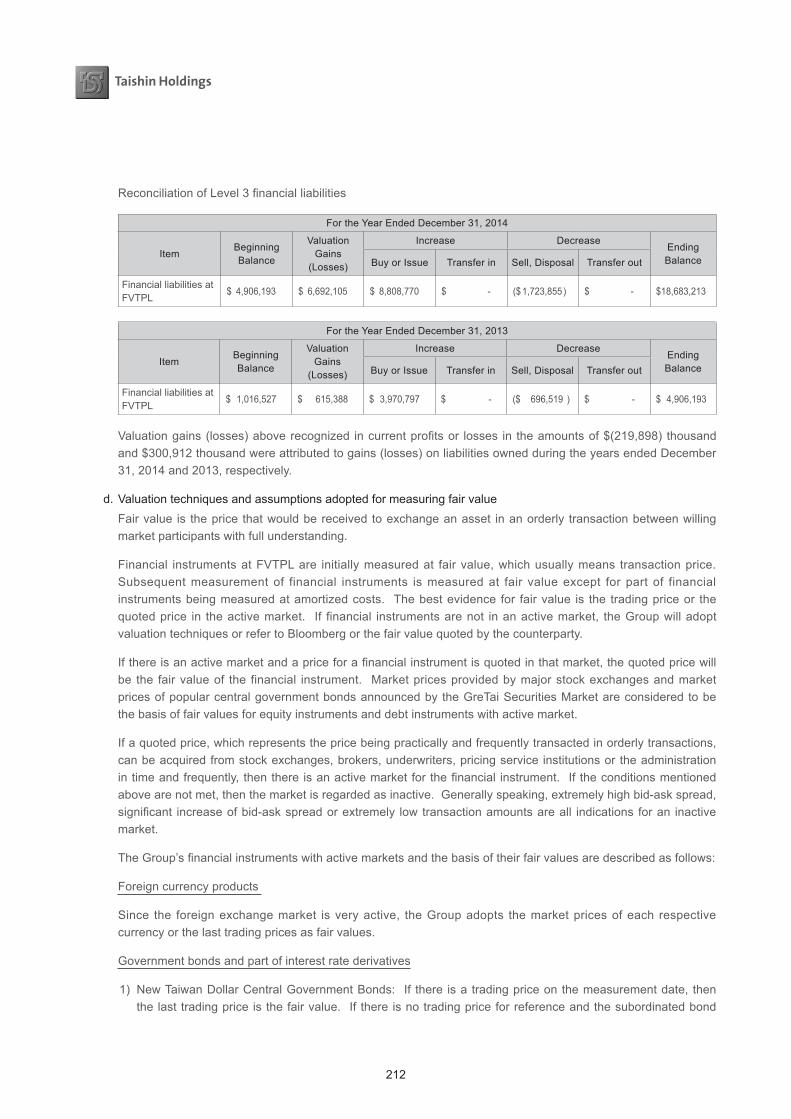
212
Reconciliation of Level 3 financial liabilities
For the Year Ended December 31, 2014
ItemBeginning Balance
Valuation Gains
(Losses)
Increase DecreaseEndingBalanceBuy or Issue Transfer in Sell, Disposal Transfer out
Financial liabilities at FVTPL $ 4,906,193 $ 6,692,105 $ 8,808,770 $ - ($ 1,723,855 ) $ - $ 18,683,213
For the Year Ended December 31, 2013
ItemBeginning Balance
Valuation Gains
(Losses)
Increase DecreaseEndingBalanceBuy or Issue Transfer in Sell, Disposal Transfer out
Financial liabilities at FVTPL $ 1,016,527 $ 615,388 $ 3,970,797 $ - ($ 696,519 ) $ - $ 4,906,193
Valuation gains (losses) above recognized in current profits or losses in the amounts of $(219,898) thousand and $300,912 thousand were attributed to gains (losses) on liabilities owned during the years ended December 31, 2014 and 2013, respectively.
d. Valuation techniques and assumptions adopted for measuring fair valueFair value is the price that would be received to exchange an asset in an orderly transaction between willing market participants with full understanding.
Financial instruments at FVTPL are initially measured at fair value, which usually means transaction price. Subsequent measurement of financial instruments is measured at fair value except for part of financial instruments being measured at amortized costs. The best evidence for fair value is the trading price or the quoted price in the active market. If financial instruments are not in an active market, the Group will adopt valuation techniques or refer to Bloomberg or the fair value quoted by the counterparty.
If there is an active market and a price for a financial instrument is quoted in that market, the quoted price will be the fair value of the financial instrument. Market prices provided by major stock exchanges and market prices of popular central government bonds announced by the GreTai Securities Market are considered to be the basis of fair values for equity instruments and debt instruments with active market.
If a quoted price, which represents the price being practically and frequently transacted in orderly transactions, can be acquired from stock exchanges, brokers, underwriters, pricing service institutions or the administration in time and frequently, then there is an active market for the financial instrument. If the conditions mentioned above are not met, then the market is regarded as inactive. Generally speaking, extremely high bid-ask spread, significant increase of bid-ask spread or extremely low transaction amounts are all indications for an inactive market.
The Group’s financial instruments with active markets and the basis of their fair values are described as follows:
Foreign currency products
Since the foreign exchange market is very active, the Group adopts the market prices of each respective currency or the last trading prices as fair values.
Government bonds and part of interest rate derivatives
1) New Taiwan Dollar Central Government Bonds: If there is a trading price on the measurement date, then the last trading price is the fair value. If there is no trading price for reference and the subordinated bond
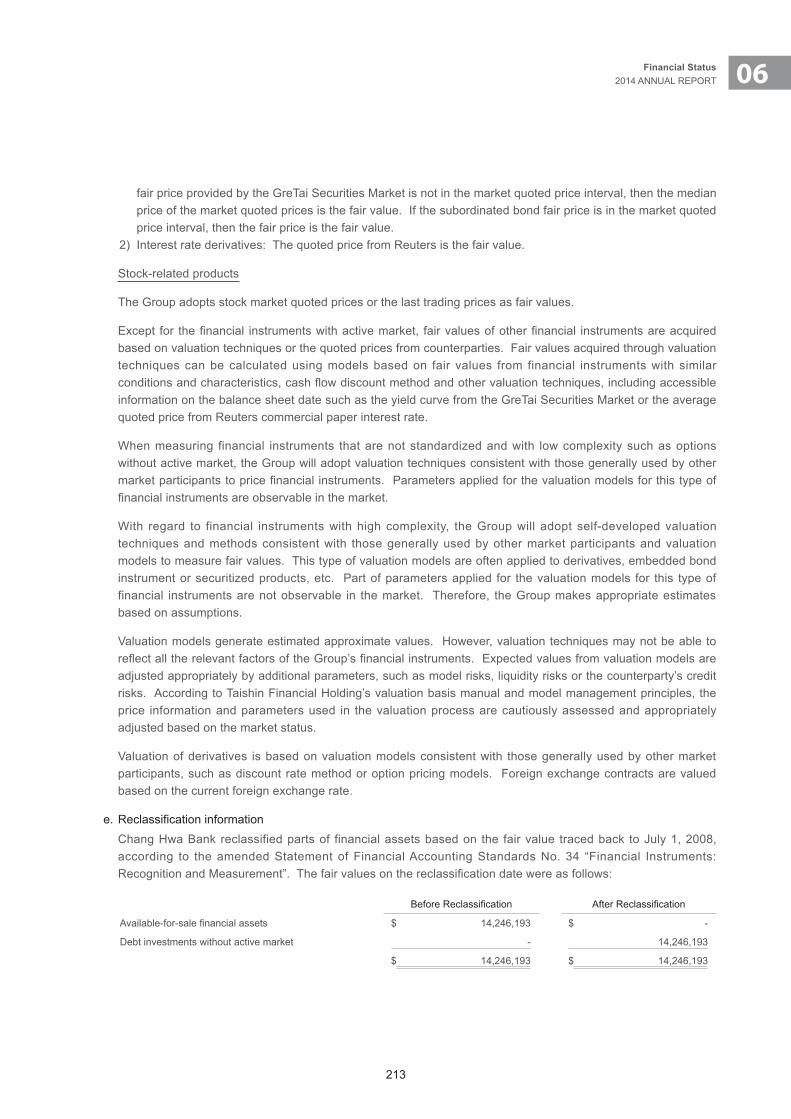
213
06Financial Status2014 ANNUAL REPORT
fair price provided by the GreTai Securities Market is not in the market quoted price interval, then the median price of the market quoted prices is the fair value. If the subordinated bond fair price is in the market quoted price interval, then the fair price is the fair value.
2) Interest rate derivatives: The quoted price from Reuters is the fair value.
Stock-related products
The Group adopts stock market quoted prices or the last trading prices as fair values.
Except for the financial instruments with active market, fair values of other financial instruments are acquired based on valuation techniques or the quoted prices from counterparties. Fair values acquired through valuation techniques can be calculated using models based on fair values from financial instruments with similar conditions and characteristics, cash flow discount method and other valuation techniques, including accessible information on the balance sheet date such as the yield curve from the GreTai Securities Market or the average quoted price from Reuters commercial paper interest rate.
When measuring financial instruments that are not standardized and with low complexity such as options without active market, the Group will adopt valuation techniques consistent with those generally used by other market participants to price financial instruments. Parameters applied for the valuation models for this type of financial instruments are observable in the market.
With regard to financial instruments with high complexity, the Group will adopt self-developed valuation techniques and methods consistent with those generally used by other market participants and valuation models to measure fair values. This type of valuation models are often applied to derivatives, embedded bond instrument or securitized products, etc. Part of parameters applied for the valuation models for this type of financial instruments are not observable in the market. Therefore, the Group makes appropriate estimates based on assumptions.
Valuation models generate estimated approximate values. However, valuation techniques may not be able to reflect all the relevant factors of the Group’s financial instruments. Expected values from valuation models are adjusted appropriately by additional parameters, such as model risks, liquidity risks or the counterparty’s credit risks. According to Taishin Financial Holding’s valuation basis manual and model management principles, the price information and parameters used in the valuation process are cautiously assessed and appropriately adjusted based on the market status.
Valuation of derivatives is based on valuation models consistent with those generally used by other market participants, such as discount rate method or option pricing models. Foreign exchange contracts are valued based on the current foreign exchange rate.
e. Reclassification informationChang Hwa Bank reclassified parts of financial assets based on the fair value traced back to July 1, 2008, according to the amended Statement of Financial Accounting Standards No. 34 “Financial Instruments: Recognition and Measurement”. The fair values on the reclassification date were as follows:
Before Reclassification After Reclassification
Available-for-sale financial assets $ 14,246,193 $ -
Debt investments without active market - 14,246,193
$ 14,246,193 $ 14,246,193
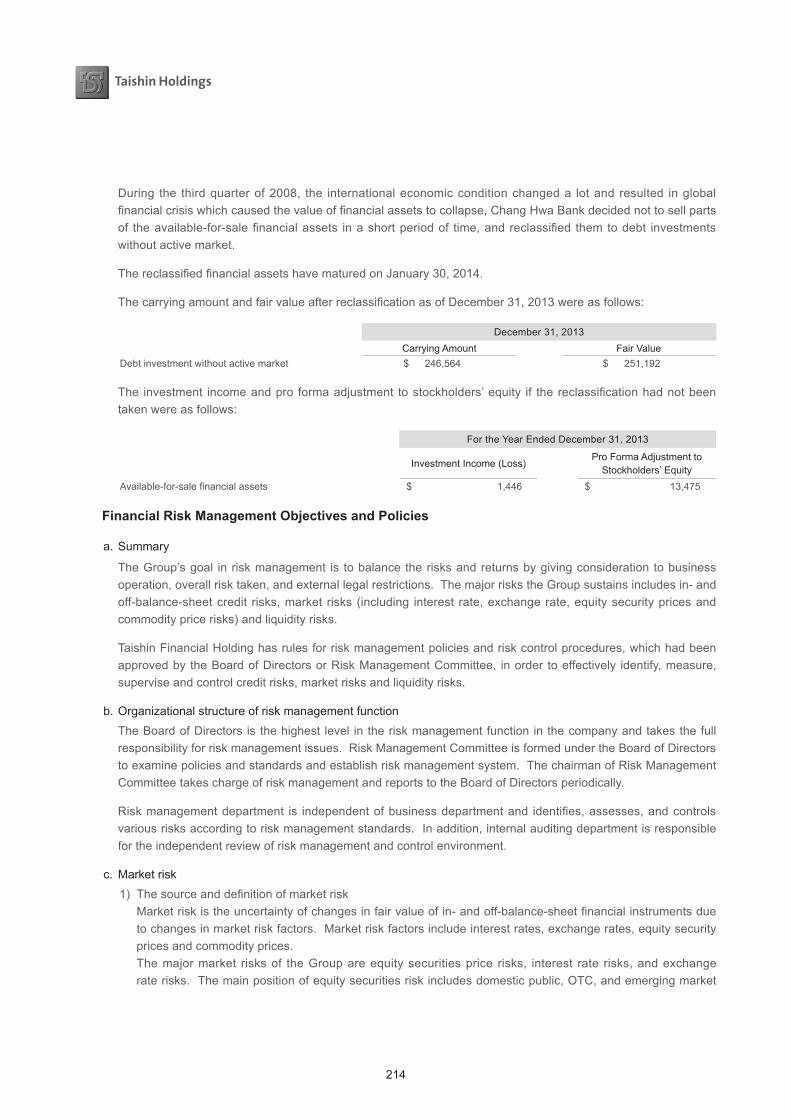
214
During the third quarter of 2008, the international economic condition changed a lot and resulted in global financial crisis which caused the value of financial assets to collapse, Chang Hwa Bank decided not to sell parts of the available-for-sale financial assets in a short period of time, and reclassified them to debt investments without active market.
The reclassified financial assets have matured on January 30, 2014.
The carrying amount and fair value after reclassification as of December 31, 2013 were as follows:
December 31, 2013Carrying Amount Fair Value
Debt investment without active market $ 246,564 $ 251,192
The investment income and pro forma adjustment to stockholders’ equity if the reclassification had not been taken were as follows:
For the Year Ended December 31, 2013
Investment Income (Loss) Pro Forma Adjustment to
Stockholders’ Equity Available-for-sale financial assets $ 1,446 $ 13,475
Financial Risk Management Objectives and Policies
a. Summary
The Group’s goal in risk management is to balance the risks and returns by giving consideration to business operation, overall risk taken, and external legal restrictions. The major risks the Group sustains includes in- and off-balance-sheet credit risks, market risks (including interest rate, exchange rate, equity security prices and commodity price risks) and liquidity risks.
Taishin Financial Holding has rules for risk management policies and risk control procedures, which had been approved by the Board of Directors or Risk Management Committee, in order to effectively identify, measure, supervise and control credit risks, market risks and liquidity risks.
b. Organizational structure of risk management functionThe Board of Directors is the highest level in the risk management function in the company and takes the full responsibility for risk management issues. Risk Management Committee is formed under the Board of Directors to examine policies and standards and establish risk management system. The chairman of Risk Management Committee takes charge of risk management and reports to the Board of Directors periodically.
Risk management department is independent of business department and identifies, assesses, and controls various risks according to risk management standards. In addition, internal auditing department is responsible for the independent review of risk management and control environment.
c. Market risk1) The source and definition of market risk Market risk is the uncertainty of changes in fair value of in- and off-balance-sheet financial instruments due
to changes in market risk factors. Market risk factors include interest rates, exchange rates, equity security prices and commodity prices.
The major market risks of the Group are equity securities price risks, interest rate risks, and exchange rate risks. The main position of equity securities risk includes domestic public, OTC, and emerging market

215
06Financial Status2014 ANNUAL REPORT
stocks, domestic stock index options and stock index futures. The main position of interest rate risk includes bonds and interest derivative instruments, such as interest rate swap. The main position of exchange rate risk includes the Group’s investments denominated in foreign currencies, such as foreign currency spots and foreign currency options.
2) Market risk management policy Taishin Financial Holding’s risk management policy was approved by the Board of Directors and is the
highest guidance and principle of risk management. Risk management policy clearly defines the risk management procedures for risk identifying, risk measuring,
risk controlling and risk reporting, which are executed by risk management department independent of trading and other departments. The risk management department develops management principles for different businesses and for various aspects of market risk management based on the risk management policy. It establishes market risk management system and regulates market risks, risk limits and stress tests of various financial assets.
3) Market risk management proceduresa) Identifying risks and measuring possible effects The Group’s risk management department identifies the exposures of positions or new financial
instruments to market risks and measures the gains and losses on positions held due to changes in market risk factors based on standards; the risk management department calculates price sensitivity and gains and losses on positions are recorded in trading books daily; and calculates the maximum potential losses recorded in each trading book monthly. The Group wants to avoid tremendous losses that will harm the Group’s operations due to overwhelming changes in market risk factors.
b) Controlling of risk and reporting of issues The Group controls market risk by managing risk limits. The risk management department sets various
trading limits, such as position limits, stop-loss limits, and maximum potential loss. The trading limits are implemented only after they are reported to and approved by the Board of Directors.
The risk management department calculates exposures and estimated gains and losses on positions daily to make sure that the positions held and losses do not exceed the limits approved by the Board of Directors and prepares reports to the high-level management and the Board of Directors periodically for their sufficient understanding of the implementation of the market risk management work and, if necessary, issuance of additional guidance.
The risk management department reports important market risk issues, such as discovery of possible loss on positions in each trading book or identification of weakness in the market risk management system, to the Risk Management Committee in order to improve the effectiveness of the market risk management.
4) Trading book market risk management Based on the related risk management standards, the Group classifies financial instruments into trading
books and banking books according to the purpose of holding the instruments and manages them with different methods. Trading book position consists of trading purpose financial instruments or commodities held to hedge positions in trading books. A position is for trading purpose if it is intended to be sold within a short period; profit can be earned from actual or expected short-term price fluctuations which are the reasons for dealing, matched principal brokering or market making position.
Principles of trading book market risk management are as follows:a) Management strategy The goal of trading book market risk management is to pursue maximum return on capital, meaning
maximizing the capital usage efficiency to improve stockholders’ interest. In order to control market risks, the risk management department sets risk limits for various investment
portfolio based on trading strategies, category of trading products and annual profit goals in order to control exposure to risks on positions and losses.
216
b) Management principles The Group stipulated “Principles of Market Risk Limit Management”, “Regulations Governing Market Risk
Management”, “Procedures for Operating Derivative Assets Transactions” and operating principles for various financial instruments to manage trading book limits.
c) Valuation gains and losses If objective prices of financial instruments in various trading books exist in open market, such as
trading prices, gains and losses on positions are valued in accordance with the market prices by the risk management department. If fair value data is inaccessible, the risk management department will cautiously adopt verified mathematical models to value gains and losses and review the assumptions and parameters of the valuation models periodically.
d) Risk measuring methods The methods applied by the risk management department in measuring market risks are as follows:
i. Measure the price sensitivity of various risk factors (i.e. Greeks), such as the effect on the valuations of foreign currency position of a 1% change in exchange rate or the effect on option position valuation due to changes in Greeks.
ii. Please refer to item 9 for the risk assumptions and calculation methods.iii. Measure potential losses resulting from extreme market volatility in order to assess capital adequacy
and essential position adjustments.5) Trading book interest rate risk management
a) Definition of interest rate risk Interest rate risk is fair value changes in interest rate risk position held by the Group due to interest rate
changes. The risks are mainly in debt securities and interest rate derivatives. b) Measuring methods The risk management department applies sensitivity analysis or Value at Risk to measure interest
rate risk and calculates stress loss of risk position held. In sensitivity analysis, the interest rate factor sensitivity is measured by DV01, which is the change in the value of interest rate risk positions when the yield curve moves upward by one basis point (1bp). Please refer to item 9 for the risk assumptions and calculation methods.
c) Management procedures The risk management department defines the interest rate related products that can be undertaken
among trading book investment portfolio and set the total limit of DV01, the limit of DV01 in each time band and the stop-loss limits in order to control exposure risks on position losses. If the losses reach the stop-loss limit, then the trading department should decrease risk exposure positions so as to control losses.
6) Exchange rate risk managementa) Definition of exchange rate risk Exchange rate risk is the gain or loss resulting from exchange or translation of two different foreign
currencies at different times. The Group’s exchange rate risk mainly comes from spot and forward exchange positions and forward exchange options.
b) Measuring methods The risk management department applies sensitivity analysis or Value at Risk to measure exchange rate
risk and calculates stress loss of risk position held. In sensitivity analysis, Delta is applied to measure the exchange rate risk of the first order change and Gamma is applied to measure the exchange rate risk of the second order change. In addition, Vega is used to measure the first order risk of implied volatility rate. Please refer to item 9 for the risk assumptions and calculation methods.

217
06Financial Status2014 ANNUAL REPORT
c) Management procedures The risk management department sets the position limit and stop-loss limit of trading book investment
combinations in order to control exchange rate risk. If the losses reach the stop-loss limit, the trading department should decrease risk exposure positions so as to control losses.
7) Equity security price risk managementa) Definition of equity security price risk Equity security price risk is the valuation effect on the position held by the Group when the equity security
price changes. The Group’s equity security price risk mainly comes from public and OTC stocks, index futures and options.
b) Measuring methods The risk management department applies sensitivity analysis or Value at Risk to measure equity security
price risk and calculates stress loss of risk position held. In sensitivity analysis, Delta is applied to measure the independent equity security price risk of the first order change, or market value is applied to indicate the exposure risks on positions of stocks. Please refer to item 9 for the risk assumptions and calculation methods.
c) Management procedures The risk management department sets the position limit and stop-loss limit of trading book investment
portfolio in order to control equity security price risk. If the losses reach the stop-loss limit, then the trading department should decrease risk exposure position so as to control losses.
8) Banking book interest rate risk management Taishin Bank Banking book interest rate risk involves bonds and bills and their hedge position, which are held to manage
the Bank’s liquidity risk and the interest rate risk of deposits and loans undertaken by business departments. The interest rate risk is transferred to banking book management department for centralized management through internal fund transfer pricing (FTP) system. Banking book interest rate risk is the effect on net interest income of risk exposure positions held due to changes in interest rate. There is no secondary market for loan transactions and the purpose of holding banking book investment position is to establish deposit reserve. This is different from short-term holding for pursuing profit in trading book. Banking book interest rate risks are regulated separately by the risk management department. a) Management strategy The goal of banking book interest rate risk management is to control interest rate risk position and
pursue stability and growth of banking book net interest income under the circumstances that liquidity is appropriate.
b) Management principles Taishin Bank stipulated “The Principles of Banking Book Interest Rate Risk Management” as the
important control regulations for banking book interest rate risk management.c) Measuring methods The banking book interest rate risk is the risk of quantitative or repricing term differences due to the
differences in amounts and maturity or repricing dates of banking book assets, liabilities and off-balance-sheet items. Taishin Bank measures the effect on net interest income when the yield curve moves upward by 1bp.
d) Management procedures Taishin Bank defines the instruments of banking book interest rate management and sets the limit of
interest rate risk in order to avoid severe recession of net interest income when the interest rate changes unfavorably. The banking book management unit sets limits and keeps the interest rate risk within the limits.
218
9) Methods for measuring market risk Taishin Bank
a) Stress test A stress test is applied to measure loss under extremely unfavorable market circumstances in order
to assess financial institutions’ tolerance to extreme market volatility. The risk management unit is required to execute the stress test at least once a month to calculate trading book stress loss. The risk management unit observes historical information of market price and sets the biggest possible volatility range for various market risk factors as the stress circumstance, which should be approved by the Risk Management Committee. Since there are so many market risk factors that affect trading book position, there might be plenty of permutation and combination of stress circumstances when the unit calculates stress loss. For instance, change in a market risk factor might result in the biggest loss of one investment portfolio but create profits for another investment portfolio. Based on the conservative principles, the risk management unit will take into account correlation between various risk factors to calculate the biggest loss as the stress loss.
The risk management unit should confirm that overall trading book loss does not exceed the stress loss limit and report to the high-level management as references for adjusting positions or resource distribution.
b) Value at risk, “VaR” Taishin Bank uses variety of methods to control market risk; the VaR is one of them. Taishin Bank is
using risk model to assess the value of trading portfolios and potential loss amount of holding positions. VaR is Taishin Bank’s important internal risk control system, and the board of directors reviews and establishes trading portfolio’s limits annually. Actual exposures of Taishin Bank are monitored daily by risk management.
VaR is used to estimate adverse market potential loss of existing positions. The VaR model uses historical simulation method, a one-year historical observation period, the estimate of 99% confidence interval, the maximum possible amount of loss holding positions for one day, and the probability that actual losses may exceed the estimate.
For the Year Ended December 31, 2014Average Highest Lowest Ending Balance
Exchange VaR $ 14,715 $ 57,436 $ 8,986 $ 12,977Interest rate VaR 23,893 37,345 14,644 12,276Equity securities VaR 22,744 33,225 14,007 19,226Value at risk 31,873 65,583 22,600 38,832
For the Year Ended December 31, 2013Average Highest Lowest Ending Balance
Exchange VaR $ 9,968 $ 106,580 $ 2,936 $ 9,783Interest rate VaR 18,291 27,316 10,922 22,008Equity securities VaR 19,786 32,803 11,692 22,540Value at risk 32,899 122,749 11,767 27,294
c) Information of exchange rate risk concentration For information regarding Taishin Bank’s non-functional currency financial assets and liabilities on the
balance sheet date, please refer to Note 55. Taishin Securities B VaR is the potential highest loss for a period within certain confidence interval. For the year ended
December 31, 2014, Taishin Securities B’s VaR factors were as follows:December 31, 2014
Highest Average Lowest Ending BalanceValue at risk (VaR) $ 38,110 $ 33,603 $ 28,968 $ 32,404
219
06Financial Status2014 ANNUAL REPORT
d. Credit risk1) Source and definition Credit risk means the possible loss due to failure of debtors or counterparties to fulfill their contractual
obligations or their ability of fulfill contractual obligations is impaired. Credit risk arises from the operation, on- and off-balance-sheet items, including credit loans, derivatives transactions and securities investment, etc. Because the business becomes more complex, the credit risk is often generated with other risks that affect one another. For example, exchange rate risk also exists in foreign currency debt investment. Secured loans will be affected by the price volatility on the collaterals and market liquidity risk of the collaterals.Credit risk can be divided into the following categories based on the object and nature of business:a) Credit risk Credit risk is the risk that a borrower is unable to pay its debts or fulfill its debt commitments in credit
loans operation.b) Issuer (guarantor) risk of the underlying issue It is the credit risk that stock issuers go into liquidation or are unable to pay back money when debts, bills
and other securities mature.c) Counterparty risk It is the credit risk that the counterparty undertaking OTC derivatives or RP/RS transactions are unable to
fulfill settlement obligations.Counterparty risk is also divided into settlement risk and pre-settlement risk.i. Settlement risk It is the loss resulting from the counterparty failing to deliver goods or other money on the settlement
date when the Group had fulfilled settlement obligations.ii. Pre-settlement risk It is the loss resulting from the counterparty failing to fulfill settlement or pay the obligations and from
changes in market prices before the settlement date.d) Other credit risks Country risk, custodian risk and brokers risk, etc.
2) Credit risk management policies Taishin Bank To ensure its credit risk under control within the tolerable range, Taishin Bank has stipulated in the guidelines
for risk management that for all the products provided and businesses conducted, including all on- and off-balance-sheet transactions in the banking and trading books, Taishin Bank should make detailed analyses to identify existing and potential credit risks. Before launching new products or businesses, Taishin Bank ensures compliance with all applicable rules and regulations and identifies relevant credit risks. For sophisticated credit extensions, such as accounts receivable factoring and credit derivative instruments, Taishin Bank also establishes risk management system described in the related rules and guidelines.
Unless the assessment of asset qualities and provision for potential losses of the overseas business department is regulated by the local authorities, it is in accordance with Taishin Bank’s risk management policies and guidelines.
The measurement and management procedures of credit risks in Taishin Bank’s main businesses are as follows:a) Credit granting business (including loans and guarantees) Classification of credit assets and level of credit quality are summarized as follows:
i. Classification of credit assets Taishin Bank’s credit assets are classified into five categories. Except for normal credit assets
classified as “Category One”, the remaining unsound credit assets are evaluated based on the status of the loan collaterals and the length of time overdue. Assets that require special mention
220
are classified as “Category Two”, assets that are substandard are classified as “Category Three”, assets that are doubtful are classified as “Category Four”, and assets with existing loss are classified as “Category Five”. In order to manage the problematic credit loans, the reorganization of loan loss provisions, allowance for bad debts or guarantee liability provisions, measures are adopted for overdue loans and procedures and for collecting default loans. In the management of credit assets, Taishin Bank is also guided by the “Regulations Governing the Procedures for Corporation Credit Business to Evaluate Assets and Deal with Non-performing Assets”, “Measures for Corporation Credit Business to Be Taken When Credit Extensions Become Past Due and Regulations Governing Collection Procedures”, “Regulations Governing the Procedures for Consumer Business to Evaluate Assets and Deal with Non-performing Assets”, “Regulations Governing the Procedures for Overdue Loan, Non-accrual Loans and Doubtful Loans”.
ii. Credit risk rating For risk management purposes, Taishin Bank rates credit qualities (by using internal rating models for
credit risk or credit score tables) in accordance with the nature and scale of a business. The credit risk rating system is internal rating based on the definition of Basel II of internal rating
method (IRB). It covers operation procedures, methodology, control mechanism, information system and data collection, which is used to assist risk assessment, rating approval and loss assessment.
The corporate finance department’s internal rating adopts two aspects. One is obligor risk rating (ORR) and the other is Facility Risk Rating (FRR). ORR is used to assess the possibility of the debtor performing financial commitments, which is a quantitative value based on the probability of default (PD) within one year. FRR is used to assess the effect of rating structures and collateral conditions on credit rating, which is a quantitative value based on loss given default (LGD). At the same time, experts also engage in judging and adjusting the rating overrides of statistic models to make up the shortage of the model.
The consumer finance department’s internal rating system adopts product characteristic and debtor condition (such as new case or behavior grading) as the basis of segmentation. It is to ensure that the same pools of debtors and risk exposure are homogeneous. At the same time, review of loans based on experts’ override is complemented to make up the shortage of the model.
b) Due from and call loans to banks Taishin Bank evaluates the credit status of counterparties before deals are closed. Taishin Bank grants
different limits to the counterparties based on their respective credit ratings as suggested by external qualified credit rating institutes.
c) Security Investment and financial derivatives transaction Regarding the credit risk of security investments and financial derivatives, Taishin Bank manages the risk
by internal credit rating of issuers, issued underlying, counterparties, and by external credit rating of debt instruments and counterparties or status of regions/countries.
The other banks with which Taishin Bank conducts derivative transactions are mostly considered investment grade. The credits extended to counterparties that are not rated as investment grade are assessed case by case. The credits extended to counterparties are monitored in accordance with the related contract terms and conditions, and the credit limits for derivatives established in normal credit granting processes. Meanwhile, Taishin Bank has set the total position limit on trading and banking book securities and each issuer’s limit based on credit ratings.
3) Credit risk hedging or mitigation policiesTaishin Banka) Collaterals Taishin Bank has a series of measures for credit granting to reduce credit risks. One of the procedures is
asking for collaterals from the borrowers. To secure the loans, Taishin Bank manages and assesses the collaterals following the procedures that suggest the scope of collateralization and valuation of collaterals
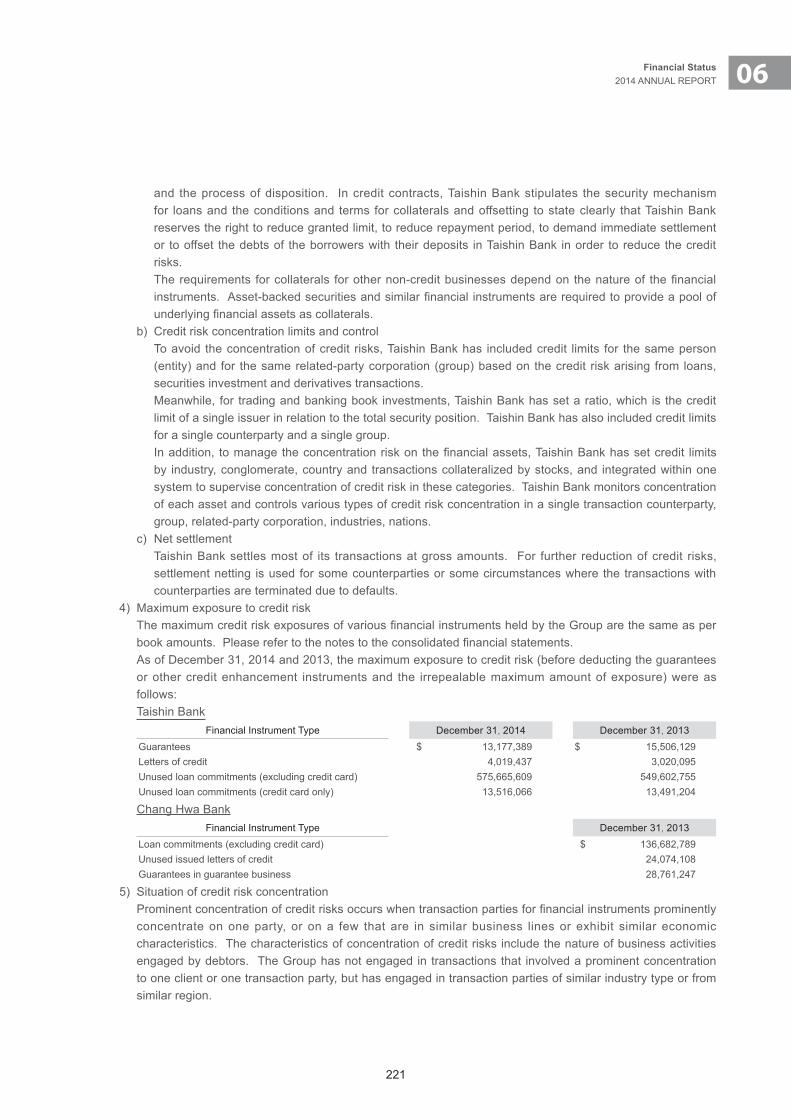
221
06Financial Status2014 ANNUAL REPORT
and the process of disposition. In credit contracts, Taishin Bank stipulates the security mechanism for loans and the conditions and terms for collaterals and offsetting to state clearly that Taishin Bank reserves the right to reduce granted limit, to reduce repayment period, to demand immediate settlement or to offset the debts of the borrowers with their deposits in Taishin Bank in order to reduce the credit risks.
The requirements for collaterals for other non-credit businesses depend on the nature of the financial instruments. Asset-backed securities and similar financial instruments are required to provide a pool of underlying financial assets as collaterals.
b) Credit risk concentration limits and control To avoid the concentration of credit risks, Taishin Bank has included credit limits for the same person
(entity) and for the same related-party corporation (group) based on the credit risk arising from loans, securities investment and derivatives transactions.
Meanwhile, for trading and banking book investments, Taishin Bank has set a ratio, which is the credit limit of a single issuer in relation to the total security position. Taishin Bank has also included credit limits for a single counterparty and a single group.
In addition, to manage the concentration risk on the financial assets, Taishin Bank has set credit limits by industry, conglomerate, country and transactions collateralized by stocks, and integrated within one system to supervise concentration of credit risk in these categories. Taishin Bank monitors concentration of each asset and controls various types of credit risk concentration in a single transaction counterparty, group, related-party corporation, industries, nations.
c) Net settlement Taishin Bank settles most of its transactions at gross amounts. For further reduction of credit risks,
settlement netting is used for some counterparties or some circumstances where the transactions with counterparties are terminated due to defaults.
4) Maximum exposure to credit risk The maximum credit risk exposures of various financial instruments held by the Group are the same as per
book amounts. Please refer to the notes to the consolidated financial statements. As of December 31, 2014 and 2013, the maximum exposure to credit risk (before deducting the guarantees
or other credit enhancement instruments and the irrepealable maximum amount of exposure) were as follows:
Taishin BankFinancial Instrument Type December 31, 2014 December 31, 2013
Guarantees $ 13,177,389 $ 15,506,129Letters of credit 4,019,437 3,020,095Unused loan commitments (excluding credit card) 575,665,609 549,602,755Unused loan commitments (credit card only) 13,516,066 13,491,204
Chang Hwa BankFinancial Instrument Type December 31, 2013
Loan commitments (excluding credit card) $ 136,682,789Unused issued letters of credit 24,074,108Guarantees in guarantee business 28,761,247
5) Situation of credit risk concentration Prominent concentration of credit risks occurs when transaction parties for financial instruments prominently
concentrate on one party, or on a few that are in similar business lines or exhibit similar economic characteristics. The characteristics of concentration of credit risks include the nature of business activities engaged by debtors. The Group has not engaged in transactions that involved a prominent concentration to one client or one transaction party, but has engaged in transaction parties of similar industry type or from similar region.
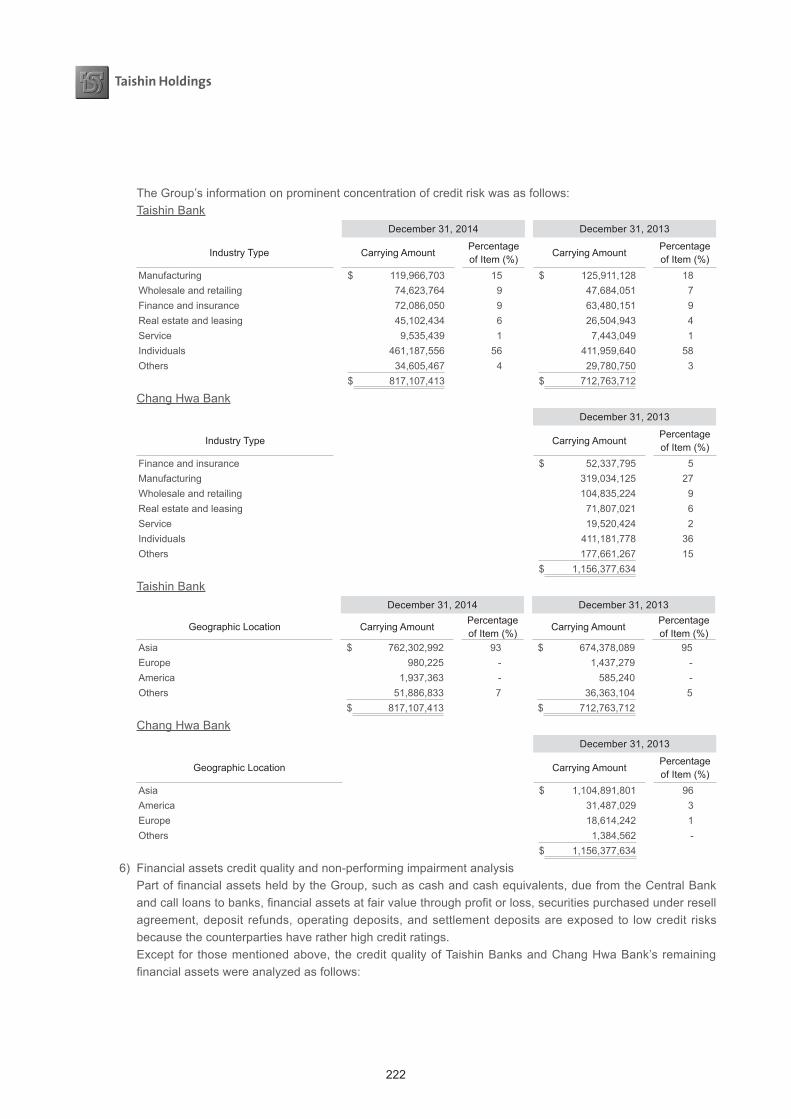
222
The Group’s information on prominent concentration of credit risk was as follows: Taishin Bank
December 31, 2014 December 31, 2013
Industry Type Carrying AmountPercentage of Item (%)
Carrying AmountPercentage of Item (%)
Manufacturing $ 119,966,703 15 $ 125,911,128 18Wholesale and retailing 74,623,764 9 47,684,051 7Finance and insurance 72,086,050 9 63,480,151 9Real estate and leasing 45,102,434 6 26,504,943 4Service 9,535,439 1 7,443,049 1Individuals 461,187,556 56 411,959,640 58Others 34,605,467 4 29,780,750 3
$ 817,107,413 $ 712,763,712
Chang Hwa BankDecember 31, 2013
Industry Type Carrying AmountPercentage of Item (%)
Finance and insurance $ 52,337,795 5Manufacturing 319,034,125 27Wholesale and retailing 104,835,224 9Real estate and leasing 71,807,021 6Service 19,520,424 2Individuals 411,181,778 36Others 177,661,267 15
$ 1,156,377,634
Taishin BankDecember 31, 2014 December 31, 2013
Geographic Location Carrying AmountPercentage of Item (%)
Carrying AmountPercentage of Item (%)
Asia $ 762,302,992 93 $ 674,378,089 95Europe 980,225 - 1,437,279 -America 1,937,363 - 585,240 -Others 51,886,833 7 36,363,104 5
$ 817,107,413 $ 712,763,712
Chang Hwa BankDecember 31, 2013
Geographic Location Carrying AmountPercentage of Item (%)
Asia $ 1,104,891,801 96America 31,487,029 3Europe 18,614,242 1Others 1,384,562 -
$ 1,156,377,634
6) Financial assets credit quality and non-performing impairment analysis Part of financial assets held by the Group, such as cash and cash equivalents, due from the Central Bank
and call loans to banks, financial assets at fair value through profit or loss, securities purchased under resell agreement, deposit refunds, operating deposits, and settlement deposits are exposed to low credit risks because the counterparties have rather high credit ratings.
Except for those mentioned above, the credit quality of Taishin Banks and Chang Hwa Bank’s remaining financial assets were analyzed as follows:
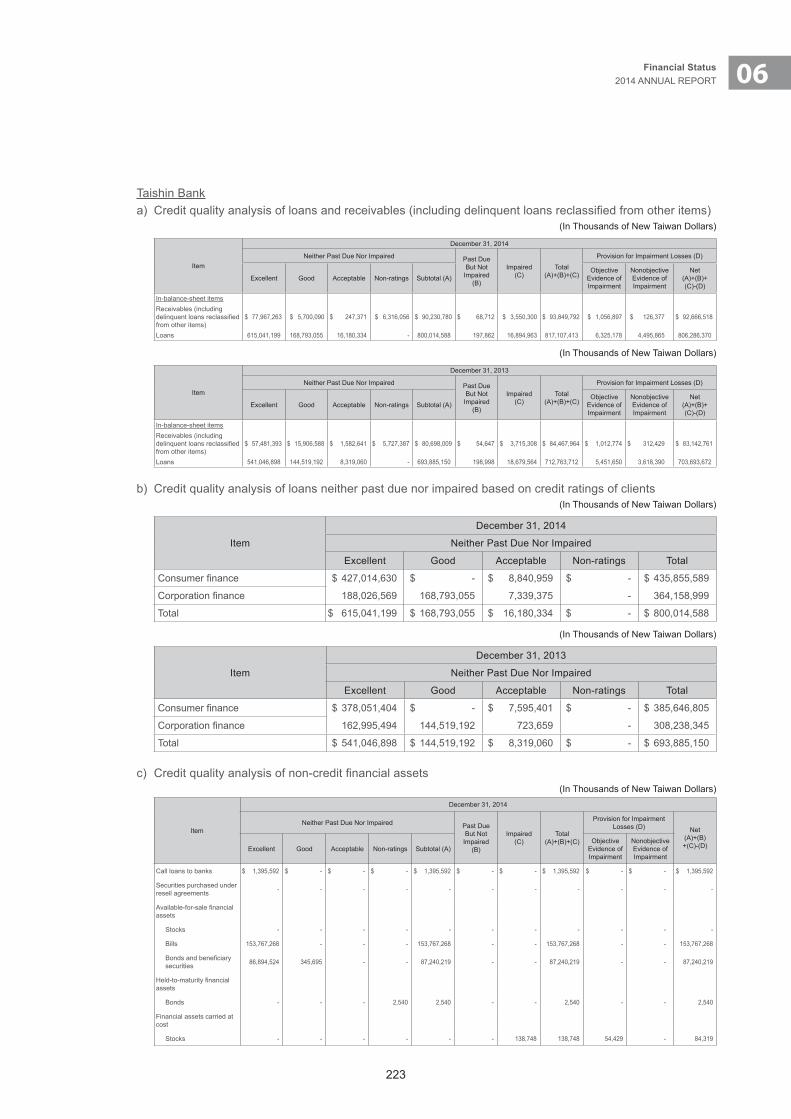
223
06Financial Status2014 ANNUAL REPORT
Taishin Banka) Credit quality analysis of loans and receivables (including delinquent loans reclassified from other items)
(In Thousands of New Taiwan Dollars)
Item
December 31, 2014
Neither Past Due Nor Impaired Past Due But Not
Impaired (B)
Impaired (C)
Total(A)+(B)+(C)
Provision for Impairment Losses (D)
Excellent Good Acceptable Non-ratings Subtotal (A)Objective
Evidence of Impairment
Nonobjective Evidence of Impairment
Net(A)+(B)+(C)-(D)
In-balance-sheet itemsReceivables (including delinquent loans reclassified from other items)
$ 77,967,263 $ 5,700,090 $ 247,371 $ 6,316,056 $ 90,230,780 $ 68,712 $ 3,550,300 $ 93,849,792 $ 1,056,897 $ 126,377 $ 92,666,518
Loans 615,041,199 168,793,055 16,180,334 - 800,014,588 197,862 16,894,963 817,107,413 6,325,178 4,495,865 806,286,370
(In Thousands of New Taiwan Dollars)
Item
December 31, 2013
Neither Past Due Nor Impaired Past Due But Not
Impaired (B)
Impaired (C)
Total(A)+(B)+(C)
Provision for Impairment Losses (D)
Excellent Good Acceptable Non-ratings Subtotal (A)Objective
Evidence of Impairment
Nonobjective Evidence of Impairment
Net(A)+(B)+(C)-(D)
In-balance-sheet itemsReceivables (including delinquent loans reclassified from other items)
$ 57,481,393 $ 15,906,588 $ 1,582,641 $ 5,727,387 $ 80,698,009 $ 54,647 $ 3,715,308 $ 84,467,964 $ 1,012,774 $ 312,429 $ 83,142,761
Loans 541,046,898 144,519,192 8,319,060 - 693,885,150 198,998 18,679,564 712,763,712 5,451,650 3,618,390 703,693,672
b) Credit quality analysis of loans neither past due nor impaired based on credit ratings of clients(In Thousands of New Taiwan Dollars)
Item
December 31, 2014
Neither Past Due Nor Impaired
Excellent Good Acceptable Non-ratings Total
Consumer finance $ 427,014,630 $ - $ 8,840,959 $ - $ 435,855,589
Corporation finance 188,026,569 168,793,055 7,339,375 - 364,158,999
Total $ 615,041,199 $ 168,793,055 $ 16,180,334 $ - $ 800,014,588
(In Thousands of New Taiwan Dollars)
Item
December 31, 2013
Neither Past Due Nor Impaired
Excellent Good Acceptable Non-ratings Total
Consumer finance $ 378,051,404 $ - $ 7,595,401 $ - $ 385,646,805
Corporation finance 162,995,494 144,519,192 723,659 - 308,238,345
Total $ 541,046,898 $ 144,519,192 $ 8,319,060 $ - $ 693,885,150
c) Credit quality analysis of non-credit financial assets(In Thousands of New Taiwan Dollars)
Item
December 31, 2014
Neither Past Due Nor Impaired Past Due But Not
Impaired (B)
Impaired (C)
Total(A)+(B)+(C)
Provision for Impairment Losses (D) Net
(A)+(B)+(C)-(D)Excellent Good Acceptable Non-ratings Subtotal (A)
Objective Evidence of Impairment
Nonobjective Evidence of Impairment
Call loans to banks $ 1,395,592 $ - $ - $ - $ 1,395,592 $ - $ - $ 1,395,592 $ - $ - $ 1,395,592
Securities purchased under resell agreements - - - - - - - - - - -
Available-for-sale financial assets
Stocks - - - - - - - - - - -
Bills 153,767,268 - - - 153,767,268 - - 153,767,268 - - 153,767,268
Bonds and beneficiary securities 86,894,524 345,695 - - 87,240,219 - - 87,240,219 - - 87,240,219
Held-to-maturity financial assets
Bonds - - - 2,540 2,540 - - 2,540 - - 2,540
Financial assets carried at cost
Stocks - - - - - - 138,748 138,748 54,429 - 84,319
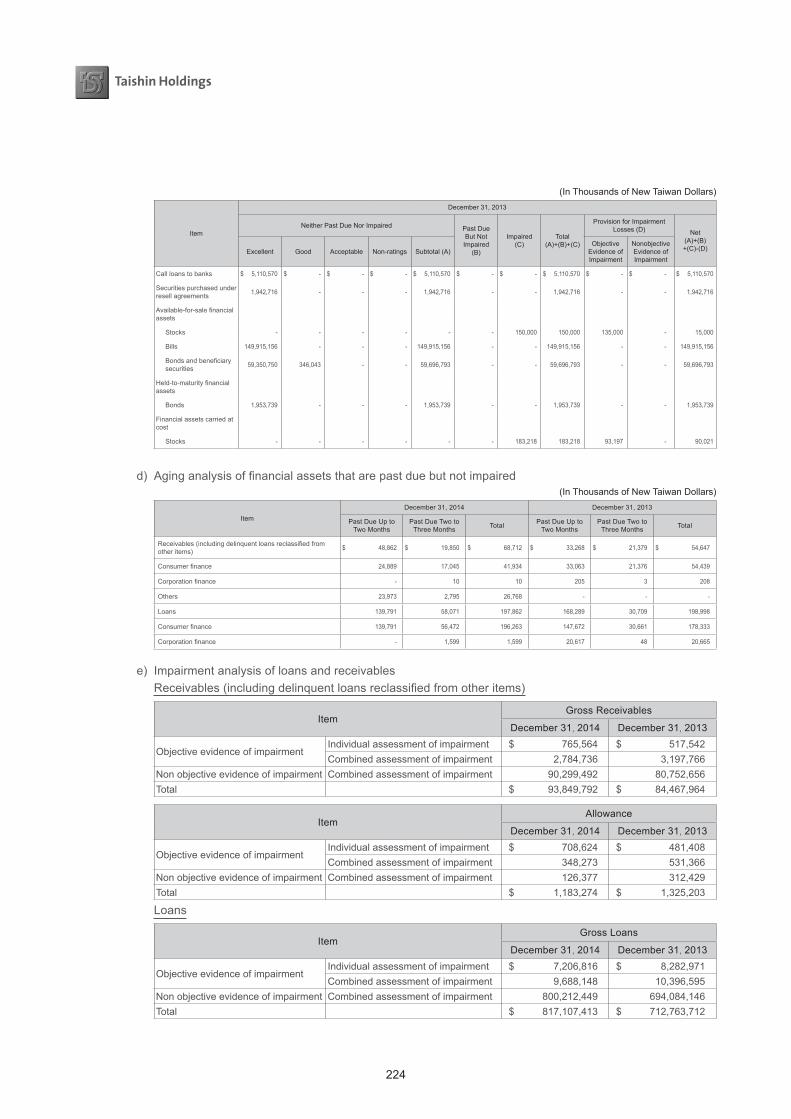
224
(In Thousands of New Taiwan Dollars)
Item
December 31, 2013
Neither Past Due Nor Impaired Past Due But Not
Impaired (B)
Impaired (C)
Total(A)+(B)+(C)
Provision for Impairment Losses (D) Net
(A)+(B)+(C)-(D)Excellent Good Acceptable Non-ratings Subtotal (A)
Objective Evidence of Impairment
Nonobjective Evidence of Impairment
Call loans to banks $ 5,110,570 $ - $ - $ - $ 5,110,570 $ - $ - $ 5,110,570 $ - $ - $ 5,110,570
Securities purchased under resell agreements 1,942,716 - - - 1,942,716 - - 1,942,716 - - 1,942,716
Available-for-sale financial assets
Stocks - - - - - - 150,000 150,000 135,000 - 15,000
Bills 149,915,156 - - - 149,915,156 - - 149,915,156 - - 149,915,156
Bonds and beneficiary securities 59,350,750 346,043 - - 59,696,793 - - 59,696,793 - - 59,696,793
Held-to-maturity financial assets
Bonds 1,953,739 - - - 1,953,739 - - 1,953,739 - - 1,953,739
Financial assets carried at cost
Stocks - - - - - - 183,218 183,218 93,197 - 90,021
d) Aging analysis of financial assets that are past due but not impaired(In Thousands of New Taiwan Dollars)
Item
December 31, 2014 December 31, 2013
Past Due Up to Two Months
Past Due Two to Three Months Total Past Due Up to
Two MonthsPast Due Two to
Three Months Total
Receivables (including delinquent loans reclassified from other items) $ 48,862 $ 19,850 $ 68,712 $ 33,268 $ 21,379 $ 54,647
Consumer finance 24,889 17,045 41,934 33,063 21,376 54,439
Corporation finance - 10 10 205 3 208
Others 23,973 2,795 26,768 - - -
Loans 139,791 58,071 197,862 168,289 30,709 198,998
Consumer finance 139,791 56,472 196,263 147,672 30,661 178,333
Corporation finance - 1,599 1,599 20,617 48 20,665
e) Impairment analysis of loans and receivables Receivables (including delinquent loans reclassified from other items)
ItemGross Receivables
December 31, 2014 December 31, 2013
Objective evidence of impairmentIndividual assessment of impairment $ 765,564 $ 517,542Combined assessment of impairment 2,784,736 3,197,766
Non objective evidence of impairment Combined assessment of impairment 90,299,492 80,752,656Total $ 93,849,792 $ 84,467,964
ItemAllowance
December 31, 2014 December 31, 2013
Objective evidence of impairmentIndividual assessment of impairment $ 708,624 $ 481,408Combined assessment of impairment 348,273 531,366
Non objective evidence of impairment Combined assessment of impairment 126,377 312,429Total $ 1,183,274 $ 1,325,203
Loans
ItemGross Loans
December 31, 2014 December 31, 2013
Objective evidence of impairmentIndividual assessment of impairment $ 7,206,816 $ 8,282,971Combined assessment of impairment 9,688,148 10,396,595
Non objective evidence of impairment Combined assessment of impairment 800,212,449 694,084,146Total $ 817,107,413 $ 712,763,712
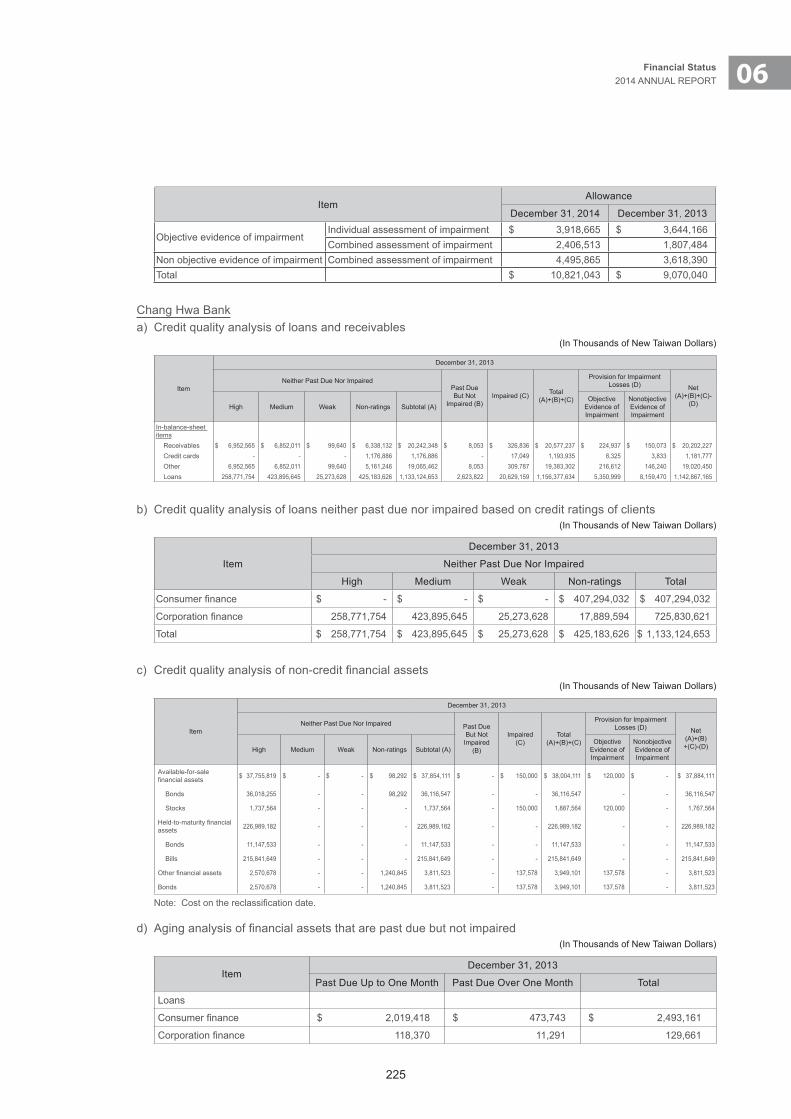
225
06Financial Status2014 ANNUAL REPORT
ItemAllowance
December 31, 2014 December 31, 2013
Objective evidence of impairmentIndividual assessment of impairment $ 3,918,665 $ 3,644,166Combined assessment of impairment 2,406,513 1,807,484
Non objective evidence of impairment Combined assessment of impairment 4,495,865 3,618,390Total $ 10,821,043 $ 9,070,040
Chang Hwa Banka) Credit quality analysis of loans and receivables
(In Thousands of New Taiwan Dollars)
Item
December 31, 2013
Neither Past Due Nor ImpairedPast Due But Not
Impaired (B)Impaired (C) Total
(A)+(B)+(C)
Provision for Impairment Losses (D) Net
(A)+(B)+(C)-(D)High Medium Weak Non-ratings Subtotal (A)
Objective Evidence of Impairment
Nonobjective Evidence of Impairment
In-balance-sheet items Receivables $ 6,952,565 $ 6,852,011 $ 99,640 $ 6,338,132 $ 20,242,348 $ 8,053 $ 326,836 $ 20,577,237 $ 224,937 $ 150,073 $ 20,202,227 Credit cards - - - 1,176,886 1,176,886 - 17,049 1,193,935 8,325 3,833 1,181,777 Other 6,952,565 6,852,011 99,640 5,161,246 19,065,462 8,053 309,787 19,383,302 216,612 146,240 19,020,450 Loans 258,771,754 423,895,645 25,273,628 425,183,626 1,133,124,653 2,623,822 20,629,159 1,156,377,634 5,350,999 8,159,470 1,142,867,165
b) Credit quality analysis of loans neither past due nor impaired based on credit ratings of clients(In Thousands of New Taiwan Dollars)
Item
December 31, 2013
Neither Past Due Nor Impaired
High Medium Weak Non-ratings Total
Consumer finance $ - $ - $ - $ 407,294,032 $ 407,294,032
Corporation finance 258,771,754 423,895,645 25,273,628 17,889,594 725,830,621
Total $ 258,771,754 $ 423,895,645 $ 25,273,628 $ 425,183,626 $ 1,133,124,653
c) Credit quality analysis of non-credit financial assets(In Thousands of New Taiwan Dollars)
Item
December 31, 2013
Neither Past Due Nor Impaired Past Due But Not
Impaired (B)
Impaired (C)
Total(A)+(B)+(C)
Provision for Impairment Losses (D) Net
(A)+(B)+(C)-(D)High Medium Weak Non-ratings Subtotal (A)
Objective Evidence of Impairment
Nonobjective Evidence of Impairment
Available-for-sale financial assets $ 37,755,819 $ - $ - $ 98,292 $ 37,854,111 $ - $ 150,000 $ 38,004,111 $ 120,000 $ - $ 37,884,111
Bonds 36,018,255 - - 98,292 36,116,547 - - 36,116,547 - - 36,116,547
Stocks 1,737,564 - - - 1,737,564 - 150,000 1,887,564 120,000 - 1,767,564
Held-to-maturity financial assets 226,989,182 - - - 226,989,182 - - 226,989,182 - - 226,989,182
Bonds 11,147,533 - - - 11,147,533 - - 11,147,533 - - 11,147,533
Bills 215,841,649 - - - 215,841,649 - - 215,841,649 - - 215,841,649
Other financial assets 2,570,678 - - 1,240,845 3,811,523 - 137,578 3,949,101 137,578 - 3,811,523
Bonds 2,570,678 - - 1,240,845 3,811,523 - 137,578 3,949,101 137,578 - 3,811,523
Note: Cost on the reclassification date.
d) Aging analysis of financial assets that are past due but not impaired(In Thousands of New Taiwan Dollars)
ItemDecember 31, 2013
Past Due Up to One Month Past Due Over One Month Total
Loans
Consumer finance $ 2,019,418 $ 473,743 $ 2,493,161
Corporation finance 118,370 11,291 129,661

226
e) Impairment analysis of loans and receivables Receivables
ItemDecember 31, 2013
Gross Receivable AllowanceObjective evidence of impairment
Individual assessment of impairment $ 274,622 $ 202,569Combined assessment of impairment 52,214 22,368
Non objective evidence of impairment
Combined assessment of impairment 20,250,401 150,073
Total $ 20,577,237 $ 375,010Note: The amount of gross receivables excluded the amount of allowance for receivables and adjustments for discount (premium).
Loans
ItemDecember 31, 2013
Gross Loans AllowanceObjective evidence of impairment
Individual assessment of impairment $ 17,986,505 $ 4,627,909Combined assessment of impairment 2,642,654 723,090
Non objective evidence of impairment
Combined assessment of impairment 1,135,748,475 8,159,470
Total $ 1,156,377,634 $ 13,510,469Note: The amount of gross loans excluded the amount of allowance for loans and adjustment for discount (premium).
e. Liquidity risk1) The source and definition of liquidity risk Liquidity risk is the potential loss that the Group may suffer due to inability to liquidate assets or raise
enough funds in reasonable time to perform obligations when due and to meet the demands of assets growth. Sources of liquidity risk are as follows:a) Inability to fulfill funding gap due to asymmetric time and amount in cash inflows and outflows.b) Liabilities paid off in advance before maturity, inability to maintain liabilities at maturity or inability to
acquire funds from the market.c) Inability to liquidate current assets at reasonable price or raising funds to fulfill funding gap with price
higher than the reasonable one. Except for the liquidity risks arising from normal operation, the Group’s liquidity might be affected by events
such as credit ratings being downgraded, credibility seriously damaged, financial system’s system risk, causing customers to lack confidence and canceling deposits before maturity, call loans from banks being suspended, RS or RP transactions being deterred and liquidity of financial assets decreasing.
2) Liquidity risk management policy Taishin Bank The objective of liquidity risk management is to ensure that Taishin Bank can acquire funds at reasonable
price to pay off debts, perform obligations and contingent liabilities and satisfy demands required by business growth either in normal operation or under sudden, serious and unusual circumstances. Taishin Bank has established policies on assets and liabilities management that stipulate related liquidity risk management rules and principles, stipulate clear distinction between accountability and responsibility of Asset and Liability Committee and management departments and regulate the limits of liquidity risk, risk measuring, risk monitoring and the scope and procedures of reporting to ensure that overall liquidity risk is within the limits of liquidity risk approved by the Board of Directors. Basic principles of liquidity risk management policy are as follows:a) Principle of risk diversification: Taishin Bank should avoid excessively concentrating funds on the same
maturity, instruments, currencies, regions, funding sources or counterparties.b) Principle of stability: Taishin Bank should follow stable strategies and pay attention to market and internal
funding liquidity. For example, Taishin Bank should absorb the core deposits at appropriate time in order
227
06Financial Status2014 ANNUAL REPORT
to prevent market volatility from affecting funding sources and thus lower dependence on unstable fund sources.
c) Principle of maintaining appropriate asset liquidity: Market liquidity will indirectly affect funding liquidity. Therefore, Taishin Bank should make sure total assets can pay off total liabilities and maintain certain proportion of assets with high liquidity or collaterals in order to finance funds and pay off current liabilities in critical and urgent time.
d) Principle of matching asset and liability maturity: Taishin Bank should pay attention to the spread of maturity and liquidity of liquid assets and current assets should be sufficient to pay off current liabilities.
For urgent or sudden liquidity events, Taishin Bank has stipulated urgent fund dispatching handling plan as the highest principle for urgent events in order to integrate the Bank’s resources quickly to resolve emergencies efficiently.
Taishin Securities B Taishin Securities B’s funding liquidity risk management incorporates funding sources, funding application
and gap management. Key control points are as follows:a) Funding sources: Other than ensuring stability and risk diversification of funding sources, Taishin
Securities B maintains sufficient credit limits in order to cope with volatility risk from unexpected funding supply.
b) Funding application: When assessing investment income, Taishin Securities B ensures its liquidity and safety in order to cope with liquidity risk from unexpected funding needs.
c) Gap management: Taishin Securities B implements funding gap management of various term structures in order to efficiently control unexpected fund dispatching
Market liquidity risk includes on- and off-balance-sheet transactions. To make sure that market liquidity of positions with low liquidity is within tolerable range, Taishin Securities B stipulated in its risk management rules that it should carefully analyze and efficiently identify existing and potential market liquidity risk in order to operate in coordination with Taishin Securities B’s business development and Taishin Financial Holding’s overall risk appetite. Before promoting new products and business, Taishin Securities B should also scrutinize related operation rules and confirm related market liquidity risk.
The market liquidity management procedures and measuring methods of Taishin Securities B’s major business are as follows:a) When closeout of a position with low amount of market transactions and low liquidity occurs, impairment
is generated due to increase of bid-ask premium and extension of covered time. Therefore, liquidity reserve is drawn based on product categories in internal assessment to avoid biased assessment.
b) The proportion limit is calculated as the sum of position, which is the amount of quoted and OTC stocks over one-day average volume, of the investment portfolio. The ratio is set to implement control.
c) The volume of holding a single stock and the volume of accounting for investment portfolio is limited to a certain amount in order to implement control.
d) The proportion of the volume of a single convertible bond issued to the volume of outstanding portfolio is limited to a certain amount in order to implement control.
3) Financial assets held to manage liquidity risk and maturity analysis Financial assets held to manage liquidity risk: The Group holds cash and cash equivalents, due from the Central Bank and banks and available-for-sale
and held-to-maturity financial assets held for the purpose of managing liquidity risk, in order to perform contracted obligations when due and meet the needs of urgent fund dispatching.
Maturity analysis: Taishin Bank
a) Maturity analysis of non-derivative financial liabilities Taishin Bank’s non-derivative financial liabilities presented based on the residual maturities from the
balance sheet date to the contract maturity date were as follows:
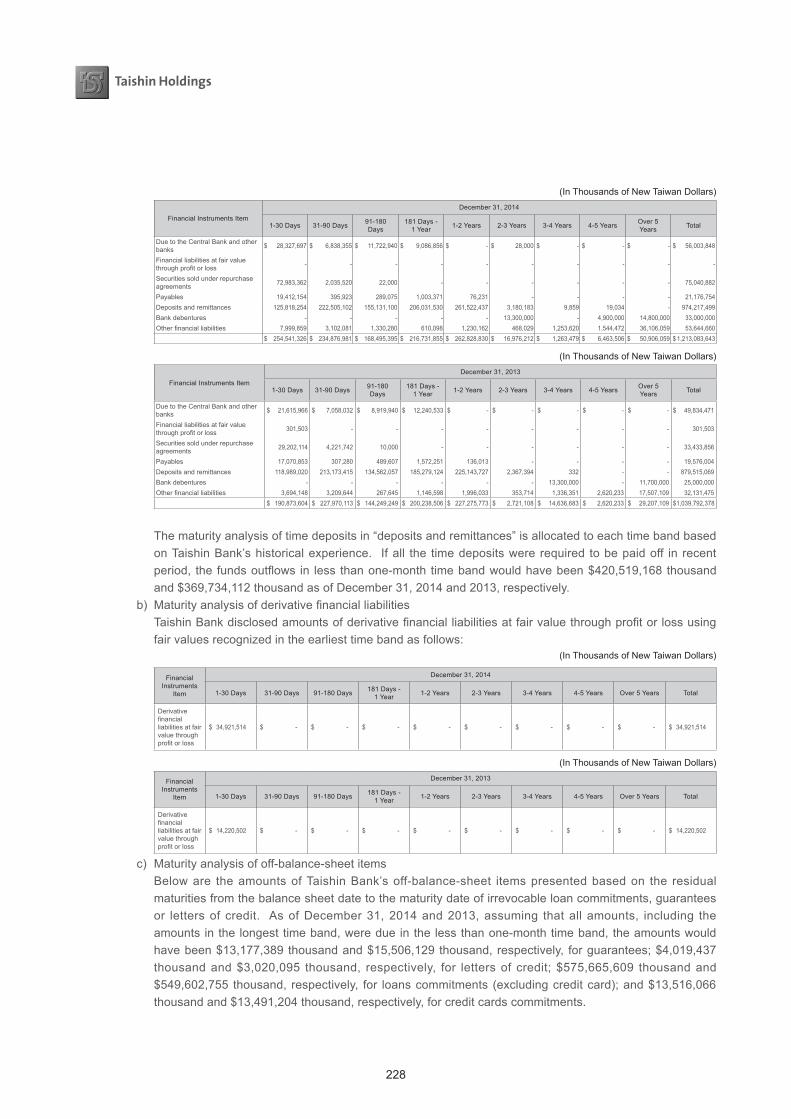
228
(In Thousands of New Taiwan Dollars)
Financial Instruments Item
December 31, 2014
1-30 Days 31-90 Days 91-180 Days
181 Days - 1 Year 1-2 Years 2-3 Years 3-4 Years 4-5 Years Over 5
Years Total
Due to the Central Bank and other banks $ 28,327,697 $ 6,838,355 $ 11,722,940 $ 9,086,856 $ - $ 28,000 $ - $ - $ - $ 56,003,848
Financial liabilities at fair value through profit or loss - - - - - - - - - -
Securities sold under repurchase agreements 72,983,362 2,035,520 22,000 - - - - - - 75,040,882
Payables 19,412,154 395,923 289,075 1,003,371 76,231 - - - - 21,176,754Deposits and remittances 125,818,254 222,505,102 155,131,100 206,031,530 261,522,437 3,180,183 9,859 19,034 - 974,217,499Bank debentures - - - - - 13,300,000 - 4,900,000 14,800,000 33,000,000Other financial liabilities 7,999,859 3,102,081 1,330,280 610,098 1,230,162 468,029 1,253,620 1,544,472 36,106,059 53,644,660
$ 254,541,326 $ 234,876,981 $ 168,495,395 $ 216,731,855 $ 262,828,830 $ 16,976,212 $ 1,263,479 $ 6,463,506 $ 50,906,059 $ 1,213,083,643
(In Thousands of New Taiwan Dollars)
Financial Instruments Item
December 31, 2013
1-30 Days 31-90 Days 91-180 Days
181 Days - 1 Year 1-2 Years 2-3 Years 3-4 Years 4-5 Years Over 5
Years Total
Due to the Central Bank and other banks $ 21,615,966 $ 7,058,032 $ 8,919,940 $ 12,240,533 $ - $ - $ - $ - $ - $ 49,834,471
Financial liabilities at fair value through profit or loss 301,503 - - - - - - - - 301,503
Securities sold under repurchase agreements 29,202,114 4,221,742 10,000 - - - - - - 33,433,856
Payables 17,070,853 307,280 489,607 1,572,251 136,013 - - - - 19,576,004Deposits and remittances 118,989,020 213,173,415 134,562,057 185,279,124 225,143,727 2,367,394 332 - - 879,515,069Bank debentures - - - - - - 13,300,000 - 11,700,000 25,000,000Other financial liabilities 3,694,148 3,209,644 267,645 1,146,598 1,996,033 353,714 1,336,351 2,620,233 17,507,109 32,131,475
$ 190,873,604 $ 227,970,113 $ 144,249,249 $ 200,238,506 $ 227,275,773 $ 2,721,108 $ 14,636,683 $ 2,620,233 $ 29,207,109 $ 1,039,792,378
The maturity analysis of time deposits in “deposits and remittances” is allocated to each time band based on Taishin Bank’s historical experience. If all the time deposits were required to be paid off in recent period, the funds outflows in less than one-month time band would have been $420,519,168 thousand and $369,734,112 thousand as of December 31, 2014 and 2013, respectively.
b) Maturity analysis of derivative financial liabilities Taishin Bank disclosed amounts of derivative financial liabilities at fair value through profit or loss using
fair values recognized in the earliest time band as follows:(In Thousands of New Taiwan Dollars)
Financial Instruments
Item
December 31, 2014
1-30 Days 31-90 Days 91-180 Days 181 Days - 1 Year 1-2 Years 2-3 Years 3-4 Years 4-5 Years Over 5 Years Total
Derivative financial liabilities at fair value through profit or loss
$ 34,921,514 $ - $ - $ - $ - $ - $ - $ - $ - $ 34,921,514
(In Thousands of New Taiwan Dollars)
Financial Instruments
Item
December 31, 2013
1-30 Days 31-90 Days 91-180 Days 181 Days - 1 Year 1-2 Years 2-3 Years 3-4 Years 4-5 Years Over 5 Years Total
Derivative financial liabilities at fair value through profit or loss
$ 14,220,502 $ - $ - $ - $ - $ - $ - $ - $ - $ 14,220,502
c) Maturity analysis of off-balance-sheet items Below are the amounts of Taishin Bank’s off-balance-sheet items presented based on the residual
maturities from the balance sheet date to the maturity date of irrevocable loan commitments, guarantees or letters of credit. As of December 31, 2014 and 2013, assuming that all amounts, including the amounts in the longest time band, were due in the less than one-month time band, the amounts would have been $13,177,389 thousand and $15,506,129 thousand, respectively, for guarantees; $4,019,437 thousand and $3,020,095 thousand, respectively, for letters of credit; $575,665,609 thousand and $549,602,755 thousand, respectively, for loans commitments (excluding credit card); and $13,516,066 thousand and $13,491,204 thousand, respectively, for credit cards commitments.
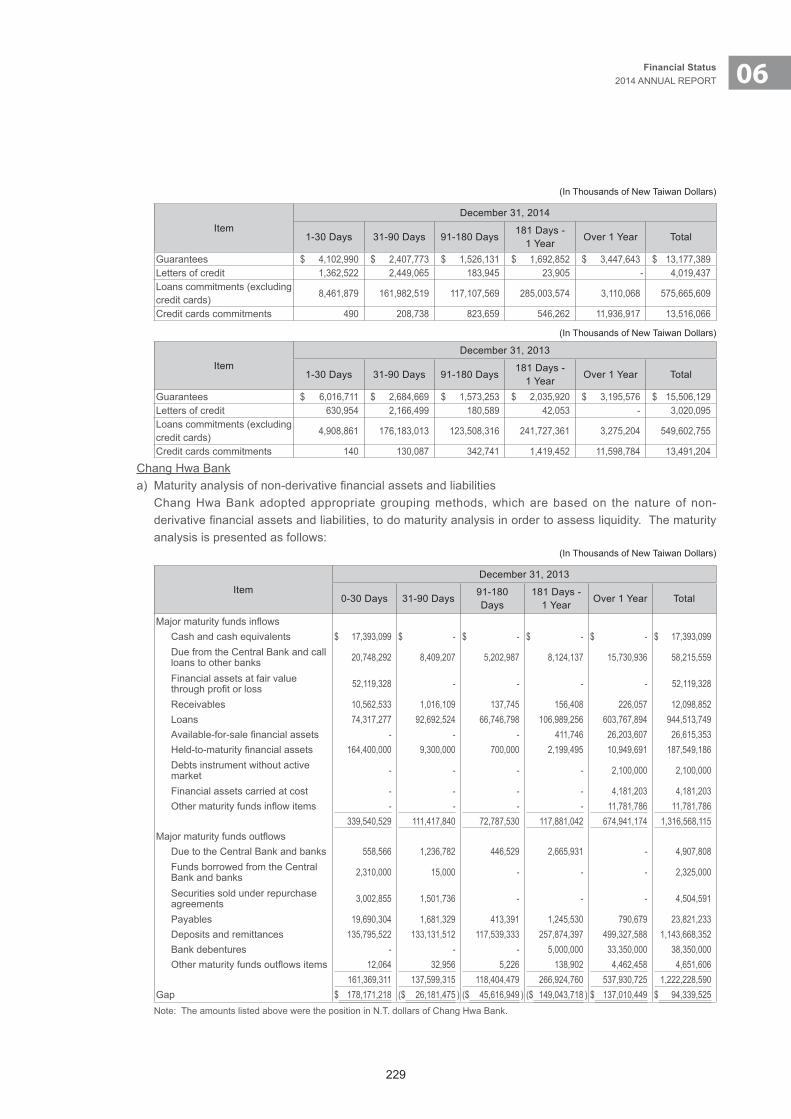
229
06Financial Status2014 ANNUAL REPORT
(In Thousands of New Taiwan Dollars)
ItemDecember 31, 2014
1-30 Days 31-90 Days 91-180 Days181 Days -
1 YearOver 1 Year Total
Guarantees $ 4,102,990 $ 2,407,773 $ 1,526,131 $ 1,692,852 $ 3,447,643 $ 13,177,389Letters of credit 1,362,522 2,449,065 183,945 23,905 - 4,019,437Loans commitments (excluding credit cards)
8,461,879 161,982,519 117,107,569 285,003,574 3,110,068 575,665,609
Credit cards commitments 490 208,738 823,659 546,262 11,936,917 13,516,066
(In Thousands of New Taiwan Dollars)
ItemDecember 31, 2013
1-30 Days 31-90 Days 91-180 Days181 Days -
1 YearOver 1 Year Total
Guarantees $ 6,016,711 $ 2,684,669 $ 1,573,253 $ 2,035,920 $ 3,195,576 $ 15,506,129Letters of credit 630,954 2,166,499 180,589 42,053 - 3,020,095Loans commitments (excluding credit cards)
4,908,861 176,183,013 123,508,316 241,727,361 3,275,204 549,602,755
Credit cards commitments 140 130,087 342,741 1,419,452 11,598,784 13,491,204
Chang Hwa Banka) Maturity analysis of non-derivative financial assets and liabilities Chang Hwa Bank adopted appropriate grouping methods, which are based on the nature of non-
derivative financial assets and liabilities, to do maturity analysis in order to assess liquidity. The maturity analysis is presented as follows:
(In Thousands of New Taiwan Dollars)
ItemDecember 31, 2013
0-30 Days 31-90 Days91-180 Days
181 Days - 1 Year
Over 1 Year Total
Major maturity funds inflows Cash and cash equivalents $ 17,393,099 $ - $ - $ - $ - $ 17,393,099 Due from the Central Bank and call loans to other banks 20,748,292 8,409,207 5,202,987 8,124,137 15,730,936 58,215,559
Financial assets at fair value through profit or loss 52,119,328 - - - - 52,119,328
Receivables 10,562,533 1,016,109 137,745 156,408 226,057 12,098,852 Loans 74,317,277 92,692,524 66,746,798 106,989,256 603,767,894 944,513,749 Available-for-sale financial assets - - - 411,746 26,203,607 26,615,353 Held-to-maturity financial assets 164,400,000 9,300,000 700,000 2,199,495 10,949,691 187,549,186 Debts instrument without active market - - - - 2,100,000 2,100,000
Financial assets carried at cost - - - - 4,181,203 4,181,203 Other maturity funds inflow items - - - - 11,781,786 11,781,786
339,540,529 111,417,840 72,787,530 117,881,042 674,941,174 1,316,568,115Major maturity funds outflows Due to the Central Bank and banks 558,566 1,236,782 446,529 2,665,931 - 4,907,808 Funds borrowed from the Central Bank and banks 2,310,000 15,000 - - - 2,325,000
Securities sold under repurchase agreements 3,002,855 1,501,736 - - - 4,504,591
Payables 19,690,304 1,681,329 413,391 1,245,530 790,679 23,821,233 Deposits and remittances 135,795,522 133,131,512 117,539,333 257,874,397 499,327,588 1,143,668,352 Bank debentures - - - 5,000,000 33,350,000 38,350,000 Other maturity funds outflows items 12,064 32,956 5,226 138,902 4,462,458 4,651,606
161,369,311 137,599,315 118,404,479 266,924,760 537,930,725 1,222,228,590Gap $ 178,171,218 ($ 26,181,475 ) ($ 45,616,949 ) ($ 149,043,718 ) $ 137,010,449 $ 94,339,525Note: The amounts listed above were the position in N.T. dollars of Chang Hwa Bank.
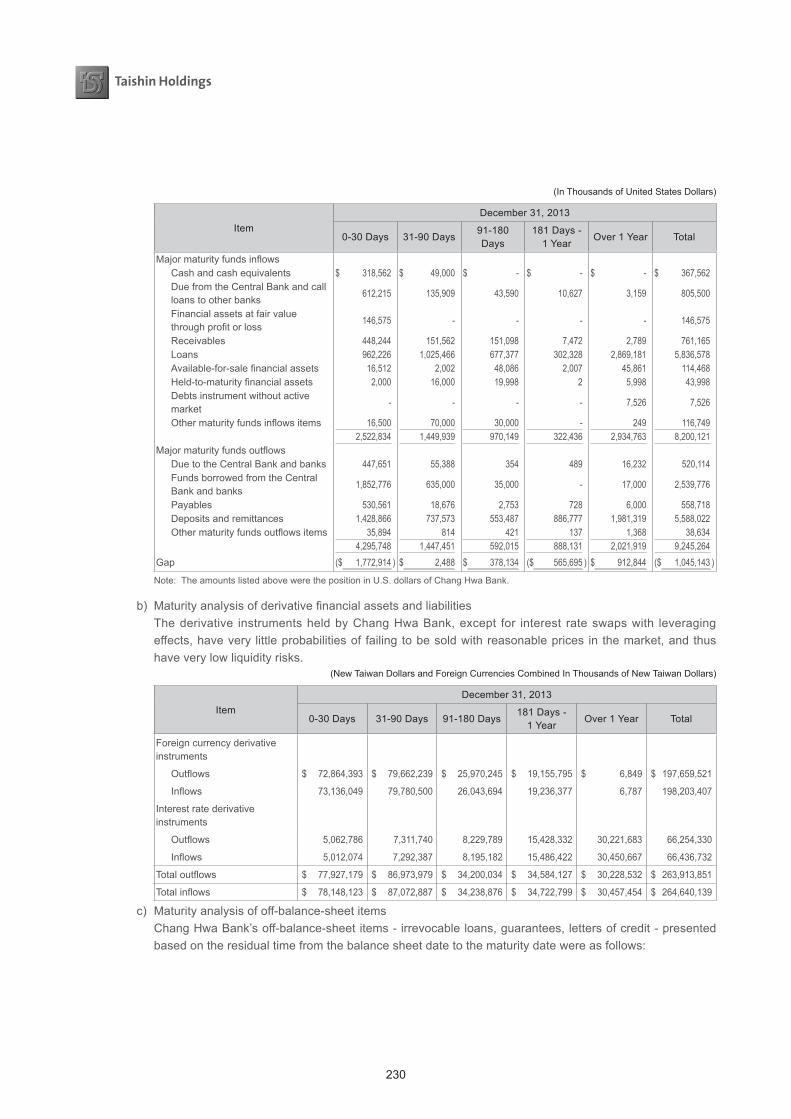
230
(In Thousands of United States Dollars)
ItemDecember 31, 2013
0-30 Days 31-90 Days91-180 Days
181 Days - 1 Year
Over 1 Year Total
Major maturity funds inflows Cash and cash equivalents $ 318,562 $ 49,000 $ - $ - $ - $ 367,562 Due from the Central Bank and call loans to other banks
612,215 135,909 43,590 10,627 3,159 805,500
Financial assets at fair value through profit or loss
146,575 - - - - 146,575
Receivables 448,244 151,562 151,098 7,472 2,789 761,165 Loans 962,226 1,025,466 677,377 302,328 2,869,181 5,836,578 Available-for-sale financial assets 16,512 2,002 48,086 2,007 45,861 114,468 Held-to-maturity financial assets 2,000 16,000 19,998 2 5,998 43,998 Debts instrument without active market
- - - - 7,526 7,526
Other maturity funds inflows items 16,500 70,000 30,000 - 249 116,749 2,522,834 1,449,939 970,149 322,436 2,934,763 8,200,121
Major maturity funds outflows Due to the Central Bank and banks 447,651 55,388 354 489 16,232 520,114 Funds borrowed from the Central Bank and banks
1,852,776 635,000 35,000 - 17,000 2,539,776
Payables 530,561 18,676 2,753 728 6,000 558,718 Deposits and remittances 1,428,866 737,573 553,487 886,777 1,981,319 5,588,022 Other maturity funds outflows items 35,894 814 421 137 1,368 38,634
4,295,748 1,447,451 592,015 888,131 2,021,919 9,245,264Gap ($ 1,772,914 ) $ 2,488 $ 378,134 ($ 565,695 ) $ 912,844 ($ 1,045,143 )
Note: The amounts listed above were the position in U.S. dollars of Chang Hwa Bank.
b) Maturity analysis of derivative financial assets and liabilities The derivative instruments held by Chang Hwa Bank, except for interest rate swaps with leveraging
effects, have very little probabilities of failing to be sold with reasonable prices in the market, and thus have very low liquidity risks.
(New Taiwan Dollars and Foreign Currencies Combined In Thousands of New Taiwan Dollars)
ItemDecember 31, 2013
0-30 Days 31-90 Days 91-180 Days181 Days -
1 YearOver 1 Year Total
Foreign currency derivative instruments
Outflows $ 72,864,393 $ 79,662,239 $ 25,970,245 $ 19,155,795 $ 6,849 $ 197,659,521
Inflows 73,136,049 79,780,500 26,043,694 19,236,377 6,787 198,203,407
Interest rate derivative instruments
Outflows 5,062,786 7,311,740 8,229,789 15,428,332 30,221,683 66,254,330
Inflows 5,012,074 7,292,387 8,195,182 15,486,422 30,450,667 66,436,732
Total outflows $ 77,927,179 $ 86,973,979 $ 34,200,034 $ 34,584,127 $ 30,228,532 $ 263,913,851
Total inflows $ 78,148,123 $ 87,072,887 $ 34,238,876 $ 34,722,799 $ 30,457,454 $ 264,640,139
c) Maturity analysis of off-balance-sheet items Chang Hwa Bank’s off-balance-sheet items - irrevocable loans, guarantees, letters of credit - presented
based on the residual time from the balance sheet date to the maturity date were as follows:

231
06Financial Status2014 ANNUAL REPORT
(In Thousands of New Taiwan Dollars)
ItemDecember 31, 2013
0-30 Days 31-90 Days 91-180 Days181 Days -
1 YearOver 1 Year Total
Loan commitments (excluding credit card)
$ 98,059,723 $ 1,876,721 $ 5,671,705 $ 7,451,285 $ 23,623,355 $ 136,682,789
Unused loan commitments (credit card only)
23,894,227 164,143 3,553 12,185 - 24,074,108
Guarantees in guarantee business
27,383,180 13,139 34,050 757,440 573,438 28,761,247
$ 149,337,130 $ 2,054,003 $ 5,709,308 $ 8,220,910 $ 24,196,793 $ 189,518,144
48. RELATED-PARTY TRANSACTIONS
a. Names and relationships of related parties were as follows:
Name Relationship
Taishin Bank Wholly owned by Taishin Financial Holding
Taishin AMC Same as above
Taishin MarketingWholly owned by Taishin Financial Holding (it had been liquidated by the end of September 2013)
Taishin Venture Capital Wholly owned by Taishin Financial Holding
Taishin Securities B Same as above
Taishin Securities Investment Trust Same as above
Taishin Holdings Insurance Brokers Same as above
Taishin Securities Investment Advisory Owned by Taishin Financial Holding
Chang Hwa BankOwned by Taishin Financial Holding (become equity-method investee in December 2014)
Taishin D.A. Finance Wholly owned by Taishin Bank
Taishin Insurance Agency Owned by Taishin bank
Taishin Real-Estate Same as above
An Hsin Real-Estate Equity-method investee by Taishin bank
Youn Shin Artistic Its corporate director is Taishin Venture Capital
Shin Kong Life Insurance Co., Ltd. (“Shin Kong Life Insurance”)Its director is the person in charge of Taishin Financial Holding’s corporate director
Shinkong Synthetic Fibers Co., Ltd. (“Shin Kong Synthetic Fibers”)
Its director is the person in charge of Taishin Financial Holding’s corporate director
Taishin Insurance Broker Wholly owned by Taishin Insurance Agency
CHB Insurance Agency Wholly owned by Chang Hwa Bank
CHB Insurance Brokerage Wholly owned by Chang Hwa Bank
Dah Chung Bills Finance Corp. (“Dah Chung Bills”) Its corporate director is Taishin Bank
Taiwan Shin Kong Commercial Bank Co., Ltd. (“Shin Kong Bank”)
Related party in substance
MasterLink Securities Corp. (“MasterLink Securities”)MasterLink Securities Corp. (“MasterLink Securities”) (become non-related party after the fourth quarter of 2014)
Taishin Financial Leases (China) Wholly owned by Taishin Venture Capital
Taishin Financial Leases (Tianjin) Wholly owned by Taishin Venture Capital
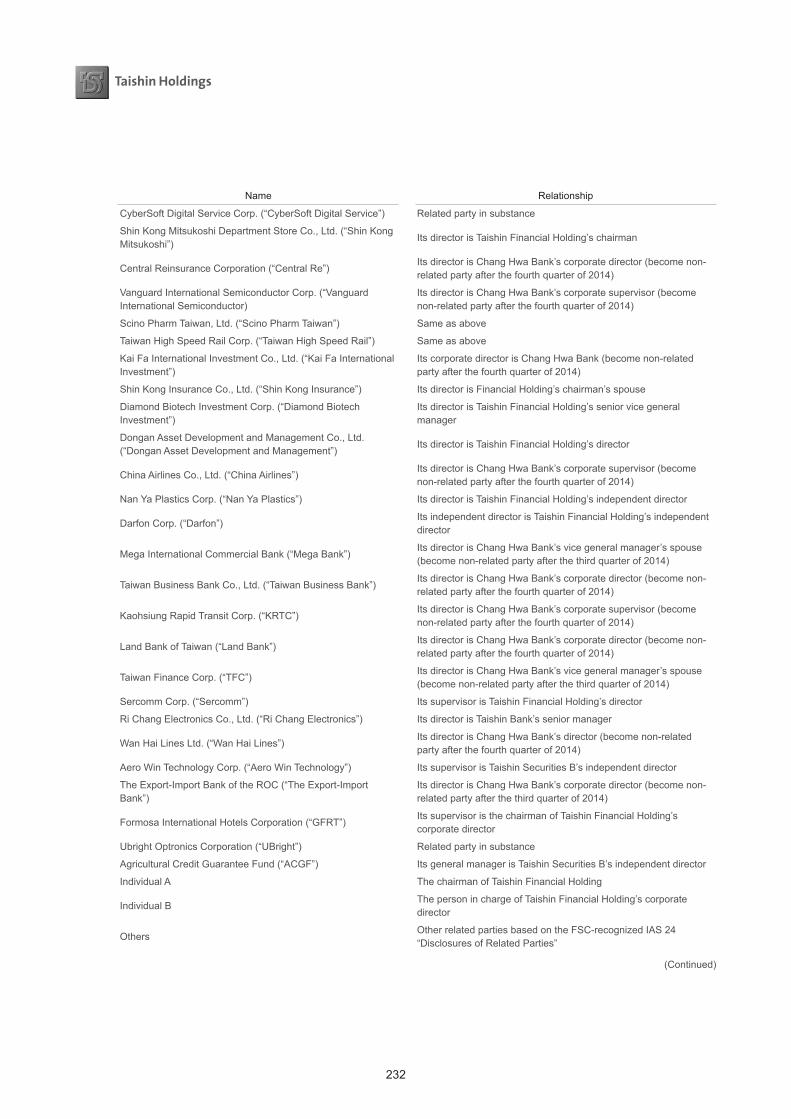
232
Name Relationship
CyberSoft Digital Service Corp. (“CyberSoft Digital Service”) Related party in substance
Shin Kong Mitsukoshi Department Store Co., Ltd. (“Shin Kong Mitsukoshi”)
Its director is Taishin Financial Holding’s chairman
Central Reinsurance Corporation (“Central Re”)Its director is Chang Hwa Bank’s corporate director (become non-related party after the fourth quarter of 2014)
Vanguard International Semiconductor Corp. (“Vanguard International Semiconductor)
Its director is Chang Hwa Bank’s corporate supervisor (become non-related party after the fourth quarter of 2014)
Scino Pharm Taiwan, Ltd. (“Scino Pharm Taiwan”) Same as above
Taiwan High Speed Rail Corp. (“Taiwan High Speed Rail”) Same as above
Kai Fa International Investment Co., Ltd. (“Kai Fa International Investment”)
Its corporate director is Chang Hwa Bank (become non-related party after the fourth quarter of 2014)
Shin Kong Insurance Co., Ltd. (“Shin Kong Insurance”) Its director is Financial Holding’s chairman’s spouse
Diamond Biotech Investment Corp. (“Diamond Biotech Investment”)
Its director is Taishin Financial Holding’s senior vice general manager
Dongan Asset Development and Management Co., Ltd. (“Dongan Asset Development and Management”)
Its director is Taishin Financial Holding’s director
China Airlines Co., Ltd. (“China Airlines”)Its director is Chang Hwa Bank’s corporate supervisor (become non-related party after the fourth quarter of 2014)
Nan Ya Plastics Corp. (“Nan Ya Plastics”) Its director is Taishin Financial Holding’s independent director
Darfon Corp. (“Darfon”)Its independent director is Taishin Financial Holding’s independent director
Mega International Commercial Bank (“Mega Bank”)Its director is Chang Hwa Bank’s vice general manager’s spouse (become non-related party after the third quarter of 2014)
Taiwan Business Bank Co., Ltd. (“Taiwan Business Bank”)Its director is Chang Hwa Bank’s corporate director (become non-related party after the fourth quarter of 2014)
Kaohsiung Rapid Transit Corp. (“KRTC”)Its director is Chang Hwa Bank’s corporate supervisor (become non-related party after the fourth quarter of 2014)
Land Bank of Taiwan (“Land Bank”)Its director is Chang Hwa Bank’s corporate director (become non-related party after the fourth quarter of 2014)
Taiwan Finance Corp. (“TFC”)Its director is Chang Hwa Bank’s vice general manager’s spouse (become non-related party after the third quarter of 2014)
Sercomm Corp. (“Sercomm”) Its supervisor is Taishin Financial Holding’s director
Ri Chang Electronics Co., Ltd. (“Ri Chang Electronics”) Its director is Taishin Bank’s senior manager
Wan Hai Lines Ltd. (“Wan Hai Lines”)Its director is Chang Hwa Bank’s director (become non-related party after the fourth quarter of 2014)
Aero Win Technology Corp. (“Aero Win Technology”) Its supervisor is Taishin Securities B’s independent director
The Export-Import Bank of the ROC (“The Export-Import Bank”)
Its director is Chang Hwa Bank’s corporate director (become non-related party after the third quarter of 2014)
Formosa International Hotels Corporation (“GFRT”)Its supervisor is the chairman of Taishin Financial Holding’s corporate director
Ubright Optronics Corporation (“UBright”) Related party in substance
Agricultural Credit Guarantee Fund (“ACGF”) Its general manager is Taishin Securities B’s independent director
Individual A The chairman of Taishin Financial Holding
Individual BThe person in charge of Taishin Financial Holding’s corporate director
OthersOther related parties based on the FSC-recognized IAS 24 “Disclosures of Related Parties”
(Continued)
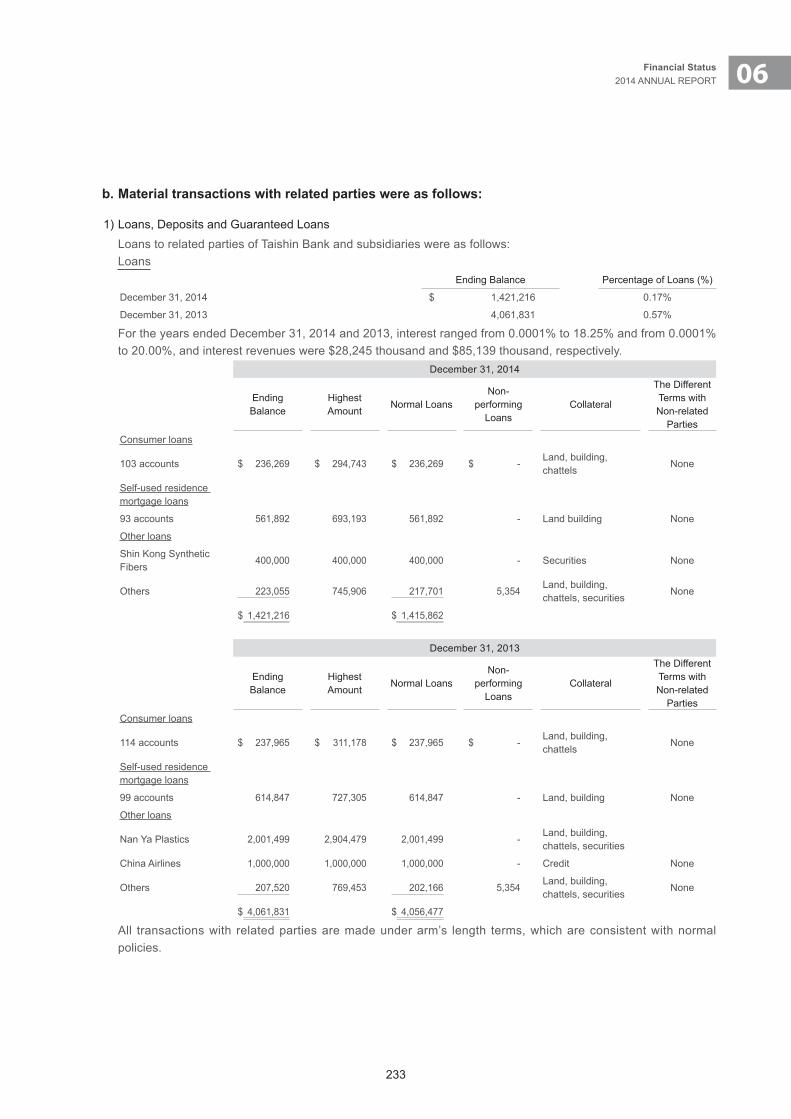
233
06Financial Status2014 ANNUAL REPORT
b. Material transactions with related parties were as follows:
1) Loans, Deposits and Guaranteed LoansLoans to related parties of Taishin Bank and subsidiaries were as follows:Loans
Ending Balance Percentage of Loans (%)
December 31, 2014 $ 1,421,216 0.17%
December 31, 2013 4,061,831 0.57%
For the years ended December 31, 2014 and 2013, interest ranged from 0.0001% to 18.25% and from 0.0001% to 20.00%, and interest revenues were $28,245 thousand and $85,139 thousand, respectively.
December 31, 2014
Ending Balance
Highest Amount
Normal LoansNon-
performing Loans
Collateral
The Different Terms with Non-related
PartiesConsumer loans
103 accounts $ 236,269 $ 294,743 $ 236,269 $ -Land, building, chattels
None
Self-used residence mortgage loans
93 accounts 561,892 693,193 561,892 - Land building None
Other loans
Shin Kong Synthetic Fibers
400,000 400,000 400,000 - Securities None
Others 223,055 745,906 217,701 5,354Land, building, chattels, securities
None
$ 1,421,216 $ 1,415,862
December 31, 2013
Ending Balance
Highest Amount
Normal LoansNon-
performing Loans
Collateral
The Different Terms with Non-related
PartiesConsumer loans
114 accounts $ 237,965 $ 311,178 $ 237,965 $ -Land, building, chattels
None
Self-used residence mortgage loans
99 accounts 614,847 727,305 614,847 - Land, building None
Other loans
Nan Ya Plastics 2,001,499 2,904,479 2,001,499 -Land, building, chattels, securities
China Airlines 1,000,000 1,000,000 1,000,000 - Credit None
Others 207,520 769,453 202,166 5,354Land, building, chattels, securities
None
$ 4,061,831 $ 4,056,477
All transactions with related parties are made under arm’s length terms, which are consistent with normal policies.
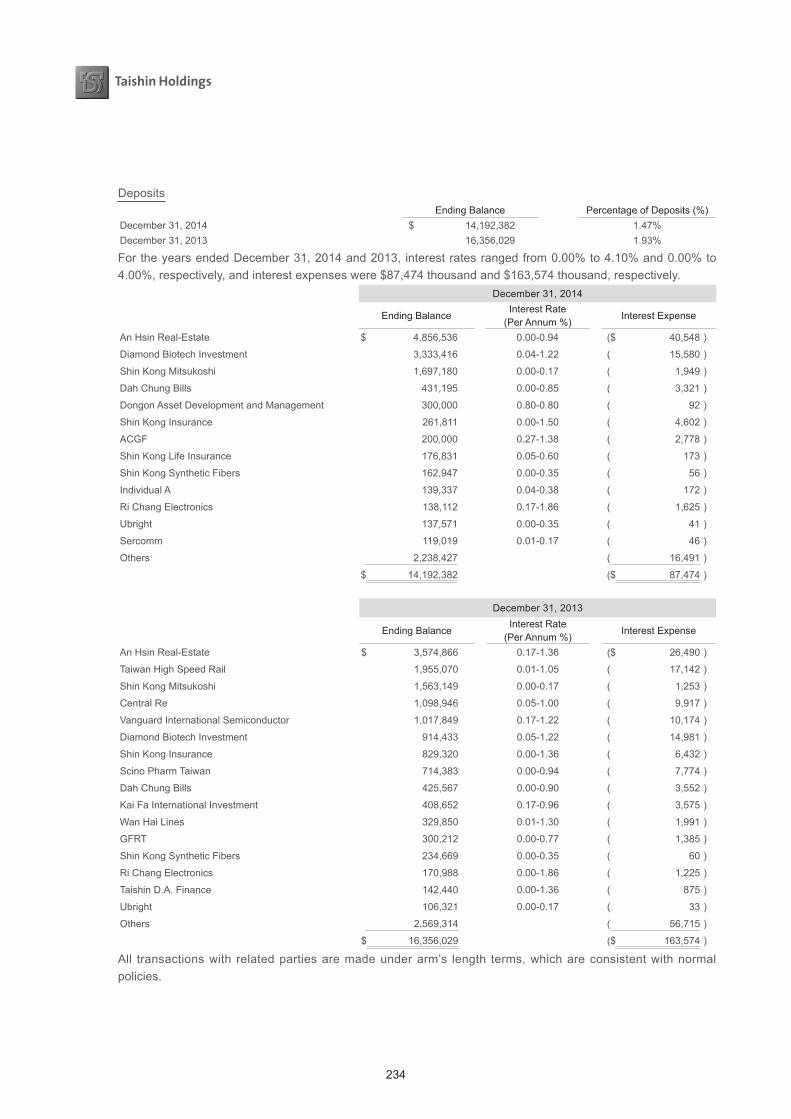
234
DepositsEnding Balance Percentage of Deposits (%)
December 31, 2014 $ 14,192,382 1.47%December 31, 2013 16,356,029 1.93%
For the years ended December 31, 2014 and 2013, interest rates ranged from 0.00% to 4.10% and 0.00% to 4.00%, respectively, and interest expenses were $87,474 thousand and $163,574 thousand, respectively.
December 31, 2014
Ending BalanceInterest Rate
(Per Annum %)Interest Expense
An Hsin Real-Estate $ 4,856,536 0.00-0.94 ($ 40,548 )
Diamond Biotech Investment 3,333,416 0.04-1.22 ( 15,580 )
Shin Kong Mitsukoshi 1,697,180 0.00-0.17 ( 1,949 )
Dah Chung Bills 431,195 0.00-0.85 ( 3,321 )
Dongon Asset Development and Management 300,000 0.80-0.80 ( 92 )
Shin Kong Insurance 261,811 0.00-1.50 ( 4,602 )
ACGF 200,000 0.27-1.38 ( 2,778 )
Shin Kong Life Insurance 176,831 0.05-0.60 ( 173 )
Shin Kong Synthetic Fibers 162,947 0.00-0.35 ( 56 )
Individual A 139,337 0.04-0.38 ( 172 )
Ri Chang Electronics 138,112 0.17-1.86 ( 1,625 )
Ubright 137,571 0.00-0.35 ( 41 )
Sercomm 119,019 0.01-0.17 ( 46 )
Others 2,238,427 ( 16,491 )
$ 14,192,382 ($ 87,474 )
December 31, 2013
Ending BalanceInterest Rate
(Per Annum %)Interest Expense
An Hsin Real-Estate $ 3,574,866 0.17-1.36 ($ 26,490 )
Taiwan High Speed Rail 1,955,070 0.01-1.05 ( 17,142 )
Shin Kong Mitsukoshi 1,563,149 0.00-0.17 ( 1,253 )
Central Re 1,098,946 0.05-1.00 ( 9,917 )
Vanguard International Semiconductor 1,017,849 0.17-1.22 ( 10,174 )
Diamond Biotech Investment 914,433 0.05-1.22 ( 14,981 )
Shin Kong Insurance 829,320 0.00-1.36 ( 6,432 )
Scino Pharm Taiwan 714,383 0.00-0.94 ( 7,774 )
Dah Chung Bills 425,567 0.00-0.90 ( 3,552 )
Kai Fa International Investment 408,652 0.17-0.96 ( 3,575 )
Wan Hai Lines 329,850 0.01-1.30 ( 1,991 )
GFRT 300,212 0.00-0.77 ( 1,385 )
Shin Kong Synthetic Fibers 234,669 0.00-0.35 ( 60 )
Ri Chang Electronics 170,988 0.00-1.86 ( 1,225 )
Taishin D.A. Finance 142,440 0.00-1.36 ( 875 )
Ubright 106,321 0.00-0.17 ( 33 )
Others 2,569,314 ( 56,715 )
$ 16,356,029 ($ 163,574 )
All transactions with related parties are made under arm’s length terms, which are consistent with normal policies.
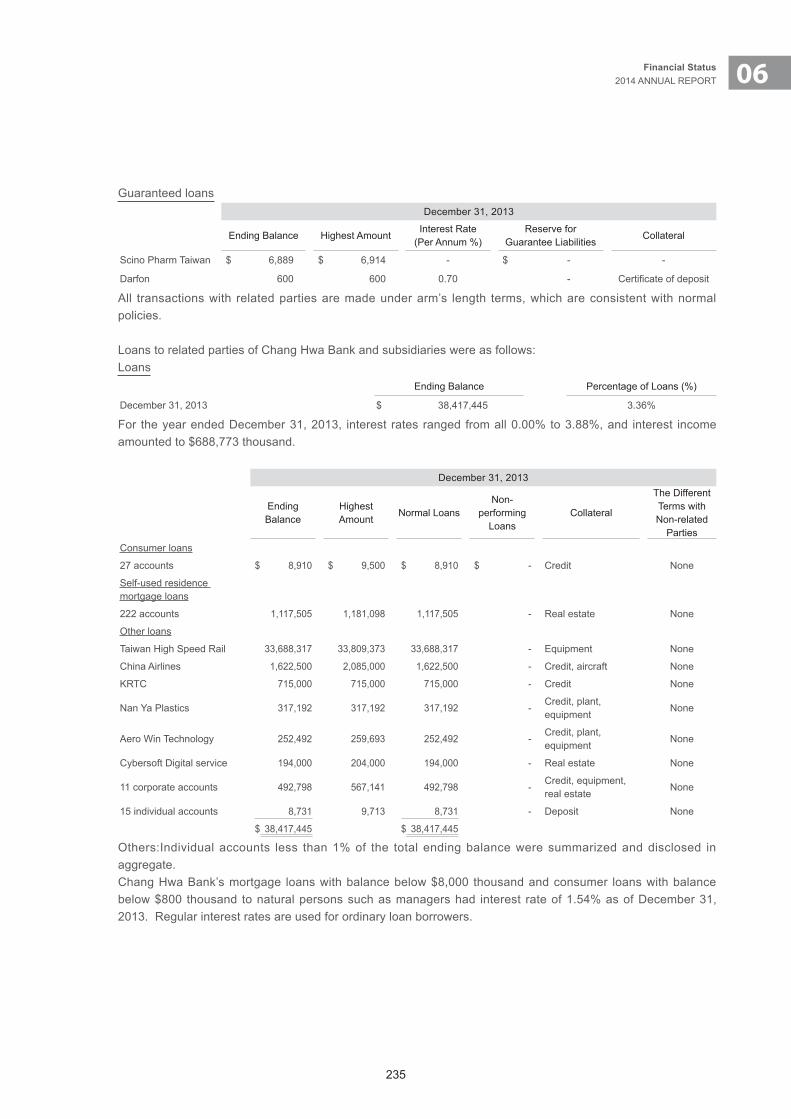
235
06Financial Status2014 ANNUAL REPORT
Guaranteed loansDecember 31, 2013
Ending Balance Highest AmountInterest Rate
(Per Annum %)Reserve for
Guarantee LiabilitiesCollateral
Scino Pharm Taiwan $ 6,889 $ 6,914 - $ - -
Darfon 600 600 0.70 - Certificate of deposit
All transactions with related parties are made under arm’s length terms, which are consistent with normal policies.
Loans to related parties of Chang Hwa Bank and subsidiaries were as follows:Loans
Ending Balance Percentage of Loans (%)
December 31, 2013 $ 38,417,445 3.36%
For the year ended December 31, 2013, interest rates ranged from all 0.00% to 3.88%, and interest income amounted to $688,773 thousand.
December 31, 2013
Ending Balance
Highest Amount
Normal LoansNon-
performing Loans
Collateral
The Different Terms with Non-related
PartiesConsumer loans
27 accounts $ 8,910 $ 9,500 $ 8,910 $ - Credit None
Self-used residence mortgage loans
222 accounts 1,117,505 1,181,098 1,117,505 - Real estate None
Other loans
Taiwan High Speed Rail 33,688,317 33,809,373 33,688,317 - Equipment None
China Airlines 1,622,500 2,085,000 1,622,500 - Credit, aircraft None
KRTC 715,000 715,000 715,000 - Credit None
Nan Ya Plastics 317,192 317,192 317,192 -Credit, plant, equipment
None
Aero Win Technology 252,492 259,693 252,492 -Credit, plant, equipment
None
Cybersoft Digital service 194,000 204,000 194,000 - Real estate None
11 corporate accounts 492,798 567,141 492,798 -Credit, equipment, real estate
None
15 individual accounts 8,731 9,713 8,731 - Deposit None
$ 38,417,445 $ 38,417,445
Others:Individual accounts less than 1% of the total ending balance were summarized and disclosed in aggregate.Chang Hwa Bank’s mortgage loans with balance below $8,000 thousand and consumer loans with balance below $800 thousand to natural persons such as managers had interest rate of 1.54% as of December 31, 2013. Regular interest rates are used for ordinary loan borrowers.
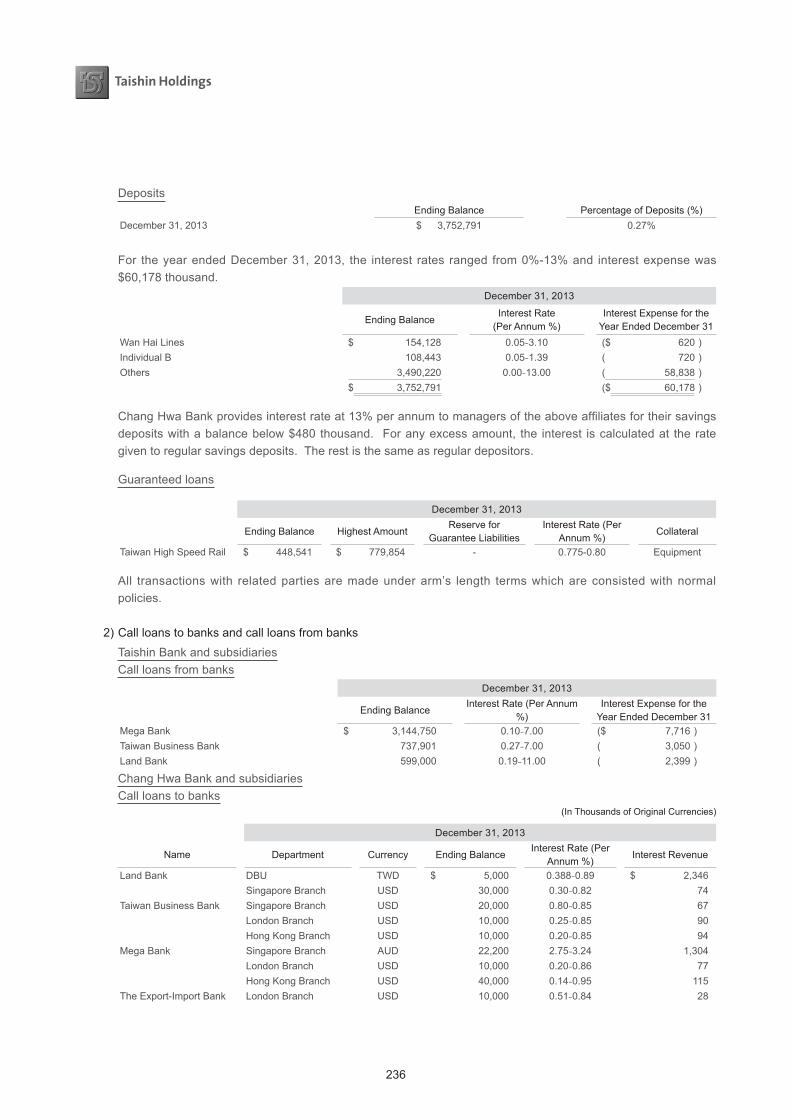
236
DepositsEnding Balance Percentage of Deposits (%)
December 31, 2013 $ 3,752,791 0.27%
For the year ended December 31, 2013, the interest rates ranged from 0%-13% and interest expense was $60,178 thousand.
December 31, 2013
Ending BalanceInterest Rate
(Per Annum %)Interest Expense for the
Year Ended December 31Wan Hai Lines $ 154,128 0.05-3.10 ($ 620 )Individual B 108,443 0.05-1.39 ( 720 )Others 3,490,220 0.00-13.00 ( 58,838 )
$ 3,752,791 ($ 60,178 )
Chang Hwa Bank provides interest rate at 13% per annum to managers of the above affiliates for their savings deposits with a balance below $480 thousand. For any excess amount, the interest is calculated at the rate given to regular savings deposits. The rest is the same as regular depositors.
Guaranteed loans
December 31, 2013
Ending Balance Highest AmountReserve for
Guarantee LiabilitiesInterest Rate (Per
Annum %)Collateral
Taiwan High Speed Rail $ 448,541 $ 779,854 - 0.775-0.80 Equipment
All transactions with related parties are made under arm’s length terms which are consisted with normal policies.
2) Call loans to banks and call loans from banksTaishin Bank and subsidiariesCall loans from banks
December 31, 2013
Ending BalanceInterest Rate (Per Annum
%)Interest Expense for the
Year Ended December 31Mega Bank $ 3,144,750 0.10-7.00 ($ 7,716 )Taiwan Business Bank 737,901 0.27-7.00 ( 3,050 )Land Bank 599,000 0.19-11.00 ( 2,399 )
Chang Hwa Bank and subsidiariesCall loans to banks
(In Thousands of Original Currencies)
December 31, 2013
Name Department Currency Ending BalanceInterest Rate (Per
Annum %)Interest Revenue
Land Bank DBU TWD $ 5,000 0.388-0.89 $ 2,346Singapore Branch USD 30,000 0.30-0.82 74
Taiwan Business Bank Singapore Branch USD 20,000 0.80-0.85 67London Branch USD 10,000 0.25-0.85 90Hong Kong Branch USD 10,000 0.20-0.85 94
Mega Bank Singapore Branch AUD 22,200 2.75-3.24 1,304London Branch USD 10,000 0.20-0.86 77Hong Kong Branch USD 40,000 0.14-0.95 115
The Export-Import Bank London Branch USD 10,000 0.51-0.84 28
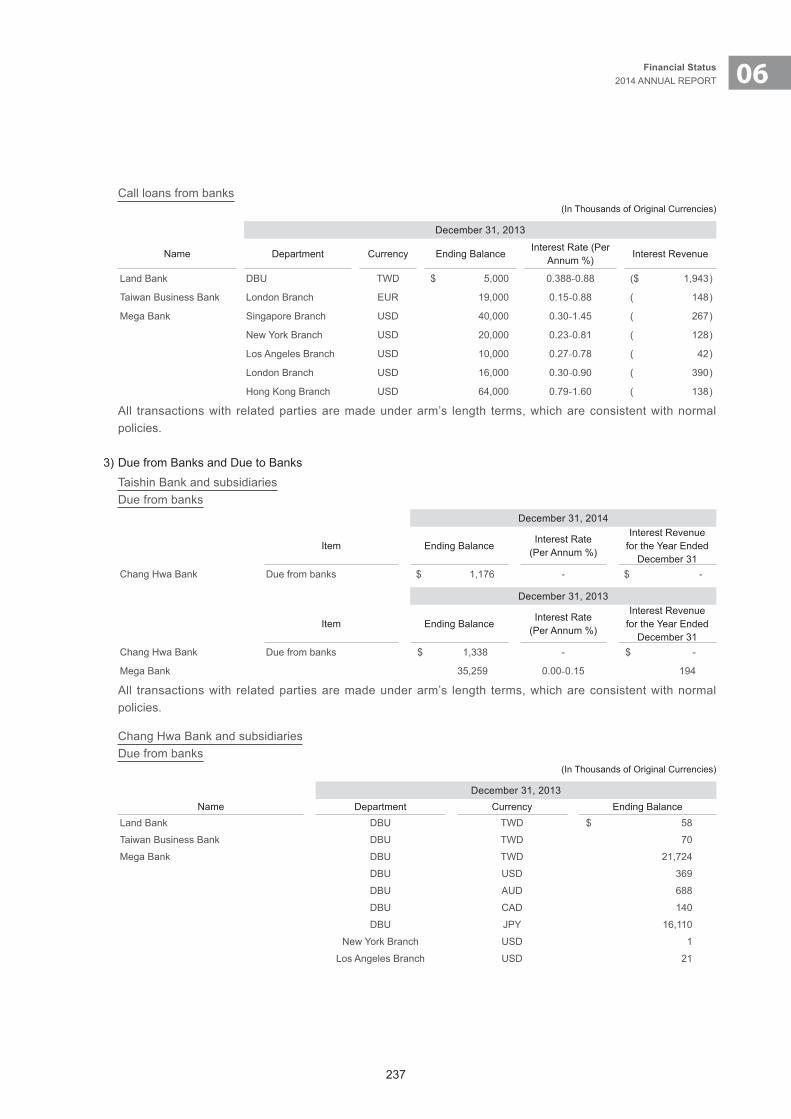
237
06Financial Status2014 ANNUAL REPORT
Call loans from banks(In Thousands of Original Currencies)
December 31, 2013
Name Department Currency Ending BalanceInterest Rate (Per
Annum %)Interest Revenue
Land Bank DBU TWD $ 5,000 0.388-0.88 ($ 1,943 )
Taiwan Business Bank London Branch EUR 19,000 0.15-0.88 ( 148 )
Mega Bank Singapore Branch USD 40,000 0.30-1.45 ( 267 )
New York Branch USD 20,000 0.23-0.81 ( 128 )
Los Angeles Branch USD 10,000 0.27-0.78 ( 42 )
London Branch USD 16,000 0.30-0.90 ( 390 )
Hong Kong Branch USD 64,000 0.79-1.60 ( 138 )
All transactions with related parties are made under arm’s length terms, which are consistent with normal policies.
3) Due from Banks and Due to BanksTaishin Bank and subsidiariesDue from banks
December 31, 2014
Item Ending BalanceInterest Rate
(Per Annum %)
Interest Revenue for the Year Ended
December 31Chang Hwa Bank Due from banks $ 1,176 - $ -
December 31, 2013
Item Ending BalanceInterest Rate
(Per Annum %)
Interest Revenue for the Year Ended
December 31Chang Hwa Bank Due from banks $ 1,338 - $ -
Mega Bank 35,259 0.00-0.15 194
All transactions with related parties are made under arm’s length terms, which are consistent with normal policies.
Chang Hwa Bank and subsidiariesDue from banks
(In Thousands of Original Currencies)
December 31, 2013Name Department Currency Ending Balance
Land Bank DBU TWD $ 58
Taiwan Business Bank DBU TWD 70
Mega Bank DBU TWD 21,724
DBU USD 369
DBU AUD 688
DBU CAD 140
DBU JPY 16,110
New York Branch USD 1
Los Angeles Branch USD 21
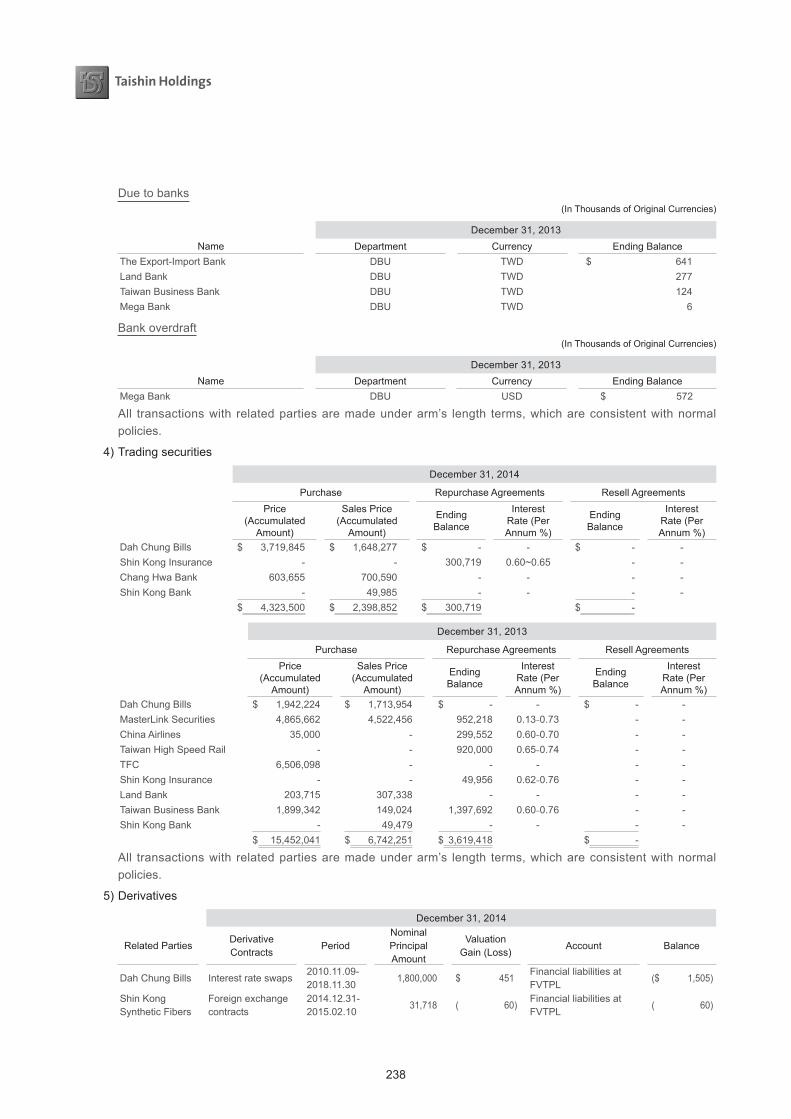
238
Due to banks(In Thousands of Original Currencies)
December 31, 2013Name Department Currency Ending Balance
The Export-Import Bank DBU TWD $ 641Land Bank DBU TWD 277Taiwan Business Bank DBU TWD 124Mega Bank DBU TWD 6
Bank overdraft(In Thousands of Original Currencies)
December 31, 2013Name Department Currency Ending Balance
Mega Bank DBU USD $ 572
All transactions with related parties are made under arm’s length terms, which are consistent with normal policies.
4) Trading securities
December 31, 2014
Purchase Repurchase Agreements Resell AgreementsPrice
(Accumulated Amount)
Sales Price (Accumulated
Amount)
EndingBalance
InterestRate (Per Annum %)
Ending Balance
InterestRate (Per Annum %)
Dah Chung Bills $ 3,719,845 $ 1,648,277 $ - - $ - -Shin Kong Insurance - - 300,719 0.60~0.65 - -Chang Hwa Bank 603,655 700,590 - - - -Shin Kong Bank - 49,985 - - - -
$ 4,323,500 $ 2,398,852 $ 300,719 $ -
December 31, 2013
Purchase Repurchase Agreements Resell AgreementsPrice
(Accumulated Amount)
Sales Price (Accumulated
Amount)
EndingBalance
InterestRate (Per Annum %)
Ending Balance
InterestRate (Per Annum %)
Dah Chung Bills $ 1,942,224 $ 1,713,954 $ - - $ - -MasterLink Securities 4,865,662 4,522,456 952,218 0.13-0.73 - -China Airlines 35,000 - 299,552 0.60-0.70 - -Taiwan High Speed Rail - - 920,000 0.65-0.74 - -TFC 6,506,098 - - - - -Shin Kong Insurance - - 49,956 0.62-0.76 - -Land Bank 203,715 307,338 - - - -Taiwan Business Bank 1,899,342 149,024 1,397,692 0.60-0.76 - -Shin Kong Bank - 49,479 - - - -
$ 15,452,041 $ 6,742,251 $ 3,619,418 $ -
All transactions with related parties are made under arm’s length terms, which are consistent with normal policies.
5) Derivatives
December 31, 2014
Related Parties Derivative Contracts
PeriodNominalPrincipal Amount
ValuationGain (Loss)
Account Balance
Dah Chung Bills Interest rate swaps2010.11.09-2018.11.30 1,800,000 $ 451
Financial liabilities at FVTPL
($ 1,505 )
Shin Kong Synthetic Fibers
Foreign exchange contracts
2014.12.31-2015.02.10
31,718 ( 60 )Financial liabilities at FVTPL
( 60 )
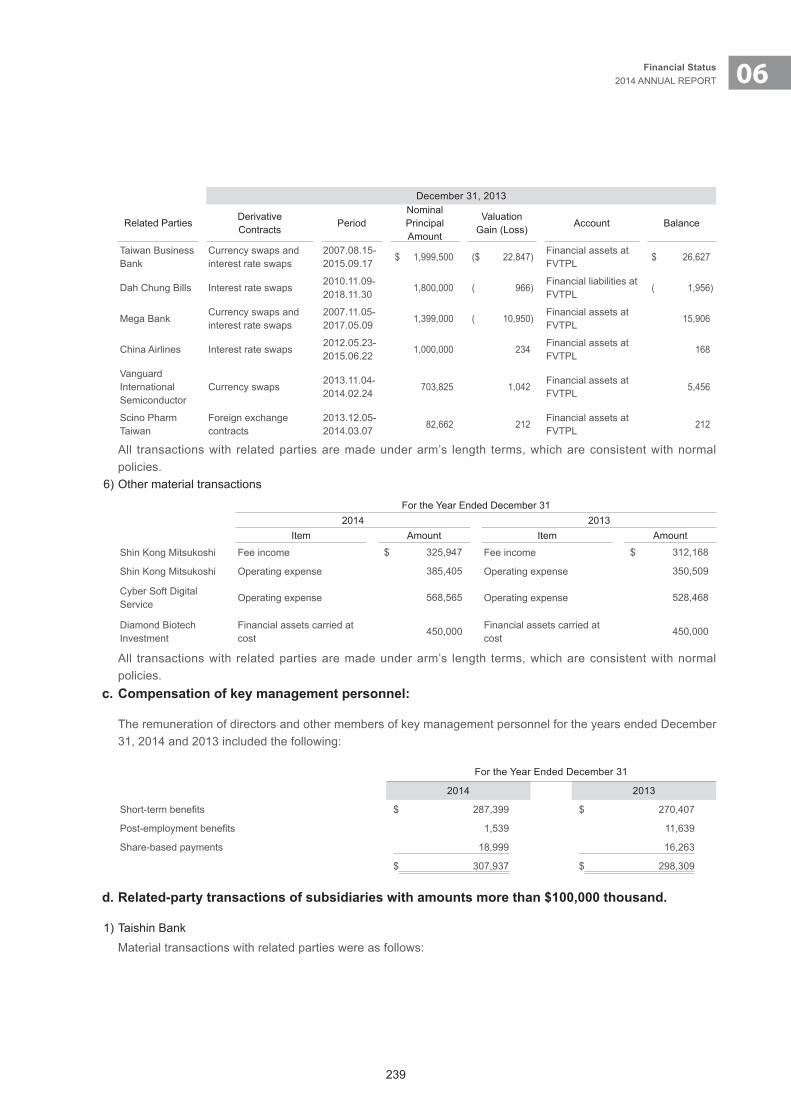
239
06Financial Status2014 ANNUAL REPORT
December 31, 2013
Related Parties Derivative Contracts
PeriodNominalPrincipal Amount
ValuationGain (Loss)
Account Balance
Taiwan Business Bank
Currency swaps and interest rate swaps
2007.08.15-2015.09.17 $ 1,999,500 ($ 22,847 )
Financial assets at FVTPL
$ 26,627
Dah Chung Bills Interest rate swaps2010.11.09-2018.11.30
1,800,000 ( 966 )Financial liabilities at FVTPL
( 1,956 )
Mega BankCurrency swaps and interest rate swaps
2007.11.05-2017.05.09
1,399,000 ( 10,950 )Financial assets at FVTPL
15,906
China Airlines Interest rate swaps 2012.05.23-2015.06.22
1,000,000 234Financial assets at FVTPL
168
Vanguard International Semiconductor
Currency swaps2013.11.04-2014.02.24
703,825 1,042Financial assets at FVTPL
5,456
Scino Pharm Taiwan
Foreign exchange contracts
2013.12.05-2014.03.07
82,662 212Financial assets at FVTPL
212
All transactions with related parties are made under arm’s length terms, which are consistent with normal policies.
6) Other material transactions
For the Year Ended December 312014 2013
Item Amount Item Amount
Shin Kong Mitsukoshi Fee income $ 325,947 Fee income $ 312,168
Shin Kong Mitsukoshi Operating expense 385,405 Operating expense 350,509
Cyber Soft Digital Service
Operating expense 568,565 Operating expense 528,468
Diamond Biotech Investment
Financial assets carried at cost
450,000 Financial assets carried at cost
450,000
All transactions with related parties are made under arm’s length terms, which are consistent with normal policies.
c. Compensation of key management personnel:
The remuneration of directors and other members of key management personnel for the years ended December 31, 2014 and 2013 included the following:
For the Year Ended December 31
2014 2013
Short-term benefits $ 287,399 $ 270,407
Post-employment benefits 1,539 11,639
Share-based payments 18,999 16,263
$ 307,937 $ 298,309
d. Related-party transactions of subsidiaries with amounts more than $100,000 thousand.
1) Taishin BankMaterial transactions with related parties were as follows:

240
a) Loans, deposits and guaranteed loans Loans
December 31, 2014
Related Parties Ending Balance Highest Amount Normal LoansNon-performing
LoansCollateral
The Different Terms with Non-related
PartiesOther loansShin Kong Synthetic Fibers $ 400,000 $ 400,000 $ 400,000 $ - Securities None
December 31, 2013
Related Parties Ending Balance Highest Amount Normal LoansNon-performing
LoansCollateral
The Different Terms with Non-related
PartiesOther loans
Nan Ya Plastics $ 2,001,499 $ 2,904,497 $ 2,001,499 $ -Land, building, chattels, securities
None
China Airline 1,000,000 1,000,000 1,000,000 - - None
DepositDecember 31, 2014
Ending BalanceInterest Rate
(Per Annum %)Interest Expense
Taishin Financial Holding $ 6,854,458 0.17-1.36 ($ 23,327 )
An Hsin Real-Estate 4,856,536 0.00-0.94 ( 40,548 )
Diamond Biotech Investment 3,333,416 0.04-1.22 ( 15,580 )
Shin Kong Mitsukoshi 1,697,180 0.00-0.17 ( 1,949 )
Taishin Holding Insurance Brokers 1,085,159 0.00-0.17 ( 1,625 )
Taishin Insurance Agency 660,514 0.00-0.17 ( 1,348 )
Dah Chung Bills 431,195 0.00-0.85 ( 3,321 )
Taishin Venture Capital 390,082 0.04-0.35 ( 52 )
Taishin Securities Investment Advisory 318,730 0.05-1.36 ( 2,689 )
Dongan Asset Development and Management 300,000 0.80 ( 92 )
Shin Kong Insurance 261,811 0.00-1.50 ( 4,602 )
ACGF 200,000 0.27-1.38 ( 2,778 )
Taishin Securities B 185,651 0.17-1.36 ( 1,559 )
Shin Kong Life Insurance 176,831 0.05-0.60 ( 173 )
Shin Kong Synthetic Fibers 162,947 0.00-0.35 ( 56 )
Individual A 139,337 0.04-0.38 ( 172 )
Ri Chang Electronics 138,112 0.17-1.86 ( 1,625 )
Ubright 137,571 0.00-0.35 ( 41 )
Sercomm 119,019 0.01-0.17 ( 46 )

241
06Financial Status2014 ANNUAL REPORT
December 31, 2013
Ending BalanceInterest Rate
(Per Annum %)Interest Expense
An Hsin Real-Estate $ 3,574,866 0.17-1.36 ($ 26,490 )
Taiwan High Speed Rail 1,955,070 0.01-1.05 ( 17,142 )
Shin Kong Mitsukoshi 1,563,149 0.00-0.17 ( 1,253 )
Central Re 1,098,946 0.05-1.00 ( 9,917 )
Vanguard International Semiconductor 1,017,849 0.17-1.22 ( 10,174 )
Taishin Insurance Agency 1,016,563 0.00-0.17 ( 1,661 )
Taishin Holding Insurance Brokers 928,958 0.00-0.17 ( 1,386 )
Diamond Biotech Investment 914,433 0.05-1.22 ( 14,981 )
Shin Kong Insurance 829,320 0.00-1.36 ( 6,432 )
Scino Pharm Taiwan 714,383 0.00-0.94 ( 7,774 )
Dah Chung Bills 425,567 0.00-0.90 ( 3,552 )
Kai Fa International Investment 408,652 0.17-0.96 ( 3,575 )
Wan Hai Lines 329,850 0.01-1.30 ( 1,991 )
Taishin Securities Investment Advisory 309,926 0.05-1.36 ( 2,743 )
GFRT 300,212 0.00-0.77 ( 1,385 )
Shin Kong Synthetic Fibers 234,669 0.00-0.35 ( 60 )
Taishin Securities B 212,040 0.17-1.36 ( 2,288 )
Taishin Financial Holding 183,391 0.17-1.36 ( 2,108 )
Ri Chang Electronics 170,988 0.00-1.86 ( 1,225 )
Taishin AMC 165,168 0.00-0.88 ( 990 )
Taishin D.A. Finance 142,440 0.00-1.36 ( 875 )
Ubright 106,321 0.00-0.17 ( 33 )
All transactions with related parties are made under arm’s length terms, which are consistent with normal policies.
b) Call loans to banks and call loans from banksDecember 31, 2013
Item Ending BalanceInterest Rate
(Per Annum %)Interest Revenue
(Expense)
Mega Bank Call loans from banks $ 3,144,750 0.10-7.00 ($ 7,716 )
Taiwan Business Bank 737,901 0.27-7.00 ( 3,050 )
Land Bank 599,000 0.19-11.00 ( 2,399 )
All transactions with related parties are made under arm’s length terms, which are consistent with normal policies.
c) Trading securitiesDecember 31, 2014
Purchase Price (Accumulated
Amount)
Sales Price (Accumulated
Amount)
Repurchase Agreements Resell Agreements
Ending Balance
Interest Rate (Per Annum %)
Ending Balance
Interest Rate (Per Annum %)
Dah Chung Bills $ 3,719,845 $ 1,648,277 $ - - $ - -
Taishin Financial Holding - - 5,316,390 0.54-0.58 - -
Shin Kong Life Insurance - - 300,719 0.60-0.65 - -
Chang Hwa Bank 603,655 700,590 - - - -
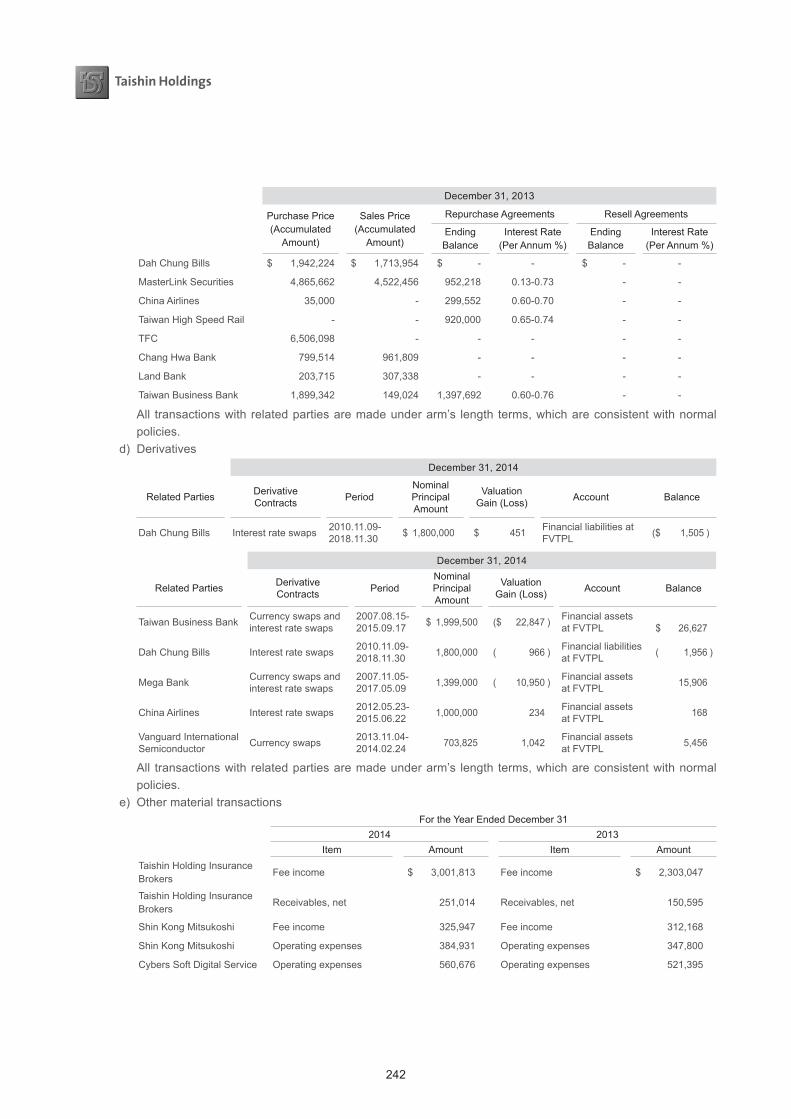
242
December 31, 2013
Purchase Price (Accumulated
Amount)
Sales Price (Accumulated
Amount)
Repurchase Agreements Resell Agreements
Ending Balance
Interest Rate (Per Annum %)
Ending Balance
Interest Rate (Per Annum %)
Dah Chung Bills $ 1,942,224 $ 1,713,954 $ - - $ - -
MasterLink Securities 4,865,662 4,522,456 952,218 0.13-0.73 - -
China Airlines 35,000 - 299,552 0.60-0.70 - -
Taiwan High Speed Rail - - 920,000 0.65-0.74 - -
TFC 6,506,098 - - - - -
Chang Hwa Bank 799,514 961,809 - - - -
Land Bank 203,715 307,338 - - - -
Taiwan Business Bank 1,899,342 149,024 1,397,692 0.60-0.76 - -
All transactions with related parties are made under arm’s length terms, which are consistent with normal policies.
d) DerivativesDecember 31, 2014
Related Parties Derivative Contracts Period
NominalPrincipal Amount
ValuationGain (Loss) Account Balance
Dah Chung Bills Interest rate swaps 2010.11.09-2018.11.30 $ 1,800,000 $ 451 Financial liabilities at
FVTPL ($ 1,505 )
December 31, 2014
Related Parties Derivative Contracts Period
NominalPrincipal Amount
ValuationGain (Loss) Account Balance
Taiwan Business Bank Currency swaps and interest rate swaps
2007.08.15-2015.09.17 $ 1,999,500 ($ 22,847 ) Financial assets
at FVTPL $ 26,627
Dah Chung Bills Interest rate swaps 2010.11.09-2018.11.30 1,800,000 ( 966 ) Financial liabilities
at FVTPL ( 1,956 )
Mega Bank Currency swaps and interest rate swaps
2007.11.05-2017.05.09 1,399,000 ( 10,950 ) Financial assets
at FVTPL 15,906
China Airlines Interest rate swaps 2012.05.23-2015.06.22 1,000,000 234 Financial assets
at FVTPL 168
Vanguard International Semiconductor Currency swaps 2013.11.04-
2014.02.24 703,825 1,042 Financial assets at FVTPL 5,456
All transactions with related parties are made under arm’s length terms, which are consistent with normal policies.
e) Other material transactionsFor the Year Ended December 31
2014 2013Item Amount Item Amount
Taishin Holding Insurance Brokers Fee income $ 3,001,813 Fee income $ 2,303,047
Taishin Holding Insurance Brokers
Receivables, net 251,014 Receivables, net 150,595
Shin Kong Mitsukoshi Fee income 325,947 Fee income 312,168
Shin Kong Mitsukoshi Operating expenses 384,931 Operating expenses 347,800
Cybers Soft Digital Service Operating expenses 560,676 Operating expenses 521,395
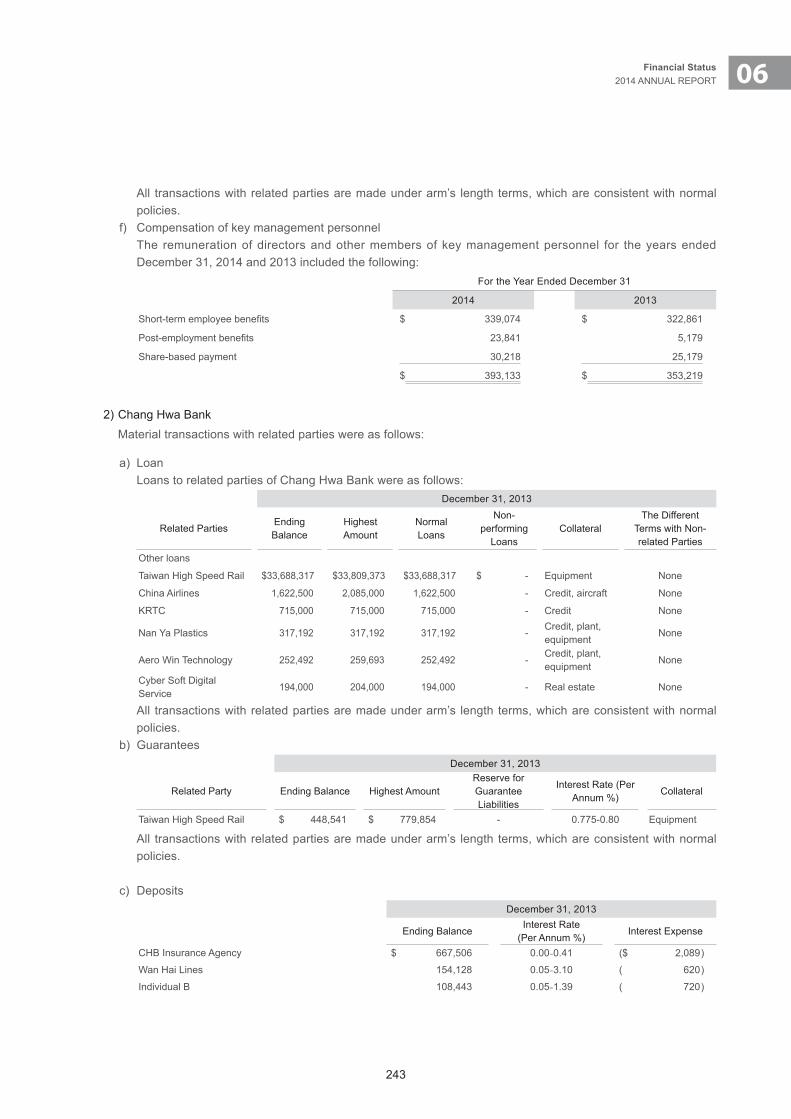
243
06Financial Status2014 ANNUAL REPORT
All transactions with related parties are made under arm’s length terms, which are consistent with normal policies.
f) Compensation of key management personnel The remuneration of directors and other members of key management personnel for the years ended
December 31, 2014 and 2013 included the following:For the Year Ended December 31
2014 2013
Short-term employee benefits $ 339,074 $ 322,861
Post-employment benefits 23,841 5,179
Share-based payment 30,218 25,179
$ 393,133 $ 353,219
2) Chang Hwa BankMaterial transactions with related parties were as follows:
a) Loan Loans to related parties of Chang Hwa Bank were as follows:
December 31, 2013
Related Parties Ending Balance
Highest Amount
Normal Loans
Non-performing
LoansCollateral
The Different Terms with Non-related Parties
Other loans
Taiwan High Speed Rail $ 33,688,317 $ 33,809,373 $ 33,688,317 $ - Equipment None
China Airlines 1,622,500 2,085,000 1,622,500 - Credit, aircraft None
KRTC 715,000 715,000 715,000 - Credit None
Nan Ya Plastics 317,192 317,192 317,192 -Credit, plant, equipment
None
Aero Win Technology 252,492 259,693 252,492 -Credit, plant, equipment
None
Cyber Soft Digital Service
194,000 204,000 194,000 - Real estate None
All transactions with related parties are made under arm’s length terms, which are consistent with normal policies.
b) GuaranteesDecember 31, 2013
Related Party Ending Balance Highest AmountReserve for Guarantee Liabilities
Interest Rate (Per Annum %)
Collateral
Taiwan High Speed Rail $ 448,541 $ 779,854 - 0.775-0.80 Equipment
All transactions with related parties are made under arm’s length terms, which are consistent with normal policies.
c) DepositsDecember 31, 2013
Ending BalanceInterest Rate
(Per Annum %)Interest Expense
CHB Insurance Agency $ 667,506 0.00-0.41 ($ 2,089 )
Wan Hai Lines 154,128 0.05-3.10 ( 620 )
Individual B 108,443 0.05-1.39 ( 720 )
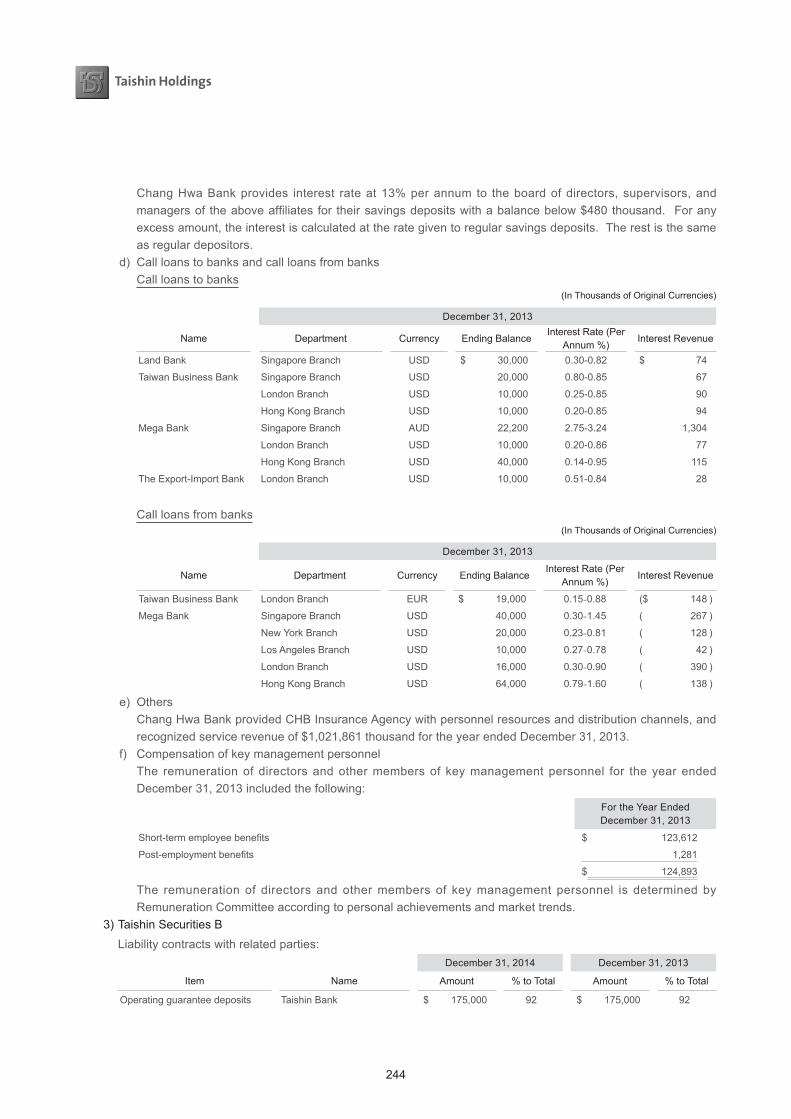
244
Chang Hwa Bank provides interest rate at 13% per annum to the board of directors, supervisors, and managers of the above affiliates for their savings deposits with a balance below $480 thousand. For any excess amount, the interest is calculated at the rate given to regular savings deposits. The rest is the same as regular depositors.
d) Call loans to banks and call loans from banks Call loans to banks
(In Thousands of Original Currencies)
December 31, 2013
Name Department Currency Ending BalanceInterest Rate (Per
Annum %)Interest Revenue
Land Bank Singapore Branch USD $ 30,000 0.30-0.82 $ 74
Taiwan Business Bank Singapore Branch USD 20,000 0.80-0.85 67
London Branch USD 10,000 0.25-0.85 90
Hong Kong Branch USD 10,000 0.20-0.85 94
Mega Bank Singapore Branch AUD 22,200 2.75-3.24 1,304
London Branch USD 10,000 0.20-0.86 77
Hong Kong Branch USD 40,000 0.14-0.95 115
The Export-Import Bank London Branch USD 10,000 0.51-0.84 28
Call loans from banks(In Thousands of Original Currencies)
December 31, 2013
Name Department Currency Ending BalanceInterest Rate (Per
Annum %)Interest Revenue
Taiwan Business Bank London Branch EUR $ 19,000 0.15-0.88 ($ 148 )
Mega Bank Singapore Branch USD 40,000 0.30-1.45 ( 267 )
New York Branch USD 20,000 0.23-0.81 ( 128 )
Los Angeles Branch USD 10,000 0.27-0.78 ( 42 )
London Branch USD 16,000 0.30-0.90 ( 390 )
Hong Kong Branch USD 64,000 0.79-1.60 ( 138 )
e) Others Chang Hwa Bank provided CHB Insurance Agency with personnel resources and distribution channels, and
recognized service revenue of $1,021,861 thousand for the year ended December 31, 2013.f) Compensation of key management personnel The remuneration of directors and other members of key management personnel for the year ended
December 31, 2013 included the following:For the Year Ended December 31, 2013
Short-term employee benefits $ 123,612
Post-employment benefits 1,281
$ 124,893
The remuneration of directors and other members of key management personnel is determined by Remuneration Committee according to personal achievements and market trends.
3) Taishin Securities BLiability contracts with related parties:
December 31, 2014 December 31, 2013
Item Name Amount % to Total Amount % to Total
Operating guarantee deposits Taishin Bank $ 175,000 92 $ 175,000 92
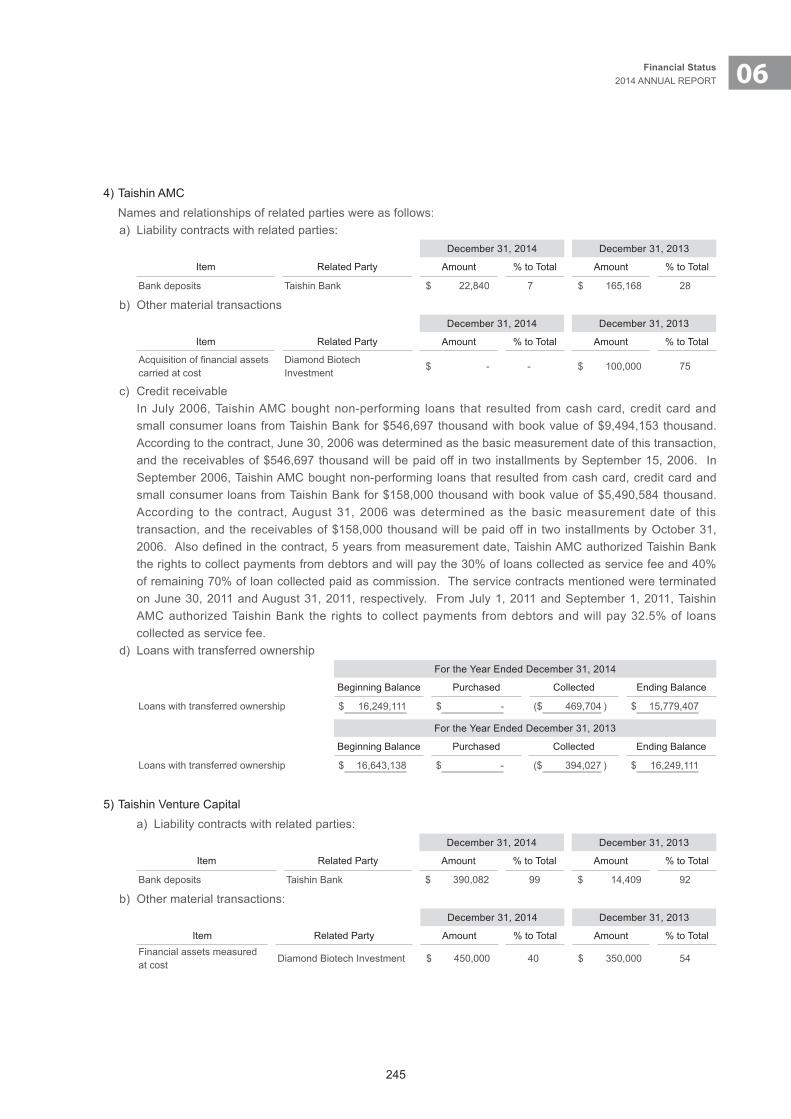
245
06Financial Status2014 ANNUAL REPORT
4) Taishin AMCNames and relationships of related parties were as follows:a) Liability contracts with related parties:
December 31, 2014 December 31, 2013
Item Related Party Amount % to Total Amount % to Total
Bank deposits Taishin Bank $ 22,840 7 $ 165,168 28
b) Other material transactionsDecember 31, 2014 December 31, 2013
Item Related Party Amount % to Total Amount % to Total
Acquisition of financial assets carried at cost
Diamond Biotech Investment
$ - - $ 100,000 75
c) Credit receivable In July 2006, Taishin AMC bought non-performing loans that resulted from cash card, credit card and
small consumer loans from Taishin Bank for $546,697 thousand with book value of $9,494,153 thousand. According to the contract, June 30, 2006 was determined as the basic measurement date of this transaction, and the receivables of $546,697 thousand will be paid off in two installments by September 15, 2006. In September 2006, Taishin AMC bought non-performing loans that resulted from cash card, credit card and small consumer loans from Taishin Bank for $158,000 thousand with book value of $5,490,584 thousand. According to the contract, August 31, 2006 was determined as the basic measurement date of this transaction, and the receivables of $158,000 thousand will be paid off in two installments by October 31, 2006. Also defined in the contract, 5 years from measurement date, Taishin AMC authorized Taishin Bank the rights to collect payments from debtors and will pay the 30% of loans collected as service fee and 40% of remaining 70% of loan collected paid as commission. The service contracts mentioned were terminated on June 30, 2011 and August 31, 2011, respectively. From July 1, 2011 and September 1, 2011, Taishin AMC authorized Taishin Bank the rights to collect payments from debtors and will pay 32.5% of loans collected as service fee.
d) Loans with transferred ownershipFor the Year Ended December 31, 2014
Beginning Balance Purchased Collected Ending Balance
Loans with transferred ownership $ 16,249,111 $ - ($ 469,704 ) $ 15,779,407
For the Year Ended December 31, 2013
Beginning Balance Purchased Collected Ending Balance
Loans with transferred ownership $ 16,643,138 $ - ($ 394,027 ) $ 16,249,111
5) Taishin Venture Capital a) Liability contracts with related parties:
December 31, 2014 December 31, 2013
Item Related Party Amount % to Total Amount % to Total
Bank deposits Taishin Bank $ 390,082 99 $ 14,409 92
b) Other material transactions:December 31, 2014 December 31, 2013
Item Related Party Amount % to Total Amount % to TotalFinancial assets measured at cost
Diamond Biotech Investment $ 450,000 40 $ 350,000 54
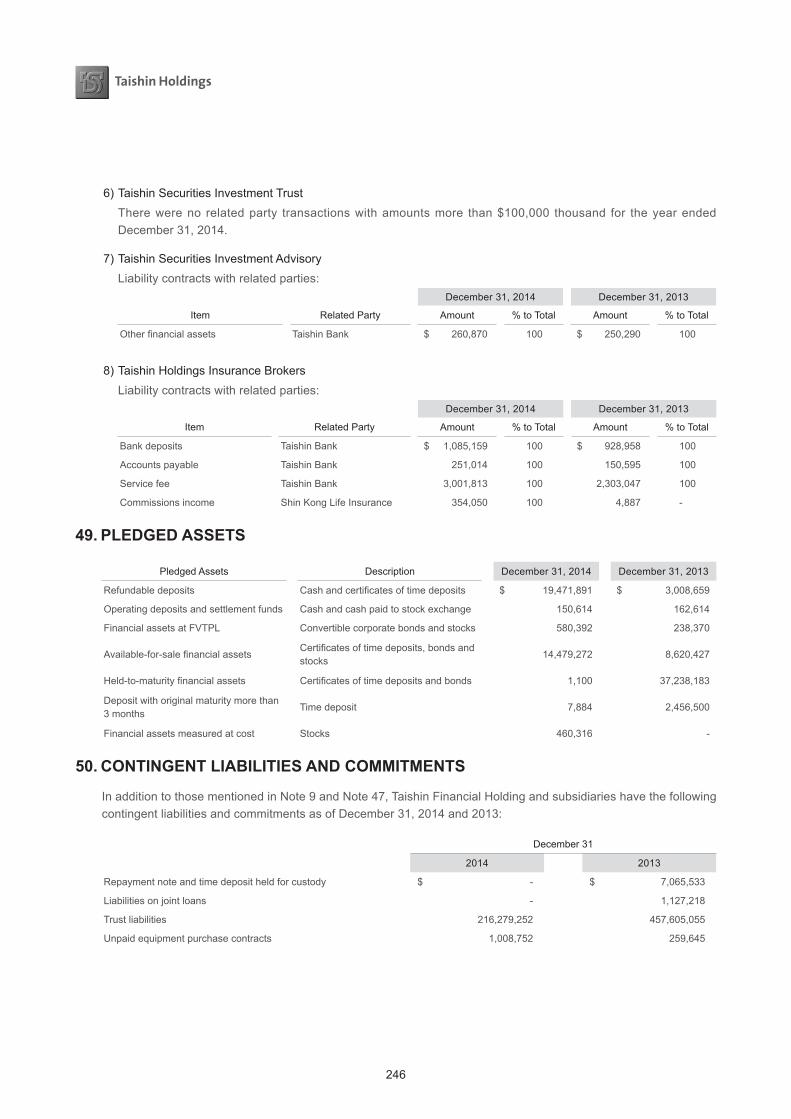
246
6) Taishin Securities Investment TrustThere were no related party transactions with amounts more than $100,000 thousand for the year ended December 31, 2014.
7) Taishin Securities Investment AdvisoryLiability contracts with related parties:
December 31, 2014 December 31, 2013
Item Related Party Amount % to Total Amount % to Total
Other financial assets Taishin Bank $ 260,870 100 $ 250,290 100
8) Taishin Holdings Insurance BrokersLiability contracts with related parties:
December 31, 2014 December 31, 2013
Item Related Party Amount % to Total Amount % to Total
Bank deposits Taishin Bank $ 1,085,159 100 $ 928,958 100
Accounts payable Taishin Bank 251,014 100 150,595 100
Service fee Taishin Bank 3,001,813 100 2,303,047 100
Commissions income Shin Kong Life Insurance 354,050 100 4,887 -
49. PLEDGED ASSETS
Pledged Assets Description December 31, 2014 December 31, 2013
Refundable deposits Cash and certificates of time deposits $ 19,471,891 $ 3,008,659
Operating deposits and settlement funds Cash and cash paid to stock exchange 150,614 162,614
Financial assets at FVTPL Convertible corporate bonds and stocks 580,392 238,370
Available-for-sale financial assetsCertificates of time deposits, bonds and stocks
14,479,272 8,620,427
Held-to-maturity financial assets Certificates of time deposits and bonds 1,100 37,238,183
Deposit with original maturity more than 3 months
Time deposit 7,884 2,456,500
Financial assets measured at cost Stocks 460,316 -
50. CONTINGENT LIABILITIES AND COMMITMENTS
In addition to those mentioned in Note 9 and Note 47, Taishin Financial Holding and subsidiaries have the following contingent liabilities and commitments as of December 31, 2014 and 2013:
December 31
2014 2013
Repayment note and time deposit held for custody $ - $ 7,065,533
Liabilities on joint loans - 1,127,218
Trust liabilities 216,279,252 457,605,055
Unpaid equipment purchase contracts 1,008,752 259,645

247
06Financial Status2014 ANNUAL REPORT
Taishin Financial Holding has appointed Lee and Li Attorney-at-Law to help Taishin Bank’s customers to assert their legal rights to Lehman Brother about the loss on investment in Lehman Brother’s securities. The related fees for the legal services will be paid by Taishin Bank. However, this case is a worldwide affair. Thus, Taishin Bank cannot reasonably estimate related litigation fee.
51. FINANCIAL INFORMATION BY BUSINESS
The financial information by business for the years ended December 31, 2014 and 2013 was as follows:
Bank BusinessItem
December 31, 2014
Bank Business Securities Business Other Business Total
Net interest income $ 33,626,424 $ 39,707 $ 31,450 $ 33,697,581
Net income other than net interest income (loss) 19,793,644 464,641 ( 9,316,180 ) 10,942,105
Net revenue and gains (expense and loss) 53,420,068 504,348 ( 9,284,730 ) 44,639,686
Reversed allowance for bad debts expenses and guarantee liability provisions
759,158 ( 1,633 ) ( 7,270 ) 750,255
Total operating expenses ( 30,410,895 ) ( 405,179 ) ( 1,405,455 ) ( 32,221,529 )
Income (loss) before income tax of continued operations
23,768,331 97,536 ( 10,697,455 ) 13,168,412
Income tax expense ( 3,260,044 ) ( 23,604 ) ( 237,025 ) ( 3,520,673 )
Income (loss) after income tax of continued operations
20,508,287 73,932 ( 10,934,480 ) 9,647,739
Bank BusinessItem
December 31, 2013
Bank Business Securities Business Other Business Total
Net interest income (expense) $ 31,541,191 $ 29,112 ($ 290,532 ) $ 31,279,771
Net income other than net interest income 19,861,453 539,051 4,146,958 24,547,462
Net revenue and gains 51,402,644 568,163 3,856,426 55,827,233
Reversed allowance for bad debts expenses and guarantee liability provisions
524,446 ( 748 ) 22,711 546,409
Total operating expenses ( 29,247,322 ) ( 391,746 ) ( 1,331,122 ) ( 30,970,190 )
Income before income tax of continued operations
22,679,768 175,669 2,548,015 25,403,452
Income tax expense ( 4,076,908 ) ( 2,915 ) ( 750,006 ) ( 4,829,829 )
Income after income tax of continued operations 18,602,860 172,754 1,798,009 20,573,623
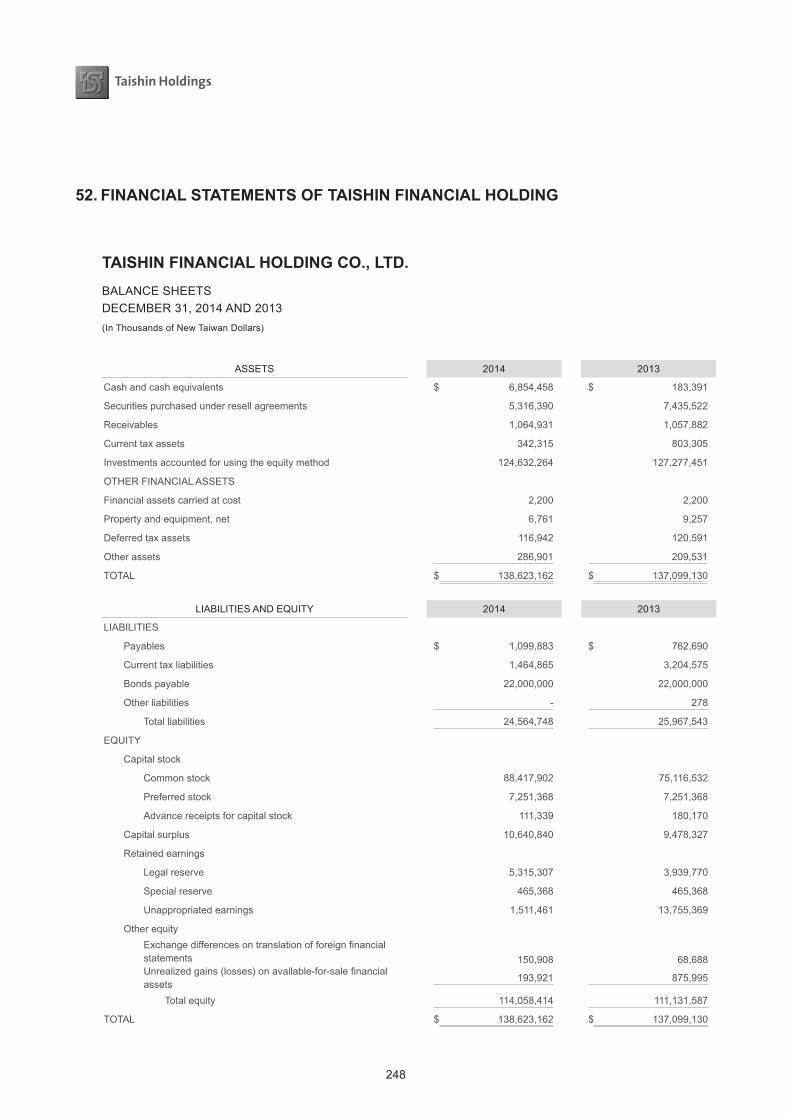
248
52. FINANCIAL STATEMENTS OF TAISHIN FINANCIAL HOLDING
TAISHIN FINANCIAL HOLDING CO., LTD.BALANCE SHEETSDECEMBER 31, 2014 AND 2013(In Thousands of New Taiwan Dollars)
ASSETS 2014 2013
Cash and cash equivalents $ 6,854,458 $ 183,391
Securities purchased under resell agreements 5,316,390 7,435,522
Receivables 1,064,931 1,057,882
Current tax assets 342,315 803,305
Investments accounted for using the equity method 124,632,264 127,277,451
OTHER FINANCIAL ASSETS
Financial assets carried at cost 2,200 2,200
Property and equipment, net 6,761 9,257
Deferred tax assets 116,942 120,591
Other assets 286,901 209,531
TOTAL $ 138,623,162 $ 137,099,130
LIABILITIES AND EQUITY 2014 2013
LIABILITIES
Payables $ 1,099,883 $ 762,690
Current tax liabilities 1,464,865 3,204,575
Bonds payable 22,000,000 22,000,000
Other liabilities - 278
Total liabilities 24,564,748 25,967,543
EQUITY
Capital stock
Common stock 88,417,902 75,116,532
Preferred stock 7,251,368 7,251,368
Advance receipts for capital stock 111,339 180,170
Capital surplus 10,640,840 9,478,327
Retained earnings
Legal reserve 5,315,307 3,939,770
Special reserve 465,368 465,368
Unappropriated earnings 1,511,461 13,755,369
Other equity Exchange differences on translation of foreign financial statements 150,908 68,688 Unrealized gains (losses) on available-for-sale financial assets
193,921 875,995
Total equity 114,058,414 111,131,587
TOTAL $ 138,623,162 $ 137,099,130
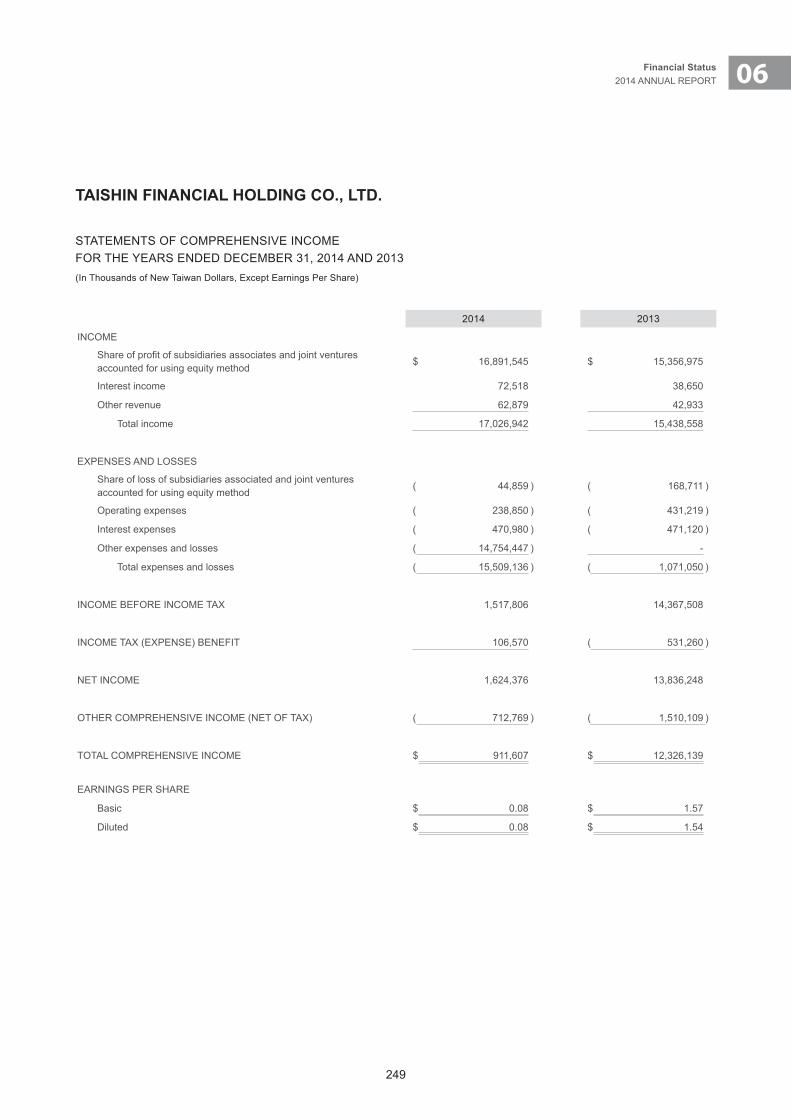
249
06Financial Status2014 ANNUAL REPORT
TAISHIN FINANCIAL HOLDING CO., LTD.
STATEMENTS OF COMPREHENSIVE INCOMEFOR THE YEARS ENDED DECEMBER 31, 2014 AND 2013(In Thousands of New Taiwan Dollars, Except Earnings Per Share)
2014 2013
INCOME
Share of profit of subsidiaries associates and joint ventures accounted for using equity method
$ 16,891,545 $ 15,356,975
Interest income 72,518 38,650
Other revenue 62,879 42,933
Total income 17,026,942 15,438,558
EXPENSES AND LOSSES
Share of loss of subsidiaries associated and joint ventures accounted for using equity method
( 44,859 ) ( 168,711 )
Operating expenses ( 238,850 ) ( 431,219 )
Interest expenses ( 470,980 ) ( 471,120 )
Other expenses and losses ( 14,754,447 ) -
Total expenses and losses ( 15,509,136 ) ( 1,071,050 )
INCOME BEFORE INCOME TAX 1,517,806 14,367,508
INCOME TAX (EXPENSE) BENEFIT 106,570 ( 531,260 )
NET INCOME 1,624,376 13,836,248
OTHER COMPREHENSIVE INCOME (NET OF TAX) ( 712,769 ) ( 1,510,109 )
TOTAL COMPREHENSIVE INCOME $ 911,607 $ 12,326,139
EARNINGS PER SHARE
Basic $ 0.08 $ 1.57
Diluted $ 0.08 $ 1.54
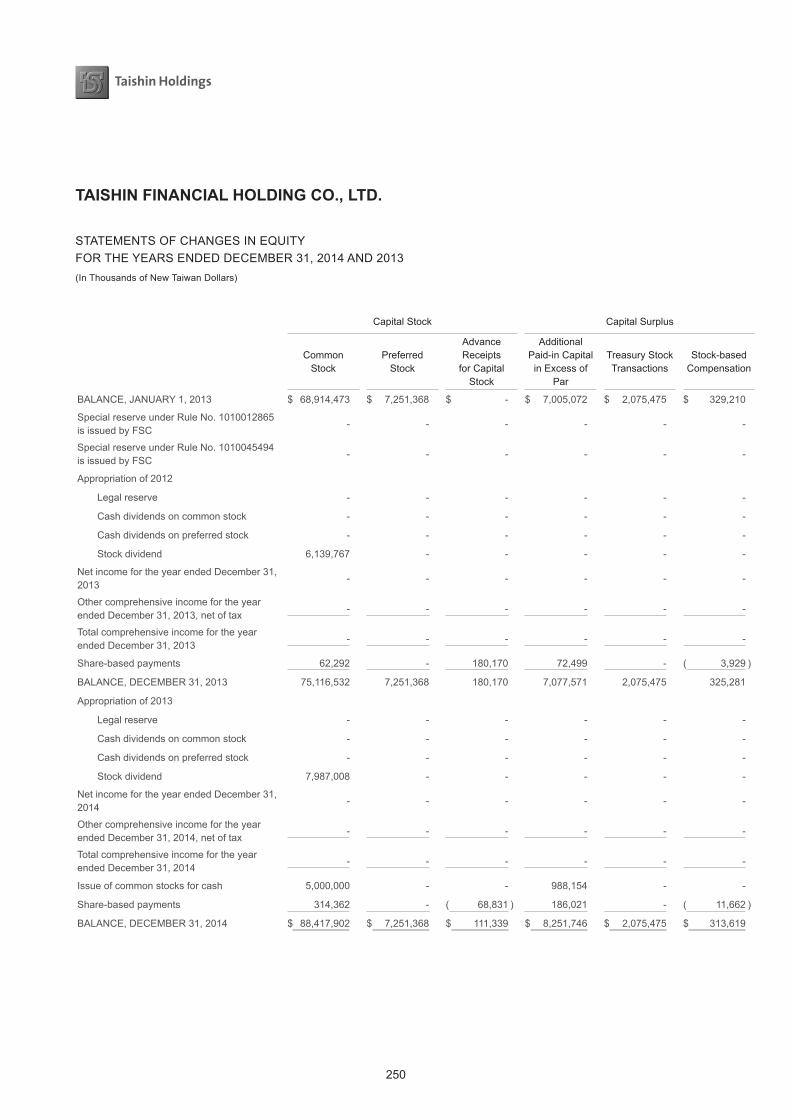
250
TAISHIN FINANCIAL HOLDING CO., LTD.
STATEMENTS OF CHANGES IN EQUITYFOR THE YEARS ENDED DECEMBER 31, 2014 AND 2013(In Thousands of New Taiwan Dollars)
Capital Stock Capital Surplus Retained Earnings Other Equity
CommonStock
Preferred Stock
AdvanceReceipts
for Capital Stock
AdditionalPaid-in Capital
in Excess of Par
Treasury StockTransactions
Stock-basedCompensation Legal Reserve Special Reserve
UnappropriatedEarnings
Exchange Differences on Translation ofForeign Financial
Statements
Unrealized Gains(Losses) on
Available- for-saleFinancial Assets
Total
BALANCE, JANUARY 1, 2013 $ 68,914,473 $ 7,251,368 $ - $ 7,005,072 $ 2,075,475 $ 329,210 $ 2,942,721 $ 244,474 $ 10,164,169 ($ 58,334 ) $ 2,458,941 $ 101,327,569
Special reserve under Rule No. 1010012865 is issued by FSC
- - - - - - - 220,376 ( 220,376 ) - - -
Special reserve under Rule No. 1010045494 is issued by FSC
- - - - - - - 518 - - - 518
Appropriation of 2012
Legal reserve - - - - - - 997,049 - ( 997,049 ) - - -
Cash dividends on common stock - - - - - - - - ( 1,534,942 ) - - ( 1,534,942 )
Cash dividends on preferred stock - - - - - - - - ( 1,298,729 ) - - ( 1,298,729 )
Stock dividend 6,139,767 - - - - - - - ( 6,139,767 ) - - -
Net income for the year ended December 31, 2013
- - - - - - - - 13,836,248 - - 13,836,248
Other comprehensive income for the year ended December 31, 2013, net of tax
- - - - - - - - ( 54,185 ) 127,022 ( 1,582,946 ) ( 1,510,109 )
Total comprehensive income for the year ended December 31, 2013
- - - - - - - - 13,782,063 127,022 ( 1,582,946 ) 12,326,139
Share-based payments 62,292 - 180,170 72,499 - ( 3,929 ) - - - - - 311,032
BALANCE, DECEMBER 31, 2013 75,116,532 7,251,368 180,170 7,077,571 2,075,475 325,281 3,939,770 465,368 13,755,369 68,688 875,995 111,131,587
Appropriation of 2013
Legal reserve - - - - - - 1,375,537 - ( 1,375,537 ) - - -
Cash dividends on common stock - - - - - - - - ( 3,423,308 ) - - ( 3,423,308 )
Cash dividends on preferred stock - - - - - - - - ( 969,516 ) - - ( 969,516 )
Stock dividend 7,987,008 - - - - - - - ( 7,987,008 ) - - -
Net income for the year ended December 31, 2014
- - - - - - - - 1,624,376 - - 1,624,376
Other comprehensive income for the year ended December 31, 2014, net of tax
- - - - - - - - ( 112,915 ) 82,220 ( 682,074 ) ( 712,769 )
Total comprehensive income for the year ended December 31, 2014
- - - - - - - - 1,511,461 82,220 ( 682,074 ) 911,607
Issue of common stocks for cash 5,000,000 - - 988,154 - - - - - - - 5,988,154
Share-based payments 314,362 - ( 68,831 ) 186,021 - ( 11,662 ) - - - - - 419,890
BALANCE, DECEMBER 31, 2014 $ 88,417,902 $ 7,251,368 $ 111,339 $ 8,251,746 $ 2,075,475 $ 313,619 $ 5,315,307 $ 465,368 $ 1,511,461 $ 150,908 $ 193,921 $ 114,058,414
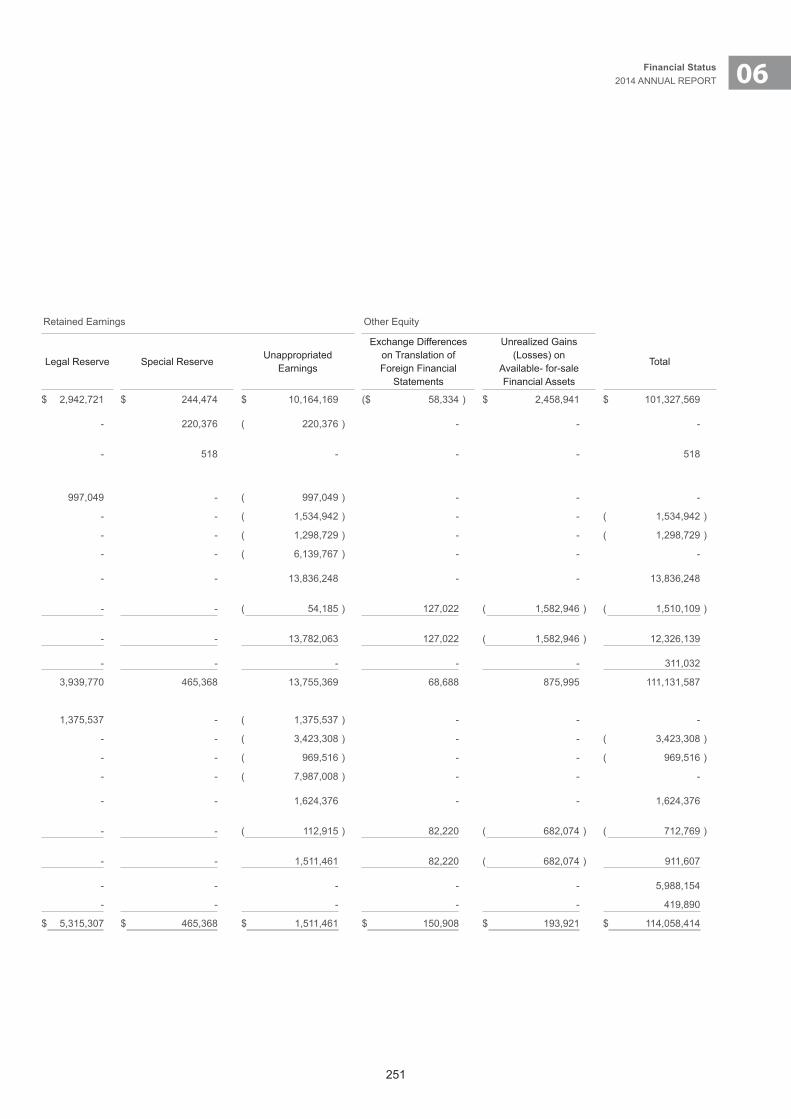
251
06Financial Status2014 ANNUAL REPORT
TAISHIN FINANCIAL HOLDING CO., LTD.
STATEMENTS OF CHANGES IN EQUITYFOR THE YEARS ENDED DECEMBER 31, 2014 AND 2013(In Thousands of New Taiwan Dollars)
Capital Stock Capital Surplus Retained Earnings Other Equity
CommonStock
Preferred Stock
AdvanceReceipts
for Capital Stock
AdditionalPaid-in Capitalin Excess of
Par
Treasury StockTransactions
Stock-basedCompensation Legal Reserve Special Reserve
UnappropriatedEarnings
Exchange Differences on Translation ofForeign Financial
Statements
Unrealized Gains(Losses) on
Available- for-saleFinancial Assets
Total
BALANCE, JANUARY 1, 2013 $ 68,914,473 $ 7,251,368 $ - $ 7,005,072 $ 2,075,475 $ 329,210 $ 2,942,721 $ 244,474 $ 10,164,169 ($ 58,334 ) $ 2,458,941 $ 101,327,569
Special reserve under Rule No. 1010012865 is issued by FSC
- - - - - - - 220,376 ( 220,376 ) - - -
Special reserve under Rule No. 1010045494 is issued by FSC
- - - - - - - 518 - - - 518
Appropriation of 2012
Legal reserve - - - - - - 997,049 - ( 997,049 ) - - -
Cash dividends on common stock - - - - - - - - ( 1,534,942 ) - - ( 1,534,942 )
Cash dividends on preferred stock - - - - - - - - ( 1,298,729 ) - - ( 1,298,729 )
Stock dividend 6,139,767 - - - - - - - ( 6,139,767 ) - - -
Net income for the year ended December 31, 2013
- - - - - - - - 13,836,248 - - 13,836,248
Other comprehensive income for the year ended December 31, 2013, net of tax
- - - - - - - - ( 54,185 ) 127,022 ( 1,582,946 ) ( 1,510,109 )
Total comprehensive income for the year ended December 31, 2013
- - - - - - - - 13,782,063 127,022 ( 1,582,946 ) 12,326,139
Share-based payments 62,292 - 180,170 72,499 - ( 3,929 ) - - - - - 311,032
BALANCE, DECEMBER 31, 2013 75,116,532 7,251,368 180,170 7,077,571 2,075,475 325,281 3,939,770 465,368 13,755,369 68,688 875,995 111,131,587
Appropriation of 2013
Legal reserve - - - - - - 1,375,537 - ( 1,375,537 ) - - -
Cash dividends on common stock - - - - - - - - ( 3,423,308 ) - - ( 3,423,308 )
Cash dividends on preferred stock - - - - - - - - ( 969,516 ) - - ( 969,516 )
Stock dividend 7,987,008 - - - - - - - ( 7,987,008 ) - - -
Net income for the year ended December 31, 2014
- - - - - - - - 1,624,376 - - 1,624,376
Other comprehensive income for the year ended December 31, 2014, net of tax
- - - - - - - - ( 112,915 ) 82,220 ( 682,074 ) ( 712,769 )
Total comprehensive income for the year ended December 31, 2014
- - - - - - - - 1,511,461 82,220 ( 682,074 ) 911,607
Issue of common stocks for cash 5,000,000 - - 988,154 - - - - - - - 5,988,154
Share-based payments 314,362 - ( 68,831 ) 186,021 - ( 11,662 ) - - - - - 419,890
BALANCE, DECEMBER 31, 2014 $ 88,417,902 $ 7,251,368 $ 111,339 $ 8,251,746 $ 2,075,475 $ 313,619 $ 5,315,307 $ 465,368 $ 1,511,461 $ 150,908 $ 193,921 $ 114,058,414
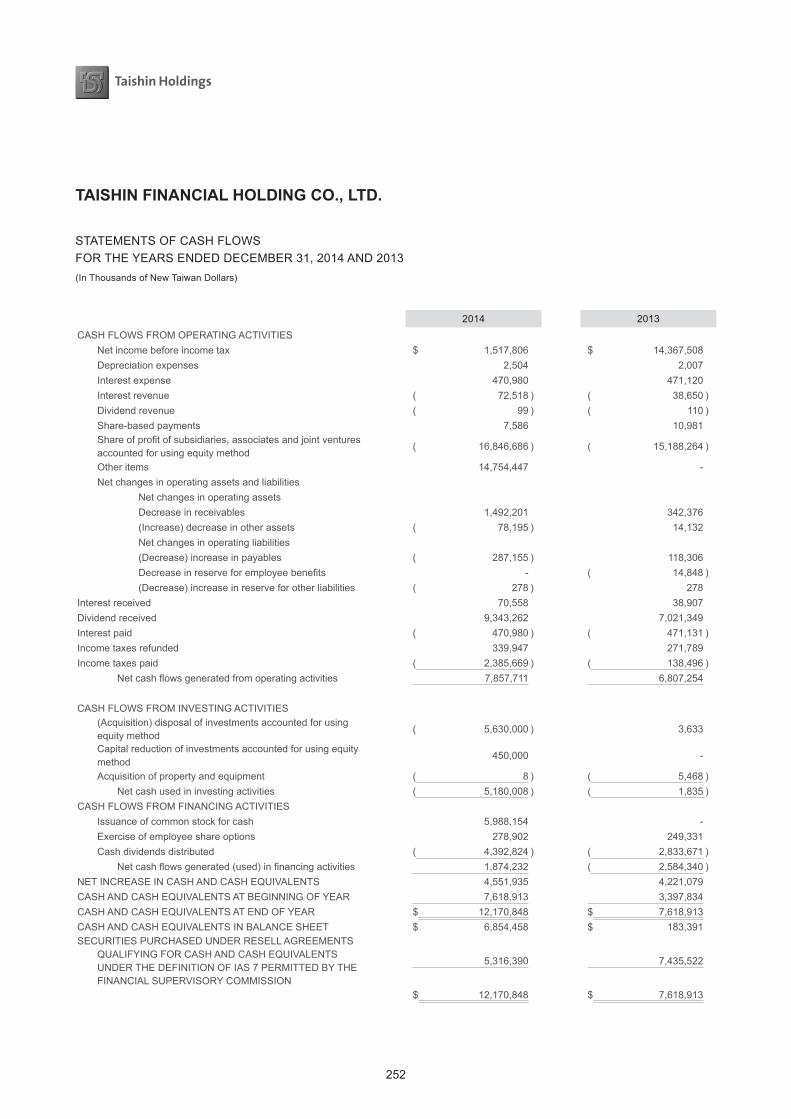
252
TAISHIN FINANCIAL HOLDING CO., LTD.
STATEMENTS OF CASH FLOWSFOR THE YEARS ENDED DECEMBER 31, 2014 AND 2013(In Thousands of New Taiwan Dollars)
2014 2013CASH FLOWS FROM OPERATING ACTIVITIES Net income before income tax $ 1,517,806 $ 14,367,508 Depreciation expenses 2,504 2,007 Interest expense 470,980 471,120 Interest revenue ( 72,518 ) ( 38,650 ) Dividend revenue ( 99 ) ( 110 ) Share-based payments 7,586 10,981 Share of profit of subsidiaries, associates and joint ventures accounted for using equity method
( 16,846,686 ) ( 15,188,264 )
Other items 14,754,447 - Net changes in operating assets and liabilities Net changes in operating assets Decrease in receivables 1,492,201 342,376 (Increase) decrease in other assets ( 78,195 ) 14,132 Net changes in operating liabilities (Decrease) increase in payables ( 287,155 ) 118,306 Decrease in reserve for employee benefits - ( 14,848 ) (Decrease) increase in reserve for other liabilities ( 278 ) 278Interest received 70,558 38,907Dividend received 9,343,262 7,021,349Interest paid ( 470,980 ) ( 471,131 )Income taxes refunded 339,947 271,789Income taxes paid ( 2,385,669 ) ( 138,496 ) Net cash flows generated from operating activities 7,857,711 6,807,254
CASH FLOWS FROM INVESTING ACTIVITIES (Acquisition) disposal of investments accounted for using equity method
( 5,630,000 ) 3,633
Capital reduction of investments accounted for using equity method
450,000 -
Acquisition of property and equipment ( 8 ) ( 5,468 ) Net cash used in investing activities ( 5,180,008 ) ( 1,835 )CASH FLOWS FROM FINANCING ACTIVITIES Issuance of common stock for cash 5,988,154 - Exercise of employee share options 278,902 249,331 Cash dividends distributed ( 4,392,824 ) ( 2,833,671 ) Net cash flows generated (used) in financing activities 1,874,232 ( 2,584,340 )NET INCREASE IN CASH AND CASH EQUIVALENTS 4,551,935 4,221,079CASH AND CASH EQUIVALENTS AT BEGINNING OF YEAR 7,618,913 3,397,834CASH AND CASH EQUIVALENTS AT END OF YEAR $ 12,170,848 $ 7,618,913CASH AND CASH EQUIVALENTS IN BALANCE SHEET $ 6,854,458 $ 183,391SECURITIES PURCHASED UNDER RESELL AGREEMENTS QUALIFYING FOR CASH AND CASH EQUIVALENTS UNDER THE DEFINITION OF IAS 7 PERMITTED BY THE FINANCIAL SUPERVISORY COMMISSION
5,316,390 7,435,522
$ 12,170,848 $ 7,618,913
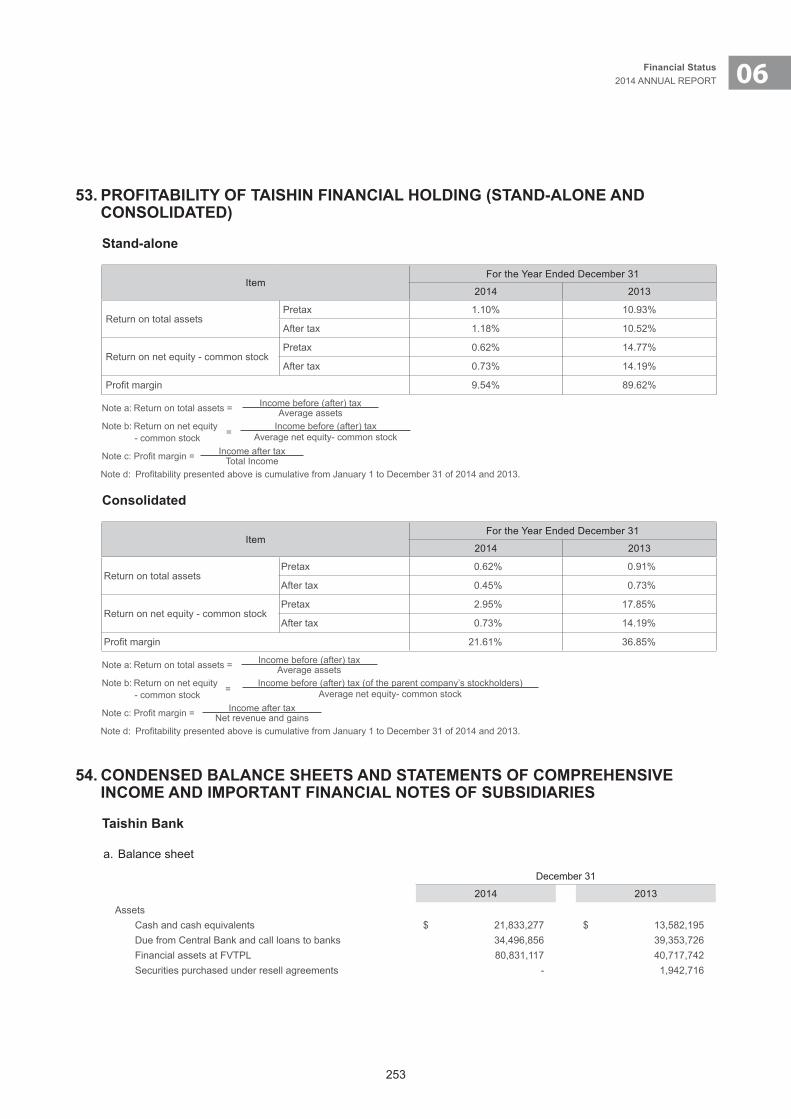
253
06Financial Status2014 ANNUAL REPORT
53. PROFITABILITY OF TAISHIN FINANCIAL HOLDING (STAND-ALONE AND CONSOLIDATED)
Stand-alone
ItemFor the Year Ended December 31
2014 2013
Return on total assetsPretax 1.10% 10.93%
After tax 1.18% 10.52%
Return on net equity - common stockPretax 0.62% 14.77%
After tax 0.73% 14.19%
Profit margin 9.54% 89.62%
Note a: Return on total assets = Income before (after) taxAverage assets
Note b: Return on net equity - common stock = Income before (after) tax
Average net equity- common stock
Note c: Profit margin = Income after taxTotal Income
Note d: Profitability presented above is cumulative from January 1 to December 31 of 2014 and 2013.
Consolidated
ItemFor the Year Ended December 31
2014 2013
Return on total assetsPretax 0.62% 0.91%
After tax 0.45% 0.73%
Return on net equity - common stockPretax 2.95% 17.85%
After tax 0.73% 14.19%
Profit margin 21.61% 36.85%
Note a: Return on total assets = Income before (after) taxAverage assets
Note b: Return on net equity - common stock = Income before (after) tax (of the parent company’s stockholders)
Average net equity- common stock
Note c: Profit margin = Income after taxNet revenue and gains
Note d: Profitability presented above is cumulative from January 1 to December 31 of 2014 and 2013.
54. CONDENSED BALANCE SHEETS AND STATEMENTS OF COMPREHENSIVE INCOME AND IMPORTANT FINANCIAL NOTES OF SUBSIDIARIES
Taishin Bank
a. Balance sheet
December 31
2014 2013Assets Cash and cash equivalents $ 21,833,277 $ 13,582,195 Due from Central Bank and call loans to banks 34,496,856 39,353,726 Financial assets at FVTPL 80,831,117 40,717,742 Securities purchased under resell agreements - 1,942,716
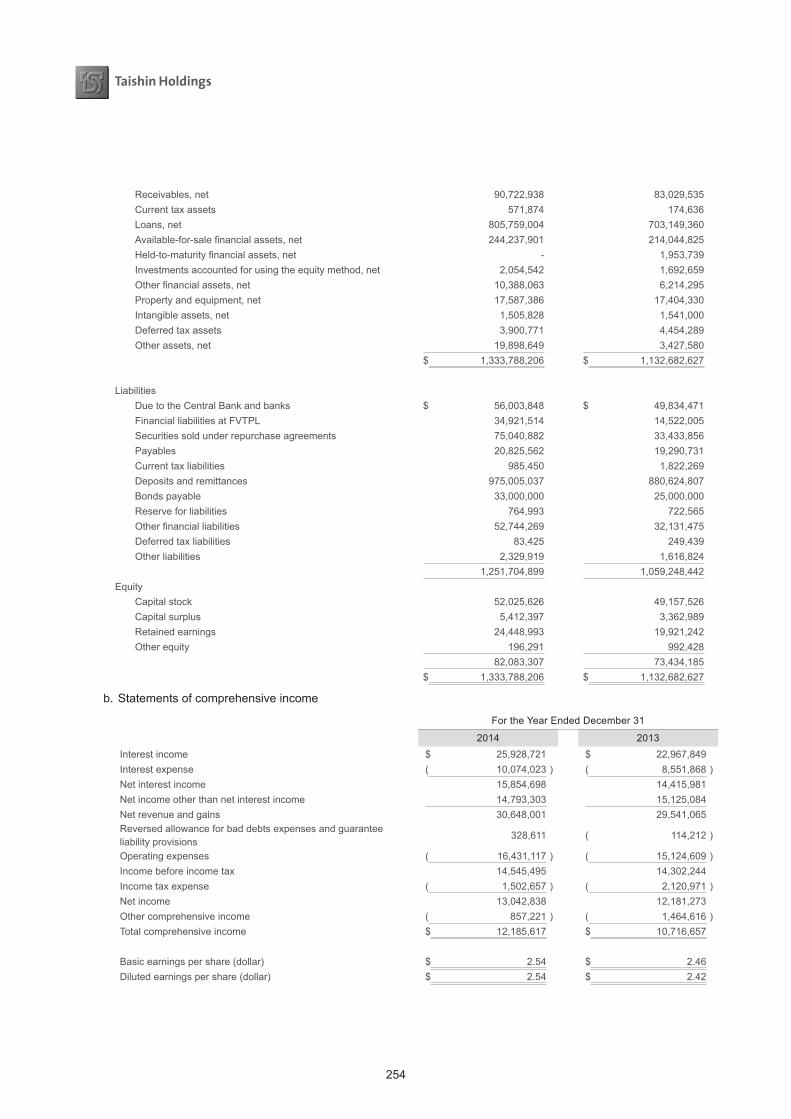
254
Receivables, net 90,722,938 83,029,535 Current tax assets 571,874 174,636 Loans, net 805,759,004 703,149,360 Available-for-sale financial assets, net 244,237,901 214,044,825 Held-to-maturity financial assets, net - 1,953,739 Investments accounted for using the equity method, net 2,054,542 1,692,659 Other financial assets, net 10,388,063 6,214,295 Property and equipment, net 17,587,386 17,404,330 Intangible assets, net 1,505,828 1,541,000 Deferred tax assets 3,900,771 4,454,289 Other assets, net 19,898,649 3,427,580
$ 1,333,788,206 $ 1,132,682,627
Liabilities Due to the Central Bank and banks $ 56,003,848 $ 49,834,471 Financial liabilities at FVTPL 34,921,514 14,522,005 Securities sold under repurchase agreements 75,040,882 33,433,856 Payables 20,825,562 19,290,731 Current tax liabilities 985,450 1,822,269 Deposits and remittances 975,005,037 880,624,807 Bonds payable 33,000,000 25,000,000 Reserve for liabilities 764,993 722,565 Other financial liabilities 52,744,269 32,131,475 Deferred tax liabilities 83,425 249,439 Other liabilities 2,329,919 1,616,824
1,251,704,899 1,059,248,442Equity Capital stock 52,025,626 49,157,526 Capital surplus 5,412,397 3,362,989 Retained earnings 24,448,993 19,921,242 Other equity 196,291 992,428
82,083,307 73,434,185 $ 1,333,788,206 $ 1,132,682,627
b. Statements of comprehensive income
For the Year Ended December 31
2014 2013Interest income $ 25,928,721 $ 22,967,849Interest expense ( 10,074,023 ) ( 8,551,868 )Net interest income 15,854,698 14,415,981Net income other than net interest income 14,793,303 15,125,084Net revenue and gains 30,648,001 29,541,065Reversed allowance for bad debts expenses and guarantee liability provisions
328,611 ( 114,212 )
Operating expenses ( 16,431,117 ) ( 15,124,609 )Income before income tax 14,545,495 14,302,244Income tax expense ( 1,502,657 ) ( 2,120,971 )Net income 13,042,838 12,181,273Other comprehensive income ( 857,221 ) ( 1,464,616 )Total comprehensive income $ 12,185,617 $ 10,716,657
Basic earnings per share (dollar) $ 2.54 $ 2.46Diluted earnings per share (dollar) $ 2.54 $ 2.42
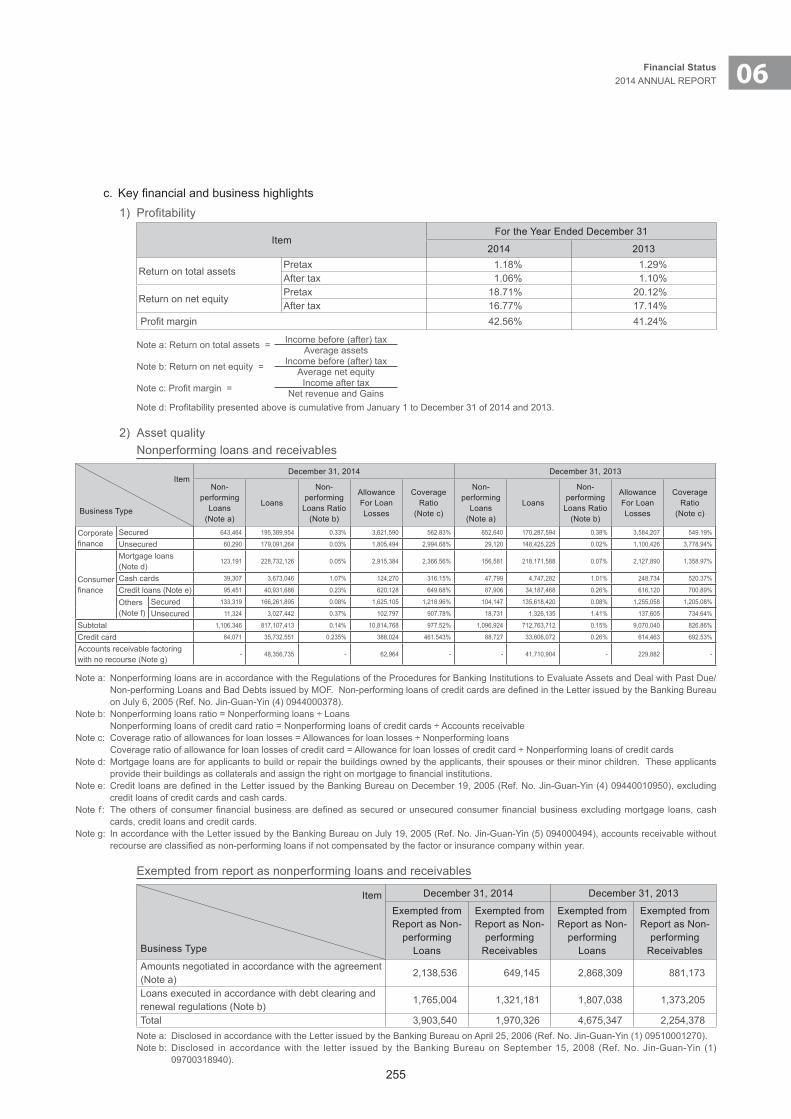
255
06Financial Status2014 ANNUAL REPORT
c. Key financial and business highlights1) Profitability
ItemFor the Year Ended December 31
2014 2013
Return on total assetsPretax 1.18% 1.29%After tax 1.06% 1.10%
Return on net equityPretax 18.71% 20.12%After tax 16.77% 17.14%
Profit margin 42.56% 41.24%
Note a: Return on total assets = Income before (after) taxAverage assets
Note b: Return on net equity = Income before (after) taxAverage net equity
Note c: Profit margin = Income after taxNet revenue and Gains
Note d: Profitability presented above is cumulative from January 1 to December 31 of 2014 and 2013.
2) Asset quality Nonperforming loans and receivables
Item
Business Type
December 31, 2014 December 31, 2013
Non-performing
Loans (Note a)
Loans
Non-performing
Loans Ratio (Note b)
Allowance For Loan Losses
Coverage Ratio
(Note c)
Non-performing
Loans (Note a)
Loans
Non-performing
Loans Ratio (Note b)
Allowance For Loan Losses
Coverage Ratio
(Note c)
Corporate finance
Secured 643,464 195,389,954 0.33% 3,621,590 562.83% 652,640 170,287,594 0.38% 3,584,207 549.19%
Unsecured 60,290 179,091,264 0.03% 1,805,494 2,994.68% 29,120 148,425,225 0.02% 1,100,426 3,778.94%
Consumer finance
Mortgage loans (Note d)
123,191 228,732,126 0.05% 2,915,384 2,366.56% 156,581 218,171,588 0.07% 2,127,890 1,358.97%
Cash cards 39,307 3,673,046 1.07% 124,270 316.15% 47,799 4,747,282 1.01% 248,734 520.37%
Credit loans (Note e) 95,451 40,931,686 0.23% 620,128 649.68% 87,906 34,187,468 0.26% 616,120 700.89%
Others (Note f)
Secured 133,319 166,261,895 0.08% 1,625,105 1,218.96% 104,147 135,618,420 0.08% 1,255,058 1,205.08%
Unsecured 11,324 3,027,442 0.37% 102,797 907.78% 18,731 1,326,135 1.41% 137,605 734.64%
Subtotal 1,106,346 817,107,413 0.14% 10,814,768 977.52% 1,096,924 712,763,712 0.15% 9,070,040 826.86%
Credit card 84,071 35,732,551 0.235% 388,024 461.543% 88,727 33,806,072 0.26% 614,463 692.53%
Accounts receivable factoring with no recourse (Note g)
- 48,356,735 - 62,964 - - 41,710,904 - 229,882 -
Note a: Nonperforming loans are in accordance with the Regulations of the Procedures for Banking Institutions to Evaluate Assets and Deal with Past Due/Non-performing Loans and Bad Debts issued by MOF. Non-performing loans of credit cards are defined in the Letter issued by the Banking Bureau on July 6, 2005 (Ref. No. Jin-Guan-Yin (4) 0944000378).
Note b: Nonperforming loans ratio = Nonperforming loans ÷ Loans Nonperforming loans of credit card ratio = Nonperforming loans of credit cards ÷ Accounts receivableNote c: Coverage ratio of allowances for loan losses = Allowances for loan losses ÷ Nonperforming loans Coverage ratio of allowance for loan losses of credit card = Allowance for loan losses of credit card ÷ Nonperforming loans of credit cardsNote d: Mortgage loans are for applicants to build or repair the buildings owned by the applicants, their spouses or their minor children. These applicants
provide their buildings as collaterals and assign the right on mortgage to financial institutions.Note e: Credit loans are defined in the Letter issued by the Banking Bureau on December 19, 2005 (Ref. No. Jin-Guan-Yin (4) 09440010950), excluding
credit loans of credit cards and cash cards.Note f : The others of consumer financial business are defined as secured or unsecured consumer financial business excluding mortgage loans, cash
cards, credit loans and credit cards.Note g: In accordance with the Letter issued by the Banking Bureau on July 19, 2005 (Ref. No. Jin-Guan-Yin (5) 094000494), accounts receivable without
recourse are classified as non-performing loans if not compensated by the factor or insurance company within year.
Exempted from report as nonperforming loans and receivables
Item
Business Type
December 31, 2014 December 31, 2013
Exempted from Report as Non-
performing Loans
Exempted from Report as Non-
performing Receivables
Exempted from Report as Non-
performing Loans
Exempted from Report as Non-
performing Receivables
Amounts negotiated in accordance with the agreement (Note a)
2,138,536 649,145 2,868,309 881,173
Loans executed in accordance with debt clearing and renewal regulations (Note b)
1,765,004 1,321,181 1,807,038 1,373,205
Total 3,903,540 1,970,326 4,675,347 2,254,378Note a: Disclosed in accordance with the Letter issued by the Banking Bureau on April 25, 2006 (Ref. No. Jin-Guan-Yin (1) 09510001270).Note b: Disclosed in accordance with the letter issued by the Banking Bureau on September 15, 2008 (Ref. No. Jin-Guan-Yin (1)
09700318940).
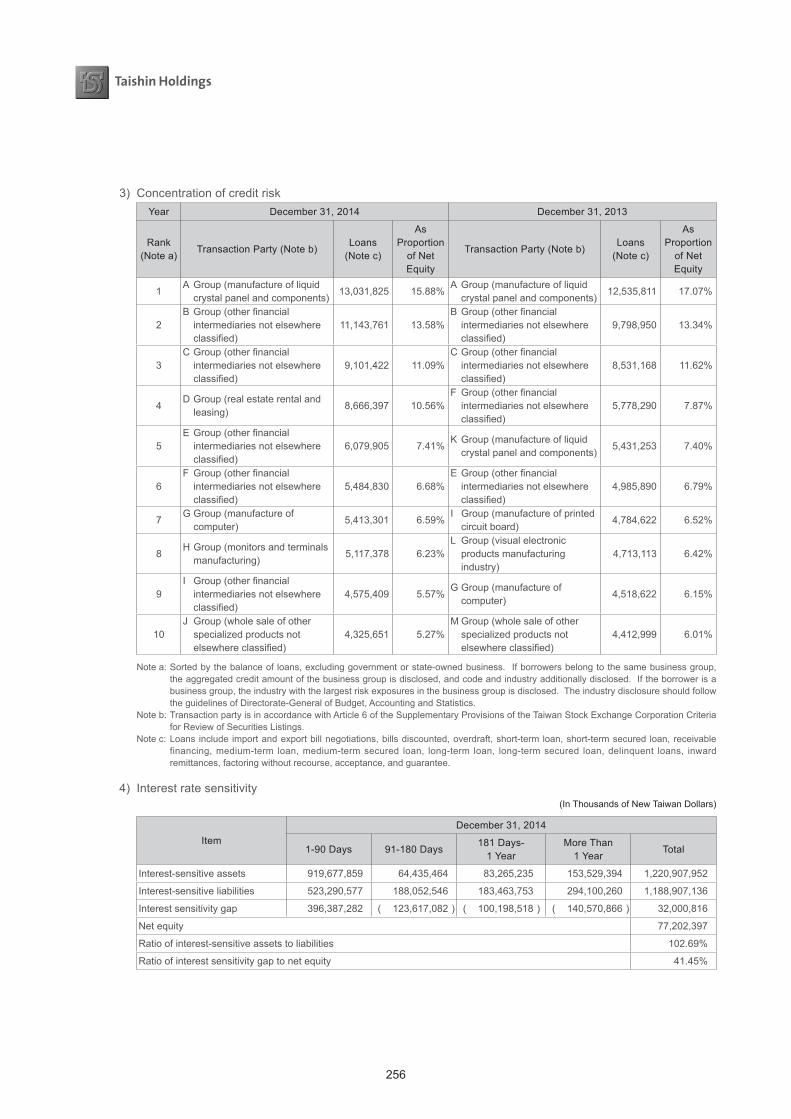
256
3) Concentration of credit riskYear December 31, 2014 December 31, 2013
Rank (Note a)
Transaction Party (Note b)Loans
(Note c)
As Proportion
of Net Equity
Transaction Party (Note b)Loans
(Note c)
As Proportion
of Net Equity
1A Group (manufacture of liquid
crystal panel and components)13,031,825 15.88%
A Group (manufacture of liquid crystal panel and components)
12,535,811 17.07%
2B Group (other financial
intermediaries not elsewhere classified)
11,143,761 13.58%B Group (other financial
intermediaries not elsewhere classified)
9,798,950 13.34%
3C Group (other financial
intermediaries not elsewhere classified)
9,101,422 11.09%C Group (other financial
intermediaries not elsewhere classified)
8,531,168 11.62%
4D Group (real estate rental and
leasing)8,666,397 10.56%
F Group (other financial intermediaries not elsewhere classified)
5,778,290 7.87%
5E Group (other financial
intermediaries not elsewhere classified)
6,079,905 7.41%K Group (manufacture of liquid
crystal panel and components)5,431,253 7.40%
6F Group (other financial
intermediaries not elsewhere classified)
5,484,830 6.68%E Group (other financial
intermediaries not elsewhere classified)
4,985,890 6.79%
7G Group (manufacture of
computer)5,413,301 6.59%
I Group (manufacture of printed circuit board)
4,784,622 6.52%
8H Group (monitors and terminals
manufacturing)5,117,378 6.23%
L Group (visual electronic products manufacturing industry)
4,713,113 6.42%
9I Group (other financial
intermediaries not elsewhere classified)
4,575,409 5.57%G Group (manufacture of
computer) 4,518,622 6.15%
10J Group (whole sale of other
specialized products not elsewhere classified)
4,325,651 5.27%M Group (whole sale of other
specialized products not elsewhere classified)
4,412,999 6.01%
Note a: Sorted by the balance of loans, excluding government or state-owned business. If borrowers belong to the same business group, the aggregated credit amount of the business group is disclosed, and code and industry additionally disclosed. If the borrower is a business group, the industry with the largest risk exposures in the business group is disclosed. The industry disclosure should follow the guidelines of Directorate-General of Budget, Accounting and Statistics.
Note b: Transaction party is in accordance with Article 6 of the Supplementary Provisions of the Taiwan Stock Exchange Corporation Criteria for Review of Securities Listings.
Note c: Loans include import and export bill negotiations, bills discounted, overdraft, short-term loan, short-term secured loan, receivable financing, medium-term loan, medium-term secured loan, long-term loan, long-term secured loan, delinquent loans, inward remittances, factoring without recourse, acceptance, and guarantee.
4) Interest rate sensitivity(In Thousands of New Taiwan Dollars)
ItemDecember 31, 2014
1-90 Days 91-180 Days181 Days-
1 YearMore Than
1 YearTotal
Interest-sensitive assets 919,677,859 64,435,464 83,265,235 153,529,394 1,220,907,952
Interest-sensitive liabilities 523,290,577 188,052,546 183,463,753 294,100,260 1,188,907,136
Interest sensitivity gap 396,387,282 ( 123,617,082 ) ( 100,198,518 ) ( 140,570,866 ) 32,000,816
Net equity 77,202,397
Ratio of interest-sensitive assets to liabilities 102.69%
Ratio of interest sensitivity gap to net equity 41.45%
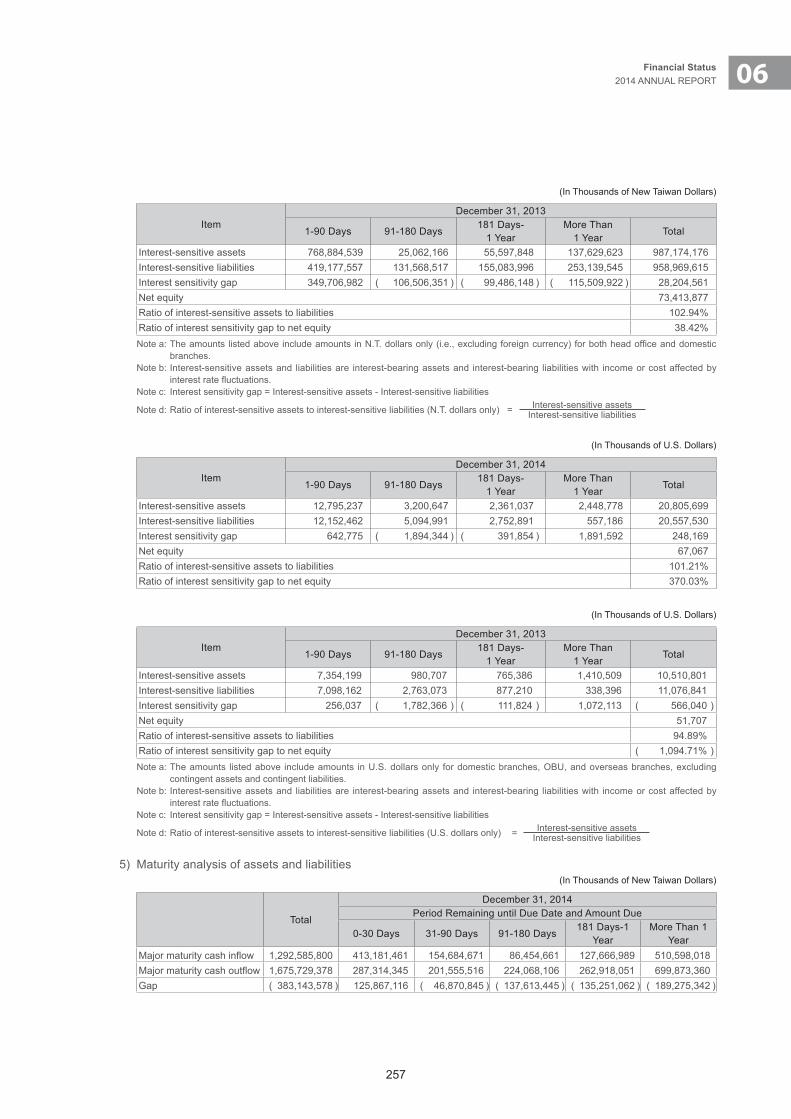
257
06Financial Status2014 ANNUAL REPORT
(In Thousands of New Taiwan Dollars)
ItemDecember 31, 2013
1-90 Days 91-180 Days181 Days-
1 YearMore Than
1 YearTotal
Interest-sensitive assets 768,884,539 25,062,166 55,597,848 137,629,623 987,174,176Interest-sensitive liabilities 419,177,557 131,568,517 155,083,996 253,139,545 958,969,615Interest sensitivity gap 349,706,982 ( 106,506,351 ) ( 99,486,148 ) ( 115,509,922 ) 28,204,561Net equity 73,413,877Ratio of interest-sensitive assets to liabilities 102.94%Ratio of interest sensitivity gap to net equity 38.42%Note a: The amounts listed above include amounts in N.T. dollars only (i.e., excluding foreign currency) for both head office and domestic
branches.Note b: Interest-sensitive assets and liabilities are interest-bearing assets and interest-bearing liabilities with income or cost affected by
interest rate fluctuations.Note c: Interest sensitivity gap = Interest-sensitive assets - Interest-sensitive liabilities
Note d: Ratio of interest-sensitive assets to interest-sensitive liabilities (N.T. dollars only) = Interest-sensitive assetsInterest-sensitive liabilities
(In Thousands of U.S. Dollars)
ItemDecember 31, 2014
1-90 Days 91-180 Days181 Days-
1 YearMore Than
1 YearTotal
Interest-sensitive assets 12,795,237 3,200,647 2,361,037 2,448,778 20,805,699Interest-sensitive liabilities 12,152,462 5,094,991 2,752,891 557,186 20,557,530Interest sensitivity gap 642,775 ( 1,894,344 ) ( 391,854 ) 1,891,592 248,169Net equity 67,067Ratio of interest-sensitive assets to liabilities 101.21%Ratio of interest sensitivity gap to net equity 370.03%
(In Thousands of U.S. Dollars)
ItemDecember 31, 2013
1-90 Days 91-180 Days181 Days-
1 YearMore Than
1 YearTotal
Interest-sensitive assets 7,354,199 980,707 765,386 1,410,509 10,510,801Interest-sensitive liabilities 7,098,162 2,763,073 877,210 338,396 11,076,841Interest sensitivity gap 256,037 ( 1,782,366 ) ( 111,824 ) 1,072,113 ( 566,040 )Net equity 51,707Ratio of interest-sensitive assets to liabilities 94.89%Ratio of interest sensitivity gap to net equity ( 1,094.71% )Note a: The amounts listed above include amounts in U.S. dollars only for domestic branches, OBU, and overseas branches, excluding
contingent assets and contingent liabilities.Note b: Interest-sensitive assets and liabilities are interest-bearing assets and interest-bearing liabilities with income or cost affected by
interest rate fluctuations.Note c: Interest sensitivity gap = Interest-sensitive assets - Interest-sensitive liabilities
Note d: Ratio of interest-sensitive assets to interest-sensitive liabilities (U.S. dollars only) = Interest-sensitive assetsInterest-sensitive liabilities
5) Maturity analysis of assets and liabilities (In Thousands of New Taiwan Dollars)
Total
December 31, 2014Period Remaining until Due Date and Amount Due
0-30 Days 31-90 Days 91-180 Days181 Days-1
YearMore Than 1
YearMajor maturity cash inflow 1,292,585,800 413,181,461 154,684,671 86,454,661 127,666,989 510,598,018Major maturity cash outflow 1,675,729,378 287,314,345 201,555,516 224,068,106 262,918,051 699,873,360Gap ( 383,143,578 ) 125,867,116 ( 46,870,845 ) ( 137,613,445 ) ( 135,251,062 ) ( 189,275,342 )
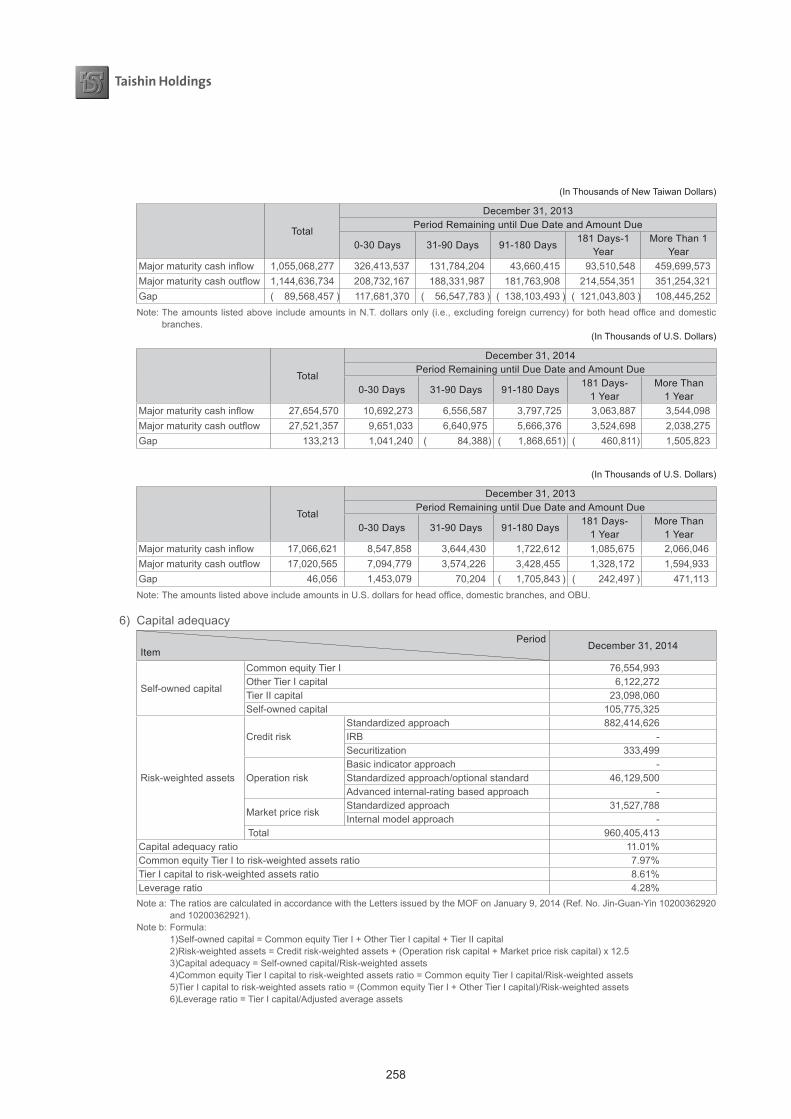
258
(In Thousands of New Taiwan Dollars)
Total
December 31, 2013Period Remaining until Due Date and Amount Due
0-30 Days 31-90 Days 91-180 Days181 Days-1
YearMore Than 1
YearMajor maturity cash inflow 1,055,068,277 326,413,537 131,784,204 43,660,415 93,510,548 459,699,573Major maturity cash outflow 1,144,636,734 208,732,167 188,331,987 181,763,908 214,554,351 351,254,321Gap ( 89,568,457 ) 117,681,370 ( 56,547,783 ) ( 138,103,493 ) ( 121,043,803 ) 108,445,252Note: The amounts listed above include amounts in N.T. dollars only (i.e., excluding foreign currency) for both head office and domestic
branches. (In Thousands of U.S. Dollars)
Total
December 31, 2014Period Remaining until Due Date and Amount Due
0-30 Days 31-90 Days 91-180 Days181 Days-
1 YearMore Than
1 YearMajor maturity cash inflow 27,654,570 10,692,273 6,556,587 3,797,725 3,063,887 3,544,098Major maturity cash outflow 27,521,357 9,651,033 6,640,975 5,666,376 3,524,698 2,038,275Gap 133,213 1,041,240 ( 84,388) ( 1,868,651) ( 460,811) 1,505,823
(In Thousands of U.S. Dollars)
Total
December 31, 2013Period Remaining until Due Date and Amount Due
0-30 Days 31-90 Days 91-180 Days181 Days-
1 YearMore Than
1 YearMajor maturity cash inflow 17,066,621 8,547,858 3,644,430 1,722,612 1,085,675 2,066,046Major maturity cash outflow 17,020,565 7,094,779 3,574,226 3,428,455 1,328,172 1,594,933Gap 46,056 1,453,079 70,204 ( 1,705,843 ) ( 242,497 ) 471,113Note: The amounts listed above include amounts in U.S. dollars for head office, domestic branches, and OBU.
6) Capital adequacyPeriod
ItemDecember 31, 2014
Self-owned capital
Common equity Tier I 76,554,993Other Tier I capital 6,122,272Tier II capital 23,098,060Self-owned capital 105,775,325
Risk-weighted assets
Credit risk Standardized approach 882,414,626IRB -Securitization 333,499
Operation riskBasic indicator approach -Standardized approach/optional standard 46,129,500Advanced internal-rating based approach -
Market price riskStandardized approach 31,527,788Internal model approach -
Total 960,405,413Capital adequacy ratio 11.01%Common equity Tier I to risk-weighted assets ratio 7.97%Tier I capital to risk-weighted assets ratio 8.61%Leverage ratio 4.28%Note a: The ratios are calculated in accordance with the Letters issued by the MOF on January 9, 2014 (Ref. No. Jin-Guan-Yin 10200362920
and 10200362921). Note b: Formula: 1)Self-owned capital = Common equity Tier I + Other Tier I capital + Tier II capital 2)Risk-weighted assets = Credit risk-weighted assets + (Operation risk capital + Market price risk capital) x 12.5 3)Capital adequacy = Self-owned capital/Risk-weighted assets 4)Common equity Tier I capital to risk-weighted assets ratio = Common equity Tier I capital/Risk-weighted assets 5)Tier I capital to risk-weighted assets ratio = (Common equity Tier I + Other Tier I capital)/Risk-weighted assets 6)Leverage ratio = Tier I capital/Adjusted average assets
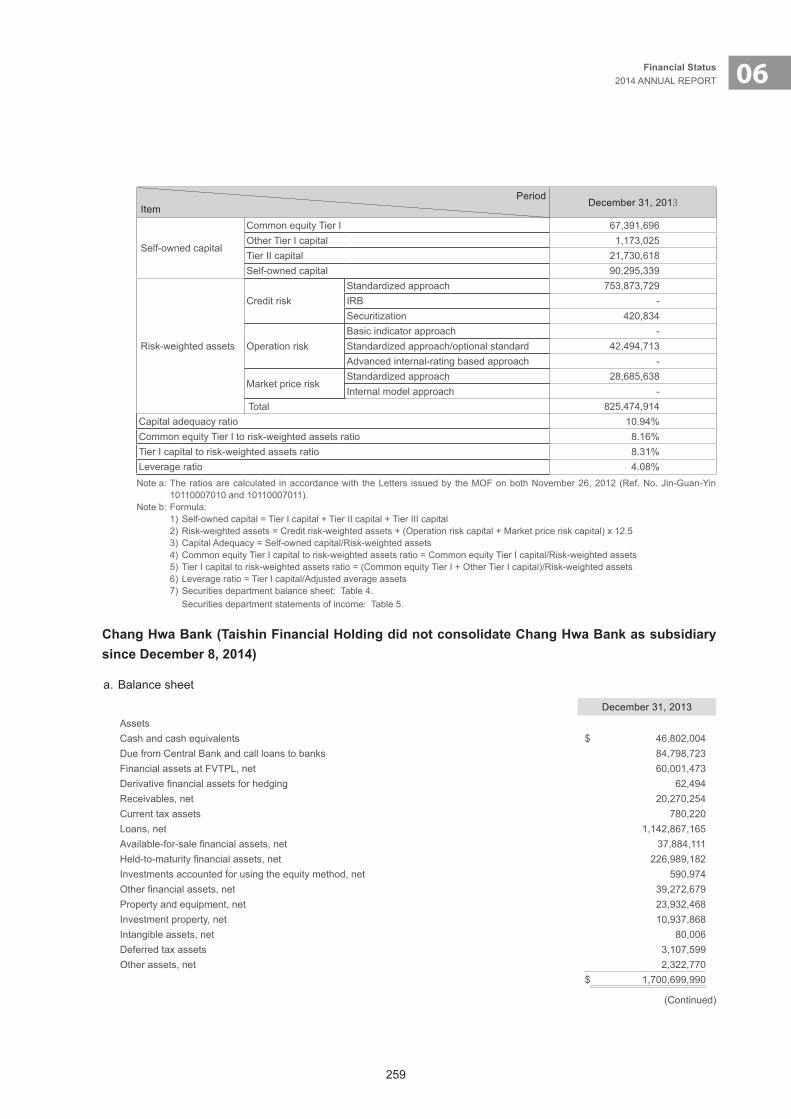
259
06Financial Status2014 ANNUAL REPORT
PeriodItem
December 31, 2013
Self-owned capital
Common equity Tier I 67,391,696Other Tier I capital 1,173,025Tier II capital 21,730,618Self-owned capital 90,295,339
Risk-weighted assets
Credit risk Standardized approach 753,873,729IRB -Securitization 420,834
Operation riskBasic indicator approach -Standardized approach/optional standard 42,494,713Advanced internal-rating based approach -
Market price riskStandardized approach 28,685,638Internal model approach -
Total 825,474,914Capital adequacy ratio 10.94%Common equity Tier I to risk-weighted assets ratio 8.16%Tier I capital to risk-weighted assets ratio 8.31%Leverage ratio 4.08%Note a: The ratios are calculated in accordance with the Letters issued by the MOF on both November 26, 2012 (Ref. No. Jin-Guan-Yin
10110007010 and 10110007011).Note b: Formula: 1) Self-owned capital = Tier I capital + Tier II capital + Tier III capital 2) Risk-weighted assets = Credit risk-weighted assets + (Operation risk capital + Market price risk capital) x 12.5 3) Capital Adequacy = Self-owned capital/Risk-weighted assets 4) Common equity Tier I capital to risk-weighted assets ratio = Common equity Tier I capital/Risk-weighted assets 5) Tier I capital to risk-weighted assets ratio = (Common equity Tier I + Other Tier I capital)/Risk-weighted assets 6) Leverage ratio = Tier I capital/Adjusted average assets 7) Securities department balance sheet: Table 4. Securities department statements of income: Table 5.
Chang Hwa Bank (Taishin Financial Holding did not consolidate Chang Hwa Bank as subsidiary since December 8, 2014)
a. Balance sheet
December 31, 2013AssetsCash and cash equivalents $ 46,802,004Due from Central Bank and call loans to banks 84,798,723Financial assets at FVTPL, net 60,001,473Derivative financial assets for hedging 62,494Receivables, net 20,270,254Current tax assets 780,220Loans, net 1,142,867,165Available-for-sale financial assets, net 37,884,111Held-to-maturity financial assets, net 226,989,182Investments accounted for using the equity method, net 590,974Other financial assets, net 39,272,679Property and equipment, net 23,932,468Investment property, net 10,937,868Intangible assets, net 80,006Deferred tax assets 3,107,599Other assets, net 2,322,770
$ 1,700,699,990
(Continued)
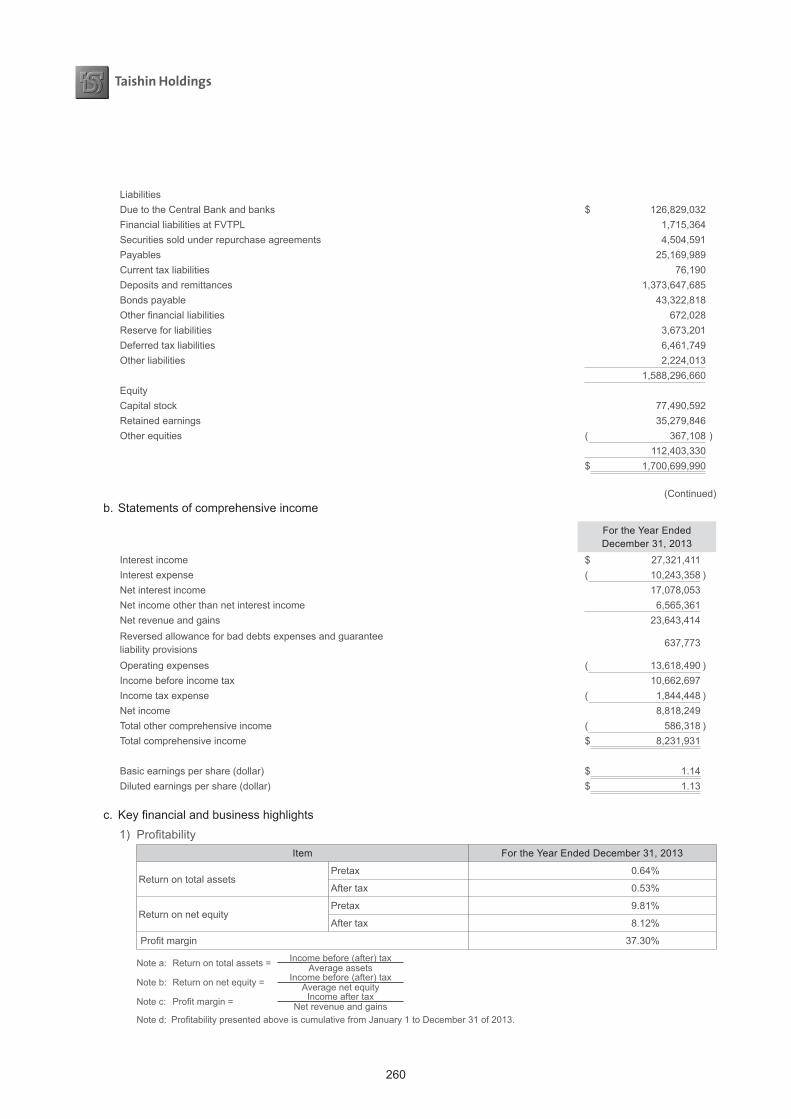
260
LiabilitiesDue to the Central Bank and banks $ 126,829,032Financial liabilities at FVTPL 1,715,364Securities sold under repurchase agreements 4,504,591Payables 25,169,989Current tax liabilities 76,190Deposits and remittances 1,373,647,685Bonds payable 43,322,818Other financial liabilities 672,028Reserve for liabilities 3,673,201Deferred tax liabilities 6,461,749Other liabilities 2,224,013
1,588,296,660EquityCapital stock 77,490,592Retained earnings 35,279,846Other equities ( 367,108 )
112,403,330 $ 1,700,699,990
(Continued)b. Statements of comprehensive income
For the Year Ended December 31, 2013
Interest income $ 27,321,411Interest expense ( 10,243,358 )Net interest income 17,078,053Net income other than net interest income 6,565,361Net revenue and gains 23,643,414Reversed allowance for bad debts expenses and guarantee liability provisions
637,773
Operating expenses ( 13,618,490 )Income before income tax 10,662,697Income tax expense ( 1,844,448 )Net income 8,818,249Total other comprehensive income ( 586,318 )Total comprehensive income $ 8,231,931
Basic earnings per share (dollar) $ 1.14Diluted earnings per share (dollar) $ 1.13
c. Key financial and business highlights1) Profitability
Item For the Year Ended December 31, 2013
Return on total assetsPretax 0.64%
After tax 0.53%
Return on net equityPretax 9.81%
After tax 8.12%
Profit margin 37.30%
Note a: Return on total assets = Income before (after) taxAverage assets
Note b: Return on net equity = Income before (after) taxAverage net equity
Note c: Profit margin = Income after taxNet revenue and gains
Note d: Profitability presented above is cumulative from January 1 to December 31 of 2013.
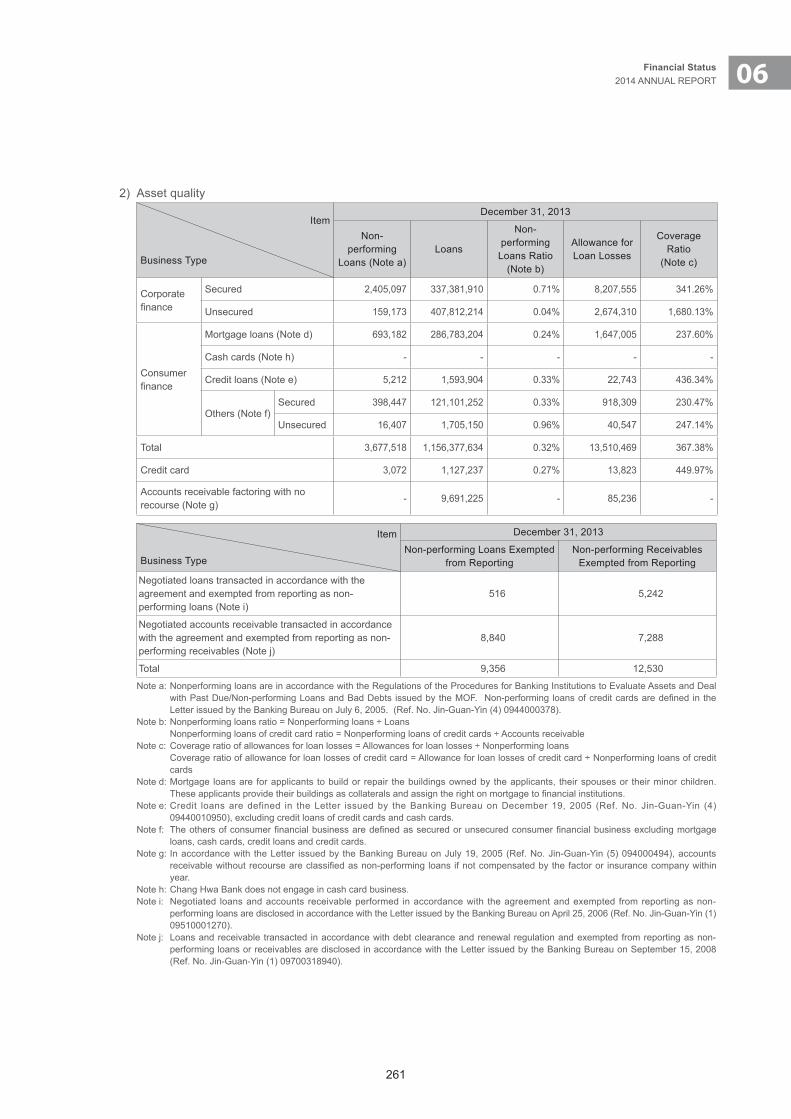
261
06Financial Status2014 ANNUAL REPORT
2) Asset quality
Item
Business Type
December 31, 2013
Non-performing
Loans (Note a)Loans
Non-performing
Loans Ratio (Note b)
Allowance for Loan Losses
Coverage Ratio
(Note c)
Corporate finance
Secured 2,405,097 337,381,910 0.71% 8,207,555 341.26%
Unsecured 159,173 407,812,214 0.04% 2,674,310 1,680.13%
Consumer finance
Mortgage loans (Note d) 693,182 286,783,204 0.24% 1,647,005 237.60%
Cash cards (Note h) - - - - -
Credit loans (Note e) 5,212 1,593,904 0.33% 22,743 436.34%
Others (Note f)Secured 398,447 121,101,252 0.33% 918,309 230.47%
Unsecured 16,407 1,705,150 0.96% 40,547 247.14%
Total 3,677,518 1,156,377,634 0.32% 13,510,469 367.38%
Credit card 3,072 1,127,237 0.27% 13,823 449.97%
Accounts receivable factoring with no recourse (Note g)
- 9,691,225 - 85,236 -
Item
Business Type
December 31, 2013
Non-performing Loans Exempted from Reporting
Non-performing Receivables Exempted from Reporting
Negotiated loans transacted in accordance with the agreement and exempted from reporting as non-performing loans (Note i)
516 5,242
Negotiated accounts receivable transacted in accordance with the agreement and exempted from reporting as non-performing receivables (Note j)
8,840 7,288
Total 9,356 12,530
Note a: Nonperforming loans are in accordance with the Regulations of the Procedures for Banking Institutions to Evaluate Assets and Deal with Past Due/Non-performing Loans and Bad Debts issued by the MOF. Non-performing loans of credit cards are defined in the Letter issued by the Banking Bureau on July 6, 2005. (Ref. No. Jin-Guan-Yin (4) 0944000378).
Note b: Nonperforming loans ratio = Nonperforming loans ÷ Loans Nonperforming loans of credit card ratio = Nonperforming loans of credit cards ÷ Accounts receivableNote c: Coverage ratio of allowances for loan losses = Allowances for loan losses ÷ Nonperforming loans Coverage ratio of allowance for loan losses of credit card = Allowance for loan losses of credit card ÷ Nonperforming loans of credit
cardsNote d: Mortgage loans are for applicants to build or repair the buildings owned by the applicants, their spouses or their minor children.
These applicants provide their buildings as collaterals and assign the right on mortgage to financial institutions.Note e: Credit loans are defined in the Letter issued by the Banking Bureau on December 19, 2005 (Ref. No. Jin-Guan-Yin (4)
09440010950), excluding credit loans of credit cards and cash cards.Note f: The others of consumer financial business are defined as secured or unsecured consumer financial business excluding mortgage
loans, cash cards, credit loans and credit cards.Note g: In accordance with the Letter issued by the Banking Bureau on July 19, 2005 (Ref. No. Jin-Guan-Yin (5) 094000494), accounts
receivable without recourse are classified as non-performing loans if not compensated by the factor or insurance company within year.
Note h: Chang Hwa Bank does not engage in cash card business.Note i: Negotiated loans and accounts receivable performed in accordance with the agreement and exempted from reporting as non-
performing loans are disclosed in accordance with the Letter issued by the Banking Bureau on April 25, 2006 (Ref. No. Jin-Guan-Yin (1) 09510001270).
Note j: Loans and receivable transacted in accordance with debt clearance and renewal regulation and exempted from reporting as non-performing loans or receivables are disclosed in accordance with the Letter issued by the Banking Bureau on September 15, 2008 (Ref. No. Jin-Guan-Yin (1) 09700318940).
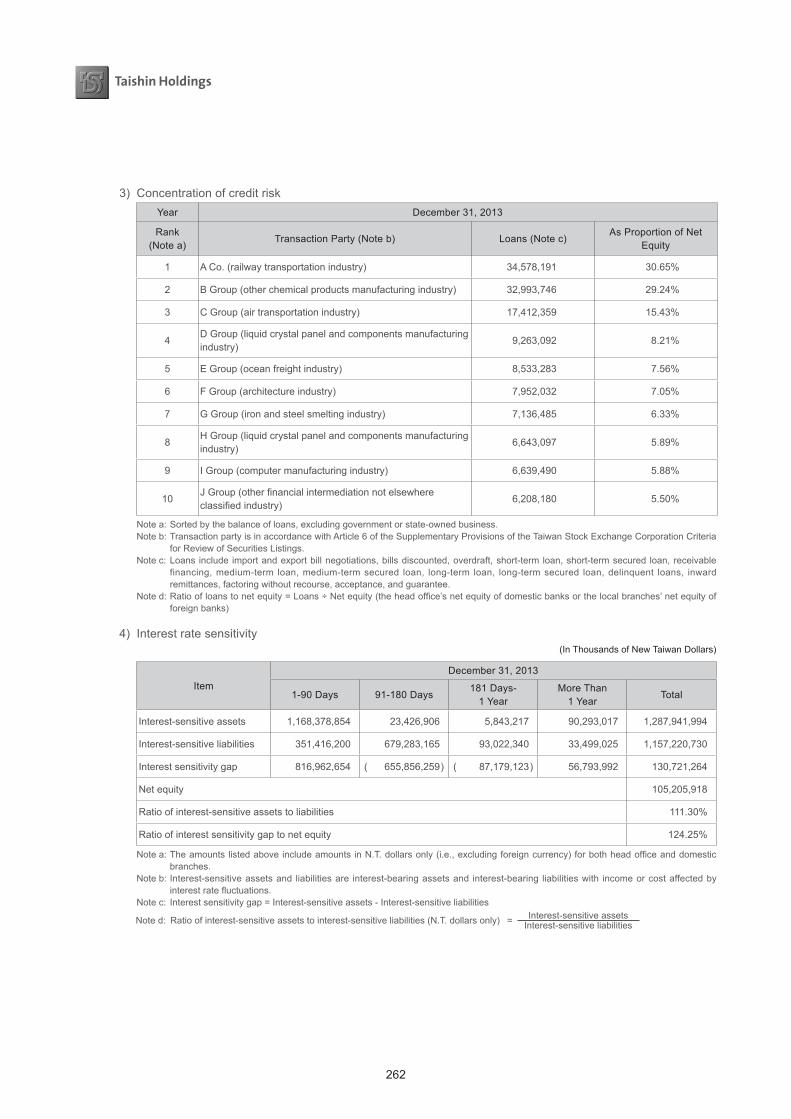
262
3) Concentration of credit riskYear December 31, 2013
Rank(Note a)
Transaction Party (Note b) Loans (Note c)As Proportion of Net
Equity
1 A Co. (railway transportation industry) 34,578,191 30.65%
2 B Group (other chemical products manufacturing industry) 32,993,746 29.24%
3 C Group (air transportation industry) 17,412,359 15.43%
4D Group (liquid crystal panel and components manufacturing industry)
9,263,092 8.21%
5 E Group (ocean freight industry) 8,533,283 7.56%
6 F Group (architecture industry) 7,952,032 7.05%
7 G Group (iron and steel smelting industry) 7,136,485 6.33%
8H Group (liquid crystal panel and components manufacturing industry)
6,643,097 5.89%
9 I Group (computer manufacturing industry) 6,639,490 5.88%
10J Group (other financial intermediation not elsewhere classified industry)
6,208,180 5.50%
Note a: Sorted by the balance of loans, excluding government or state-owned business.Note b: Transaction party is in accordance with Article 6 of the Supplementary Provisions of the Taiwan Stock Exchange Corporation Criteria
for Review of Securities Listings.Note c: Loans include import and export bill negotiations, bills discounted, overdraft, short-term loan, short-term secured loan, receivable
financing, medium-term loan, medium-term secured loan, long-term loan, long-term secured loan, delinquent loans, inward remittances, factoring without recourse, acceptance, and guarantee.
Note d: Ratio of loans to net equity = Loans ÷ Net equity (the head office’s net equity of domestic banks or the local branches’ net equity of foreign banks)
4) Interest rate sensitivity (In Thousands of New Taiwan Dollars)
ItemDecember 31, 2013
1-90 Days 91-180 Days181 Days-
1 YearMore Than
1 YearTotal
Interest-sensitive assets 1,168,378,854 23,426,906 5,843,217 90,293,017 1,287,941,994
Interest-sensitive liabilities 351,416,200 679,283,165 93,022,340 33,499,025 1,157,220,730
Interest sensitivity gap 816,962,654 ( 655,856,259 ) ( 87,179,123 ) 56,793,992 130,721,264
Net equity 105,205,918
Ratio of interest-sensitive assets to liabilities 111.30%
Ratio of interest sensitivity gap to net equity 124.25%
Note a: The amounts listed above include amounts in N.T. dollars only (i.e., excluding foreign currency) for both head office and domestic branches.
Note b: Interest-sensitive assets and liabilities are interest-bearing assets and interest-bearing liabilities with income or cost affected by interest rate fluctuations.
Note c: Interest sensitivity gap = Interest-sensitive assets - Interest-sensitive liabilities
Note d: Ratio of interest-sensitive assets to interest-sensitive liabilities (N.T. dollars only) = Interest-sensitive assetsInterest-sensitive liabilities
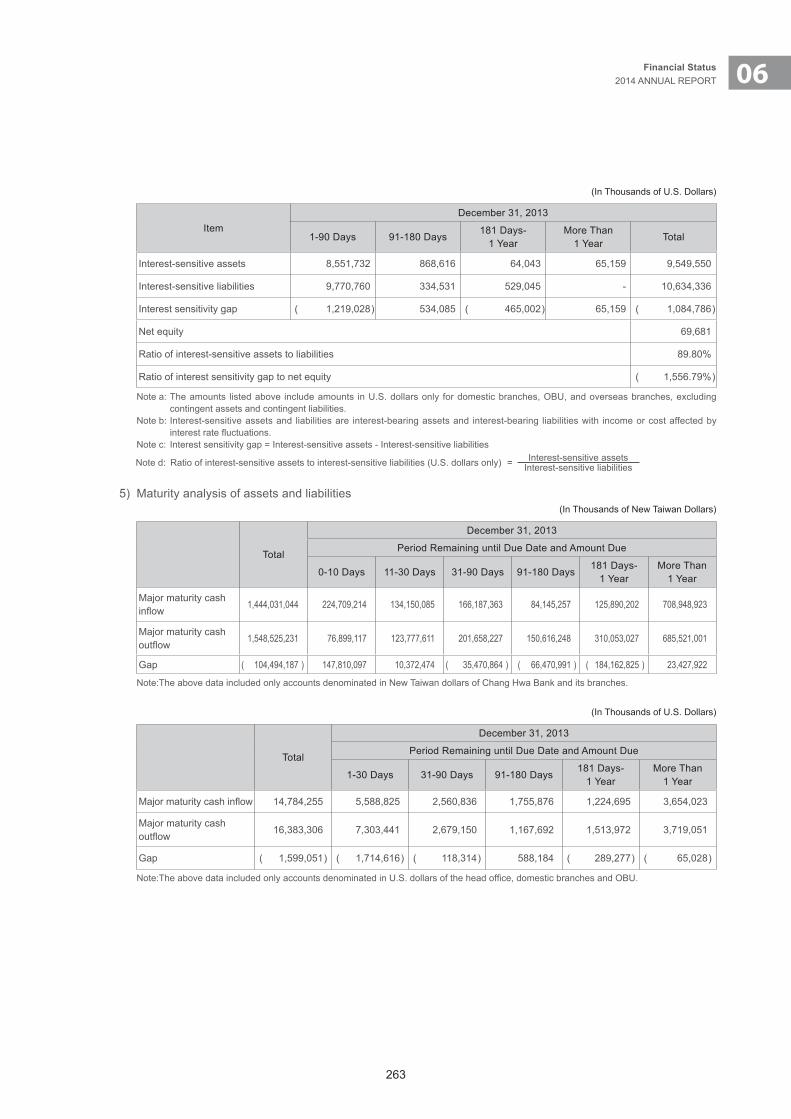
263
06Financial Status2014 ANNUAL REPORT
(In Thousands of U.S. Dollars)
ItemDecember 31, 2013
1-90 Days 91-180 Days181 Days-
1 YearMore Than
1 YearTotal
Interest-sensitive assets 8,551,732 868,616 64,043 65,159 9,549,550
Interest-sensitive liabilities 9,770,760 334,531 529,045 - 10,634,336
Interest sensitivity gap ( 1,219,028 ) 534,085 ( 465,002 ) 65,159 ( 1,084,786 )
Net equity 69,681
Ratio of interest-sensitive assets to liabilities 89.80%
Ratio of interest sensitivity gap to net equity ( 1,556.79% )
Note a: The amounts listed above include amounts in U.S. dollars only for domestic branches, OBU, and overseas branches, excluding contingent assets and contingent liabilities.
Note b: Interest-sensitive assets and liabilities are interest-bearing assets and interest-bearing liabilities with income or cost affected by interest rate fluctuations.
Note c: Interest sensitivity gap = Interest-sensitive assets - Interest-sensitive liabilities
Note d: Ratio of interest-sensitive assets to interest-sensitive liabilities (U.S. dollars only) = Interest-sensitive assetsInterest-sensitive liabilities
5) Maturity analysis of assets and liabilities(In Thousands of New Taiwan Dollars)
Total
December 31, 2013
Period Remaining until Due Date and Amount Due
0-10 Days 11-30 Days 31-90 Days 91-180 Days181 Days-
1 YearMore Than
1 Year
Major maturity cash inflow
1,444,031,044 224,709,214 134,150,085 166,187,363 84,145,257 125,890,202 708,948,923
Major maturity cash outflow
1,548,525,231 76,899,117 123,777,611 201,658,227 150,616,248 310,053,027 685,521,001
Gap ( 104,494,187 ) 147,810,097 10,372,474 ( 35,470,864 ) ( 66,470,991 ) ( 184,162,825 ) 23,427,922
Note:The above data included only accounts denominated in New Taiwan dollars of Chang Hwa Bank and its branches.
(In Thousands of U.S. Dollars)
Total
December 31, 2013
Period Remaining until Due Date and Amount Due
1-30 Days 31-90 Days 91-180 Days181 Days-
1 YearMore Than
1 Year
Major maturity cash inflow 14,784,255 5,588,825 2,560,836 1,755,876 1,224,695 3,654,023
Major maturity cash outflow
16,383,306 7,303,441 2,679,150 1,167,692 1,513,972 3,719,051
Gap ( 1,599,051 ) ( 1,714,616 ) ( 118,314 ) 588,184 ( 289,277 ) ( 65,028 )
Note:The above data included only accounts denominated in U.S. dollars of the head office, domestic branches and OBU.

264
6) Capital adequacyPeriod
ItemDecember 31, 2013
Self-owned capital
Common equity Tier I capital 96,516,072
Other Tier I capital 3,453,503
Tier II capital 25,991,559
Self-owned capital 125,961,134
Risk-weighted assets
Credit risk
Standardized approach 1,073,505,460
IRB -
Real estate securitization 59,772
Operation risk
Basic indicator approach -
Standardized approach/optional standard 39,393,925
Advanced internal-rating based approach -
Market price riskStandardized approach 20,542,888
Internal model approach -
Total 1,133,502,045
Capital adequacy ratio 11.11%
Common equity Tier I capital to risk weighted assets ratio 8.51%
Tier I capital to risk weighted assets ratio 8.82%
Gearing ratio 3.66%
Note a: The ratios are calculated in accordance with the Letters issued by the MOF (Ref. No. Jin-Guan-Yin 09610000025) and (Ref. No. Jin-Guan-Yin 10110007010).
Note b: Capital adequacy should be disclosed current and same period for the years ended December 31.Note c: Formula: 1)Self-owned capital = Common equity Tier I capital + Other Tier I capital + Tier II capital 2)Risk-weighted assets = Credit risk-weighted assets + (Operation risk Capital + Market price risk Capital) × 12.5 3)Capital Adequacy = Self-owned capital ÷ Risk-weighted assets 4)Common equity Tier I capital to risk weighted assets ratio = Common equity Tier I capital ÷ Risk-weighted assets 5)Tier I capital to risk weighted assets ratio = (Common equity Tier I capital + Other Tier I capital) ÷ Risk-weighted assets 6)Gearing ratio = Tier I capital ÷ Average-assets adjusted
Taishin Securities B
a. Balance sheet
December 31
2014 2013AssetsCurrent assets $ 3,835,549 $ 2,844,345Financial assets carried at cost - noncurrent 4,630 6,470Property and equipment 26,988 31,539Intangible assets 28,089 31,311Deferred tax assets 3,549 3,755Other noncurrent assets 232,829 230,684
$ 4,131,634 $ 3,148,104LiabilitiesCurrent liabilities $ 675,359 $ 667,654Other noncurrent liabilities 19,679 18,835
695,038 686,489EquityCapital stock 3,061,250 2,280,000Capital surplus 297,639 74,034Retained earnings 77,707 107,581
3,436,596 2,461,615 $ 4,131,634 $ 3,148,104
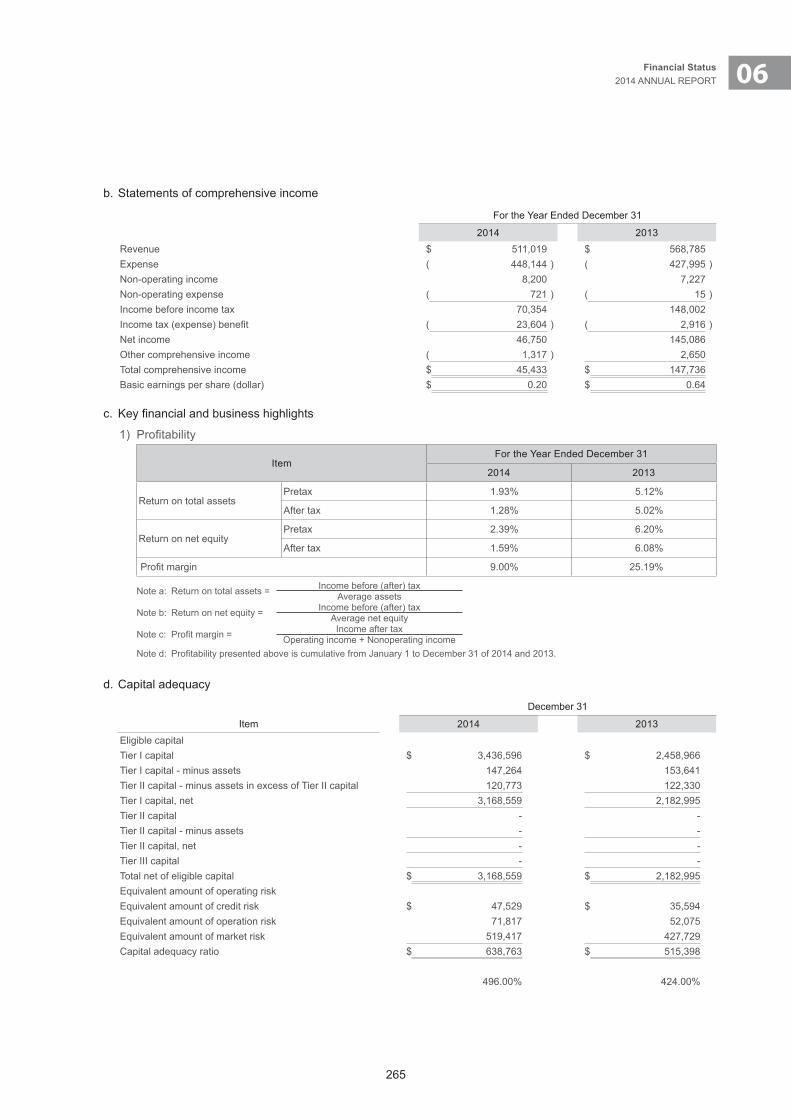
265
06Financial Status2014 ANNUAL REPORT
b. Statements of comprehensive income
For the Year Ended December 31
2014 2013Revenue $ 511,019 $ 568,785Expense ( 448,144 ) ( 427,995 )Non-operating income 8,200 7,227Non-operating expense ( 721 ) ( 15 )Income before income tax 70,354 148,002Income tax (expense) benefit ( 23,604 ) ( 2,916 )Net income 46,750 145,086Other comprehensive income ( 1,317 ) 2,650Total comprehensive income $ 45,433 $ 147,736Basic earnings per share (dollar) $ 0.20 $ 0.64
c. Key financial and business highlights
1) Profitability
ItemFor the Year Ended December 31
2014 2013
Return on total assetsPretax 1.93% 5.12%
After tax 1.28% 5.02%
Return on net equityPretax 2.39% 6.20%
After tax 1.59% 6.08%
Profit margin 9.00% 25.19%
Note a: Return on total assets = Income before (after) taxAverage assets
Note b: Return on net equity = Income before (after) taxAverage net equity
Note c: Profit margin = Income after taxOperating income + Nonoperating income
Note d: Profitability presented above is cumulative from January 1 to December 31 of 2014 and 2013.
d. Capital adequacy
December 31
Item 2014 2013Eligible capitalTier I capital $ 3,436,596 $ 2,458,966Tier I capital - minus assets 147,264 153,641Tier II capital - minus assets in excess of Tier II capital 120,773 122,330Tier I capital, net 3,168,559 2,182,995Tier II capital - -Tier II capital - minus assets - -Tier II capital, net - -Tier III capital - -Total net of eligible capital $ 3,168,559 $ 2,182,995Equivalent amount of operating riskEquivalent amount of credit risk $ 47,529 $ 35,594Equivalent amount of operation risk 71,817 52,075Equivalent amount of market risk 519,417 427,729Capital adequacy ratio $ 638,763 $ 515,398
496.00% 424.00%
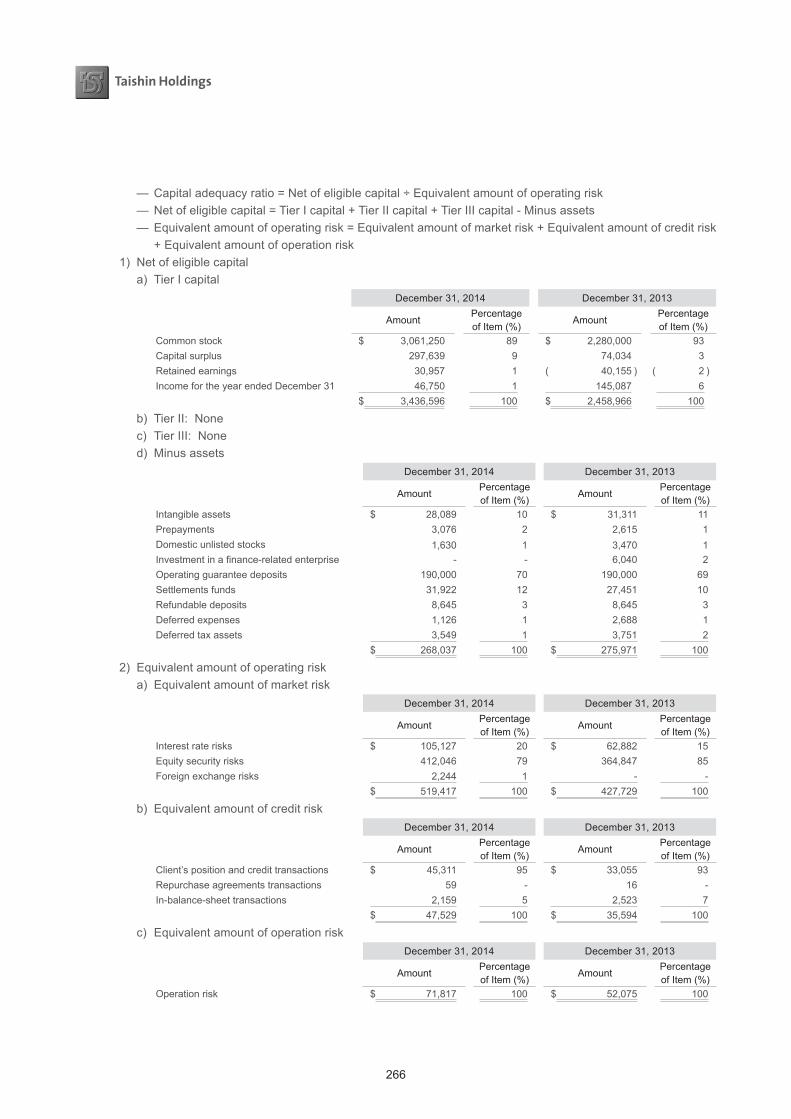
266
— Capital adequacy ratio = Net of eligible capital ÷ Equivalent amount of operating risk— Net of eligible capital = Tier I capital + Tier II capital + Tier III capital - Minus assets— Equivalent amount of operating risk = Equivalent amount of market risk + Equivalent amount of credit risk
+ Equivalent amount of operation risk1) Net of eligible capital
a) Tier I capitalDecember 31, 2014 December 31, 2013
AmountPercentageof Item (%)
AmountPercentageof Item (%)
Common stock $ 3,061,250 89 $ 2,280,000 93Capital surplus 297,639 9 74,034 3Retained earnings 30,957 1 ( 40,155 ) ( 2 )Income for the year ended December 31 46,750 1 145,087 6
$ 3,436,596 100 $ 2,458,966 100
b) Tier II: Nonec) Tier III: Noned) Minus assets
December 31, 2014 December 31, 2013
AmountPercentageof Item (%)
AmountPercentageof Item (%)
Intangible assets $ 28,089 10 $ 31,311 11Prepayments 3,076 2 2,615 1Domestic unlisted stocks 1,630 1 3,470 1Investment in a finance-related enterprise - - 6,040 2Operating guarantee deposits 190,000 70 190,000 69Settlements funds 31,922 12 27,451 10Refundable deposits 8,645 3 8,645 3Deferred expenses 1,126 1 2,688 1Deferred tax assets 3,549 1 3,751 2
$ 268,037 100 $ 275,971 100
2) Equivalent amount of operating riska) Equivalent amount of market risk
December 31, 2014 December 31, 2013
AmountPercentageof Item (%)
AmountPercentageof Item (%)
Interest rate risks $ 105,127 20 $ 62,882 15Equity security risks 412,046 79 364,847 85Foreign exchange risks 2,244 1 - -
$ 519,417 100 $ 427,729 100
b) Equivalent amount of credit riskDecember 31, 2014 December 31, 2013
AmountPercentageof Item (%)
AmountPercentageof Item (%)
Client’s position and credit transactions $ 45,311 95 $ 33,055 93Repurchase agreements transactions 59 - 16 -In-balance-sheet transactions 2,159 5 2,523 7
$ 47,529 100 $ 35,594 100
c) Equivalent amount of operation riskDecember 31, 2014 December 31, 2013
AmountPercentageof Item (%)
AmountPercentageof Item (%)
Operation risk $ 71,817 100 $ 52,075 100
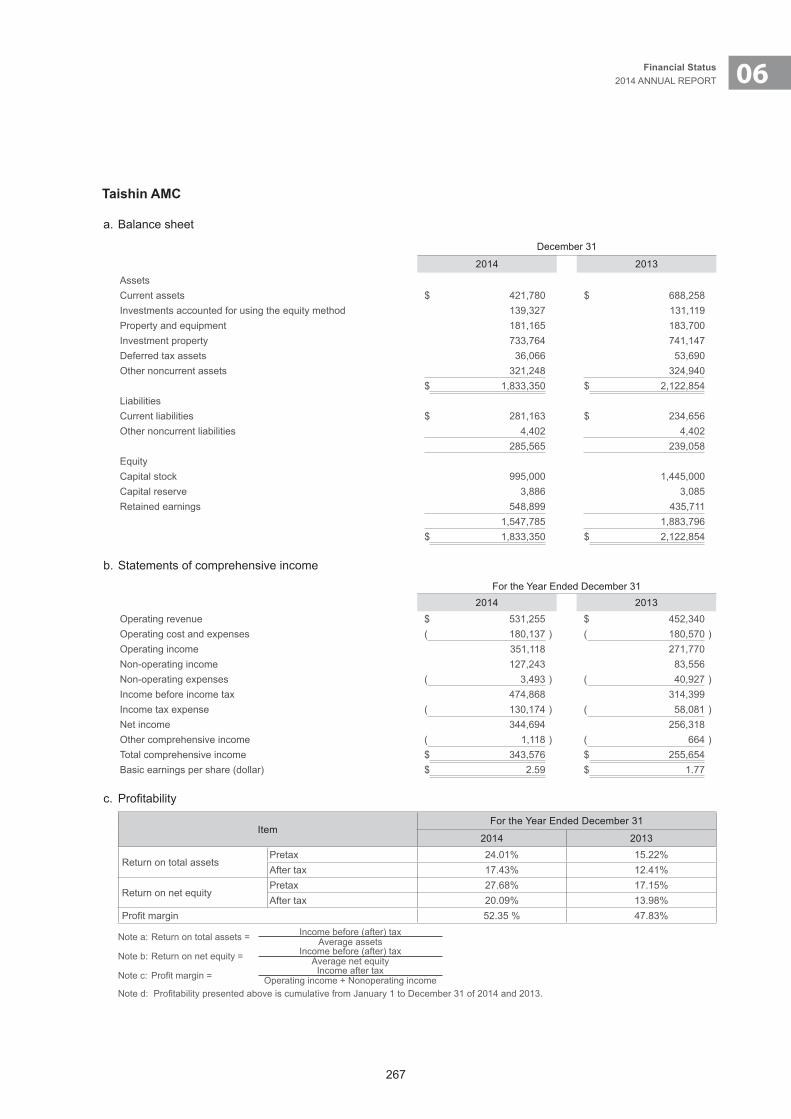
267
06Financial Status2014 ANNUAL REPORT
Taishin AMC
a. Balance sheet
December 31
2014 2013AssetsCurrent assets $ 421,780 $ 688,258Investments accounted for using the equity method 139,327 131,119Property and equipment 181,165 183,700Investment property 733,764 741,147Deferred tax assets 36,066 53,690Other noncurrent assets 321,248 324,940
$ 1,833,350 $ 2,122,854LiabilitiesCurrent liabilities $ 281,163 $ 234,656Other noncurrent liabilities 4,402 4,402
285,565 239,058EquityCapital stock 995,000 1,445,000Capital reserve 3,886 3,085Retained earnings 548,899 435,711
1,547,785 1,883,796 $ 1,833,350 $ 2,122,854
b. Statements of comprehensive income
For the Year Ended December 312014 2013
Operating revenue $ 531,255 $ 452,340Operating cost and expenses ( 180,137 ) ( 180,570 )Operating income 351,118 271,770Non-operating income 127,243 83,556Non-operating expenses ( 3,493 ) ( 40,927 )Income before income tax 474,868 314,399Income tax expense ( 130,174 ) ( 58,081 )Net income 344,694 256,318Other comprehensive income ( 1,118 ) ( 664 )Total comprehensive income $ 343,576 $ 255,654Basic earnings per share (dollar) $ 2.59 $ 1.77
c. Profitability
ItemFor the Year Ended December 31
2014 2013
Return on total assetsPretax 24.01% 15.22%After tax 17.43% 12.41%
Return on net equityPretax 27.68% 17.15%After tax 20.09% 13.98%
Profit margin 52.35 % 47.83%
Note a: Return on total assets = Income before (after) taxAverage assets
Note b: Return on net equity = Income before (after) taxAverage net equity
Note c: Profit margin = Income after taxOperating income + Nonoperating income
Note d: Profitability presented above is cumulative from January 1 to December 31 of 2014 and 2013.

268
Taishin Venture Capital
a. Balance sheet
December 31
2014 2013AssetsCurrent assets $ 465,001 $ 179,627Financial asset measured at cost 1,129,470 654,125Available-for-sale financial assets 11,152 6,269Investments accounted for using the equity method 1,496,696 1,146,807Property and equipment 66 92Other noncurrent assets 439 439
$ 3,102,824 $ 1,987,359LiabilitiesCurrent liabilities $ 2,956 $ 2,244Equity 2,956 2,244Capital stock 3,329,035 2,219,035Capital surplus 829 604Retained earnings ( 317,189 ) ( 269,548 )Other equity 87,193 35,024
3,099,868 1,985,115 $ 3,102,824 $ 1,987,359
b. Statements of comprehensive income
For the Year Ended December 31
2014 2013Revenue $ 30,743 $ 28,198Expense ( 75,602 ) ( 196,797 )Loss before income tax ( 44,859 ) ( 168,599 )Income tax expense - -Net loss ( 44,859 ) ( 168,599 )Other comprehensive income 49,167 68,353Total comprehensive income $ 4,308 ($ 100,246 )
Basic loss per share (dollar) ($ 0.19 ) ($ 0.76 )
c. Profitability
ItemFor the Year Ended December 31
2014 2013
Return on total assetsPretax ( 1.76% ) ( 8.28% )After tax ( 1.76% ) ( 8.28% )
Return on net equityPretax ( 1.76% ) ( 8.28% )After tax ( 1.76% ) ( 8.28% )
Profit margin ( 145.92% ) ( 597.91% )
Note a: Return on total assets = Income before (after) taxAverage assets
Note b: Return on net equity = Income before (after) taxAverage net equity
Note c: Profit margin = Income after taxOperating income + Nonoperating income
Note d: Profitability presented above is cumulative from January 1 to December 31 of 2014 and 2013.
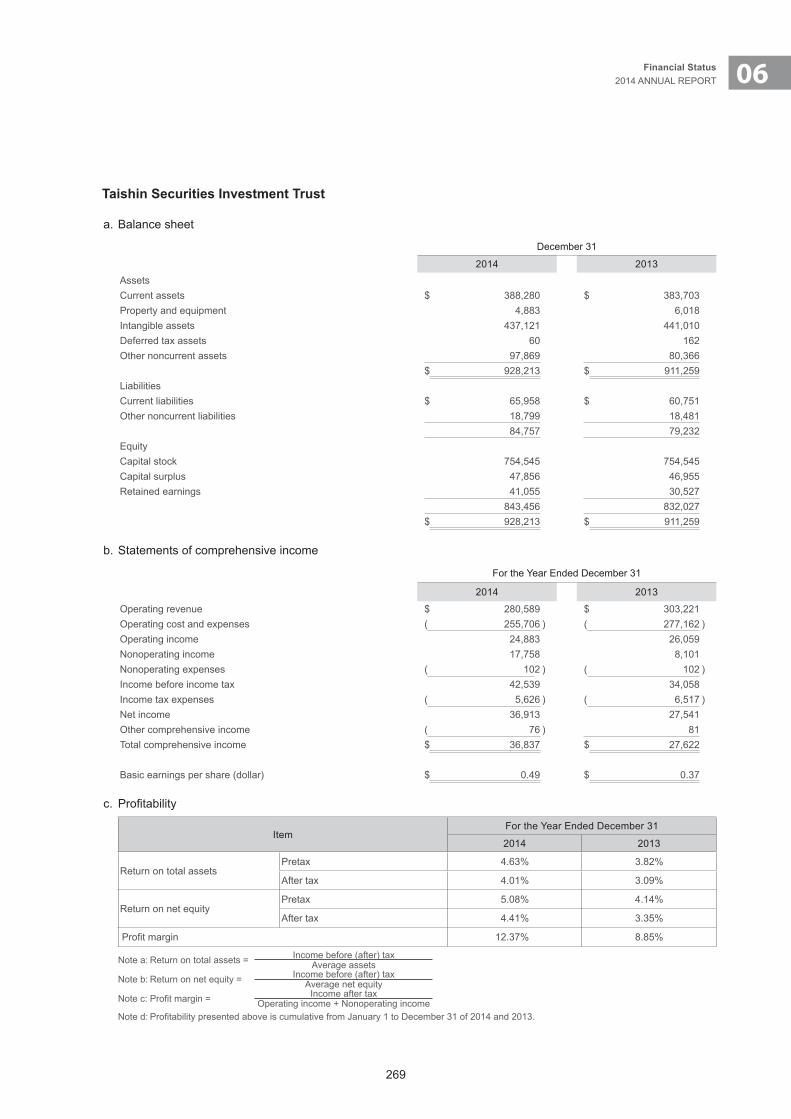
269
06Financial Status2014 ANNUAL REPORT
Taishin Securities Investment Trust
a. Balance sheet
December 31
2014 2013AssetsCurrent assets $ 388,280 $ 383,703Property and equipment 4,883 6,018Intangible assets 437,121 441,010Deferred tax assets 60 162Other noncurrent assets 97,869 80,366
$ 928,213 $ 911,259LiabilitiesCurrent liabilities $ 65,958 $ 60,751Other noncurrent liabilities 18,799 18,481
84,757 79,232EquityCapital stock 754,545 754,545Capital surplus 47,856 46,955Retained earnings 41,055 30,527
843,456 832,027 $ 928,213 $ 911,259
b. Statements of comprehensive income
For the Year Ended December 31
2014 2013
Operating revenue $ 280,589 $ 303,221Operating cost and expenses ( 255,706 ) ( 277,162 )Operating income 24,883 26,059Nonoperating income 17,758 8,101Nonoperating expenses ( 102 ) ( 102 )Income before income tax 42,539 34,058Income tax expenses ( 5,626 ) ( 6,517 )Net income 36,913 27,541Other comprehensive income ( 76 ) 81Total comprehensive income $ 36,837 $ 27,622
Basic earnings per share (dollar) $ 0.49 $ 0.37
c. Profitability
ItemFor the Year Ended December 31
2014 2013
Return on total assetsPretax 4.63% 3.82%
After tax 4.01% 3.09%
Return on net equityPretax 5.08% 4.14%
After tax 4.41% 3.35%
Profit margin 12.37% 8.85%
Note a: Return on total assets = Income before (after) taxAverage assets
Note b: Return on net equity = Income before (after) taxAverage net equity
Note c: Profit margin = Income after taxOperating income + Nonoperating income
Note d: Profitability presented above is cumulative from January 1 to December 31 of 2014 and 2013.
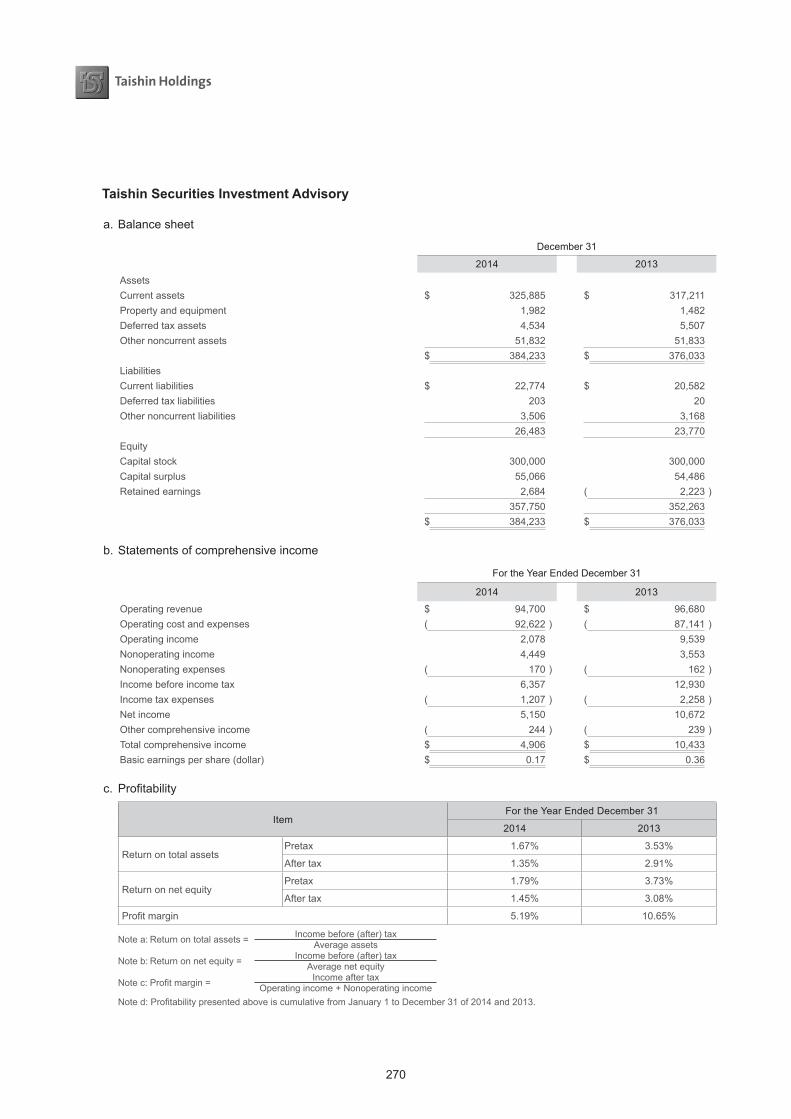
270
Taishin Securities Investment Advisory
a. Balance sheet
December 31
2014 2013AssetsCurrent assets $ 325,885 $ 317,211Property and equipment 1,982 1,482Deferred tax assets 4,534 5,507Other noncurrent assets 51,832 51,833
$ 384,233 $ 376,033LiabilitiesCurrent liabilities $ 22,774 $ 20,582Deferred tax liabilities 203 20Other noncurrent liabilities 3,506 3,168
26,483 23,770EquityCapital stock 300,000 300,000Capital surplus 55,066 54,486Retained earnings 2,684 ( 2,223 )
357,750 352,263 $ 384,233 $ 376,033
b. Statements of comprehensive income
For the Year Ended December 31
2014 2013
Operating revenue $ 94,700 $ 96,680Operating cost and expenses ( 92,622 ) ( 87,141 )Operating income 2,078 9,539Nonoperating income 4,449 3,553Nonoperating expenses ( 170 ) ( 162 )Income before income tax 6,357 12,930Income tax expenses ( 1,207 ) ( 2,258 )Net income 5,150 10,672Other comprehensive income ( 244 ) ( 239 )Total comprehensive income $ 4,906 $ 10,433Basic earnings per share (dollar) $ 0.17 $ 0.36
c. Profitability
ItemFor the Year Ended December 31
2014 2013
Return on total assetsPretax 1.67% 3.53%
After tax 1.35% 2.91%
Return on net equityPretax 1.79% 3.73%
After tax 1.45% 3.08%
Profit margin 5.19% 10.65%
Note a: Return on total assets = Income before (after) taxAverage assets
Note b: Return on net equity = Income before (after) taxAverage net equity
Note c: Profit margin = Income after taxOperating income + Nonoperating income
Note d: Profitability presented above is cumulative from January 1 to December 31 of 2014 and 2013.
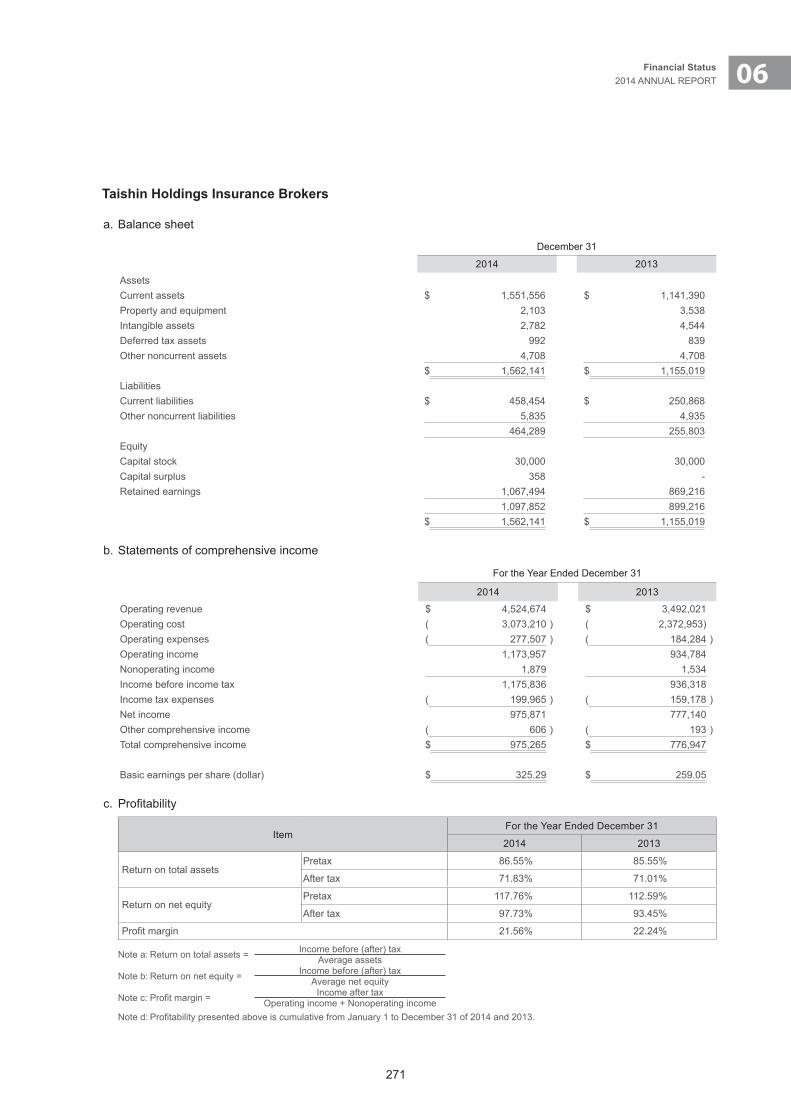
271
06Financial Status2014 ANNUAL REPORT
Taishin Holdings Insurance Brokers
a. Balance sheet
December 31
2014 2013AssetsCurrent assets $ 1,551,556 $ 1,141,390Property and equipment 2,103 3,538Intangible assets 2,782 4,544Deferred tax assets 992 839Other noncurrent assets 4,708 4,708
$ 1,562,141 $ 1,155,019LiabilitiesCurrent liabilities $ 458,454 $ 250,868Other noncurrent liabilities 5,835 4,935
464,289 255,803EquityCapital stock 30,000 30,000Capital surplus 358 -Retained earnings 1,067,494 869,216
1,097,852 899,216 $ 1,562,141 $ 1,155,019
b. Statements of comprehensive income
For the Year Ended December 31
2014 2013
Operating revenue $ 4,524,674 $ 3,492,021Operating cost ( 3,073,210 ) ( 2,372,953)Operating expenses ( 277,507 ) ( 184,284 )Operating income 1,173,957 934,784Nonoperating income 1,879 1,534Income before income tax 1,175,836 936,318Income tax expenses ( 199,965 ) ( 159,178 )Net income 975,871 777,140Other comprehensive income ( 606 ) ( 193 )Total comprehensive income $ 975,265 $ 776,947
Basic earnings per share (dollar) $ 325.29 $ 259.05
c. Profitability
ItemFor the Year Ended December 31
2014 2013
Return on total assetsPretax 86.55% 85.55%
After tax 71.83% 71.01%
Return on net equityPretax 117.76% 112.59%
After tax 97.73% 93.45%
Profit margin 21.56% 22.24%
Note a: Return on total assets = Income before (after) taxAverage assets
Note b: Return on net equity = Income before (after) taxAverage net equity
Note c: Profit margin = Income after taxOperating income + Nonoperating income
Note d: Profitability presented above is cumulative from January 1 to December 31 of 2014 and 2013.
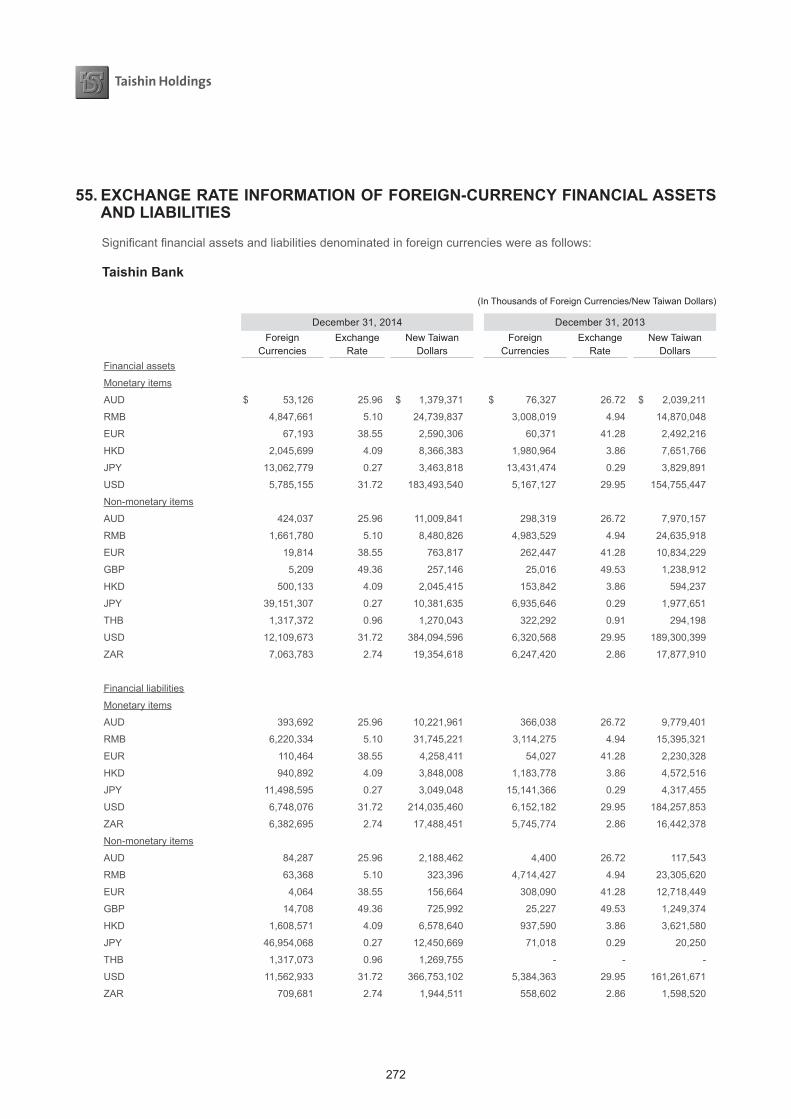
272
55. EXCHANGE RATE INFORMATION OF FOREIGN-CURRENCY FINANCIAL ASSETS AND LIABILITIES
Significant financial assets and liabilities denominated in foreign currencies were as follows:
Taishin Bank
(In Thousands of Foreign Currencies/New Taiwan Dollars)
December 31, 2014 December 31, 2013Foreign
CurrenciesExchange
RateNew Taiwan
DollarsForeign
CurrenciesExchange
RateNew Taiwan
DollarsFinancial assets
Monetary items
AUD $ 53,126 25.96 $ 1,379,371 $ 76,327 26.72 $ 2,039,211
RMB 4,847,661 5.10 24,739,837 3,008,019 4.94 14,870,048
EUR 67,193 38.55 2,590,306 60,371 41.28 2,492,216
HKD 2,045,699 4.09 8,366,383 1,980,964 3.86 7,651,766
JPY 13,062,779 0.27 3,463,818 13,431,474 0.29 3,829,891
USD 5,785,155 31.72 183,493,540 5,167,127 29.95 154,755,447
Non-monetary items
AUD 424,037 25.96 11,009,841 298,319 26.72 7,970,157
RMB 1,661,780 5.10 8,480,826 4,983,529 4.94 24,635,918
EUR 19,814 38.55 763,817 262,447 41.28 10,834,229
GBP 5,209 49.36 257,146 25,016 49.53 1,238,912
HKD 500,133 4.09 2,045,415 153,842 3.86 594,237
JPY 39,151,307 0.27 10,381,635 6,935,646 0.29 1,977,651
THB 1,317,372 0.96 1,270,043 322,292 0.91 294,198
USD 12,109,673 31.72 384,094,596 6,320,568 29.95 189,300,399
ZAR 7,063,783 2.74 19,354,618 6,247,420 2.86 17,877,910
Financial liabilities
Monetary items
AUD 393,692 25.96 10,221,961 366,038 26.72 9,779,401
RMB 6,220,334 5.10 31,745,221 3,114,275 4.94 15,395,321
EUR 110,464 38.55 4,258,411 54,027 41.28 2,230,328
HKD 940,892 4.09 3,848,008 1,183,778 3.86 4,572,516
JPY 11,498,595 0.27 3,049,048 15,141,366 0.29 4,317,455
USD 6,748,076 31.72 214,035,460 6,152,182 29.95 184,257,853
ZAR 6,382,695 2.74 17,488,451 5,745,774 2.86 16,442,378
Non-monetary items
AUD 84,287 25.96 2,188,462 4,400 26.72 117,543
RMB 63,368 5.10 323,396 4,714,427 4.94 23,305,620
EUR 4,064 38.55 156,664 308,090 41.28 12,718,449
GBP 14,708 49.36 725,992 25,227 49.53 1,249,374
HKD 1,608,571 4.09 6,578,640 937,590 3.86 3,621,580
JPY 46,954,068 0.27 12,450,669 71,018 0.29 20,250
THB 1,317,073 0.96 1,269,755 - - -
USD 11,562,933 31.72 366,753,102 5,384,363 29.95 161,261,671
ZAR 709,681 2.74 1,944,511 558,602 2.86 1,598,520

273
06Financial Status2014 ANNUAL REPORT
Chang Hwa Bank
(In Thousands of Foreign Currencies/New Taiwan Dollars)
December 31, 2013
Foreign Currencies Exchange Rate New Taiwan Dollars
Financial assets
Monetary items
USD $ 5,404,324 29.78 $ 160,940,769
GBP 81,587 49.14 4,009,185
AUD 695,630 26.59 18,493,324
HKD 1,858,439 3.84 7,136,406
CAD 51,687 27.98 1,446,202
ZAR 236,019 2.86 675,014
JPY 49,284,378 0.28 13,996,763
EUR 349,304 41.12 14,363,380
NZD 51,662 24.50 1,265,719
RMB 12,942,152 4.91 63,584,793
Financial liabilities
Monetary items
USD 6,217,419 29.78 185,154,738
GBP 127,283 49.14 6,254,687
AUD 832,273 26.59 22,125,978
HKD 1,394,370 3.84 5,354,381
CAD 66,764 27.98 1,868,057
ZAR 1,668,055 2.86 4,770,637
JPY 52,689,808 0.28 14,963,905
EUR 368,134 41.12 15,137,670
NZD 134,493 24.50 3,295,079
RMB 9,443,643 4.91 46,396,618
56. DISCLOSURES UNDER STATUTORY REQUIREMENTS
a. Material transactions are summarized as follows:
No. Item Explanation
1Marketable securities acquired or disposed of at costs or prices of at least NT$300 million or 10% of the paid-in capital
Table 1
2Acquisition or disposal of individual real estate at costs of at least NT$300 million or 10% of the paid-in capital
None
3 Discounts of service charges for related parties amounting to at least $5 million None
4 Receivables from related parties amounting to at least NT$300 million or 10% of the paid-in capital Table 7
5 Sales of NPL from subsidiaries None
6Authorities securitized instruments and related assets which are in accordance with the Statute for Financial Assets Securitization and the Statute for Real Estate Securitization
None
7 Other transactions that may have significant impact on the decision made by the financial statement users None
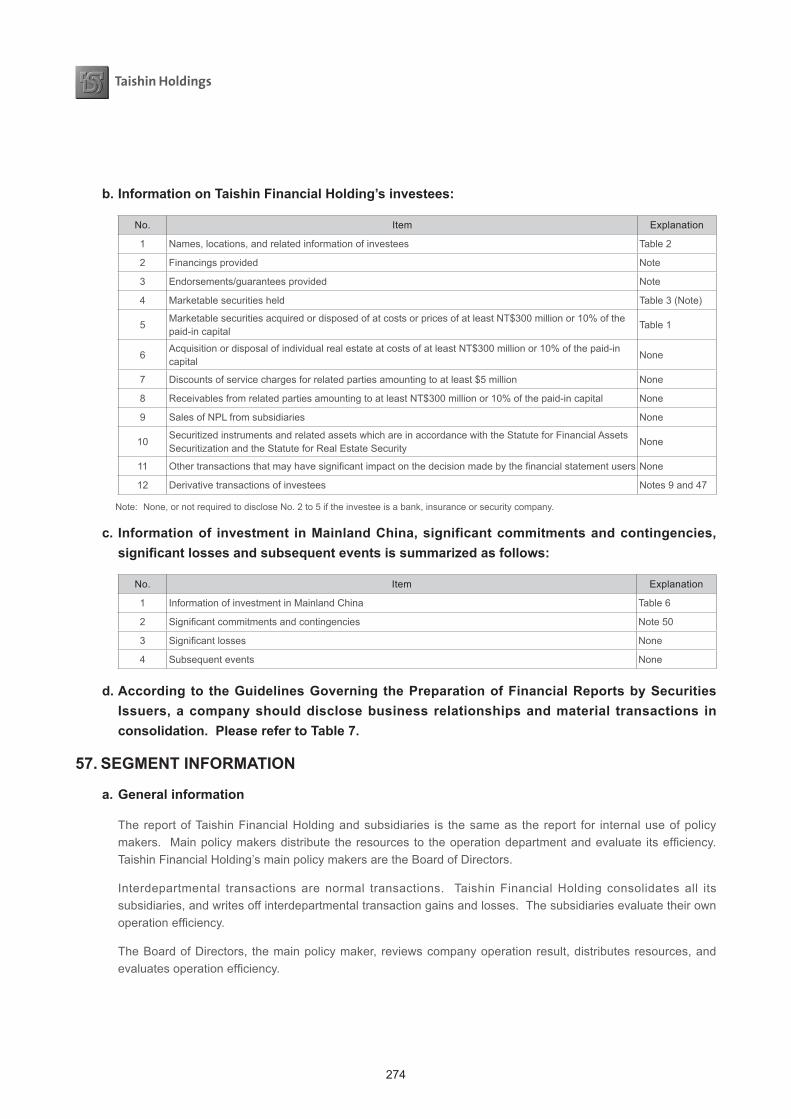
274
b. Information on Taishin Financial Holding’s investees:
No. Item Explanation
1 Names, locations, and related information of investees Table 2
2 Financings provided Note
3 Endorsements/guarantees provided Note
4 Marketable securities held Table 3 (Note)
5Marketable securities acquired or disposed of at costs or prices of at least NT$300 million or 10% of the paid-in capital
Table 1
6Acquisition or disposal of individual real estate at costs of at least NT$300 million or 10% of the paid-in capital
None
7 Discounts of service charges for related parties amounting to at least $5 million None
8 Receivables from related parties amounting to at least NT$300 million or 10% of the paid-in capital None
9 Sales of NPL from subsidiaries None
10Securitized instruments and related assets which are in accordance with the Statute for Financial Assets Securitization and the Statute for Real Estate Security
None
11 Other transactions that may have significant impact on the decision made by the financial statement users None
12 Derivative transactions of investees Notes 9 and 47
Note: None, or not required to disclose No. 2 to 5 if the investee is a bank, insurance or security company.
c. Information of investment in Mainland China, significant commitments and contingencies, significant losses and subsequent events is summarized as follows:
No. Item Explanation
1 Information of investment in Mainland China Table 6
2 Significant commitments and contingencies Note 50
3 Significant losses None
4 Subsequent events None
d. According to the Guidelines Governing the Preparation of Financial Reports by Securities Issuers, a company should disclose business relationships and material transactions in consolidation. Please refer to Table 7.
57. SEGMENT INFORMATION
a. General information
The report of Taishin Financial Holding and subsidiaries is the same as the report for internal use of policy makers. Main policy makers distribute the resources to the operation department and evaluate its efficiency. Taishin Financial Holding’s main policy makers are the Board of Directors.
Interdepartmental transactions are normal transactions. Taishin Financial Holding consolidates all its subsidiaries, and writes off interdepartmental transaction gains and losses. The subsidiaries evaluate their own operation efficiency.
The Board of Directors, the main policy maker, reviews company operation result, distributes resources, and evaluates operation efficiency.
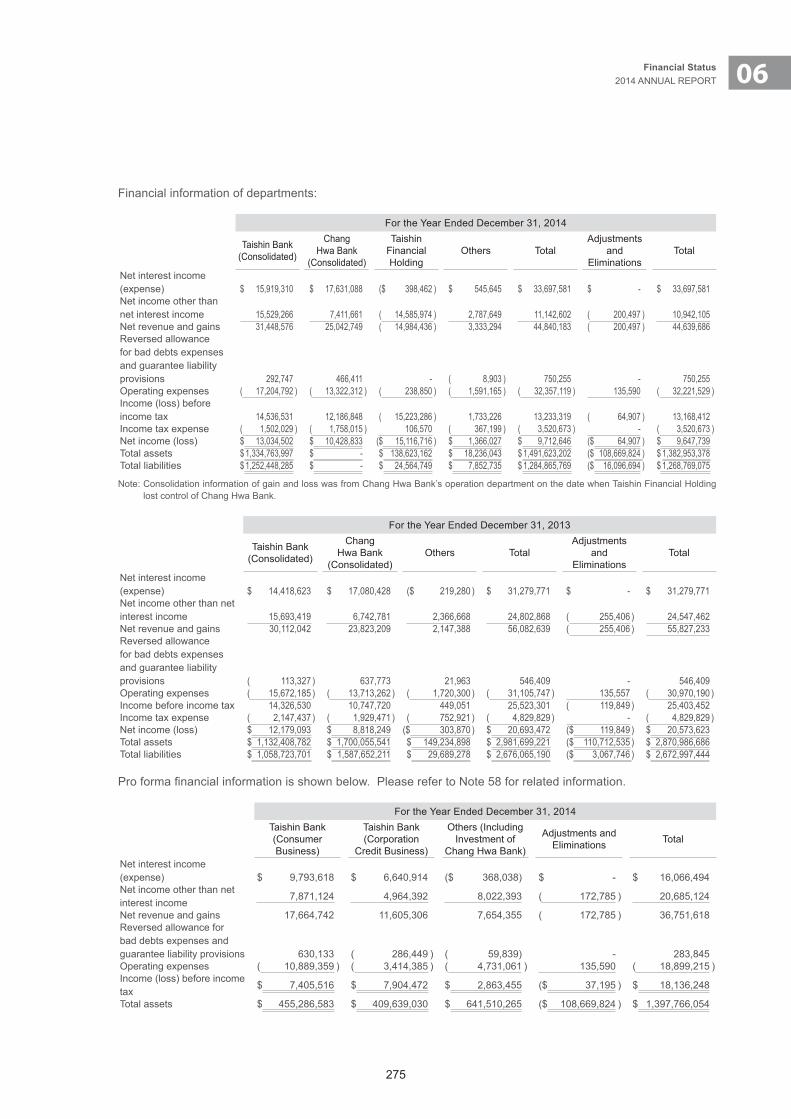
275
06Financial Status2014 ANNUAL REPORT
Financial information of departments:
For the Year Ended December 31, 2014
Taishin Bank (Consolidated)
Chang Hwa Bank
(Consolidated)
Taishin Financial Holding
Others TotalAdjustments
and Eliminations
Total
Net interest income (expense) $ 15,919,310 $ 17,631,088 ($ 398,462 ) $ 545,645 $ 33,697,581 $ - $ 33,697,581Net income other than net interest income 15,529,266 7,411,661 ( 14,585,974 ) 2,787,649 11,142,602 ( 200,497 ) 10,942,105Net revenue and gains 31,448,576 25,042,749 ( 14,984,436 ) 3,333,294 44,840,183 ( 200,497 ) 44,639,686Reversed allowance for bad debts expenses and guarantee liability provisions 292,747 466,411 - ( 8,903 ) 750,255 - 750,255Operating expenses ( 17,204,792 ) ( 13,322,312 ) ( 238,850 ) ( 1,591,165 ) ( 32,357,119 ) 135,590 ( 32,221,529 )Income (loss) before income tax 14,536,531 12,186,848 ( 15,223,286 ) 1,733,226 13,233,319 ( 64,907 ) 13,168,412Income tax expense ( 1,502,029 ) ( 1,758,015 ) 106,570 ( 367,199 ) ( 3,520,673 ) - ( 3,520,673 )Net income (loss) $ 13,034,502 $ 10,428,833 ($ 15,116,716 ) $ 1,366,027 $ 9,712,646 ($ 64,907 ) $ 9,647,739Total assets $ 1,334,763,997 $ - $ 138,623,162 $ 18,236,043 $ 1,491,623,202 ($ 108,669,824 ) $ 1,382,953,378Total liabilities $ 1,252,448,285 $ - $ 24,564,749 $ 7,852,735 $ 1,284,865,769 ($ 16,096,694 ) $ 1,268,769,075
Note: Consolidation information of gain and loss was from Chang Hwa Bank’s operation department on the date when Taishin Financial Holding lost control of Chang Hwa Bank.
For the Year Ended December 31, 2013
Taishin Bank (Consolidated)
Chang Hwa Bank
(Consolidated)Others Total
Adjustments and
EliminationsTotal
Net interest income (expense) $ 14,418,623 $ 17,080,428 ($ 219,280 ) $ 31,279,771 $ - $ 31,279,771Net income other than net interest income 15,693,419 6,742,781 2,366,668 24,802,868 ( 255,406 ) 24,547,462Net revenue and gains 30,112,042 23,823,209 2,147,388 56,082,639 ( 255,406 ) 55,827,233Reversed allowance for bad debts expenses and guarantee liability provisions ( 113,327 ) 637,773 21,963 546,409 - 546,409Operating expenses ( 15,672,185 ) ( 13,713,262 ) ( 1,720,300 ) ( 31,105,747 ) 135,557 ( 30,970,190 )Income before income tax 14,326,530 10,747,720 449,051 25,523,301 ( 119,849 ) 25,403,452Income tax expense ( 2,147,437 ) ( 1,929,471 ) ( 752,921 ) ( 4,829,829 ) - ( 4,829,829 )Net income (loss) $ 12,179,093 $ 8,818,249 ($ 303,870 ) $ 20,693,472 ($ 119,849 ) $ 20,573,623Total assets $ 1,132,408,782 $ 1,700,055,541 $ 149,234,898 $ 2,981,699,221 ($ 110,712,535 ) $ 2,870,986,686Total liabilities $ 1,058,723,701 $ 1,587,652,211 $ 29,689,278 $ 2,676,065,190 ($ 3,067,746 ) $ 2,672,997,444
Pro forma financial information is shown below. Please refer to Note 58 for related information.
For the Year Ended December 31, 2014Taishin Bank (Consumer Business)
Taishin Bank (Corporation
Credit Business)
Others (Including Investment of
Chang Hwa Bank)
Adjustments and Eliminations Total
Net interest income (expense) $ 9,793,618 $ 6,640,914 ($ 368,038) $ - $ 16,066,494Net income other than net interest income
7,871,124 4,964,392 8,022,393 ( 172,785 ) 20,685,124
Net revenue and gains 17,664,742 11,605,306 7,654,355 ( 172,785 ) 36,751,618Reversed allowance for bad debts expenses and guarantee liability provisions 630,133 ( 286,449 ) ( 59,839) - 283,845Operating expenses ( 10,889,359 ) ( 3,414,385 ) ( 4,731,061 ) 135,590 ( 18,899,215 )Income (loss) before income tax
$ 7,405,516 $ 7,904,472 $ 2,863,455 ($ 37,195 ) $ 18,136,248
Total assets $ 455,286,583 $ 409,639,030 $ 641,510,265 ($ 108,669,824 ) $ 1,397,766,054
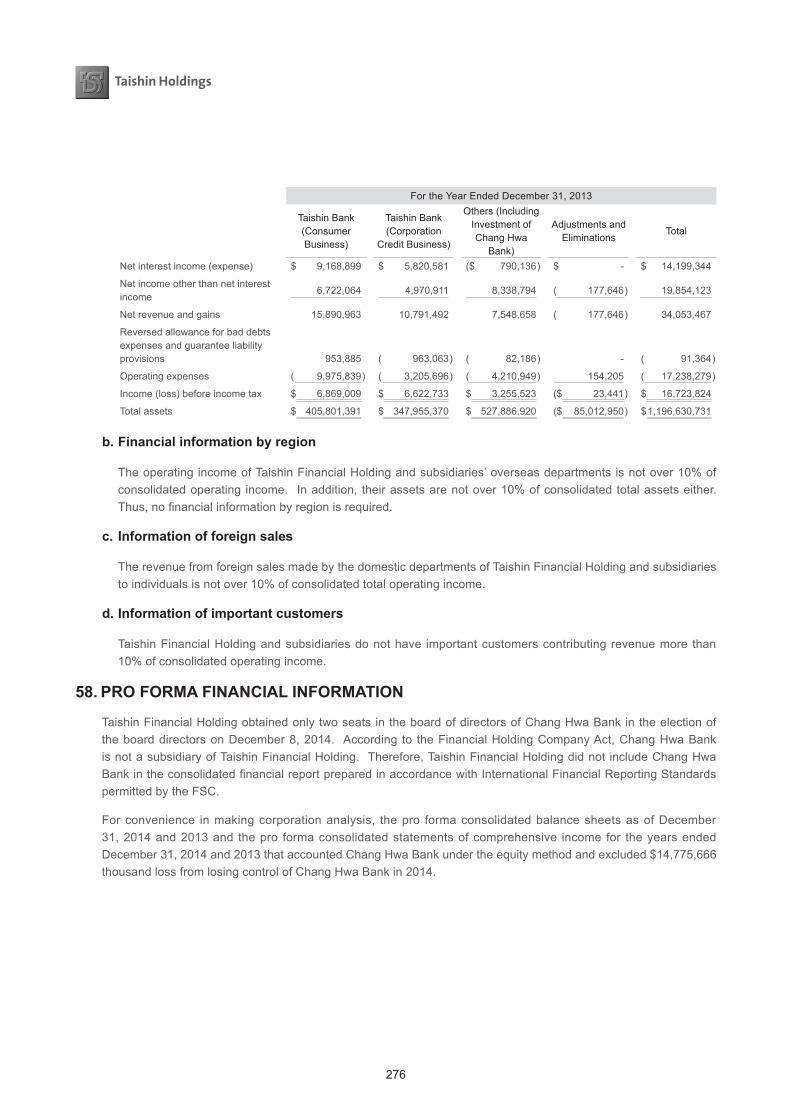
276
For the Year Ended December 31, 2013
Taishin Bank (Consumer Business)
Taishin Bank (Corporation
Credit Business)
Others (Including Investment of Chang Hwa
Bank)
Adjustments and Eliminations
Total
Net interest income (expense) $ 9,168,899 $ 5,820,581 ($ 790,136 ) $ - $ 14,199,344
Net income other than net interest income 6,722,064 4,970,911 8,338,794 ( 177,646 ) 19,854,123
Net revenue and gains 15,890,963 10,791,492 7,548,658 ( 177,646 ) 34,053,467
Reversed allowance for bad debts expenses and guarantee liability provisions 953,885 ( 963,063 ) ( 82,186 ) - ( 91,364 )
Operating expenses ( 9,975,839 ) ( 3,205,696 ) ( 4,210,949 ) 154,205 ( 17,238,279 )
Income (loss) before income tax $ 6,869,009 $ 6,622,733 $ 3,255,523 ($ 23,441 ) $ 16,723,824
Total assets $ 405,801,391 $ 347,955,370 $ 527,886,920 ($ 85,012,950 ) $ 1,196,630,731
b. Financial information by region
The operating income of Taishin Financial Holding and subsidiaries’ overseas departments is not over 10% of consolidated operating income. In addition, their assets are not over 10% of consolidated total assets either. Thus, no financial information by region is required.
c. Information of foreign sales
The revenue from foreign sales made by the domestic departments of Taishin Financial Holding and subsidiaries to individuals is not over 10% of consolidated total operating income.
d. Information of important customers
Taishin Financial Holding and subsidiaries do not have important customers contributing revenue more than 10% of consolidated operating income.
58. PRO FORMA FINANCIAL INFORMATION
Taishin Financial Holding obtained only two seats in the board of directors of Chang Hwa Bank in the election of the board directors on December 8, 2014. According to the Financial Holding Company Act, Chang Hwa Bank is not a subsidiary of Taishin Financial Holding. Therefore, Taishin Financial Holding did not include Chang Hwa Bank in the consolidated financial report prepared in accordance with International Financial Reporting Standards permitted by the FSC.
For convenience in making corporation analysis, the pro forma consolidated balance sheets as of December 31, 2014 and 2013 and the pro forma consolidated statements of comprehensive income for the years ended December 31, 2014 and 2013 that accounted Chang Hwa Bank under the equity method and excluded $14,775,666 thousand loss from losing control of Chang Hwa Bank in 2014.
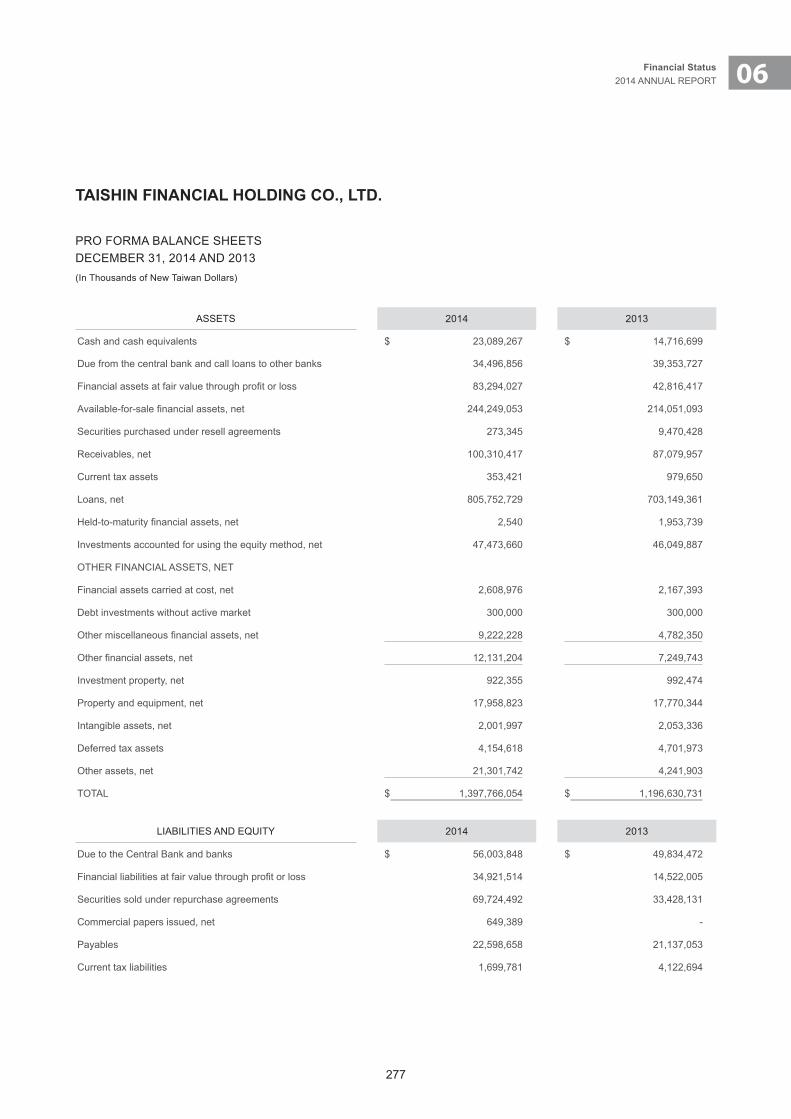
277
06Financial Status2014 ANNUAL REPORT
TAISHIN FINANCIAL HOLDING CO., LTD.
PRO FORMA BALANCE SHEETSDECEMBER 31, 2014 AND 2013(In Thousands of New Taiwan Dollars)
ASSETS 2014 2013
Cash and cash equivalents $ 23,089,267 $ 14,716,699
Due from the central bank and call loans to other banks 34,496,856 39,353,727
Financial assets at fair value through profit or loss 83,294,027 42,816,417
Available-for-sale financial assets, net 244,249,053 214,051,093
Securities purchased under resell agreements 273,345 9,470,428
Receivables, net 100,310,417 87,079,957
Current tax assets 353,421 979,650
Loans, net 805,752,729 703,149,361
Held-to-maturity financial assets, net 2,540 1,953,739
Investments accounted for using the equity method, net 47,473,660 46,049,887
OTHER FINANCIAL ASSETS, NET
Financial assets carried at cost, net 2,608,976 2,167,393
Debt investments without active market 300,000 300,000
Other miscellaneous financial assets, net 9,222,228 4,782,350
Other financial assets, net 12,131,204 7,249,743
Investment property, net 922,355 992,474
Property and equipment, net 17,958,823 17,770,344
Intangible assets, net 2,001,997 2,053,336
Deferred tax assets 4,154,618 4,701,973
Other assets, net 21,301,742 4,241,903
TOTAL $ 1,397,766,054 $ 1,196,630,731
LIABILITIES AND EQUITY 2014 2013
Due to the Central Bank and banks $ 56,003,848 $ 49,834,472
Financial liabilities at fair value through profit or loss 34,921,514 14,522,005
Securities sold under repurchase agreements 69,724,492 33,428,131
Commercial papers issued, net 649,389 -
Payables 22,598,658 21,137,053
Current tax liabilities 1,699,781 4,122,694
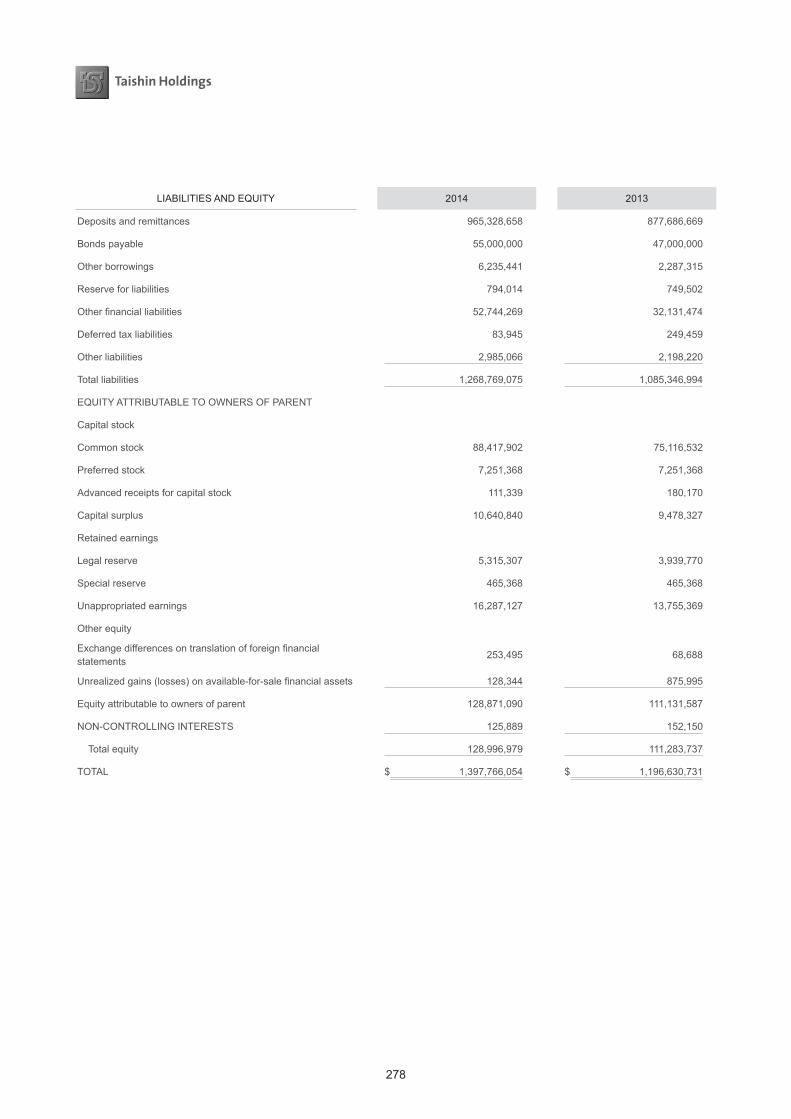
278
LIABILITIES AND EQUITY 2014 2013
Deposits and remittances 965,328,658 877,686,669
Bonds payable 55,000,000 47,000,000
Other borrowings 6,235,441 2,287,315
Reserve for liabilities 794,014 749,502
Other financial liabilities 52,744,269 32,131,474
Deferred tax liabilities 83,945 249,459
Other liabilities 2,985,066 2,198,220
Total liabilities 1,268,769,075 1,085,346,994
EQUITY ATTRIBUTABLE TO OWNERS OF PARENT
Capital stock
Common stock 88,417,902 75,116,532
Preferred stock 7,251,368 7,251,368
Advanced receipts for capital stock 111,339 180,170
Capital surplus 10,640,840 9,478,327
Retained earnings
Legal reserve 5,315,307 3,939,770
Special reserve 465,368 465,368
Unappropriated earnings 16,287,127 13,755,369
Other equity
Exchange differences on translation of foreign financial statements
253,495 68,688
Unrealized gains (losses) on available-for-sale financial assets 128,344 875,995
Equity attributable to owners of parent 128,871,090 111,131,587
NON-CONTROLLING INTERESTS 125,889 152,150
Total equity 128,996,979 111,283,737
TOTAL $ 1,397,766,054 $ 1,196,630,731
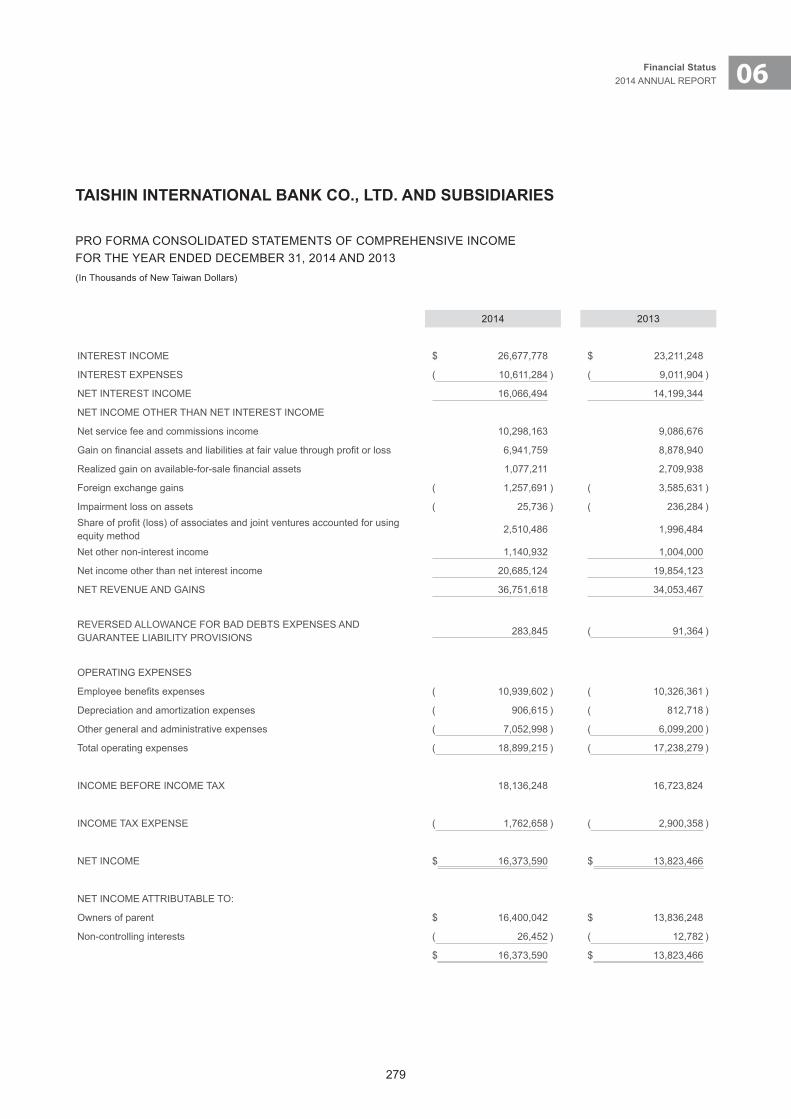
279
06Financial Status2014 ANNUAL REPORT
TAISHIN INTERNATIONAL BANK CO., LTD. AND SUBSIDIARIES
PRO FORMA CONSOLIDATED STATEMENTS OF COMPREHENSIVE INCOMEFOR THE YEAR ENDED DECEMBER 31, 2014 AND 2013(In Thousands of New Taiwan Dollars)
2014 2013
INTEREST INCOME $ 26,677,778 $ 23,211,248
INTEREST EXPENSES ( 10,611,284 ) ( 9,011,904 )
NET INTEREST INCOME 16,066,494 14,199,344
NET INCOME OTHER THAN NET INTEREST INCOME
Net service fee and commissions income 10,298,163 9,086,676
Gain on financial assets and liabilities at fair value through profit or loss 6,941,759 8,878,940
Realized gain on available-for-sale financial assets 1,077,211 2,709,938
Foreign exchange gains ( 1,257,691 ) ( 3,585,631 )
Impairment loss on assets ( 25,736 ) ( 236,284 )Share of profit (loss) of associates and joint ventures accounted for using equity method
2,510,486 1,996,484
Net other non-interest income 1,140,932 1,004,000
Net income other than net interest income 20,685,124 19,854,123
NET REVENUE AND GAINS 36,751,618 34,053,467
REVERSED ALLOWANCE FOR BAD DEBTS EXPENSES AND GUARANTEE LIABILITY PROVISIONS
283,845 ( 91,364 )
OPERATING EXPENSES
Employee benefits expenses ( 10,939,602 ) ( 10,326,361 )
Depreciation and amortization expenses ( 906,615 ) ( 812,718 )
Other general and administrative expenses ( 7,052,998 ) ( 6,099,200 )
Total operating expenses ( 18,899,215 ) ( 17,238,279 )
INCOME BEFORE INCOME TAX 18,136,248 16,723,824
INCOME TAX EXPENSE ( 1,762,658 ) ( 2,900,358 )
NET INCOME $ 16,373,590 $ 13,823,466
NET INCOME ATTRIBUTABLE TO:
Owners of parent $ 16,400,042 $ 13,836,248
Non-controlling interests ( 26,452 ) ( 12,782 )
$ 16,373,590 $ 13,823,466

280
TABLE 1
TAISHIN FINANCIAL HOLDING CO., LTD. AND SUBSIDIARIESACCUMULATED PURCHASES AND SALES OF SPECIFIC MARKETABLE SECURITIES OVER NT$300 MILLION OR 10% OF OUTSTANDING CAPITALFOR THE YEAR ENDED DECEMBER 31, 2014(In Thousands of New Taiwan Dollars, Unless Specified Otherwise)
Buyer or SellerType and Name of Marketable
Security
AccountRecorded
TransactionParty
Issuer’sRelationship
to the Buyer orSeller
Beginning of the Period Purchases Sales Others End of the Period
Shares(Units)
AmountShares(Units)
AmountShares(Units)
SellingPrice
CarryingValue
DisposalGain (Loss)
Shares(Units)
Amount (Note)
Shares(Units)
Amount
Taishin Financial Stock
Holding Taishin BankInvestments accounted for using the equity method
Taishin Bank Parent and subsidiary 4,915,752,571 $ 73,396,067 160,000,000 $ 3,520,000 - $ - $ - $ - - $ 5,129,123 5,075,752,571 $ 82,045,190
Taishin Venture Capital
Investments accounted for using the equity method
Taishin Venture Capital
Parent and subsidiary 221,903,495 1,985,115 111,000,000 1,110,000 - - - - - 4,753 332,903,495 3,099,868
Taishin Securities BInvestments accounted for using the equity method
Taishin Securities B Parent and subsidiary 228,000,000 2,511 ,434 78,125,000 1,000,000 - - - - - ( 38,796 ) 306,125,000 3,472,638
Taishin Venture Stock
CapitalDiamond Biotech Investment
Financial assets carried at cost
Diamond Biotech Investment
Its director is Taishin Venture Capital’s director
35,000,000 350,000 45,000,000 450,000 - - - - - - 80,000,000 800,000
Note: Others means investment income, cash dividends, recognition of employee stock options, others.
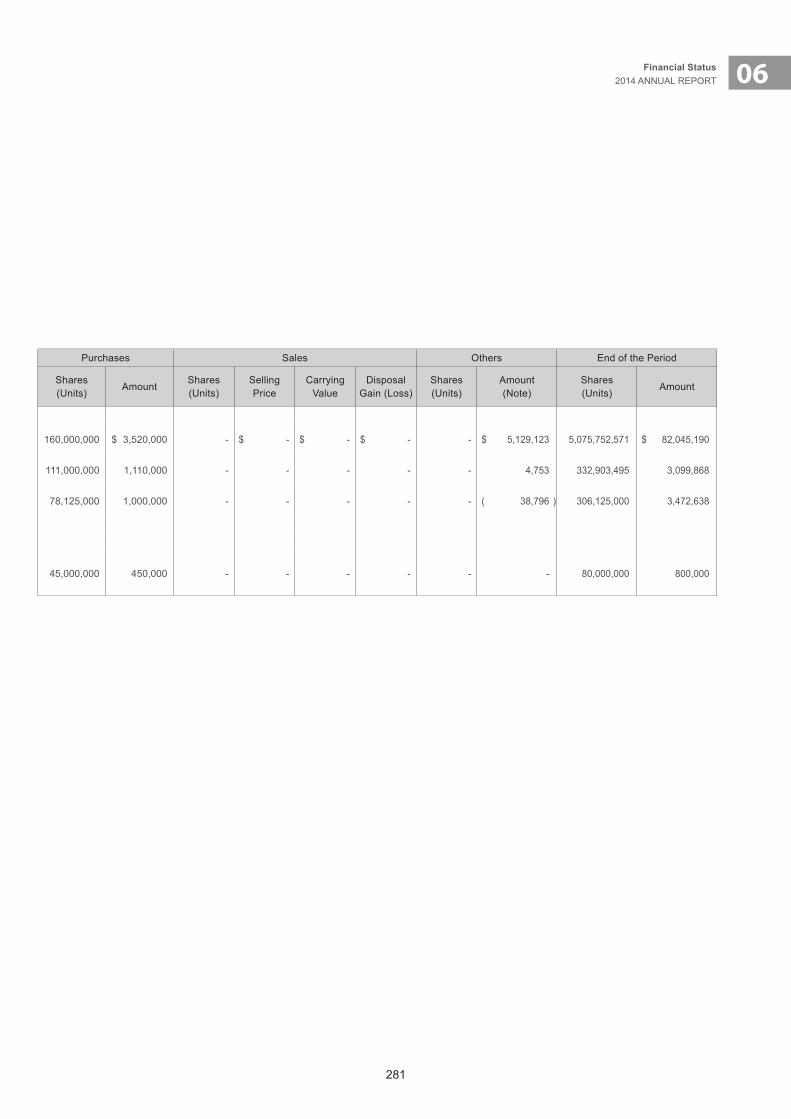
281
06Financial Status2014 ANNUAL REPORT
Buyer or SellerType and Name of Marketable
Security
AccountRecorded
TransactionParty
Issuer’sRelationship
to the Buyer orSeller
Beginning of the Period Purchases Sales Others End of the Period
Shares(Units)
AmountShares(Units)
AmountShares(Units)
SellingPrice
CarryingValue
DisposalGain (Loss)
Shares(Units)
Amount (Note)
Shares(Units)
Amount
Taishin Financial Stock
Holding Taishin BankInvestments accounted for using the equity method
Taishin Bank Parent and subsidiary 4,915,752,571 $ 73,396,067 160,000,000 $ 3,520,000 - $ - $ - $ - - $ 5,129,123 5,075,752,571 $ 82,045,190
Taishin Venture Capital
Investments accounted for using the equity method
Taishin Venture Capital
Parent and subsidiary 221,903,495 1,985,115 111,000,000 1,110,000 - - - - - 4,753 332,903,495 3,099,868
Taishin Securities BInvestments accounted for using the equity method
Taishin Securities B Parent and subsidiary 228,000,000 2,511 ,434 78,125,000 1,000,000 - - - - - ( 38,796 ) 306,125,000 3,472,638
Taishin Venture Stock
CapitalDiamond Biotech Investment
Financial assets carried at cost
Diamond Biotech Investment
Its director is Taishin Venture Capital’s director
35,000,000 350,000 45,000,000 450,000 - - - - - - 80,000,000 800,000
Note: Others means investment income, cash dividends, recognition of employee stock options, others.
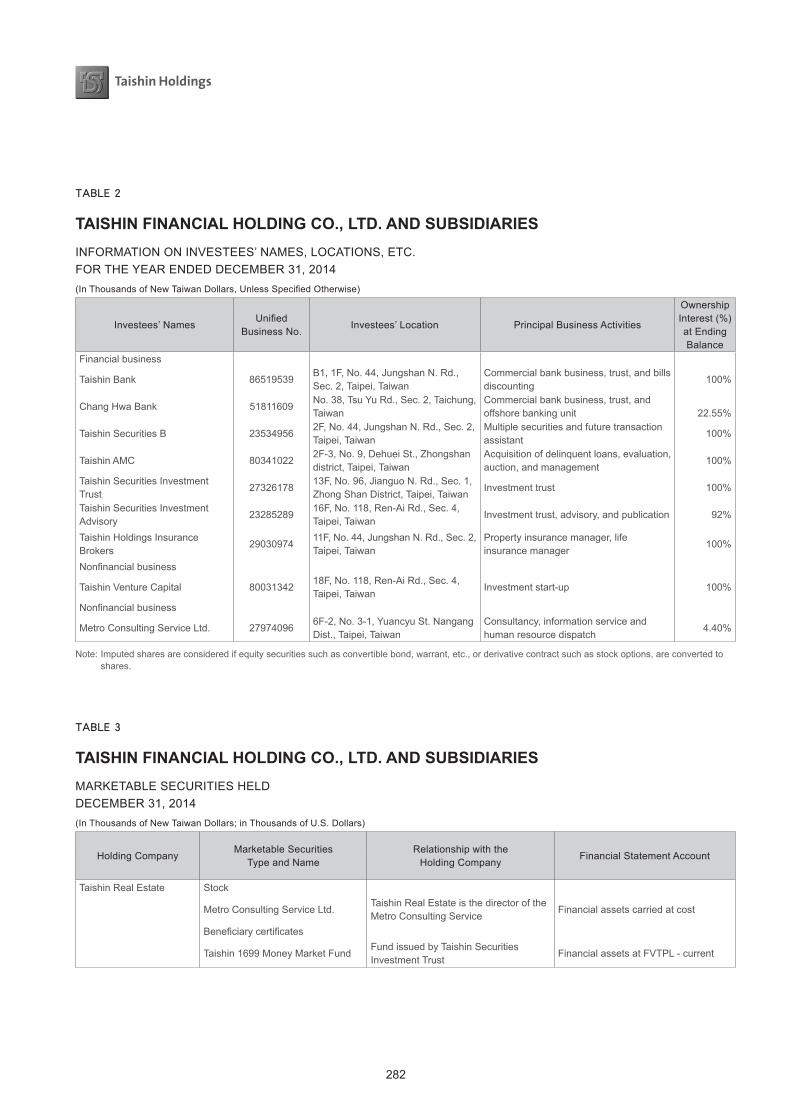
282
TABLE 2
TAISHIN FINANCIAL HOLDING CO., LTD. AND SUBSIDIARIESINFORMATION ON INVESTEES’ NAMES, LOCATIONS, ETC.FOR THE YEAR ENDED DECEMBER 31, 2014(In Thousands of New Taiwan Dollars, Unless Specified Otherwise)
Investees’ NamesUnified
Business No.Investees’ Location Principal Business Activities
Ownership Interest (%) at Ending Balance
InvestmentBook Value
Recognized Investment Income (Loss) of Current
Period
Sum of Ownership
NoteCurrent Shares
Imputed Shares(Note)
Total
Total SharesOwnership Interest (%)
Financial business
Taishin Bank 86519539B1, 1F, No. 44, Jungshan N. Rd., Sec. 2, Taipei, Taiwan
Commercial bank business, trust, and bills discounting
100% $ 82,045,190 $ 13,039,457 5,202,562,622 5,202,562,622 100.00%Investments accounted for using equity method
Chang Hwa Bank 51811609No. 38, Tsu Yu Rd., Sec. 2, Taichung, Taiwan
Commercial bank business, trust, and offshore banking unit
22.55%
32,196,350 2,456,898 1,782,059,748 1,811,426,419 22.92% 〃
Taishin Securities B 235349562F, No. 44, Jungshan N. Rd., Sec. 2, Taipei, Taiwan
Multiple securities and future transaction assistant
100% 3,472,638 32,974
306,125,000 306,125,000 100.00% 〃
Taishin AMC 803410222F-3, No. 9, Dehuei St., Zhongshan district, Taipei, Taiwan
Acquisition of delinquent loans, evaluation, auction, and management
100% 1,547,785 344,694 99,500,000 99,500,000 100.00% 〃
Taishin Securities Investment Trust
2732617813F, No. 96, Jianguo N. Rd., Sec. 1, Zhong Shan District, Taipei, Taiwan
Investment trust 100% 843,456 36,913 75,454,545 75,454,545 100.00% 〃
Taishin Securities Investment Advisory
2328528916F, No. 118, Ren-Ai Rd., Sec. 4, Taipei, Taiwan
Investment trust, advisory, and publication 92% 329,124 4,738 27,599,513 27,599,513 92.00% 〃
Taishin Holdings Insurance Brokers
2903097411F, No. 44, Jungshan N. Rd., Sec. 2, Taipei, Taiwan
Property insurance manager, life insurance manager
100% 1,097,852 975,871 3,000,000 3,000,000 100.00% 〃
Nonfinancial business
Taishin Venture Capital 8003134218F, No. 118, Ren-Ai Rd., Sec. 4, Taipei, Taiwan
Investment start-up 100% 3,099,868 ( 44,859 ) 332,903,495 332,903,495 100.00% 〃
Nonfinancial business
Metro Consulting Service Ltd. 279740966F-2, No. 3-1, Yuancyu St. Nangang Dist., Taipei, Taiwan
Consultancy, information service and human resource dispatch
4.40% 2,200 220,000 520,000 10.40%Financial assets carried at cost
Note: Imputed shares are considered if equity securities such as convertible bond, warrant, etc., or derivative contract such as stock options, are converted to shares.
TABLE 3
TAISHIN FINANCIAL HOLDING CO., LTD. AND SUBSIDIARIESMARKETABLE SECURITIES HELDDECEMBER 31, 2014(In Thousands of New Taiwan Dollars; in Thousands of U.S. Dollars)
Holding CompanyMarketable Securities
Type and NameRelationship with the
Holding CompanyFinancial Statement Account
December 31, 2014Note
Shares/Units/Nominal Carrying AmountPercentage of Ownership (%)
Market Value
Taishin Real Estate Stock
Metro Consulting Service Ltd.Taishin Real Estate is the director of the Metro Consulting Service
Financial assets carried at cost 300,000.00 $ 3,000 6.00 $ -
Beneficiary certificates
Taishin 1699 Money Market FundFund issued by Taishin Securities Investment Trust
Financial assets at FVTPL - current 870,448.00 11,564 - 11,564
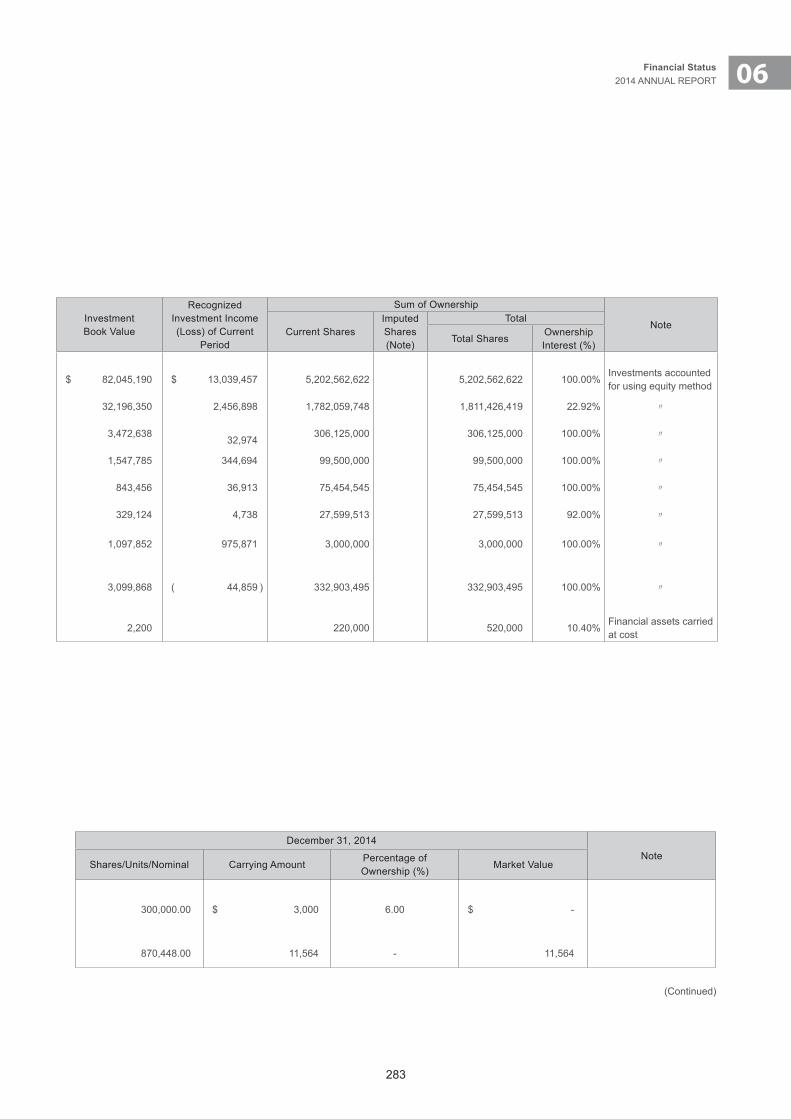
283
06Financial Status2014 ANNUAL REPORT
TABLE 2
TAISHIN FINANCIAL HOLDING CO., LTD. AND SUBSIDIARIESINFORMATION ON INVESTEES’ NAMES, LOCATIONS, ETC.FOR THE YEAR ENDED DECEMBER 31, 2014(In Thousands of New Taiwan Dollars, Unless Specified Otherwise)
Investees’ NamesUnified
Business No.Investees’ Location Principal Business Activities
Ownership Interest (%) at Ending Balance
InvestmentBook Value
Recognized Investment Income (Loss) of Current
Period
Sum of Ownership
NoteCurrent Shares
Imputed Shares(Note)
Total
Total SharesOwnership Interest (%)
Financial business
Taishin Bank 86519539B1, 1F, No. 44, Jungshan N. Rd., Sec. 2, Taipei, Taiwan
Commercial bank business, trust, and bills discounting
100% $ 82,045,190 $ 13,039,457 5,202,562,622 5,202,562,622 100.00%Investments accounted for using equity method
Chang Hwa Bank 51811609No. 38, Tsu Yu Rd., Sec. 2, Taichung, Taiwan
Commercial bank business, trust, and offshore banking unit
22.55%
32,196,350 2,456,898 1,782,059,748 1,811,426,419 22.92% 〃
Taishin Securities B 235349562F, No. 44, Jungshan N. Rd., Sec. 2, Taipei, Taiwan
Multiple securities and future transaction assistant
100% 3,472,638 32,974
306,125,000 306,125,000 100.00% 〃
Taishin AMC 803410222F-3, No. 9, Dehuei St., Zhongshan district, Taipei, Taiwan
Acquisition of delinquent loans, evaluation, auction, and management
100% 1,547,785 344,694 99,500,000 99,500,000 100.00% 〃
Taishin Securities Investment Trust
2732617813F, No. 96, Jianguo N. Rd., Sec. 1, Zhong Shan District, Taipei, Taiwan
Investment trust 100% 843,456 36,913 75,454,545 75,454,545 100.00% 〃
Taishin Securities Investment Advisory
2328528916F, No. 118, Ren-Ai Rd., Sec. 4, Taipei, Taiwan
Investment trust, advisory, and publication 92% 329,124 4,738 27,599,513 27,599,513 92.00% 〃
Taishin Holdings Insurance Brokers
2903097411F, No. 44, Jungshan N. Rd., Sec. 2, Taipei, Taiwan
Property insurance manager, life insurance manager
100% 1,097,852 975,871 3,000,000 3,000,000 100.00% 〃
Nonfinancial business
Taishin Venture Capital 8003134218F, No. 118, Ren-Ai Rd., Sec. 4, Taipei, Taiwan
Investment start-up 100% 3,099,868 ( 44,859 ) 332,903,495 332,903,495 100.00% 〃
Nonfinancial business
Metro Consulting Service Ltd. 279740966F-2, No. 3-1, Yuancyu St. Nangang Dist., Taipei, Taiwan
Consultancy, information service and human resource dispatch
4.40% 2,200 220,000 520,000 10.40%Financial assets carried at cost
Note: Imputed shares are considered if equity securities such as convertible bond, warrant, etc., or derivative contract such as stock options, are converted to shares.
TABLE 3
TAISHIN FINANCIAL HOLDING CO., LTD. AND SUBSIDIARIESMARKETABLE SECURITIES HELDDECEMBER 31, 2014(In Thousands of New Taiwan Dollars; in Thousands of U.S. Dollars)
Holding CompanyMarketable Securities
Type and NameRelationship with the
Holding CompanyFinancial Statement Account
December 31, 2014Note
Shares/Units/Nominal Carrying AmountPercentage of Ownership (%)
Market Value
Taishin Real Estate Stock
Metro Consulting Service Ltd.Taishin Real Estate is the director of the Metro Consulting Service
Financial assets carried at cost 300,000.00 $ 3,000 6.00 $ -
Beneficiary certificates
Taishin 1699 Money Market FundFund issued by Taishin Securities Investment Trust
Financial assets at FVTPL - current 870,448.00 11,564 - 11,564
(Continued)
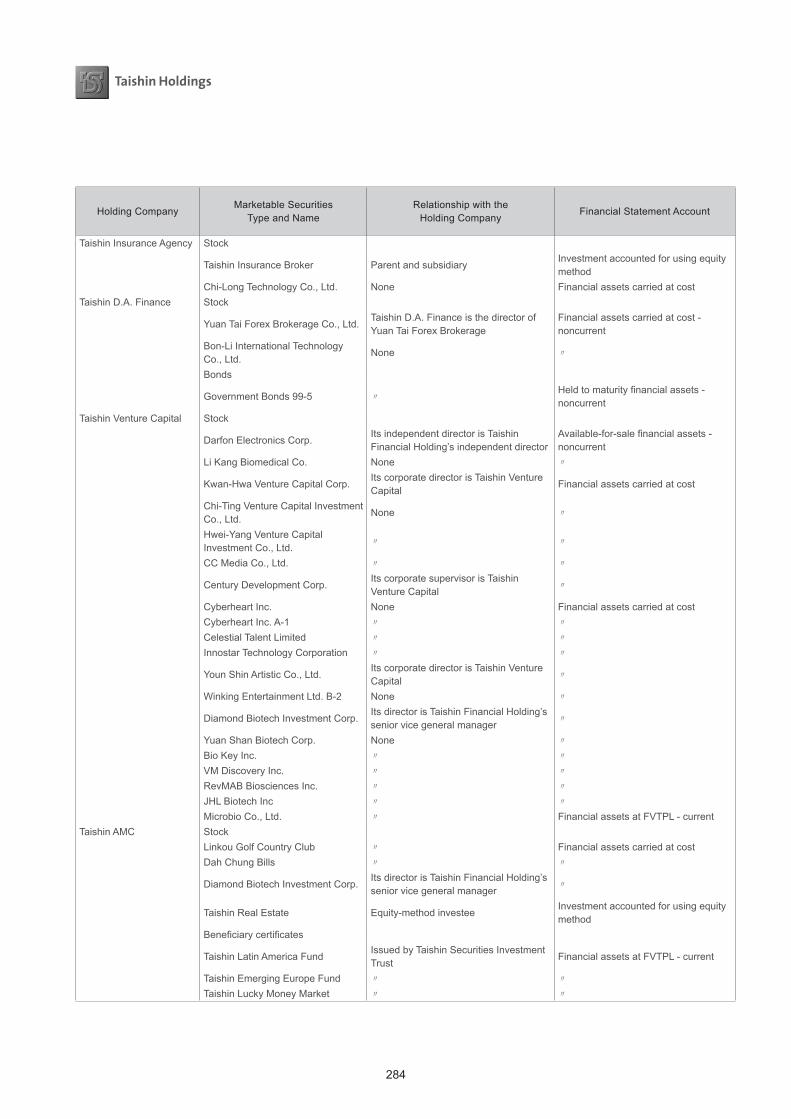
284
Holding CompanyMarketable Securities
Type and NameRelationship with the
Holding CompanyFinancial Statement Account
December 31, 2014Note
Shares/Units/Nominal Carrying AmountPercentage of Ownership (%)
Market Value
Taishin Insurance Agency Stock
Taishin Insurance Broker Parent and subsidiaryInvestment accounted for using equity method
6,000,000.00 74,958 100.00 -
Chi-Long Technology Co., Ltd. None Financial assets carried at cost 950,000.00 4,275 4.13 -Taishin D.A. Finance Stock
Yuan Tai Forex Brokerage Co., Ltd.Taishin D.A. Finance is the director of Yuan Tai Forex Brokerage
Financial assets carried at cost - noncurrent
600,000.00 6,000 5.00 -
Bon-Li International Technology Co., Ltd.
None 〃 125,000.00 - 1.50 - Go out of business
Bonds
Government Bonds 99-5 〃Held to maturity financial assets - noncurrent
2,500,000.00 2,540 - 2,540
Taishin Venture Capital Stock
Darfon Electronics Corp.Its independent director is Taishin Financial Holding’s independent director
Available-for-sale financial assets - noncurrent
242,550.00 4,330 0.08 4,330
Li Kang Biomedical Co. None 〃 174,044.00 6,823 0.87 6,823
Kwan-Hwa Venture Capital Corp.Its corporate director is Taishin Venture Capital
Financial assets carried at cost 2,720,000.00 23,040 5.56 -
Chi-Ting Venture Capital Investment Co., Ltd.
None 〃 3,000,000.00 30,000 1.30 -
Hwei-Yang Venture Capital Investment Co., Ltd. 〃 〃 420,000.00 4,200 1.54 -
CC Media Co., Ltd. 〃 〃 400,000.00 164 0.48 -
Century Development Corp.Its corporate supervisor is Taishin Venture Capital 〃 8,249,495 85,176 3.03 -
Cyberheart Inc. None Financial assets carried at cost 12,500.00 79 0.05 -Cyberheart Inc. A-1 〃 〃 285,958.00 1,659 - - Preferred stockCelestial Talent Limited 〃 〃 1,457,152.00 18,954 6.85 -Innostar Technology Corporation 〃 〃 756,408 19,411 2.71 -
Youn Shin Artistic Co., Ltd.Its corporate director is Taishin Venture Capital 〃 1,000,000.00 8,650 12.69 -
Winking Entertainment Ltd. B-2 None 〃 709,178.00 29,626 - - Preferred stock
Diamond Biotech Investment Corp.Its director is Taishin Financial Holding’s senior vice general manager 〃 80,000,000.00 800,000 10.00 -
Yuan Shan Biotech Corp. None 〃 500,000.00 30,328 0.56 -Bio Key Inc. 〃 〃 200,000.00 6,029 - - Preferred stockVM Discovery Inc. 〃 〃 95,238.00 6,029 - - Preferred stockRevMAB Biosciences Inc. 〃 〃 400,000.00 6,029 - - Preferred stockJHL Biotech Inc 〃 〃 1,052,632.00 60,097 - - Preferred stockMicrobio Co., Ltd. 〃 Financial assets at FVTPL - current 1,709,150.00 48,882 0.40 48,882
Taishin AMC StockLinkou Golf Country Club 〃 Financial assets carried at cost 3.00 1,800 0.30 -Dah Chung Bills 〃 〃 2,200,000.00 28,886 0.51 -
Diamond Biotech Investment Corp.Its director is Taishin Financial Holding’s senior vice general manager 〃 10,000,000.00 100,000 1.25 -
Taishin Real Estate Equity-method investeeInvestment accounted for using equity method
8,000,000.00 139,327 40.00 -
Beneficiary certificates
Taishin Latin America FundIssued by Taishin Securities Investment Trust
Financial assets at FVTPL - current 1,000,000.00 6,480 - 6,480
Taishin Emerging Europe Fund 〃 〃 1,000,000.00 5,660 - 5,660Taishin Lucky Money Market 〃 〃 4,587,745.20 50,176 - 50,176
(Concluded)

285
06Financial Status2014 ANNUAL REPORT
Holding CompanyMarketable Securities
Type and NameRelationship with the
Holding CompanyFinancial Statement Account
December 31, 2014Note
Shares/Units/Nominal Carrying AmountPercentage of Ownership (%)
Market Value
Taishin Insurance Agency Stock
Taishin Insurance Broker Parent and subsidiaryInvestment accounted for using equity method
6,000,000.00 74,958 100.00 -
Chi-Long Technology Co., Ltd. None Financial assets carried at cost 950,000.00 4,275 4.13 -Taishin D.A. Finance Stock
Yuan Tai Forex Brokerage Co., Ltd.Taishin D.A. Finance is the director of Yuan Tai Forex Brokerage
Financial assets carried at cost - noncurrent
600,000.00 6,000 5.00 -
Bon-Li International Technology Co., Ltd.
None 〃 125,000.00 - 1.50 - Go out of business
Bonds
Government Bonds 99-5 〃Held to maturity financial assets - noncurrent
2,500,000.00 2,540 - 2,540
Taishin Venture Capital Stock
Darfon Electronics Corp.Its independent director is Taishin Financial Holding’s independent director
Available-for-sale financial assets - noncurrent
242,550.00 4,330 0.08 4,330
Li Kang Biomedical Co. None 〃 174,044.00 6,823 0.87 6,823
Kwan-Hwa Venture Capital Corp.Its corporate director is Taishin Venture Capital
Financial assets carried at cost 2,720,000.00 23,040 5.56 -
Chi-Ting Venture Capital Investment Co., Ltd.
None 〃 3,000,000.00 30,000 1.30 -
Hwei-Yang Venture Capital Investment Co., Ltd. 〃 〃 420,000.00 4,200 1.54 -
CC Media Co., Ltd. 〃 〃 400,000.00 164 0.48 -
Century Development Corp.Its corporate supervisor is Taishin Venture Capital 〃 8,249,495 85,176 3.03 -
Cyberheart Inc. None Financial assets carried at cost 12,500.00 79 0.05 -Cyberheart Inc. A-1 〃 〃 285,958.00 1,659 - - Preferred stockCelestial Talent Limited 〃 〃 1,457,152.00 18,954 6.85 -Innostar Technology Corporation 〃 〃 756,408 19,411 2.71 -
Youn Shin Artistic Co., Ltd.Its corporate director is Taishin Venture Capital 〃 1,000,000.00 8,650 12.69 -
Winking Entertainment Ltd. B-2 None 〃 709,178.00 29,626 - - Preferred stock
Diamond Biotech Investment Corp.Its director is Taishin Financial Holding’s senior vice general manager 〃 80,000,000.00 800,000 10.00 -
Yuan Shan Biotech Corp. None 〃 500,000.00 30,328 0.56 -Bio Key Inc. 〃 〃 200,000.00 6,029 - - Preferred stockVM Discovery Inc. 〃 〃 95,238.00 6,029 - - Preferred stockRevMAB Biosciences Inc. 〃 〃 400,000.00 6,029 - - Preferred stockJHL Biotech Inc 〃 〃 1,052,632.00 60,097 - - Preferred stockMicrobio Co., Ltd. 〃 Financial assets at FVTPL - current 1,709,150.00 48,882 0.40 48,882
Taishin AMC StockLinkou Golf Country Club 〃 Financial assets carried at cost 3.00 1,800 0.30 -Dah Chung Bills 〃 〃 2,200,000.00 28,886 0.51 -
Diamond Biotech Investment Corp.Its director is Taishin Financial Holding’s senior vice general manager 〃 10,000,000.00 100,000 1.25 -
Taishin Real Estate Equity-method investeeInvestment accounted for using equity method
8,000,000.00 139,327 40.00 -
Beneficiary certificates
Taishin Latin America FundIssued by Taishin Securities Investment Trust
Financial assets at FVTPL - current 1,000,000.00 6,480 - 6,480
Taishin Emerging Europe Fund 〃 〃 1,000,000.00 5,660 - 5,660Taishin Lucky Money Market 〃 〃 4,587,745.20 50,176 - 50,176
(Concluded)
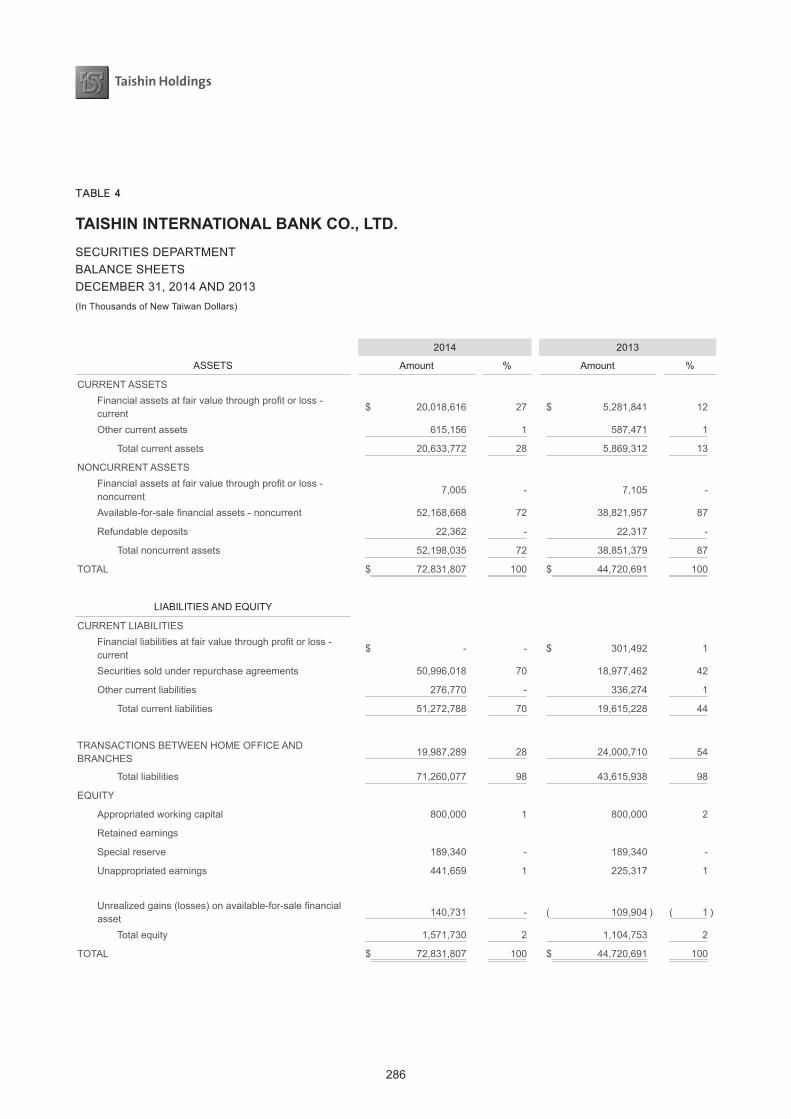
286
TABLE 4
TAISHIN INTERNATIONAL BANK CO., LTD.SECURITIES DEPARTMENTBALANCE SHEETSDECEMBER 31, 2014 AND 2013(In Thousands of New Taiwan Dollars)
2014 2013
ASSETS Amount % Amount %
CURRENT ASSETS Financial assets at fair value through profit or loss - current
$ 20,018,616 27 $ 5,281,841 12
Other current assets 615,156 1 587,471 1
Total current assets 20,633,772 28 5,869,312 13
NONCURRENT ASSETS Financial assets at fair value through profit or loss - noncurrent
7,005 - 7,105 -
Available-for-sale financial assets - noncurrent 52,168,668 72 38,821,957 87
Refundable deposits 22,362 - 22,317 -
Total noncurrent assets 52,198,035 72 38,851,379 87
TOTAL $ 72,831,807 100 $ 44,720,691 100
LIABILITIES AND EQUITY
CURRENT LIABILITIES Financial liabilities at fair value through profit or loss - current
$ - - $ 301,492 1
Securities sold under repurchase agreements 50,996,018 70 18,977,462 42
Other current liabilities 276,770 - 336,274 1
Total current liabilities 51,272,788 70 19,615,228 44
TRANSACTIONS BETWEEN HOME OFFICE AND BRANCHES
19,987,289 28 24,000,710 54
Total liabilities 71,260,077 98 43,615,938 98
EQUITY
Appropriated working capital 800,000 1 800,000 2
Retained earnings
Special reserve 189,340 - 189,340 -
Unappropriated earnings 441,659 1 225,317 1
Unrealized gains (losses) on available-for-sale financial asset
140,731 - ( 109,904 ) ( 1 )
Total equity 1,571,730 2 1,104,753 2
TOTAL $ 72,831,807 100 $ 44,720,691 100
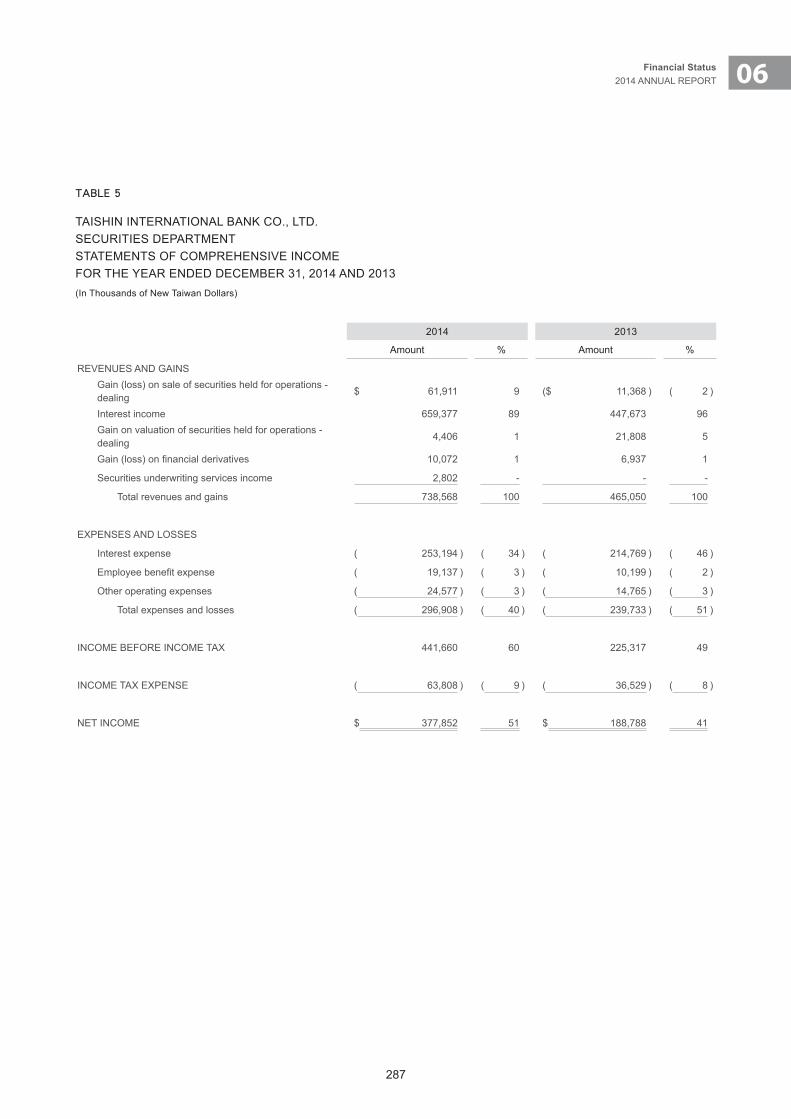
287
06Financial Status2014 ANNUAL REPORT
TABLE 5
TAISHIN INTERNATIONAL BANK CO., LTD.SECURITIES DEPARTMENTSTATEMENTS OF COMPREHENSIVE INCOMEFOR THE YEAR ENDED DECEMBER 31, 2014 AND 2013(In Thousands of New Taiwan Dollars)
2014 2013
Amount % Amount %
REVENUES AND GAINS Gain (loss) on sale of securities held for operations - dealing
$ 61,911 9 ($ 11,368 ) ( 2 )
Interest income 659,377 89 447,673 96 Gain on valuation of securities held for operations - dealing
4,406 1 21,808 5
Gain (loss) on financial derivatives 10,072 1 6,937 1
Securities underwriting services income 2,802 - - -
Total revenues and gains 738,568 100 465,050 100
EXPENSES AND LOSSES
Interest expense ( 253,194 ) ( 34 ) ( 214,769 ) ( 46 )
Employee benefit expense ( 19,137 ) ( 3 ) ( 10,199 ) ( 2 )
Other operating expenses ( 24,577 ) ( 3 ) ( 14,765 ) ( 3 )
Total expenses and losses ( 296,908 ) ( 40 ) ( 239,733 ) ( 51 )
INCOME BEFORE INCOME TAX 441,660 60 225,317 49
INCOME TAX EXPENSE ( 63,808 ) ( 9 ) ( 36,529 ) ( 8 )
NET INCOME $ 377,852 51 $ 188,788 41
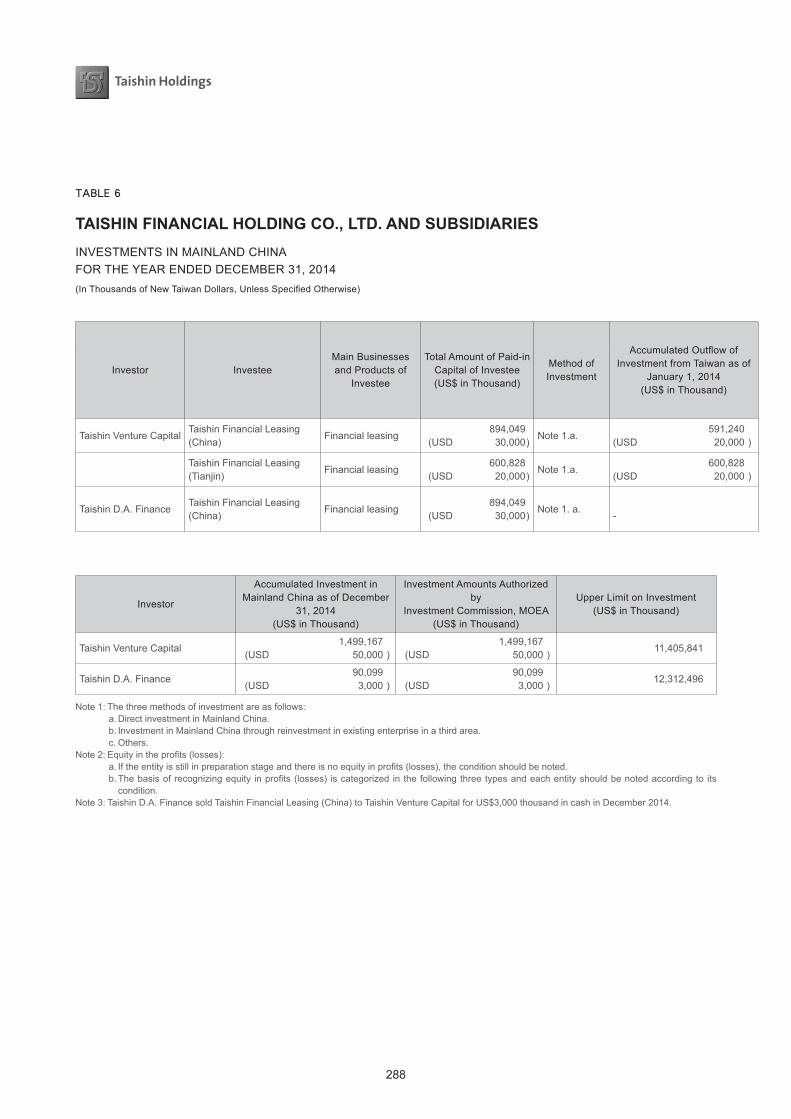
288
TABLE 6
TAISHIN FINANCIAL HOLDING CO., LTD. AND SUBSIDIARIESINVESTMENTS IN MAINLAND CHINAFOR THE YEAR ENDED DECEMBER 31, 2014(In Thousands of New Taiwan Dollars, Unless Specified Otherwise)
Investor InvesteeMain Businesses and Products of
Investee
Total Amount of Paid-in Capital of Investee(US$ in Thousand)
Method of Investment
Accumulated Outflow of Investment from Taiwan as of
January 1, 2014(US$ in Thousand)
Investment Flows(US$ in Thousand)
Accumulated Outflow of
Investment from Taiwan as of
December 31, 2014 (US$ in Thousand)
Investee’s Net Income
Percentage of Ownership
Equity in the Earnings (Losses) (Note 2)
Carrying Value as of
December 31, 2014
Accumulated Inward
Remittance of Earnings as of December 31,
2014
Outflow Inflow
Taishin Venture CapitalTaishin Financial Leasing (China)
Financial leasing 894,049 (USD 30,000 )
Note 1.a. 591,240(USD 20,000 )
307,099(USD 10,000 )
- 898,339(USD 30,000 )
20,360 100% 18,852 (Note 2.b.1)
907,953 -
Taishin Financial Leasing (Tianjin)
Financial leasing 600,828 (USD 20,000 )
Note 1.a. 600,828(USD 20,000 ) - -
600,828(USD 20,000 )
( 20,565 )
100%( 20,565 ) (Note 2.b.1)
588,742 -
Taishin D.A. FinanceTaishin Financial Leasing (China)
Financial leasing 894,049 (USD 30,000 )
Note 1. a. -
90,099(USD 3,000 )
94,389(USD 3,000 ) (Note 3)
- 18,838 - 1,509 (Note 2.b.1)
- -
Investor
Accumulated Investment in Mainland China as of December
31, 2014(US$ in Thousand)
Investment Amounts Authorized by
Investment Commission, MOEA(US$ in Thousand)
Upper Limit on Investment(US$ in Thousand)
Taishin Venture Capital 1,499,167 (USD 50,000 )
1,499,167 (USD 50,000 )
11,405,841
Taishin D.A. Finance 90,099 (USD 3,000 )
90,099 (USD 3,000 )
12,312,496
Note 1: The three methods of investment are as follows:a. Direct investment in Mainland China.b. Investment in Mainland China through reinvestment in existing enterprise in a third area.c. Others.
Note 2: Equity in the profits (losses):a. If the entity is still in preparation stage and there is no equity in profits (losses), the condition should be noted.b. The basis of recognizing equity in profits (losses) is categorized in the following three types and each entity should be noted according to its
condition. Note 3: Taishin D.A. Finance sold Taishin Financial Leasing (China) to Taishin Venture Capital for US$3,000 thousand in cash in December 2014.
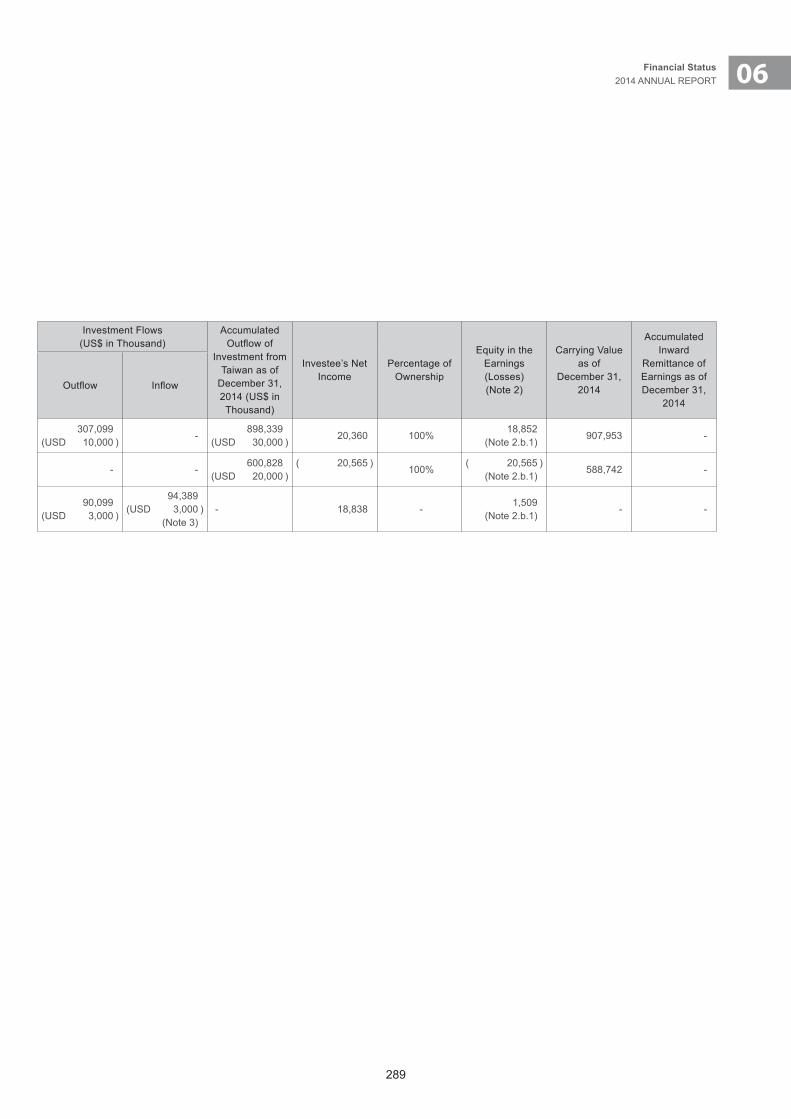
289
06Financial Status2014 ANNUAL REPORT
TABLE 6
TAISHIN FINANCIAL HOLDING CO., LTD. AND SUBSIDIARIESINVESTMENTS IN MAINLAND CHINAFOR THE YEAR ENDED DECEMBER 31, 2014(In Thousands of New Taiwan Dollars, Unless Specified Otherwise)
Investor InvesteeMain Businesses and Products of
Investee
Total Amount of Paid-in Capital of Investee(US$ in Thousand)
Method of Investment
Accumulated Outflow of Investment from Taiwan as of
January 1, 2014(US$ in Thousand)
Investment Flows(US$ in Thousand)
Accumulated Outflow of
Investment from Taiwan as of
December 31, 2014 (US$ in Thousand)
Investee’s Net Income
Percentage of Ownership
Equity in the Earnings (Losses) (Note 2)
Carrying Value as of
December 31, 2014
Accumulated Inward
Remittance of Earnings as of December 31,
2014
Outflow Inflow
Taishin Venture CapitalTaishin Financial Leasing (China)
Financial leasing 894,049 (USD 30,000 )
Note 1.a. 591,240(USD 20,000 )
307,099(USD 10,000 )
- 898,339(USD 30,000 )
20,360 100% 18,852 (Note 2.b.1)
907,953 -
Taishin Financial Leasing (Tianjin)
Financial leasing 600,828 (USD 20,000 )
Note 1.a. 600,828(USD 20,000 ) - -
600,828(USD 20,000 )
( 20,565 )
100%( 20,565 ) (Note 2.b.1)
588,742 -
Taishin D.A. FinanceTaishin Financial Leasing (China)
Financial leasing 894,049 (USD 30,000 )
Note 1. a. -
90,099(USD 3,000 )
94,389(USD 3,000 ) (Note 3)
- 18,838 - 1,509 (Note 2.b.1)
- -

290
TABLE 7
TAISHIN FINANCIAL HOLDING CO., LTD. AND SUBSIDIARIESBUSINESS RELATIONSHIPS AND MATERIAL TRANSACTIONS IN CONSOLIDATION FOR THE YEAR ENDED DECEMBER 31, 2014(In Thousands of New Taiwan Dollars, Unless Specified Otherwise)
Number (Note a)
Main Party CounterpartyRelationship
(Note b)
Transactions
Account Amount Terms
% of Consolidated Operating
Revenues or Consolidated Total
Assets (Note c)
1 Taishin Bank Taishin Securities B 3 Deposits and remittances $ 185,651Under arm’s length terms
0.01%
1 Taishin BankTaishin Securities Investment Advisory
3 Deposits and remittances 318,730Under arm’s length terms
0.02%
0Taishin Financial Holding
Taishin Bank 1Securities purchased under resell agreements
5,316,390Under arm’s length terms
0.38%
0Taishin Financial Holding
Taishin Bank 1 Accounts receivable, net 851,436Under arm’s length terms
0.06%
0Taishin Financial Holding
Taishin Holding Insurance Brokers
1 Accounts receivable, net 149,733Under arm’s length terms
0.01%
0Taishin Financial Holding
Taishin Bank 1 Accounts payable, net 560,872Under arm’s length terms
0.04%
1 Taishin BankTaishin Holding Insurance Brokers
3 Accounts receivable, net 251,014Under arm’s length terms
0.02%
1 Taishin BankTaishin Holding Insurance Brokers
3 Deposits and remittances 1,085,159Under arm’s length terms
0.08%
1 Taishin BankTaishin Holding Insurance Brokers
3 Fee income 3,001,813Under arm’s length terms
0.22%
0Taishin Financial Holding
Taishin Bank 1Cash and cash equivalents
6,854,458Under arm’s length terms
0.50%
1 Taishin BankTaishin Venture Capital
3 Deposits and remittances 390,082Under arm’s length terms
0.03%
Note a: Business between the parent and subsidiaries is numbered as follows:1. Parent: 02. Subsidiaries are numbered from 1 in order
Note b: Relationship between the main party and the counterparty is numbered as follows:1. Parent to subsidiary2. Subsidiary to parent3. One subsidiary to another subsidiary
Note c: Percentage of consolidated operating revenues or consolidated total assets: If the account is a balance sheet account, it was calculated by dividing the ending balance into consolidated total assets; if the account is an income statement account, it was calculated by dividing the interim cumulative balance into consolidated operating revenues.
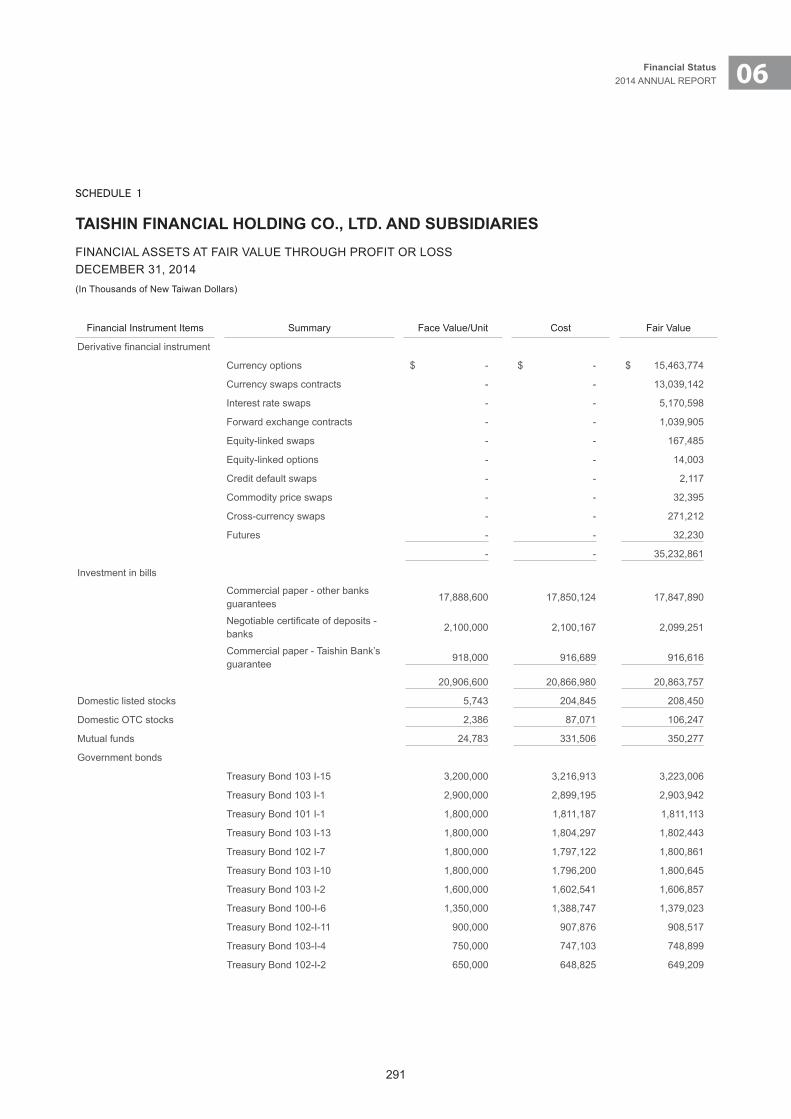
291
06Financial Status2014 ANNUAL REPORT
SCHEDULE 1
TAISHIN FINANCIAL HOLDING CO., LTD. AND SUBSIDIARIESFINANCIAL ASSETS AT FAIR VALUE THROUGH PROFIT OR LOSSDECEMBER 31, 2014(In Thousands of New Taiwan Dollars)
Financial Instrument Items Summary Face Value/Unit Cost Fair Value
Derivative financial instrument
Currency options $ - $ - $ 15,463,774
Currency swaps contracts - - 13,039,142
Interest rate swaps - - 5,170,598
Forward exchange contracts - - 1,039,905
Equity-linked swaps - - 167,485
Equity-linked options - - 14,003
Credit default swaps - - 2,117
Commodity price swaps - - 32,395
Cross-currency swaps - - 271,212
Futures - - 32,230
- - 35,232,861
Investment in bills
Commercial paper - other banks guarantees
17,888,600 17,850,124 17,847,890
Negotiable certificate of deposits - banks
2,100,000 2,100,167 2,099,251
Commercial paper - Taishin Bank’s guarantee 918,000 916,689 916,616
20,906,600 20,866,980 20,863,757
Domestic listed stocks 5,743 204,845 208,450
Domestic OTC stocks 2,386 87,071 106,247
Mutual funds 24,783 331,506 350,277
Government bonds
Treasury Bond 103 I-15 3,200,000 3,216,913 3,223,006
Treasury Bond 103 I-1 2,900,000 2,899,195 2,903,942
Treasury Bond 101 I-1 1,800,000 1,811,187 1,811,113
Treasury Bond 103 I-13 1,800,000 1,804,297 1,802,443
Treasury Bond 102 I-7 1,800,000 1,797,122 1,800,861
Treasury Bond 103 I-10 1,800,000 1,796,200 1,800,645
Treasury Bond 103 I-2 1,600,000 1,602,541 1,606,857
Treasury Bond 100-I-6 1,350,000 1,388,747 1,379,023
Treasury Bond 102-I-11 900,000 907,876 908,517
Treasury Bond 103-I-4 750,000 747,103 748,899
Treasury Bond 102-I-2 650,000 648,825 649,209
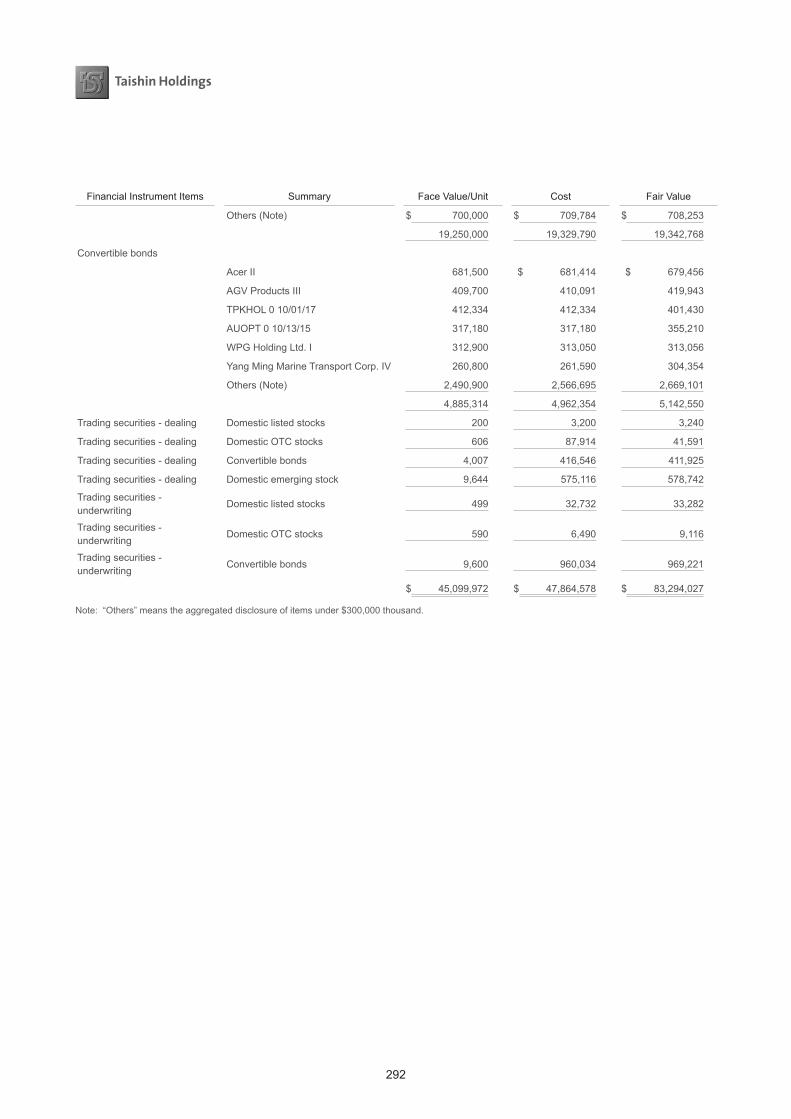
292
Financial Instrument Items Summary Face Value/Unit Cost Fair Value
Others (Note) $ 700,000 $ 709,784 $ 708,253
19,250,000 19,329,790 19,342,768
Convertible bonds
Acer II 681,500 $ 681,414 $ 679,456
AGV Products III 409,700 410,091 419,943
TPKHOL 0 10/01/17 412,334 412,334 401,430
AUOPT 0 10/13/15 317,180 317,180 355,210
WPG Holding Ltd. I 312,900 313,050 313,056
Yang Ming Marine Transport Corp. IV 260,800 261,590 304,354
Others (Note) 2,490,900 2,566,695 2,669,101
4,885,314 4,962,354 5,142,550
Trading securities - dealing Domestic listed stocks 200 3,200 3,240
Trading securities - dealing Domestic OTC stocks 606 87,914 41,591
Trading securities - dealing Convertible bonds 4,007 416,546 411,925
Trading securities - dealing Domestic emerging stock 9,644 575,116 578,742
Trading securities - underwriting
Domestic listed stocks 499 32,732 33,282
Trading securities - underwriting
Domestic OTC stocks 590 6,490 9,116
Trading securities - underwriting
Convertible bonds 9,600 960,034 969,221
$ 45,099,972 $ 47,864,578 $ 83,294,027
Note: “Others” means the aggregated disclosure of items under $300,000 thousand.
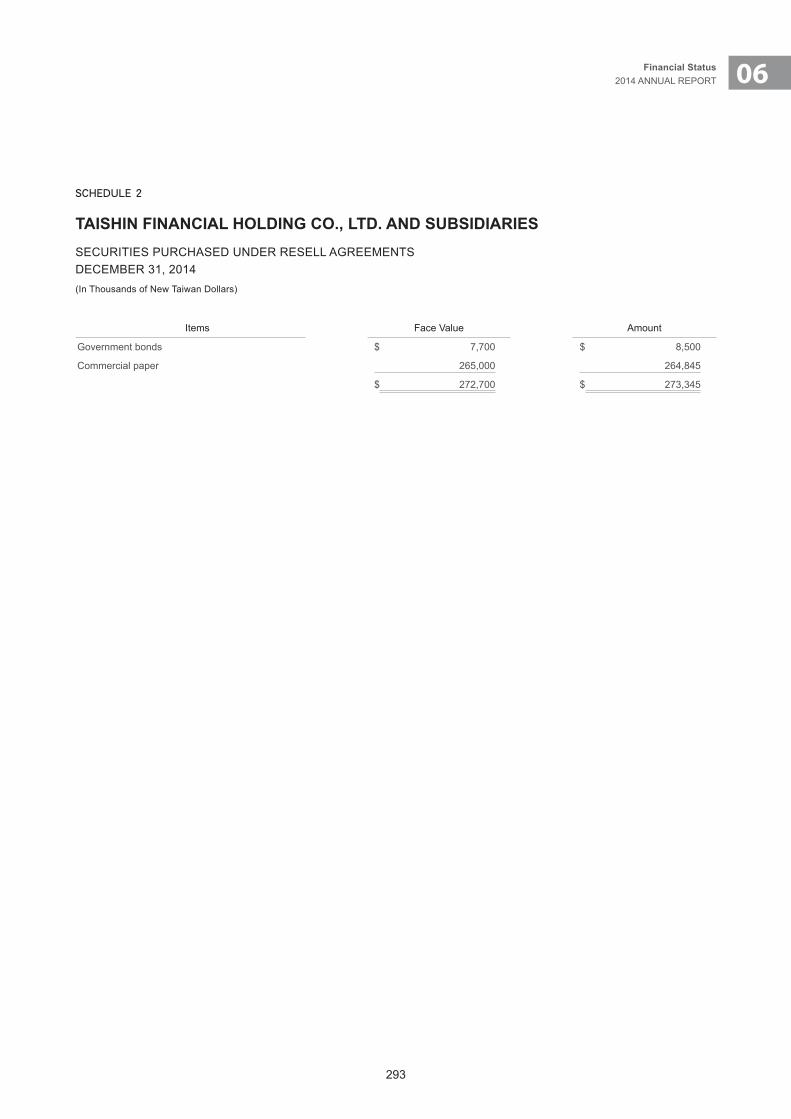
293
06Financial Status2014 ANNUAL REPORT
SCHEDULE 2
TAISHIN FINANCIAL HOLDING CO., LTD. AND SUBSIDIARIESSECURITIES PURCHASED UNDER RESELL AGREEMENTSDECEMBER 31, 2014(In Thousands of New Taiwan Dollars)
Items Face Value Amount
Government bonds $ 7,700 $ 8,500
Commercial paper 265,000 264,845
$ 272,700 $ 273,345
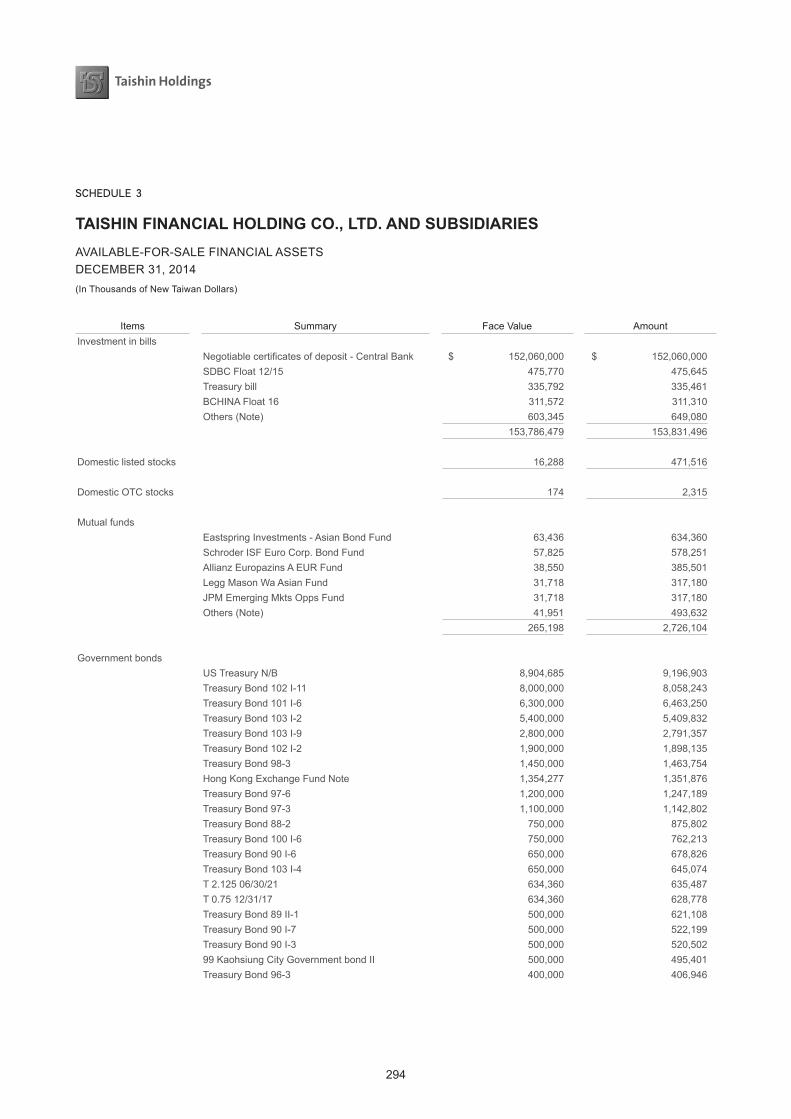
294
SCHEDULE 3
TAISHIN FINANCIAL HOLDING CO., LTD. AND SUBSIDIARIESAVAILABLE-FOR-SALE FINANCIAL ASSETSDECEMBER 31, 2014 (In Thousands of New Taiwan Dollars)
Items Summary Face Value Amount Accumulated Impairment Adjustment Fair Value NoteInvestment in bills
Negotiable certificates of deposit - Central Bank $ 152,060,000 $ 152,060,000 $ - ($ 66,142 ) $ 151,993,858SDBC Float 12/15 475,770 475,645 - 2,378 478,023Treasury bill 335,792 335,461 - ( 30 ) 335,431BCHINA Float 16 311,572 311,310 - 250 311,560Others (Note) 603,345 649,080 - ( 684 ) 648,396
153,786,479 153,831,496 - ( 64,228 ) 153,767,268
Domestic listed stocks 16,288 471,516 ( 16,168 ) 6,489 461,837
Domestic OTC stocks 174 2,315 - 4,508 6,823
Mutual fundsEastspring Investments - Asian Bond Fund 63,436 634,360 - ( 3,955 ) 630,405Schroder ISF Euro Corp. Bond Fund 57,825 578,251 - 30,348 608,599Allianz Europazins A EUR Fund 38,550 385,501 - 3,391 388,892Legg Mason Wa Asian Fund 31,718 317,180 - ( 6,341 ) 310,839JPM Emerging Mkts Opps Fund 31,718 317,180 - ( 9,718 ) 307,462Others (Note) 41,951 493,632 - 33,077 526,709
265,198 2,726,104 - 46,802 2,772,906
Government bondsUS Treasury N/B 8,904,685 9,196,903 - 17,061 9,213,964Treasury Bond 102 I-11 8,000,000 8,058,243 - 17,467 8,075,710Treasury Bond 101 I-6 6,300,000 6,463,250 - 27,264 6,490,514Treasury Bond 103 I-2 5,400,000 5,409,832 - 13,310 5,423,142Treasury Bond 103 I-9 2,800,000 2,791,357 - 10,853 2,802,210Treasury Bond 102 I-2 1,900,000 1,898,135 - ( 448 ) 1,897,687Treasury Bond 98-3 1,450,000 1,463,754 - 2,628 1,466,382Hong Kong Exchange Fund Note 1,354,277 1,351,876 - ( 5,397 ) 1,346,479Treasury Bond 97-6 1,200,000 1,247,189 - 1,676 1,248,865Treasury Bond 97-3 1,100,000 1,142,802 - 1,176 1,143,978Treasury Bond 88-2 750,000 875,802 - ( 515 ) 875,287Treasury Bond 100 I-6 750,000 762,213 - 3,911 766,124Treasury Bond 90 I-6 650,000 678,826 - 3,148 681,974Treasury Bond 103 I-4 650,000 645,074 - 3,971 649,045T 2.125 06/30/21 634,360 635,487 - 5,712 641,199T 0.75 12/31/17 634,360 628,778 - ( 1,778 ) 627,000Treasury Bond 89 II-1 500,000 621,108 - ( 10,345 ) 610,763Treasury Bond 90 I-7 500,000 522,199 - 2,976 525,175Treasury Bond 90 I-3 500,000 520,502 - 3,066 523,56899 Kaohsiung City Government bond II 500,000 495,401 - 2,216 497,617Treasury Bond 96-3 400,000 406,946 - 3,151 410,097
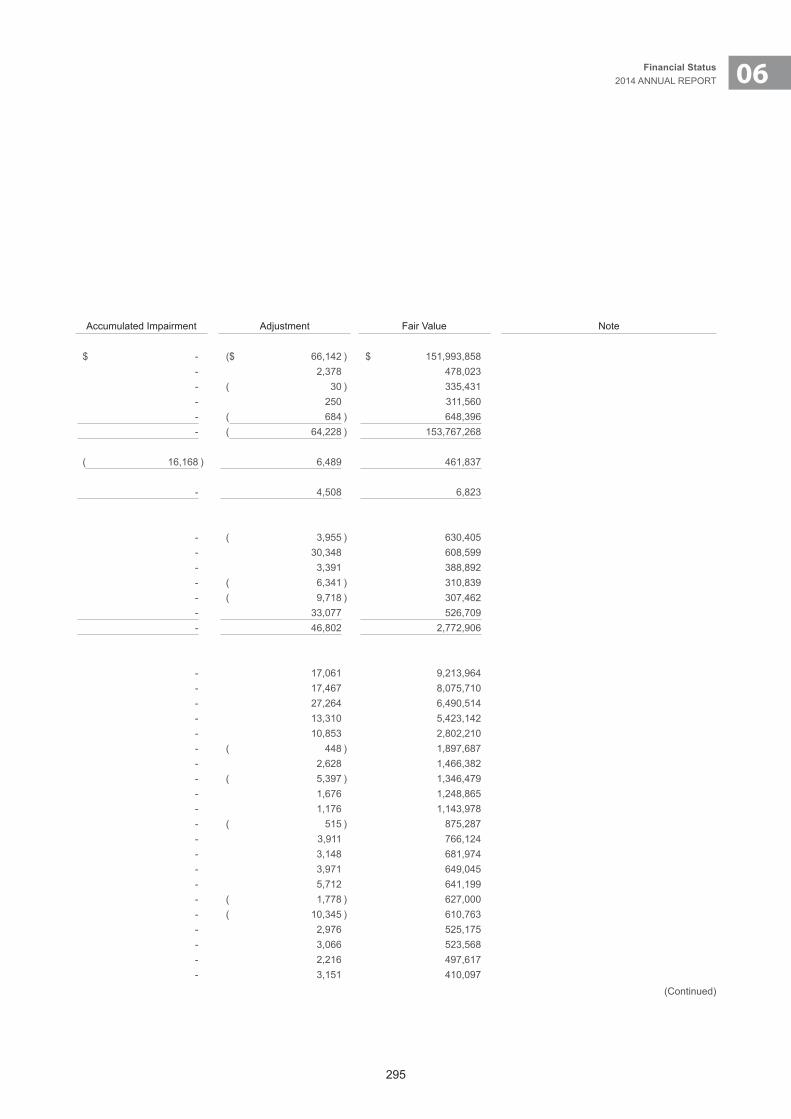
295
06Financial Status2014 ANNUAL REPORT
SCHEDULE 3
TAISHIN FINANCIAL HOLDING CO., LTD. AND SUBSIDIARIESAVAILABLE-FOR-SALE FINANCIAL ASSETSDECEMBER 31, 2014 (In Thousands of New Taiwan Dollars)
Items Summary Face Value Amount Accumulated Impairment Adjustment Fair Value NoteInvestment in bills
Negotiable certificates of deposit - Central Bank $ 152,060,000 $ 152,060,000 $ - ($ 66,142 ) $ 151,993,858SDBC Float 12/15 475,770 475,645 - 2,378 478,023Treasury bill 335,792 335,461 - ( 30 ) 335,431BCHINA Float 16 311,572 311,310 - 250 311,560Others (Note) 603,345 649,080 - ( 684 ) 648,396
153,786,479 153,831,496 - ( 64,228 ) 153,767,268
Domestic listed stocks 16,288 471,516 ( 16,168 ) 6,489 461,837
Domestic OTC stocks 174 2,315 - 4,508 6,823
Mutual fundsEastspring Investments - Asian Bond Fund 63,436 634,360 - ( 3,955 ) 630,405Schroder ISF Euro Corp. Bond Fund 57,825 578,251 - 30,348 608,599Allianz Europazins A EUR Fund 38,550 385,501 - 3,391 388,892Legg Mason Wa Asian Fund 31,718 317,180 - ( 6,341 ) 310,839JPM Emerging Mkts Opps Fund 31,718 317,180 - ( 9,718 ) 307,462Others (Note) 41,951 493,632 - 33,077 526,709
265,198 2,726,104 - 46,802 2,772,906
Government bondsUS Treasury N/B 8,904,685 9,196,903 - 17,061 9,213,964Treasury Bond 102 I-11 8,000,000 8,058,243 - 17,467 8,075,710Treasury Bond 101 I-6 6,300,000 6,463,250 - 27,264 6,490,514Treasury Bond 103 I-2 5,400,000 5,409,832 - 13,310 5,423,142Treasury Bond 103 I-9 2,800,000 2,791,357 - 10,853 2,802,210Treasury Bond 102 I-2 1,900,000 1,898,135 - ( 448 ) 1,897,687Treasury Bond 98-3 1,450,000 1,463,754 - 2,628 1,466,382Hong Kong Exchange Fund Note 1,354,277 1,351,876 - ( 5,397 ) 1,346,479Treasury Bond 97-6 1,200,000 1,247,189 - 1,676 1,248,865Treasury Bond 97-3 1,100,000 1,142,802 - 1,176 1,143,978Treasury Bond 88-2 750,000 875,802 - ( 515 ) 875,287Treasury Bond 100 I-6 750,000 762,213 - 3,911 766,124Treasury Bond 90 I-6 650,000 678,826 - 3,148 681,974Treasury Bond 103 I-4 650,000 645,074 - 3,971 649,045T 2.125 06/30/21 634,360 635,487 - 5,712 641,199T 0.75 12/31/17 634,360 628,778 - ( 1,778 ) 627,000Treasury Bond 89 II-1 500,000 621,108 - ( 10,345 ) 610,763Treasury Bond 90 I-7 500,000 522,199 - 2,976 525,175Treasury Bond 90 I-3 500,000 520,502 - 3,066 523,56899 Kaohsiung City Government bond II 500,000 495,401 - 2,216 497,617Treasury Bond 96-3 400,000 406,946 - 3,151 410,097
(Continued)
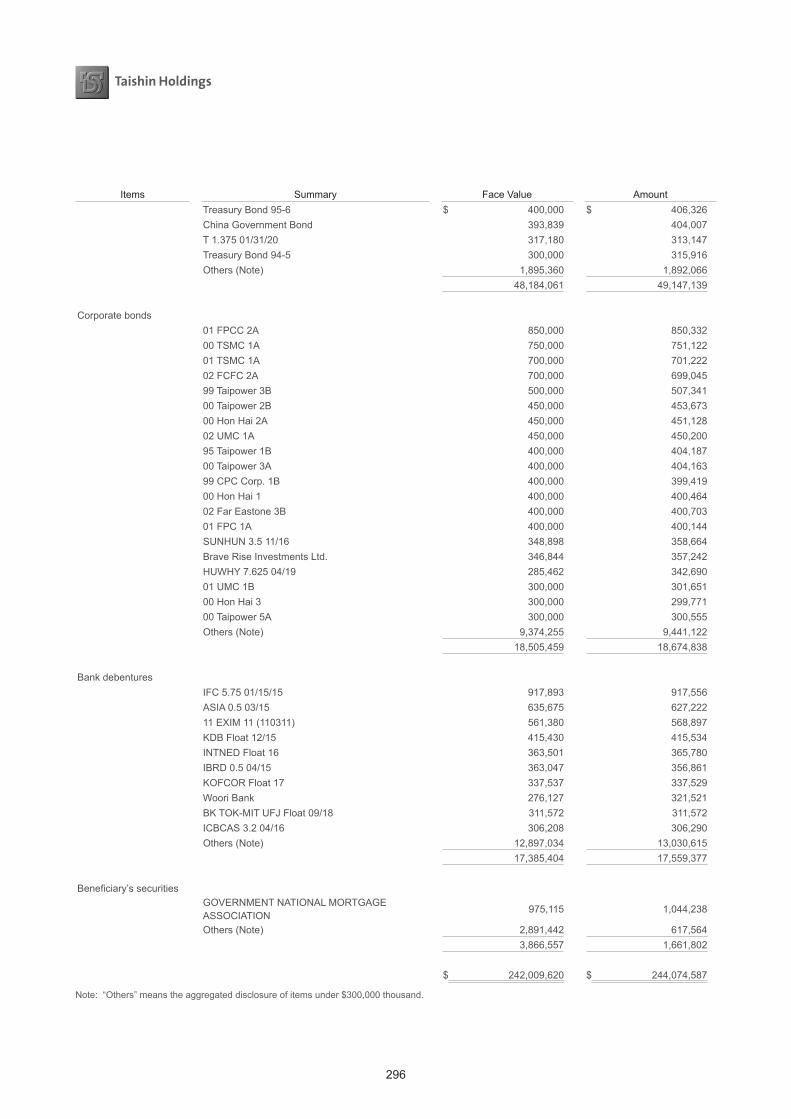
296
Items Summary Face Value Amount Accumulated Impairment Adjustment Fair Value NoteTreasury Bond 95-6 $ 400,000 $ 406,326 $ - $ 1,890 $ 408,216China Government Bond 393,839 404,007 - ( 7,142 ) 396,865T 1.375 01/31/20 317,180 313,147 - ( 675 ) 312,472Treasury Bond 94-5 300,000 315,916 - ( 4,355 ) 311,561Others (Note) 1,895,360 1,892,066 - 3,964 1,896,030
48,184,061 49,147,139 - 94,785 49,241,924
Corporate bonds01 FPCC 2A 850,000 850,332 - 2,656 852,98800 TSMC 1A 750,000 751,122 - 5,180 756,30201 TSMC 1A 700,000 701,222 - 3,294 704,51602 FCFC 2A 700,000 699,045 - ( 327 ) 698,71899 Taipower 3B 500,000 507,341 - 19 507,36000 Taipower 2B 450,000 453,673 - 1,448 455,12100 Hon Hai 2A 450,000 451,128 - 2,115 453,24302 UMC 1A 450,000 450,200 - 727 450,92795 Taipower 1B 400,000 404,187 - 1,864 406,05100 Taipower 3A 400,000 404,163 - 1,730 405,89399 CPC Corp. 1B 400,000 399,419 - 2,867 402,28600 Hon Hai 1 400,000 400,464 - 1,259 401,72302 Far Eastone 3B 400,000 400,703 - 125 400,82801 FPC 1A 400,000 400,144 - 240 400,384SUNHUN 3.5 11/16 348,898 358,664 - 918 359,582Brave Rise Investments Ltd. 346,844 357,242 - - 357,242HUWHY 7.625 04/19 285,462 342,690 - 1,697 344,38701 UMC 1B 300,000 301,651 - 1,122 302,77300 Hon Hai 3 300,000 299,771 - 2,812 302,58300 Taipower 5A 300,000 300,555 - 1,457 302,012Others (Note) 9,374,255 9,441,122 - 23,939 9,465,061
18,505,459 18,674,838 - 55,142 18,729,980
Bank debenturesIFC 5.75 01/15/15 917,893 917,556 - 116 917,672ASIA 0.5 03/15 635,675 627,222 - 272 627,49411 EXIM 11 (110311) 561,380 568,897 - 1,477 570,374KDB Float 12/15 415,430 415,534 - 1,273 416,807INTNED Float 16 363,501 365,780 - 2,948 368,728IBRD 0.5 04/15 363,047 356,861 - 4 356,865KOFCOR Float 17 337,537 337,529 - 2,429 339,958Woori Bank 276,127 321,521 - 436 321,957BK TOK-MIT UFJ Float 09/18 311,572 311,572 - ( 543 ) 311,029ICBCAS 3.2 04/16 306,208 306,290 - ( 1,901 ) 304,389Others (Note) 12,897,034 13,030,615 - 36,268 13,066,883
17,385,404 17,559,377 - 42,779 17,602,156
Beneficiary’s securities GOVERNMENT NATIONAL MORTGAGE ASSOCIATION
975,115 1,044,238 - 2,191 1,046,429
Others (Note) 2,891,442 617,564 - 2,166 619,730 3,866,557 1,661,802 - 4,357 1,666,159 $ 242,009,620 $ 244,074,587 ($ 16,168 ) $ 190,634 $ 244,249,053
Note: “Others” means the aggregated disclosure of items under $300,000 thousand.(Concluded)
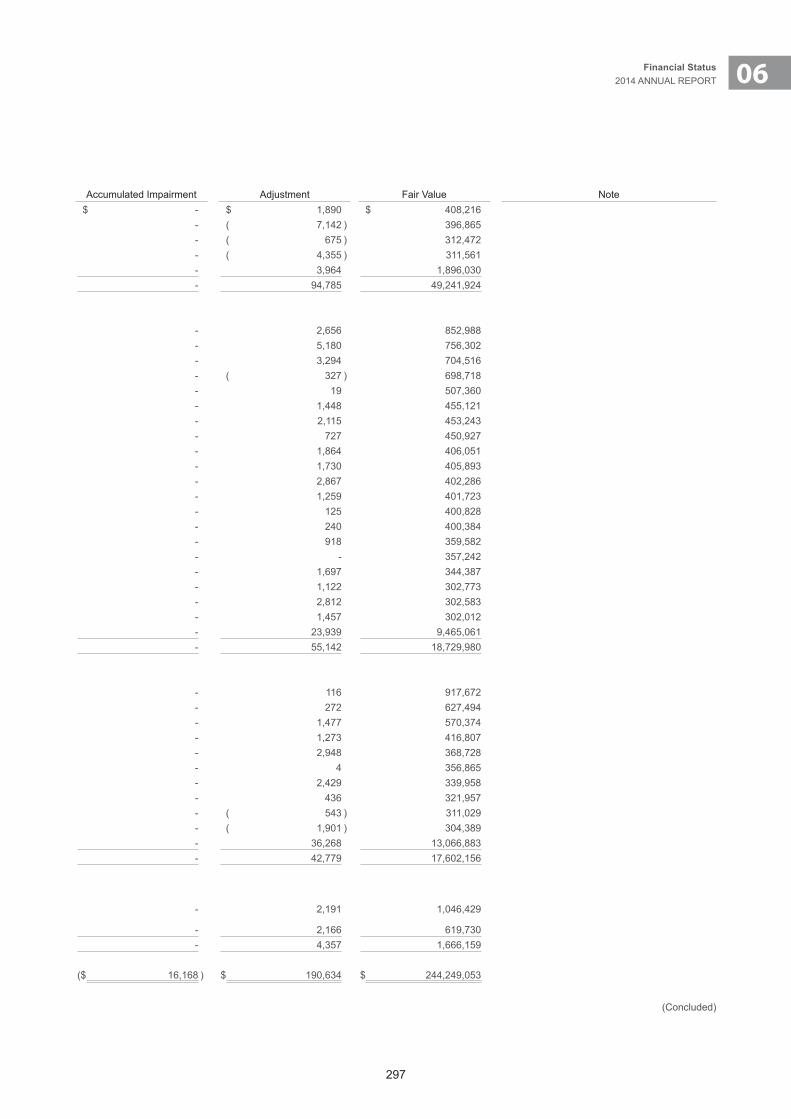
297
06Financial Status2014 ANNUAL REPORT
Items Summary Face Value Amount Accumulated Impairment Adjustment Fair Value NoteTreasury Bond 95-6 $ 400,000 $ 406,326 $ - $ 1,890 $ 408,216China Government Bond 393,839 404,007 - ( 7,142 ) 396,865T 1.375 01/31/20 317,180 313,147 - ( 675 ) 312,472Treasury Bond 94-5 300,000 315,916 - ( 4,355 ) 311,561Others (Note) 1,895,360 1,892,066 - 3,964 1,896,030
48,184,061 49,147,139 - 94,785 49,241,924
Corporate bonds01 FPCC 2A 850,000 850,332 - 2,656 852,98800 TSMC 1A 750,000 751,122 - 5,180 756,30201 TSMC 1A 700,000 701,222 - 3,294 704,51602 FCFC 2A 700,000 699,045 - ( 327 ) 698,71899 Taipower 3B 500,000 507,341 - 19 507,36000 Taipower 2B 450,000 453,673 - 1,448 455,12100 Hon Hai 2A 450,000 451,128 - 2,115 453,24302 UMC 1A 450,000 450,200 - 727 450,92795 Taipower 1B 400,000 404,187 - 1,864 406,05100 Taipower 3A 400,000 404,163 - 1,730 405,89399 CPC Corp. 1B 400,000 399,419 - 2,867 402,28600 Hon Hai 1 400,000 400,464 - 1,259 401,72302 Far Eastone 3B 400,000 400,703 - 125 400,82801 FPC 1A 400,000 400,144 - 240 400,384SUNHUN 3.5 11/16 348,898 358,664 - 918 359,582Brave Rise Investments Ltd. 346,844 357,242 - - 357,242HUWHY 7.625 04/19 285,462 342,690 - 1,697 344,38701 UMC 1B 300,000 301,651 - 1,122 302,77300 Hon Hai 3 300,000 299,771 - 2,812 302,58300 Taipower 5A 300,000 300,555 - 1,457 302,012Others (Note) 9,374,255 9,441,122 - 23,939 9,465,061
18,505,459 18,674,838 - 55,142 18,729,980
Bank debenturesIFC 5.75 01/15/15 917,893 917,556 - 116 917,672ASIA 0.5 03/15 635,675 627,222 - 272 627,49411 EXIM 11 (110311) 561,380 568,897 - 1,477 570,374KDB Float 12/15 415,430 415,534 - 1,273 416,807INTNED Float 16 363,501 365,780 - 2,948 368,728IBRD 0.5 04/15 363,047 356,861 - 4 356,865KOFCOR Float 17 337,537 337,529 - 2,429 339,958Woori Bank 276,127 321,521 - 436 321,957BK TOK-MIT UFJ Float 09/18 311,572 311,572 - ( 543 ) 311,029ICBCAS 3.2 04/16 306,208 306,290 - ( 1,901 ) 304,389Others (Note) 12,897,034 13,030,615 - 36,268 13,066,883
17,385,404 17,559,377 - 42,779 17,602,156
Beneficiary’s securities GOVERNMENT NATIONAL MORTGAGE ASSOCIATION
975,115 1,044,238 - 2,191 1,046,429
Others (Note) 2,891,442 617,564 - 2,166 619,730 3,866,557 1,661,802 - 4,357 1,666,159 $ 242,009,620 $ 244,074,587 ($ 16,168 ) $ 190,634 $ 244,249,053
Note: “Others” means the aggregated disclosure of items under $300,000 thousand.(Concluded)

298
SCHEDULE 4
TAISHIN FINANCIAL HOLDING CO., LTD. AND SUBSIDIARIESHELD-TO-MATURITY FINANCIAL ASSETSDECEMBER 31, 2014(In Thousands of New Taiwan Dollars)
Items Summary Amount Interest Rate (%)Unamortized
Premium (Discount)
Book Value Note
Government bonds
Treasury Bond 99-5
$ 2,500 1.38% $ 40 $ 2,540
SCHEDULE 5
TAISHIN FINANCIAL HOLDING CO., LTD. AND SUBSIDIARIESCHANGES IN INVESTMENTS ACCOUNTED FOR USING EQUITY METHODFOR THE YEAR ENDED DECEMBER 31, 2014(In Thousands of New Taiwan Dollars, Except Unit Price)
Beginning Balance Increase Decrease Ending Balance Market Price or Equity
Name Shares Amounts Shares Amounts Shares Amounts SharesOwnershipInterest (%)
Amounts Unit Price Total
Unlisted shares
Taishin D.A. Finance (Note 1) 20,000,000 $ 142,860 - $ - ( 20,000,000 ) ( $ 142,860 ) - - $ - - $ -
An-Hsin Real-Estate 3,900,000 78,369 - 24,630 - ( 17,823 ) 3,900,000 30.00 85,176 18.93 85,176
Listed company
Chang Hwa Bank (Note 2) - - 1,803,062,594 32,575,808 - - 1,803,062,594 22.81 32,575,808 18.07 32,575,808
$ 221,229 $ 32,600,438 ($ 160,683 ) $ 32,660,984 $ 32,660,98
Note 1: Taishin Financial Holding has consolidated Taishin D.A. Finance as subsidiary cause the decrease of Taishin D.A. Finance. Note 2: Chang Hwa Bank is accounted for using equity method after Taishin Financial Holding lost controls of Chang Hwa Bank.
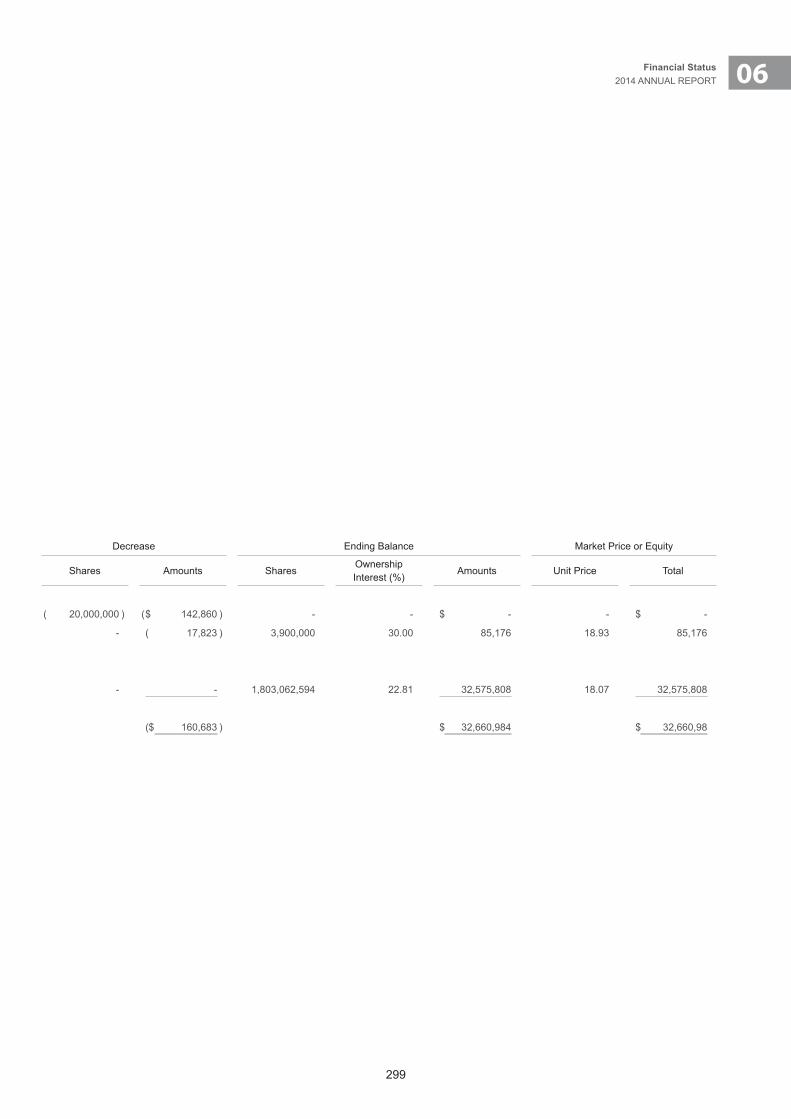
299
06Financial Status2014 ANNUAL REPORT
SCHEDULE 4
TAISHIN FINANCIAL HOLDING CO., LTD. AND SUBSIDIARIESHELD-TO-MATURITY FINANCIAL ASSETSDECEMBER 31, 2014(In Thousands of New Taiwan Dollars)
Items Summary Amount Interest Rate (%)Unamortized
Premium (Discount)
Book Value Note
Government bonds
Treasury Bond 99-5
$ 2,500 1.38% $ 40 $ 2,540
SCHEDULE 5
TAISHIN FINANCIAL HOLDING CO., LTD. AND SUBSIDIARIESCHANGES IN INVESTMENTS ACCOUNTED FOR USING EQUITY METHODFOR THE YEAR ENDED DECEMBER 31, 2014(In Thousands of New Taiwan Dollars, Except Unit Price)
Beginning Balance Increase Decrease Ending Balance Market Price or Equity
Name Shares Amounts Shares Amounts Shares Amounts SharesOwnershipInterest (%)
Amounts Unit Price Total
Unlisted shares
Taishin D.A. Finance (Note 1) 20,000,000 $ 142,860 - $ - ( 20,000,000 ) ( $ 142,860 ) - - $ - - $ -
An-Hsin Real-Estate 3,900,000 78,369 - 24,630 - ( 17,823 ) 3,900,000 30.00 85,176 18.93 85,176
Listed company
Chang Hwa Bank (Note 2) - - 1,803,062,594 32,575,808 - - 1,803,062,594 22.81 32,575,808 18.07 32,575,808
$ 221,229 $ 32,600,438 ($ 160,683 ) $ 32,660,984 $ 32,660,98
Note 1: Taishin Financial Holding has consolidated Taishin D.A. Finance as subsidiary cause the decrease of Taishin D.A. Finance. Note 2: Chang Hwa Bank is accounted for using equity method after Taishin Financial Holding lost controls of Chang Hwa Bank.
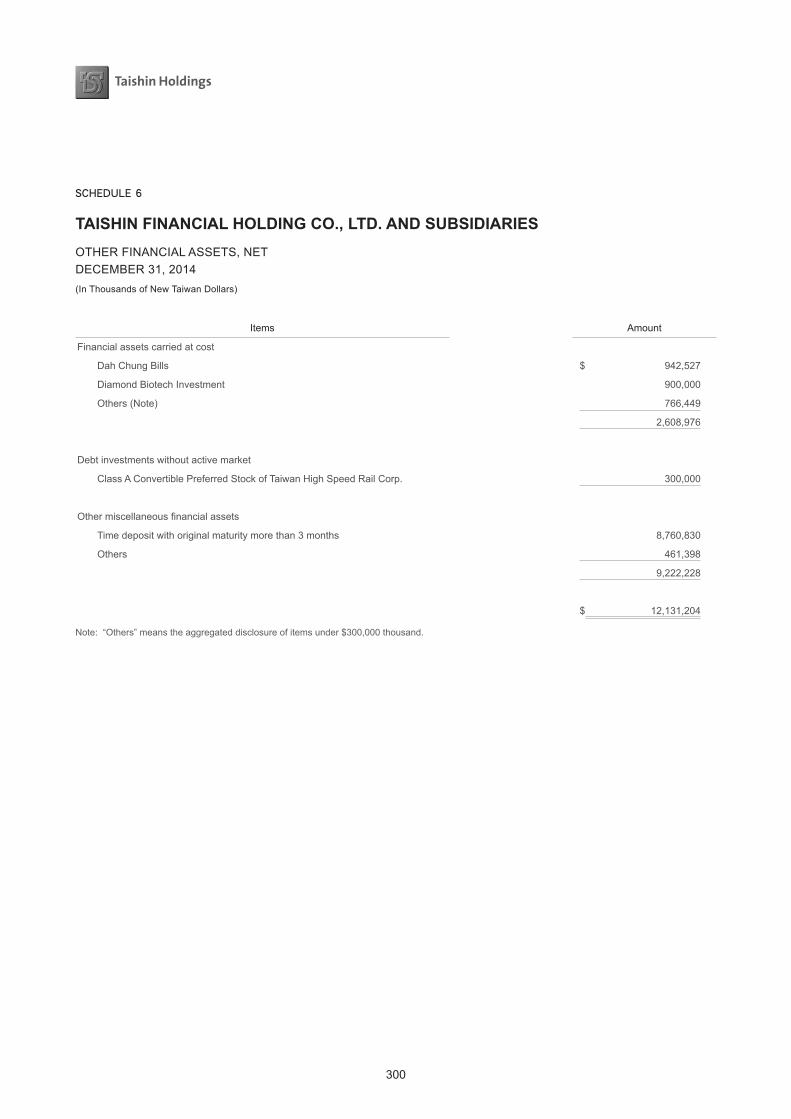
300
SCHEDULE 6
TAISHIN FINANCIAL HOLDING CO., LTD. AND SUBSIDIARIESOTHER FINANCIAL ASSETS, NETDECEMBER 31, 2014(In Thousands of New Taiwan Dollars)
Items Amount
Financial assets carried at cost
Dah Chung Bills $ 942,527
Diamond Biotech Investment 900,000
Others (Note) 766,449
2,608,976
Debt investments without active market
Class A Convertible Preferred Stock of Taiwan High Speed Rail Corp. 300,000
Other miscellaneous financial assets
Time deposit with original maturity more than 3 months 8,760,830
Others 461,398
9,222,228
$ 12,131,204
Note: “Others” means the aggregated disclosure of items under $300,000 thousand.
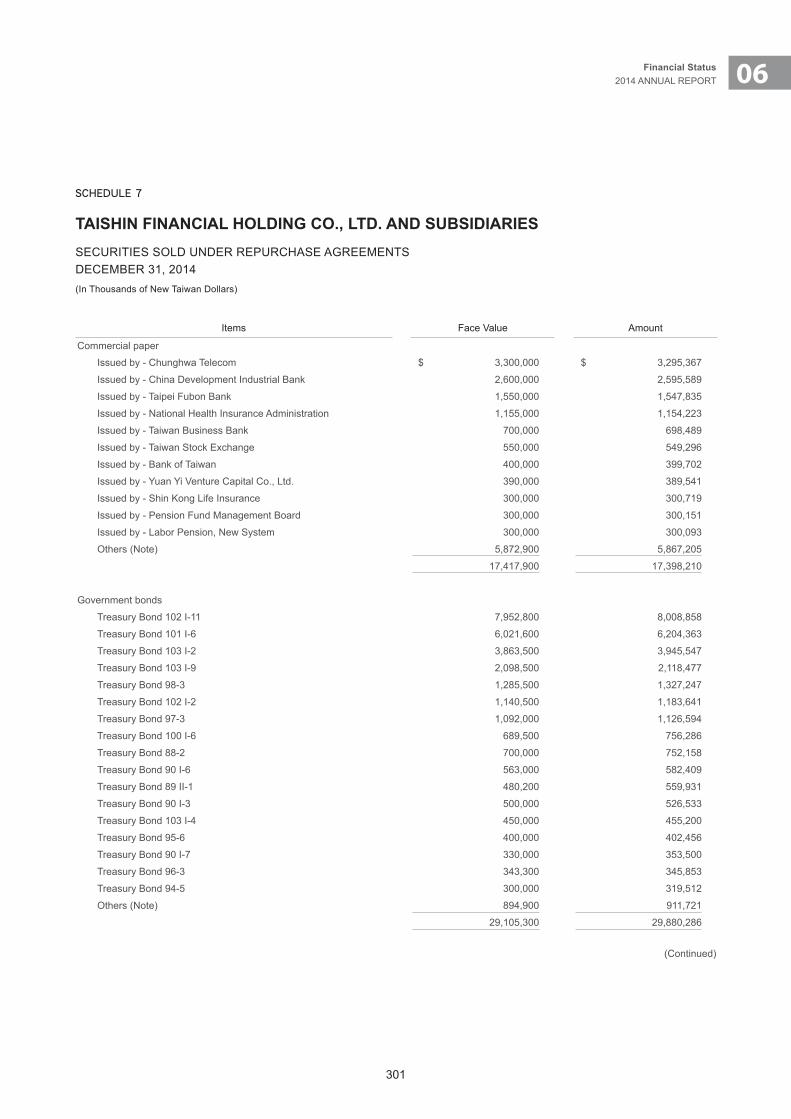
301
06Financial Status2014 ANNUAL REPORT
SCHEDULE 7
TAISHIN FINANCIAL HOLDING CO., LTD. AND SUBSIDIARIESSECURITIES SOLD UNDER REPURCHASE AGREEMENTSDECEMBER 31, 2014(In Thousands of New Taiwan Dollars)
Items Face Value Amount
Commercial paper
Issued by - Chunghwa Telecom $ 3,300,000 $ 3,295,367
Issued by - China Development Industrial Bank 2,600,000 2,595,589
Issued by - Taipei Fubon Bank 1,550,000 1,547,835
Issued by - National Health Insurance Administration 1,155,000 1,154,223
Issued by - Taiwan Business Bank 700,000 698,489
Issued by - Taiwan Stock Exchange 550,000 549,296
Issued by - Bank of Taiwan 400,000 399,702
Issued by - Yuan Yi Venture Capital Co., Ltd. 390,000 389,541
Issued by - Shin Kong Life Insurance 300,000 300,719
Issued by - Pension Fund Management Board 300,000 300,151
Issued by - Labor Pension, New System 300,000 300,093
Others (Note) 5,872,900 5,867,205
17,417,900 17,398,210
Government bonds
Treasury Bond 102 I-11 7,952,800 8,008,858
Treasury Bond 101 I-6 6,021,600 6,204,363
Treasury Bond 103 I-2 3,863,500 3,945,547
Treasury Bond 103 I-9 2,098,500 2,118,477
Treasury Bond 98-3 1,285,500 1,327,247
Treasury Bond 102 I-2 1,140,500 1,183,641
Treasury Bond 97-3 1,092,000 1,126,594
Treasury Bond 100 I-6 689,500 756,286
Treasury Bond 88-2 700,000 752,158
Treasury Bond 90 I-6 563,000 582,409
Treasury Bond 89 II-1 480,200 559,931
Treasury Bond 90 I-3 500,000 526,533
Treasury Bond 103 I-4 450,000 455,200
Treasury Bond 95-6 400,000 402,456
Treasury Bond 90 I-7 330,000 353,500
Treasury Bond 96-3 343,300 345,853
Treasury Bond 94-5 300,000 319,512
Others (Note) 894,900 911,721
29,105,300 29,880,286
(Continued)
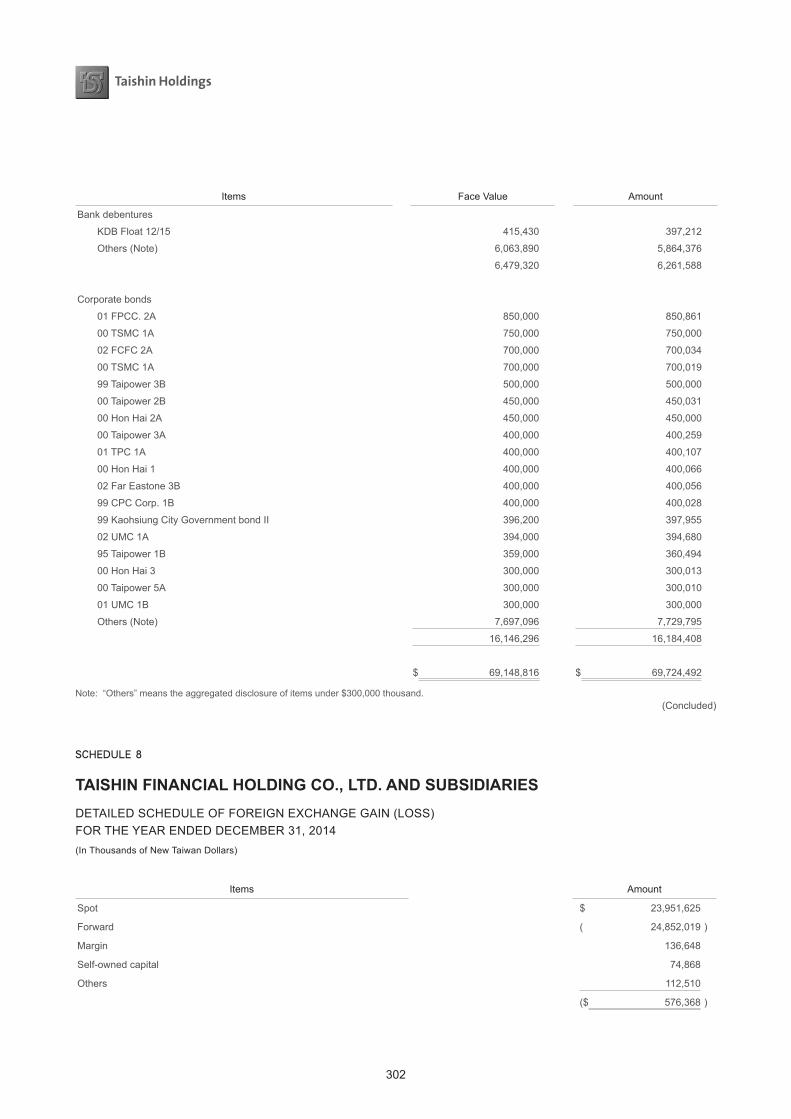
302
Items Face Value Amount
Bank debentures
KDB Float 12/15 415,430 397,212
Others (Note) 6,063,890 5,864,376
6,479,320 6,261,588
Corporate bonds
01 FPCC. 2A 850,000 850,861
00 TSMC 1A 750,000 750,000
02 FCFC 2A 700,000 700,034
00 TSMC 1A 700,000 700,019
99 Taipower 3B 500,000 500,000
00 Taipower 2B 450,000 450,031
00 Hon Hai 2A 450,000 450,000
00 Taipower 3A 400,000 400,259
01 TPC 1A 400,000 400,107
00 Hon Hai 1 400,000 400,066
02 Far Eastone 3B 400,000 400,056
99 CPC Corp. 1B 400,000 400,028
99 Kaohsiung City Government bond II 396,200 397,955
02 UMC 1A 394,000 394,680
95 Taipower 1B 359,000 360,494
00 Hon Hai 3 300,000 300,013
00 Taipower 5A 300,000 300,010
01 UMC 1B 300,000 300,000
Others (Note) 7,697,096 7,729,795
16,146,296 16,184,408
$ 69,148,816 $ 69,724,492
Note: “Others” means the aggregated disclosure of items under $300,000 thousand.(Concluded)
SCHEDULE 8
TAISHIN FINANCIAL HOLDING CO., LTD. AND SUBSIDIARIESDETAILED SCHEDULE OF FOREIGN EXCHANGE GAIN (LOSS)FOR THE YEAR ENDED DECEMBER 31, 2014(In Thousands of New Taiwan Dollars)
Items Amount
Spot $ 23,951,625
Forward ( 24,852,019 )
Margin 136,648
Self-owned capital 74,868
Others 112,510
($ 576,368 )
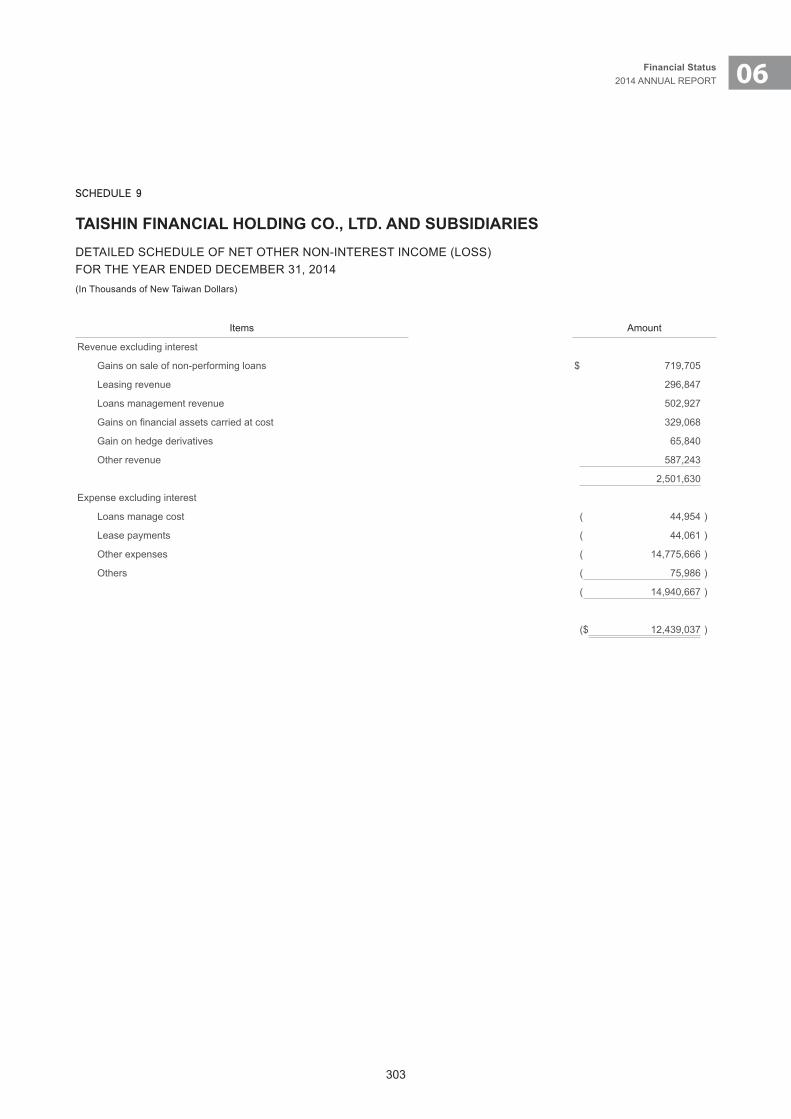
303
06Financial Status2014 ANNUAL REPORT
SCHEDULE 9
TAISHIN FINANCIAL HOLDING CO., LTD. AND SUBSIDIARIESDETAILED SCHEDULE OF NET OTHER NON-INTEREST INCOME (LOSS)FOR THE YEAR ENDED DECEMBER 31, 2014(In Thousands of New Taiwan Dollars)
Items Amount
Revenue excluding interest
Gains on sale of non-performing loans $ 719,705
Leasing revenue 296,847
Loans management revenue 502,927
Gains on financial assets carried at cost 329,068
Gain on hedge derivatives 65,840
Other revenue 587,243
2,501,630
Expense excluding interest
Loans manage cost ( 44,954 )
Lease payments ( 44,061 )
Other expenses ( 14,775,666 )
Others ( 75,986 )
( 14,940,667 )
($ 12,439,037 )
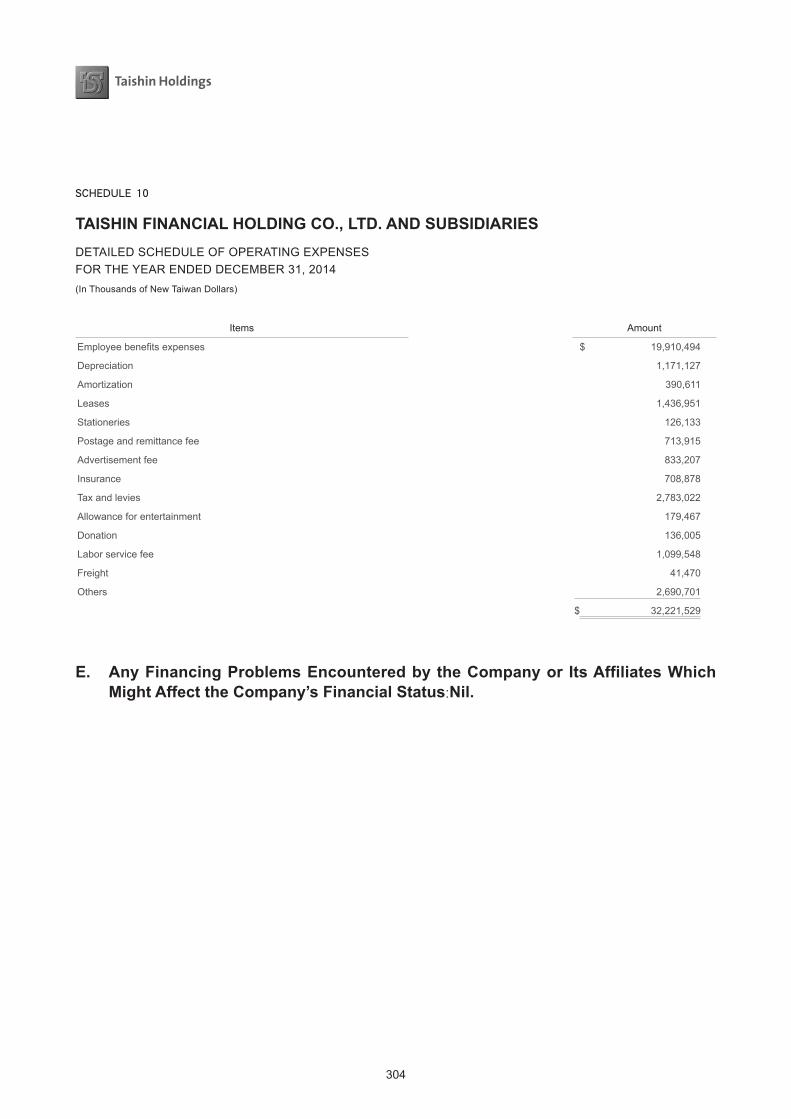
304
SCHEDULE 10
TAISHIN FINANCIAL HOLDING CO., LTD. AND SUBSIDIARIESDETAILED SCHEDULE OF OPERATING EXPENSESFOR THE YEAR ENDED DECEMBER 31, 2014(In Thousands of New Taiwan Dollars)
Items Amount
Employee benefits expenses $ 19,910,494
Depreciation 1,171,127
Amortization 390,611
Leases 1,436,951
Stationeries 126,133
Postage and remittance fee 713,915
Advertisement fee 833,207
Insurance 708,878
Tax and levies 2,783,022
Allowance for entertainment 179,467
Donation 136,005
Labor service fee 1,099,548
Freight 41,470
Others 2,690,701
$ 32,221,529
E. Any Financing Problems Encountered by the Company or Its Affiliates Which Might Affect the Company’s Financial Status:Nil.
07
Financial Status, Review of Business Performance, and Risk Management
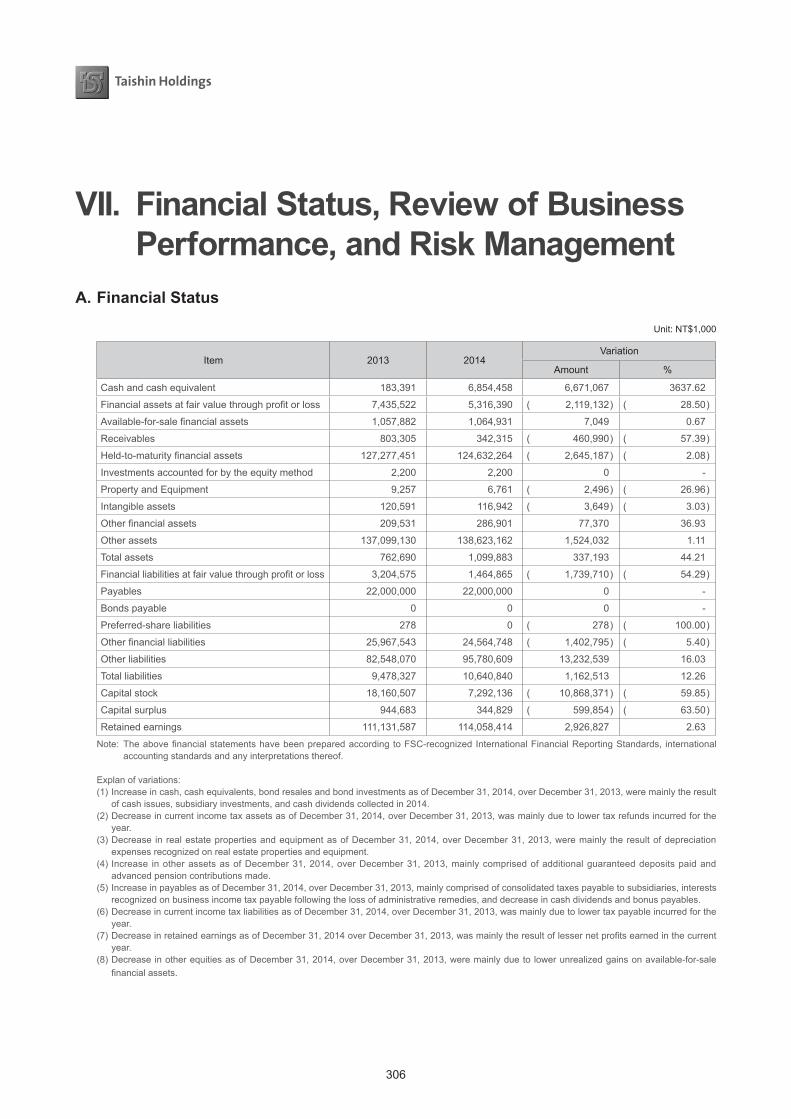
306
VII. Financial Status, Review of Business Performance, and Risk Management
A. Financial Status
Unit: NT$1,000
Item 2013 2014Variation
Amount %
Cash and cash equivalent 183,391 6,854,458 6,671,067 3637.62
Financial assets at fair value through profit or loss 7,435,522 5,316,390 ( 2,119,132 ) ( 28.50 )
Available-for-sale financial assets 1,057,882 1,064,931 7,049 0.67
Receivables 803,305 342,315 ( 460,990 ) ( 57.39 )
Held-to-maturity financial assets 127,277,451 124,632,264 ( 2,645,187 ) ( 2.08 )
Investments accounted for by the equity method 2,200 2,200 0 -
Property and Equipment 9,257 6,761 ( 2,496 ) ( 26.96 )
Intangible assets 120,591 116,942 ( 3,649 ) ( 3.03 )
Other financial assets 209,531 286,901 77,370 36.93
Other assets 137,099,130 138,623,162 1,524,032 1.11
Total assets 762,690 1,099,883 337,193 44.21
Financial liabilities at fair value through profit or loss 3,204,575 1,464,865 ( 1,739,710 ) ( 54.29 )
Payables 22,000,000 22,000,000 0 -
Bonds payable 0 0 0 -
Preferred-share liabilities 278 0 ( 278 ) ( 100.00 )
Other financial liabilities 25,967,543 24,564,748 ( 1,402,795 ) ( 5.40 )
Other liabilities 82,548,070 95,780,609 13,232,539 16.03
Total liabilities 9,478,327 10,640,840 1,162,513 12.26
Capital stock 18,160,507 7,292,136 ( 10,868,371 ) ( 59.85 )
Capital surplus 944,683 344,829 ( 599,854 ) ( 63.50 )
Retained earnings 111,131,587 114,058,414 2,926,827 2.63
Note: The above financial statements have been prepared according to FSC-recognized International Financial Reporting Standards, international accounting standards and any interpretations thereof.
Explan of variations:(1) Increase in cash, cash equivalents, bond resales and bond investments as of December 31, 2014, over December 31, 2013, were mainly the result
of cash issues, subsidiary investments, and cash dividends collected in 2014. (2) Decrease in current income tax assets as of December 31, 2014, over December 31, 2013, was mainly due to lower tax refunds incurred for the
year. (3) Decrease in real estate properties and equipment as of December 31, 2014, over December 31, 2013, were mainly the result of depreciation
expenses recognized on real estate properties and equipment. (4) Increase in other assets as of December 31, 2014, over December 31, 2013, mainly comprised of additional guaranteed deposits paid and
advanced pension contributions made. (5) Increase in payables as of December 31, 2014, over December 31, 2013, mainly comprised of consolidated taxes payable to subsidiaries, interests
recognized on business income tax payable following the loss of administrative remedies, and decrease in cash dividends and bonus payables. (6) Decrease in current income tax liabilities as of December 31, 2014, over December 31, 2013, was mainly due to lower tax payable incurred for the
year. (7) Decrease in retained earnings as of December 31, 2014 over December 31, 2013, was mainly the result of lesser net profits earned in the current
year. (8) Decrease in other equities as of December 31, 2014, over December 31, 2013, were mainly due to lower unrealized gains on available-for-sale
financial assets.

307
07Financial Status, Review of Business Performance, and Risk Management 2014 ANNUAL REPORT
B. Business Performance
Unit: NT$1,000
Item 2013 2014Variation
Amount %
Realized gain on available-for-sale financial assets 15,356,975 16,891,545 1,534,570 9.99
Other gains 81,583 135,397 53,814 65.96
Realized loss on available-for-sale financial assets ( 168,711 ) ( 44,859 ) 123,852 ( 73.41 )
Operating expenses ( 431,219 ) ( 238,850 ) 192,369 ( 44.61 )
Other expenses and losses ( 471,120 ) ( 15,225,427 ) ( 14,754,307 ) 3,131.75
Pre-tax income (loss) 14,367,508 1,517,806 ( 12,849,702 ) ( 89.44 )
After-tax income (loss) ( 531,260 ) 106,570 637,830 ( 120.06 )
Net Income 13,836,248 1,624,376 ( 12,211,872 ) ( 88.26 )
Other comprehensive income(loss), net of tax ( 1,510,109 ) ( 712,769 ) 797,340 ( 52.80 )
Total comprehensive income 12,326,139 911,607 ( 11,414,532 ) ( 92.60 )
Note: The above financial statements have been prepared according to FSC-recognized International Financial Reporting Standards, international accounting standards and any interpretations thereof.
Explan of variations:(1) Increase in other gains in 2014 over 2013 was mainly attributed to higher interest income. (2) Decrease in operating expenses in 2014 over 2013 was mainly attributed to lower employee welfare expenses. (3) Increase in other expenses and losses in 2014 over 2013 was mainly due to the loss of control over Chang Hwa Bank. (4) Decrease in income tax expenses in 2014 over 2013 was mainly due to the new tax treatments agreed between the company and the tax authority
on previous operating and interest expenses. (5) Increase in other overall incomes in 2014 over 2013 was mainly due to the fact that subsidiaries’ losses on disposal of available-for-sale assets
were reclassified from other overall incomes into main income categories.
C.Cashflow
Analysisofcashflowinthecomingyear
Unit: NT$1,000
Initial cash balance1
Expected cash flow from business
activities for the whole year
2
Expected cash outflow (inflow) for
the whole year3
Expected cash surplus (shortage)
1+2-3
Remedies for expected cash shortage
Investment plan Financing plan
12,170,848 9,261,296 7,815,093 13,617,051 Nil Nil
D.Influenceonfinanceofmajorcapitaloutlaysintherecentoneyear
The company did not incur any major capital outlay in 2014.
E. Investmentpolicyintherecentyear
The company carries out investments according to article 36 and 37 of the Financial Holding Company Law, the returns rate, and cross selling among subsidiaries, in the hope of the returns on equity. In response to the demand of clients for assets accumulation and wealth management planning, the company will expand its business scope, on
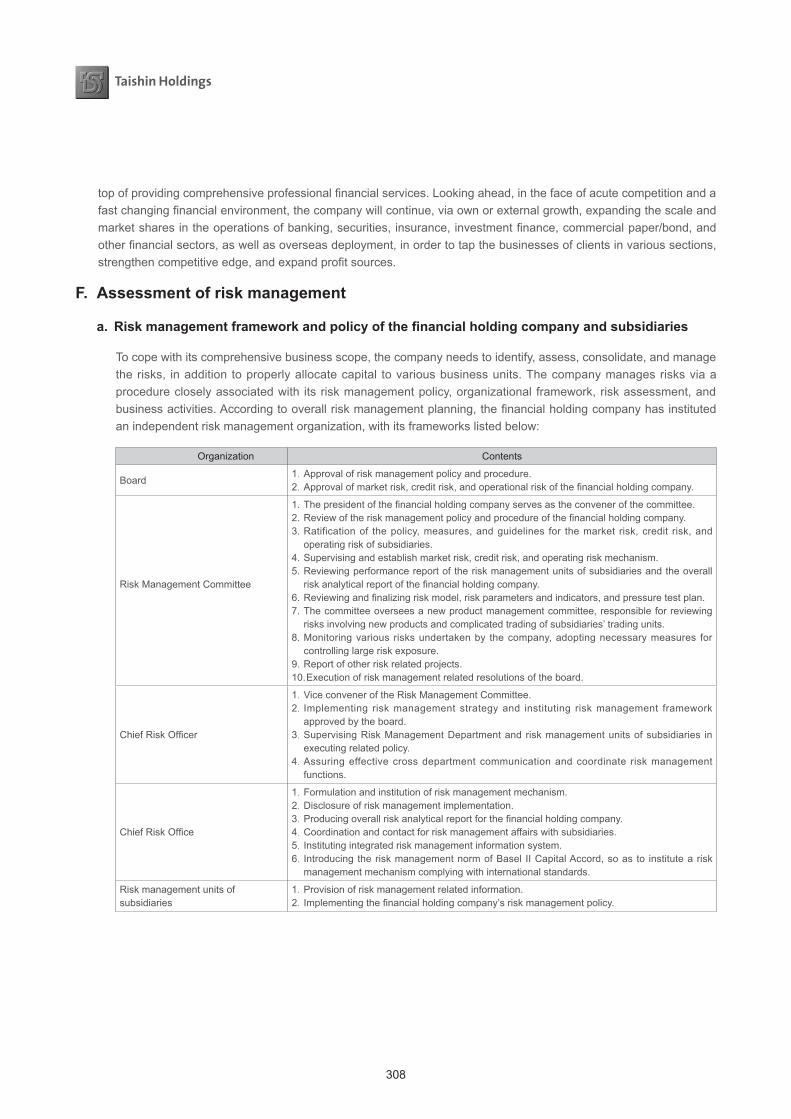
308
top of providing comprehensive professional financial services. Looking ahead, in the face of acute competition and a fast changing financial environment, the company will continue, via own or external growth, expanding the scale and market shares in the operations of banking, securities, insurance, investment finance, commercial paper/bond, and other financial sectors, as well as overseas deployment, in order to tap the businesses of clients in various sections, strengthen competitive edge, and expand profit sources.
F. Assessment of risk management
a. Riskmanagementframeworkandpolicyofthefinancialholdingcompanyandsubsidiaries
To cope with its comprehensive business scope, the company needs to identify, assess, consolidate, and manage the risks, in addition to properly allocate capital to various business units. The company manages risks via a procedure closely associated with its risk management policy, organizational framework, risk assessment, and business activities. According to overall risk management planning, the financial holding company has instituted an independent risk management organization, with its frameworks listed below:
Organization Contents
Board 1.Approval of risk management policy and procedure.2.Approval of market risk, credit risk, and operational risk of the financial holding company.
Risk Management Committee
1. The president of the financial holding company serves as the convener of the committee. 2. Review of the risk management policy and procedure of the financial holding company.3. Ratification of the policy, measures, and guidelines for the market risk, credit risk, and
operating risk of subsidiaries.4. Supervising and establish market risk, credit risk, and operating risk mechanism.5. Reviewing performance report of the risk management units of subsidiaries and the overall
risk analytical report of the financial holding company.6. Reviewing and finalizing risk model, risk parameters and indicators, and pressure test plan.7. The committee oversees a new product management committee, responsible for reviewing
risks involving new products and complicated trading of subsidiaries’ trading units.8. Monitoring various risks undertaken by the company, adopting necessary measures for
controlling large risk exposure.9. Report of other risk related projects.10. Execution of risk management related resolutions of the board.
Chief Risk Officer
1.Vice convener of the Risk Management Committee.2. Implementing risk management strategy and instituting risk management framework
approved by the board.3.Supervising Risk Management Department and risk management units of subsidiaries in
executing related policy. 4.Assuring effective cross department communication and coordinate risk management
functions.
Chief Risk Office
1.Formulation and institution of risk management mechanism. 2.Disclosure of risk management implementation. 3.Producing overall risk analytical report for the financial holding company. 4.Coordination and contact for risk management affairs with subsidiaries.5. Instituting integrated risk management information system.6. Introducing the risk management norm of Basel II Capital Accord, so as to institute a risk
management mechanism complying with international standards.
Risk management units of subsidiaries
1.Provision of risk management related information. 2. Implementing the financial holding company’s risk management policy.
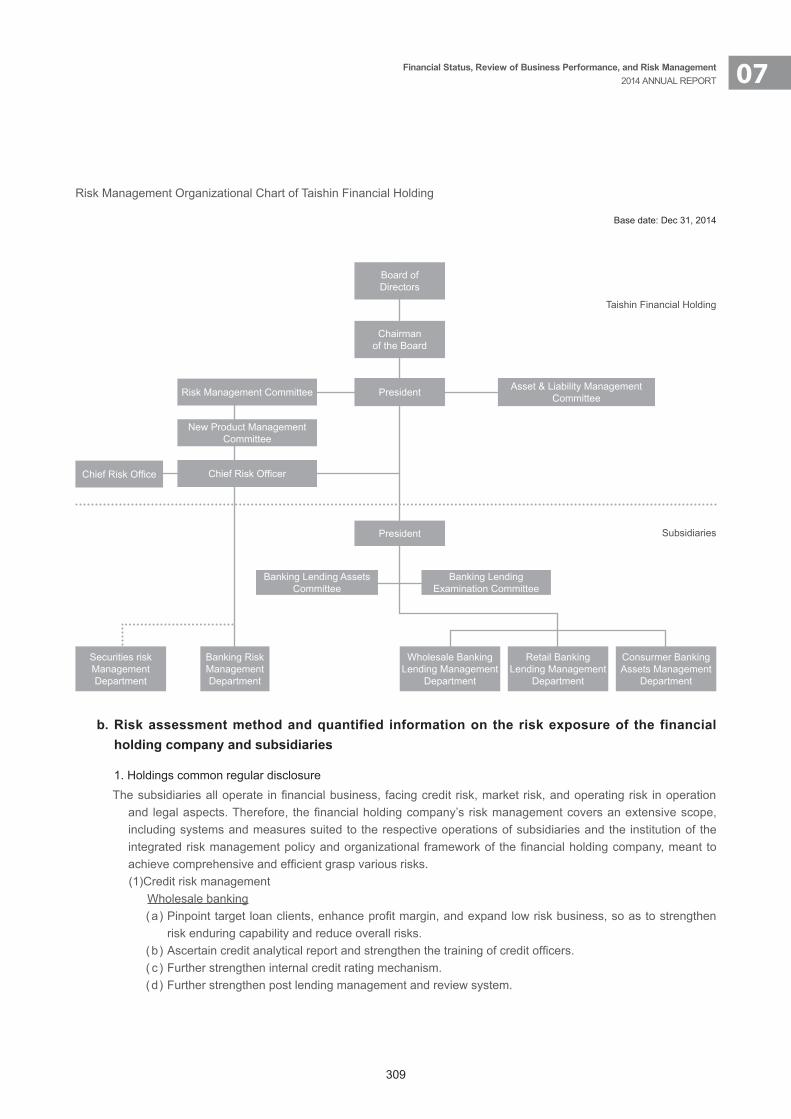
309
07Financial Status, Review of Business Performance, and Risk Management 2014 ANNUAL REPORT
Risk Management Organizational Chart of Taishin Financial Holding
Base date: Dec 31, 2014
b.Riskassessmentmethodandquantified informationon theriskexposureof the financialholdingcompanyandsubsidiaries
1. Holdings common regular disclosureThe subsidiaries all operate in financial business, facing credit risk, market risk, and operating risk in operation
and legal aspects. Therefore, the financial holding company’s risk management covers an extensive scope, including systems and measures suited to the respective operations of subsidiaries and the institution of the integrated risk management policy and organizational framework of the financial holding company, meant to achieve comprehensive and efficient grasp various risks.(1) Credit risk management
Wholesale banking( a ) Pinpoint target loan clients, enhance profit margin, and expand low risk business, so as to strengthen
risk enduring capability and reduce overall risks. ( b ) Ascertain credit analytical report and strengthen the training of credit officers. ( c ) Further strengthen internal credit rating mechanism. ( d ) Further strengthen post lending management and review system.
Board ofDirectors
Chairman of the Board
President Asset & Liability Management Committee
Chief Risk Office
President
Banking Lending Assets Committee
Banking Lending Examination Committee
Risk Management Committee
New Product Management Committee
Chief Risk Officer
Wholesale Banking Lending Management
Department
Retail Banking Lending Management
Department
Consurmer Banking Assets Management
Department
Banking RiskManagement Department
Securities riskManagement Department
Taishin Financial Holding
Subsidiaries
310
( e ) Institute the evaluation system for individual risks and overall credit risk involving securities underwriting and investment position.
( f ) Strengthen the management of credit risk concentration associated with loaning, investment, and trading of various financial products such as derivatives.
( g ) Institute individual management measures for businesses involving specific risk (such as ceiling for loans mortgaged with specific stocks, tracking the price threshold for margin calls, and the undertaking and post management of realty financing).
( h ) Institute the system for the alert, notification, and control of abnormal accounts.( i ) Centralized NPL management.Retail banking( a ) In order to analyzing and monitoring risks, the company has formulated various qualitative indicators by
product, as well as the NPL ratio, aging analysis, NPL sttus,loan loses, recovery of loans, write off and return rates.
( b ) Further enhancement of risk management technique: introduction and deep cultivation of rating model and policy making model; monitor, adjust, and upgrade of the models’ efficacy.
( c ) Core risk analytical team: Core professional talents with analytical capability, product design capability, risk management capability, and execution capability.
( d ) Lending policy based on client group analysis: Analyze client risks according clients’ external and internal behaviors, and flexibly adjust lending policy according to the risk levels of various client groups, as to maintain proper client group ratio.
( e ) Prevention of NPL and fraud: Further track the behavioral modes of NPL and fraud cases and repayment status, thereby forging policy and credit examination/lending flow, as to institute a proactive preventive mechanism.
( f ) Client management based on risk analysis, rating model, and policy model, debt collection, and case review system.
( g ) Single client credit management.(2) Market risk management To consolidate the management of risks deriving from interest rate, exchange rate, and equity securities, the
company assesses via marked-to-market method the income or loss of trading positions for various financial products held by subsidiaries.
(3) Operating risk management To achieve a consistent and complete operating risk management system, the company’s daily operation
and decision making, the company has formulated operating risk management policy and operating risk endurable extent. It has also established “operating risk reporting procedure,” “self-evaluation and auditing operation procedure,” “key risk indicator procedure,” and risk offsetting procedure, featuring mutually linked analysis to uphold operating risk forecast capability.
2. Risk management methods and quantified risk exposure information of subsidiaries(1) Taishin Bank
( a ) Credit risk The main goal of risk management is to pursue maximum profits under reasonable risk, so as to uphold
shareholders’ interest. Effectively grasp the trend of assets quality via regular monitoring of numerical changes in net flow and adjust lending policy and debt collection strategy accordingly. Utilize internal credit rating system, midterm management and review, diversification and ceiling of credit extension/investment positions (customer groups), and other methods to monitor constantly risk level and changes in general economy and financial climate, on top of irregular review or adjustment of risk avoidance
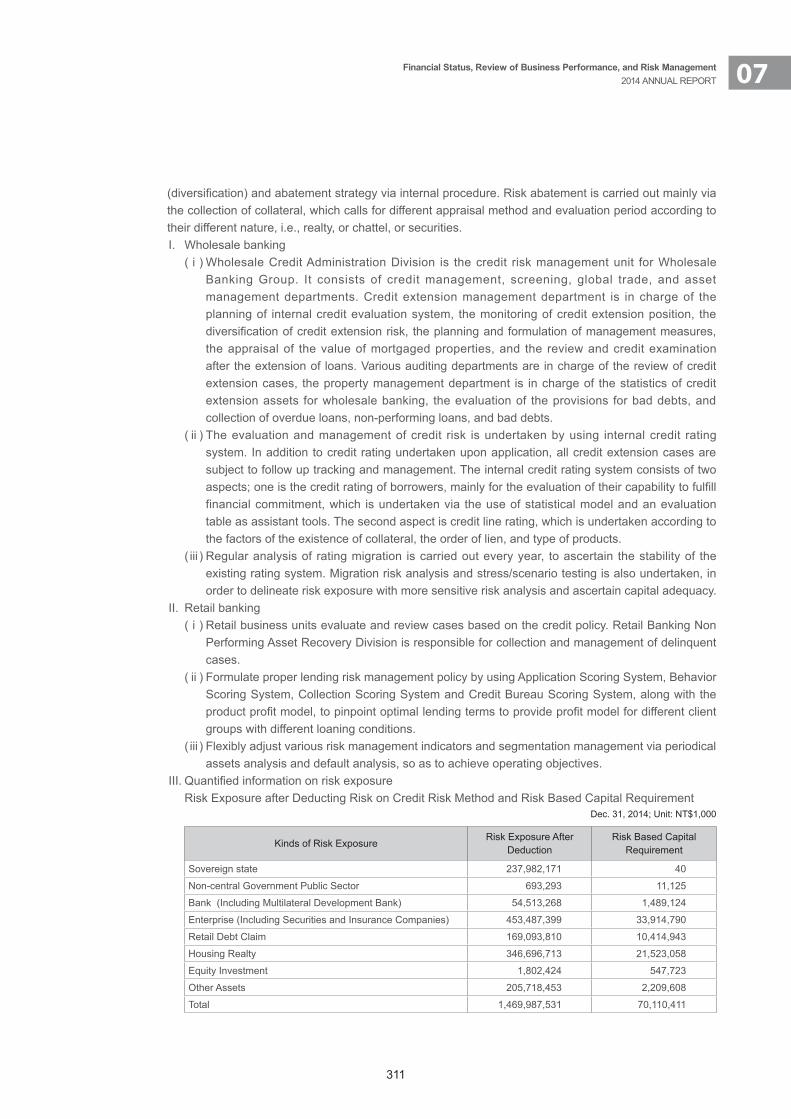
311
07Financial Status, Review of Business Performance, and Risk Management 2014 ANNUAL REPORT
(diversification) and abatement strategy via internal procedure. Risk abatement is carried out mainly via the collection of collateral, which calls for different appraisal method and evaluation period according to their different nature, i.e., realty, or chattel, or securities.I. Wholesale banking
( i ) Wholesale Credit Administration Division is the credit risk management unit for Wholesale Banking Group. It consists of credit management, screening, global trade, and asset management departments. Credit extension management department is in charge of the planning of internal credit evaluation system, the monitoring of credit extension position, the diversification of credit extension risk, the planning and formulation of management measures, the appraisal of the value of mortgaged properties, and the review and credit examination after the extension of loans. Various auditing departments are in charge of the review of credit extension cases, the property management department is in charge of the statistics of credit extension assets for wholesale banking, the evaluation of the provisions for bad debts, and collection of overdue loans, non-performing loans, and bad debts.
( ii ) The evaluation and management of credit risk is undertaken by using internal credit rating system. In addition to credit rating undertaken upon application, all credit extension cases are subject to follow up tracking and management. The internal credit rating system consists of two aspects; one is the credit rating of borrowers, mainly for the evaluation of their capability to fulfill financial commitment, which is undertaken via the use of statistical model and an evaluation table as assistant tools. The second aspect is credit line rating, which is undertaken according to the factors of the existence of collateral, the order of lien, and type of products.
( iii ) Regular analysis of rating migration is carried out every year, to ascertain the stability of the existing rating system. Migration risk analysis and stress/scenario testing is also undertaken, in order to delineate risk exposure with more sensitive risk analysis and ascertain capital adequacy.
II. Retail banking( i ) Retail business units evaluate and review cases based on the credit policy. Retail Banking Non
Performing Asset Recovery Division is responsible for collection and management of delinquent cases.
( ii ) Formulate proper lending risk management policy by using Application Scoring System, Behavior Scoring System, Collection Scoring System and Credit Bureau Scoring System, along with the product profit model, to pinpoint optimal lending terms to provide profit model for different client groups with different loaning conditions.
( iii ) Flexibly adjust various risk management indicators and segmentation management via periodical assets analysis and default analysis, so as to achieve operating objectives.
III. Quantified information on risk exposure Risk Exposure after Deducting Risk on Credit Risk Method and Risk Based Capital Requirement
Dec. 31, 2014; Unit: NT$1,000
Kinds of Risk ExposureRisk Exposure After
DeductionRisk Based Capital
Requirement
Sovereign state 237,982,171 40
Non-central Government Public Sector 693,293 11,125
Bank (Including Multilateral Development Bank) 54,513,268 1,489,124
Enterprise (Including Securities and Insurance Companies) 453,487,399 33,914,790
Retail Debt Claim 169,093,810 10,414,943
Housing Realty 346,696,713 21,523,058
Equity Investment 1,802,424 547,723
Other Assets 205,718,453 2,209,608
Total 1,469,987,531 70,110,411
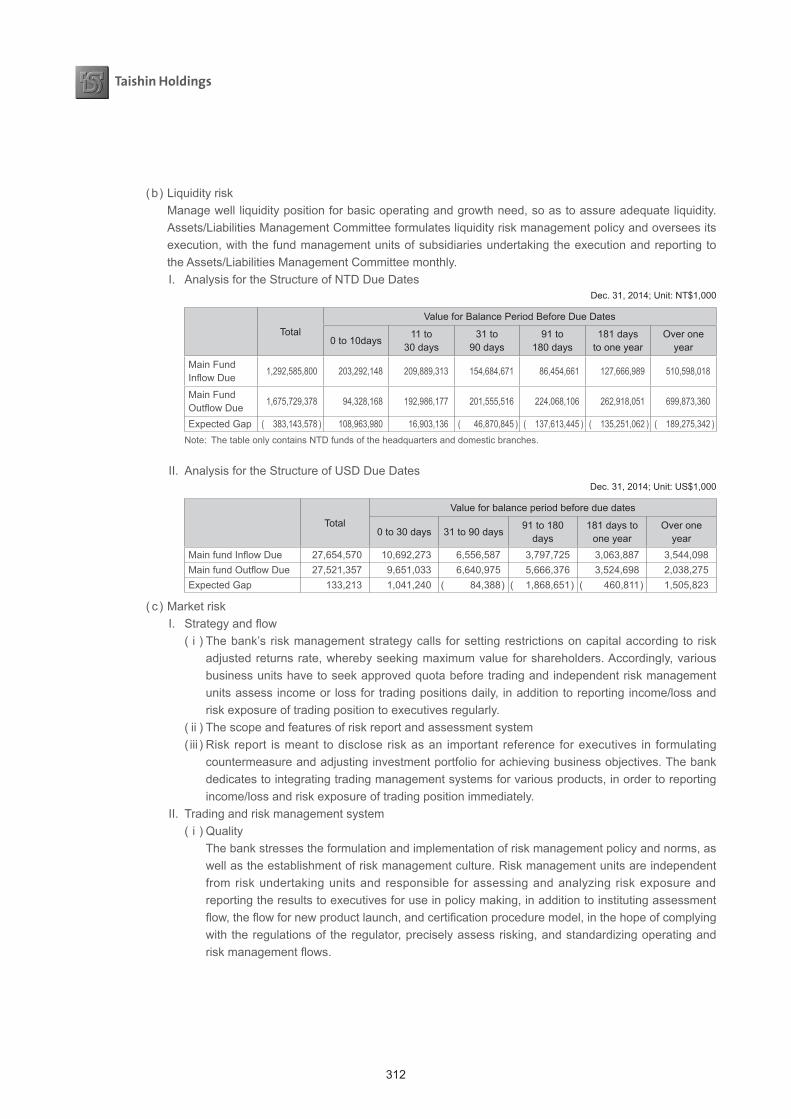
312
( b ) Liquidity risk Manage well liquidity position for basic operating and growth need, so as to assure adequate liquidity.
Assets/Liabilities Management Committee formulates liquidity risk management policy and oversees its execution, with the fund management units of subsidiaries undertaking the execution and reporting to the Assets/Liabilities Management Committee monthly.I. Analysis for the Structure of NTD Due Dates
Dec. 31, 2014; Unit: NT$1,000
TotalValue for Balance Period Before Due Dates
0 to 10days11 to
30 days31 to
90 days91 to
180 days181 days
to one yearOver one
year
Main Fund Inflow Due
1,292,585,800 203,292,148 209,889,313 154,684,671 86,454,661 127,666,989 510,598,018
Main Fund Outflow Due
1,675,729,378 94,328,168 192,986,177 201,555,516 224,068,106 262,918,051 699,873,360
Expected Gap ( 383,143,578 ) 108,963,980 16,903,136 ( 46,870,845 ) ( 137,613,445 ) ( 135,251,062 ) ( 189,275,342 )Note: The table only contains NTD funds of the headquarters and domestic branches.
II. Analysis for the Structure of USD Due Dates
Dec. 31, 2014; Unit: US$1,000
TotalValue for balance period before due dates
0 to 30 days 31 to 90 days 91 to 180
days 181 days to
one year Over one
year Main fund Inflow Due 27,654,570 10,692,273 6,556,587 3,797,725 3,063,887 3,544,098Main fund Outflow Due 27,521,357 9,651,033 6,640,975 5,666,376 3,524,698 2,038,275Expected Gap 133,213 1,041,240 ( 84,388 ) ( 1,868,651 ) ( 460,811 ) 1,505,823
( c ) Market risk I. Strategy and flow
( i ) The bank’s risk management strategy calls for setting restrictions on capital according to risk adjusted returns rate, whereby seeking maximum value for shareholders. Accordingly, various business units have to seek approved quota before trading and independent risk management units assess income or loss for trading positions daily, in addition to reporting income/loss and risk exposure of trading position to executives regularly.
( ii ) The scope and features of risk report and assessment system( iii ) Risk report is meant to disclose risk as an important reference for executives in formulating
countermeasure and adjusting investment portfolio for achieving business objectives. The bank dedicates to integrating trading management systems for various products, in order to reporting income/loss and risk exposure of trading position immediately.
II. Trading and risk management system( i ) Quality The bank stresses the formulation and implementation of risk management policy and norms, as
well as the establishment of risk management culture. Risk management units are independent from risk undertaking units and responsible for assessing and analyzing risk exposure and reporting the results to executives for use in policy making, in addition to instituting assessment flow, the flow for new product launch, and certification procedure model, in the hope of complying with the regulations of the regulator, precisely assess risking, and standardizing operating and risk management flows.
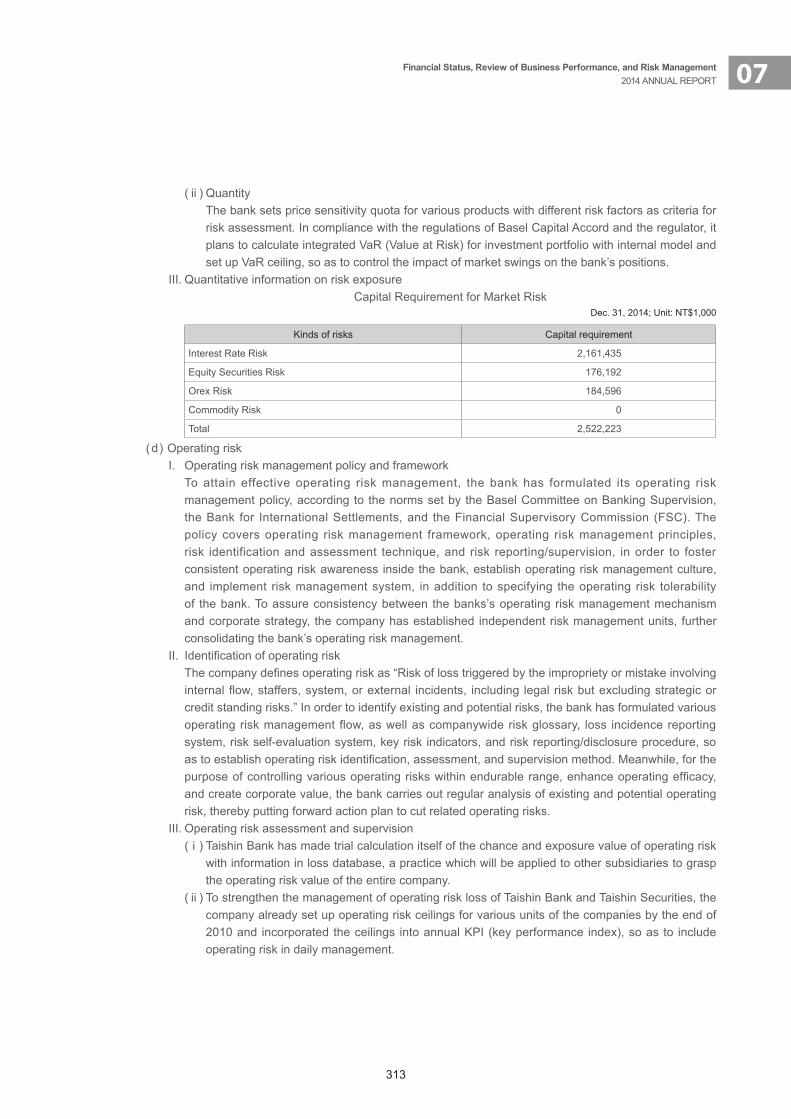
313
07Financial Status, Review of Business Performance, and Risk Management 2014 ANNUAL REPORT
( ii ) Quantity The bank sets price sensitivity quota for various products with different risk factors as criteria for
risk assessment. In compliance with the regulations of Basel Capital Accord and the regulator, it plans to calculate integrated VaR (Value at Risk) for investment portfolio with internal model and set up VaR ceiling, so as to control the impact of market swings on the bank’s positions.
III. Quantitative information on risk exposure Capital Requirement for Market Risk
Dec. 31, 2014; Unit: NT$1,000
Kinds of risks Capital requirement
Interest Rate Risk 2,161,435
Equity Securities Risk 176,192
Orex Risk 184,596
Commodity Risk 0
Total 2,522,223
( d ) Operating riskI. Operating risk management policy and framework To attain effective operating risk management, the bank has formulated its operating risk
management policy, according to the norms set by the Basel Committee on Banking Supervision, the Bank for International Settlements, and the Financial Supervisory Commission (FSC). The policy covers operating risk management framework, operating risk management principles, risk identification and assessment technique, and risk reporting/supervision, in order to foster consistent operating risk awareness inside the bank, establish operating risk management culture, and implement risk management system, in addition to specifying the operating risk tolerability of the bank. To assure consistency between the banks’s operating risk management mechanism and corporate strategy, the company has established independent risk management units, further consolidating the bank’s operating risk management.
II. Identification of operating risk The company defines operating risk as “Risk of loss triggered by the impropriety or mistake involving
internal flow, staffers, system, or external incidents, including legal risk but excluding strategic or credit standing risks.” In order to identify existing and potential risks, the bank has formulated various operating risk management flow, as well as companywide risk glossary, loss incidence reporting system, risk self-evaluation system, key risk indicators, and risk reporting/disclosure procedure, so as to establish operating risk identification, assessment, and supervision method. Meanwhile, for the purpose of controlling various operating risks within endurable range, enhance operating efficacy, and create corporate value, the bank carries out regular analysis of existing and potential operating risk, thereby putting forward action plan to cut related operating risks.
III. Operating risk assessment and supervision( i ) Taishin Bank has made trial calculation itself of the chance and exposure value of operating risk
with information in loss database, a practice which will be applied to other subsidiaries to grasp the operating risk value of the entire company.
( ii ) To strengthen the management of operating risk loss of Taishin Bank and Taishin Securities, the company already set up operating risk ceilings for various units of the companies by the end of 2010 and incorporated the ceilings into annual KPI (key performance index), so as to include operating risk in daily management.
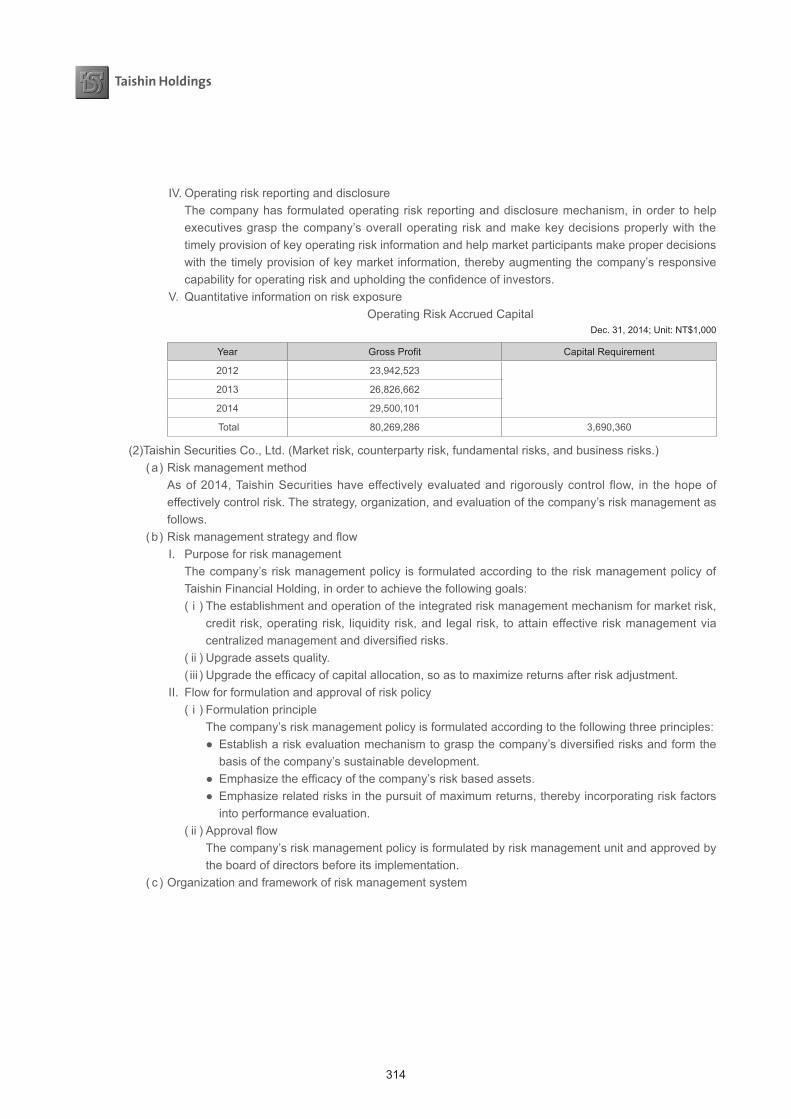
314
IV. Operating risk reporting and disclosure The company has formulated operating risk reporting and disclosure mechanism, in order to help
executives grasp the company’s overall operating risk and make key decisions properly with the timely provision of key operating risk information and help market participants make proper decisions with the timely provision of key market information, thereby augmenting the company’s responsive capability for operating risk and upholding the confidence of investors.
V. Quantitative information on risk exposure Operating Risk Accrued Capital
Dec. 31, 2014; Unit: NT$1,000
Year Gross Profit Capital Requirement
2012 23,942,523
2013 26,826,662
2014 29,500,101
Total 80,269,286 3,690,360
(2) Taishin Securities Co., Ltd. (Market risk, counterparty risk, fundamental risks, and business risks.)( a ) Risk management method As of 2014, Taishin Securities have effectively evaluated and rigorously control flow, in the hope of
effectively control risk. The strategy, organization, and evaluation of the company’s risk management as follows.
( b ) Risk management strategy and flow I. Purpose for risk management The company’s risk management policy is formulated according to the risk management policy of
Taishin Financial Holding, in order to achieve the following goals: ( i ) The establishment and operation of the integrated risk management mechanism for market risk,
credit risk, operating risk, liquidity risk, and legal risk, to attain effective risk management via centralized management and diversified risks.
( ii ) Upgrade assets quality.( iii ) Upgrade the efficacy of capital allocation, so as to maximize returns after risk adjustment.
II. Flow for formulation and approval of risk policy ( i ) Formulation principle The company’s risk management policy is formulated according to the following three principles:
● Establish a risk evaluation mechanism to grasp the company’s diversified risks and form the basis of the company’s sustainable development.
● Emphasize the efficacy of the company’s risk based assets. ● Emphasize related risks in the pursuit of maximum returns, thereby incorporating risk factors
into performance evaluation. ( ii ) Approval flow The company’s risk management policy is formulated by risk management unit and approved by
the board of directors before its implementation. ( c ) Organization and framework of risk management system
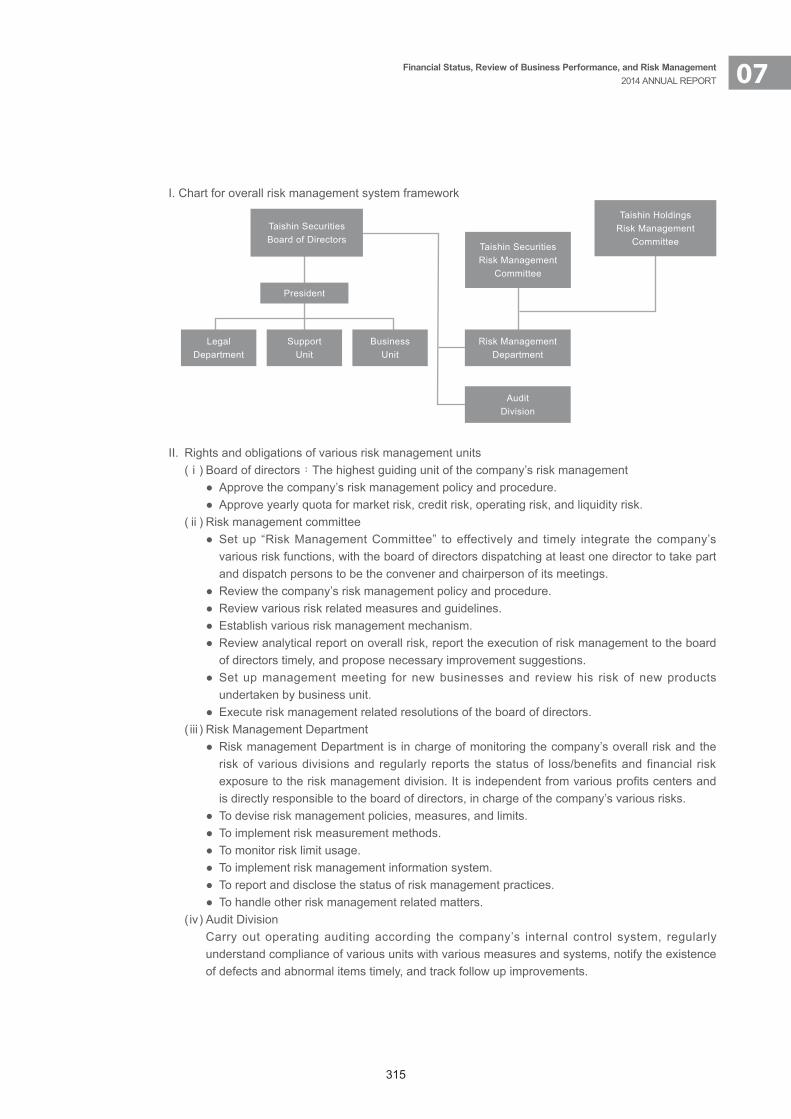
315
07Financial Status, Review of Business Performance, and Risk Management 2014 ANNUAL REPORT
I. Chart for overall risk management system framework
Taishin SecuritiesBoard of Directors
Taishin HoldingsRisk Management
Committee
President
Taishin SecuritiesRisk Management
Committee
AuditDivision
LegalDepartment
SupportUnit
BusinessUnit
Risk ManagementDepartment
II. Rights and obligations of various risk management units
( i ) Board of directors:The highest guiding unit of the company’s risk management● Approve the company’s risk management policy and procedure. ● Approve yearly quota for market risk, credit risk, operating risk, and liquidity risk.
( ii ) Risk management committee ● Set up “Risk Management Committee” to effectively and timely integrate the company’s
various risk functions, with the board of directors dispatching at least one director to take part and dispatch persons to be the convener and chairperson of its meetings.
● Review the company’s risk management policy and procedure. ● Review various risk related measures and guidelines. ● Establish various risk management mechanism. ● Review analytical report on overall risk, report the execution of risk management to the board
of directors timely, and propose necessary improvement suggestions. ● Set up management meeting for new businesses and review his risk of new products
undertaken by business unit. ● Execute risk management related resolutions of the board of directors.
( iii ) Risk Management Department ● Risk management Department is in charge of monitoring the company’s overall risk and the
risk of various divisions and regularly reports the status of loss/benefits and financial risk exposure to the risk management division. It is independent from various profits centers and is directly responsible to the board of directors, in charge of the company’s various risks.
● To devise risk management policies, measures, and limits. ● To implement risk measurement methods.● To monitor risk limit usage.● To implement risk management information system.● To report and disclose the status of risk management practices. ● To handle other risk management related matters.
( iv ) Audit Division Carry out operating auditing according the company’s internal control system, regularly
understand compliance of various units with various measures and systems, notify the existence of defects and abnormal items timely, and track follow up improvements.
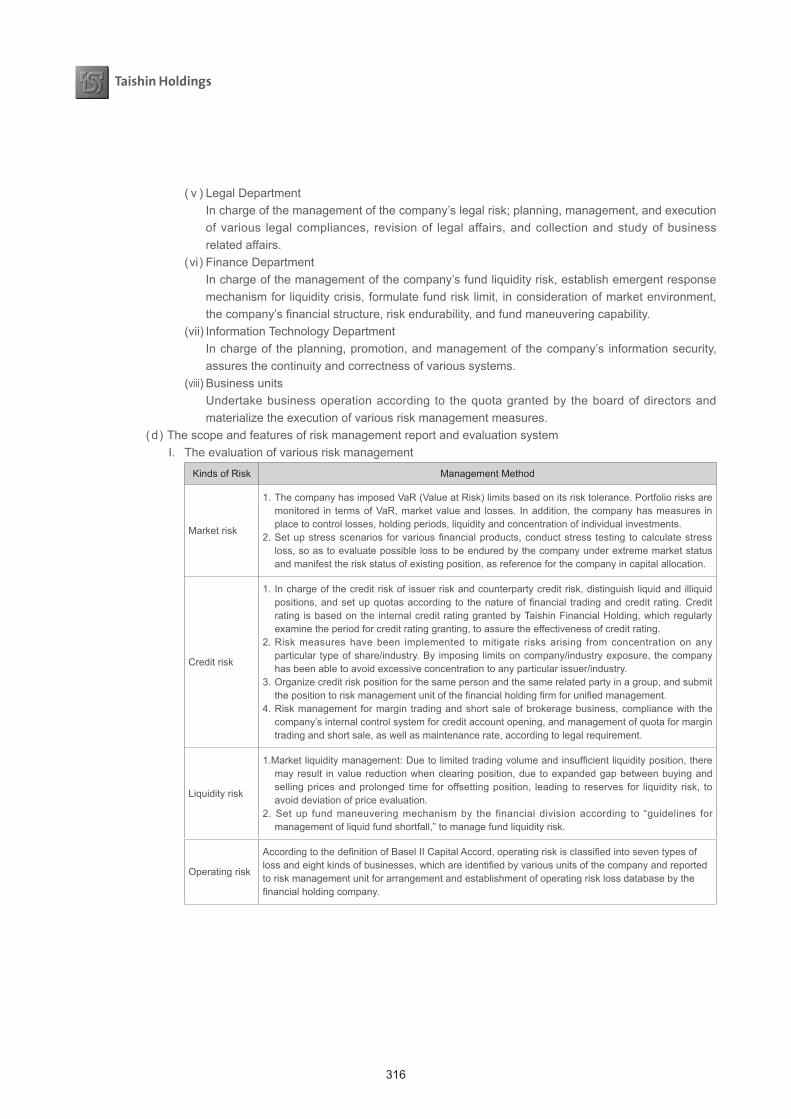
316
( v ) Legal Department In charge of the management of the company’s legal risk; planning, management, and execution
of various legal compliances, revision of legal affairs, and collection and study of business related affairs.
( vi ) Finance Department In charge of the management of the company’s fund liquidity risk, establish emergent response
mechanism for liquidity crisis, formulate fund risk limit, in consideration of market environment, the company’s financial structure, risk endurability, and fund maneuvering capability.
( vii ) Information Technology Department In charge of the planning, promotion, and management of the company’s information security,
assures the continuity and correctness of various systems. ( viii ) Business units Undertake business operation according to the quota granted by the board of directors and
materialize the execution of various risk management measures. ( d ) The scope and features of risk management report and evaluation system
I. The evaluation of various risk management
Kinds of Risk Management Method
Market risk
1. The company has imposed VaR (Value at Risk) limits based on its risk tolerance. Portfolio risks are monitored in terms of VaR, market value and losses. In addition, the company has measures in place to control losses, holding periods, liquidity and concentration of individual investments.
2. Set up stress scenarios for various financial products, conduct stress testing to calculate stress loss, so as to evaluate possible loss to be endured by the company under extreme market status and manifest the risk status of existing position, as reference for the company in capital allocation.
Credit risk
1. In charge of the credit risk of issuer risk and counterparty credit risk, distinguish liquid and illiquid positions, and set up quotas according to the nature of financial trading and credit rating. Credit rating is based on the internal credit rating granted by Taishin Financial Holding, which regularly examine the period for credit rating granting, to assure the effectiveness of credit rating.
2. Risk measures have been implemented to mitigate risks arising from concentration on any particular type of share/industry. By imposing limits on company/industry exposure, the company has been able to avoid excessive concentration to any particular issuer/industry.
3. Organize credit risk position for the same person and the same related party in a group, and submit the position to risk management unit of the financial holding firm for unified management.
4. Risk management for margin trading and short sale of brokerage business, compliance with the company’s internal control system for credit account opening, and management of quota for margin trading and short sale, as well as maintenance rate, according to legal requirement.
Liquidity risk
1.Market liquidity management: Due to limited trading volume and insufficient liquidity position, there may result in value reduction when clearing position, due to expanded gap between buying and selling prices and prolonged time for offsetting position, leading to reserves for liquidity risk, to avoid deviation of price evaluation.
2. Set up fund maneuvering mechanism by the financial division according to “guidelines for management of liquid fund shortfall,” to manage fund liquidity risk.
Operating risk
According to the definition of Basel II Capital Accord, operating risk is classified into seven types of loss and eight kinds of businesses, which are identified by various units of the company and reported to risk management unit for arrangement and establishment of operating risk loss database by the financial holding company.
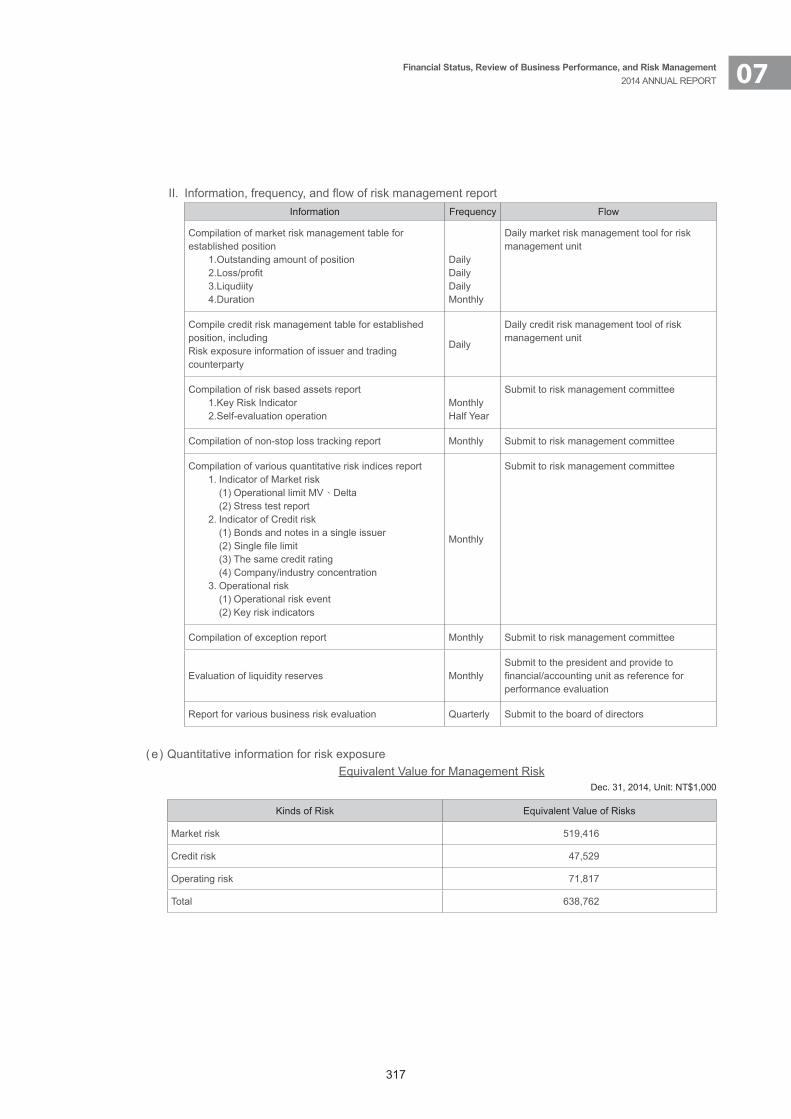
317
07Financial Status, Review of Business Performance, and Risk Management 2014 ANNUAL REPORT
II. Information, frequency, and flow of risk management reportInformation Frequency Flow
Compilation of market risk management table for established position 1.Outstanding amount of position 2.Loss/profit 3.Liqudiity 4.Duration
DailyDailyDailyMonthly
Daily market risk management tool for risk management unit
Compile credit risk management table for established position, includingRisk exposure information of issuer and trading counterparty
Daily
Daily credit risk management tool of risk management unit
Compilation of risk based assets report 1.Key Risk Indicator 2.Self-evaluation operation
Monthly Half Year
Submit to risk management committee
Compilation of non-stop loss tracking report Monthly Submit to risk management committee
Compilation of various quantitative risk indices report 1. Indicator of Market risk (1)Operational limit MV、Delta (2)Stress test report 2. Indicator of Credit risk (1) Bonds and notes in a single issuer (2) Single file limit (3) The same credit rating (4) Company/industry concentration 3. Operational risk (1)Operational risk event (2)Key risk indicators
Monthly
Submit to risk management committee
Compilation of exception report Monthly Submit to risk management committee
Evaluation of liquidity reserves Monthly Submit to the president and provide to financial/accounting unit as reference for performance evaluation
Report for various business risk evaluation Quarterly Submit to the board of directors
( e ) Quantitative information for risk exposure Equivalent Value for Management Risk
Dec. 31, 2014, Unit: NT$1,000
Kinds of Risk Equivalent Value of Risks
Market risk 519,416
Credit risk 47,529
Operating risk 71,817
Total 638,762
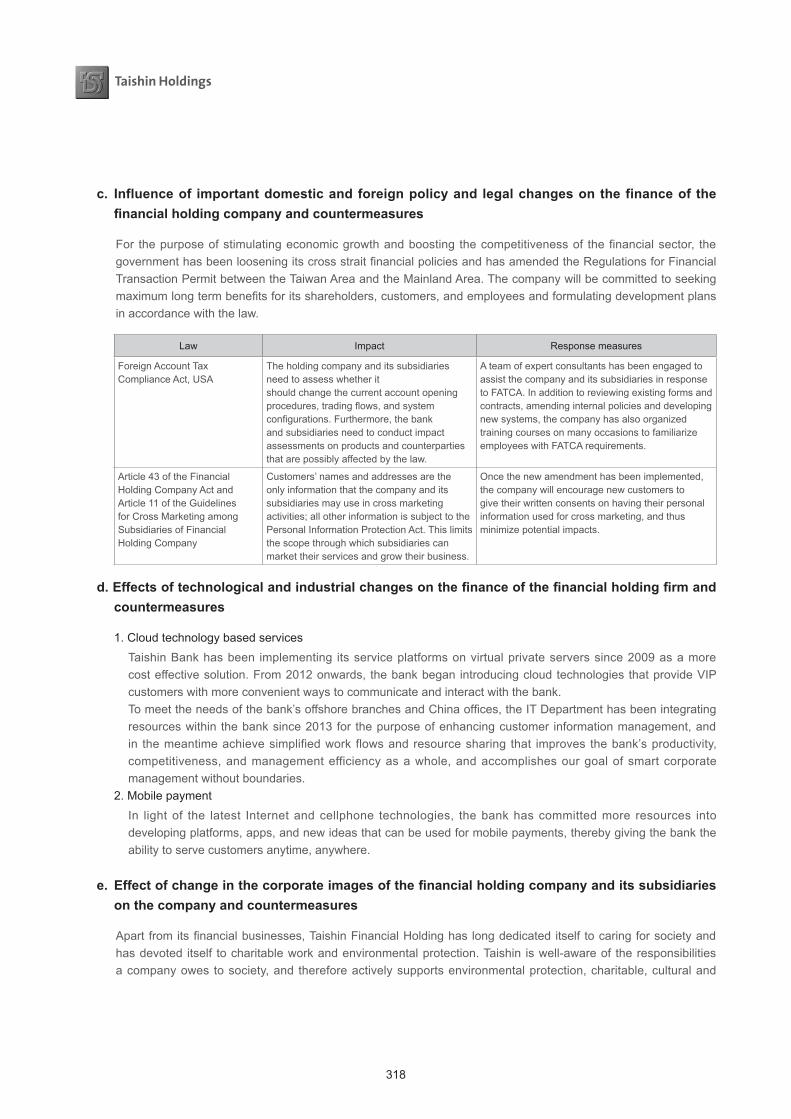
318
c. Influenceof importantdomesticandforeignpolicyandlegalchangesonthefinanceofthefinancialholdingcompanyandcountermeasures
For the purpose of stimulating economic growth and boosting the competitiveness of the financial sector, the government has been loosening its cross strait financial policies and has amended the Regulations for Financial Transaction Permit between the Taiwan Area and the Mainland Area. The company will be committed to seeking maximum long term benefits for its shareholders, customers, and employees and formulating development plans in accordance with the law.
Law Impact Response measures
Foreign Account Tax Compliance Act, USA
The holding company and its subsidiaries need to assess whether itshould change the current account opening procedures, trading flows, and system configurations. Furthermore, the bank and subsidiaries need to conduct impact assessments on products and counterparties that are possibly affected by the law.
A team of expert consultants has been engaged to assist the company and its subsidiaries in response to FATCA. In addition to reviewing existing forms and contracts, amending internal policies and developing new systems, the company has also organized training courses on many occasions to familiarize employees with FATCA requirements.
Article 43 of the Financial Holding Company Act and Article 11 of the Guidelines for Cross Marketing among Subsidiaries of Financial Holding Company
Customers’ names and addresses are the only information that the company and its subsidiaries may use in cross marketing activities; all other information is subject to the Personal Information Protection Act. This limits the scope through which subsidiaries can market their services and grow their business.
Once the new amendment has been implemented, the company will encourage new customers to give their written consents on having their personal information used for cross marketing, and thus minimize potential impacts.
d.Effectsoftechnologicalandindustrialchangesonthefinanceofthefinancialholdingfirmandcountermeasures
1. Cloud technology based services Taishin Bank has been implementing its service platforms on virtual private servers since 2009 as a more
cost effective solution. From 2012 onwards, the bank began introducing cloud technologies that provide VIP customers with more convenient ways to communicate and interact with the bank.
To meet the needs of the bank’s offshore branches and China offices, the IT Department has been integrating resources within the bank since 2013 for the purpose of enhancing customer information management, and in the meantime achieve simplified work flows and resource sharing that improves the bank’s productivity, competitiveness, and management efficiency as a whole, and accomplishes our goal of smart corporate management without boundaries.
2. Mobile payment In light of the latest Internet and cellphone technologies, the bank has committed more resources into
developing platforms, apps, and new ideas that can be used for mobile payments, thereby giving the bank the ability to serve customers anytime, anywhere.
e. Effectofchangeinthecorporateimagesofthefinancialholdingcompanyanditssubsidiariesonthecompanyandcountermeasures
Apart from its financial businesses, Taishin Financial Holding has long dedicated itself to caring for society and has devoted itself to charitable work and environmental protection. Taishin is well-aware of the responsibilities a company owes to society, and therefore actively supports environmental protection, charitable, cultural and
319
07Financial Status, Review of Business Performance, and Risk Management 2014 ANNUAL REPORT
artistic activities, in the hope of bringing about social change and real benefits for the socially disadvantaged, and fulfilling its role as a member of society.
f. Anticipatedbenefitsandpossiblerisksfromacquisitionandcountermeasures
1. Anticipated benefits(1) Expand financial scope, enhance the scale of assets and market share ranking, and boost business
competitiveness.(2) Expand marketing channel network and provide clients more convenient and pluralized service channels.(3) Create the business synergy of acquisition and maximize the profits for shareholders.(4) Provide all round services and deep cultivate the relationship with clients.(5) Diversify business risks and expand the scope of business development.
2. Possible risks(1) Inadequate business integration can lead to business loss, affecting the company’ business and profit
performance.(2) Inadequate integration of information systems may affect business operation, deferring the appearance of
merger synergy.(3) Inadequate integration of human resources may lead to loss of talents, indirectly affecting business and
management performance.(4) The integration of corporate culture and organization did not proceed as expected, and hence the synergies
expected from the merger were not delivered.(5) The effect of misjudgment in acquisition strategy on the overall development outlook of the company.
g.Possiblerisksfrombusinessconcentrationandcountermeasures
1. Back up mechanism The concentration of operation has led to sharing of resources and manpower, a status which could magnify
the effect of emergent incidents on the bank. To cope with possible risk, the Risk Management Division of the financial holding company has formulated integrated business continuity plan, which covers emergency response mode for venue, system, and personnel, as well as disaster recovery plan. The integration of corporate culture and organization did not proceed as expected, and hence the synergies expected from the merger were not delivered.
2. Document delivery In the wake of operating concentration, internal transmission or delivery of original copies of document may
result in information leakage of loss of documents, thereby causing serious consequence on the customers and the bank. To prevent the problems, the bank keeps the track for signed reception and formulates complete delivery rules for the delivery of key documents.
h. Influenceofmassivesharetransferorexchangebyboarddirectors,supervisors,ormajorshareholders with over 1% stake, risk, and countermeasures
Due to the diversified shareholding of the company and low stake of a single shareholder, massive shareholding transfer or exchange would not impact the makeup of the company’s shareholders or produce major influence or risk.
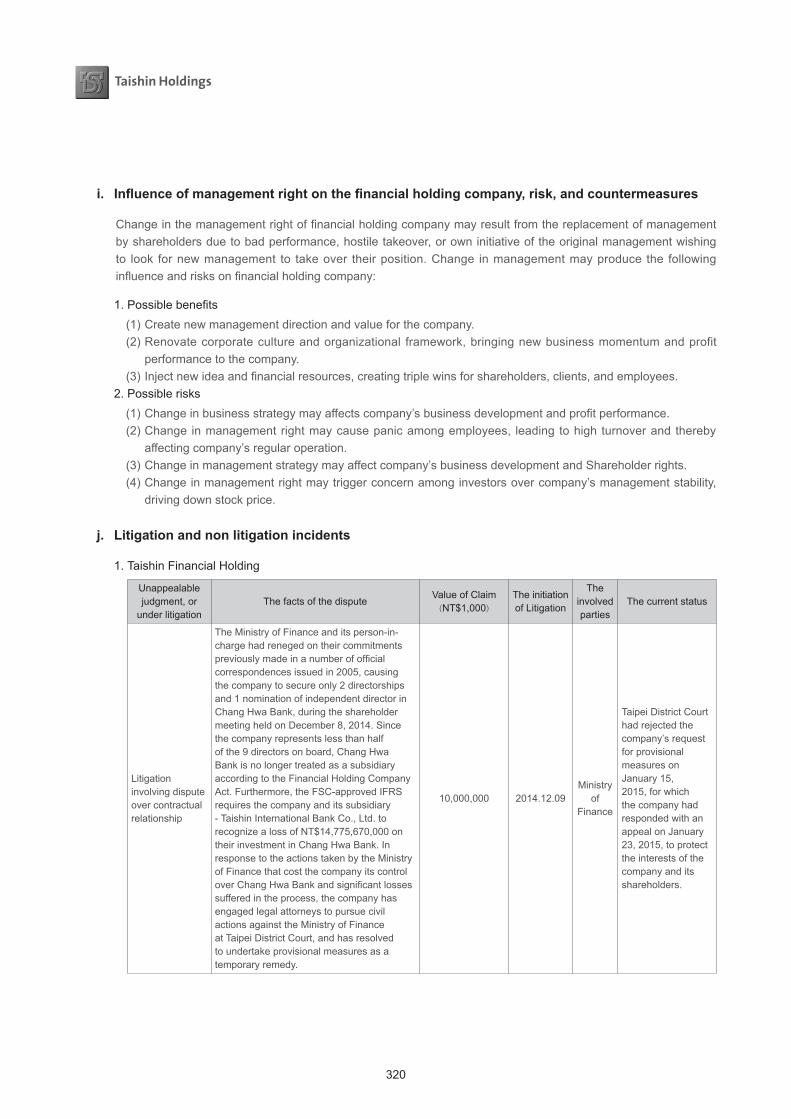
320
i. Influenceofmanagementrightonthefinancialholdingcompany,risk,andcountermeasures
Change in the management right of financial holding company may result from the replacement of management by shareholders due to bad performance, hostile takeover, or own initiative of the original management wishing to look for new management to take over their position. Change in management may produce the following influence and risks on financial holding company:
1. Possible benefits(1) Create new management direction and value for the company.(2) Renovate corporate culture and organizational framework, bringing new business momentum and profit
performance to the company.(3) Inject new idea and financial resources, creating triple wins for shareholders, clients, and employees.
2. Possible risks(1) Change in business strategy may affects company’s business development and profit performance.(2) Change in management right may cause panic among employees, leading to high turnover and thereby
affecting company’s regular operation.(3) Change in management strategy may affect company’s business development and Shareholder rights.(4) Change in management right may trigger concern among investors over company’s management stability,
driving down stock price.
j. Litigationandnonlitigationincidents
1. Taishin Financial Holding
Unappealable judgment, or
under litigationThe facts of the dispute
Value of Claim(NT$1,000)
The initiation of Litigation
The involved parties
The current status
Litigation involving dispute over contractual relationship
The Ministry of Finance and its person-in-charge had reneged on their commitments previously made in a number of official correspondences issued in 2005, causing the company to secure only 2 directorships and 1 nomination of independent director in Chang Hwa Bank, during the shareholder meeting held on December 8, 2014. Since the company represents less than half of the 9 directors on board, Chang Hwa Bank is no longer treated as a subsidiary according to the Financial Holding Company Act. Furthermore, the FSC-approved IFRS requires the company and its subsidiary - Taishin International Bank Co., Ltd. to recognize a loss of NT$14,775,670,000 on their investment in Chang Hwa Bank. In response to the actions taken by the Ministry of Finance that cost the company its control over Chang Hwa Bank and significant losses suffered in the process, the company has engaged legal attorneys to pursue civil actions against the Ministry of Finance at Taipei District Court, and has resolved to undertake provisional measures as a temporary remedy.
10,000,000 2014.12.09Ministry
of Finance
Taipei District Court had rejected the company’s request for provisional measures on January 15, 2015, for which the company had responded with an appeal on January 23, 2015, to protect the interests of the company and its shareholders.
321
07Financial Status, Review of Business Performance, and Risk Management 2014 ANNUAL REPORT
2. Taishin International Bank: Nil.3. Taishin Securities: Nil.4. Taishin Asset Management:Nil.5. Taishin Venture Capital: Nil.6. Taishin Securities Investment Trust: Nil.7. Taishin Securities Investment Advisory: Nil.8. Taishin Holdings Insurance Brokers: Nil.
k. Other key risks and countermeasures: Nil.
G.Crisismanagementandresponsemechanism
To assure the uninterrupted operation of the company’s major business activities, strengthen the company’s responsive capability for emergent incidents, and minimize the influence of disaster and resume normal operation within the shortest time possible, the company has formulated the BCM (Business Contingency Management), specifying the definition of emergent incidents, grading risks, and pinpointing responsibilities, and related handling procedure.
H.OtherImportantitems:Nil.

08SpecialNotes
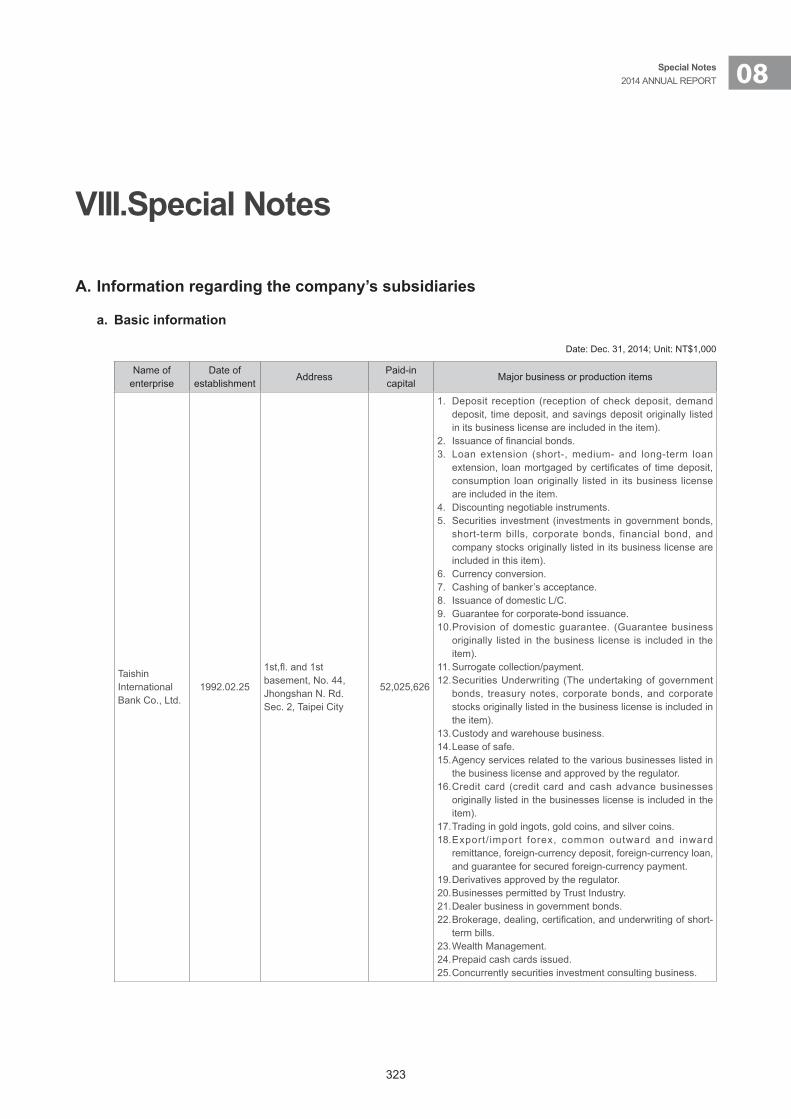
323
08Special Notes 2014 ANNUAL REPORT
VIII.SpecialNotes
A.Informationregardingthecompany’ssubsidiaries
a. Basic information
Date: Dec. 31, 2014; Unit: NT$1,000
Name of enterprise
Date of establishment
AddressPaid-in capital
Major business or production items
Taishin International Bank Co., Ltd.
1992.02.25
1st,fl. and 1st basement, No. 44, Jhongshan N. Rd. Sec. 2, Taipei City
52,025,626
1. Deposit reception (reception of check deposit, demand deposit, time deposit, and savings deposit originally listed in its business license are included in the item).
2. Issuance of financial bonds.3. Loan extension (short-, medium- and long-term loan
extension, loan mortgaged by certificates of time deposit, consumption loan originally listed in its business license are included in the item.
4. Discounting negotiable instruments.5. Securities investment (investments in government bonds,
short-term bills, corporate bonds, financial bond, and company stocks originally listed in its business license are included in this item).
6. Currency conversion.7. Cashing of banker’s acceptance.8. Issuance of domestic L/C.9. Guarantee for corporate-bond issuance.10.Provision of domestic guarantee. (Guarantee business
originally listed in the business license is included in the item).
11. Surrogate collection/payment.12. Securities Underwriting (The undertaking of government
bonds, treasury notes, corporate bonds, and corporate stocks originally listed in the business license is included in the item).
13. Custody and warehouse business.14. Lease of safe.15. Agency services related to the various businesses listed in
the business license and approved by the regulator.16. Credit card (credit card and cash advance businesses
originally listed in the businesses license is included in the item).
17. Trading in gold ingots, gold coins, and silver coins.18. Export/ import forex, common outward and inward
remittance, foreign-currency deposit, foreign-currency loan, and guarantee for secured foreign-currency payment.
19. Derivatives approved by the regulator.20. Businesses permitted by Trust Industry. 21. Dealer business in government bonds.22. Brokerage, dealing, certification, and underwriting of short-
term bills.23. Wealth Management.24. Prepaid cash cards issued.25. Concurrently securities investment consulting business.
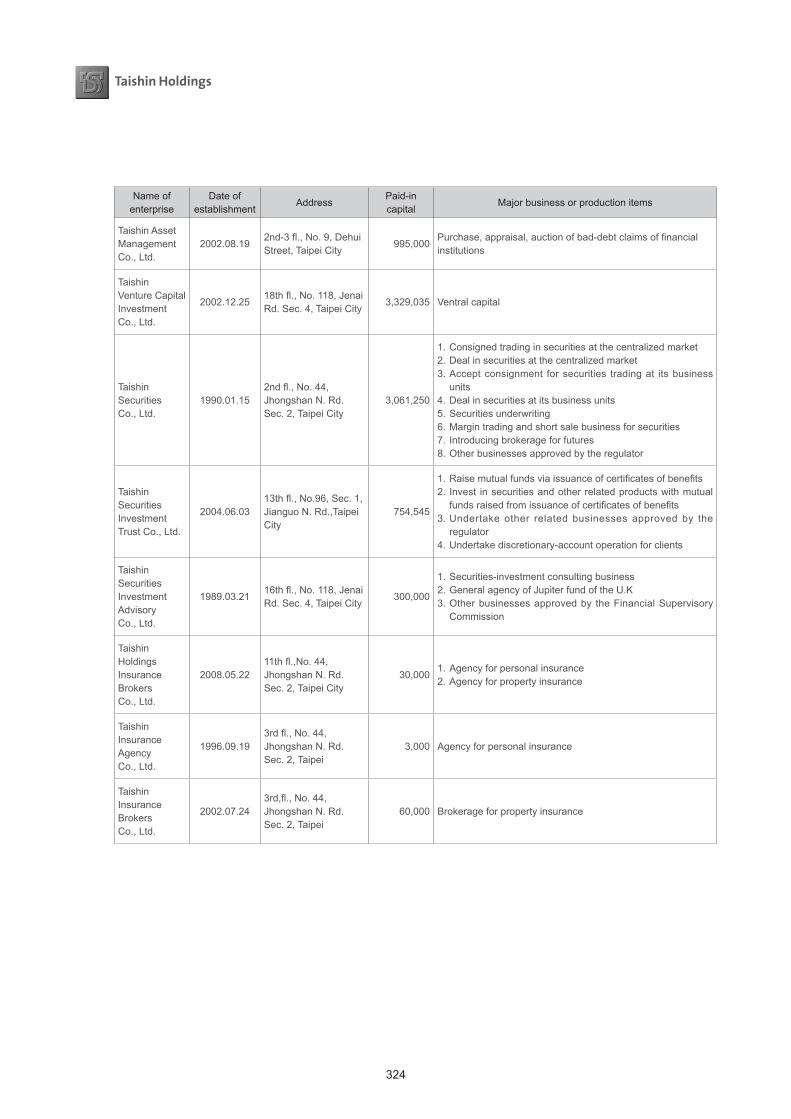
324
Name of enterprise
Date of establishment
AddressPaid-in capital
Major business or production items
Taishin Asset Management Co., Ltd.
2002.08.192nd-3 fl., No. 9, Dehui Street, Taipei City
995,000Purchase, appraisal, auction of bad-debt claims of financial institutions
Taishin Venture Capital Investment Co., Ltd.
2002.12.2518th fl., No. 118, Jenai Rd. Sec. 4, Taipei City
3,329,035 Ventral capital
Taishin SecuritiesCo., Ltd.
1990.01.15 2nd fl., No. 44, Jhongshan N. Rd. Sec. 2, Taipei City
3,061,250
1. Consigned trading in securities at the centralized market2. Deal in securities at the centralized market3. Accept consignment for securities trading at its business
units4. Deal in securities at its business units5. Securities underwriting6. Margin trading and short sale business for securities7. Introducing brokerage for futures8. Other businesses approved by the regulator
Taishin Securities Investment Trust Co., Ltd.
2004.06.0313th fl., No.96, Sec. 1, Jianguo N. Rd.,Taipei City
754,545
1. Raise mutual funds via issuance of certificates of benefits 2. Invest in securities and other related products with mutual
funds raised from issuance of certificates of benefits3. Undertake other related businesses approved by the
regulator4. Undertake discretionary-account operation for clients
Taishin Securities Investment Advisory Co., Ltd.
1989.03.2116th fl., No. 118, Jenai Rd. Sec. 4, Taipei City
300,000
1. Securities-investment consulting business2. General agency of Jupiter fund of the U.K3. Other businesses approved by the Financial Supervisory
Commission
Taishin Holdings Insurance Brokers Co., Ltd.
2008.05.2211th fl.,No. 44, Jhongshan N. Rd. Sec. 2, Taipei City
30,0001. Agency for personal insurance2. Agency for property insurance
Taishin Insurance Agency Co., Ltd.
1996.09.193rd fl., No. 44, Jhongshan N. Rd. Sec. 2, Taipei
3,000 Agency for personal insurance
Taishin Insurance Brokers Co., Ltd.
2002.07.243rd,fl., No. 44, Jhongshan N. Rd. Sec. 2, Taipei
60,000 Brokerage for property insurance
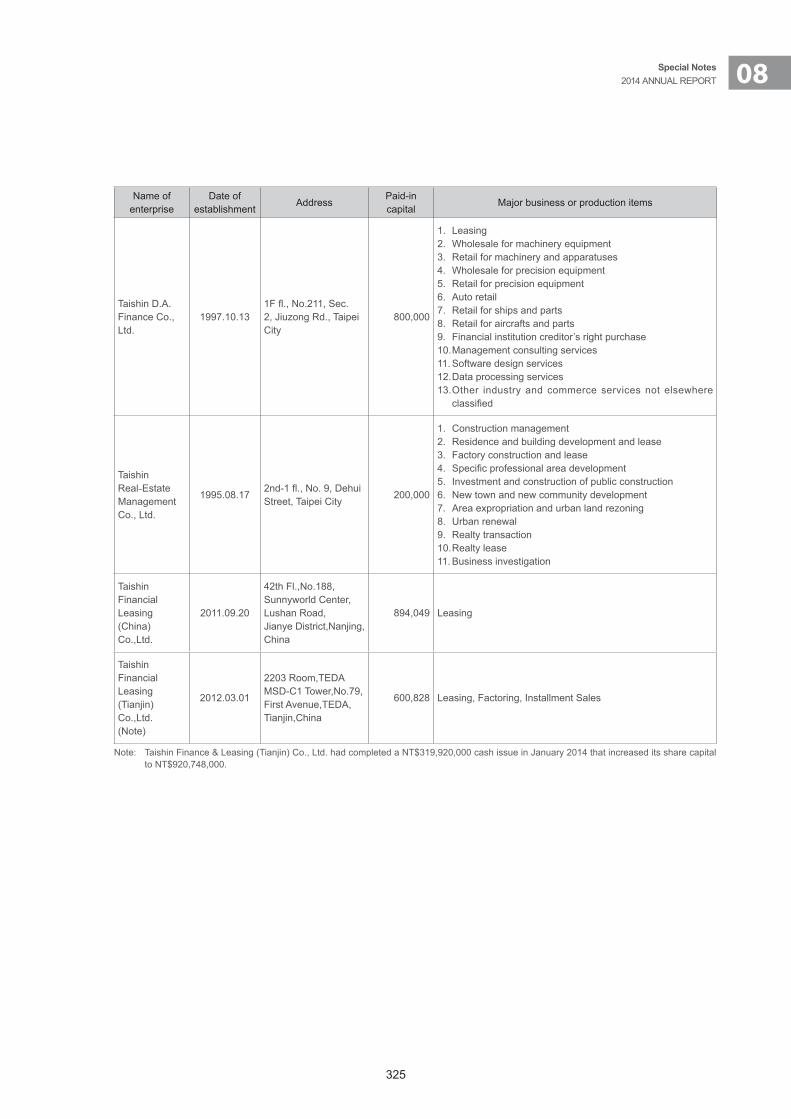
325
08Special Notes 2014 ANNUAL REPORT
Name of enterprise
Date of establishment
AddressPaid-in capital
Major business or production items
Taishin D.A. Finance Co., Ltd.
1997.10.131F fl., No.211, Sec. 2, Jiuzong Rd., Taipei City
800,000
1. Leasing2. Wholesale for machinery equipment3. Retail for machinery and apparatuses4. Wholesale for precision equipment5. Retail for precision equipment6. Auto retail 7. Retail for ships and parts8. Retail for aircrafts and parts9. Financial institution creditor’s right purchase10. Management consulting services11. Software design services12. Data processing services13. Other industry and commerce services not elsewhere
classified
Taishin Real-Estate Management Co., Ltd.
1995.08.172nd-1 fl., No. 9, Dehui Street, Taipei City
200,000
1. Construction management2. Residence and building development and lease3. Factory construction and lease4. Specific professional area development5. Investment and construction of public construction6. New town and new community development7. Area expropriation and urban land rezoning8. Urban renewal9. Realty transaction10. Realty lease11. Business investigation
Taishin Financial Leasing (China) Co.,Ltd.
2011.09.20
42th Fl.,No.188,Sunnyworld Center,Lushan Road,Jianye District,Nanjing,China
894,049 Leasing
Taishin Financial Leasing (Tianjin)Co.,Ltd.(Note)
2012.03.01
2203 Room,TEDA MSD-C1Tower,No.79,First Avenue,TEDA,Tianjin,China
600,828 Leasing, Factoring, Installment Sales
Note: Taishin Finance & Leasing (Tianjin) Co., Ltd. had completed a NT$319,920,000 cash issue in January 2014 that increased its share capital to NT$920,748,000.
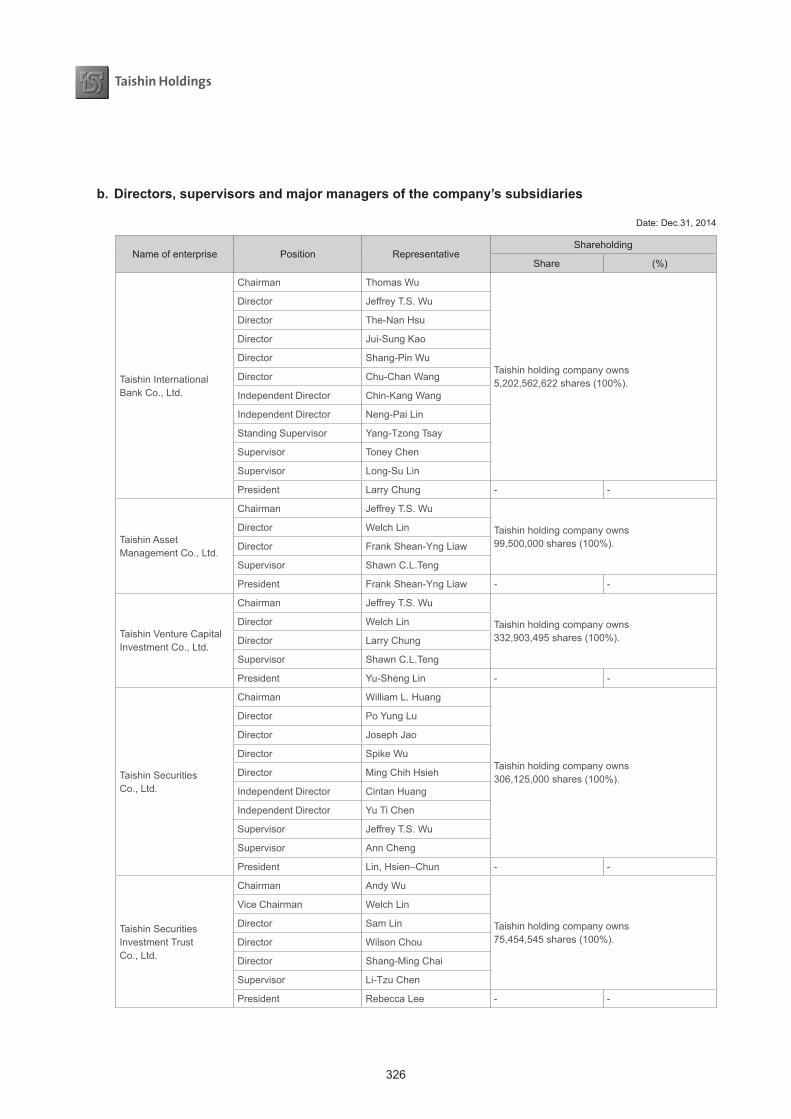
326
b.Directors,supervisorsandmajormanagersofthecompany’ssubsidiaries
Date: Dec.31, 2014
Name of enterprise Position RepresentativeShareholding
Share (%)
Taishin International Bank Co., Ltd.
Chairman Thomas Wu
Taishin holding company owns 5,202,562,622 shares (100%).
Director Jeffrey T.S. Wu
Director The-Nan Hsu
Director Jui-Sung Kao
Director Shang-Pin Wu
Director Chu-Chan Wang
IndependentDirector Chin-Kang Wang
IndependentDirector Neng-Pai Lin
StandingSupervisor Yang-Tzong Tsay
Supervisor Toney Chen
Supervisor Long-Su Lin
President Larry Chung - -
Taishin Asset Management Co., Ltd.
Chairman Jeffrey T.S. Wu
Taishin holding company owns 99,500,000 shares (100%).
Director Welch Lin
Director Frank Shean-Yng Liaw
Supervisor Shawn C.L.Teng
President Frank Shean-Yng Liaw - -
Taishin Venture Capital Investment Co., Ltd.
Chairman Jeffrey T.S. Wu
Taishin holding company owns 332,903,495 shares (100%).
Director Welch Lin
Director Larry Chung
Supervisor Shawn C.L.Teng
President Yu-Sheng Lin - -
Taishin Securities Co., Ltd.
Chairman William L. Huang
Taishin holding company owns 306,125,000 shares (100%).
Director Po Yung Lu
Director Joseph Jao
Director Spike Wu
Director Ming Chih Hsieh
IndependentDirector Cintan Huang
IndependentDirector Yu Ti Chen
Supervisor Jeffrey T.S. Wu
Supervisor Ann Cheng
President Lin, Hsien–Chun - -
Taishin Securities Investment Trust Co., Ltd.
Chairman Andy Wu
Taishin holding company owns 75,454,545 shares (100%).
ViceChairman Welch Lin
Director Sam Lin
Director Wilson Chou
Director Shang-Ming Chai
Supervisor Li-Tzu Chen
President Rebecca Lee - -
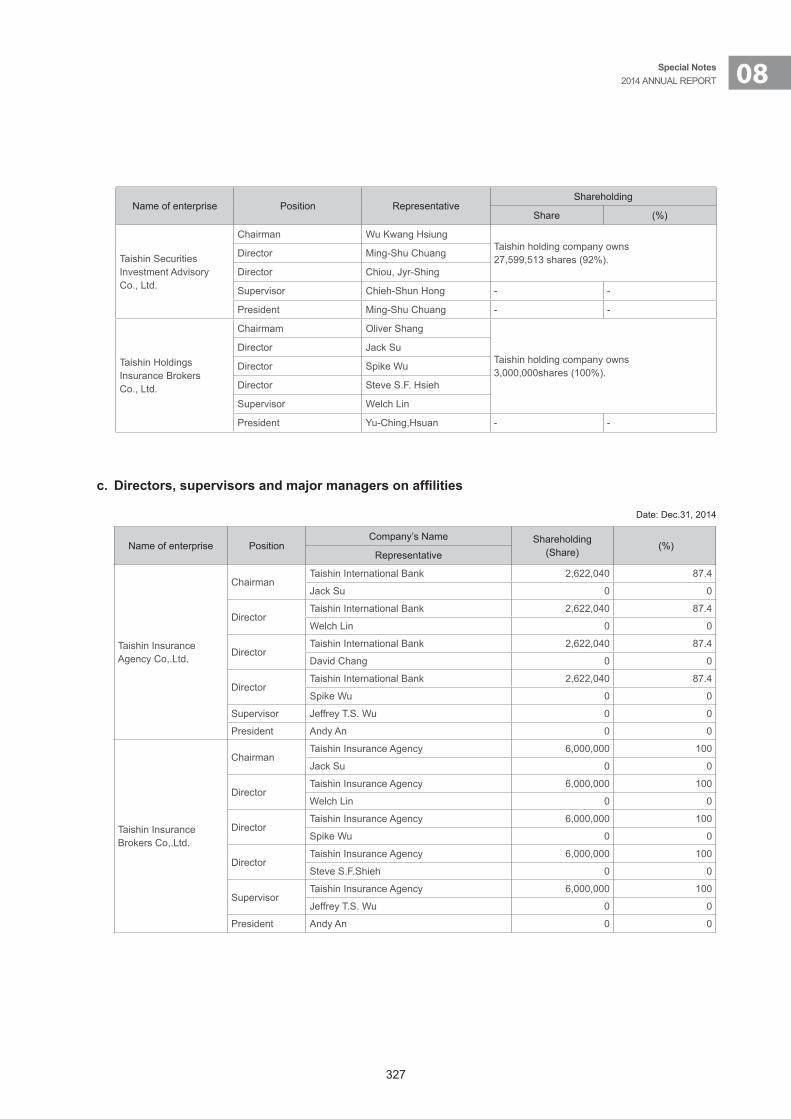
327
08Special Notes 2014 ANNUAL REPORT
Name of enterprise Position RepresentativeShareholding
Share (%)
Taishin Securities Investment Advisory Co., Ltd.
Chairman Wu Kwang HsiungTaishin holding company owns 27,599,513 shares (92%).
Director Ming-Shu Chuang
Director Chiou, Jyr-Shing
Supervisor Chieh-Shun Hong - -
President Ming-Shu Chuang - -
Taishin Holdings Insurance Brokers Co., Ltd.
Chairmam Oliver Shang
Taishin holding company owns 3,000,000shares (100%).
Director Jack Su
Director Spike Wu
Director Steve S.F. Hsieh
Supervisor Welch Lin
President Yu-Ching,Hsuan - -
c. Directors,supervisorsandmajormanagersonaffilities
Date: Dec.31, 2014
Name of enterprise PositionCompany’s Name Shareholding
(Share) (%)
Representative
Taishin Insurance Agency Co,.Ltd.
ChairmanTaishin International Bank 2,622,040 87.4
Jack Su 0 0
DirectorTaishin International Bank 2,622,040 87.4
Welch Lin 0 0
DirectorTaishin International Bank 2,622,040 87.4
David Chang 0 0
DirectorTaishin International Bank 2,622,040 87.4
Spike Wu 0 0
Supervisor Jeffrey T.S. Wu 0 0
President Andy An 0 0
Taishin Insurance Brokers Co,.Ltd.
ChairmanTaishin Insurance Agency 6,000,000 100
Jack Su 0 0
DirectorTaishin Insurance Agency 6,000,000 100
Welch Lin 0 0
DirectorTaishin Insurance Agency 6,000,000 100
Spike Wu 0 0
DirectorTaishin Insurance Agency 6,000,000 100
Steve S.F.Shieh 0 0
SupervisorTaishin Insurance Agency 6,000,000 100
Jeffrey T.S. Wu 0 0
President Andy An 0 0
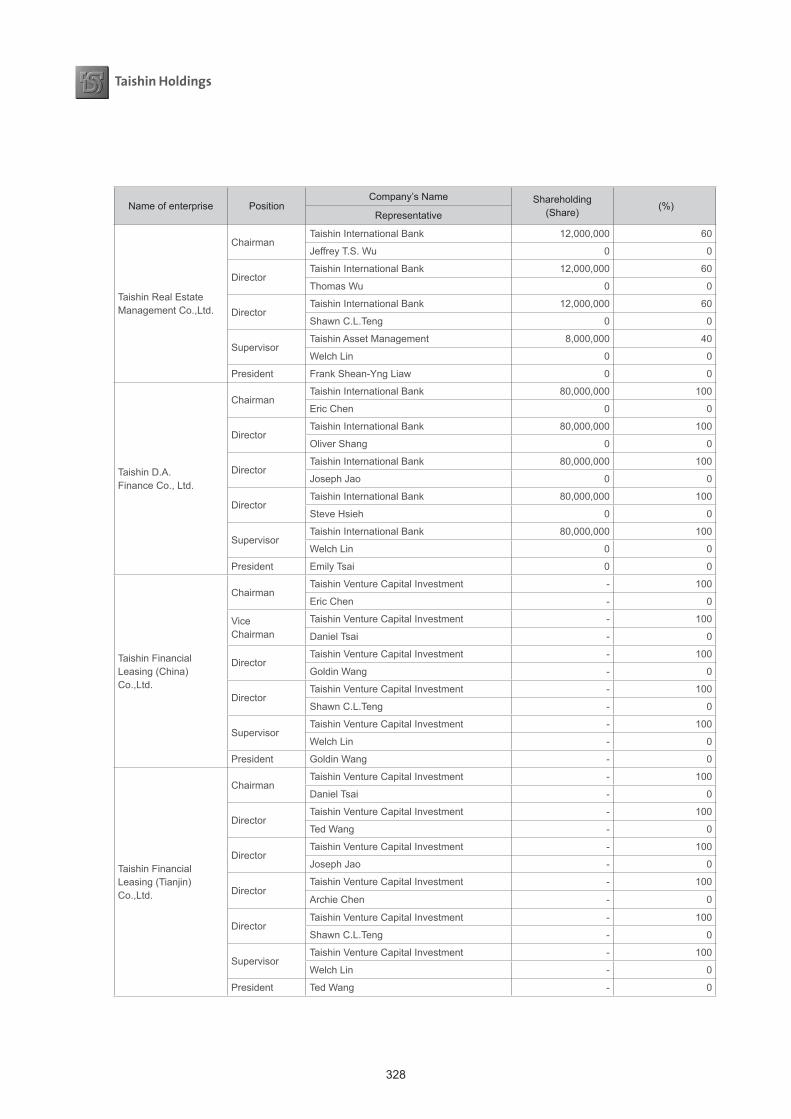
328
Name of enterprise PositionCompany’s Name Shareholding
(Share) (%)
Representative
Taishin Real Estate Management Co.,Ltd.
ChairmanTaishin International Bank 12,000,000 60
Jeffrey T.S. Wu 0 0
DirectorTaishin International Bank 12,000,000 60
Thomas Wu 0 0
DirectorTaishin International Bank 12,000,000 60
Shawn C.L.Teng 0 0
SupervisorTaishin Asset Management 8,000,000 40
Welch Lin 0 0
President Frank Shean-Yng Liaw 0 0
Taishin D.A. Finance Co., Ltd.
ChairmanTaishin International Bank 80,000,000 100
Eric Chen 0 0
DirectorTaishin International Bank 80,000,000 100
Oliver Shang 0 0
DirectorTaishin International Bank 80,000,000 100
Joseph Jao 0 0
DirectorTaishin International Bank 80,000,000 100
Steve Hsieh 0 0
SupervisorTaishin International Bank 80,000,000 100
Welch Lin 0 0
President Emily Tsai 0 0
Taishin Financial Leasing (China) Co.,Ltd.
ChairmanTaishin Venture Capital Investment - 100
Eric Chen - 0
ViceChairman
Taishin Venture Capital Investment - 100
Daniel Tsai - 0
DirectorTaishin Venture Capital Investment - 100
Goldin Wang - 0
DirectorTaishin Venture Capital Investment - 100
Shawn C.L.Teng - 0
SupervisorTaishin Venture Capital Investment - 100
Welch Lin - 0
President Goldin Wang - 0
Taishin Financial Leasing (Tianjin)Co.,Ltd.
ChairmanTaishin Venture Capital Investment - 100
Daniel Tsai - 0
DirectorTaishin Venture Capital Investment - 100
Ted Wang - 0
DirectorTaishin Venture Capital Investment - 100
Joseph Jao - 0
DirectorTaishin Venture Capital Investment - 100
Archie Chen - 0
DirectorTaishin Venture Capital Investment - 100
Shawn C.L.Teng - 0
SupervisorTaishin Venture Capital Investment - 100
Welch Lin - 0
President Ted Wang - 0
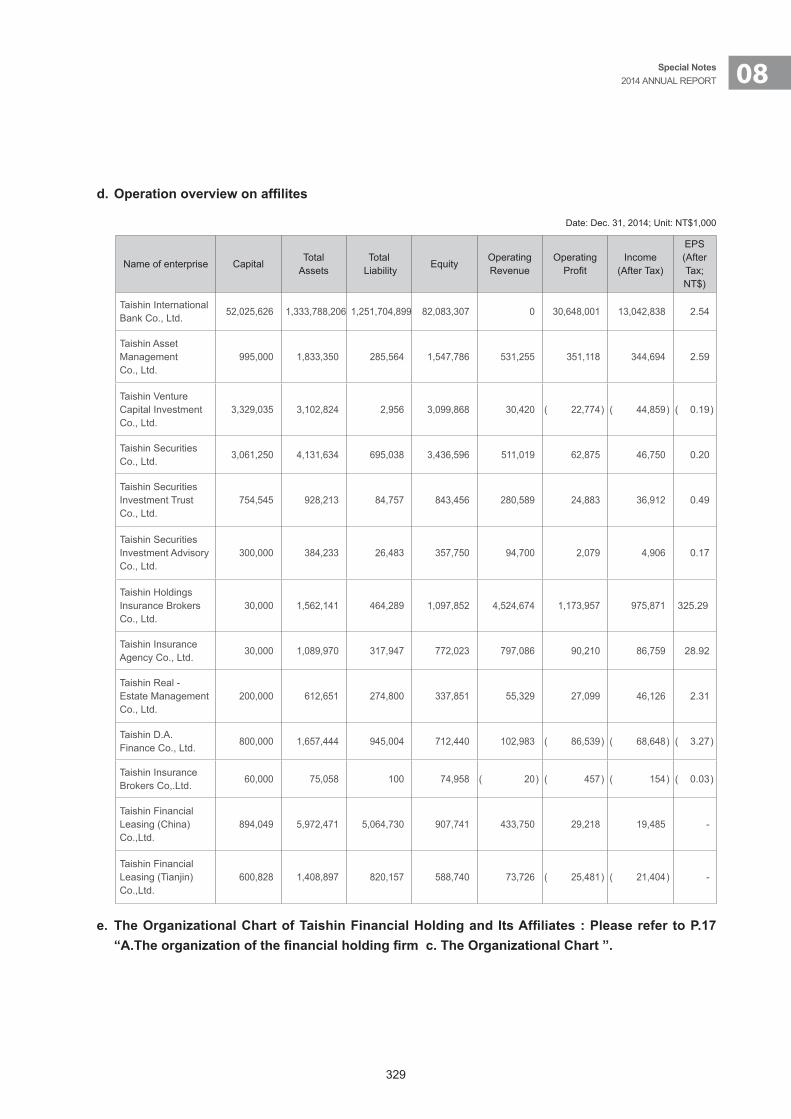
329
08Special Notes 2014 ANNUAL REPORT
d.Operationoverviewonaffilites
Date: Dec. 31, 2014; Unit: NT$1,000
Name of enterprise CapitalTotal
AssetsTotal
LiabilityEquity
OperatingRevenue
OperatingProfit
Income(After Tax)
EPS(AfterTax;NT$)
Taishin International Bank Co., Ltd. 52,025,626 1,333,788,206 1,251,704,899 82,083,307 0 30,648,001 13,042,838 2.54
Taishin Asset Management Co., Ltd.
995,000 1,833,350 285,564 1,547,786 531,255 351,118 344,694 2.59
Taishin Venture Capital Investment Co., Ltd.
3,329,035 3,102,824 2,956 3,099,868 30,420 ( 22,774 ) ( 44,859 ) ( 0.19 )
Taishin Securities Co., Ltd.
3,061,250 4,131,634 695,038 3,436,596 511,019 62,875 46,750 0.20
Taishin Securities Investment Trust Co., Ltd.
754,545 928,213 84,757 843,456 280,589 24,883 36,912 0.49
Taishin Securities Investment Advisory Co., Ltd.
300,000 384,233 26,483 357,750 94,700 2,079 4,906 0.17
Taishin Holdings Insurance Brokers Co., Ltd.
30,000 1,562,141 464,289 1,097,852 4,524,674 1,173,957 975,871 325.29
Taishin Insurance Agency Co., Ltd.
30,000 1,089,970 317,947 772,023 797,086 90,210 86,759 28.92
Taishin Real -Estate Management Co., Ltd.
200,000 612,651 274,800 337,851 55,329 27,099 46,126 2.31
Taishin D.A. Finance Co., Ltd.
800,000 1,657,444 945,004 712,440 102,983 ( 86,539 ) ( 68,648 ) ( 3.27 )
Taishin Insurance Brokers Co,.Ltd.
60,000 75,058 100 74,958 ( 20 ) ( 457 ) ( 154 ) ( 0.03 )
Taishin Financial Leasing (China) Co.,Ltd.
894,049 5,972,471 5,064,730 907,741 433,750 29,218 19,485 -
Taishin Financial Leasing (Tianjin)Co.,Ltd.
600,828 1,408,897 820,157 588,740 73,726 ( 25,481 ) ( 21,404 ) -
e. TheOrganizationalChartofTaishinFinancialHoldingandItsAffiliates:PleaserefertoP.17“A.Theorganizationofthefinancialholdingfirmc.TheOrganizationalChart”.

330
B.Progressofprivateplacementofsecuritiesduringthelatestyearanduptothedateofannualreportpublication:Nil.
C.TheCompany’ssubsidiaries’shareholdingordisposaloftheCompany’sshareduringthelatestyearanduptothedateofannualreportpublication:Nil.
D. Additional Disclosure: Nil.
09
Itemswithmajoreffectonshareholders’benefitsorsecuritiespricesin2014andasofthedateforthepublication
ofthe2015annualreport

332
IX.Itemswithmajoreffectonshareholders’benefitsorsecuritiespricesin2014andasofthedateforthepublicationofthe2015annualreportThe company was only able to secure 2 directorships and 1 nomination of independent director during Chang Hwa Bank’s shareholder meeting held on December 8, 2014. Since the company represents less than half of the 9 directors on board, Chang Hwa Bank is no longer treated as a subsidiary according to Article 4 of the Financial Holding Company Act,Furthermore, the FSC-approved IFRS requires the company and its subsidiary - Taishin International Bank Co., Ltd. to recognize a loss of NT$14,775,670,000 on their investment in Chang Hwa Bank.
In response to the actions taken by the Ministry of Finance that cause the company to lose its control over Chang Hwa Bank and suffer significant losses in the process, the company has engaged legal attorneys to pursue civil actions against the Ministry of Finance at Taipei District Court, and has made an application for an injunction maintaining a temporary status quo.
Taishin Financial Holding Co., Ltd.
ChairmanThomas T.L. Wu