i-ince symposium report on flow-induced noise and vibration
TRANSCRIPT

I-INCE Symposium Report: Second Symposium on Flow-Induced Noise and Vibration Issues and Aspects (FLINOVIA II)
Stephen Hambric1; Amanda Hanford1; Sergio De Rosa2; Francesco Franco2; Elena Ciappi3, Jean-Louis Guyader4; and Randolph C.K. Leung5
1 ARL/Penn State, USA 2 Universita degli Studi di Napoli, Italy
3 CNR-INSEAN, Italy 4 INSA de Lyon, France
5 Hong Kong Polytechnic University, Hong Kong
ABSTRACT The International Institute for Noise Control Engineering (I-INCE) and Penn State University co-sponsored an international symposium on Flow Induced Noise and Vibration Issues and Aspects (FLINOVIA II) at Penn State 27-28 April 2017. Thirty presentations by internationally known researchers were given on topics ranging from fluid dynamics of turbulent flow, to structural excitation and response, to radiated sound. This I-INCE report summarizes the current state-of-the-art in flow-induced noise and vibration, drawing examples from the presentations at the FLINOVIA. Computational and experimental methods are discussed, along with recent applications of methodologies to aerospace and marine vehicles and turbomachinery. A recorded version of the Inter-Noise 2017 presentation of this paper is available on the I-INCE website www.i-ince.org.
1. INTRODUCTION The International Institute for Noise Control Engineering (I-INCE) sponsors annual symposia on
topics in noise and noise control (go to http://i-ince.org/activities.php for a list of recent events). In 2017, I-INCE co-sponsored the 2nd International Symposium on Flow Induced Noise and Vibration Issues and Aspects (FLINOVIA II) at Penn State on 27-28 April 2017. The Symposium was also co-sponsored by the Penn State Center for Acoustics and Vibration (CAV), and the Penn State Institute for CyberScience (ICS). This paper reports on the Symposium, including the demographics of the presenters and attendees, along with a technical summary of the symposium topics.
2. SYMPOSIUM DEMOGRAPHICS
2.1 Authors The first FLINOVIA was held in Rome, Italy in November 2013 at the Italian Consiglio Nazionale
delle Ricerche (CNR), and co-sponsored by CNR-INSEAN, the University of Naples, and the Lyon Acoustics Centre (CELYA). 17 presentations were given by authors from Europe, the Americas, and Asia spanning experimental and numerical methods for quantifying flow induced forcing functions, vibration response, and radiated sound. The presentations were later expanded into chapters in the first book of FLINOVIA proceedings, published by Springer.
The topics at the second FLINOVIA were broader, with 30 presentations spanning two days. Half of the presentations were from authors outside the United States, with papers from Australia, Belgium, Canada, France, Germany, Hong Kong, Italy, and Spain. US papers included five from Penn State, and ten from other universities and companies, including Aerohydroplus, ESI, Florida Atlantic University, Illingworth and Rodkin, Kansas University, Lehigh University, University of Michigan, Notre Dame, and Virginia Tech.
4533

2.2 Attendees Over 100 people attended the conference, representing academia, industry, and government.
25% of attendees were from outside the US, 35% were from industry and government, and 10% were from universities (other than the host institution). Figure 1 shows a group photo taken of the attendees outside the congress venue – the Nittany Lion Inn at Penn State.
Figure 1 – FLINOVIA II Attendees.
3. TECHNICAL OVERVIEW OF SYMPOSIUM TOPICS
3.1 General The sections below summarize the research presented at the symposium, using schematics, images,
and plots of results drawn from some of the papers. Figure 2 shows a flow chart of how the topics interconnect. Applications ranged from low-speed flows over thick structures in water to high speed flows over thin structures in air. Flow over vehicle bodies, like aircraft and automobiles was presented, as well flow over lifting surfaces (foils) and through the human vocal folds and mouth. Experimental measurements using traditional localized sensors, as well as advanced optical techniques were described. Computational work focused mainly on time-accurate methods such as Large Eddy Simulation (LES). Finally, noise control applications were also shown.
Figure 2 – Flowchart of FLINOVIA II topics.
4534

The presentations were subdivided into two main groups: (1) Flow and (2) Vibroacoustic Response. In the flow group, papers were further subdivided into:
• Forcing Functions • Sound Sources • Experiments • Numerical Methods
The Vibroacoustic response group was subdivided into:
• Numerical Methods • Experiments • Innovative Applications
3.2 Flow-induced forces One of the most important flow-induced forcing functions are the fluctuating wall pressures
induced by turbulent boundary layer (TBL) flow. TBL wall pressures cause vibrations in underlying structures, which subsequently radiate sound. Common examples are flows over automobiles, aircraft, and marine vehicles. 3.2.1 Measurements of TBL wall pressures
Figure 3 shows examples of wall pressure fluctuation spectra measured on the surface of an aircraft by the German Aerospace Center (DLR) and Airbus. The spectra show the typical TBL character of strong broad-band low-frequency levels with amplitudes diminishing at higher frequencies. Figure 4 shows similar wall pressure spectra measurements, but taken on a towed underwater body. The spectra are similar in character to those measured on the aircraft, but the in-water spectra show diminished levels at much lower frequencies since the flow speeds are much lower. In general, as flow speed increases, the ‘knee’ in the TBL wall pressure spectra moves higher in frequency.
The aircraft and towed body examples generally show wall pressure spectra from TBL flow which is fairly homogeneous and unaffected by strong pressure gradients. Flows over airfoils, however, are always affected by pressure gradients, particularly near trailing edges. Figure 5 shows measurements made at Notre Dame of wall pressure spectra on the suction side of a foil trailing edge, where the reduced cross-sectional thickness causes an Adverse Pressure Gradient (APG). APGs reduce flow speed, increase turbulence, and distort the shape of the boundary layer itself. All of these effects tend to increase low frequency wall pressure amplitudes, and shift the ‘knee’ in the TBL curve to lower frequencies.
Along with the wall pressure spectra, the spatial variability of the forces is required to analyze structural response. Figure 6 compares spatial correlations of wall pressures measured on the Morris airfoil and the Abshagen towed body. On the Morris plot, the spatial correlations are shown as a function of separation distance, and decrease with increasing separation. Curve fits overlay the measured data, and are used as empirical functions in subsequent radiated sound and structural vibration response calculations. The Abshagen data are shown as a function of frequency and for two speeds. The coherence between two pressure transducers is shown, and increases with increasing flow speed.
4535

Figure 3 – TBL wall pressure spectra measured on DLR aircraft (from Klabes, Callsen, Herr, and Appel,
DLR, Fuselage excitation during cruise flight conditions).
Figure 4 – TBL wall pressure spectra measured on underwater towed body (from Abshagen, Kuter, and
Nejedl, Bundeswehr, Turbulent flow noise generation under sea conditions).
Figure 5 – TBL wall pressure spectra measured on trailing edge of airfoil (from Morris, Notre Dame,
Flow-Induced Vibration of Trailing Edges using Air-Analog Experiments).
4536

Figure 6 – TBL wall pressure correlations: Left – From Airfoil measurements by Morris (Notre Dame);
Right – From towed underwater body measurements by Abshagen (Bundeswehr).
3.2.2 Forcing Function Modeling TBL wall pressure forcing functions have been approximated with empirical models since the
1960’s, with the famous Corcos model being the most popular. The Corcos model fits exponential decay functions in the streamwise and cross-flow directions to measured data. The model includes an oscillating streamwise component associated with the dominant convecting waves. The Corcos model works well for simple homogeneous TBL flow without any pressure gradient effects. However, most flows are more complicated, and empirical models have been augmented with information from Computational Fluid Dynamics (CFD) Reynolds Averaged Navier Stokes (RANS) models. Over the past several years, however, many researchers have pursued time-accurate CFD analyses using variants of Large Eddy Simulation (LES) approaches to model TBL wall pressure fields. Whereas RANS models only provide mean velocities, energies, and dissipation rates, LES can provide time varying velocity fields, as well as surface pressures. Figure 7 compares the outputs from typical RANS and LES calculations, where the LES image is a snapshot in time.
Other researchers have simulated different types of more complicated flow-induced forces with LES analyses, such as those induced by the root junction and tip flows shown in Figure 8. Also shown in Figure 8 is a calculation of turbulence ingestion noise, where inflow turbulence interactions with downstream airfoils generate random unsteady forces on the foil, as well as radiated sound.
Validation of semi-empirical and LES forcing function models remains a large challenge, as LES calculations require significant computational resources, particularly for large-scale flows with high Reynolds Number. Some validation has been promising, though, as shown in the comparisons of simulations and measurements by Klabes in Figure 9. Empirical models, when better informed by CFD RANS-based results can be quite accurate, as can full computational models.
4537

Figure 7 – CFD simulations of flow fields around an airfoil (from Croaker, et. al., UNSW, Numerical and
Experimental Investigation of the Flow-Induced Noise of a Wall-Mounted Airfoil).
Figure 8 – CFD simulations of flow fields (Left) around an airfoil (from Croaker, et. al., UNSW) and (Right)
ingested by a rotor (Wang, Wang, Wang, and Wang, Notre Dame, Large-Eddy Simulation of Rotor
Turbulence Ingestion Noise)
Figure 9 – Comparisons of measured and simulated TBL wall pressure spectra from Klabes; Left – Empirical
and CFD-augmented empirical models; Right – Fully Numerical Models.
4538
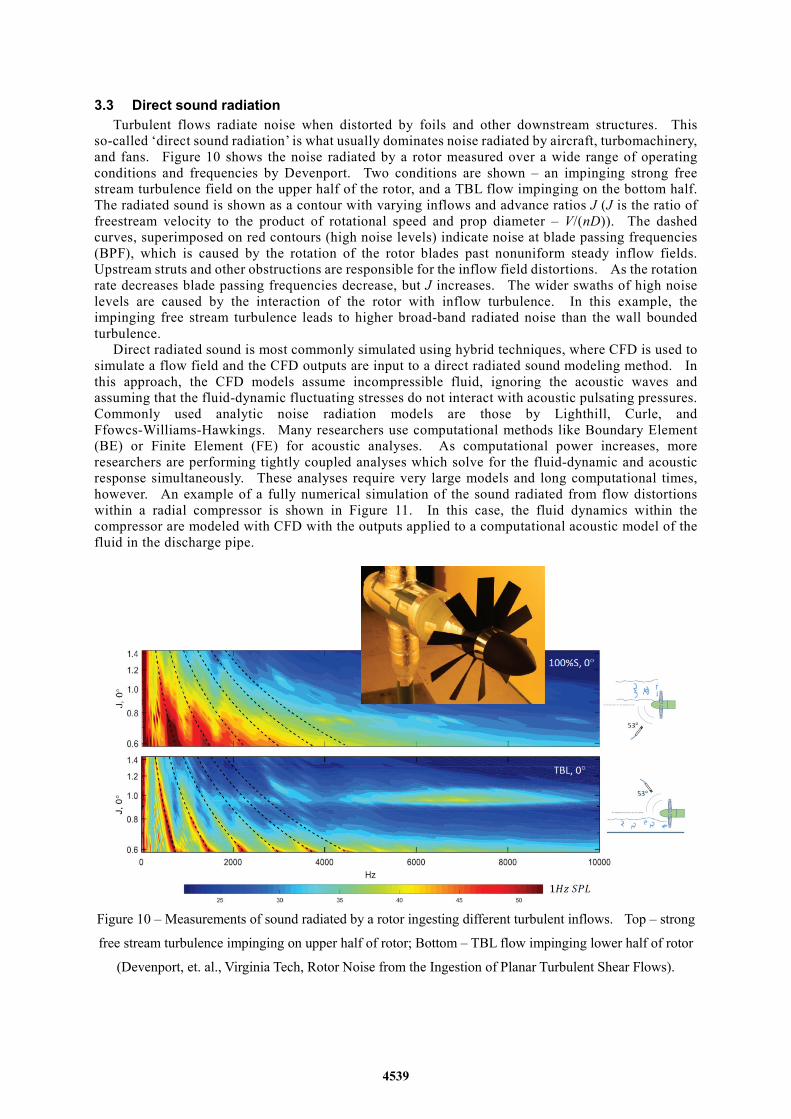
3.3 Direct sound radiation Turbulent flows radiate noise when distorted by foils and other downstream structures. This
so-called ‘direct sound radiation’ is what usually dominates noise radiated by aircraft, turbomachinery, and fans. Figure 10 shows the noise radiated by a rotor measured over a wide range of operating conditions and frequencies by Devenport. Two conditions are shown – an impinging strong free stream turbulence field on the upper half of the rotor, and a TBL flow impinging on the bottom half. The radiated sound is shown as a contour with varying inflows and advance ratios J (J is the ratio of freestream velocity to the product of rotational speed and prop diameter – V/(nD)). The dashed curves, superimposed on red contours (high noise levels) indicate noise at blade passing frequencies (BPF), which is caused by the rotation of the rotor blades past nonuniform steady inflow fields. Upstream struts and other obstructions are responsible for the inflow field distortions. As the rotation rate decreases blade passing frequencies decrease, but J increases. The wider swaths of high noise levels are caused by the interaction of the rotor with inflow turbulence. In this example, the impinging free stream turbulence leads to higher broad-band radiated noise than the wall bounded turbulence.
Direct radiated sound is most commonly simulated using hybrid techniques, where CFD is used to simulate a flow field and the CFD outputs are input to a direct radiated sound modeling method. In this approach, the CFD models assume incompressible fluid, ignoring the acoustic waves and assuming that the fluid-dynamic fluctuating stresses do not interact with acoustic pulsating pressures. Commonly used analytic noise radiation models are those by Lighthill, Curle, and Ffowcs-Williams-Hawkings. Many researchers use computational methods like Boundary Element (BE) or Finite Element (FE) for acoustic analyses. As computational power increases, more researchers are performing tightly coupled analyses which solve for the fluid-dynamic and acoustic response simultaneously. These analyses require very large models and long computational times, however. An example of a fully numerical simulation of the sound radiated from flow distortions within a radial compressor is shown in Figure 11. In this case, the fluid dynamics within the compressor are modeled with CFD with the outputs applied to a computational acoustic model of the fluid in the discharge pipe.
Figure 10 – Measurements of sound radiated by a rotor ingesting different turbulent inflows. Top – strong
free stream turbulence impinging on upper half of rotor; Bottom – TBL flow impinging lower half of rotor
(Devenport, et. al., Virginia Tech, Rotor Noise from the Ingestion of Planar Turbulent Shear Flows).
4539

Figure 11 – Simulation of sound radiated into the discharge pipe of a radial compressor (Enghardt, et. al.,
DLR, Sound Sources of Radial Compressors – Experimental and Numerical Studies).
3.4 Structural response Once a distribution of flow-induced forces is determined, they may be applied to the surfaces of a
neighboring structure to calculate vibration response. The vibration response may then be used as a boundary condition to an acoustic model to compute reradiated sound. The structural reradiated sound is added to the direct radiated sound to compute a total sound field. Note that in some cases structural reradiated sound can dominate a total sound field, particularly for structures submerged in water.
The most common structural response calculation approach is to assume that the flow-induced forces are ‘blocked’, and unaffected by the motion of the vibrating structure (this assumption is similar to that made for most direct radiated sound calculations). Forced response is usually computed in the frequency domain, but sometimes in the time domain, particularly when alternating stresses within the structure are of interest (such as in fatigue calculations; see pp. 343-356 in [1]). Modal summation approaches are usually used due to their computational efficiency. In a modal approach the products of the forcing fields and structural mode shapes are computed and summed to compute overall response.
The strength of the structural response depends on the impedance of the structure, the strength of the flow-induced forces, and on the degree of coupling between structural mode shapes and the spatial correlation distribution of the forces. Figure 12 shows the classic example of a simply supported flat plate excited by TBL flow. At low frequencies, the spatial distribution of the forces is wider than at high frequencies. In this example, none of the forces will couple strongly to the mode shape shown since the shapes are so mismatched. In fact, in the high frequency limit simple ‘rain-on-the-roof’ uncorrelated forcing may be assumed with good accuracy.
An example of a measured and simulated structural vibration spectrum is shown in Figure 13. In this example, a supersonic wall-bounded nozzle discharge flow excites a downstream panel. The interaction of the turbulence with the shock cells in the supersonic flow complicates the excitation field considerably. The loading was computed using CFD LES modeling and applied to the structure in a time-domain analysis. The spectrum in Figure 13 is the Fourier transform of the response time histories. As is sometimes common in flow-excited vibration studies the frequency and the response are scaled with flow and structural variables. In this example, the simulation time record length is much shorter than that of the measured vibration, leading to higher random error in the simulation.
The agreement is reasonable, but not perfect, with some modal peaks behaving quite differently in the measurements and simulations. These sorts of discrepancies are common in any realistic application, and are usually due to uncertainties in the forcing functions (computed by CFD in this case), the structural mode shapes (in this example the panel is screwed along its streamwise edges, affecting modal stiffness), and damping (the screwed edges as well as the flow over the structure induce damping that is difficult to quantify).
Overall solution uncertainties are rarely properly quantified, since they are so hard to determine even for individual inputs. Figure 14 compares measured variability in the structural response of a launch vehicle due to diffuse acoustic loading with estimates of the variance of simulations. The
4540

simulation variance is the sum of the variances of the forcing function, structural damping, structural responsiveness, and variability of response over the structure. In this example, low-frequency variance is dominated by the variability of response over the structure. At high frequencies, the variance is dominated by uncertainty in the forcing function and structural damping.
Figure 12 – Comparison of spatial correlation of TBL wall pressure field at low, mid, and high frequencies
compared to structural mode shape. The red and blue colors indicate opposite phasing of the forcing field.
(Lysak, Bonness, and Fahnline, Penn State, Comparison of Low Wavenumber Models for Turbulent
Boundary Layer Excitation).
Figure 13 – Comparison of measured and simulated panel response due to jet flow excitation (Hambric, Shaw,
and Campbell, Penn State, Panel Vibrations Induced by Supersonic Wall-Bounded Jet Flow from an
Upstream High Aspect Ratio Rectangular Nozzle).
4541

Figure 14 – Measured (left) and estimated (right) variations of vibration response of a launch vehicle. The
estimated variances are from the forcing function (p^2), damping (Q), modal acceptance (j^2ReM), and
spatial variability (F(B)), (Bremner, AeroHydroPlus, End-to-end statistical model for maximum expected
vibration response under aero-acoustic loading).
3.5 Noise Control Vibration and sound induced by turbulent flow may be controlled by reducing:
• the forcing function, • structural response, and/or • sound radiation.
Methods for reducing structural response are well known (but certainly not yet perfected). However methods for reducing the strengths of flow-induced forcing functions without compromising fluid-dynamic performance, or for attenuating radiated sound from flow-induced sources are more challenging and require innovative research.
Figure 15 shows a method for injecting flow along the outer regions of a jet discharging a converging-diverging nozzle. The small jets of injected turbulent flow (about 4% of the overall mass flow) break up the spatial coherence of the discharge jet flow, thereby reducing subsequent radiated noise. The noise reduction is most pronounced in the 30-40 degree angles off of the axis of the jet flow (which is the region of highest radiated sound).
Figure 16 shows another aeroacoustic noise problem – noise radiated by the turbulent flow distortions in the gap between an aircraft wing and downstream flap. Here, a perforated plate liner was designed to maximize sound absorption in the frequency range of highest radiated noise. A computational acoustics model was linked to the CFD solution to compute the direct radiated sound with and without the liner.
4542

Figure 15 – Measured noise reductions due to injection of air into discharge jet from nozzle (Morris and
McLaughlin, Penn State, Noise and Noise Reduction in Supersonic Jets).
Figure 16 – Simulated noise reductions due to insertion of an acoustic liner on the lower surface of a
downstream flap on an aircraft wing (Barbarino, Dimino, and Concilio, CIRA, Experimental Validation of
Innovative Liners for hyper-lift surfaces.
4543

4. CONCLUSIONS The second FLINOVIA was highly successful, growing the number of authors and participants
from the first meeting in 2013. Future meetings are being planned, and will maintain the features of the first two – two days of presentations with a small number of invited papers (no parallel sessions). Participation by industry and government will be strongly pursued to ensure transition of research. The FLINOVIA II papers will be published in a book by Springer in 2018. PDF versions of the extended abstracts and presentations are available for download at www.flinovia.org.
The authors also hope to continue flow-induced noise and vibration sessions at future Inter-Noise meetings to continue to connect and grow our community of researchers. Participants of Inter-Noise 2017 are encouraged to consider submitting papers to future Inter-Noise congresses – look for the ‘Flow Induced Noise and Vibration’ topic during the abstract and paper submission process.
ACKNOWLEDGEMENTS The authors are grateful for the financial support of International Institute of Noise Control
Engineering (I-INCE), the Penn State Center for Acoustics and Vibration (CAV), and the Penn State Institute for CyberScience (ICS).
REFERENCES 1. Ciappi, E., De Rosa, S., Franco, F., Guyader, J-L., and Hambric, S. Flinovia – Flow Induced Noise
and Vibration Issues and Aspects. Springer; 2014.
APPENDIX A – LIST OF PAPERS AND AUTHORS Please go to www.flinovia.org for a complete listing. 1. Abshagen, Kuter, and Nejedl, Turbulent flow induced noise generation under sea conditions 2. Brungart, Hansford, Lindau, and Moeny, Noise from Pulsating Supercavities 3. Bremner, End-to-end statistical models for predicting maximum expected vibro-acoustic response
levels under aero-acoustic loading 4. Caiazzo, D'Amico, and Desmet, Development of a Generalized Corcos model for the prediction of
turbulent boundary layer induced noise 5. Croaker, Moreau, Awasthi, Karimi, Doolan, and Kessissoglou, Numerical and experimental
investigation of the flow-induced noise of a wall mounted foil 6. Devenport, Alexander, Hicking, Molinaro, Balantrapu, and Glegg, Rotor Noise from the Ingestion of
Planar Turbulent Shear Flows 7. Dimino, Barbarino, and Concilio, Experimental validation of innovative liners concept, designed for
hyperlift surfaces 8. Donovan and Blake, Measurement, prediction, and reduction of high frequency aerodynamic noise
generated and radiated from surfaces of various textures 9. Enghardt, Hurst, Raitor, and Neise, Sound sources of radial compressors - experimental and
numerical studies 10. Fan, Lam, and Leung, A Numerical Study of Nonlinear Fluid-Structure Interaction of an Excited
Membrane in Viscous Flow 11. Ganesh, Wu, and Ceccio, Flow-induced noise as a result of shedding partial cavitation 12. Glegg, Devenport, and Alexander, Recent Developments in Understanding the Sound Radiation
from Rotors Operating Near Rigid Surfaces 13. Guasch, Pont, Baiges, and Codina, Simultaneous finite element computation of direct and
diffracted flow noise in domains with static and moving walls 14. Hambric and Shaw, Panel vibrations induced by supersonic wall-bounded jet flow from an
upstream high aspect ratio rectangular nozzle 15. Hugues, Perrey-Debain, Dauchez, and Papaxanthos, Determination of the acoustic and
aerodynamic contributions to the vibrational response of an air-conveying rectangular duct 16. Jaworski, Wagenhoofer, and Moored, Accelerated flow-acoustic boundary element solver and the
noise generation of schooling fish 17. Klabes, Callsen, Herr, and Appel, Fuselage Excitation During Cruise Flight Conditions: From
Flight Test to Numerical Prediction
4544

18. Krane, Flow-induced vibration in human speech sound production 19. Lysak, Bonness, and Fahnline, Comparison of Low Wavenumber Models for Turbulent Boundary
Layer Excitation 20. Marchetto, Maxit, Robin, and Berry, Measurement techniques of the sensitivity functions to
characterize the vibro-acoustic response of panels excited by random excitations 21. Morris and Guan, Airfoil Sound and Vibration Caused by Separated Trailing Edge Flow 22. Morris and McLaughlin, Noise and noise reduction in supersonic jets 23. O'Donoughue, Robin, and Berry, Inference of Random Excitations from Contactless Vibration
Measurements on a Rectangular Panel or Circular Membrane using the Virtual Fields Method 24. Peiffer and Mueller, Review of efficient methods for the computation of transmission loss of plates
with inhomogeneous material properties and curvature under turbulent boundary layer excitation 25. Pezerat, Grosseet, Carpentier, Thomas and Ablitzer, Wall Pressure identification by using the
Force Analysis Technique in automotive, naval and aeronautic applications 26. Robin, Franco, Ciappi, De Rosa, and Berry, Exact similitude laws for flat plate vibrations induced
by a turbulent boundary layer 27. Skvortsov, MacGillivray, and Dylejko, Vibroelastic Analogy in Flow Noise Modeling 28. Wang, Wang, and Wang, Large-eddy simulation of rotor turbulence ingestion noise 29. Zerbib and Heather, Wind Noise Application Coupling OpenFOAM with an Aero-Acoustic Finite
Element Hybrid Method 30. Zheng and Zhang, Acoustic Scattering by Vortices
4545