i i do not reiove from files - andrews forestandrewsforest.oregonstate.edu/pubs/pdf/pub508.pdfi do...
TRANSCRIPT

II DO NOT REIOVE FROM FILES
Forests and Rangelands as Sources of Chemical Pollutants
by
Logan A. Norris
Duane G. Moore
of the
Pacific Northwest Forest and Range Experiment Station
Forestry Sciences Laboratory
USDA Forest Service
Corvallis, Oregon
h
Reprinted from "Non-Point Sources of Water Pollution," seminar
publication, July 1976, Water Resources Research Institute,
Oregon State University, Corvallis, Oregon. Proceedingsof Spring Quarter 1976 weekly series.
PURCHASED BY THE FOREST SERVICE FOR OFFICIAL USE

Presented April 15, 1976 by LOGAN A. NORRIS, Forestry Sciences Laboratory,U. S. Department of Agriculture, Corvallis, Oregon. (Paper co-authored byDuane G. Moore of the Forestry Sciences Laboratory.)
9opte4a awe Rawfeeagaal Sew/tee:1 eitemee4e Poilata,(4:),
Technological revolution in American agriculture has produced a 35percent increase in farm output with a 45 percent reduction in farm labor
despite an 11 percent reduction in cropland acreage since 1940 (Barton, 1966).Forestry technology must undergo a similar revolution to provide the products
and services the Nation demands from our forests and rangelands. Our pastpreoccupation with projected needs of the Nation for wood fiber obscured the
increasing demands for forage, water, wildlife, and areas for purely recrea-tional purposes. All these needs must be satisfied, so we must compensate
for our decreasing production base for wood products by markedly increasing
the productivity of each acre of forest land devoted primarily to timber pro-duction.
Chemicals have played an important role in the success story of
modern American agriculture. These same tools -- fertilizers, insecticides,
and a host of other pest control agents -- are equally important in meeting
our timber needs. The widespread use of chemicals, however, cannot proceed
without adequate consideration of their possible impact on environmental
quality. We must know in advance the consequence or hazard from each practice
involving the use of chemical tools.
The hazard of using an herbicide is the risk of adverse effects on
nontarget organisms. Two factors determine the degree of hazard: (1) the
toxicity of the chemical and (2) the likelihood that nontarget organisms will
be exposed to toxic ] doses. Toxicity alone does not make a chemical hazardous.The hazard comes from exposure to toxic doses of that chemical. Even the most
toxic chemicals pose no hazard if organisms are not exposed to them. There-
fore, an adequate assessment of the hazard from the use of any chemical re-
quires consideration of both the likelihood of exposure and the toxicity of
the chemical (Norris, 1971).
1A toxic effect is not restricted to lethality. Any adverse effect is a
toxic effect.
17

CONCEPT OF CHEMICAL ACTION
Chemical action is the direct effect of a chemical on an organism.Chemical action on any organism requires that exposure occurs and the chemicalbe present at the site of action in an active form in sufficient quantity andfor a sufficient period of time to produce a toxic effect.
Toxicity
There are two kinds of toxicity: acute and chronic. Acute toxicityis the fairly rapid response of organisms to a few, relatively large doses ofchemical administered over a short period of time. Chronic toxicity is theslow or delayed response or organisms to the exposure of relatively small dosesof chemical administered over a relatively long period of time. There arevarious gradations between these two extremes. The kind of response (acute orchronic) observed in an organism depends on the magnitude of the dose and theduration of the exposure which results from the behavior of the chemical.
Potential for Exposure
The initial distribution of a chemical and its subsequent movement,persistence, and fate in the environment determines the potential for exposure.The laws of physics, chemistry, and biology direct an interaction between theproperties of chemicals and the properties of the environment to produce chem-ical behavior (see Figure 1). The resulting quantities of a chemical in vari-ous parts of the environment at various times determine the duration and mag-nitude of exposure of different organisms to a chemical. The impact of chem-icals on target and nontarget organisms and the selective action of chemicalsdepend on this exposure.
PROPERTIES LAWS OFOF CHEMICAL
<S>/5))- POTENTIALINTERACTION BEHAVIOR 11+ OF
EXPOSURE
PROPERTIES •OF ENVIRONMENT
Figure 1. The interaction of chemicals with the environment.
18

••••••• ••••••••••••••••••••••••• • ••••••••••••••••••••••••••••
•••••• • • • • • • - • • • • • • •• • • • • • • ••••••••••••••••••••••••••••••.. 1 0 0 • •• • • • • • ••••••••••••• •• • • • • • • • • • • • • • • •• • • • • • • •••••••••••••
• •••••• • • • • • •.• • • • • ••. • • •• • .
4.4 40.4
``. 50
0ti
5 M.P.H. WIND --ja.
CHEMICAL BEHAVIOR
Initial Distribution of Spray Materials
Aerially applied chemicals will be distributed to four major portionsof the environment: air, vegetation, forest floor, and water. The amount ofchemical entering each portion of the environment will be determined by thechemical used and the environmental conditions which prevail at the time ofapplication (Norris, 1967).
Some spray material will be dispersed by the wind as fine dropletscalled "drift". The degree of lateral movement of spray drift depends on drop-let size, height of release, and wind velocity (see Figure 2) (Reimer, et al.,1966). Additional amounts of chemical may remain in the air due to volatili-zation of spray materials while falling through the air or from interceptingsurfaces. Most of the herbicide not lost through drift or volatilization isintercepted by the vegetation or the forest floor. Some small amount of pesti-cide may fall directly on surface waters.
LATERAL MOVEMENT (feet)40 80 120
Figure 2. Lateral movement of spray particles of various
diameters falling at terminal velocity in an8 km/hr crosswind. (5 mph = 8 km/hr; 1 ft =0.3048 m)
19

Movement, Persistence, and Fate of Pesticides in the Forest Environment
The movement of pesticides includes movement within a given part of
the environment such as leaching in the soil profile or movement from one part
of the environment to another such as the rain washing of pesticide residuesfrom leaf surfaces to the forest floor. Persistence is the tendency for pesti-
cides to remain in an unaltered form. The fate of pesticides concerns the
chemical pathway of pesticide degradation. The following section in this paper
considers the movement, persistence, and fate of chemicals in various parts ofthe forest environment.
Air:
Losses of herbicides and insecticides to the air may be appreciable,
but there is little quantitative data. During one test in western Oregon, for
instance, from 20 percent to 75 percent of certain herbicides did not reach the
ground, but these results are confounded by the presence of nearby overstoryvegetation2.
Norris, Montgomery, and Warren (1976)3 report 70 percent to 90 per-
cent recovery of 2,4-D and picloram, respectively, at first intercepting sur-
faces after helicopter application in southern Oregon. Chemical dispersed inthe air is mostly moved to other locations where it may settle to the earth, be
washed out with rain, or be taken up by plants and other organisms. Degradationin the air is also possible (Moilanen, et al., 1975).
Vegetation:
The amount of pesticides intercepted by vegetation depends on the
rate of application and the density of vegetation. There is limited absorption
and very little translocation of many pesticides intercepted by foliage. Throughthe action of rain, much of the unabsorbed pesticide will be washed from the
surface of the leaf. Pesticide remaining on the leaf surface and any pesticidenot translocated to other plant parts will also enter the environment of theforest floor due to leaf fall.
Pesticides retained by the plant may be excreted back into the envi-ronment through the roots or they may end up in some plant storage tissue to
be released at a later time. Through metabolic activities, plants may degradea pesticide to nonbiologically active substances.
Studies with herbicides show the highest concentrations occurring in
foliage shortly after application (see Table 1) (Morton, et al., 1967; Getz-
endaner, et al., 1969). A combination of factors causes the concentration to
2Unpublished data. M. newton, L. A. Norris, and J. Zavitkovski, School ofForestry, Oregon State University, Corvallis.
3 This publication does not contain recommendations for pesticide use nor doesit imply that the uses discussed here have been registered. All uses must
be registered by appropriate State and/or Federal agencies before recommen-dation.
20

decrease rapidly with time. Growth dilution, weather, and metabolism of theherbicide by the plants are particularly important.
Table 1. Residues of Herbicide1in Forage Grass
Time afterHerbicide residue
treatment 2,4-D2
2,4,5-T2
Picloram3
(weeks) ppm
0 100 100 135
1 60 60
2 50 30 32
4 30 15
8 6 6 24
16 1 2 16
52 -- 3
1Rate of application - 1.12 kg/ha.
2Data from Figure 4, Morton, et al., 1967.
3Data from Table 5, Getzendaner, et al., 1969.
The forest floor is a major receptor of aerially applied spray mater-
s. Pesticides in the forest floor may be volatilized and re-enter the air,
-,orbed on soil mineral or organic matter, leached through the soil profileby water, or degraded by chemical or biological means. Volatilization of chem-
icals from the soil surface may be responsible for the loss of fairly largeamounts of some pesticides such as DDT and perhaps some phenoxy esters.
The length of time chemicals persist in forest floor and soil bears
strongly on the probability they will contaminate the aquatic environment.Pesticide degradation is usually biological, but chemical degradation is impor-
tant in the loss of amitrole and the organophosphate insecticides.
The common brush control herbicides 2,4-D, amitrole, 2,4,5-T, and
picloram are all degraded in the forest floor although their rates of degrada-
tion vary considerably (see Figure 3). In red alder (AZnus rubra) forest floormaterial, 80 percent of the amitrole and 94 percent of the 2,4-D were degradedin 35 days, but 120 days were required to degrade 87 percent of the 2,4,5-T.
Picloram degradation was slow, 35 percent in 180 days (Norris, 1970).
Adsorption and leaching are processes which work in opposition to
one another. Adsorbed molecules are not available for leaching, but adsorp-
tion is not permanent. The amount of pesticide which is adsorbed is in equili-
brium with the amount of pesticide in the soil solution (see Figure 4). As the
concentration of pesticide in the soil solution decreases, more pesticide will
?1

Picloram
be released from adsorption sites. Thus, adsorption provides only temporarystorage, and the soil is, in effect, a reservoir of chemicals which will even-tually be released. Leaching is a slow process capable of moving pesticidesonly short distances (Harris, 1967, 1968). Herbicides are generally moremobile in soil than insecticides, but mobility is relative, and even the move-ment of herbicides is measured in terms only of inches or a few feet.
120
100
90
80
70
60a50 ■ LEGEND=
0 2,4-D0 40
Amitrolewcc
30 (2 2,4,5-T
20
10
0
20 40 60 80 100
120
140
160
180TIME (days►
Figure 3. Recovery of 2,4-D, amitrole, 2,4,5-T, and picloramfrom red alder forest floor material (Norris, 1970).
CHEMICAL + ADSORBENT
kik2
CHEMICAL ADSORBENT
Figure 4. Chemical adsorption on soil is an equilibrium reaction.
22

B. Eddyville Watershed
Surface Waters
Degradation of environmental quality in the forest is often first
recognized by changes in stream quality. Stream contamination is also a most
important expression of environmental contamination in the forest because
water is both the habitat for many biological communities and a critical com-
modity to downstream water users.
Pesticides may enter streams by several processes. The direct ap-
plication or drift to surface waters will occur for only a short period of
time but may cause high concentrations of pollutant. Pesticides may also
enter streams in rainfall which washes particulate and vapor forms from the
air or from leaves. Pesticides may move to streams by leaching through thesoil profile or in mass overland flow during periods of intense precipitation.
FOREST STREAM CONTAMINATION BY HERBICIDES IN OREGON
Stream contamination by herbicides is a subject which intensely
interests the public. Herbicides are the most commonly used group of pesti-
cides in this forest region, and managers can greatly influence the amount ofherbicide which enters streams near spray areas.
Direct Application or Drift of Herbicides to Oregon Streams
I have looked for herbicides in streams after regularly scheduled
spray projects on forests and rangelands in Oregon. The following examplesillustrate several important points about minimizing stream residues (Norris,
1967). You can best study these examples by observing the location of treat-ment unit boundaries, streams, and sampling points. Note in particular when
the peak concentrations of herbicide occurred and how long residues persisted.
About 26 ha of 400-ha Cascade Creek Watershed (western Oregon)
were sprayed with low volatile esters of 2,4,5-T, 2.24 kg/ha, in March by
helicopter (see Figure 5).
0---•• Sampling Point
Stream
Watershed Boundary
I mile
A Cascade Creek Watershed
Figure 5. The Cascade Creek and Eddyville Watersheds
treatment areas (1 mile = 1.6 km).
23

A small stream was sampled at point 1 from a 2-ha watershed whichwas completely sprayed. Streams sampled at points 2 and 3 did not enter butran adjacent to the treated area. Herbicide residues were measured by gaschromatography in samples collected at these points (see Table 2).
Table 2. Concentration of 2,4,5-T in Cascade Creek1
Sample Point 1 Sample Point 2 Sample Point 3
Hours afterspraying
2,4,5-T(ppb)
Hours afterspraying
2,4,5-T(ppb)
Hours afterspraying
2,4,5-T(ppb)
0.05 0 0.2 1 0.3 Lost
.6 16 1.3 2 1.4 3
1.3 7 2.2 1 2.0 3
2.0 4 3.9 1 3.93
0
4.0 4 5.43
0
5.2 4
9.8 4
24.7 2
48.2 1
74.82
1
1Rate of application - 2.24 kg/ha.
2Herbicide residues were detected at point 1 up to 16 weeks after spraying.
3No further residues were detected although sampling continued for 10 months.
The drainage basin at point 1 was characterized by a large slump andmarshy area which indicated a high water table. The highest concentrationsoccurred shortly after application started, but low concentrations were foundup to 16 weeks later. At points 2 and 3, only low levels of herbicide werefound, and these persisted for less than 1 day. Data from points 2 and 3 re-flect the small area of the watershed treated as well as the location of thetreatment unit boundaries with respect to the sampled stream.
The Eddyville Watershed in western Oregon was treated with low vola-tile esters of 2,4-D at the same time as the Cascade Creek Watershed (seeFigure 5). Several streams were included in the 28 treated hectares.
Higher concentrations of herbicide were found in the Eddyvillestreams than in Cascade Creek (see Table 3). This is attributed to a slightlyhigher rate of herbicide application, a larger proportion of the watershedbeing treated, and, most importantly, the fact that all of the sampled streamsflowed from or through the treated area. The highest concentrations of herbi-cide were found shortly after application. Residue levels declined rapidlywith time.
24

Table 3. Concentration of 2,4-D in Streams Near Eddyville1
Sample Point 4
Sample Point 5 Sample Point 6
Hours afterspraying
2,4,5-T(ppb)
Hours afterspraying
2,4,5-T(ppb)
Hours afterspraying
2,4,5-T(ppb)
0.8 33 1.3 62 1.4 30
1.8 13 2.3 71 2.3 44
2.8 13 3.3 58 3.3 25
53.52
9 4.3 44 4.3 23
53.62
25 53.62
11
1
Rate of application - 2.5 - 3.36 kg/ha.2No further residues were detected although sampling continued for 10months.
Other studies have been carried out on the Malheur National Forestin eastern Oregon (Norris, 1967). The treatment areas examined in easternOregon were generally larger than those in western Oregon, although the dis-tance between units was greater. The spray units in eastern Oregon weretreated by helicopter with 2,4-D low volatile esters in early June.
The West Myrtle treatment area is a fairly typical eastern Oregonspray project (see Figure 6). It contained nearly 480 treated hectares in oneblock. Live streams were included in the treatment area. Herbicide residueswere measured near the downstream end of the unit and at another point about1.6 km downstream. The concentrations of herbicide were higher than thoseencountered in Cascade Creek in western Oregon but similar to those in theEddyville treatment area which also included live streams (see Table 4).
The point that needs to be emphasized is that the magnitude of thisshort term contamination is not a function of the herbicide or the geographicallocation in which it is used. It is closely related to the manner in which thetreatment area is laid out with respect to live streams. Data from the CampCreek spray unit in eastern Oregon illustrate these points. The Camp Creekunit resembled situations frequently encountered in western Oregon because thespray boundaries were close to, but did not include live streams (see Figure6). The concentrations of herbicide in Camp Creek after spraying were low andpersisted for only a short time (see Table 5).
The Keeney-Clark spray unit (88 ha) in eastern Oregon illustrates aparticular type of problem. This unit is a fairly flat, marshy area whichcontains several small live streams (see Figure 7). Standing water was notedin several areas at the time of treatment which suggested a high water table.
25

I mile
1North
West Myrtle treatment area Camp Creek treatment area watershed
Figure 6. West Myrtle and Camp Creek treatment areas(1 mile = 1.6 km).
Table 4. Concentration of 2,4-D in Myrtle Creek'
Sample Point 1 Sample Point 22
Hours afterspraying
2,4-D(ppb)
Hours afterspraying
2,4-D(ppb)
1.7 132 2.0 T
3.7 61 3.9 T
4.7 85 5.0 T
6.0 10 6.2 2
7.0 26 7.2 7
8.0 75 8.2 8
9.0 59 9.2 13
13.9 51 14.1 14
26.9 3 17.0 7
37.9 9 38.0 6,
78.0 8 77.8 9
80.8 1 81.0 9
1 week T 104.8 3
1 week 1
1Rate of application - 2.24 kg/ha.
2Sample point 2 is 1.6 km downstream fromsample point 1. 26

Table 5. Concentration of 2,4-D in Camp Creek1
Hours after spraying 2,4-D
(PPb)
0.1 T
2.0 25
5.4 1
8.8 1
84.5 3
1 week 0
1Rate of application - 2.24 kg/ha.
113:19111T-CLUI POLLIXUS SPRAY AREAS
Figure 7. Keeney-Clark Meadows treatment area
(1 mile = 1.6 km).
High concentrations of herbicide were found shortly after applica-
tion (see Table 6). The long persistence of fairly high concentrations of
herbicide is characteristic of what would be expected from treating areas of
this type. The length of time measurable concentrations flowed from this
area is unknown. This particular situation is probably one of the most
27

dangerous in terms of potential stream contamination. A slight rise in thewater table could result in the release of large quantities of herbicide tothe streams which drain this area.
Table 6. Concentration of 2,4-D in Streamsin Keeney-Clark Meadows'
Hours after spraying 2,4-D
(PPb)
0.7 840
2.5 48
3.1 128
3.6 106
4.1 106
6.1 121
8.1 176
9.6 138
14.3 113
37.8 91
56.4 76
100.1 115
103.6 95
289.9 5
297.0 7
1Rate of application - 2.24 kg/ha.
I want to stress one point based on the data presented. Short-term,high-level contamination results from direct application of herbicide to thewater surface. This can be reduced markedly by excluding streams from treat-ment areas. In other words, if you do not want it in the water, then don'tput it there.
Movement of Chemicals from l'reated Areas to Streams
The forest floor is a large reservoir of potential stream pollutants.Any amount of herbicide that has not been degraded, volatilized, or absorbedis available for leaching or surface runoff.
The mechanism by which chemicals are moved from spray deposit to astream may be visualized as two competing reactions: leaching and surfacerunoff. Rainfall that is not lost through evaporation either enters the soil
28

profile or runs over the surface. In either case, it carries surface depositedchemicals either in solution or as suspended matter. The greater the propor-
tion of water entering the soil profile, the lower the proportion of wateravailable for surface flow. In general, where the water goes the chemicalalso goes but not as fast. There are numerous factors which influence thedistribution of water between surface flow and infiltration:
1 Nature of surface
Amount of surface organic matter
Slope
Depth of soil profile
Infiltration characteristics of soil
e. Immediate previous precipitation history
2. Nature of precipitation
Intensity
Duration
c. Form
Factors which favor infiltration will decrease the amount of surface
runoff occurring and with it the overland flow of chemical. These factors in-fluence the amount of herbicide entering the stream due to surface flow:
Distance from stream course to closest point of herbicide appli-
cation.
Infiltration properties of soil or forest floor.
3. Rate of surface flow.
4. Adsorptive characteristics of surface materials.
Conditions which retard the rate of discharge of surface flow to
the stream will result in a decrease in the immediate level of contamination.
It will also reduce the long term total stream load of herbicide because a
longer residence time in the soil will provide greater opportunity for degra-
dation of herbicide.
Surface flow or mass overland flow has the potential to carry a lot
of chemical over a long distance in a short time. However, hydrologists say
overland flow of this type seldom occurs on western forest lands because the
infiltration capacity of the forest floor and soil is much larger than most
rates of precipitation. Therefore, most pesticide residues enter the soil
where absorption will prevent their rapid or extensive movement.
Leaching is a slow process capable of moving only small amounts of
herbicide short distances. It offers little potential for serious stream pol-
lution because the herbicide is available for degradation for a long period of
time before sufficient movement would occur to permit release to a stream.
29

Norris (1967, 1968) looked for the long term entry of 2,4-D and
2,4,5-T into forest streams draining areas receiving these herbicides. In one
case, 11 streams in western Oregon were monitored immediately below treatment
areas on a regular basis for 9 months after application. In all cases, once
the initial stream contamination had declined to nondetectable limits (0.001
mg/1 in 3 to 72 hours), no further herbicide residues were detected. In a
second case, two other watersheds in western Oregon were studied. In one,
the treatment area bordered a stream for more than 3 km extending from 200 to
400 m upslope from the stream. 2,4-D and 2,4,5-T were applied at 1.12 kg/ha
acid equivalent (ae) each as low volatile esters in oil in the spring. The
second area had 25 different treatment areas totaling 160-ha in an 1 135-ha
watershed which received the same treatment. In both cases, during the first
storms of the fall which raised stream levels, streams were sampled to detectthe movement of herbicide from treated areas to the stream, but no residues
were found.
FERTILIZERS
Fertilization of forested watersheds is a relatively new but rapidly
growing management practice. Operational forest fertilization began in the
Douglas-fir region of the Pacific Northwest in 1965 and in the southeastern
pine region in 1968. Nearly 300,000 ha of Douglas-fir have now been fertilized
in western Oregon and Washington and soon an additional 100,000 ha or more willbe fertilized each year.
In the Pacific Northwest, the major coniferous commercial timber
types have responded only to additions of nitrogen. As growth response has
not been influenced by form of nitrogen, granular urea (46% N), being a high
analysis source well adapted to aerial application, is therefore the nitrogen
carrier of choice. In the southeast, both nitrogen and phosphorus fertilizers
are applied to forest stands by conventional ground equipment or helicopter.
Many concepts concerning the initial distribution of pesticides
apply also to fertilizers, but there are some important exceptions. Rate of
application of fertilizer varies with site and timber type but is usually 168
or 224 kg of urea nitrogen per ha. In contrast with pesticides, where signi-ficant quantities may remain in the atmosphere, essentially all of the ferti-
lizer applied reaches the intended target. However, because of the higherrates of application, it is necessary to make at least two flights over the
unit and a uniform rate of a p plication over an entire unit is difficult to
obtain (Strand, 1970).
The introduction of large, specially coated urea granules (forest
grade) has eliminated drift problems experienced in early applications due
to dust. Drift problems still exist, however, when standard a g ricultural urea
(45% N) is used, or when experimental liquid formulations of nitrogen are sub-
stituted for the forest (granules. Should liquid fertilizer formulations come
into commercial use, their initial distribution in the environment will be
subject to the same factors controlling distribution of aerially applied pesti-
cides.
Because very little granular fertilizer is intercepted by a dry for-
est canopy, the forest floor is the major receptor. The initial distribution
of fertilizers is thus restricted to the forest floor and to exposed surface
waters within the treated areas.
30

Urea fertilizer is highly water soluble and readily moved into theforest floor and soil by any appreciable amount of precipitation. Under nor-mal conditions, urea is also rapidly hydrolyzed (4-7 days) to the ammonium ion
by the enzyme urease. When moisture is limited, however, urea granules may be
slowly hydrolyzed on the forest floor resulting in a marked increase in sur-
face pH and a loss of ammonia nitrogen by volatilization. In a laboratory
study, Watkins and Strand (1970) measured losses of ammonia nitrogen rangingfrom 6 percent to 46 percent of the urea nitrogen applied to forest floor and
soil depending on the nature of the surface, surface pH, and rate of air flow
across the surface. Although some applied nitrogen is undoubtedly lost by
volatilization in the field, it is generally conceded that such losses are
small. Time of application is important, and forest fertilization projects
are usually conducted during the spring or fall months to take advantage ofprecipitation. Urea nitrogen is quickly distributed throughout the living
complex, becomes a part of the nutrient budget, and is cycled within the eco-system.
Fertilizer nitrogen may enter the aquatic environment by one of sev-
eral routes. The greatest potential source is direct application to exposedsurface water. This can be minimized by carefully marking and avoiding larger
streams during applications, but most applicators find it impractical to avoidsmall headwater streams. The size of stream which should be avoided has been
suggested, but standards have not been established. Ammonia nitrogen vola-tilized from the forest floor may be absorbed from the air by exposed surfacewater, but it is doubtful that this source adds significant amounts to streams.
Overland flow, or surface runoff, is a major source of nutrients in
streams of many areas but is not important in the Pacific Northwest where sur-face runoff rarely occurs. Subsurface drainage is another possible route of
entry of soluble forms of nitrogen into streams. Forest soils are excellentfilters for most plant nutrients because of their high exchange capacities and
the dense root systems which can absorb and recycle nutrients (Moore, 1970a).
However, measurable levels of ammonia-, nitrate-, urea-, and organic-nitrogen
are found in several streams being monitored for water quality in westernOregon and Washington.
There is an enormous literature concerning the effects of farm ferti-
lization on water quality but essentially none concerning the effects of forestfertilization. Soileau's (1969) extensive bibliography (701 entries) on ef-fects of fertilizers on water quality contains no references on effects of
forest fertilization.
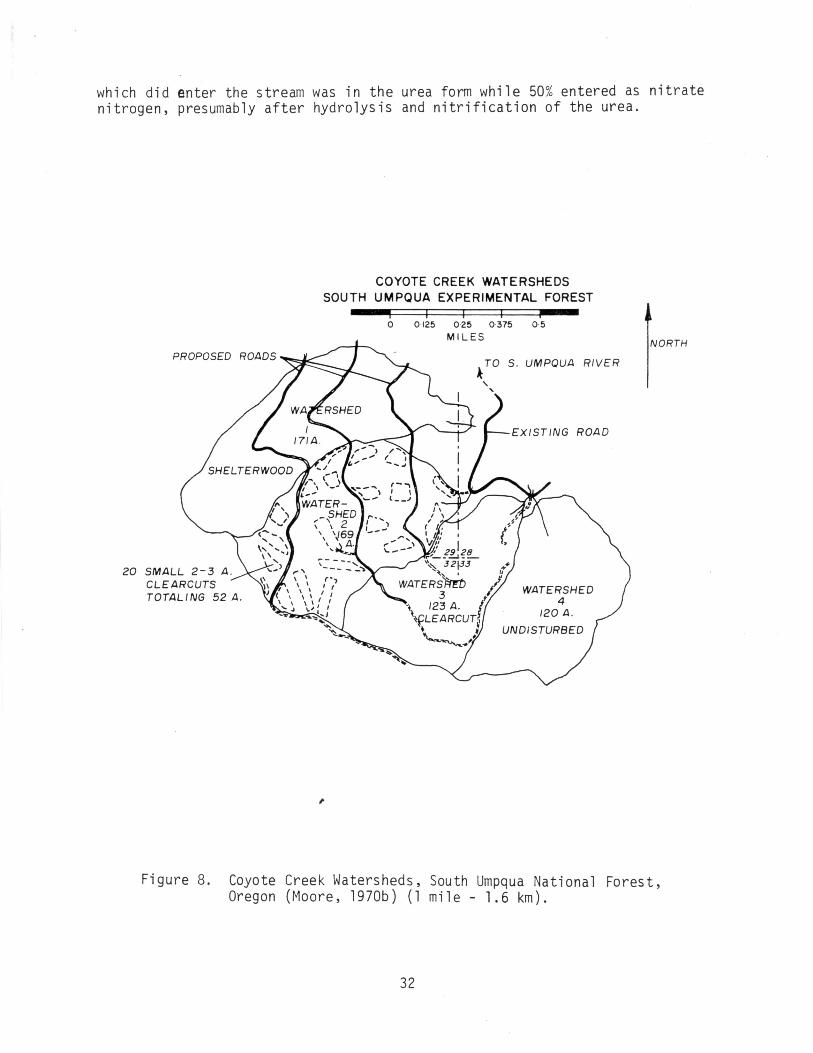
Several forest fertilization projects have been monitored recently
in the Pacific Northwest. Moore (1970b) measured the amounts and forms of
nitrogen entering streams during and following aerial application of 224 kg/haof urea nitrogen to an experimental watershed in southwestern Oregon in March
1970 (see Figure 8). Data obtained during the first 15 weeks after applicationare summarized in Tables 7 and 8. Urea concentrations increased slowly and
reached a maximum of .39 mg/kg urea-N 48 hours after application started.
Ammonia-N increased slightly above background but never reached 0.10 mg/kg.
Nitrate-N began to increase slowly the second day, reached 0.168 mg/kg in 72
hours and was 0.140 mg/kg at the end of 2 weeks. Nitrite-N was not detected.
Only 0.01 percent of the nitrogen applied to the watershed was found in the
stream up to 15 weeks after application. About 40 percent of the nitrogen
31
PROPOSED ROADS kTO S. UMPQUA RIVER
COYOTE CREEK WATERSHEDSSOUTH UMPQUA EXPERIMENTAL FOREST
I I I MINIM0 0 125 0 25 0 375 0 5
MILES
EXISTING ROAD
20 SMALL 2-3 A.CLEARCUTSTOTALING 524.
NORTH
which did enter the stream was in the urea form while 50% entered as nitratenitrogen, presumably after hydrolysis and nitrification of the urea.
Figure 8. Coyote Creek Watersheds, South Umpqua National Forest,Oregon (Moore, 1970b) (1 mile - 1.6 km).
32

Table 7. Concentrations of Fertilizer Nitrogen in Selected WaterSamples Collected at Coyote Creek Watershed 2, FollowingApplication of 225 kg urea-N/ha. (ppm)
Date Time Urea-N NH3-N NO
3-N Total
3/25 0800 .007 .001 .002 .010
3/26 0815 .437 .016 .040 .493
1230 .237 .012 .069 .318
2025 .171 .034 .067 .272
3/27 0805 1.389 .048 .107 1.544
1640 .606 .036 .150 .792
2005 .488 .029 .168 .685
3/28 0805 .075 .036 .117 .228
4/1 .007 .016 .092 .185
4/8 -- .028 .015 .140 .183
4/15 -- 0 .010 .030 .040
4/22 -- 0 .010 .021 .031
5/6 0 .013 .022 .035
5/27 -- 0 .004 .004
6/17 -- 0 .002 .002
7/8 -- 0 .006 .006
Table 8. Nitrogen Lost from Treated (WS-2) and Untreated (WS-4)Watersheds, South Umpqua Experimental Forest, DuringFirst 15 Weeks after Application of 225 kg urea-N/ha(pounds N)
Unit Urea-N NH3-N NO
3-N Total
WS-2 1.423 0.600 1.904 3.927
WS-4 0.049 0.135 0.038 0.222
Net loss 1.374 0.465 1.866 3.705
Percent ofTotal 37.1 12.5 50.4
33

1.4e don't know if these preliminary data are representative of whatcan be expected whenever any forested watershed is fertilized. However, com-parable concentrations of urea-, ammonia-, and nitrate-nitrogen have been foundin other monitoring studies in this region. Nitrite nitrogen is not expectedto occur in the well-aerated streams of the Pacific Northwest.
Thut and Haydu (1971) reviewed the effects of forest chemicals onaquatic life and concluded the concentrations of urea fertilizer and its break-down products are well below toxic thresholds for aquatic life. In some cases,at least, they feel forest fertilization may have a beneficial effect on foreststream productivity.
Research experience and long history of use have established that ourimportant forest chemicals offer minimum potential for pollution of the environ-ment when they are used properly. The key to proper use is an adequate appre-
ciation for the mechanisms by which chemicals behave and thorough understandingof the factors which influence the degree to which these mechanisms operate.
LITERATURE CITED
Barton, Glen T. 1966. Our food abundance. In Protecting our food. U.S.Dept. Agric., Yearb. Agric. 1966, p. 16-24.
Getzendaner, M. E. J. L. Herman, and Bart van Giessen. 1969. Residues of4-amino-3,5,6-trichloropicolinic acid in grass from applicationsof Tordon herbicides. J. Agr. Food Chem. 17:1251-1256.
Harris, C. I. 1967. Movement of herbicides in soils. Weeds 15:214-216.
Harris, C. I. 1968. Movement of pesticides in soils. J. Agr. Food Chem.17:80-82.
vloilanen, K. W., D. G. Crosby, C. J. Soderquist, and A. S. Wong. 1975.Dynamic aspects of pesticide photodecomposition. In Environmentaldynamics of pesticides. p. 45-60. R. Hague and V. H. Freed, eds.
Plenum, New York.
Moore, D. G. 1975. Impact of forest fertilization on water quality in theDouglas-fir region -- a summary of monitoring studies. p. 209-219.In: Proceedings 1974 national convention, Soc. Amer. For., New York.
Moore, D. G. 1970b. Forest, fertilization and water quality in the PacificNorthwest. Am. Soc. Agron. Abstr. 1970:160-161.
Morton, Howard L., E. D. Robinson, and R. E. Meyer. 1967. Persistence of2.4-D, 2,4,5-T and dicamba in range and forage grasses. Weeds15:268-271.
Norris, Logan A. 1967. Chemical brush control and herbicide residues in theforest environment. In Symp. Proc. Herbicides and vegetation manage-ment in forests, ranges, and noncrop lands. p. 103-123. Sch. For.,Oregon State Univ., Corvallis.
34

Norris, Logan A. 1968. Stream contamination by herbicides after fall rainson forest land. Res. Prog. Rep., West. Soc. Weed Sci. p. 33-34.
Norris, Logan A. 1970. Degradation of herbicides in the forest floor. InTree growth and forest soils. p. 397-411. C. T. Youngberg and
C. B. Davey, eds. Oreg. State Univ. Press, Corvallis.
Norris, Logan A. 1971. Chemical brush control--assessing the hazard. J.For. 69: 715-720.
Norris, L. A., M. L. Montgomery, and L. E. Warren. 1976. Leaching and per-sistence characteristics of picloram and 2,4-D on a small watershed
in southwest Oregon. p.35-36. In Abstr. of Weed Sci. Soc. Amer. annualmtg.
Reimer, C. A., B. C. Byrd, and J. H. Davidson. 1966. An improved helicopter
system for the aerial application of sprays containing Tordon 101
mixture particulated with Norbak. Down to Earth 22(1):3-6.
Soileau, J. N. 1969. Effects of fertilizers on water quality. Tenn. Val.Auth., Muscle Shoals, Ala. 107 p.
Strand, R. F. 1970. Aerial application problems--fertilizer distribution.Typewritten manuscript presented at Conf. Nutr. Probl. Pract.
Forest Land, Lake Wilderness Center, Maple Valley, Wash. 8 p.
Thut, Rudolph N., and Eugene P. Haydu. 1971. Effects of forest chemicals onaquatic life. In Forest land uses and stream environment. OregonState Univ., Corvallis. p. 159-171.
Watkins, S. H., and R. F. Strand. 1970. Volatilization loss of ammonia Nfrom urea applied to forest soils and forest floor materials. Am.
Soc. Agron. Abstr. 1970:164.
Note: Dr. Norris is project leader and principal chemist and Dr. Moore is re-
search soil scientist for Research Work Unit 1653 in the Pacific North-
west Forest and Range Experiment Station, USDA Forest Service. RWU
1653 is concerned with the behavior and impact of introduced chemicals
in the forest environment and is located at the Forestry Sciences Labor-
atory in Corvallis, Oregon.
35