i grafx process6 sig bro
TRANSCRIPT
A Proven Standard for Six SigmaiGrafx® Process™ for Six Sigma is the most full-featured, easy to use process analysis and simulation tool available and is specifically designed to help Six Sigma professionals understand and improve their processes. iGrafx Process for Six Sigma provides all of the functionality in iGrafx® FlowCharter® and iGrafx® Process™ plus integration with Minitab® and JMP® to run Rapid Design of Experiments, log simulation results, and Six Sigma method support .
iGrafx Process for Six Sigma is ideal for:
• Six Sigma Yellow Belts• Six Sigma Green Belts• Six Sigma Black Belts• Six Sigma Master Black Belts• Lean Six Sigma Practitioners• Lean Practitioners
Meet your objectives in:
• Six Sigma• Lean Six Sigma• Lean
Easily create:
• Flowcharts • Process Maps • Swimlane® Diagrams • Value Stream Maps • Cause & Effect Diagrams• FMEA Spreadsheets• Pick Charts • SIPOC Diagrams• BPMN Diagrams• Customized Templates• And more
Plus:
• Integration with Minitab® and JMP®• Discrete Event Simulation• Design of Experiments• Resource Modeling • “What-If” Analysis• Tabular & Graphical Reports
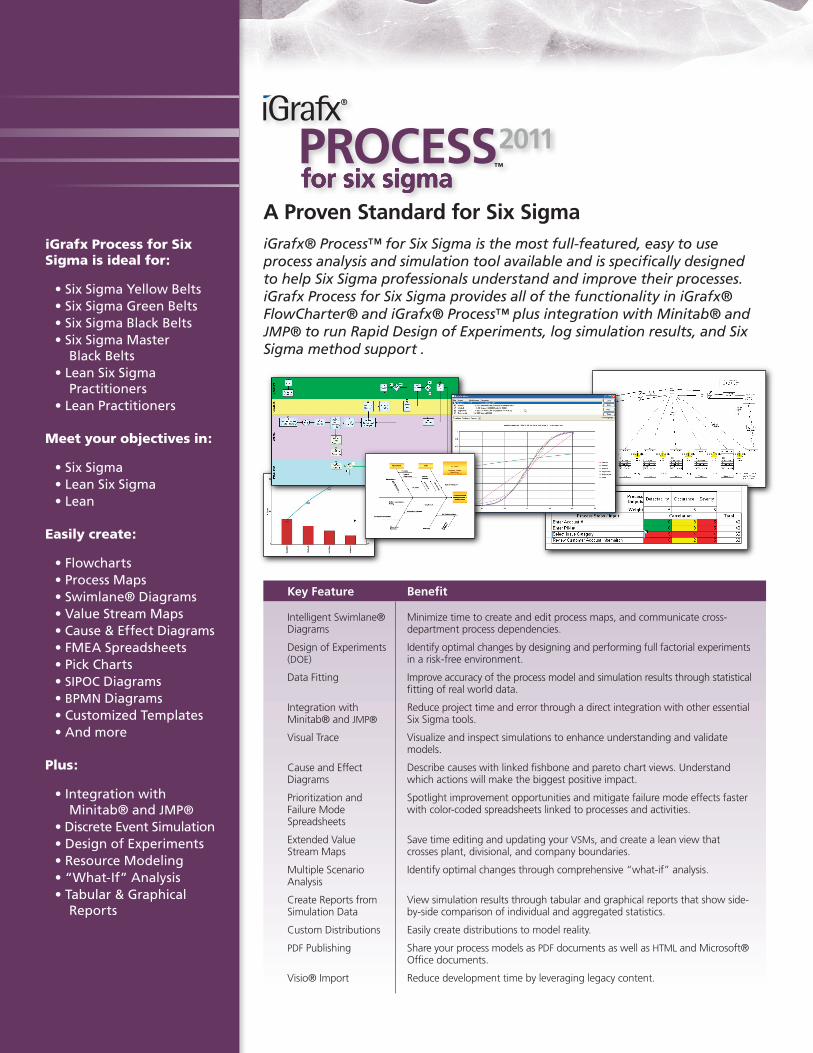
Key Feature
Intelligent Swimlane® Diagrams
Design of Experiments (DOE)
Data Fitting
Integration with Minitab® and JMP®
Visual Trace
Cause and Effect Diagrams
Prioritization and Failure Mode Spreadsheets
Extended Value Stream Maps
Multiple Scenario Analysis
Create Reports from Simulation Data
Custom Distributions
PDF Publishing
Visio® Import
Benefit
Minimize time to create and edit process maps, and communicate cross- department process dependencies.
Identify optimal changes by designing and performing full factorial experiments in a risk-free environment.
Improve accuracy of the process model and simulation results through statistical fitting of real world data.
Reduce project time and error through a direct integration with other essential Six Sigma tools.
Visualize and inspect simulations to enhance understanding and validate models.
Describe causes with linked fishbone and pareto chart views. Understand which actions will make the biggest positive impact.
Spotlight improvement opportunities and mitigate failure mode effects faster with color-coded spreadsheets linked to processes and activities.
Save time editing and updating your VSMs, and create a lean view that crosses plant, divisional, and company boundaries.
Identify optimal changes through comprehensive “what-if” analysis.
View simulation results through tabular and graphical reports that show side-by-side comparison of individual and aggregated statistics.
Easily create distributions to model reality.
Share your process models as PDF documents as well as HTML and Microsoft® Office documents.
Reduce development time by leveraging legacy content.

Increase Customer Satisfaction and Lower Costs
Many organizations use customer satisfaction, shareholder value and bottom line results to measure success. Six Sigma is a proven methodology for improving these metrics and iGrafx Process for Six Sigma is a proven tool within the Six Sigma community.
iGrafx Process for Six Sigma provides a visual framework for exposing hidden factories, bottlenecks and other inefficien-cies, enabling “quick hit” improvements. Additionally, multi-factor and multi-response Design of Experiments (DOE) can be executed as a risk-free simulation without impacting the real process. Then, simulation results can be analyzed in greater detail through a seamless
Global Headquarters
7585 SW Mohawk StreetTualatin, OR 97062Tel.: 503.404.6050Fax: [email protected]
EMEA Headquarters
Dr.-Johann-Heitzer-Str. 285757 KarlsfeldGermanyTel.: +49 8131 3175 100Fax: +49 8131 3175 [email protected]
For contact details visit:www.iGrafx.com/contact
© 2011 iGrafx, LLC. All rights reserved. Current Value Stream Map courtesy of Lean Enterprise Institute, Inc. SAP is a registered trademark of SAP AG in Germany and in several other countries. Printed in USA. 8/11 Job#00421c
iGrafx is an integrated suite of software and services for process excellence.
integration with both Minitab and JMP—a feature unique to iGrafx.
A Pillar of Process Excellence
iGrafx Process for Six Sigma is a powerful tool for Six Sigma professionals, but excels when integrated with other iGrafx components to form an enterprise wide approach to process excellence. When coupled with a client/server based central repository like iGrafx® Process Central® or iGrafx® Enterprise Central®, the iGrafx solution will help you bridge the gap between the major organization constituencies—IT, process initiatives and business analysts—to ensure a level of process consistency, management, history and control across the enterprise.
The DMAIC MethodologyiGrafx Process for Six Sigma has specific functionality to help users move through
the five inter-connected phases of the DMAIC methodology:
CONTROL the improved process
• Centrally manage all processes and related information *• Manage process knowledge and documentation through version control *• Share best practices through publication of approved process• Ensure improved process is deployed
• Run multiple simulation scenarios in a risk-free environment• Design and perform full factorial DOE• Identify improved process
• Determine causes of defects• Unveil opportunities for improvement• Perform “what-if” analysis through simulation and reporting• Fit empirical data to improve accuracy of results• Integrate with Minitab and JMP
• Process Maps • Pareto Charts• Value Stream Maps • SIPOC Diagrams• Cause and Effect Diagrams • Layout Diagrams
• Calculate costs, units, cycle times, resource utilization, process efficiency• Establish process capability by measuring defect levels• Calculate Rolled Throughput Yield (RTY)• Perform Failure Modes and Effects Analysis (FMEA)• Capture transaction level statistics for detailed process analysis
* Requires a server component
IMPROVE the current state process
ANALYZE data and process maps
MEASURE the process performance
DEFINE the problem and document the process
Looking for a jumpstart with iGrafx?
Our training and consulting services can help you apply the power of iGrafx even faster. For more information, please visit www.iGrafx.com/services.
Leverage expertise for a higher ROI
iGrafx tools are used by thousands of organizations throughout the world. Learn more at:
www.iGrafx.com [email protected] (503) 404-6050