i-beam by fea. composite structures, volume 100 . pp. 233...
TRANSCRIPT

http://go.warwick.ac.uk/lib-publications
Original citation: Nguyen, T.T., Chan, T.M. and Mottram, J.T.. (2013) Influence of boundary conditions and geometric imperfections on lateral–torsional buckling resistance of a pultruded FRP I-beam by FEA. Composite Structures, Volume 100 . pp. 233-242. ISSN 0263-8223 Permanent WRAP url: http://wrap.warwick.ac.uk/54473 Copyright and reuse: The Warwick Research Archive Portal (WRAP) makes the work of researchers of the University of Warwick available open access under the following conditions. Copyright © and all moral rights to the version of the paper presented here belong to the individual author(s) and/or other copyright owners. To the extent reasonable and practicable the material made available in WRAP has been checked for eligibility before being made available. Copies of full items can be used for personal research or study, educational, or not-for-profit purposes without prior permission or charge. Provided that the authors, title and full bibliographic details are credited, a hyperlink and/or URL is given for the original metadata page and the content is not changed in any way. Publisher’s statement: This is the author’s version of a work that was accepted for publication in Composite Structures. Changes resulting from the publishing process, such as peer review, editing, corrections, structural formatting, and other quality control mechanisms may not be reflected in this document. Changes may have been made to this work since it was submitted for publication. A definitive version was subsequently published in Composite Structures. Volume 100, pp. 233–242. (June, 2013) doi:10.1016/j.compstruct.2012.12.023 A note on versions: The version presented here may differ from the published version or, version of record, if you wish to cite this item you are advised to consult the publisher’s version. Please see the ‘permanent WRAP url’ above for details on accessing the published version and note that access may require a subscription. For more information, please contact the WRAP Team at: [email protected]

1
T. T. Nguyen, T. M. Chan and J. T. Mottram, ‘Influence of boundary conditions and
geometric imperfections on establishing lateral-torsional buckling resistance of a
pultruded FRP I-beam by finite element analysis,’ Composite Structures, 100 (June)
(online 10 February 2013). ISSN: 0263-8223
http://dx.doi.org/10.1016/j.compstruct.2012.12.023
Influence of Boundary Conditions and Geometric Imperfections on Lateral-
Torsional Buckling Resistance of a Pultruded FRP I-beam by FEA
T.T. Nguyen a, T.M. Chan
a,* and J.T. Mottram
a
a School of Engineering, University of Warwick, Coventry, CV4 7AL, UK.
Abstract
Presented are results from geometric non-linear finite element analyses to examine the
lateral torsional buckling (LTB) resistance of a Pultruded fibre reinforced polymer
(FRP) I-beam when initial geometric imperfections associated with the LTB mode
shape are introduced. A data reduction method is proposed to define the limiting
buckling load and the method is used to present strength results for a range of beam
slendernesses and geometric imperfections. Prior to reporting on these non-linear
analyses, Eigenvalue FE analyses are used to establish the influence on resistance of
changing load height or displacement boundary conditions. By comparing predictions
for the beam with either FRP or steel elastic constants it is found that the former has a
relatively larger effect on buckling strength with changes in load height and end
warping fixity. The developed finite element modelling methodology will enable
parametric studies to be performed for the development of closed form formulae that
will be reliable for the design of FRP beams against LTB failure.
* Corresponding author. Tel.: +44 (0)24 765 22106; fax:+44 (0)24 76 418922
E-mail addresses: [email protected] (T.T.Nguyen), [email protected] (T.M.Chan),
[email protected] (J.T.Mottram).

2
Keywords: Lateral-torsional buckling; geometric non-linear finite element analysis;
fibre reinforced polymer; load height; warping restraint; initial geometric imperfections.

3
Notation
ey Load eccentricity displacement normal to the minor axis plane of the beam
cross-section (mm)
b Breadth of I-beam (mm)
h Height of I-beam (mm)
k Restraint factor for lateral flexural bending at end supports; 0.5 for full
restraint to 1.0 for fully unrestrained
kw Restraint factor for warping at end supports; 0.5 for full restraint to 1.0 for
fully unrestrained
C1 Factor to account for the type of moment distribution and support condition
C2 Factor to account for the vertical position of the load with respect to the
shear centre (centroidal axis) of the I-beam
Cb Moment modification factor for non-uniform moment distribution for
laterally unsupported span when both ends of the beam are braced
E Modulus of elasticity (kN/mm2)
EL Longitudinal modulus of elasticity (kN/mm2)
ET Transverse modulus of elasticity (kN/mm2)
G Shear modulus (kN/mm2)
GLT In-plane shear modulus (kN/mm2)
Poisson’s ratio (for steel)
LT Major Poisson’s ratio
Iw Warping rigidity (mm6)
Iz Second moment of area for flexure about the beam’s minor axis (mm4)

4
J Torsional rigidity (mm4)
L Span of beam or height of column for defining magnitude of out-of-
straightness (mm)
w Vertical deflection of shear centre at mid-span (mm)
Mcr Elastic critical buckling moment of resistance (kNm)
Mcrp Elastic critical buckling moment including the influence of pre-buckling
displacements (kNm)
P Central point load (kN)
Pcr Elastic critical buckling load of simply supported beam subjected to centre
point loading (kN)
Pcr,FEA Elastic critical buckling load obtained from linear (Eigenvalue) Finite
Element Analysis (kN)
PLimit Limiting buckling load (kN)
PLimit/Pcr Normalized buckling load for influence of geometric imperfections
Pcr,T Elastic critical buckling load when P is applied on Top flange (kN)
Pcr,S Elastic critical buckling load when P is applied at Shear centre (kN)
Pcr,B Elastic critical buckling load of beam P is applied on Bottom flange (kN)
Pcr,Fixed Elastic critical buckling load of beam with end warping fully Fixed (kw =
0.5) (kN)
Pcr,Free Elastic critical buckling load of beam with end warping fully Free (kw = 1.0)
(kN)
x Distance along beam from one end the other end (mm)
zg Distance (height) from the shear centre to the point of load application (mm)

5
s Maximum lateral deformation due to out-of-straightness geometric
imperfection (mm)
sx Initial lateral deformation distribution along the beam due to out-of-
straightness geometric imperfection (mm)
t Maximum angle of twist due to twist geometric imperfection (degrees)
tx Initial twist distribution along the beam due to twist geometric imperfection
(degrees)
Ux Displacement in X-direction (mm)
Uy Displacement in Y-direction (mm)
Uz Displacement in Z-direction (mm)
URx Rotation about X-axis (degrees)

6
Introduction
Shapes and systems of Fibre Reinforced Polymer (FRP) made by the pultrusion
processing method [1] are finding applications in civil engineering works, alongside
construction components of conventional materials such as steel, concrete and
aluminium. Standard Pultruded FRP (PFRP) shapes are thin-walled and have the same
cross-sectional shapes as found in conventional steelwork. They consist of E-glass fibre
reinforcement (layers of unidirectional rovings and continuous mats) in a thermoset
resin based matrix. Layers are not necessarily of constant thickness or flat. Technical
information on the pultrusion process, and PFRP shapes themselves, is found in
American pultruders’ Design Manuals [2, 3]. Pultruded material has a density at 1900
kg/m3 that is under one-quarter the density of structural steel. Although these PFRP
shapes are similar to steel sections, their structural behaviour is different. Direct
strengths (in the direction of pultrusion) can be over 200 N/mm2 that is comparable with
structural steel. However, the longitudinal (tensile or compressive) modulus of elasticity
(EL) is up to 10 times lower at 20-30 kN/mm2. The modulus of elasticity perpendicular
to the direction of pultrusion (ET) is about one-third of the longitudinal value [2, 3]. The
in-plane shear modulus (GLT) can be between one-tenth and one-quarter of the value of
EL. In terms of the material response to direct stress under static loading, it is virtually
linear elastic to failure and can be taken as linear elastic under shear to the shear strains
experienced in practice. If loading is over the long-term the viscoelastic nature of FRP
will make the material response non-linear. Worldwide the number of engineering
structures using pultruded standard shapes has increased in recent years, for the reasons
given in Mottram [1] and Bank [4].

7
A major factor preventing greater penetration of standard PFRP shapes in civil
engineering works is the lack of recognised guidelines for practitioners to have full
confidence in their structural designs, say, for framed structures. One source of
guidance is from the pultrusion companies who have Design Manuals [2, 3] specific to
their range of pultruded shapes. Further guidance, that has no legal standing, can be
found in the 1996 EUROCOMP Design Code and Handbook [5] and the more recent
Italian publication [6] that is a guide for the design and construction of structures made
of FRP pultruded elements. The Pultrusion Industry Council of the American
Composites Manufacturers Association commenced an action, in 2007, of preparing a
design standard for the ‘Load and Resistance Factor Design of Pultruded Fibre-
Reinforced Polymer Structures’ [7]. A pre-standard was finalised in 2010, and it is
expected that the guidelines can be adopted in 2013 as a national ASCE standard. To
have confidence in the resistance formulae in a design standard it is desirable to have
them evaluated by a combination of computational modelling and physical testing.
Owing to high strength-to-stiffness ratio of the material, the design of PFRP members
(in braced frames of simple construction) is normally governed by elastic deflections
and/or elastic buckling instabilities and rarely by material strength limitations [5, 8]. In
other words, to execute the Ultimate Limit State (ULS) design approach the different
instability modes must be quantified by a combination of rigorous numerical analysis
and physical testing. As a type of global instability, Lateral-Torsional Buckling (LTB) is
commonly observed in laterally unrestrained beams of open thin-walled sections that
are subjected to flexure about their major axis. The beam loses stability in the LTB
mode when the member bends laterally and twists along its length, without any cross-
section distortion. Because a beam’s moment of resistance to LTB is influenced by

8
having relatively small lateral (minor-axis) flexure and torsional stiffness, it is observed
that PFRP I-shapes are susceptible to this failure mode governing in ULS design [9].
Researchers can determine LTB resistance, either by a theoretical treatment (analytical
or computational) or by physical testing. Because the latter approach is expensive and
technically challenging, for the reasons that are uncovered from assessing the reported
test series [9-13], a theoretical treatment is always required to populate parameters that
cannot be characterised by physical testing [13-15].
Numerical models can be divided into those that account for geometric imperfections
and those that assume the beam’s geometry is perfect. It is the analytical solutions for
the problem of a ‘perfect’ isotropic beam with constant moment along length that gives
the well-known closed form formula for the elastic critical buckling moment of
resistance (Mcr). This Mcr solution is the theoretical upper bound resistance that forms
the basic strength value towards the preparation of guidelines for the reliable and safe
design of structural steel I-beams, as given in design standards BS EN 1993-1-1:2005
and ANSI/AISC 360-10.
For doubly symmetric cross-sectional (steel) beams, the lateral-torsional buckling
resistance moment may be calculated using [16]:
2 222
wzcr 1 2 g 2 g2 2
w z z
= + + -kL GJIEI k
M C C z C zk I EIkL
(1)
The variables in Equation (1) are defined in the Notation section. This equation can be
used to determine Mcr when calculating LTB resistance in accordance with the design
procedure in Eurocode 3 for steel (BS EN 1993-1-1:2005).

9
In the specific case, when loading is a vertical point load (P) at mid-span, and beam
ends are free to warp (kw = 1.0) and allowed to rotate about major and minor axes (k =
1.0), the buckling resistance load Pcr is given by:
2 2
2wz
cr g g3 2
z z
5.39+ + 0.63 - 0.63
IEI L GJP z z
L I EI
(2)
In Equation (2) zg is the height of the load from the shear centre. zg is 0.0 at the shear
centre and positive when above and negative when below.
According to American steel standard ANSI/AISC 360-10 Mcr may also be determined
for I-beams from the simpler formula:
2
wcr b 2
z z
π=
I L GJM C
L I EI (3)
Unlike Equations (1) and (2), Equation (3) is valid only when the level of loading
coincides with the beam’s shear centre (i.e. for zg is zero).
Italian guidelines of 2007 [6] recommend that Mcr be calculated using Equation (1) with
both restraint factors k and kw equal to either 1.0 or 0.5. The Design Manuals from two
American pultruders [2, 3] recommend that designers calculate Mcr using Equation (1),
with k and kw assumed to be equal to 1.0 (for the lowest LTB moment of resistance).
Moreover because they take zg = 0.0, the allowable load tables in [2] and [3] are
ignoring the reduction in strength from having load applied on the top flange. Reliable
calculation of the elastic critical buckling strength does require the two elastic constants
EL and GLT to be measured, either by testing coupons or full-sections [4].

10
The American pre-standard for PFRP structures [7] recommends Mcr to be calculated
using Equation (3), with the expression for Cb formula taken directly from ANSI/AISC
360-10, and with the ‘full-section’ elastic constants of E and G replaced, respectively,
by the Longitudinal modulus of elasticity EL and the in-plane shear modulus GLT for the
PFRP material.
The aim of the work reported in this paper is to use Finite Element Analysis (FEA) to
study the change in LTB resistance of a, single sized, PFRP I-beam at different spans
that is influenced by varying load height, end displacement boundary conditions and
initial geometric imperfections. The shape is chosen from the standard range of I-beams
pultruded in America [2, 3]. To be consistent with the set-up in a series of physical tests
at the University of Warwick, the problem analysed, using ABAQUS, is that of a
simply supported beam (for Major axis flexure) having a vertical point load at mid-span.
Verification of the correct FE modelling methodology to simulate what can exist in
practice will be done by combining results from the experimental and finite element
work. Additional numerical results from FEA will be used with Equation (2) and the
‘curve fitting’ method of Dutheil [17] to account for the modal interaction of local and
global buckling modes [18,19], to prepare a calibrated closed form formula for clauses
in a future Eurocode design standard for FRP material elements.
To ensure the FEA results are appropriate when the beam possesses initial geometric
imperfections it is necessary to use the geometric non-linear solver in ABAQUS. It
will be shown that the calculated vertical load against vertical deflection response of a
PFRP beam does not always give a distinct buckling (bifurcation) point to signal the
onset of LTB failure. To overcome the absence in numerical calculations of a definite

11
elastic critical buckling load (for the classical bifurcation point) a data reduction method
is presented by the authors that will provide the limiting buckling load from the finite
element (FE) results.
Finite element modelling methodology
In this study the nominal geometry of the cross-section for the PFRP I-beam is 101.6
50.86.4 mm (or 421/4 in. [2, 3]). The height has the notation h, which is used to
define beam slenderness through non-dimensional ratio L/h. In Figure 1 the global
Cartesian (XYZ) co-ordinate system is shown. The Y-axis is for the section’s major axis,
the Z-axis is for the minor axis and the X-axis is along the beam’s centroidal axis. The
nominal values for the sectional properties are: Iz is 1.41105 mm
4, Iw is 3.1610
8 mm
6
and J is 1.59104 mm
4. These are required later when Equation (2) is used to calculate
the elastic critical buckling load, Pcr. The flanges and web panels are given orthotropic
properties, defined by the four elastic constants of EL, ET, GLT and LT [5, 10].
ABAQUS [20] offers several options to input mechanical properties including: a
‘microscopic’ approach (micromechanical modelling requiring constituent matrix and
fibre reinforcement properties); a ‘macroscopic’ approach (where a layer or panel is
taken to be a single orthotropic material); a ‘mixed’ approach (the panel is modelled as
a lamination comprising a number of discrete ‘macroscopic’ orthotropic layers).
Because the four elastic constants have previously been determined by coupon testing
and micro-mechanical modelling [19, 21] the ‘macroscopic’ approach is appropriate for
this FE work.
It is observed that mechanical properties of PFRP shapes can change with pultruder.
This change is due to differences in: how a property is measured; processing conditions;

12
the matrix; the number of reinforcement layers; the fibre arrangement and the fibre
volume fractions. To illustrate the likely differences, Table 1 collates test data for the in-
plane shear modulus (GLT). Listed in column (2) are ranges of values taken from the
nine sources defined in column (1). Shear modulus is difficult to measure because it is
challenging to have a representative volume of PFRP material subject to pure shearing.
Using knowledge of measurements of the elastic constants and the findings of the
review by Mottram [28], for the determination of in-plane shear modulus, engineering
judgement has been used to establish that, for this FE work, EL is 24 kN/mm2, ET is 8
kN/mm2, GLT is 4 kN/mm
2 and LT is 0.3. It is noted from the literature that the
mechanical properties of flange and web material are actually slightly different. Since
flanges and web thin-walled panels are assumed to be of the same orthotropic material,
any influence this secondary difference might have on FE result has been ignored.
Moreover, EL and ET are for direct tension (or direct compression) and, because of the
layered construction, are not the moduli if the panel is subjected to flexure. By correctly
assuming that the material response is linear elastic to a strain that will exceed the strain
at LTB failure, the FEA does not need to consider a material failure criterion. Moreover,
the influence, if any, of residual stresses throughout the cross-section, which are
unknown in pultruded FRP shapes, is neglected too.
The choice of element to create a mesh is between solid and shell types of elements.
Linear elastic flat shell elements have successfully been adopted in previous FE studies
with thin-walled FRP structures [10, 12, 29, 30]. The element chosen is the second-
order ABAQUS/Standard thick shell element S8R, having 8-nodes and six degrees of
freedom per node. The formulation for the element stiffness matrix adopts the Mindlin
plate theory (for first-order shear deformation) and so this thick shell element has
13
displacement compatibility that avoids there being any discontinuities between element
sides. This FE modelling attributes is known to give a more accurate shell element in a
coarser mesh [31].
Following the boundary conditions defined by Trahair [32] for a simply supported
beam, both ends are fully restrained for Y and Z translational displacements (Uy and Uz)
and rotation about the X-axis (URx). Ends are free to rotate about major and minor axes
(for k = 1.0) and allowed freely warp (kw = 1.0). Because effective length factors k and
kw may vary from 0.5 to 1.0, a parametric study could consider a number of distinct
displacement boundary conditions. FEA results will be presented later for the two end
conditions of either having both k and kw = 1.0, or having k =1.0 and kw = 0.5. In what
follows these two displacement boundary conditions are given labels BC1 and BC2.
BC1 is specified in the FE modelling by setting Uy = Uz = URx = 0 for all the nodes in the
cross-section, at both ends. At one end, the node located at the cross-section’s shear
centre has its Ux nodal displacement set to zero to remove a rigid-body movement. To
model the BC2 end condition the ends are fixed against warping. As Figure 1 shows a
vertical plate, comprising of R3D4 rigid surface elements, is added at the ends. Because
the beam flanges must deform in accordance with the movement of the ‘rigid’ plate this
modelling feature fully restrains the warping. As the movement of the rigid plate is
controlled by a single reference node at each end, translational and rotational
displacement restraints are imposed to the node at the I-beam’s centroid. Figure 1 shows
that to obtain BC2 one end requires this node have Ux = Uy = Uz = URx = 0, while at the
other end the equivalent node has Uy = Uz = URx = 0.

14
Mesh specification has the shell elements constructed with an aspect ratio close to one,
as this can eliminate any loss in numerical reliability due to computation for the
inclusion of shear flexibility. To create the beam’s mesh the shell elements are placed at
the mid-planes of the two flanges and web panels. Equally spaced, there are five nodes
(four shell elements) across the 50.8 mm flange width and nine nodes (eight elements)
over the web’s height of 95.6 mm. This mesh specification gives an element with side
lengths of 12.7 by 12.7 mm for flanges and 11.9 by 12.7 mm for web. As shown in
Figure 1 one metre length of the 101.650.86.4 mm I-shape requires 1108 elements.
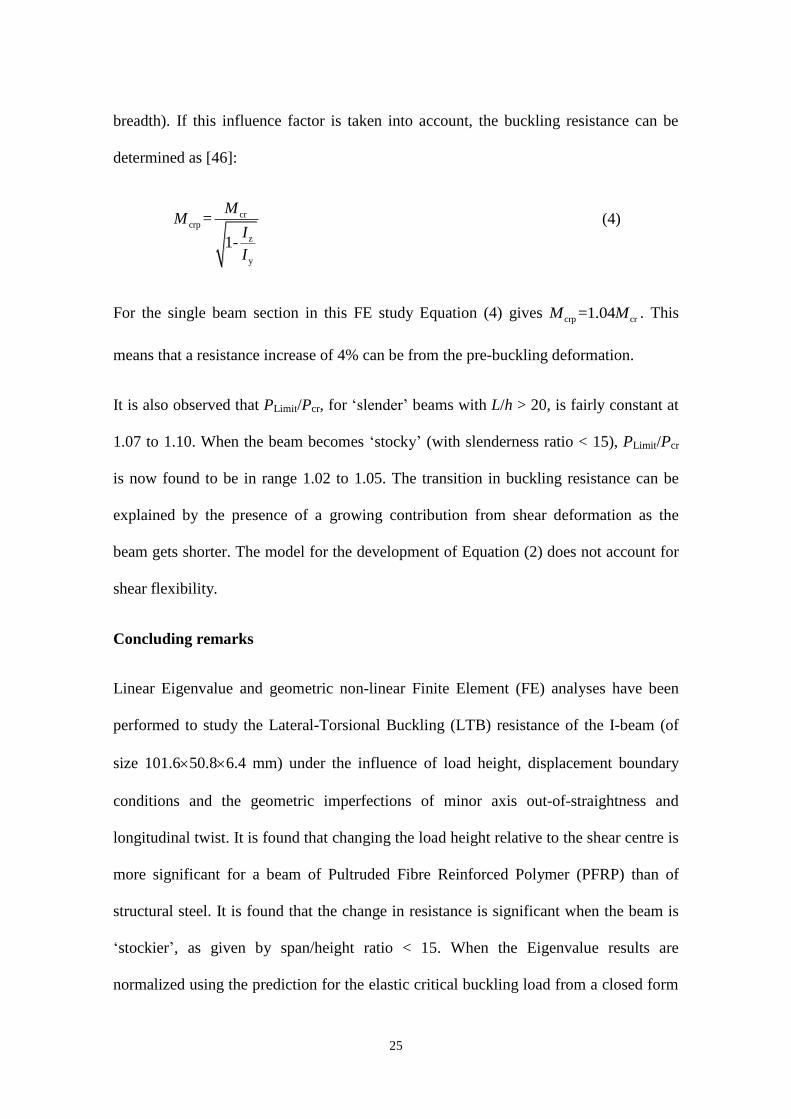
Table 2 reports the elastic critical buckling load (Pcr,FEA) as the mesh size is refined.
These FE results are from Eigenvalue analyses with a perfectly straight beam, BC1 end
conditions and shear centre point load (P) at mid-span. It can be seen that there is
insignificant change in Pcr,FEA when the element side length is < 12.7 mm. However, it
is seen that on doubling the side length to 25.4 mm the calculated bifurcation load is
increased by 10%. Shell elements with side lengths of 12.7 mm or less are used in the
mesh specification for the FE results presented next.
The parametric studies have numerical simulations for both linear Eigenvalue analyses
and geometric non-linear analyses. Eigenvalue buckling analysis predicts the elastic
critical buckling load (Pcr,FEA) of a linear elastic beam where the change in beam
geometry is neglected on increasing loading, up to the bifurcation. By applying
perturbations to the mesh geometry of the unloaded beam, and looking for local and
global deflections that could promote the onset of instability due to second-order
effects, the FEA gives load factors (the Eigenvalues) for buckling failures. The inputted
load in the FE model is multiplied by the outputted load factor to obtain the elastic
critical buckling load. The associated eigenvector to each Eigenvalue establishes the

15
corresponding mode shape. The mode shape describes how the structure buckles, but
gives no information for actual load-deflection response. It can be expected that the
lowest Eigenvalue is for the mode having the lowest Pcr,FEA.
In contrast, a non-linear geometric analysis predicts the actual load-deflection response
by applying the load in small increments and evaluating the current (static equilibrium)
deformation state at each increment. The load follows the deformation of the linear
elastic beam until instability occurs, and this corresponds to what will happen in
practice. There is no material non-linearity as it is assumed the PFRP material behaves
perfectly linear elastic. This modelling assumption is acceptable, providing loading (to
failure) is short-term and deformations from material viscoelasticity remain small.
ABAQUS [33] will solve the problem of a geometric non-linear structural problem,
having a falling load-deflection branch, following instability failure, by employing a
modified Riks method. This commonly used non-linear numerical method, also known
as the arc-length method, was originally derived by Riks [34], following on from
pioneering work by Wempner [35]. Later the arc length method was improved for
computational efficiency by Crisfield [36].
As the post-buckling response is not the main topic under consideration, the Riks
analysis was terminated a few increments after the beam had become unstable and its
deformation was progressing into the post-buckling region.
Initial geometric imperfection is introduced into the beam’s FE mesh by modifying the
nodal coordinates through the adoption of a vector field. The out-of-straightness
imperfection was obtained by scaling the first Eigenvalue buckling mode shape for
Euler (flexural) buckling of a perfectly straight concentrically loaded column. The

16
deformed shape (exaggerated) from the Eigenvalue analysis is shown in Figure 2. The
geometric definition for the twist imperfection was acquired from the deformed shape of
an ‘imperfection-free’ beam subjected to a pure ‘twisting’ moment, that was generated
by a torque at the free end, created by applying there a couple of magnitude Pb (Figure
3). The static analysis deformation for twisting along the length of the I-shape is shown
in Figure 4.
Influence of load height
LTB resistance is influenced by the vertical distances of load (zg) from the shear centre
due to the additional torque about the longitudinal (centroidal) axis that is generated
from the lateral movement of the vertical point load when instability happens. Because
the torque acts in the opposite sense to the LTB twist rotation when the load is applied
below the shear centre the buckling resistance will increase. Likewise, when load acts
above the shear centre, the additional torque acts with the beam’s rotation to decrease
buckling resistance. This behaviour has been confirmed by Sapkás and Kollár [37] and
Machado and Cortínez [38] in their numerical studies on the same instability mode of
failure.
In this study, the effect on resistance of changing load height zg is established by
Eigenvalue analyses that obtain the bifurcation load with displacement boundary
conditions BC1. The span (L) varies from 1.0 to 5.0 m; which is for slenderness (L/h)
ratios from about 10 to 50. In the FE model the mid-span point load is positioned along
the Z-Z axis at the top flange and web junction (zg = 47.6 mm), shear centre (zg = 0.0
mm) and at bottom flange and web junction (zg = -47.6 mm). Note that these values of
zg are 3.2 mm below what they will be when the actual beam section is loaded. By

17
changing the elastic constants to those for structural steel (E is 210 kN/mm2 and is
0.3) the effect on Pcr,FEA for a beam of this isotropic material is established. To
distinguish between the Pcr,FEAs for the three load heights they are given the notation
Pcr,T, Pcr,B and Pcr,S for load at Top flange, at Shear centre and at Bottom flange,
respectively. The subscript FEA has been removed from the notation for these three
critical elastic buckling loads.
Plotted in Figure 5 are LTB load ratios Pcr,T/Pcr,S and Pcr,B/Pcr,S against slenderness for
the beam of either FRP or steel. It is obvious that for the same beam configuration, the
closer the buckling load ratios are to 1.0, the less significant is the load height influence.
The higher Pcr,B/Pcr,S is, and the lower Pcr,T/Pcr,S is for PFRP compare to steel shows that
the change of load height is more significant for the composite material. The maximum
difference between the steel and PFRP curves is 11% at the lowest slenderness ratio of
9.8, and the minimum difference is 4%, when L/h is 49.2.
Plotted in Figure 6 is the normalized LTB load Pcr,FEA/Pcr versus L/h for the PFRP
beam. Pcr was calculated using Equation (2). Because the normalised load does not
deviate significantly from 1.0, the three curves in the figure confirm that Equation (2)
gives Pcr,FEAs similar to those from the Eigenvalue FEA with the same parameter values.
When slenderness L/h is < 15 the reliability of Equation (2) in predicting LTB
resistance is seen to decrease.
Figure 7 is for plots of mid-span vertical point load (P) with mid-span vertical
deflection (w) for a virtually straight beam. The beam has a span of 2 m and the out-of-
straightness geometric imperfection has maximum amplitude of span/20000. From the
three load-deflection curves in the figure it can be seen that Pcr,FEA (for the onset of LTB

18
failure) depends on zg. Instability happens when the beam’s vertical stiffness (P/w)
dramatically reduces. It is observed that until the instability starts to develop, the three
P-w curves are identical, and so initial vertical stiffness is not influenced by the load
height. Mohri et al. [39] recorded a similar observation when analyzing the buckling
behaviour of steel beams. It is also worth noting that, from a designer’s point of view,
when the load is applied below shear centre (i.e. zg is negative), the governing limit state
for the PFRP beam section can be a serviceability deflection limit.
Influence of end warping fixity
When a thin-walled cross-section has an open shape its stiffness under torsion, acting
about the centroidal axis, is the sum of torsional stiffnesses from uniform (St. Venant)
torsion (governed by torsional rigidity GLTJ or GJ) and from non-uniform torsion
(controlled by warping rigidity ELIw or EIw). When the ends of the beam have warping
fully fixed the state of non-uniform torsion will be dominant and because the stiffness to
twisting deformation increases, so does the resistance to LTB failure. On the other hand
if warping at the ends is free, the state of non-uniform torsion reduces (it will be present
either side of the mid-span when a torque is generated by P) and the LTB resistance is
the lower bound for this end displacement boundary condition. It is because the free
warping condition is for lowest strength that kw is specified to be 1.0 in design, such as
given by the closed form Equations (2) and (3). Minghini et al. [40] investigated by
analysis the critical load of a PFRP portal frame, where the column ends were either
free warping or fully warping fixity. They found that there was a 40% increase in
buckling load between these two bounds on a displacement boundary condition.

19
Plotted in Figure 8 is the ratio of elastic critical buckling loads with BC2 for end
warping fully restrained (Pcr,Fixed) and BC1 for warping fully free (Pcr,Free), for
slenderness ratios from 9.8 to 49.2. For convenience the subscript FEA has been
removed from these two FE Eigenvalue solutions. The top curve is for FRP and the
lower curve is for steel elastic constants. It is noted that the contribution of non-uniform
torsion stiffness to the total torsional stiffness (defined by ELIw/(ELIw+GLTJ) or
EIw/(EIw+GJ)) is bigger for FRP, and so the effect of changing the warping restraint
from free to fixed is greater for the same beam geometry and displacement and loading
boundary conditions. It can be seen from the figure that Pcr,Fixed/Pcr,Free for FRP varies
from 1.13 to 1.66 and for steel from 1.07 to 1.48. The maximum difference between
steel and FRP is 13%, when L/h is 14.8. The minimum difference of 4.3% is found to be
at the slenderness ratio of 44.3.
It is well-known [32] that the effect of warping torsion reduces as the span gets longer,
such that its influence on buckling resistance reduces too. As the contribution of
warping torsion (on total torsion) is highest with end warping fixed, the reduction in
buckling resistance is biggest when kw = 0.5. As consequence the ratio Pcr,Fixed /Pcr,Free is
higher for stockier beams. The result of interaction of the two torsional stiffnesses on
LTB strength is seen from the curves plotted in Figure 8.
Influence of initial geometric imperfections
In this study only the influence of expected manufacturing imperfections on the
geometry of the PFRP I-shape are considered in a FE parametric study. Another
‘imperfection’ that is inherent will be the eccentricity of load from having the vertical
load offset a distance, ey, from the Z-Xplane. This imperfection introduces a ‘secondary’

20
moment of magnitude Pey that will either act with, or against the beam deformation
induced by the presence of geometric imperfections [41]. In other words the presence of
a larger geometric imperfection can be employed to account for the load eccentricity
that is due to tolerances found on on-site or in laboratory testing. As a result this
particular form of imperfection is not included in the FE modelling. Structural PFRP
shapes are pultruded to possess acceptable geometric imperfections in the form of out-
of-straightness, flatness, twist, angularity, etc. It is imperative to include these geometric
imperfections in the FE modelling methodology as their existence in practice will lower
the LTB buckling resistance. It could be argued that an acceptable approach in FEA is
to scope geometric imperfections, residual stresses and load eccentricity by modelling
the dominant type of imperfection with a relatively high magnitude. Investigated next is
the influence on LTB resistance of changing the two key geometric imperfections of
minor axis out-of-straightness and (longitudinal) twist. These two geometric
imperfections are directly linked to the two (governing) LTB deformations of lateral
flexural and cross-section twist, respectively.
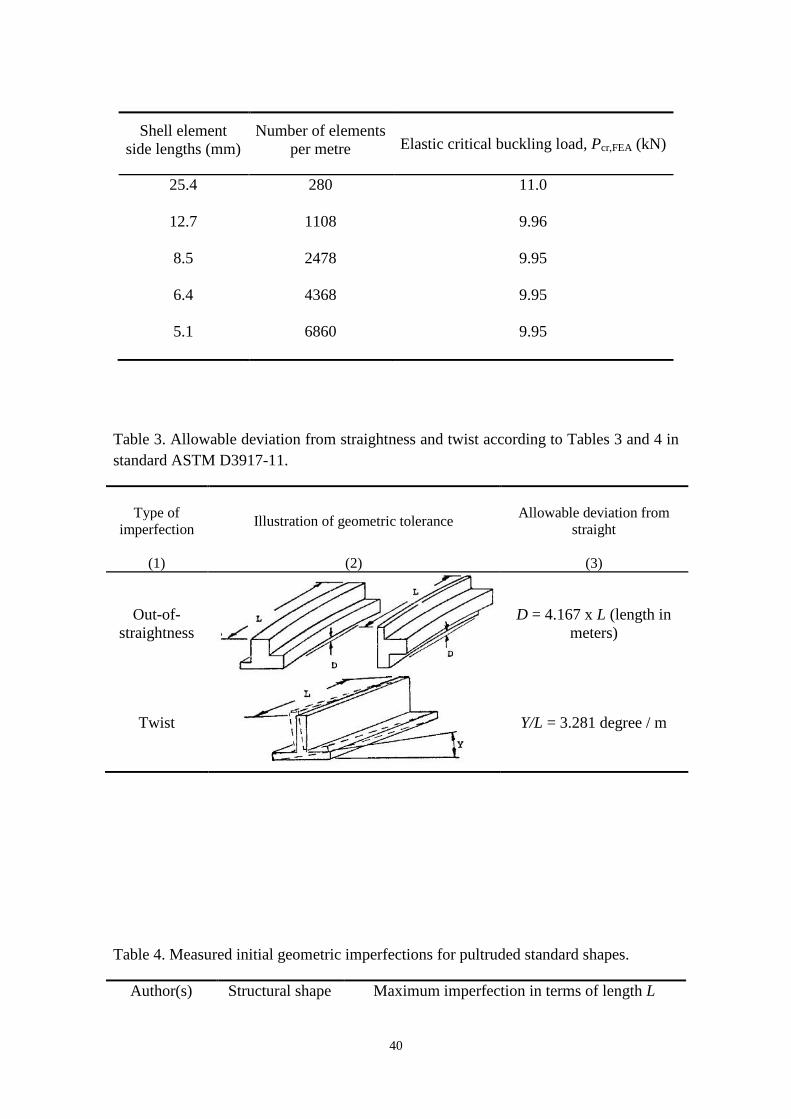
The question to next address is how large are the two geometric imperfections to be?
Maximum allowable magnitudes can be based on ASTM D3917-11 for Standard
Specification for Dimensional Tolerance of Thermosetting Glass-Reinforced Plastic
Pultruded Shapes [42]. Table 3 reports information taken from Tables 3 and 4 in ASTM
D3917-11 to give the ‘allowable deviation from straight’ per unit length. Column (1)
lists the type of imperfection and column (2) provides an illustration. In column (3) the
values of the allowable deviation from straightness (s) or twist (T) is reproduced. The
standard has made the assumption that the initial lateral out-of-straightness (sx), along
a beam of length L, to be defined by the geometric relationship

21
s
π= Δ sinsx
x
L
. (5)
For the initial twist imperfection the assumed distribution along the length is given by
tΔ Δ sin2
tx
x
L
. (6)
In Equations (5) and (6) x is the distance along the beam from one end to the other end.
It is noted that the maximum twisting allowance in 2011 version of ASTM D3917 is
three times larger than in the previous version of 2002. The reason for this significant
change has not been given provenance by the drafting committee. A maximum limit on
the twist angle is not given in ASTM D3917-11; it was stated to be 3 degrees in 2002.
Table 4 reports measured values for the magnitude of geometric imperfections, in terms
of L, for a range of standard pultruded standard shapes [2, 3]. In column (1) the source
to the data is given. Column (2) gives the form of shapes characterised by an ‘in-house’
measurement method of the research centre, and results are listed in column (3). It is
noted that no measurements for the twist imperfection have been made. Table 4 reports
that the minor axis out-of-straight straightness imperfection (s in Equation (5)) can
have a magnitude in the range of L/800 to L/4500. These measurements are found to be
significantly lower than the maximum allowed in ASTM D3917-11 of L/240.
Figure 9 presents plots of P against w for the FRP beam at 2 m span for three initial
minor axis out-of-straightnesses in the range of L/10000 to L/240. The smallest is for a
virtually straight beam and the largest corresponds to the maximum allowed in
manufacture. For the non-linear FEA the three-point bending load case has the
displacement boundary conditions BC1 (for free warping and free lateral flexure at both

22
ends). Note that inspection of the deformation shape of the beams analysed did not find
any signs for the development of a local instability near the sections with a shear force
concentration. The three curves plotted in the figure show that, as the geometric
imperfection increases, the load for LTB failure become less distinct. This FE buckling
load is not the critical load it is a limiting value (PLimit). It is seen from the P-w curves in
Figure 9 that with the FRP material remaining linear elastic in the post-buckling region,
the secondary load path has a positive slope. The curves show that, following instability,
the beam develops post-buckling strength and so onset of LTB instability does not result
in member collapse. This is an important finding when developing guidelines to design
against LTB failure as a ULS, as its presence is analogous to the additional reliability
given to design provisions in BE EN 1993-1-1:2005 and ANSI/AISC 360-10 from
having the ultimate strength of steel higher than yield strength; the lower (yield)
strength is used in the design calculations for LTB resistance.
Focusing on the shape of the three P-w curves in Figure 9, when P is close to 2.5 kN
and w is about 10 mm, it is observed that there is no clear buckling bifurcation (for
Pcr,FEA) when the out-of-straightness is L/1000 and larger. Singer et al. [44] explains that
there are a number of data reduction methods that can be employed to estimate what the
limiting buckling load (PLimit) is. A review of methods previously employed by
researchers studying pultruded shapes is given next. Lee [45], in his PhD work on the
flexural-torsional buckling of T-sections, suggested that buckling load should be
estimated by the intersection point of extrapolating the two ‘linear’ lines for the ‘pre-
buckling’ and ‘post-buckling’ parts to the P-w response. In his LTB experiments with I-
beams, Stoddard [12] choose to define the limiting buckling load to be the load when
the mid-span rotation (twist) of the top flange attained 5 degrees. To determine the LTB

23
resistance of an end-loaded cantilever beam Brooks and Turvey [10] recorded their
buckling load as the load at which the end-rotation started to grow rapidly. In a series of
tests to determine flexural buckling of concentrically loaded columns Mottram et al.
[41] terminated an increase to axial load when the mid-span lateral deflection reached
height/100. Using measurements for column load and lateral mid-span deflection they
employed the Southwell plot method to get an improved estimate to the elastic critical
buckling load. Based on results from non-linear FE analyses with ANSYS, Afifi [46]
obtained column buckling loads by applying the Southwell plot method. This is known
[44] to be an effective data reduction method when estimation to the elastic critical
buckling load, for the perfect member, is required.
Returning to the FE results in Figure 9 it is seen that the beam’s stiffness, given by P/w,
is very similar during pre-buckling. The load and deflection when non-linearity occurs
is dependent on the amplitude of the out-of-straightness geometric imperfection. Using
these observations, the authors define the limiting buckling load PLimit as the point on
the load-deflection curve when the secant stiffness has been reduced by X%. Figure 10
illustrates how PLimit can be obtained using this stiffness reduction method. As can be
seen the initial constant stiffness is common to establishing PLimit for the two non-linear
P-w curves that give a lower prediction as the size of the geometric imperfections
increases.
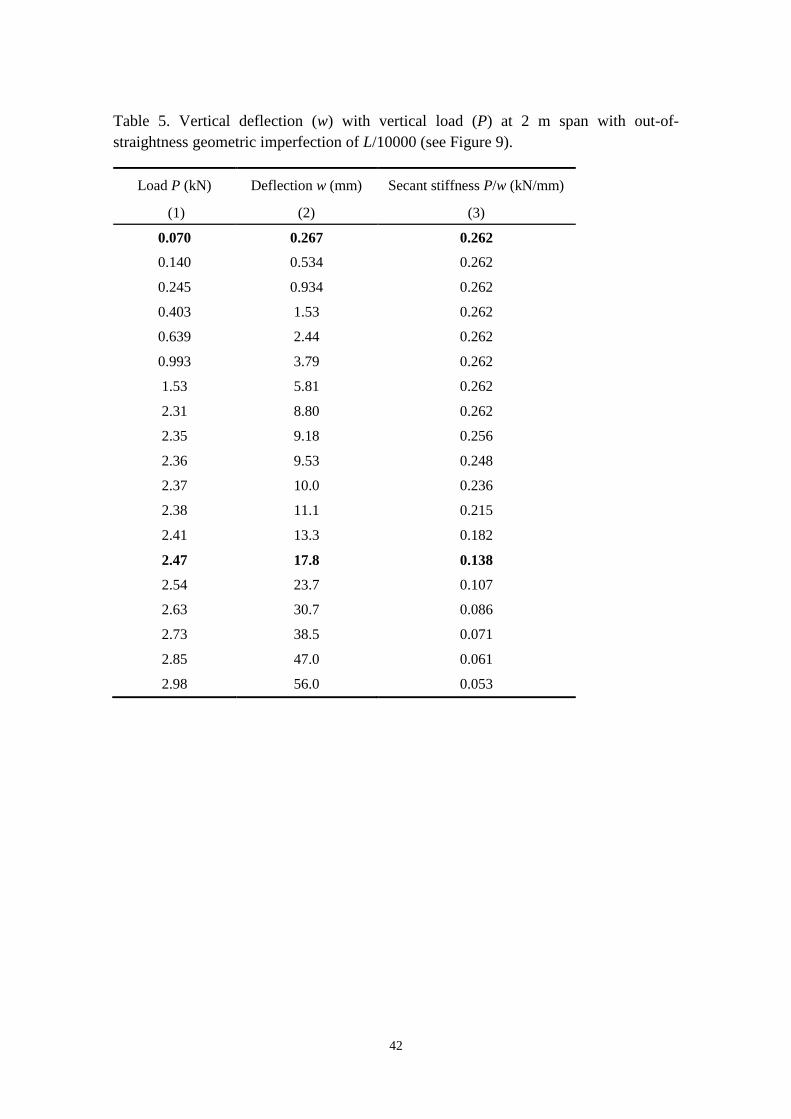
The question is, how large a percentage is X to be? To establish the answer it will be
prudent to determine PLimit at or near the point where the secant stiffness is changing
rapidly with a small increase in w. For the 2 m beam with initial out-of-straightness of
L/10000, Table 5 presents, in columns (1) to (3), the values of P, w and the
instantaneous secant stiffness P/w. For this virtually straight beam the results show that

24
the ‘pre-buckling’ stiffness is constant at 0.262 kN/mm to P up to 2.31 kN. Secant
stiffness is then found to start reducing and can be seen to be very rapidly falling away
when P is 2.47 kN. At this load the ‘post-buckling’ stiffness is 0.138 kN/mm
(highlighted in bold font), giving a secant stiffness reduction of around 50%. Based on
this evaluation PLimit is determined as the value of P when the secant stiffness reduction
X is 50%.
Taking a constant 1.0 m span the FRP beam is analysed with either out-of-straightnesses
of L/10000, L/1000, L/500 and L/240 or twists of 0.1o, 1
o, 2
o and 3.28
o. Note that L/240
and 3.28o are the maximum allowable in accordance with ASTM 3917-11 (refer to
Table 3). Presented in Figure 11 is PLimit, presented as a load ratio in terms of Pcr from
using Equation (2). FE modelling has boundary conditions BC1 and shear centre load
(zg = 0.0 mm). For the parameters chosen PLimit/Pcr lies between 0.95 to 1.05 for the full
range of the minor axis out-of-straightness and from 1.01 to 1.05 for the potential range
in the twist imperfection.
The FE results in Figure 12 are for a constant out-of-straightness of L/1000 and a
constant initial twist of 1o. It is believed that these geometric deviations are likely to be
typical for pultruded I-shapes. The parameter changed in the FE study is the span, which
varies from 1.0 m (L/h of 9.84) to 4.0 m (L/h of 39.4). Ratio PLimit/Pcr is seen to lie
within the range of 1.02 to 1.08. Being always > 1.0, the results show that PLimit is
higher than that calculated by Equation (2). A feasible explanation for why the limiting
value is found to be higher is that the closed form formula ignores the increase in
instability resistance due to beam curvature [32]. Robert [47] found this influence is
significant giving 4% increase with narrow-flange beam (i.e. height twice the flange
25
breadth). If this influence factor is taken into account, the buckling resistance can be
determined as [46]:
crcrp
z
y
=
1-
MM
I
I
(4)
For the single beam section in this FE study Equation (4) gives crp cr=1.04M M . This
means that a resistance increase of 4% can be from the pre-buckling deformation.
It is also observed that PLimit/Pcr, for ‘slender’ beams with L/h > 20, is fairly constant at
1.07 to 1.10. When the beam becomes ‘stocky’ (with slenderness ratio < 15), PLimit/Pcr
is now found to be in range 1.02 to 1.05. The transition in buckling resistance can be
explained by the presence of a growing contribution from shear deformation as the
beam gets shorter. The model for the development of Equation (2) does not account for
shear flexibility.
Concluding remarks
Linear Eigenvalue and geometric non-linear Finite Element (FE) analyses have been
performed to study the Lateral-Torsional Buckling (LTB) resistance of the I-beam (of
size 101.650.86.4 mm) under the influence of load height, displacement boundary
conditions and the geometric imperfections of minor axis out-of-straightness and
longitudinal twist. It is found that changing the load height relative to the shear centre is
more significant for a beam of Pultruded Fibre Reinforced Polymer (PFRP) than of
structural steel. It is found that the change in resistance is significant when the beam is
‘stockier’, as given by span/height ratio < 15. When the Eigenvalue results are
normalized using the prediction for the elastic critical buckling load from a closed form

26
formula it is found that the ratio remains close to 1.0 (between 0.94 and 1.02). The FE
study on influence of load height with the PFRP beam does show that the post-buckling
load path is significantly affected by this parameter.
By studying the influence of the degree of end warping fixity on LTB resistance it is
found to be more significant when the beam is of FRP material. The level of influence is
reduced as the beam span increases and an explanation for the finding is developed in
the paper.
To simulate pre-buckling response in the presence of geometric imperfections,
emanating during the pultrusion process, it is necessary to perform a geometric non-
linear analysis. It is found that the vertical load against vertical deflection curve does
not show a clear buckling (bifurcation) point for LTB failure. A data reduction method
is proposed to allow an acceptable prediction of the limiting buckling load. It is given
by the point on the load-deflection curve at which the secant stiffness has reduced by
50% from its initial constant value. By adopting this method, limiting buckling loads are
obtained for a 1.0 m long FRP beam having initial geometric imperfections of out-of-
straightness from span/10000 to span/240 and twist along span from 0.1o to 3.28
o.
Normalized buckling load is shown to be in the range of 0.95 to 1.05 and 1.01 to 1.05,
respectively. A value of 1.0 means the FE result is identical to that from a closed form
equation developed for the design of isotropic (steel) members in bending. By setting
the two imperfections constant at span/1000 and 1o the buckling load ratio, from
increasing spans from 1.0 to 4.0 m, is found to be 1.03 to 1.08 and 1.04 to 1.1,
respectively. The lowest ratios are for slenderness ratio < 15 and can be explained by
the growing influence of shear deformation. The physical explanation for why the FE

27
results for the FRP I-beam are above that calculated by the closed form equation is
given.
The authors recommend their FE modelling methodology for PFRP beam problems
with geometric imperfection failing with the lateral-torsional buckling mode.
For the development and calibration of a closed form formula for inclusion in a design
standard other geometric imperfections such as flatness, angularity and residual stress
might have an important role to play in reducing LTB resistance. Based on the
relevance of the results from the work reported in this paper the authors believe that the
inclusion of all ’field’ imperfections can be scoped by modelling a single (dominant)
imperfection with appropriate magnitude. The most practical to work with is that of out-
of-straightness about the minor-axis, having maximum amplitude of, say, span/200.
Acknowledgements
The first author gratefully acknowledges his scholarships from the Vietnamese
International Education Development and the School of Engineering at the University
of Warwick, UK.
Reference
1. Mottram JT. Does Performance Based Design with Fibre Reinforced Polymer
Components and Structures Provide any New Benefits and Challenges?. The Structural
Engineer 2011;89(6):23-27.
2. Anonymous. Strongwell Design Manual. Strongwell Composites Inc, Bristol, VA.
(www.strongwell.com/) (1st August 2012).

28
3. Anonynous. The New and Improved Pultrex Pultrusion Design Manual (Imperial
version) Vol. 4 Rev. 6. Creative Pultrusion Inc., Alum Bank, PA.
(www.creativepultrusions.com/library.html) (1st August 2012).
4. Bank LC. Composites for Construction - Structural Design with FRP Material. John
Wiley & Sons, New Jersey 2006.
5. Clarke JL (Ed.). Structural Design of Polymer Composites: Eurocomp Design Code
and Handbook. S & FN Spon, London 1996.
6. Anonynous. Guide for the Design and Construction of Structures made of Thin FRP
Pultruded Elements. National Research Council of Italy (CNR), Rome, Italy, 2008.
(http://www.cnr.it/documenti/norme/IstruzioniCNR_DT205_2007_eng.pdf)
(1st November 2012)
7. Anonymous. Pre-Standard for Load and Resistance Factor Design (LRFD) of
Pultruded Fiber Reinforced Polymer (FRP) Structures. American Composites
manufacturers Association (ACMA), Arlington, VA. press release.
(www.acmanet.org/pressreleases/2011/011711.html) (1st August 2012).
8. Chambers RE. ASCE Design Standard for Pultruded Fiber-Reinforced-Plastic (FRP)
Structures. Journal of Composites for Construction 1997;1(1): 26-38.
9. Mottram JT. Lateral-torsional Buckling of a Pultruded I-beam. Composites
1992;23(2): 81-92.
10. Brooks RJ, Turvey GJ. Lateral Buckling of Pultruded GRP I-section Cantilevers.
Composite Structures 1995;32(1-4): 203-215.
11. Turvey GJ. Effects of Load Position on the Lateral Buckling Response of Pultruded
GRP Cantilevers - Comparisons Between Theory and Experiment. Composite
Structures 1996;35(1): 33-47.
12. Stoddard WP. Lateral-torsional Buckling Behavior of Polymer Composite I-shaped
Members. PhD Thesis, Georgia Institute of Technology, Atlanta, Georgia 1997.
13. Trumpf H. Local and Global Stability of Plane Frame Works made of Orthotropic
FRP-profiles. PhD thesis, University of Aachen, Germany, Shaker-Verlag 2006.
14. Zhang S. Lateral-torsional Buckling of Simply Supported and Cantilvered Fiber
Reinforced Polymeric I-beams. PhD thesis, Georgia Institute of Technology, Atlanta,
Georgia 2000.

29
15. Ascione L, Giordano A, Spadea S. Lateral Buckling of Pultruded FRP Beams.
Composites Part B: Engineering 2011;42(4): 819-824.
16. Clark JW, Hill HN. Lateral buckling of beams. J Struct Div-ASCE 1960;
86(ST7):175-196.
17. Dutheil J. Verifica Delle aste Compresse: Principi Fondamentali. Construzioni
Metalliche 1966 18(4): 266–275.
18. Di Tommaso A, Russo S. Shape influence in buckling of GFRP pultruded column.
Journal of Mechanics of Composite Materials 2003; 39(4):329-340.
19. Lane A. An Experimental Investigation of Buckling Mode Interaction in Pultruded
Fiber Reinforced Plastic Columns. PhD Thesis, University of Warwick, UK 2002.
20. Abaqus. 'User Manual, version 6.10,' Hibbitt, Karlsson and Sorensen, Inc 2011.
21. Tomblin J, Barbero E. Local Buckling Experiments on FRP Columns. Thin-Walled
Structures 1994;18(2): 97-116.
22. Bank LC. Shear Properties of Pultruded Glass Fiber Reinforced Plastic Materials.
Journal of Materials in Civil Engineering 1990;2(2): 118-122.
23. Sonti SS, Barbero EJ. Material Characterization of Pultruded Laminates and Shapes.
Journal of Reinforced Plastics and Composites 1996;15(7): 701-717.
24. Zureick A, Scott D. Short-Term Behavior and Design of Fiber-Reinforced
Polymeric Slender Members under Axial Compression. Journal of Composites for
Construction 1997;1(4): 140-149.
25. Steffen RE. Behavior and Design of Fiber-reinforced Polymeric Composite Equal-
leg Angle Struts. PhD thesis, Georgia Institute of Technology, Atlanta, Georgia 1998.
26. Turvey GJ. Torsion Tests on Pultruded Glass-reinforced Plastic Sheets. Journal of
Composites Science and Technology 1998;58(8): 1343-1351.
27. Roberts TM, Al-Ubaidi H. Flexural and Torsional Properties of Pultruded Fiber
Reinforced Plastic I-Profiles. Journal of Composites for Construction 2002;6(1): 28-34.
28. Mottram JT. Shear Modulus of Standard Pultruded Fiber Reinforced Plastic
Material. Journal of Composites for Construction 2004;8(2): 141-147.
29. Qiao PZ, Zou GP, Davalos JF. Flexural-torsional Buckling of Fiber-reinforced
Plastic Composite Cantilever I-Beams. Composite Structures 2003;60(2): 205-217.
30. Shan LY and Qiao PZ. Flexural-torsional Buckling of Fiber-reinforced Plastic
Composite Open Channel Beams. Composite Structures 2005;68(2): 211-224.

30
31. Mottram JT and Shaw CT. Using Finite elements in mechanical design. McGRAW-
HILL book company europe, UK, 1996.
32. Trahair NS. Flexural-Torsional Buckling of Structures. E & FN Spon, London, UK
1993.
33. Abaqus. Theory manual, version 6.11. Hibbitt, Karlsson and Sorensen, Inc 2011.
34. Riks E. An Incremental Approach to the Solution of Snapping and Buckling
Problems. International Journal of Solids and Structures 1979;15(7): 529-551.
35. Wempner GA. Discrete Approximations Related to Nonlinear Theories of Solids.
International Journal of Solids and Structures 1971;7(11): 1581-1599.
36. Crisfield MAA. Fast Incremental/Iterative Solution Procedure that Handles "Snap-
through". Computers and Structures 1981;13(1-3): 55-62.
37. Sapkás Á, Kollár LP. Lateral-torsional buckling of composite beams. Int J Solids
Struct 2002;39(11):2939-2963.
38. Machado SP, Cortínez VH. Lateral buckling of thin-walled composite bisymmetric
beams with prebuckling and shear deformation. Eng Struct 2005;27(8):1185-1196.
39. Mohri F, Azrar L, Potier-Ferry M. Lateral Post-buckling Analysis of Thin-walled
Open Section Beams. Thin-Walled Structures 2002;40(12): 1013-1036.
40. Minghini F, Tullini N, Laudiero F. Buckling analysis of FRP pultruded frames using
locking-free finite elements. Thin Wall Struct 2008;46(2):223-241.
41. Mottram JT, Brown ND, Anderson D. Physical Testing for Concentrically Loaded
Columns of Pultruded Glass Fibre Reinforced Plastic Profile. Structures and Buildings
2003;156(2): 205-219.
42. ASTM D3917-11. Standard Specification for Dimensional Tolerance of
Thermosetting Glass-Reinforced Plastic Pultruded Shapes. American Society for
Testing and Materials (ASTM), West Conshohocken, PA 2011.
43. Lane A, Mottram JT. Influence of Modal Coupling on the Buckling of
Concentrically Loaded Pultruded Fibre-reinforced Plastic Columns. Proceedings of the
Institution of Mechanical Engineers, Part L: Journal of Materials Design and
Applications 2002;216(2): 133-144.
44. Singer J, Arbocz J, Weller T. Buckling Experiments Experimental Methods in
Buckling of Thin-Walled Structures: Volume I Basic Concepts, Column, Beams and
Plates. John Wiley & Sons, Chichester, 1997.

31
45. Lee S. Flexural-torsional Buckling of Pultruded T-sections. PhD Thesis, Georgia
Institute of Technology, Atlanta, Georgia 2001.
46. Afifi AAM. Buckling of Stiffened Pultruded GRP Plates and Columns. PhD thesis,
University of Lancaster, UK 2007.
47. Roberts TM. Influence of Shear Deformation on Buckling of Pultruded Fiber
Reinforced Plastic Profiles. Journal of Composite for Construction 2002;6(4): 241-248.
Figure caption
Figure 1. FE Cartesian coordinate system, and mesh with displacement end boundary
conditions BC2 (for k = 1 and kw = 0.5).
Figure 2. Eigenvalue analysis for initial Minor axis out-of-straightness geometric
imperfection shape along the I-beam.
Figure 3. Model for ‘twisting’ couple applied at free ends of I-beam.
Figure 4. Initial geometric imperfection shape from pure torsion and linear elastic small
displacement FEA.
Figure 5. Effect of load height on elastic critical buckling load when beam is of FRP or
steel.
Figure 6. Normalized buckling load (Pcr,FEA/Pcr) versus slenderness ratio (L/h) for a
simply supported I-beam subjected to a vertical point load at mid-span and positioned
either on top flange, at the shear centre or on bottom flange.
Figure 7. Vertical load (P) with vertical deflection (w) for the PFRP beam, having span
of two metres and load applied at either Top flange, Shear centre or Bottom flange.
Figure 8. Influence of end warping fixity boundary condition on LTB resistance.
Figure 9. Load (P) and vertical displacement (w) for the FRP beam at 2.0 m span having
an initial Minor axis out-of-straightness deformation from L/10000 to L/240.
Figure 10. Illustration to show the secant stiffness reduction method to establish the
limiting buckling load when imperfections negate a bifurcation buckling failure.
Figure 11. Influence of magnitude of initial geometric imperfections on LTB resistance
of a pultruded beam of size 101.650.86.4 mm at span of 1.0 m.
Figure 12. Influence of having constant geometric imperfections and varying beam span
from 1.0 to 4.0 m.

32
Figure 1
Figure 2

33
Figure 3
Figure 4

34
Figure 5

35
Figure 6
Figure 7

36
Figure 8
Figure 9

37
Figure 10
Figure 11

38
Figure 12

39
Table 1. Previous test or micromechanical values for the in-plane shear modulus (GLT)
of PFRP material in standard shapes.
Author(s) or pultruder’s
design manual
In-plane shear modulus, GLT
kN/mm2 Test or prediction method Pultruder
(1) (2) (3) (4)
Strongwell [2] Null
Creative Pultrusion Inc [3] 2.9 Full-section Creative Pultrusions Inc.
Bank [22] 2.4-2.8 Isopescu Creative Pultrusions Inc.
Sonti and Barbero [23] 3.9-4.5 Isopescu and Torsion Creative Pultrusions Inc.
Zureick and Scott [24] 4.1-4.8 Isopescu Strongwell
Steffen [25] 3.5-4.5 Modified (Isopescu)
V-notched beam Strongwell
Turvey [26] 3.0-3.6 Torsion Strongwell
Roberts and Al-Ubaidi
[27] 4.4-4.9 Torsion Fiberforce Composites
Lane [19] 3.2-3.7
Resin burn-off and
Micromechanical
modelling
Creative Pultrusions Inc.
Table 2. Elastic critical buckling load for lateral-torsional buckling with mesh
refinement.
40
Shell element
side lengths (mm)
Number of elements
per metre Elastic critical buckling load, Pcr,FEA (kN)
25.4 280 11.0
12.7 1108 9.96
8.5 2478 9.95
6.4 4368 9.95
5.1 6860 9.95
Table 3. Allowable deviation from straightness and twist according to Tables 3 and 4 in
standard ASTM D3917-11.
Type of
imperfection Illustration of geometric tolerance
Allowable deviation from
straight
(1) (2) (3)
Out-of-
straightness
D = 4.167 x L (length in
meters)
Twist
Y/L = 3.281 degree / m
Table 4. Measured initial geometric imperfections for pultruded standard shapes.
Author(s) Structural shape Maximum imperfection in terms of length L

41
(1) (2) (3)
Brooks and
Turvey [10] I Out-of-straightness for flanges and web is L/900.
Zureick and
Scott [24] I and box
Out-of-straightness of:
I-beam lies between L/812 to L/1835;
Box lies between L/1103 to L/8053.
Maximum did not always exist at mid-span.
Mottram et al.
[41] Wide flange I Maximum out-of-straightness is L/4500.
Lane and
Mottram [43] Wide flange I Minor-axis out-of-straightness is L/3200.
42
Table 5. Vertical deflection (w) with vertical load (P) at 2 m span with out-of-
straightness geometric imperfection of L/10000 (see Figure 9).
Load P (kN) Deflection w (mm) Secant stiffness P/w (kN/mm)
(1) (2) (3)
0.070 0.267 0.262
0.140 0.534 0.262
0.245 0.934 0.262
0.403 1.53 0.262
0.639 2.44 0.262
0.993 3.79 0.262
1.53 5.81 0.262
2.31 8.80 0.262
2.35 9.18 0.256
2.36 9.53 0.248
2.37 10.0 0.236
2.38 11.1 0.215
2.41 13.3 0.182
2.47 17.8 0.138
2.54 23.7 0.107
2.63 30.7 0.086
2.73 38.5 0.071
2.85 47.0 0.061
2.98 56.0 0.053