i 'author robitaille, david-f.; sherrill, jalles n. …author robitaille, david-f.; sherrill,...
TRANSCRIPT

_Doconzimlissuma
ED)
152 526. . .
.
SE 023 991,,I ,
. .
,
1
'AUTHOR Robitaille, David-F.; Sherrill, JalleS N."TITLE . British Columbia Mathematics Assessment,. 1977. Report
Number'2: Teacher Questionnaire-Instructional :
(. ft Practices.:INSTITUTION gritish Columbia Univ., Vancouver.-.-PUB RAT/ Sep 77 ,..
-
NOTE 174p.; Prepared'far the Learning Assessment Branch ofthe Ministry of Education; For related docuientsi see-SE 023 990-993; Contains occasional light and brokentype-
IDES PRICE MF-$0.83 HC-$8.69 Pius Postage: I
DESCRIPURS *Educational Assessi4nt; * Educational Research ";*Elementary Secondary Education; *InstAction;*Mathematics Education; Needs Assessment; *TeacherAttitudes; Teaching Methods
IDENTIFIERS *British Columbia
.ABSTRACTAs part of the .1977 British Columbia Mathematics
Assessient over 100,000 students from Grades 4, 8, and 12 weretested on a limited number of important 'mathematical skills and
.concepts; Approximately 3,500 teachers of mathematics at seven
c different grade levels (1,3,4,7,8,10,12) completed comprehensivequestionnaires dealing with numerous aspects,of the methods and,laterials in the:teching of mathematics in the- province. This. report10 one` of a four-part 'series and discusses the Teacheir Questionnaire-
' fEase of the project. It contains a detailed exposition of. theresults,qf the questioInaire in terms of .Teacher Background and
r.-General Information, Classroom Organization; Use of Textbooks,Classroom Instructionuand Learning Outcomes expected by thet c ersh. The Elementary Teacher Questionnaire and the SecondaryT acher Questionnaire are provided in the' Appendix. (ON)
e-
. *l
v***********W***********4***********************************************
,' * Reproductions supplied by EDRSare the best that can be made *** , from the original document.
****f**************************************************************4!****
I
L

N.
BRITISH COLUMBIA,MATHEMATICS ASSESSMENT1'977
U.S. DE PARtMENT OF HEALTH.EDUCATION i WELFARENATIONAL INSTITUTE OF
EDUCATION
THIS DOCUMENT HAS BEEN 'REPRO.DUCED EXACTLY AS RECEIVED FROMTHE PERSON bleORGANIZATION ORIGIN.ATING IT PIZ/NTS OF vtgw OR OPINIONSSTATED DO NOT NECESSARILY REPRE-SENT OFFICIAL NATIONAL-MSTIWTEOF -;EDUCATION POSITION OR POLICY.
9ifAhisolicotai pliactice4
**PERMISSION TO REPRODUCE THISMATERIAL HAS SEEN GRANTED BY
TQ THE EDUCATIONAL RESOURCESINFORMATION CENTER IERIChANDUSERS OF THE ERIC SYSTEM.

The B.C. Mathematics Assessment
A
This report was prepa
Report Numbpr 2 0'
TEAENER QUESTIONNAIRE
d for the LearnlingAssessilie%t Blanchistry of 'Education by. 4
David F. RobitailleJames M. Sherrill
MATHEMATICS ASSESSMENT-CONTRACT TEAM
Robitaille, (Chairman)
James M. Sherrill .
Heather Kelleher'John Klassen
a
- ,Faculty of Education, U.B.C.- Faculty of Education, U.B.C.-..Teacher, New Westminster,' S.D.- Teacher, North Vancouver, S.D.
September 1977.
3

r
/F.
a
I
C I
British rumbia Catalogiaing in Publication. Data
Robitaille, David F.
Teacher questionriaire.
(British Columbi;.'Mathematics Assess-ment. Report ; no. 2).
Prepared for the Learning AssessmentBranch of the Ministry of Education. s-).
ISBN 0-7718-7002-7
'1. Mathematics - Study and teaching -British Columbia. I. Sherrill, James'
II.British Columbia. Ministry ofEducation. -Learning Assessment Branch.III. Title. IV. Series:
0.A14.C3e) 372.7'09711
A
-4,

The Brittish Columbia Mathematics Assessment 4
Management Committee
.Robert Aitken (Chairman)
Olga Bowes
Helen Casher
y Ralph Gardner
Gary Mitchell
Jeri.y Mussio
Linda O'Reilly
David Robitaille
James Vance
1
Learning.Assessment BranchMinistry of Education
Learning Assessment BranchMinistry of EduCation
School TrusteeMaple Ridge School District
Supervisor of InstructionCoquitlam School District
TeacherCranbrook School DistriCt
Learning Assessment BranchMinistry of Education
TeacherVancouver School District
Faculty of EducationUniversity of Britibh Columbia
Faculty of EducationUniversity of Victoria
L.)

.
..
\I
c
TABLE OF CONTENTS
4. .
,..
lif `41.
2:
3.
4.
5.
6.
.
A.< B.
o
4
...
IntroductionTeacher Background ancf:General InfbrmationClassroom OrganizationUse of Textbooks'Classroom InstructionLearning Outcomes
iI.
-
Appendices
Elementary Teacher QuestionnaireSecondary,Teacher Questionnaire
t.
-,
....".t, lo
Page
1
11
23
33
73
111
131
155,4.
..
I
all
Mi
)
1
3
/ Y.
4.
/
4,
. .
a
.. a \..,t\..
f
t
4
..
),.I.
a

CHAPTER 1
INTRODUCTION
1
7
.r
G.

C
;A
i
3
ca.
In the spring of 197r,students enrolled in Grades 4, 82 and 12 inthe public schools of the province/ of Britibh Columbia took part-in an .
Assessment of Student Learnings in Mathematics conducted by the Learning.
Assessment. Branch of the Ministry of Education. During the same period,approximately. 3500 teachers of mathematics) at seven"different grade level&completed a comprehensive questionnaires dealing with numerous aspects ofthe methods and materials used in the teaching of mathematics in the pro-vince. The Learning Assessment ,Program is longitudinal in nature, and thevarious aspects of.the curriculum of the public schools are scheduled tobe, assessed at regular. intervals.
One of themajor purposes of this assessment of mathematics in theProvince was to collect baseline data against which ,the perfoOmance ofstudents in future assessments' could be compared. .
1.1 Purposes of the Assessment
The major principle underlying the entire Learning,, Assessment Program,
is .that decisions about education should be based upbn an understandingof what and how children and young adults 'are learning. Educational de-,
cisions, are being made every day,'-decisions which affect the allocation
of resources,,, in-service education of teachers, teacher training prbgrams,
curriculum development and the adequacy ofwarious programs. .The Mathe-/
matics Askessment will. provide /decision- makers at all levels with factual
and curreTt information concerning the teaching and .earning of mathe-
matics upon which to base their decisions.
The Assessment Program in general, and the Mathematics Assessment inparticular, are designed to inform the public of softie of the strengthsand weaknesses of'the public school system in this province. The inform-
ation generated byl the Mathematics Assessment will assist school districtsin maintaining identified strengths and overcominamweakvsses. It is
hoped that curriculum devlopers and curriculuth inision committees willbe able to make use of these results in the process of improving curri-culum end developing suitable resource materials. Furthermore, such in-
formtation could be used in the allocation'of resources at both th provin-
cial and district levels.
At the university level, 'he information generated by the Assessmentwill be useful itn indicating directions for change and improvement in
teacher education. Finally, the information produced by the Assessment
should be of great value to educatioffial resea ers both as a data bank
acid as a. source of researchable questions conce ing the teaching and
learning of mathematics.
1.2 Organization of the Assessment
Several groups participated in the organization and implementation.
of the Mathematics Assessment. These groups included the,Learning Assess-,

'4
ment Branch of the MiniAry,of Education, the ntract Team, the Manage-mdhtsCommittee, and the B.C. Research Council a d several others with whom'consultations were held.
. The' Contract Team was retained by the Learns g Assessment.Branch toconduct the Mathematics Assessment, The Contract Team's responsibilitiesincluded conducting the Goals AssesSment and devel ping the set of objec-tives to be assessed, constructing the student tes s, trying out the tests,and subsequently'revising them', constructing the I tructional Practicesquestionnaire, and writing,the final ceports of the Assessment., The Con -
tract Team consisted of two members of the Faculty Education, Univer-sity of British Columbia, a primary teacher who Vas tin leave of absencefrom the New WesAminster School District, and a teac e.-of secondary mathe-matics from the North Vancouver School District.
It was the role of the Management Committee tof the'Contract Team and to provide guidance and sugthe various phases of the assessment. Members of the
tee included two teachers, &supervisor-of instruction,tor, a school"trustee,.the chairman of the Contract Teatives of.the Learning Assessment Branch. '
ov
e
rsee the operationstions regarding'nagement Commit-a teacher educa-
and representa-
The B.C. Research Council Conducted the majority ofand administrative aspects of the Assessment under. the suContract Team. Theirresponsibilities included overseeinand distribution of the tests, answer cards, and teacherconducting the scoring and data analysis, and serving as ssultants and advisors to the Contract Team and the i4anagem
the technicalervision oflthethe printing
uestionnaires,atistical con-nt Comtittee.
Consultative meetings were held with several group.of the,Coatract Team met twice with the Mathematics CurricuCommittee to discuss aspects of the Asessment. In additio
Panels were organized by the Learning AssessMent Branch toobjectives to 'be tested in the Mathematics Assetsment: Such
intendedrto be as widely representative as possible of the vinterested in the mathematics achievement of studdnts% Fins
were held and correspondence exchanged with representativesment progiams in North America, in order that the B.C. Math
ment could benefit from their experiences. ,
epresentatives ;pm. Revision
, Reviewisaiss,thepanels wererious groupsly, meetingsf other assess-atics Asses-
1.3 Components of the Mathematics Assessment
The Mathematics Assessment consists of four major componGoals. Assessment, the Assessment of Student LeArnings, the InAnalysis, and the Invi;eory of Instructional Practices. The
form the substance of a separate-report (See Report Number 1
. sults) and will not be discussed in great detail here. Howev
descriptive comments about; each of the four components are g
section.
ts: theerpretiveirst threeTest Re-
r, briefen in this
WO*

S
5
1.3.1 The Goals Assessment
'4It was notthe objectiVe of the Mathematics Assessment to
o attempt to evaluate students' achievement in mathematics iwanTparti-cular courseor program, or to evaluate the entirerpathematics curri-1
culum. Neither was it the objective of this assessment to obtain in
formation on the achievement of individual student or Schools, 'or
on the performance of teachers of mathematics. I was the objective
of the assessment to obtain, and to make widely kn wn, information
regarding the'present state of mathematics learning'on'a province-
wide basis.- In addition, each s6hool district would be provided with
a summary of its own results.
The initi al and hasic decision as regards the Goals'Assess7
ment was to limit the scope of the content areas of mathematics to
be assessed to those which most informed observers would agree were
among the essential concepts and skills of matheMatics at the three
levels tested: end of primary education (Grade/Year 4), end ofelem-
entary education (Grade 4)', and end of public Schooling (Grade 12).
Three levelsof cognitive behaviour, called domains in the assess-
ment, each subdivided into a number f objectives made up the basic
framework of the Goals Assessment.
The of identifying the pecific concepts andskills
td be assessed, wa based primarily upon the recently revised curri-
culum guide f,or mathematics in British Columbia. addition to this
basic document,. several other sources were consulted and utilized.
Chapter2 of the Test Results report contains'a detailed exposition
of this procedure, as well as-of. the rather extensive consultation
R that took'place throughout the Goals Assessment phase of the Troject
1.3.2 The Assessment of Student Learnings
Tests were constructed to measure. students' mastery of the
'objectives identified in the Goals Assessment'phase. A separate
4 test S,Tas prepared for each of the three grade levels 4nvolved. For
each test, a total administration time of nin ty minutes was allotted:,
thirty minutes for instructions, distfibution and collection of ,the
test booklets'ooklets and answer cards, and sixty min tes for completion of
th test.
L. Pilov testing of the assessment instrume is was conducted
'during the late fall of-'1976 in'several school istricts across the
province. Approximately 250 students_ at each o the three grade
levels iny*ved wrote the tests, and their results were used in'de-
ciding,upon the final form of the tests.
On the basis of the pilot testing certain items were deleted,
others were added' and.,still others were ,modified. The majority
modifications to items represented efforts to iMpr 've the readability
of the stbm of an item or the platsibilityof the distractors. All
-10

6
additions and modifications were then.tried out before being includedin the final.wersions of the tests.
A second purpose of the pilot tests was,.
to ensure that studentshad sufficient time in which to complete the tests since they werenot intended to be speed tests. Results.show that the majority ofstudents at each grade level required significantly less than thetotal time allotted, and that virtually everyone was able 'to completethe test in less than one hour. . ,
With the exception of a. portion (f the Grade/Year 4 test, all.--...
of the test items were presented in multiple-choice format with five'fails.or distractors for each item., In every ease, the foils consisted of four possible answers to the,item while the fifth foil w,46"I don't know". The "I don't know" optiOn_mas'used in an attempt tominimize guessing and in order to.provide an outlet for students who,for one reason or another',.had not been exposed to, the material being*tested or had forgotten it.
..--.'
In do effort to assess change in students' abilitiesto deal, t
with certain concepts and7Ncills, some items appeared on two or more^ of.the tests. Fpi example, the same five items dealing with knowledge ...'e,
and understanding of the units of the metric system of deasurementwere used on all three tests. In several of the skill areas; thesame items.appearedlon.the Grade 4 and 8 tests,'or.on the Grade 8and 12 tests. Overall, there were nine items common to the Grade 4and 8 tests and frty-three items common to the Grade 8 and 12 tests-.Of the foregoing, Live items were .common to all three tests. Y ,
...
4 i
The International System of Units (SI) was-v,plized for alltest items involving measurement; no, items Contained British or Im-perial units of measurement.. Furthermore, any numeral 'containing .'<7.:_five or more digits waswritten with a space"between periods rather!'
, thence comma (43 256 not 43,251.) and any'decimal fraction with abso-lute value less than one was written *ith a zero before the decimaloint (0.86 not .86), except in the case of computation items.
lf-
The decision to use the metric System of m4asurement ekclu-sively did restrict, to some degree, the number and the nature ofproblem-solving items involving measurement concepts. For example,it was felt that including items dealing with the pdrchase of con-sumer goods such as carpeting, or concrete, or the like, in termsof
( metric units of area or volume would make such items appear overlyunrealistic and unfamiliar since. these terms and units are not yetin widespread use by 'consumers in our society. On the other hand,since the curriculum guide does call for implementation of the metricsystem of measurement in the schools, any reference to e Britishsystem was a/oided.
One section of each of the three student tests was included'to obtain information on certain aspects of student backgrodnd.
11

V
7
These consisted df a number of factorsLuhieir4Ware either known to be
or were strongly suspected of being telatedto students' performancein mathematics. StudeAs at all three levels were asked to report ontheir age, sex, number ofschools attended, length of residence inCanada, language spoken, and use,of hand-held calculators. Grade/Year 4 students were also asked how many hours of television theyWatched each day. Grade 8 and 12 students reported how much time 7
they spent on homework in mathdtaticis, and whether or not their mathe-matics courses were semestered. Grade 12 students were also askedabout the nature and extent of any employment they had,--their futureplans, and'their parents' educational level.
Assessm4nt tests ih Reading were also giVen at the Grade 8and 12 levels, an these tests coniined similar;,and in somgkcasesidentical, background.and information -questions. FOr example, on -
both the Reading and the Mathematics-,,,tests, students4were'asked theirdate of birth, sex, and,number of- schools attended. Because of thecommon items, it was-possible to merge the two sets of data and ob-tain anew data file containing the information and results obtainedon both of the tests. MatcJes were-obtained for 66% of the Grade'8_students and 63% of the Grae 12 students. This new file was usedto obtain, further information on student background, as well as'tocorrelate some aspects of student performArice.in reading with thesame student's achievement on some of mathematics, otjectives. tor . , ,
example, it wa's then possible, to obtain a meae-OTe,of the correlation.
that exists'between reading comprehension- and the ability to solve-.
mathematics problems., *
N
4While it would not be possible to identify causal relation-
ships between suq student eharacteristicS'and performance on thebasis of th%Mathelilatics Assessment data, it is possible to.:identifyvariables that appear to be-related on the basis of the data col-,
lected. Relationships so identified may lead to follow-up studiesspecifically designed- to identify ca and effect relationships on-theibasis of the correlational resul scovered in the assessment
program.
1.3.3 ' Interpretive ,Analysis
As part of the Language B.C# project, which took place during1976-77, the Learning Assessment Branch assembild a panel of eleVeneducators and assigned them the task of interpretinglVe assessmentresults: Such an approach to the interpretation of assessment resultsis not without its prpblemiti: the procedure Is necessarily subjectivein nature, the weeel:, members ray not be truly 'representative of thevarious groups having an interest in the results, and furthermore,such an analysis"Might give a false impression of precision or efeck-itude by assigning numerical values to" -decisions based on such shb-jective information.
On the other hand, no assessment pr6gram would be completewithout some type of interpretation of the -raw data. Since no
/

standards 4.1.c comparison exist at the present time, some (form of
Interpretation Panel would appear to be the only choice available.
For that, purpose three fifteen-member-Interpretation Panels,bne for each of the three grade levels involved were constituted bythe Learning Assessment Branch. Each panel conaisted of seven teachers"of mathematics at the particular grade level, two supervisors of in-struction, two leacher educators, two school trustees, and two members
of the public at large.
The information gained from the deliberations of the Inter-, pretation Panels was used by the authors of this report in commenting
upon.the results of the assessment. Although the procedure used doeslack some air of precision attributed to strictly numerical compari-sons, the wealth of experience which the members of the panels broughtto bear upon their examination and interpretation of the results givestheir interpretations considerable credibility.
1.3.4 Teacher Quedionnaire
Two questionnaires, one for teachers of elementary schoolmathematics end the other for teachers of secondary mathematics,were developed for use in the Mathematics Assessment. The question-naires, which were completed anonymously, dealt with various aspectsof the teachers' backgrounds and training as well as with facets ofthe methodology of teaching mathematics ae different levels and withinstructional practices used by teachers of.mathematics:
Samples of potential questionnaire respondents were systema-tically selected on the basis of information provided annually byteachers to the Ministry of Educationen Form "J". Every attemptwas made to ensure that only teachers of mathematics received thequestionnaire. Fu e re, since assessments in Reading and SocialStudies were bei g conducted at the same time as. the MathematicsAsseSsment, an effort was also 4Wde to 'ensure that no teacher wasasked to complete questionnaires for_more than one of the assess-ments. Further detail on the structure 'of the,teacher 'sample is con-
tained in the Technical Report.
Four elementary levels; 1? 3, 5, and 7, and three secondarylevels, 8, 10, and 12, were utiliEed for the questionnaire. At eachelementary level, questiOnnaires were sent to twenty-five percent'more teachers than were required in order for the results to be inter-pretable as the opinions of the:entire population bf teachers of mathe-matics at that level. For example, given -the number of teachers of
thematics that there are at the Grade 5 level, 625 questionnaireswe se t ouf and 561 were retwne4, which was more than enough forthe results to be interpreted as representing the opinions of theentire population ef,teachers of Grade 5 mathematics. The data on.
numbers of questionnaires sent but and returned are summarized inTable 1-1.
13

p
99 o'
4s.
9
Table 1-1Questionnaire Completion Results
Grade/Level
Questionnaire
Sent Out Returned % Completed
1 625 532 85.1
3 625 521 83.4
5 625 561 89.8
7 .625 530 84.8
Total Elementary 2 500, 144 t 85.8
8 489 420 85:9
10 1 292 80.9
12 101 99 98.0
Total Secondary 951 811 85.3
At each level the return rate exceeded eighty percent. This
very high rate of return on the questionnaire' -was gratifying and adds
credibility to the results. Teachers, seem to have taken the question-
naire seriously, and they are to be congratulated for their effortsin completing what ms a lengthy and comprehensive survey instrument.
1:4 Structure of the Questionnaire
Although separate questionnaires were $repared for the elementlry and
secondary levels, they shared the same structure and many identical items.Each questionnaire consisted of five parts: background and general intim-
ation, leaping outcomes, classroom organization,-classroom instructionand use of textbooks.
Part I, Background and General Informatioq, contained a number'ofitemk dealing with teachers' academic and professnal training, lengthand nature of teaching,experience, and membership in professional associa-
tions. In addition, teachers were asked to rate various areas of the curri-culum as to their pmportance'fortudents' success in school as well as in
adult life. Finally, secondary teachers were asked to rate how much they'enjoyed and how difficult they found it to teach,mathematics at various
secondary levels.
In Part II, Learning Outcomes, teachers were asked to rate the import-ance of each of a_number of objectives from the Mathematics Cdrriculum
Guide Mist of objectives 'for their Opde level. In addition, all teachers
were asked to rate the importance of each in S list of objectives which
students could be expected to have mastered upon completion of secondaryschool and secondaryteachers rated a number of objectives for students
completing elementary school.
In Part Classroom Organization, teachers reported on class, size,
length of teaching periods for mathematics, and time spent in preparation
0
-10
and grading. They were also asked to indicate the natur of their class-
. room situation, use of various grouping practices, and the ature and ex-
tent of use-of different- student activities.
Part IV, Classroom Instruction, was designed to collect informationon the resources, aids, and methods teachers use for the teaching of mathe-
matics. This section contained several items dealing with teachers' andstudents' use of hand -held .calculators.
Part V, the last section of the questionnaire, was concerned with theuse of textbooks for the teaching of mathematics'. In addition to stating
which textbooks they were using, teachers were asked to indicate how satis-fied they were with various aspects of the prescribed texts and how theyused mathematics texts with their classes.
Overall, the elementary qutstionnaire consisted of fifty-four itemsfor teachers of Grade 1, 3, 5, or 7 mathematics. The secondary question-naire was designed for teachers of Grades 8, 10 or 12 and included sixty-
five items. tr °
\Many items were included on the questionnaires for several different
ade levels. For example, all of the elementary teachers surveyed (i.e.;Grades 1, 3, 5, and 7) were asked to rate the importance of several subjectareas, including mathematics, to the' students' success in school: A f t-
note to Iiible 2-7 which presents.,eht data on this question states that7 ,
there waa significant difference at the 0.05 level among the grade-levelgroups who responded to this item, and a similar footnote is to be foundfollowing ,many of the tables throughout this volume. The footnote means
4 .hat there was a difference in the way the grade-level groups responded.tothe item, and that this difference was large enough that there is less thanfive percent chance (0.05) that the difference is due to sar@ling error.With, samples the size of the ones in this study, any difqrence in excessof approximately 0.2 would be statistically significant at the 0.05 level.
,..
0.
15

I
CHAPTER 2
TEACHER BACKGROUND AND GENERAL INFORMATIONr

13
p
Questions concerning the nature. and extent of teachers' professionaltraining) their teaching experience, professional activities, and opinions
Kegatr1
.rd'
31
g the relative importance of various areas of the,curriculum con-Sti edPart, F.of the teacher questionnaire. The,te-SE5ers' responses tothese questions e discussed in this chapter.
2.1 Nature end IxtentOf Professional Training
I
2.1.1 Elementary Teachers
According to the questionnaire results, teachers of mathematicsat the fbur grade levels sampled have an average of just over fo ryears of post secondary educ.ktion.- There is some variation amo g thegrade levels as can be seen from Table 2-1.
Table 2-1Elementary Teachers:
Years of Post-Secondary Education (Percent)
No. of Years Grade l Grade 3- Grade 60, Grade 7
1
2 .
3
4
5
6 -Qs) more
0.4
7.9
33,90 40.2
A 15.4
2,2
0.2
7.1
26.1
0.0.
5.7
0.4
2.9
-4 18.034.334.5"10.0
z0.01.210./
24.742.121.2
In general, the number (4 years of education increases withgrade level taught. Over sixty percent of.the Grade 7 teachers ofmathematics have five or mote years of post - secondary education while
only about seventeen percent at the Grade 1 level have a similar amount.
Slightly lees than thirteen percent of the elementary teachers "havejmathematics as 9ne of their major subject areas in their under-graduate training. This finding ranged from a low of eleven percentfor Grade 1 teachers to about eighteen percent for Grade 7 teachers.ITP-response to a related item, approximately one quarter of the tea-ches indicated that they had not taken any mathematics since com-pleting secondary school. Here also, the results varied with.gradelevel -- from a high of 27.7% of Grade 1 teachers who.had no post-'secondary mathematics background- td a low of 19.6% at the Grade 7 level.
More than one teacher of elementoy mathematics in every ten,13.7 %, has never had a course in the teaching of mathematics, and an-other 35% has not had such a course in the past ten years. 'Signifi-
.Lcantly more teachers at the Grade 7 level have never had a mathematicsNimethods course (17.4% vs 10.1%).
1 7 #
-NA
".

a
14
Recommendation 2-1: The Ministry of Education ard individualschool boards should require that aZZ persons teaching mathematicsat the elementary school level should have ds a required part oftheir'training the equivalent of at least one course tn the teachingof mathematics and one course in mathematics for teachers.
2.1.2 Secondary Teachers
On the-average, teachers of secondary mathematics at the ,
three levels surveyed have had slightly more than five years of post-secondarysecondary edudation. The data relative to this question are Pre-sented in Table 2-2.
.1% Table 2-2Secondary Teachers:
Years of Pos-b-Secondary Education (Percent)
No. of Years Grade 8 Grade 10 Grade 12,
t
1 0.0, 0.4 1.1
-1' ,5.87: ,'.1
..... d-:- 0 0 . 0
2.1j "1
1 ,1
0 .0
'9i
0 . 8,,j
5 ,IE
571/2' 54.2 :1, 2.,-5.6:,6 or more 3i.3 38.5 1.:;;I,'-lA,2--.1 4
,z..
1 ;' ,- ^r., tb-,'",N.-
\ k; e
As with the elepaentary;-t .410or-the'N.,number bf years of post-secon'cla,,,e9**ti ,with gradelevel taught. Grade 12 teac'erthe a `at p,e 1;._ have mOreyearstf education than eithee7t-hectidOs,7kteachers, ao, al-
.though the between-grouraifferences-arenot..ael great ap they wereamong the elementary teaChers.
;-
Surprising).
.tlirrty-five percent of these secondary
teachers indicated tlfat1 tics was not one of their major sub-1 ject areas in their ur ergt4ate training. This finding ranged from
a high of almost'fifty:peceht at the Grade 8 level to a low ofsever} percent at Grade 12. In other word's, a fairly large proportionof those teaching mathematics at the secondary school 'level did notspecialize in mathematics at university and most such teachers are?pricing with students at the junior levels where the foundationsfor secondary mathematics are laid.
The situation with regard to training in methods. of teachingmathematics is, perhaps, cause for even more concern as,the data inTable 2-3 show.
Twenty percent of the teachers of secondary mathematics who
18

.15
responded to the questionnaire indicated that they had never taken a
course in the teaching of mathematics. Another 37% took such a course.
more than ten years ago.
Table 2-3Secondary Teachers:
Percent Who Have Taken a, Matliematics Methods Course
Yes
Grade 8 Grade 10 Grade 12
72.0 83.8 95.4
4
Recommendation 2-2: The Ministry of Education and individual schoolboards should require that all persons teaching mathematics at thesecondary school level have mathematics as one of their major areas'of study, in their undargraduate training and aTh urse in methods ofteaching mathematics. This recommendation is important at all levels,.
_but particularly at the junior ,secondary ones.
2.2 Teaching Experiences .
9
The results reported on teaching experience are based on groupeddata and are theeefore approximations of the true figures. All reportedmeans are conservative estimates: i.e., the true means are almost certainlysomewhat grOter than thOse reported.
The avrage number of -years teaching experience among the elemen-tary teacher respondents As 8.5 years; fo-their colleagues at the second-
` ary level, the average was 9.2 years. Grade 12 teachers of.mathemitics hadthe Aghest average nubbet..of years of teaching experience, 11.1, and.Grade 5 teachers the lowest at 8.3 years. Just overtone fourth ot theelementary teachers and one third of the secondary teachers had more thanthirteen years of experience. Less than six percent.of either group werein their first year .of teachingf.
2.3 Professional Activities
2.3.1 Membership in Professional Associations,
Teachers were asked to indicate to which of a number of pro-fessional associations they belonged: These retults are shown inTable 2-4.
With the notable exception of membership in the Primary,Tea- _
obchers Association, membershiprin professional societies is very low.It is particularly worrisome to note that at both,theprimary andintermediate levels, membership in associations specializing in theteaching of mathematics:is virtually lion- existent. At the secondary
19

ti
P.t
At 0-
16r-
log
level, 'wher tea ers specialize in one or two teaching areas, the
memberthip rate are still not very high.
Table 2-4 a
Members.ip in Professional Associations (Percent)
Association* Primary Intermediate Secondary
.11, BCAMT 2.9 2.8 27.7
NCTM 0:3 1.2 , 10.3
PSA 0.7 1.6 21.8
,3,4PITA 3.5 25.6 n/a
1Primary 56.0 i '1.7 tpra
"4
* BCAMT is the B.C. Association of Mathematics Teachers, NCTM is theNational Council of Teachers of Mathematics, PSA is the local special-
ists association for mathematics, PITA is the Provincial Lnteimediate
Teachers Association, and Primary is the B.C. Primary'Teacherse
ASsociation. -
Directors of the various associations, patticularly the spell"
cialist ones, might do well to consider the services their associa-tions are offering teachers at various levels In particular, it
may be that elementary teachers either rightly or wrongly see'little
advantage in belonging to a specialist, association.
o
At the same ,time, i would be unrealistic to expect each
-teacher to belong t' sev a4 subject-related associations. In the
case of an elementary chool, rather than expecting several teachers
to join aic association such as NCTM, the school could apply for group
membership and the benefits of such membership could then be shared
by the staff.
Recommendation 2-3:, Rather than expecting each elementary teacher
to join several subject-matter specialist associations, schools
should apply for group membership in such associations thereby
making many of the benefits of membership available to all teachers
on the staff.
k. 'Another way in which teachers'can become informedabout cur-
, rent developments in the teaching of mathematics is through,attend-
anc4-at conferences, workshops, or in-service days. Two items on
the questionnaire aAtt teachers to indicate whether pt of they
had participated in such activities in the last three ye rs. The
results are shown in Table 2-5.4
1

17,
O
Table 2-5.
Participation in Recent Conferences and In-ServicesActivities (Percent)
Grade Leyel
1 3 5 7 ,8 10 12.
Attended a conference
Math-session 67.1 60.1 49.6' 54.6 52.2 65.6 83.1
Attended a non-conferenceMath workshop 70..8 65.7 58.5 61.9 55.6 .6.4.6 74.2
At the primary and senior secondary levels, attendance at. mathe-
matics conference sessions and 1n- servic dl7t is significAntl,w more
'common than at the Grade 5, 7 and 8 levels. The,Grade 8 level, it
will be remembered, is the one with the highest concentration of
secondary teachers of mathematics with no university-level background
in mathematics or the'teaching of mathematics. It is also true that'
Grade 8 mathematics teachers have the lowest rate of membership in
professional associations of the three secondary.level groups who were
surveyed.
2.4 Opinions Regarding the Teaching of Mathematics
"2.4.1 'Elementary' Teachers
Teachers of Grades 1, 3; 5, and 7 were asked to respond 'to'
three statements c ncerning their feelings about the teaching of
elementary school athematics. For each statement, they were asked
to select a poin on a five-point scale ranging from "StrcIngly Agree"
which had a v e of 5, to "Strongly Disagree" which had a value of
1. The°data obtained are summarized in Table 2 -6.
VTable 2-6
Elementary Teachers:.
Opinidns About Teaching Mathematics
Mean Value
Mathematics is my ... Grade 1 Grade 3 Grade 5 'Grade 7 Overay.
(a) favourite subject to learn 2.8 2.8 1 2.8 3.1 2.9
(b) favourite subject to teach 3.6 3.9 41\2 4.3 4.0
(c) easiest Subject to teach 3.4 3.6 3.9 5.9 3.7
V. A
.
mClearly, a great many elementary teachers considered mathematics
one of4the easiest subjects to teach as well as oqe of their favouritesubjects to teeth... However, they 'did not enjoy. learning mathematicsas much astthey enjoyed teaching it. The fact that many of those whoresponded positively to statements
t
(b). and (c) were among those with-out any post-secondary training,in mathematios,6r"the teaching of
-mathematics raises the questionbf what th4se' teachers consideredto be the important aspects of teaching and learning Mathematics atthis level. Some light is shed on this que'Stion in'5ection 6.1 ofChapter 6 which summarizes teachers' ratings of the relative importanceof various currlkular objectivet in mathematics.
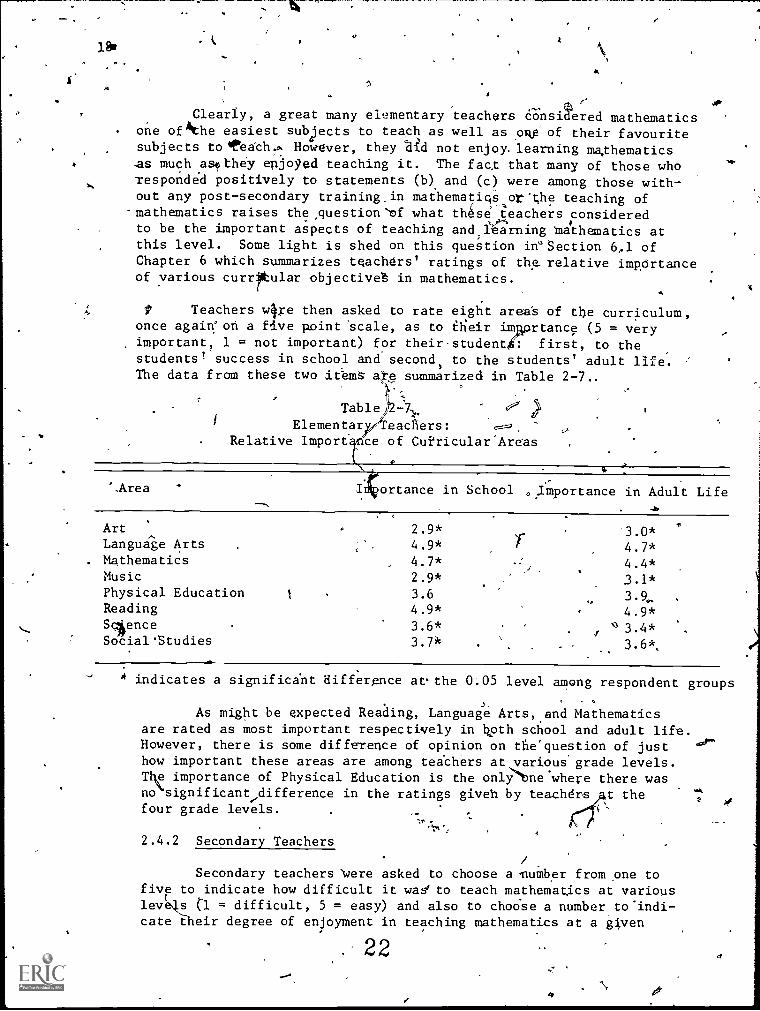
Teachers we then asked to rate eight area's of the curriculum,once again'on a five point 'scale, as to their imaprtance (5 = veryimportant, 1 = not important) for their-student k: first, to thestudents! success in school and second, to the students' adult life.The data from these two items are summarized in Table 2-7..
TableElementar eadlers:
Relative Import ce of Cutricular'Areas
%Area I ortance in School Importance in Adult Life
Art 2.9* 3.0*O
Language Arts 4.9* 4.7*Mathematics 4.7* 4.4*Music 2.9* 3.1*Physical Education 3.6 3.9,Reading 4.9* 4.9*SopnceSocial 'Studies
3.6*
3.7*3.4*3.6*,
* indicates a significant difference atthe 0:05 level among respondent groups
As might be expected Reading, Language Arts, and Mathematicsare rated as most important respectively in both school and adult life.However, there is some difference of opinion on the'question of just .0"
how important these areas are among teaChers at various grade levels.The importance of Physical Education is the on1)tIne where there wasnosignificantdifference in the ratings giveh by teachers t thefour grade leverls.
2.4.2 Secondary Teachers
/
Secondary teachers 'were asked to choose a number from one tofive to indicate how difficult it was' to teach mathematics at variouslevegs (1 = difficult, 5 = easy) and also to choOse a number to'indi-cate their degree of enjoyment in teaching mathematics at a given
22
4
.ko

4
4.
level (1 = do not enjoy; 5 lenjoy). The data gath red from thesetwo items are presented in Table 2-8.
Table 2-8Secondary Teachers:
Opinions re Teaching at Various Leve.s
Giade Degree of Diffdculty pegr e of Enjoyment
8 3.8 3.9* .
9 4.0' .4:1*10 4.1 . 4.4*11 4.3 4.612 4.2 4.8*
19
* indicates a significanti.difference at the 0.05 level amongrespondent groups.
-There is a high degree of, agreemerieamong seconday teachers
of mathematics that maihematics is easier to teeth at the seniorlevels than it is at the lower levels. It is also the case that th(enjoyment of mathematics teaching increases grade by grade.
LThe significant differences noted in Table 2-8 require some ego°
explanation. The Grade 8 respondents rated their enjoyment ofteaching mathematics at the Gradg 12 level relatively low, therebygiving rise to the significant difference.at the Cale 12 level.The other three significant differences were due primarily to teachersat the higher levels assigning lower ratings to their enjoyment ofteaching at the Grade 8, 9, and 10 levels.
It seems somewhat contradictory that teachers of secondarymathematics rate the junior secondary courses as the r.ost difficultto teach andyet it is at this 1001 that there are so many teacherswith less than adequate professional or academic training in mathe-matics. Further attention to these matters would appear to be war-
a
)
6

s.
Areaa
/Table 2 -9
lf
/411-Secondary- Teachers:
Relative Importance of Curricular Area's
.Importance in School- dir
Imoortance in Adult Life
Businessa
Education 3.0
English 4.8Fine Arts .2.6*
'Mathematics 4.6*,
MuSlc 2.5*Physical Educadon ,
Reading 4.9*
Science 3:9
Social Studies 3.8
Vocational Education 3.2*
3.8*
4.62.8
4.2*2,83.8
4.73.4
3.5
3.8*
* indicates a significant difference at the 0.05 level among respondent groups.
It is not surprising to find that teachers of secondary mathe=
matics rate their subject as one of the most important'both for a
student's success in school as well as in adult life. The significant
differences that were reported for both ratings of. the importance of
mathematics were due to the lok../er ratings assigned by the Grade 12
teachers. Grade 8 and 10 teacfiers rated mathematics higher in im-
pOrtance than did their Grade 12 colleagues.
2.5 Summary and Interpretation
The information presented in this chapter can be colledted and usedto sketch the broad outlines of "typical" teachers of mathematics at the
elementary and secondary levels. Such an outline must be intetpreted with
caution,and the results should not be applied to an individual teacher.
The "typical" teacher of elementary mathematics has four years of post-.
secondary education and nine years of teaching experience. One elementary
teacher inseven had mathematics as 1majorlfielbf,study in university,
one in fov has had no mathematics be, ond the secondary school lete1, and
one in sevlen has Ilea no training in methodology of teaching mathematics.
There is.a good probability that this "typical" teacher has recently at-
tended a conference session or an in-service day dealing with mathematics,
but a low probability that he or she belongs to a professional association
of mathematics teachers. This teacher considers mathematics to be one
of the easiest and most enjoyable subjects to teach, but not to learn as
a student.*
The "typical" teacher of secondary mathematics has five years of
g post-secondary education and nine years of teaching experience. There
is amt a thirty-five percent chance that this teacher* did .not major in
24

21
matheMatice. At the Grale 8 level, thete is a fifteen percent chance thatthe teacher has had no peat-secondary level mathematics training and atwenty-five _percent chance that he or she has nevet taken 'a mathematics
methods course. There is a fair chance that the teacher belongs to theB.C./Association of Mathematics Teacheis and a °good possibility that he o
she has attended a recent conference or in-service day on mathematics.,This teacher considers that mathematics is easiest and most enjoyable toteach at the senior levels, and that it is one of the most important areas
. of the curriculum.
On the one hand, the general picture that emerges at both the elemen -tary and secondary levels is 'that most mathematics classes are being taughtby experienced teachers with fairly extensive backgrounds in professionaltraining. On the 'other hand, too many teachers of mathematics have hadlittle or no training either in mathematics or the teaching of mathe-matics. Moreover, relatively few teachers of matheinatics are members ofprofessional associations specializing in the teaching of mathematics.
lThe situation appears to be piticularly acute at the Grade 8'level.In the first year of secondary school,vwhere many 'of the' foundations fdrfuture work are laid, students need the guiVance and directio4 of the very,best-prepared teachers of mathematics that'can be provided. While it maybe_understandable that a highly qualified teacher of mathematics prefersto teach at the senior levels, thks must be balanced against the needs ofthe students. Schools should ensure that at all levels, but particularlyin the secondary grades mathematics is taught oily by persons adequatelyqualified to do so:
Recommendation 2-4: Secondary schools should ensure that aZZ-mathe-matics classes are taught by only those teachers who are qualified
to do so. The situation described in this report concerning theZeveZ of qualification of teachers of mathematics aj the Grade 8,ZeveZ would appear to be the one in most urgent need of action.
2.6 Summary of R&ommendations
Recommendation 2-1: The Ministry of Education and individual school boardsshould require that aZZ persons teaching mathematics at the elementarysch9o1 level should have as a requirec4ft of'thei-r training the equi-valent of at least oree course in the matching of mathematics and onecourse in mathematics for teachers.
Recommendation 2-2: The Ministry of Education and individual school boardsshouldIrequire that aZZ persons teaching mathematics at the, secondary
school Level have mathematics as one of their major areas of stAdy,intheir
( undergraduate training and a course in methods of-teaching mathematics.This recommendation 'is important at all levels, but particularly at the
junior secondary ones.
Recommendation 2-3: Rather than expecting each eZemen,tary teacher to
join several subject-matter specialist associations, sChoas should apply. .
011
ti

22
for group membership in such.associations thereby m'akin many of-the bene-fits ofiqnembershl-p,avail toitati teachers on the staff.
Recommendation SecondoiT schools should ensure that.tll mathematicsclasses are taught by only thpse teachers who are qualified tQ do so. The
situation described in this report concerning the level of qualificationof teachers of mathematics at the 'Grade 8 level would appear to be the one'in most urgent need' of action.
7
T
44.
26
e.
\.-
I

..
..,
.
.
J
. 40CHAPTER 3
CLASSROOM ORGANIZATION
r
.i
27
de
..4
41-
I
&
r
'

lS
Teachers were asked to provide information. About cla;..s size, tlr,
amouni of time spent preparing and teaching mathematics classes, and certain
characteristics of their classroom organizational patterns. Part III of
the questionnaire consisted of Items 16 through 22 on the elementary
-questionnaire and of Items 38 through 26 on the secondary.
' 3.1 Class Size
The topics of class size and pupil-teacher ratio are of current inte-
rest both to educators and to the members of the general publit Teachers
know that with large classes it is virtually impossible to give pupils the
individual attention they need. Parents and tax payers know that a re-
duction in the pupil-teacher ratio can translate into an increase in
school district budgets.
In Chapter 6 of this volume, teachers' rating of the importance of
reduced class size to the success of mathematics instruction is' discussed.
In the present section; data concerning the actual size of mathematics
classes are presented and discussed.
The average size of mathematics classes a the elementary level is
25.0. the secondary level, the average is 29.4. The average class
*size foi each grade'is presented in Figure 3-1.
30
N-20
tN
to
1
7 77
3 5 7 8 10
C Pr A D E
12;.,
Figure 3-1: Average Class Size.for Mathematics
Class size increases steadily from a low of about twenty-three pupilsin Grade 1 to a high of nearly thi ty-one in Grade,8. .The average sizethen decreases through Grade 10 an 12 to a low of twenty-six. Overall,
the average class size at both lev is is approximately 26.
28A
'a)
26
3.2 'T,ime.Allotments
.3.2.1 Elnmentary Teachers
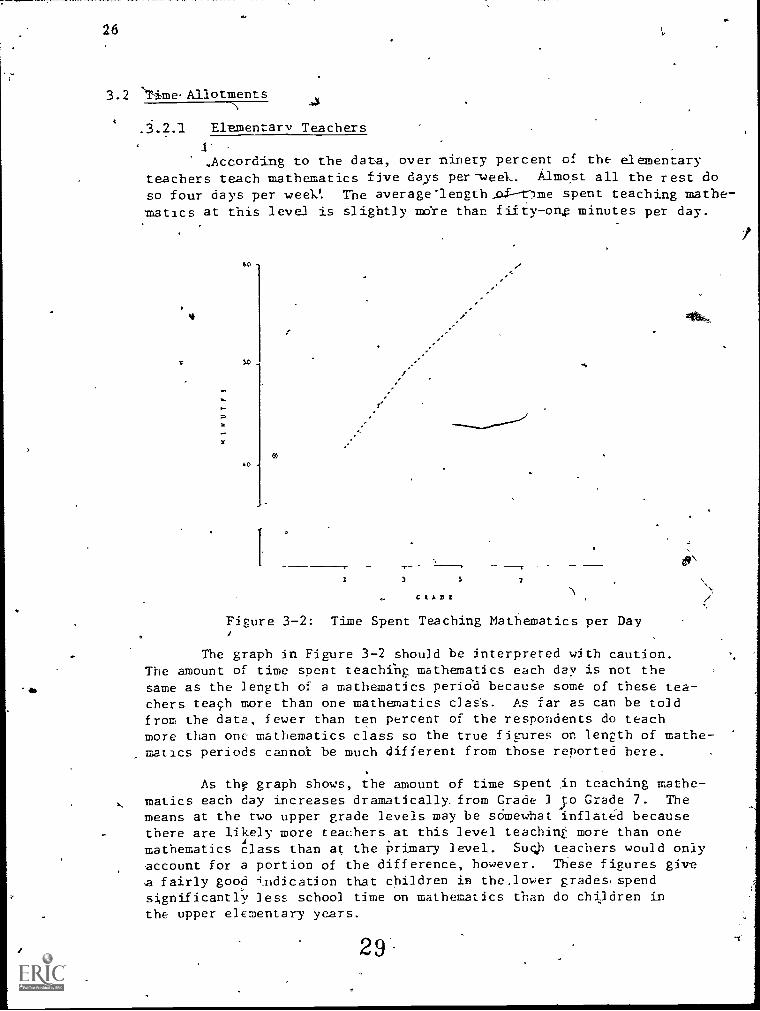
According to the data, over ninety percent of the elementary
teachers teach mathematics five days per-week. Almost all the rest doso four days per week'. The average 'length ..cd---ri_me spent teaching mathe-
matics at this level is slightly more than fifty-on.g minutes per day.
4e
5D
40 .
L3
C1ADC "-
Figure 3-2: Time Spent Teaching Mathematics per Day
The graph in Figure 3-2 should be interpreted with caution.The amount of time spent teaching mathematics each day is not thesame as the length of a mathematics period because some of these tea-chers teach more than one mathematics class. As far as can be toldfrom the data, fewer than ten percent of the respondents do teachmore than one mathematics class so the true fiFures on length of mathe-matics periods cannon be much different from those reported here.
As thf graph shows, the amount of time spent in teaching mathe-matics each day increases dramatically from Grade 1 5o Grade 7. Themeans at the two upper grade levels may be somewhat inflated becausethere are likely more teachers at this level teaching more than one
4mathematics class than at the p rimary level. Such teachers would onlyaccount for a portion of the difference, however. These figures givea fairly good indication that children in the.lower grades, spend
si,gnificantly less school time on mathematics than do children inthe upper elementary years.
29

27
.0./
In response to Item 19. teachers of elementary mathematics re-ported that they spend an average of almost thirty-eight minutes perday in preparing mathematics lessons and in grading. Teachers at theprimary levels spend significantly more time at such activities thando interme,diate teachers.. The data relevant to this question are dis-played in'Figure 3-3.
SO
40
30
S
CZADI
S.
Figure 3-3: Time Spent Daily on Preparation and Marking
3.2.2 Secondary Teachers
Secondary teachers were asked, to indicqte how much\time theyspent each day teaching mathematics and how much time they spent eachday teaching courses otberthan-mathematics. Their responses are sum-marized in Table 3-l".

2S
Grade/Year
10
12
$.0
Table 3-2Secondary Teachers: 'Sally Teaching Time (minutes)
Mathematics Courses Non- Mathematics Courses
162.9
186.3
196.2
96.252.337.6
the data show again that teachers of mathematics at the seniorlevel are more highly specialized than their junior secondary col-leagues. Grade 8 teachers spend only 62.9% of their teaching time inteaching mathematics. Tile corresponding figures at the 10 and 12levels are 78.1% and 83.49% respective
As in the case of the'elemen ary teachers, almost all of thesecondary teachers reported that they teach mathematics five days perweek. There were no significant differences among the three gradelevel groups of teachers in this regard.
Secondary teachers were asked separate questions regarding> the amount of time spent on lesson preparation and grading assign-
ments. The teachers indicated that on the average they spend 53 minuteseach day on lesson preparation and an additional 38 minutes grading
assignments: Responses from all three groups were very similar; therewere'rib significant differences among them. .
3.3 Organizati Sn for Instruction
Teachers.Were asked to select fom a list of four or fide alternativall of those whicirde'scribed their teaching situation. Since they could'
- pick more than one of the alternatives, some of the columns in Table 3-2have sums in excess of one hundred percent.
The data show that the vast majdrity of teachers at all levels teachin self.- contained classrooms., This is particularly true at each of thethree secondary levels, where more than ninety-five percent of the teachers
selected this alternative. The only significant departure 6ccurs attheGrade 7 level where one teachef in five .indicates that mathematics is some-
.what departmentalized: i.e., one teacher may teach several mathematics
.,heclasses.
0Both team teaching and open area organization are relatively recent
educational ,innovations. The teachers' responses indicate that ne'ithei
one has made significant inroads at any level, and that both are virtually
non-existent at the secondary level.V
31

29
Table 3-2
Categorization of Teaching Situarion,(percent)
Grade /Year
1 3 5 7 8 10 12
Self-contained room 86.k. 83.8 83.2 ) 77.8 96.1 97.5' 98.9 .
Team Teaching 7.3 5.4 3:8/
3.3 0.8 1.8 0.0
Open Area ,, 7.7 8.4 5.5 3.7 -0.3 0.7 0.0
Shared' Workioad* 2.6 5.0 8.6 20.9 N/A N/A N/A
Other 3.4 7.0 6.7 6.9 4.7 1.5 0.0
* elementary teachers only (one teacher takes all'the mathematics, another takes allthe language arts, etc.)
Teachers were also asked to select from among a number of al rnatives,the one or ones which best described how their students were organized formathematics instruction. Since they were permitted to select more than oneof the alternatives, the sum of each column in Table 3-3 exceeds one hund-red percent.
Table 3-3
Organization for Instruction (percent)
Grade
1 3 5 7
-10 ,12
Ability Groups 57.0 56.7 51.3' 53.9 / 32,9 32.3 18.0in.dividualiied Instruction 27.6 30.7\ 22:5 20.1 J 12.5, 17.4 .18.0.
Partially IndividualizedInstruction 51.19' 53. 50.2 54.5' 41.2 40.3 30.3
Total Class Instruction 53.8 52.9 43.7 47.6 66.8 69.4 87.6
Other 5.5 4..2 5.0 3,7 2.3 3.6 4.5
The data in Table 3-3 are somewhat difficult to interpret because ofthe number of different meanings- attached to some of the alternatives^de-scribed and because of the lack of a decision rule for teachers to use oneach alternative' to aid in deciding whether or not their particular teach-ipg approach fit a given alternative. ,,For example, no precise definition
of the term "individualized instruction" was provided. As a result, tea-chers who had their students Bork through a textbook on their own andteachers who had a highly organized system of tests and learning packagesadministered'in a supervistdenvironment. would both select' "individualized
320

30
instruction" as a descriptor .of th$ii teaching situation.
These weaknesses notwithstanding, the data in Table 3-3 indicate thatmany teachers are doing something other than total class instruction with
their-mathematics classes. The numb.ers who state that they make use ofability grouping or some form of individualized instruction are large in-deed, and +indicative of the teachers' awareness of individdal differencesamong their students and their willingness to address this problem. Only
at the grade 12 level where a gopd deal of self-selection has. already takenplace does total class instruction become the overwhelming choice of theteachers.
Closely related to the basis classroom organization, are the activitiesin which students and teacher engage during the mathematics lesson. Teachers
were asked to rate a number of such activities on a five point scale accord-ing to the number of times each activity was used in their classes (1 =new, 1.1, 5 = very frequently). The results obtained are summarized separatelyfor &lementary and secondary teacheq in Tables 3-4 and 3-5. In examin
these tables it. should be remembered that with groups of the sizes usedhere, any difference in excess of approximately 0.2 is statistically signi-ficant at the 0.05 level. That is, there is only a five percent chance thatthe differences reported are not real and do not apply to the entire popu=lation of teachers at these levels.
Table 3-4
Elementary Teac ers: Teaching Activities
Grade/Year3 5 7
OverallAverage
Oral -Work* 4.4 4.2 3.9 3.8 4.1Individual Work* 4.3 4.3 4.2 .'-4.2
' Small Group Work* 3.7 3.5 3.3 3.2 3.4Text Exerc is es* 3.5 3.9 4.3 4.3 4.0Math Projects* 3.0, 2.9 2.6 2.6 2.8Teacher Explains* 4.0 4.1 4.2 4.2 4.1Xctivity dentres* 3.2 '2.9 2.2 2.1 2.6Drill on iasic Facts* 4.3, 4.5 4.1' 3.6 4.1
-
* incdi tes a. significant difference at the 0.05 level amongrespondent groups'.
,33
4

fir
c
31
Table 3-5Secondary Teachers: Tea.ching Activities'
Grade/Year8 10 12
Overall'Average
Oral Work -Individual WorkSmall Group WorkText Exercises*Math Projects*Teacher ExplainsActivity Centres .
Drill on Computatibn
3.6(.2..7°
2.74.1
2.24.2
1.53.5
3.54.22.8
4.32.3
4.2
1.53.0
3.7
4.02.6
4.52.04.4
1.4
2%1
3.64.,2
2.7
4.2
2.2
'4.21.4
3.1
* indicates .a significant difference at the 0.05 level amongrespondent groups.
A number of interesting trends- re evident in these results.' Generallyspeaking, the frequency of use of text exercises and teacher explanationincreases with grade level. For the.remaining six activities, the general
trend .is'theopposite: as grade level increases,' selection Of the alter-
native decreases. In cases-such as the use of activity Centres and inci-dencof small group work"there is a dramatic drop,betweeri the Grade 7
and 8 levels in their selection of these alternatives.
.3.4 Summary
The average size of a mathematics class at the elementary level is-25.0; at the secondary level it is 29:4. The largest average class sizeoccurs at the Grade 8 levn
'
where it is 30.6.
Elementary teachers spend an average of fifty-one minutes per day-teaching mathematics, -And an additional thirty-eight minutes in lessontpreparation and grading of mathematics assignment. Secondary teachersof mathematics, who are more highly specialized and hence have fewer classpreparations than elementary teachers, spend an average of 176 minutes perday teaching mathematics, fifty-three minutes in.class preparation, apdthirty-eight minutes grading._
The self-contained classroom is by far the most comm teaching tua-
tion at all grade levels. About twenty percent of Grade 7 teachers indi-
i
cated that there wasa degree of departmentalization in their classes:i.e., different teachers for different subjects. Open area classes and,team teaching have made some inroads at the primary level, but not at the
.
higher grade levels.
- A large proportion of teachers at all levels indicated that some form
4of ability grouping, partially individualized instruction, and total class
3.4

32
instruction were,used in mathematics classes. The use of total class ln-struction tended to increase with grade level, while the other two decreased.
The most prevalent classroom activities in elem ntary mathematics,classes are individual 'work, teacher explanation, oral w k, drill on basic
' facts, and work on textbook exercises. At the secondary level they are .individual work, textbook exercises, and teacher explanation. The use of ractivity centres and creative projects for the teaching of mathematics isvery limited at-both the elementary and secondary levels.
The overall picture presented by these results is thA a considevItfe;amount of time is spent in preparing for and teaching mathematics classes;
. and that the teaching of mathematics is highly traditional" in character..,Putting together the results of several items shows that the most frequentlyused teaching techniques are total claSs instruction and teacher explanation.Among the most commonly used student activities are indiv,idual work andtextbook exercises. In other word%, and particularly at the higher levels,classroom organization for the teaching of mathematics is much the same as
*it has always been.
35
4
4.

we"
CHAPTER 4
USE' OF TEXTBOOKS
81.
.r e 8111., 0
-8t
e
.r
tir
*
.8
GI

35
There is probably no subject in)the school curriculum which is moretextbook-based thin mathematics. For many years, the table of contents ofthe approved textbook constituted the curriculum for the course. In morerecent times, teachers seem to have'moved away from dependence upon asingle textbook as the determinant.Of the mathematics curriculum and thismovement has teen encouraged by the Ministry of Education which has allowedschools al 'teachers to order multiple textrboks for mathematics instruction.
. Part V of the teacher questionnaire consisted of a number of itemswhich were designed to collect information on the ways in which teachersmake use of mathematics textbooks, thernature of the textbooks they use,and their degree of satisfaction with the various prescribed texts formathematics.
4.1 Extent of Use of Textbooks
As the data displayed in Table 4-1 make clear, the use of textbooksby teachers for the teaching of mathematics is virtually universal. Thelowest rates-'of usage occur at the Grade 1 and 8 levels, but even theseare greater than ninety percent. At the Grade 1 level it may be thatthose teachers who do not use a text have developed their own collectionsof,worksheets which they-use instead of one of the approved texts. Thelower rate at the Grade 8 level is more difficult to explain and may be acause for some concern in view of the fact that, as was discussed earlier,the academic and professional preparation of teachers of mathematics atthis level is lower than at either of the other two secondary levels.
Table 4-1-Extent of Use of Textbooks
Grade Level Percent Using One or MoreMathematics Texts
1 90.5
3 96.8
5 98.8
7 99.4
8 11.410 *N .r'':.. 95.9
--if
12 98.9
1 4
i
For the past several years the Ministry of Education has been encour-aging teahers of mathematics, particularly at the elementary levels, toutilize More than one textbook. It is hope that in so doing, -teacherswill be better able to allow for difference in approach, depth, and ratef learning. The Curriculum Guide for Math matics stresses the point that
2

no single text may be considered as the sole instrument for achievingthe objectives of the:mathematics curriculum..
In orderto gatige the degree.of acceptance of this philosophy byteachers, respondents who had indicated that they used textbooks wereasked whether or not they'used a multi-text approach in their teacingof mathematics. The results obtained are 'presented in Table 4-2. L'
Table 4-2
Number of Textbooks Used (percent)
r-
Grade Level1-5
8 10 12
One basic-text 41.8 20.8 22.9 22.3 41.0 33.9 43.8
Multiple texts, use of onepredominant 51.1 55.3 56,19 54:5 47.9 53.2 47.0
Multiple texts, equal useof each 7.1 23.9 20.2 23.2 11.1 '12.9 7.2
Very few teachers at either the Grade 1 or Grade 12 level use anequal sharing of multiple texts fpr the teaching of mathematics. On thecontrary, it is in these two grades where teachers say they use one basictextbook more than at any,of,the other levels. The figures in,Table 4-2indicate that the multi-text approach, ie., equal use of more than onetextdoes not appear to have gained widespread acceptance at any level,and certainly not at the secondary level.
At least seventy-five percent of the teachers say that they use eitherone textbook exclusively or multiple texts with one being used predomin-artly. As a mater°of fact, the use of several texts with one predomina-ting is the, mast popular alternative at each grade level.
On a related item, teachers were asked to indicate whether thereshould be one prescribed textbook series.for mathematics, several prescribedseries, or none at all. Their responses are summarized in Table 4-3.
'Table 4=3Teachers' Opinions Regarding the Optimum Numberof Prescribed Textbook Series for Mathematics
Optimum Number of Textbook Series
-One Several None I don't know'
Elemenmujeachers 16.8' 78.6 2.0 2.5
Secondary Teachers 258 69.9 2.8 2.2
<7---

37
'Statistically speaking, there were no significant differences amongthe responses of the three groups of secondary teachers to this item.About one quarter of them were of the opinion that there should he onlyone prescribed textbook series for mathematics at any level, and most ofthe remainder considered that there should be several approved series.The general trend was the same among the elementary teachers, althoughfewer of them maintained that one series was preferable. There was asignificant difference in the way in which different grade level groups,of elementary teachers responded to this item. Mord teachers at theGrades 5 and 7 levels preferred the adoption of a single'textbodk seriesthan did teachers at the Grades 1 and 3 lev7els.
air
he final item in this section was designed to determine whether ornot teachers-felt that they should be provided with an outline of theminimum learning outcomes at each level or grade to guide them in the.selection bf mathematics textbooks, materials, and activities. Theiropinions are summarized in Table 4-4.
Table 4-4
Teachers' Opinions Regarding the Establishment of Minimum
4 Learning Outcomes for Each Grade/Level
Agree Disagree I don't know
Elementary Teachers 94.0 3:6 2.5
Secondary Teachers 92.8 4.0 3.1
There is virtual unanimity among teachers at all levels, elementaryand secondary, that an outline of minimum learningdoutcopes for mathema-tics at each-grade or level should be provided as an aid to teachers, -
and the 1977 edition of the Curriculum Guide for Mathematics provide§a statement of core or essential objectives for each grade. In respond-
' ing to this item, teachers seem to be requesting such specific guidancein terms of the particular grade or level with which they are concernedas wells in assisting them to decide what are the minimum essentialsof thelEathematics Curriculum for their level.
Recommendation 4-l: The Curriculum Development' Branch should provideteachers of mathematics with an utline of the minimum learning outcomesat each level or grade to aid hem in the s'election'of mathematicstextbooks, materials, and a tivities:
4.2 Textbooks for Elementary School Mathematics
4.2.1 Textbook Series Utilized
Teachers of Grades 1, 3, and 5 were asked to name the text
39
at

, )
used for teaching mathematics. Their responses,, aTh'summat:ized in Figure 4-1. Since many :
n one text, the total perCent fqr eactvgradeercent.
or texts which theyreported as,percentteachers use more texoseds one hundred
GRADE 1
-" GRADE 9
GRAN, 5
4
Qr
'et
o-
40 -
30 -
la
PROJECT
\MATHMEATH STA
Figure 4-1: Textbooks Used in Grades 1,3 and .54
404$

41/
4. 39 /,
The Investigating School Mathematics texts are by far the most common-ly used at each of these grade levels. Over seventy-five percent of the`teachers at each of. Grades 1, 3, and 5 use these texts in their mathematicsclasses.
One surpfising piece of information obtained from this item is theextent to which the Seeing Through Arithmetic textbooks are still beingused. These textbooks were formerly on the list of prescribed series forthe teaching of mathematics, but were removed from the list several yearsago.when the mathematics curriculum was revised. In spite of that, overforty percent of Grade 5 teachers continue to use this textbook.
Teachers may be using the Seeing Through Arithmetic texts solely as asource of additional exercises or, perhaps, for alternative teachingapproaches to various topics. If, on the other hand, teachers are usingthese books as basal texts instead of the prescribed series, then therewould seem to be a communication problem of conslderable magnitude existingbetween teachers of mathematics at the Grades 1, 3, and 5 levels and thoseresponsible for implementing the spirit and the content of the newly revisedmathematics curriculum. An in-depth study of this question seems warranted.
Recommendation 4-2: The Curriculum Development Branch should conduct aprovince-wide stud to discover the reasons for the apparently widespreadLack of acceptance by elementary teachers of the newly revised mathematicscurriculum and the textbook series prescribed for its implementation.
f"4"
Grade 7 teachers were also asked to name the textbooks"aich they usedfor the teaching of mathematics. Their, responses ark presented in,Table 4-5.
4tti Table 4-5
Grade 7: Textbooks Used
Title Percent of Use
School Mathematics I Vtddison-Wesley) 79.5Mathematics I (Ginn) 59.9ESsentials of Mathematics I (Ginn) 47.6Contemporary Mathematics, Book I
.
(Holt, Rinehart) 43.6Other - 3.3
School Mathematics I is the mostpopular text at the Grade 7 level.Essentials of Mathematics I was designed for use by lower ability studentswhich is probably one reason it ranks third in this list. Mathematics I,on the other hand, is considered to be the most sophisticated and makhemati-
.cally rigorous of the three forerunners .,11
\ 41
4; 4

"01I
40
Contemporary Mathematics, Book I is to Grade 7 as Seeing Through-"Arithmetic is to the earlier grades. The text is no longer an the listof prescribed series, and has not been for several years. In spie ofthis, over forty percent of the Grade 7 teachers continue to make use ofit.
Table 4-6 "IP
Elementary Teachers: Teachers' Ratings of Textbooks
Rating Percent
Satisfactory
Not SatiSfactory
annot Say
-78.4
20.1
1.5
The data in Table 4-6 show that almost four out of every five teachersgive the textbooks they. are using a satisfactory rating overall. Thisincludes teachers at all four'' elementary grade levels surveyed, regardlessof which text they happen to be using for the teaching of mathematT
4.2.2 Reading in Mathematics Textbooks
The data in Figure 4 -2 indicate the amount of textual materialin a mathematics textbook which elementary teachers expect their lhstudents -to read.
PERCENT
100 -
10
0 -
03 -
4 0
30
10 -
001
10.
II
11111 ORR% 1
EIGRROE 3
GRIM 5
ISSI GRADE 7
p
0
< 1 OUT OF 5 1-2 OUT OF 5 3 -4 OJT OF 5 5 OUT 17 5
PACES
igure 4-2: Elementary Teachers Percent ofTextbook ad by Students

41
lit 4r
The Grade 1 teachers', responses to thia- significantly
different from those of the other three groups! .4bstantially more .Grade 1 teachers expect their children to read less than one page out ofevery five pages in their texts than-do other elementary teachers._Similarly, at least twice as many Grade 1 teachers say that their studentsace expected to read every page in their texts than do other elementaryteachers. Grade 1 teachers' responses to this item should be interpreted,cautiously since mathematics textbooks at this level usually require verylittle reading. For a typical lesson covering one or.two pages in ,thetext, the only reading required may be of the directions forftheexercises.
0'
Reading of technical material such as that found in mathematics text-books requires skills somewhat different from those needed for generalreading, skills that must be taught if students are to become adept at
-reading such material. Mathematics educators at all levels should examinethese results and consider means of improving students' reading skills inmathematics.
Overall, the responses to this item indicate that teachers do notexpect their students to read a great deal in their mathematics texts.Grade 1 aside, virtually none of the teachers expect their students to readall of the textual. material. However, it is encouraging to note a generaltrend toward an increasing amount of reading of such materiak as grade,level increases so that by the Grade 7 level, seventy percent of teachersexpect their students to read between one and four pekse6 out of every five.
Recommendation 4-3: Teachers of intermediate, maihematics shouldplace more emphasis upon teaching students how to read mathematicstexts with understanding.
Recomigndation 4-4: The Curriculum Development.J3mnch, schooldistrict curriculum specialists, and publishers of mathematicstextbooks should take steps to ensure that mathematics textbooksfor the elementary grades are designed to be read by the students,inasmuch as it is possible to do so.
'Recommendation 4-4`is not intended to imply that all, elementary schoolt
students should be able to read a mathematics textbook and master all of A,.
its contents on their own. Clearly this is not possible. However,
students should be able to comprehend the textual material that is there,and, with a teacher's guidance, explanation, and direction, to master thecontent of the course.
4.2.3 Uses of Pupil's Editions of Textbooks,
Teachers were asked to select from a list of ways in which atextbook might be, used, those which they employed in their classes.Since they were permitted to select more than one- option, the totals:in Table 4-7 exceed one hundred percent for-ZTEN-grade. .

0
42
ry
Taste 4-7Elementary Teachers: In-Class Uses of Textbooks
Grade Level
1 3 5'
'To develop a newconcept 23.9 36. 52.3 53.9
4To review conceptsdeveloped in class 60.3 -' 66,3 63.3 63.4
To ovide exercisesfor rill andpra ice 80.3 89.2 89.1 91.5
Other 1.6 1.8 2.9 2.4
By far the most frequent-use of the textbook is to provide exercisesfor drill and practice. In this regard, it is interesting to note thatalmost twenty percent of Grade 1 teachers do not use a textbook for is
purpose! Their number should not include the ten percent who ndi ed,
in response to an earlier item, that they did not use a mathematics text-book, since they were asked to omit all the textbook-related items on thequestionnaire. In otheOrwords, twenty percent of the Grace-1 teachers whouse mathematics textbooks de not use them for drill and practice exercises.
More teachers at every elementary level, but particularly at theprimary level, use their textbooks to review concepts which have alreadybeen developed in class than to develop new concepts initially. In other
words, teachers present the new material themselves and then have pupilsturn to their texts in order'to reinforce the concepts which they havebeen discussing.
Over forty-five percent of teachers at all elementaiy levels do notuse their textbooks to introducetew concepts, and over thirty perant do
. not use them to review concepts developed in class. Teachers who do not
use their texts for either of these purposes can only be using them to.provide exercises for drill and practice. Persons who are .interested in
ttie methodologies oAiteaching mathematics at this level tight wish to
pursue this question greater depth. -,
Recommendation 4-5: Educational4xesearchers and supervisors ofinstruction should investigate the ways in which mathematics textbooks areused in the elementary schoolg in an. attempt to clarify .the int4naction
,between teacher-based discussion and text-book-based discussion.
44I

4:2.4 Attributes of Preferred Textbooks
Elementary teachers were asked to select from a list of five
possible attributes of a mathematics textbook the one which bst.
described the kind of textbook they preferred. These results are
summarized in Table 4-8.
Table 4-8Elementary'Teachers: Attributes of Preferred Textbooks
(percent) *-
I prefer a textbook with:
Grade Level
3 5 7
Great emphasis-oh-Skills/drill . 22.2 16.1 .13.5 11.7
Greater emphasis on skills/drill than concepts/principles 25.6 30.4 32.2 28.9
Equal emphasi; on skills/drill and concepts/principles 45.3 48.8, 49.4 53.9
Greater emphasis on con -cepts/'principles thanskills/drill 4.3 3.5 3.9
,
4.8
. Great emphasis on con-.2.5 1.3 1.0 0.7cepts/principles
There are some differences in the ways in which teachers fromdifferent grade levels resRonded to this item. For example,- ,although
the percentages are low, it is more common for primary. teachers toprefer an dmphasis on concepts/principles than it is for intermediate
teachers. This preference4s probably a reflection of the fact thatthe curriculum calls for such an emphasis at'the primary level whererIlatively few of the major computational skills are, mastered, butwWereany basic and important concepts are introduced.
At every grade level, over ninety percent of the teachers saythey prefer texts with at most an equal balance between skilIsidrili,
and conceptsiprinciples. In fact, almost fifty percent of all the res-
pondents selected the third choice: equal emphasis on both.
On a related item, teachers {were asked to rate,the importanceof each of a number of purposes for a mathematics textbodk. The ratings
ranged from A low ofd, Not Important, to 5, Very. Important. The
4J

,
q,/07
, obtained are displayed in Table 4-9:
s /
STable 4-9Elementary Teachers: Purposes of Mathematics Tex&oks
A Textbook should: 1
,...delielop concepts '3:85 4.02...provide drill and
practice 4.67 4.73...prOvide enrichment * 4.04 4.18..:motivate the student * 4:12 4.05
....provide remedial ,'
material 3-.55 3.85
Grade Level
5 7 Overall
4.16 .4j0 4.06
4.71 4.75 4.714..08 3.95 4.07,4.07 3.77 4.'00
3.81 3.68 3.73
*indicates a significant 'cliff revce at Vie,00.dent gredps
There are significan differences amongrespondents on all but one of the five purposes
05 level among responz-
the four groups of-listed. All teachers
agree that a mathematics textbook should provide drill and practicematerial. There is a fairly pionounced tendency for teachers at theupper grade leyels to expect the textbook to provide develqpmentalmaterial for introduction of new concepts, and an equally pronouncedtendency for diem to expect less in the way of motivation from the
textbook. All four group's rate the provision of remedial material asthe least itnportant of these five purposes.
4.2. Preferred characteristics of Teacher's Editions
All o the contemp rary mathematics textbooks are accompanied
llby specially annotated ed i ions which are designed to assist teachers °
in lesson preparation and in teaching. Respondents were asked to rateeach of a number of characteristics of such teacher's editions on ascale from 1, Not Important, to 5, Very Important. Their .ratings are
summarized in Table 4-10.
46
Tft

/07
45
Table 4-10Elementary Teachers: Importance of Certain Characteristics
of Teachers' Editions
The teacher's edition should, provide
Grade Level
1 3 5,...
1
7 Overall
t
...lesson objectives * 4.40 4.3g 4.18 .08 4.25
...suggested discussiOn * 3.72 3.77 3.68 3.45 3.65
...lesson developmen1 4.08: 4/.10 3.9.6 3.84 4.00
...exercise answers at thefiend '* 2.45 3.38 3.56 3.68 3.29
...enrichment materials * 4.38 4.36 4.27 4.14 4.28
...remediation materials * 4.25 4.27 ,4.18 4.04 4.18
...follow-up activities '* 4.40 4.35 4.14 4.00 4.22
...suggested resources * 3.71 3.55 1:34 3.33 3.48
...achievement tests 3.30 3.83, 3.96 3.91 3.76
...diagnostic tests * 3.69 4.05 4.20 4.15 4.03
...suggested' teaching aids "* 4.00 3.91 3.70 3.57 3.79
...time allotments * 2.61 2.73 2.86 2.72 2.74
.:.overprinted answers * 2.73 3.67 4.01 3.86* 3.59
* indicates a significant difference at the 0.05 level among/a--respondent groups.)
As is notbokin the tal4e, there was a significant differencein the way the four:groups responded to each of the factors. On five
of the thitteen, the importance of the factor decreases steadily withan increase in grade level. In only one case, exercise answers at theend, doed the reverse trend hold true.
In every case'but the qne just mentioned the Grade 7 teachersrank the factors lower than do the Grade'5 teachers.. As will.be seenlater, it is also true at the secondary level that the senior second-ary teachers tend to rate the importance of-teachers' editions lesshighly than do their junior secondary colleagues.
These data indicate that teachers want the features which arecommonly found in teachers'- editions of mathematics'textbooks. Of'the
fifty-two ratings shown in Table 4-1014'only five are less than 3..0,the mid-point of the scale, and the lowest rating was 2.45.
4.2.6 Ratings of Textbooks: Grades 1,-3, and'5
Teachers of Grades 1, 3, and,5 were asked to rate threeapproved textbook series -On each of four factors: reading level;stress on whole number computation; stress on problem solving; andstress on metric measurement. The graphs in.Figures 4-3 through 4-5that-are used to summarize the data are based on percents which havebeen adjusted so as to include the opinions of only those teacherswhy were sufficiently familiar with a series to rate it on a given
47

factor. In some of these factors, as many as one-half of therespondents stated that they did not haire enough information tomake a judgment.
100 e,
03
10
*-
4 gm so -
-
32 -
111
e
ISM
PROJECT MATH
MEATH
11111
TOO
HI GM
ABOUT
R1 WiT
TOO
.1.0111
Figure 4-3: Teachers' Ratings ofReading LeVels of Textbooks
48

47 ...
In'Figure 4-3, and the two subsequent graphs, "ISM" denotesInvestigating School Matheugtics, "Project Math" denotes Proje6tMathematics, and "Heath" ddnotes Heath Elementary-MathematicsThese abbreviated forms will also be used in the text discussing thedata.
Both ISM and Heath seem to besat,isfaCtory to the largemajority of teachers insofar as their reading levelsare concerned.On the other hand, almist half of the teacherd are, familiar withProject Math feel that the reading level ill that series is too high:Very few teachers indicated that any of .the series had too low areading level. 4,
9
Project Math was seen 637 teacherslas placing fobis on computation with Whole:numbers. Over 55% of the respondentsgave the series a low rating on this factor. Almost none of theteachers indicate hat any of the series emphasized` whole'number com-,putation too much.
4. a, 0
r
.6
a
49

48
1
HEATH
PROJECT MATH
ISM100 v
90
80 -
70
OS -
a.g so -0.
40 -
RS
20
C
Tb0 ABOUT TOO
HOCH RIGHT L I TTLE,
`Figure 4-4: Tea9b, Ratings ofd Emphasis
oit-eomputclon in Textbooks
s'a
t
e

Problem solving is one of the major strands in the mathematics
curriculum, and teachers were asked to rate the three series with
respect to the extent of their treatment of this topic. As the graph
in Figure 4-5 showd:`E substantial proportion of rpapondents think that
all three series place too little, emphasis on problLem solving. On the
,other hand, almost fifteen percent.see Project Math as placing too
much stress on it.
A
JO g-
00 -
70 -
CO
ISH
PROJECT MATH
HEATH ,
TOO
LITTLE
Figure 4-5: -Teachers' Ratings of Emphasison Problem-Solving An Textbooks
5144
I

50
Finally, Grade 1, 3, and 5 teachers Were asked to rate thethree textbook series according to their stress on metric measure-ment. The results for all three series were virtually the same.
\zlietween sixty and sixty-five percent of the respondents expresgedthe opinion that all three series had the correct emphasis.on metricmeasurement, while between thirty and thirty-five percent said therewas too. little such stress in all three series. Almost none of theteachers indicated that any of the series over-emphasized the topicof metric measurement.
\I
4.2.7 Ratings of Textbooks: Grade 7
Grade 7 teachers responded to the same four questions as theGrade 1,-3, and 5 teachers with respect to their textbooks: .SchoolMathematics I (School Math), Mathematics I (Math I), and Essentialsof Mathematics I (Essentials). The percentages reported in thissectl1on have been adjusted to reflect only the opinions-of thoseteachers who felt qualified to rate a particular textbook on a givenfactor.
Oa
52
1
4e.

e"
I
r--
s
1t.wa
SCHOOL HAM
MATH 1
ESSENTIALS100
90
90
'I'll
0
' I
TOO
HIGH
ABOUT
RIGHT
TOO
LOW
...
Figure 4 -6:, Grade 7 TeacherP Ratingsof Reading Levels of Textbooks .
g
).,
D
\
I-
.4
51
"J
405
..-
a.
/OA

sitV
The results displayed in Figute indicate that School Math
was rated as having just about,the correct reading level by threa-quarters of the riespondente* and hardly anyone rated either it or
Math I as having to lova .-beadipg level. Essentials, on the othei -
hand, was judged to have too low a reading le almost forty per-
cent of those responding. 'It should be te MI text Was ,
written-for low iility students..
On the ratingsof,_the emphasis on:oompUw n with whole.numbers, itv- the three ee*td.betwee thirtir.ttrpe and forty-one'percent of the teachers felt that there was too\alt?le emphasis, in.anyof-the _three textbookS. This appears to be a relatively seriouscriticism of these books since computational skillsNithwhole nuthberSare po important to the elementary curriculum.
1°Th ssentials text was seen to be the weakqst of thelphreelpi
the extent its treatment of problem solving. As he graph in,
Figure-4-7 indicates, however,.the other two texts were n rated
especiilly highly orithis trait either.
est
54 .
C
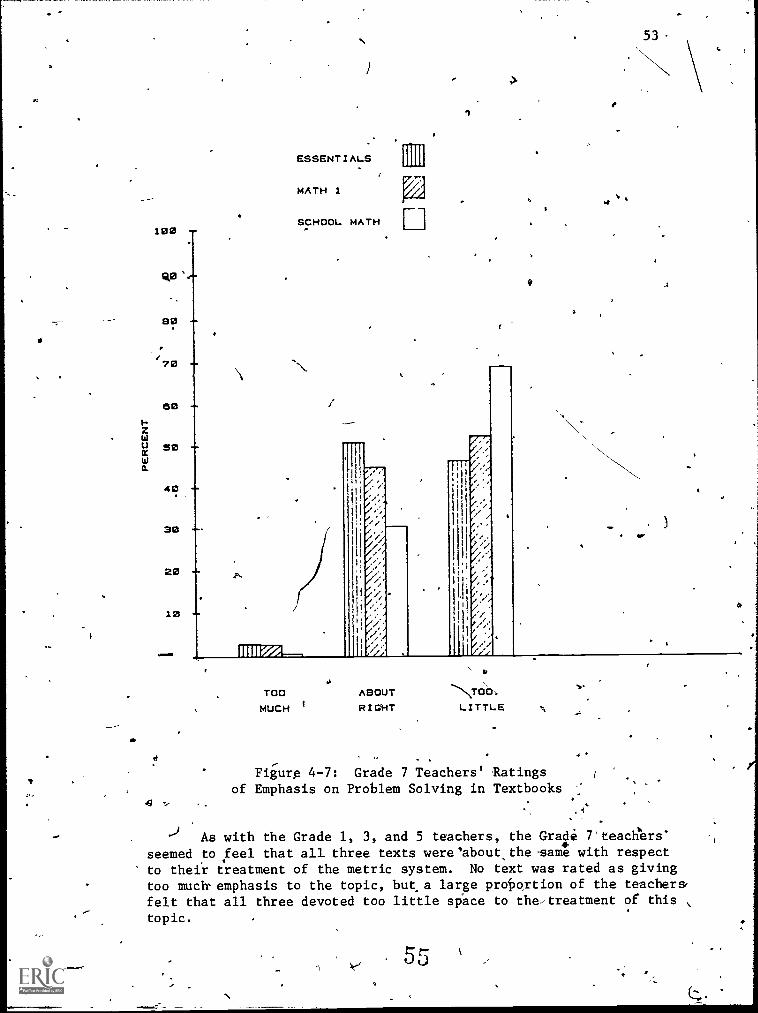
100
Q,0
90
e70
50
50
40
30
20
10
ESSENTIALS
MATH 1
SCHOOL MATH
I
I
11
1,
'I'll
TOOMUCH
ABOUTRIGHT
I
,*
Figure 4-7: Grade 7 Teachers' Ratingsof Emphasis on Problem Solving in Textbooks
53
4.
.3
As with the Grade 1, 3, and 5 teachers, the Grade 7'teactiers'seemed to feel that all three texts were about the -same with respect
.
to their treatment of the metric system. No text was rated as givingtoo muck emphasis to the topic, but.a large proportion of the teachers,felt that all three devoted too little siace to the-treatment of this ,
topic.
55

54
4.3 Textbooks or Secondary'School Mathematics
4.3.1 Reading in Mathematics Textbooks
All three groups of secondary teachers of mathematics were insubstantial agreement concerning, the amount of reading they expecttheir students to do in-their mathematics texts. For that reason,only the overall averages are reported in Table 4-11.
. ° -'5Table 4-11Secondary Teachers: Proportion of Textbook Rea& by Students
Proportion 'Percenta
Less than 1 page out of 5
1 - 2 pages out. of 5
3 -.4 pages out of 5 .
5 pages out of 5
40.5
34.3
20.5
4.8
Almost seventy-five percent of thesesteachers indicaie-that.their students are expected to read at mostawo pages out of every -"five in their textbooki, a rate almost ten percent higher than for the,elementary teachers'.
Readihg of technical material such'as that found'in mathematicstextboo s requires'skills which are somewhat different from thoseneeded fo general reading, skills which must be learne& and taught.Teachew of mathematics at all levels should examine these results,andiconsider means of improving students' skills in the reading ofmathematics.
Recommendation 4-6: Teachers of secondary mathematics should placemore emphasis upon teaching students how to read mathematics textswith,understanding.
'RecommendatioA,47: The Curriculum Development Branch, school districtcurricuhum specialists, and publishers of mathematics textb06ks.shouldtakesteps to ensure that mathematics textbooks for the secondarygrades are designed.to be reacby the studentssinasmuch as it-ispossible to do so. -
Recommendation 4-7 is not intended to imply that all secondarystudents should be able to Master the contents of a mathematics text
* on their own. This is prohlably not possible, T2g it is certainly notdesirable from a methodological viewpoint. However, .students should-be-Able to comprehend the material that is in the text which; in turn,means that this material should be written for the student and notsolely for the teacher.
56
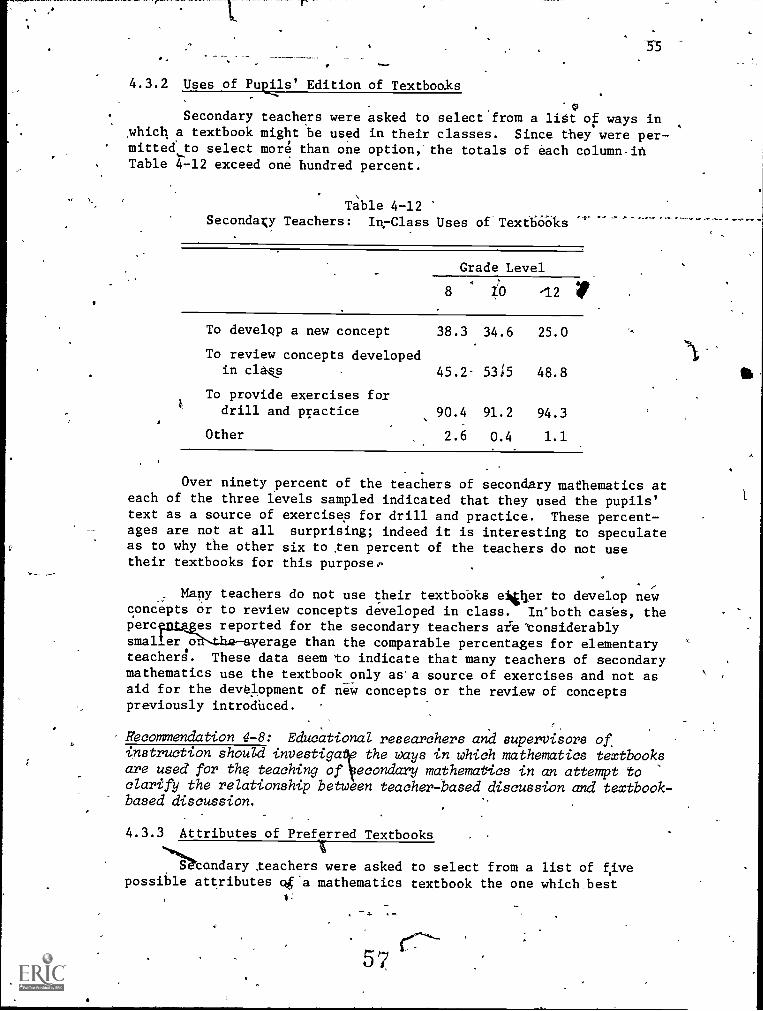
..
4.3.2 Uses of PuEils' Edition of Textbooks
Secondary teachers were asked to select from a lit of ways inwhich, a textbook might be used in their classes. Since they were per-
' mitted to select more than one option, the totals of each column-iftTable 4.-12 exceed one hundred percent.
Table 4-12Secondary Teachers: In, -Class Uses of Text6OOks
Grade Level
8 tO -12 rTo develQp a new concept 38.3 34.6
To review concepts developedin cla§s 45.2- 5315
To provide exercises fordrill and practice 90.4 91.2
Other 2.6 0.4
25.0
48.8
94.3
1.1
. .
Over ninety percent of the teachers of secondary mathematics ateach of the three levels sampled indicated that they used the pupils'text as a source of exercises for drill and practice. These percent-ages are not at all surprising; indeed it is interesting to speculateas to why the other six to ten percent of the teachers do not usetheir textbooks for this purpose.'
. rMany teachers do not use their textbooks eiVier to develop new
concepts or to review concepts developed in class. In'both cases, theperc es reported for the secondary teachers afeconsiderablysmal.er o. erage than the comparable percentages for elementaryteachers. These data seem to indicate that many teachers of secondarymathematics use the textbook only as'a source of exercises and not asaid for the devq.opment of new concepts or the review of conceptspreviously introdUced.
Recommendation 4-8: Educational researchers and supervisors ofinstruction should investiga the ways in which mathematics textbooksare used for the teaching of econdary mathematics in an attempt toclarify the relationship between teacher-based discussion and textbook-based discussion.
4.3.3 Attributes of Preferred Textbooks
''''''htandary teachers were asked to select from a list of fivepossible attributes ag'a mathematics textbook the one which best
57
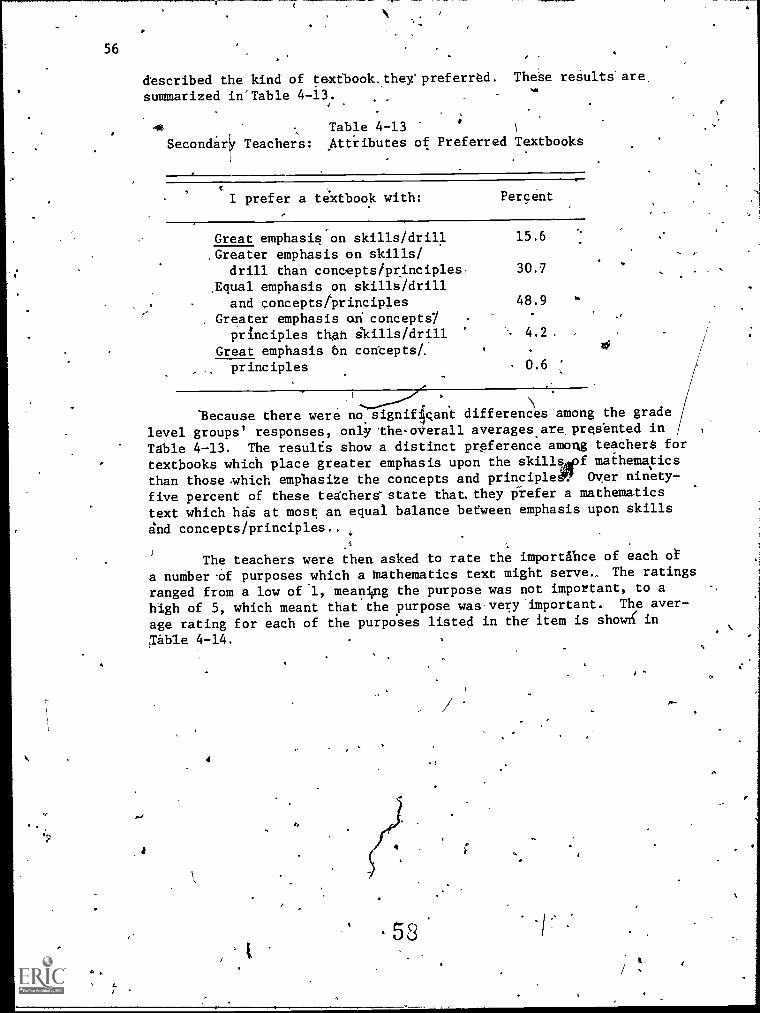
56
4 ,
1
described the kind of textbook.they'preferrtd. The'se results are,
summarized in'Table 4-13.
Aft Table 4-13;
ti
Secondary Teachers: Attributes of Preferred Textbooks
Sm
I prefer a textbook with: Percent
Great emphasis:on skills/drill 15.6
,Greater emphasis on skills/drill than concepts /principles; 30.7
,Equal emphasis on skills/drilland Concepts /'principles 48.9 ..
Greater emphasis on concepts/principles thAh skills /drill 4.2.
Great emphasis bn concepts/.
principles 0.6
'Because there were no signif4gant differences among the grade
level groups' responses, only the-oVerall averages.arepresented in
Table 4-13. The results show a distinct preference among teachers for
textbooks which place greater emphasis upon the skillsgef mathematics
than those which emphasize the concepts and principle de Over ninety-
five percent of these teachers state that, they Piefer a mathematics
text which has at most an equal balance between emphasis upon skills
and concepts/principles..
The teachers were then asked to rate the importance of each of
a number .of purposes which a mathematics text might serve.. The ratings
ranged from a low of 1, meaning the purpose was not important, to ahigh of 5, which meant that the purpose was-very 'important. The aver-
age rating for each of the purposes listed in the item is shot-4 in
l'able 4-14.
58
w.

1
).%
Table .4-14 -'Secondary Teachers: Purpose of Mathematics Textbooks
'\,A Textbook should: Average Rating
.
...develop concepts
...reinforce skills
...provide drill andpractice
...provide enrichmentmaterial
...motivate the student
..provide remedial.,material
4.01
4:72
* 3.86
3.90
3.64
* indicates a significant difference at the 0.05level among fespondent groups.
57
There.was a significant difference among the three groups ontheir responses to only one of the purposes, namely the provision ofenrichment material. In this case the Grade 8 teachers felt that thiswas a lesslimportant-purpose than di0 either the'Grade 10 or theGrade 12 teachers.
V
tac4of the purposes was rated quite highly; the lowest rating/was 3.64 for the provision of remedial material. The ratings of the
reinforcing Akins factor and the providing drill and practice factorare 'extreme', high:1;01e hith rating, given to the develgpment of con-cepts would appear to conflict with the teachers' earlier downgradiqg.of their use .bf textbooks fOr this purpose.
. 4.3.4 Pref rertharacteritics of Teacher' (Edition'
All of th e contemporary textbooks for secondary school mathema-tics are accompanied by sRecially annotated editions for teacherswhich axe designed to assist them in lesson preparation and teaching.
'-Respondents were asked to rate each of a nuFber,of characterist4cs ofsuch teacher's editionson a scale ranging'from 1, Not Important, to5,"Very Important. Their ratings are summarized in Table 4-15.
r
5L
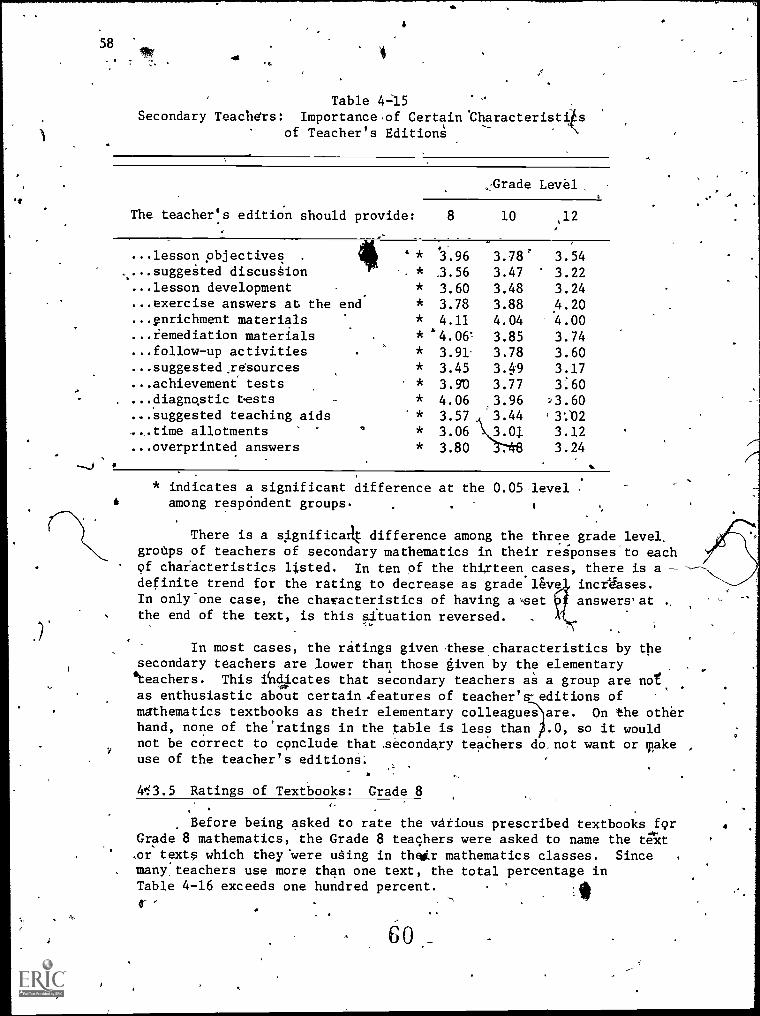
4
584
,.
Table 4-15Secondary Teachers: Importance,of Certain Characteristi4s
of Teacher's EditionA
.Grade Level,
The teacher's edition should provide: 8 10 ;12
...lesson objectives . 411 4* 3.96 3.78' 3.54.,...suggested discusbion -. * .3.56 3.47 ' 3.22...lesson development * 3.60 3.48 3.24...exercise answers at the end * 3.78 3.88 4.20...pnrichment materials * 4.11 4.04 4.00...iemediation materials * a.4.06' 3.85 3.74...follow-up activities * 3.91 3.78 3.60...suggested resources * 3.45 349 3.17...achievement tests * 3.90 3.77 3.60...diagnostic tests * 4.06 3.96 73.60...suggested teaching aids * 3.57 3.44 '3:132
...time allotments ° * 3.06 3.01 3.12
...overprinted answers * 3.80 3.24
--.....)
* indicates a significant difference at the 0.05-level* among respOndent groups. . 1
groups of teachers of secondary mathematics in their responses to eachThere is a significant difference among the three grade level,
of chaiacteristics listed. In ten of the thirteen cases, there_is a ---definite trend for the rating to decrease as grade live incedases.In onlyone case, the characteristics of having a%set answers'at ,the end of the text, is this situation reversed. .
-.-
2
.
In most cases, the ratings given .these characteristics by thesecondary teachers are lower than those given by the elementary
.
*teachers. This indicates that secondary teachers as a group are not1*%
as enthusiastic about certain .features of teacher's-editions of
hand, none of the'ratings in the table is less than .0, so it would)
mathematics textbooks as their elementary colleagues are. On the other
not be correct to conclude that secondary teachers do not want or Takeuse of the teacher's editions.
4*$3.5 Ratings of Textbooks: Grade 8
Before being asked to rate the various prescribed textbooks forGrade 8 mathematics, the Grade 8 teachers were asked to name the text.or texts which they 'were using in thewir mathematics classes. Sincemany, teachers use more than one text, the total percentage inTable 4-16 exceeds one hundred percent.

Other. 8.1
59
Table 4-16Grade 8 Teachers: Textbooks Used
Textb'ook Percent
School Mathematics II 33.8Mathematics II 53.5.Essentials of.Mathematics II 32.4'Fundamental Concepts of .
EleMentary, Mathematics _0 2. ""
.
No one text appears to have the predominant position in Grade 8.'School Mathematics II and, Mathematics II haveirtually equal sharesthe market. The third major text, Essentials of Mathematics II, isaimed ti-students of lower ability'and
tthis fact probably accounts f
its having a smaller share of the Grade 8 market.
Grade 8 teachers were the most dissatisfied among the secondaryteachers with'the text that they wdre using. Only 61.4% of themsaid they found thei to be satisfactory, and 36.1% found them tobe.unsatisfactory, g nerally peakin. This rate of dissatisfactionis substantially hig er than the comparable rate at any of the otherlevels sampled, elementary or 'secondary.
A more precise idea of what teachers at thiklevel find unsatis-* -'factory about their textbooks may be obtained by an examination of
' their responses to four items in which they were asked to rate theirtextbooks on'each of four factors.' Thefour factors were reading level,
N ' stress on computation, stress on.. problem,solving,,and_stress 9p enrich-ment. In'the discussion of the texts whfch follows, the data areexpressed in Percents which have been adjusted so as to include theopinions of only those teachers who were sufficiently familiar with agiven textbook to rate it for a particular factor.. On some of these
. . factors, as many as thirtg,..perCent of the respondents stated that theydid dot have suffitient information upon which to base a valid judgment.
In the graph"shown in Figure 4-8 which describes teachers'ratings of the reading levels of the Grade 8 mathematics textbooks,School Math denotes the School thematics II textbook, Math II the`Mathematics II text, and Essen s the Essentials of Mathematics IItext. These abbreviated forms 1 also be used in the text whichcontains the discussions of these rati gs.
As indicated in Vivre 4-8, at least a majority of the respond-ents see each of`the texts ie having just about the right reading levelfor the grade level. However, slightly more than one-third of theteachers feel that the reading level in Essentials is o low. Thefact that the reading level in this text is too 1,ow,' acc ding to someteachers, is undoubtedly due to its having beentwriten fo lowerability students.
6 7

60
4
SCHOOL MATH
'MATH It
ESSENTIALSr-1
(10
90 .!
t
8
70
60 11
50 -
40 i
30 Is
1 .
20'1
10 L
TOO
HIGH
1)(Figure 4-8: Grad Teacherg' Ratings
of Reading fevels of Textbooks
14
ABOUT TOO
RICHT if, Low
. .
There was a considera le degree of agreethent among the respond-
ents in their ratings of the text ooks° emphases on computation and problem
solving. No text was seen by mor than five percent of the teachers as '
'placing tdo\much stress on eithA% f these areas, and over forty percent
felt that all threettextbooks.place too little emphasis on both. These
. 62

ti
61
ratings eOnstitnte a serious criticism of the three prescribed Grade8 texts, and something should be done to improve the situation.,
Recommendation 4-9! Persons responsible for the approval and adoptionof mathematics textbooks at the Grade 8 ZeveZ should take under advise-.ment the concerns expressdd by Grade 8 teachers concerning the treat-ment of computational skills and problem solving in textbooks.
Slightly more than fifty percent of the teachers felt thatEssentials placed too little emphasis upon,en;*6ffilient topics. Again,it should be noted that this text was written for:loiker ability studentsso it is not overly surprising that it contains little in the way bfenrichment topics. Both School Math and Math II were judged by seventypercent of the teachers as having about the right amount of enrichment. 0
4.3.6 Ratings of Textbooks: Grade 10
There is a fairly large number° of textbooks which have been pre-scribed for use in Grade 10 mathematics. Teachers were asked to .
indicate which texts they used with their mathematics 'claspes;these results are summarized in Table 4-17. Since a teacher may beusing more than one text, the total in theltable exceeds one hundredpercent.
Table 4-17Grade 10 Teachers: Textbooks Used
Textbook Percent
Mathematics for a ModernWorld, 2. .69.5
Geometry 19.6`Mathematics: A Modern Approach 21.1
Trouble-Shooting MathematicsSkills 20.4, 6
Essentials of Mathematics III!Modern Algebra, Book 1 46.2Mathematica1 Pursuits Two 8.0Busindss and Consumer Mathe-matics
Career Mathematics, Industryand Trade
Other
34.5
21.1
8.0°
t63
ti

62
. , One text, .ilathillatics for a Modern World, is used by almostI
' seve nty percent 41.f the Grade 10 teachers of mathematics. The nextmost commonly used book was selected by 3ess than fifty Pergentoof.the teachers. Two of the texts, Essentials of Mathematics andMathematical Pursuits Two, are used by less than ten percent of theteachers. .P \ ,, .
,z' Grade 10 teachers are more satisfied with their textbooks thanare the Grade 8 teachers. Slightly/more than seventy percent.of
° the Grade 10 teachers indicated,that,.in general, they were satisfiedwith the books. Sow twenty-five perCenn indicates that they'found the
. ..text or texts they wefe 'using tb be unsatisfactory.
A clearer picture of what the teachers mean by their ratingsof the textbooks as satisfadtory or unsatisfactory may be obtainedfrom an examination of their responses to four items in which theteachers* were asked to rate the textbooks on each of four 'fact:': Thefour factOrs were reading level, emphasis on computation,, emphas anproblem solving, and emphasis on enrichment topics.. In the[discu6sionof the teachers' judgmen s on these four factors, the data are express-ed as percents which 4 e_been adjusted tb.reflect the opinions, Ofonly those teacherswha were suff ciently familiar with a given text-book .to rate it on a pa titular f ctor.1 On some of these factors at
- the Grade 10. level, a 1 rge proportion Of the respondents felt unquali-. fied to express an °On on. For examplet, in the case of the .
Mathematical Pursuits o text, almost seventy percent of the teachersdid'not give a rating for the emphasis, on.problem.solving iit that tat.
'able 4-18 summarizes the teachers' ratings of the readinglevels of the nine prescribed textbooks.
igt
Table 4 -18
Grade 10 Teach rs! Ratingsof the Reading Lev lsof Textbooks
Text Too,High About Right) 'Too Low.
'Mathematics for,A ModernWorld, 2
Gedmetry'
Mathematics: A Modern ApproachTrouble-Shooting Mathematics
Skills .
Essentials of Mathematits IIIModern Algebra; Book IMathematical Pursuits TwoBusiness and,Consumer Mathe-
matics,Carder Mathematics, Industry
and Trade
0
3.4
62.8 ,
6.9
1.6-
1.1
34\..2.
45.3
22.3
10.2
89.947.278.4.
4.... ......
62.1
44.965.845.3
71.5
81.8
j
6.70.014.7
36.353.90.09.3
6.2
8.0
64.

Four of the nine texts were judged by more than twenty percentof the teachers as having too high a reading level for their students;one text, Geometry, was considered to have too high a reading level bymoreithan,sixtY'percent of the respondents,
1**A
On the other hand, only two texts were judged to'have too lowa reading level by more than twenty Percent of the teachers.' Both ofthese are. texts designed to be used with lower ability students, andthis undoubtedly accounts forlheir low re ing
Almost ninety percient of the -Ichers ated Mathematics for aModdrn WU and Consunier Mathematics as having just about the correctreading leveimfor their students.= The formerlis also the text usedby more teachers than, any othvrescribed text.
k
The ratings of the textbooks with respect to their strtss on thetopic of computational skills are summarized in Table 4-19.
Table 4-19Grade 10 Teachers' Ratings
of Stress on Computation in Texts
Textbooka
Tod Much About Right Too Little
Mathematics fbr a Modern' World, 2Geometry1,Ithematics: A Modern Appkoach
0.55.9
58.3
51.570.9
41.242.6
20.5
Trouble-ShoOting MathematicsSkills 10.9 7.0
Essentials of Mathematics III -2.4 56.1 41.5Modern Algebra, Book-1 13 79.0 19.7Mathematical Pursuits Two 8.3.2 51.7 40.0Business and Cesumer Mathe7. .
ma'tics_
10.0' 78.5 11.5Career Mathematics , Industrrs.
and Trade 6.0 77.40
.16.7
Four of the textbooks, including,Mathematics for a Modern World', )the` most pOpultr text, were judged by more than forty percent of the'teachers-to deVote tod'little'emphasis to the topic of computationalskills. -This would appear 'to be a very serious criticism of 'thesetexts. MOdg.rn Algebra,on the other hand, received a positive rAtiftgon this factor fiOm almost eighty percent of thoselphd respdnded.Several other.litextbooks also.receiVed high ratings on_thisfactor, andall,af them are textbooks designed for use ,primarily:with students of
0 low ability in mathematics. 4e
The third factor concerning the mathematics textbooks which theteach-vs were asked to rate was the degree of emphasis placed upon
t

64
dr problem solving. These results are displayed in Table 4,20.
g
' Table 4-20, Grade 10 Teachers' Ratings
of Emphasis on Problem Solving in Texts
c
le.
Textbook Too Much A bout Right- Too Little
Mathematics for a ModernI World, 2 6
.11.5 57,3 ,,'2
Geometry 8 63.2 17.0. -Mathematics: A Modern Approach 0.9 51.8 . 47.3
Trouble - Shooting Mathematics
Skills 0.0 , 51.3 .' 48.7Es-Sentials of Mathematics III 0.0. 41.6 58.4Modern Algebrak Book 1 i 7.1 84.4 8.4Mathematical Virsuits Two 12.5 62.5 25.0Business and Consumer Mathe- i 7
matics4
78.35.07
___I 16.7Careet Mathematics, Industry
and Trade : 3.8 83.5 12.7.---,
.....
According to the teachers, the Modern Algebra text is clearly
superior to all the others insofar as the extent of its treatment of
problem solving is concerned. Mathematics fora ModernWorld was ratedas having too'little emphasis on problem solving by over forty percent
of those responding to this item. No text was rated as over-emphasizingproblem salving by more than twenty petcent of the teachers althoughGeometry was within 0.2% of this/range.
The fourth and final factor rated was the texts' stress on)1.
enrichment topics. The teathers' ratings of this factor are pre,sented
in Table 4-21. 4' 1;1
Four textbooks were judged by more than fifty petcent of tieteachers to contain too little in the way of stress on enrichment
topics. Thre'e of the four are low achiever texts, and the fourth s
the most widtly used textbook, Mathematics for a Modern World. Mo ernAlgebra was given the highest percent rating as being about iight inits emphasis on enrichment. At *the same time, Modern Algebra alsoobtained the loWest percent rating of all the books as far as havingtoo little emphasis on enrichment is concerned.
"4.
66

AAA
Table 4-21Grade 10 Teachers' Ratings
of Emphasise on Enrichment in Texts
65
Textbook Too Much About Right Too Little
. 46,Mathematics fora Modern
World., 2 .
GeometryMathematics: A Modern Approach
0.5
_ 15.2
0.0
4
65.7
28.
' 58.919.0
71.4Trouble-Shooting Mathematics
Skills ..0.0 30.8 69.2Essentials of Mathematics III 1.4 38.6 60.0Modern Algebra, Book 1 4.6 77.8 17.6Mathematical Pursuits Two 13.8 63.8 22.4Business' and Consumer Mathe-
matic 3.4 60.5 36:I--\,Career Mathematics, Industry
oto.'
and Trade 0.0 67.9 32:1
Examination of the data presented in Tables 4-17 through-4-21raises some questions about how and why textbooks are adopted. AlthoughMaiheinatics for a, Modern World, Bbok 2 fa far and awe? the most widelyused text'at the Grade 10 level, it ranked first only for readinglevel. Teachers rated it in sixth place out of nine for being abutright on computation, sixth for being about right on problem solving,and sixth for being about right in its emphasis on enrichment. ModernAlgebra, Book 1, on the other hand was rated first on two of thesethree factors and second on the remaining one.
4.3.7 Ratings of Textbooks:, Grade 12.`
Grade 12 teachers were asked to indicate which textbooks, from alist of five, they used with their mathematics classes: Their Wect-..-ions, expressed in percents, are show in Table 4-22. Since a'teachermay be using more than.one text, the total in the table exceeds onehundred percent.
Modern Algebra and Trigonometry II is by far the most commonlyused text at this level. Almost ninety percent of the teach'ers use it.Mathematics for a Modern World 111,2, which, is a later volume in thesame series as the most.popular Grade 10 text, is not'widely used,although this maybe due in part to its being one of the newest text-books listed. Intro ction to Calculus and Using Advanced Algebrawere rat ed'second and in usage, respectively.

66
/- Table 4-22Grade 12 Teachers: textbooks Used
C
4 Textbook9
Percent
Modern Algebra and Trigono-..metry II
Introduction to Calculus
1,A
87.6"
66.3Mathematics for a ModernWo 1112
Usi dvanced AlgebraPre- lculus ilathematieskOtbet
13.5
51.7'21.3
1.1. a
Grade12 teachers were extremely satisfied with their` mathematicstextbooks. Ninety-four percent of them chose the satisfactory rating,and orkly six percent decl4red themselves dissatisfied. This pattern ofresponse was significantly difgerent from that Bound at either of thetwo other setopdary level s44244,11, for that matter, at any of the elementary
school grade levels. A
o, QA more detailed description of these teachers' likes and dislikes
about these textbooks,may be obtained by exaTining their responses tofour items in which they were asked to ratehe texts on each of fourfactors. The fOur factors were reading leyg-1,_.e.mphaIs on computation,emphasis on problem solyirig, and emphasis on enrichment topics. In the
discussion of the teachers' judgments on 'these four factors, the dataare expressed as percents which have been adjusted to reflect the opinionof only those teachers who were.sufficientlyfamiliar with a given text -'book to rate iton a particular factor. On some of these factors forcertain textbooks at the Grade 12.1evel, a large proportion. of the'respondents considered themselves unqualified to egress airbpinion.For example, in the case of Mathematics for a,Modeyn World 1112,-Over
sixty percent of the Grade 12 teachers did noe'rate the text on the'factors of stress on computation and stress on problem solvil.
In Table 4-23 a.summary of the teachers' ratings of the readinglevels in tie texts is presented.
Using Advanced Algebra w given the most favorable rating as far
as reading level is concerned. Over ninetypercent rated it as, being
about right. The most po'ular text, Modern Algebra and Trigonometry II,tp and Pre-Calculus Mathematics w re both seen by over sixty percent of, .
the raters as having too high reading level and this may be part ofthe reason that Grade 12 teache s do not have their students read more
in- their mathematics texts a ection 4.3.1). Mathematics for a .
Modern World 1112 obtained t poorest rating on this factor with overforty-percent saying that its reading levecwas too low:
65

a
r
a
O
Table 4-23Grade 12 Teachers' Ratings
of the Reading Levels of-Textbooks
67
Textbook Too High About Right Too Low..
Modern Algebra and Trigono-A
.matry II 61.2 38.8 0.40
Introduction to Calculus* 20.9 70.1 '§.0
Mathematics for a ModernWorld 1112 0.0 59.0 41.0
Using Advanced Algebra 1.6 - 93.4 4.9,
Pre-Calculus Mathematics 62.8. 37.2 0.0.
The second factor rated was - qe amount of stress placed oncomputation by each of the books. A,submary of the teachers" ratings
is given in Table A-24.
Table 4-24Grade 12 TeLhers' atings
of Stress on Computation in Textbooks
Textbook Too Much Apout Right Too Little
Modern Algebra and Trigono-metry II 9.6 . 80.7 9.6
Introduction to Calculus . 4.5 71.6 23.9. 4
Mathematics for a ModernWorld,,1112 ° 11.1 70:4 18.5
,Using Advanced Algebra 1.8 .94.6 3.6
Pre-Calculus Mathematics 3.8 76.9 -_ '19r.2
_ . Using Advanced Algebra obtaineldthe highest gercent rating as
being about right in its treatment of computational skills. As a matter
of fact, all five exts obtained.quite food ratings on this factor:-
Only Introduction ,o Calculus was Seen by mort than twenty percent of
its raters as, placing too little stress on computation.
The third factor rated by the Cade 12 teachers was the extent
of the emphasis placed on problem solving in the various approved
texts. Their ratings are presentedin Table 4-25.
6.9 .,

68
,1
Table 4-25Grade 12 Teachers' Ratings
,of Emphatis oArProblei Solving In Texts.
. Textbook -- Too Much- AbdUt Right Too Little
Modern Algebra and Trigono-metry II- , 8.3 .82.1 9:$.
Introduction to Calculus. ---, 3.0 45.5F51,5
Mathematics for a Modernr\ .
World 1112 0.0 50.0 50. t!.t"---;(
Using Advanced Algebra' '0.0 76.4 , 23.6Pre-Calculus Mathematics 3.8 76.'9 - . -19.2."
Two of tike texts are viewed by one-half their raters as putting too,littleemphasis on the tdpic of problem solving, and Using Advanced Algebra was so ratedby about twenty-five percent Ofits users: None of th4exts wasseen to sUiressproblem solvIng too much. Three. books, &dem Algebra and Trigonometry II,,Using Advanced Algebra'and Pre-Calculus Mathematics, all were rated ,ps placingthe correct amount of 'emphasis on this factor.
ft
. .
. , . ;..
Finally, the Grade 12 teachers rated the five texts with respect to thelirptress on enrichment. Table 4 -26 contains'a summary of these
i /
iatings.r
-*, Table 4 -26Grade'12'Teachers' Ratings
4s/of Emphasis on Enrichmenp in Texts '!'.
4./ ' !
/
Textbook
0
Too Much Ab9t Right Too Little'.
le - . 9 . , .
Modern Algebra and Trigono--. metry II " 7:1' .' 75.0 ; '11.9introduction to Calculus _1.6, - 31.7-k, . 66:7'Mathematics for a Modern - i
World 1112 "I.,
Using Advanced Alg-ehrare-Calculus Mathematics . .
0/4
4.
0.0" 290 . 71.00.0 54.5 45.5:29.0 . ;58.1 ' .i2.9
1
4.
4, r,

4.-- es
69
All five of these textbooks are used in Mathematiis 12classes so iecannot be said that a lack of enrichment topics in agiven book is due to,the fact that it was written for low ability .
students. In this case a lack of emphasis on enrichment is justthat; it is a lack of emphasis on enriment.
Two of the texts, Introduction to Calculus and Mathematicsfor a Modern World 1112, were judged by more than sixty-five percentof their raters to contain too little enrichment material. A third
text, Using Advanced Algebra, was similarly rated by fOrty-fivepercent. Modern Algebra and Trigonometry II received the most positive-rating. Three-quarters of those responding felt it contained about, the :
correct amount of enrichment material.
4.4 'Summary
.
Almost all teachers of mathematics use one or more teXtbooksin theirteaching. The'lowest rates of usage, 90.5% and .91.4%, were.found,:to occur
at the Grades 1 and 8 levels respectively. Even considering these two, itis safe to say that the use of textbooks in mathematics classes is universal-at all grade levels.
, . .
-,
,. .
More elementary tjitan secondary teachers"prefer to have several pre=scribed textbooks fOr aliven grade. However, A clear majority of teachersat,eacll level would prefer to have several texts from which to choose :rather than just qne. Relatively few teachers of mathematics have adopted
.. , -a multi-text approach to the teaching of mathematics, if by that approach.
. is meant the more or less equal utilization of several kts. A majority.
of teachers said that they prefer to use ohe,text pred inaptly and others
..,', .1% the'need or occasion arises. An-overwhelming majority of teachersagree 'that there should be made available, an outline,of the minimum learning
4-outcomes for mathematics at each Nval,to gUide them in the selection of,
, .
,textbooks= materials, and ac-tiities. . ..
J:.-
.', .
,
,i
' Teache'rs-dovnot teatuire their students to read very extensively from,. :o - .
their,mathemet1c.textbdok4. Among elethentary,teachers, there Is a tendency,
foetbbsele the highergrades_to require more reading than in the, loverng ,secondary, teachers, there is virtually no' difference it this
.
I.
grades.'respect am ng.tba ers at the Grades 8, foc or lt leve16.
# .. . , ,
. 0 All teachers use their 'mathematics- textS 'priimarilY"As sources of,.
exercises. They appeac to,be used leskfrequentlY-4or puldses-bf revieiging- .
, .
65114Capts presented in class, and -eVenless frequently to ievelop new eon,
" .. °Cens. Teachers at all levels say they. 4o not want textbooks which place ', n 1 -o ,..,
e p grda errempbasis upOn concepts and principles- than upon skills and drill...a . ' k
'., They atticularly want textbooks to provIde material for drill and practice.
Teachers' ratings of Vripus characteristics ofeditions of mathemAics textbooks were ebsitive but'grade leVei increastdc7 In 'other words, 411 te4hers.Vaiut o6such'elitions", but they are .less important
1, ,
'high r grades.. .
. -I 71
annotator!! teacher's
tended to decrease asseem' to appreciate the
to teachers of the

70
On the whole,, teachers are quite satisfied With.the textbooks thatthey are using, although many of them seem to be using texts which areno longer on the prescribed list. The highest rating of dissatisfactionwith textbooks occurred at the Grade 8 level Where thirty-six percent ofthe teachers expressed negative opinions.
Teachers were askedto rate the prescribed texts with respect to urlectors. In general, the two areas which seemed to be a cause for conc rnwere emphasis on problem solving and on computation. At every grade level,a sizeable proportion of the texts being evaluated was, seen to be weak inthese two areas. - . 0
4.5 Summary of TtecoMmendations
Recommendation 4 -l: The Curriculum Development Branch should provideteachers of mtthematics with'an outline of the miniMUm learning out-comes at each level or grade to aid them in the selection ofmathematics textbooks, materials; and activities.
Recommendation 4-.27 The Curriculum Development Branch should conducta province-wide study to discover the reasons for die parentlywidespread lack of acceptance'by elementary teachers off the newlyrevised mathematics curriculum and the textbook series presciiibed forits implementation.
Recommendation'4-.r Teachers of intermediate mathematics shouldplace more emphasis upon teaching students how trread mathematic'stexts with under&tanding.
Recommendation J1,-4: The/.Curriculum Development Branch, schooldistrict curriculum specialists, and publishers of mathematicstextbooks should take/steps to ensure that mathematics tectbooks'for the elementary' grades are designed,to be read by the students,inasmuch as it is po,aible to do so.
Recommendation 4-S:, Educational researchers and supervisors ofinstruction should/investigate the ways in which. mathematics text-books are used in the,elementary schools in an attempt to clarify'the interaction etween teacher-based discussion and text -book-based discuss n. .
Recommendation,46: Teachers of secondary mathematics should placemore emphasis upon teaching students how toread mathematics textswith understanding. , ,
Recommendation 4 -7: The Curriculum Development Branch, schooldistrict curriculum specialists, and publishers of mathematicstextbooks should take steps to ensure that mathematics textbooksfor the secondary grades are designed to be read by the stuOntsinasmuch as it is possible to do so.
*
6
a
71
Recommendation 4-8: Educational researchers and supervisors ofinstruction should investigate the ways in which mathematicstextbooks are used for the teaching of secondary mathematics in anattempt to clarify the relationship between teacher-based discussionand textbook-based discussion.
Recommendation 4-9: Persons responsible for the approval and adoptionOf mathematics textbooks at the Grade 8 level should take under advise-
{ ° Ithent the concerns expressed by Grade 8 teachers concerning the treat -meht skills and problem 'solving in the textbooks.
L.
fr
O
43
p
O
44
Vit
/"Th,
40.
/1

r
a8.%
(
CHAPTER 5
CLASSROM INSTRUCTION)
4
f.
74
i
4
a
r
.!
i

1
75
* Items concerning materials and methods used in class, relative timespent on different mathematics content areas, resources used to develop ,
day-to-day lessons, relative importance of different, evaluation tech-niquet are all contained. in the classroom instruction section, Part-IV,of the Teacher Questionnaire. The discussion in this chapter is
,organized by item, Items 23-25 on the elemeary form Items 27-42 onthe secondary form.
5.1 Time "Spent on Various Strands
5.1.1 Elementary Teachers
1eRespon nts were' asked to rank five content areas of mamatics according to how much time they' spent on each in theirmathematics class during the school ear. scale ranged from."Least Time Spent" (1) to "Most TimOpen . The averageranking for each of the, our grade level i presented in Table 5-1 .
or each of the five content areas.
;Table 5-1Elemfntary Teachers: Time Spent in Clasq,
on YiveSeletted Mathematics Content:Areas
,Grade 1 Grade 3 Grade 5 Grade 7
Drill on basic number facts* 4.16 4.14 3.65 .3.04
Computation* 4.38 4.58 4:64 4.52
Problem solving and applications* 3.23 3.53 3.55 3.80
Geometry* 1.89 -. 1.73 1.73 2.19
Metric measurement* 2.26 2.39 2.43 .2.49
* indicates a significant difference at the 0.05 level among respondenr-groups..
-
,,
As might be expected, the two most time-consuming items foreach of the four grade levels are,drill on basic number facts andcomPaation. The time spent, however, is reflected} in the Mathe-matics Assessment test results with the grade 4 and 8 studentspe orming well on whole number computation. The low ranking ofgeo etry, however, is also reflected in the results on the Mathe-ma cs Assessment to t. " 4 "
_ , . ...____.. 1 .
5.1.2 Secondary aefiers ;I'
.
. '.
.
,. .
'd Secondary tea.chers were also asked to rank five"matematicscontent areas in'the same mAnner,as their elementary school counter-parts. The scale ranged from 1 (Least timekpent) to 5 (Most time
75,/ 4,

76
sp t . The average ranking for each of the thrse grade levels on...eac the five content areas is presented in table 5-2.
Table 5-2Secondary Teachers: Time Spent in'Class
on Five Selected Mathematics Content Areas
Grade 8 Grade 10 Grade 12
Drill on arithmetic compUtation* 3.65 ' 2.47 1.84
Problem solving and applications* 3.59 3.93 4.071Geometry* 2.40 2.70 j2.53''
Metric measurement* 242.,,2.14 1.76
Algebraic concepts* 3.66' 4.24, 4.84
4*9
* indicates a significant difference at the 0.05 level among.the14
respondent groups.
Ass,grade level increases the amount of time spent in classon drill on arithmetic computation andbetrigmeasurpent decreases.Secondary teachers spend less time on arithmetic computation inclass than elementary teachers do, as would be expected. Secondaryteachers responded, that they spent the least amount of time onmetric measurement of those content areas listed. .
'8 As grade level increases, the amount of time spent in classon problem solving and applicationsand algebraic concepts in:-creases. Algebraic concepts yielded the highest average of the fivecontent lareas in each of the three grade Ietvels. The averages for'proble% solving and applications and 'algebraic concepts were bothover the 4.0 level for giade 12. The next highest average in thegrade 12 group was) a 2.53 for geRmetry-. The averages forAoroblemsolving and applications and algebraic concepts; while not as highas for grade /2, were far higher than any'other content area forgrade 10 as well.
A comparison of the results for eometry in Tables 5-1 andr '
5-2 indicates that secondary teachers d A significantly greater+ amount of time in class ,6n geometry than elementary teachers do.
k5.2 Use of Metrid,Units
6
5.2.1 Elementary Teachersa
Elementary teachers were asked to select the statement thatwould best describe their use of wilts of measurement -in their non-mat ematics classes. The data relevant -to this question are sum- .
. mat zed in Table 5-3.
r
a
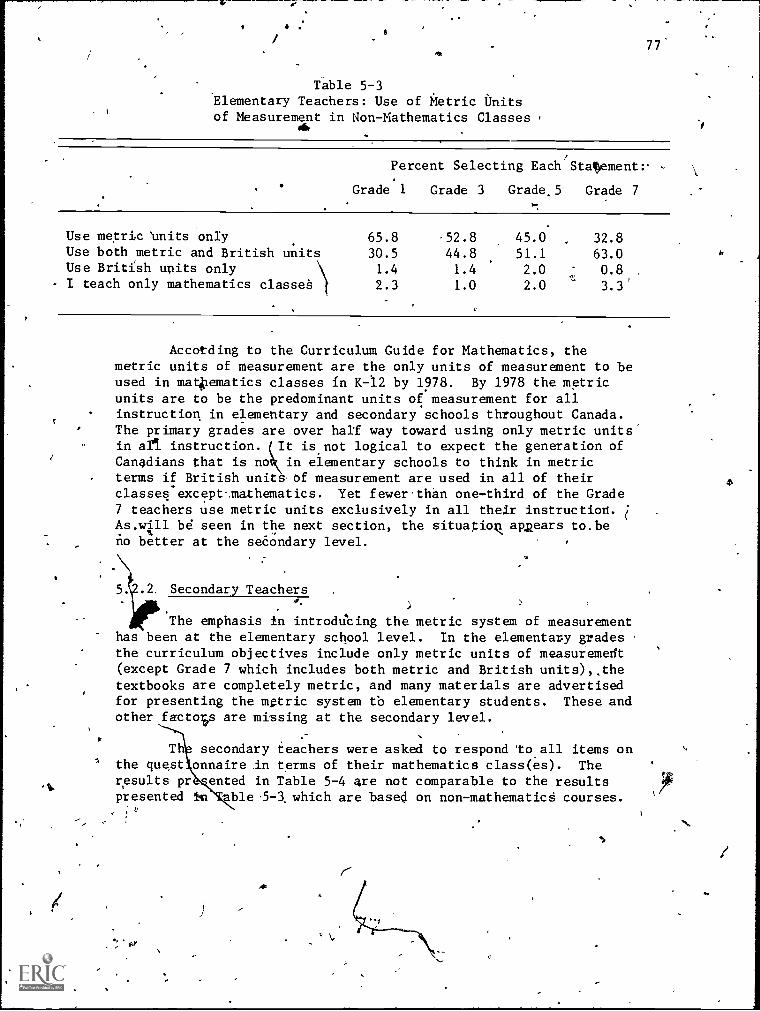
77Or
Table 5-3Elementary Teachers: Use of Metric Unitsof Measurement in Non-Mathematics Classes
Percent Selecting Each Staftwment:.
Grade 1 Grade 3 Grade,5 Grade 7
Use metric 'units only 65.8 -52.8 45.0 , 32.8Use both metric and British units 30.5 44.8 51.1 63.0Use British units only 1.4 1.4 2.0 0.8I teach only mathematics classes 2.3 1.0 2.0 3.3'
Accotding to the Curriculum Guide for Mathematics, themetric units of measurement are the only units of measurement to beused in mathematics classes in K -12 by 1978. By 1978 the metricunits are to be the predominant units of measurement for allinstruction in elementary and secondary schools throughout Canada.The primary grades are over half way toward using only metric unitsin all instruction. It is not logical to expect the generation ofCanadians that is no in elementary schools to think in metricterms if British units-6f measurement are used in all of theirclasses. except-mathematics. Yet fewerthan one-third of the Grade7 teachers use metric units exclusively in all their instruction.As.wll be seen in the next section, the situation appears to.be
Ano better at the secondary level.
Secondary Teachers
The emphasis in introdticing the metric system of measurementhas been at the elementary school level. In the elementary gradesthe curriculum objectives include only metric units of measurement(except Grade 7 which includes both metric and British units),,thetextbooks are completely metric, and many materials are advertisedfor presenting the metric system tb elementary students. These andother factois are missing at the secondary level.
Th secondary teachers were asked to respond 'to all items onthe quest onnaire in terms of their mathematics class(es). Theresults pr ented in Table 5-4 are not comparable to the resultspresented able5-3, which are based on non-mathematicS courses.
'w
a,

78
I
Table 5-4
°Secondary Teachers: Use of Units of Measurement in Mathematics Classes
Percent Selecting Each Statement:
Grade 8 Grade 10 Grade 12
Use metric units only 48.0 )6.9 13.6
Use oth metric and British units 50.9 62.0 85.2
Use ritAsh units only 1.1 1.1 1.1
There Ts no mention of units' of measurement, British or,
Metric, in the Curriculum Guide for, Mathematics in Grade 10 or 12.'
In Grade 8 the Curriculum Guide requires that both, metric and
British units be presented. tt is not surprising that at none of
the three secondary grades surveyed were a majority, or even a
plurality, of teachers using metric units exclusively.. It is
surprising that only about fourteen percent of the Grade 12 teachers
use only metric units in their mathematics classes. If the goal
stated earlier is to be attained, in less than one year, almost 100%
of the secondary mathematics teachers should be using metric-units
exclusively in their instruction.1;?
5.3 Use of Aids in PlanniAg.
5.3.1 Elementary Teachers7
Elementary teachers were asked to'rank each item in a liatdf-,
resources according to its usefulness in their ilanning day -to-day
lessons or units in mathematics. The rankings were on a scale'froW
1.(not useful) to 5 (very useful). The results.are'presented in
Table 5-5.
df the eleven rows that show statistically significant
ts, eight are due to the primary teachers having ranked the
item higher khan the intermediate teachers, and one bY the primary
teachers ranking the item lower. *Using the students' mathematics
tIktbook,,while ranked high by all four groups, was ranked lower by
t'he pr' ary teachers. The lower ranking, is probably due to the fact
that, ''red to intermediate level textbooks', very little thforma-
tion conc ning the lesson is printed on the pages of primary
students' mathematics textbooks.
All four group's ranked the following items higher than 3.5:
use of students' textbooks, and use of the accompanying teachers'
g debook. All four groups ranked the following items less than 2.0:
hoof district mathematics specialists,and district supervisors.i 11 0,3%.
.

79
In addition, primary teachers 'ranked ideas from in-service activ-
ities apd ideas fro colleagues higher than 3.5.
k
Table 5-5Elementary Teachers:
Usefulness of Resources for Planning Lessons
ReSource Grade 1
Average Ranking:
Grade 3 Grade 5 Grade. 7
Last ear's preparation*B.C. Mathematics Curriculum Guide*B.C.T.F. Lesson Aids*Idea books*Ideas from in-service actities*Ideas from colleagues* 4
Ideas from university coursesMaterials from your district.Resource Centre
Professional journals*School district mathematicsspecialists
,,
District supervisors*Students' mathematics textbook*Teachers' guidebooks accompanying the
different mathematics textbooks*Locally developed,turriculilm guidesMaterials obtained through comer-
cial establishments*
3.402.98
2.27
3.613.80
3.642.50
.
..65.
1.97
1.953.55
4.002.75
3.13
3.233.07
2.36
3.343.50
3.542.45
2.67
2.35
'1.911.87
3.88
3.9412.80'
344
3.20_2-72__.
2.18 .
3.103.09
3.24
2.42
2.552.15
'1.90(
1.664:Q3
4.002.58
2.98
3.432.772.163.023.123.252.52w
2.492.18
1.81
1.63
4.09
3.642.65
2.83
'
* indicates a significant difference at the 0.05 level among the respondent groups.
Recommendation 5-1: School districts should explore ways and means of
making specialists' services more readily avoklable and of. more benefit
to elementary teachers.
5.3.2 Slcondary Teachers
Secondary teacher were ilso'asked to rank a number teach-
illgresources according to their usefulness. e'The scale used ranged
from 1 (not useful) to 5 (very useful). Several resources on the
6 entary list were changed to make the rpvised list more approp--
late the secondary level, bUt the reshonse mode was the same.,
s for this item are found in Table 5-6.The re

80
, Tab e 5-6Secondary Teachers:
a 0
Usefulness of Resou ces for Plant Lesscps
,SAverage Ranking:
ResourceGrade.8 Grade 10 Grade 12
Last year's preparation* ,. 3.34 3.57 3.98
B.C. Mathematics Curriculum Guide* 2.84 ' 3:06 3:08B.C.T.F. Lesson Aids*. . 1.81 1.76. 1.50The provincially adopted textbooks for students* 3.77 3.91 ) 4.28The teachers' guidebook accompanying the fto-vincially adopted textbooks . 2.53 2.55 2.76
Mathematics books which are not provinciallyadopted 3.16 1.34
.,
3.33.Mathematics books which are not textbooks 2:78 2.81 2.89Ideas from in-service programmes 2.62 2.62 .2%64
Ideas from university courses*., 2.24 2.43 2.68Materials from your district Resource Centre 1.90 1.83 1.69
Professional journals* 2.16 2.48 2.63School district mathematics specialists* 1.79 1.66 0 1.49District supervisor* 1.39 1.32 1.18Locally developed curriculum guideA* 2.65 2.60 2.13Materials obtained through commercial
\, 2.80 2.70 2.69establishments , -....j.
* indicates a significafit-dierence at the 0.05 level among respondent groups,'
Unlike the elementary teachers, there is no one group of,§econdary teachers that ranks items consistently higher or lowerthan the others, thereby causing most of the nine statisticallysignificant differences. The Grade 8 teachers ranked 'one of thenine items higher and two items lower than the other two groups.The Grade 12 teachers ranked one ifg7higher and two item's lowerthan the other two groups. ,
Four items weie given an average ranking of less than 3.0and all three groups ranked them as such: Th4 four items wereB.C.T.F. Lesson Aids, materials from district Resource Centres,school district mathematics specialists, and district supervisors.The last two items are the two that were also ranked low by theelementary teachers.
One item was given a high ranking by all three groups: the
provincially adopted textbooks for the students.. In additioni.k Grade
10 and Grade 12 teachers ranked last year's preparation higher than3.5.
I

tt:
.Recommendation 5-2: School districts should explore ways and meansof making specialists' services more readily available and,ofmorebenefit to secondary teachers.
5.4 Factors Influencing Mathematics Instruction
5.4.1 Elementary Teachers
81
The elementary' teachers were presented a lisp of sixteenfactors purported to affect mathematics instruction, nd asked toTate the factors on a fiye-point scale (1 = low pri = highpriority) according to the priority they would give each; based onthe effect it has on the success oyheir mathematics programme.The average rating for each factor .is presented in Table 5 -7.
Table 5-7Elementary Teachers:
Factors Influencing Mathematics Instruction
r
Factors grade 1
Average Ranking:
Grade 3 Grade S grade 7
Reduction of class*)
size#)
..,
Greater release time for lesson preparationMore clerical assistanceBetter library services - ) .
Reduction of total pupil load*Improveient-of physical facilities*Textbdoks more suited to instructional.neeSt*' .
Increasing time allotment for mathematics*Moie effective teacher education pre-
. ,,et-rvice programmeiMore effective ih-service and professionaldevelopment . .
More..
release time for in-service and, professional ,.development*Curriculum guideSchat offer more assis-taw in the instructional process
4.24
3.57
2.532.12:
3.82
2.80
3.372.46
3.49
3.63.
3.56
1.57
3.56,
3.21''
4.29
3.08
'4.283.71
, 2.632.08
3.90
,182
3.832.70
_3.57
3.70
3.68
A
3.67
3.71
3.37
4143.39
tt.
4.44
3. 02f612.05
3.682.54
3.762.86
3.44
3.57
0
3,65
3.32...
3.79
3.44
-
4.17
3.492.51 ``
2.10
3.622.49
3.822.81
3.32
'3.51
3.32
3.56,
1.613.22
3.663.59
°
, Cut,ulum guides that outline contentin specific termsMore Learning Assistance ServicesMore mathematics manipulative materialsfor individual.classrooms*
Ability grouping of students for classes*
* indicates a siiniffcant difference at the 0.05 level among respondent groups,
$.1
I.
L

0
' 82
Q
er
Of the seven statistically' significant dI,,fferdifices,.four vaere
were caused by the primary teachers ranking the factors higher thanthe intermediate teachers. One was caused by the primary teachers,
.
i:v.in particular the grade one teachers, ranking the factor lower; andCy `the other two were caused by the grade ode teachers ranking the
factor much lower tha the,other three groups,.
All four groups gave eight factors,a rating neaeer \han, 1.5
and no-group gave an average ranking of less than 2.0 tofactor. The eight factors ranked highest by all four groups in .
order of. priority were/reduction,of,class size, more mathematicsmanipulative materials for individual classrooms, reduction of
0. total pupil load, textbooks more suited to instructional needs, /Ale ,curriculum guides that outline content in specific terms, more
effective in-service and professional developtent, more releasetime for lessbn preparation, and curriculum guides that offer ,moreassistance in the instructional process. .
.
. -3(.
In addition, the primary teachers ranked, more effectiveteacher education pre=service programmes and more release time forin-serviCe and professional develoftent higher than 3.5.
The factor with the lowest average ranking was better libraryservices with an average rating of 2.09. As shown in Table 5=7,
. there was no statistically significant difference on this/factor, .
meaning that all four groups were in agreement. This 19w ratingcould indicate either that library service is already good or thatelementary teachers do not. use the library for their mathematicsclasses.
These elementary tea Qrs have a number of recommendationto make to vaefous groups of people concerning factors which influ-ence mathematics instruction. Textbook authors need to try to maketextboolss more suited to instructional needs. Curriculum develop-ers need to produce guides that outline the content in more -
specific terms.4Id that offer more assistance in the instructionalprocess. SchoOl boards need to explore ways of rediming class sizeand total pupil.load and of providing more mathematics manipulative,materials for individual classrooms and more release time°forlesson preparation. Teacher education institutions need to provide'more effective teacher educetion programmes,, esucially for,primaryeducation Students4 The universities, teachesteand school boardpersonnel need to combine their efforts.toprovid more effectivein-service and prgfessi al d--lopmeni.
82 4..

83.
7. 5.4,2 Secondary Teacher\. 0
Secondary teachers weie asked 'to rate the,same. teenfactors as Ihe elementary teachers-using the same type of scale..The results for the. item on the secondary form ce the luestbonnaire.are "presented in' Table 5-8.
Table 5%-8
Secondary Teachers:I ,
FactorS Influencing Mathematics Instruction .
A .
Average Ranking:
Grade 8 Grade 10 Grade-12
Reduction df class size*
Greater release time for lessik preparationMore clerical assistance 1 -
Better library services. Reduction of total pupil'lOad
Improvement of physical-facilitiet*Textbooks more suited to instructional needs*IncreasingtiMe allotment' far mathedatics*--More effective teacher education pre-serviceprogrannest,
More effec4ve in-service and,professidnal
4.26
3.242.65
'12.37.53
2t.t5,4 06
.2.86
4.62
3.40
2.76
3.783.16
2.592.41 . 2.18,
3.54 3.473.10 x.664:10 3,75'
3.07 3.73
3.34', . 3.18 2.83
. . ,
development* - '3,46 . 3.42- 3.13More release time for in-service and pro ssional '.-,
development Q.
3.25 3:28 a.01Curriculum guides that offer more'assist nce inthe ingtructional rocess* /' t3.,4d* =3.36 2.85 -.
Cur-riulum gullies that tline content in more : . -i
spe ific erns*\ . 3.51 3.50 .3.97
Mor Learning Apsistance services* ') , .3.28 2.96 2.45More mathpLatics manipulative materials for # -OVILVidUal/ClaS9rPOMSt .'" 3.46 3.27. ,2.77
o '
Ability grouping ofstudents for classes*'' -3.96 '3.. 3.62
)
:
* indicates a significant differenceat the 0.05.level among respoDdent.groups.
There were eleven items yielding statistically signif-iCabt,differences,'Iof which five items yieldeVseatistically,significant
.differences orl'.bath th'e elementary aid secondary forms of the'i
. .
- 7agestionnaire.' Those five 'it.ems concerned increasing timet.,allot-,
:-psa Gr,mathematics, more mathematics clanipulative materials for,-.
41idividual classrooms, improvement Of physical facilities, textlooks, - -
more suited to instructional Deeds; and ability grouping of student's.6
`"for, classes. -k.-- ' ,
. . .
\ . ' ...t Of theelen statistically Significant differehces, eight.
,were,caused by the gradea-2 teachers ranking thet item significanlly, ,--
'..,
, -4.
, -
0rt
O
k
t
. .
8 3 r
A

fts,
- 84
., ....
., .
, lower than.teachersof, tie other:ti..lo grades did'.
i 'All'three.
grcuvs gave three.
items a rating in excess of .5.
- Thd three items were vduction of- Class sfae, textbooks more suited
to instructional needs,, and 'ability grouping of students for
... classes. The first tub also recpived'high rankings rom the prim-
<aly and intermediate teac'hers. It is common practiCe 4n theelem=1-
,..rtary Classwom to opganize t4 mathematics class int smaller groups
based on some measurement Of ak.ilityl, As a result,-elementary
teachers did 313.t rAlk ability grouping of students for class s as a
, high pr4ority, though tthe trade seven teachers did give' it 4 rating',
! of 3.59. Onithe.other,4hand; total class instruction is'very common
in the secondary mathemtticsclasroom4i93% of the seeenAary .,
'teachers responding marked that they'used total class instrUctio,frequently,'see Section45.5.25 .and the secondary, teachers ranked
:ability grouping of students for classes as the third highest item
'on' the priority list ..of sixteen items. ' 4 ,J .! . The grade 8 and 10, teachers also ranked redUction of total
pupil load and curriculum guides that outline'content in more '
. specificoterms,as being of high priority. The grade 1.2 teachers
ranked increasing time, alldtme4 for mathem4tics a4,being.of high
priority..., 0
.,...
rAs with the elementary teachers2,no ieei Had an average
arati g, lower than 2.0, Tha item with _the lowest overall average ,
.\.(2.1 ) ,was,, again be library services.. . ,
- '. <
5.5-Use of .Teaching Aids
4 . ' -N
5.5.1S.--
,Efementary Teachers ;.
. .The list of, aids- Used in teaching mathematics was orednized
Into-three categories:' media materials, and methods, Thd
. .
elementary teachers were askea to respond to 'each -item on the list
'; accor4ing to' whether they.used tcie item frequently, infrequently',.
ornot at all. The data presented. in Tables .5-9 to 5=14 are=aver-- ,
----.'ages,Computed hy,assigning the following: scores: . r.,
,.
......_
I.
. --Response 0Score
' Not at all 1
Infrviently 2
Frequently 3
,Figure 5 -1: Response:Scorres'
g44'
"`

S.
10
(. Six.differenti.media wer;e'li-tedai ilossible aids for mathe-.
' ma ical instrucriori. The data regarOmg use ofthese,aids are. :
listed in'Table 5-9."
Of t e six, tems aisted over, half..the primary teachersnot 6sed-fiv The'chalkboard,,as-expected, is by far:thie most.
.common medium use .in the maFhenittict classroom at all levels. Theoverhead" pro)ectcw_l.s being used to some extent probably.as analtergailYes,to'the chalkboard. One primary teacher in ten, one,Grade "teacher infive: and one Grade 7 teacher in fopr respOndedthat they ude the overhead projector frequently. Films andstrip are not b'ing used frequently by. the elementary teachers.Only five of the almost 2000 eleffientary teachers responding make.frequent dse_,of television in their teaching of mathematics.
° Table 5-9ElenleAtary Teachers: Use 'of Media
d
e
TelevisionsFiims*-
. Filmstrips (or 'loops)
---OVerhead projector*Opaque projectorChalkboard
4Grade 1
l.I01.36
1.50,
4.54
.21
2.95
A
Grade 5;
.-Grade 5 Grade 7
14/0 1.161:41 1.46 1.471.51 1.50 1.521:55 1.86 `2.021.21 1.27 1.26
2.98 2.94. 2.96ti
,* indicates a significant difference at
.0'
Materials2)
Thirteen items were list
`bids elementary mathematics4s concerning materials are
e
the 0:!05.level ambng the respondent group.
* .ed as mateals.thateight serveinStruction. The resuTts.forsummarized in Table 5-1.0.
`t
I
s
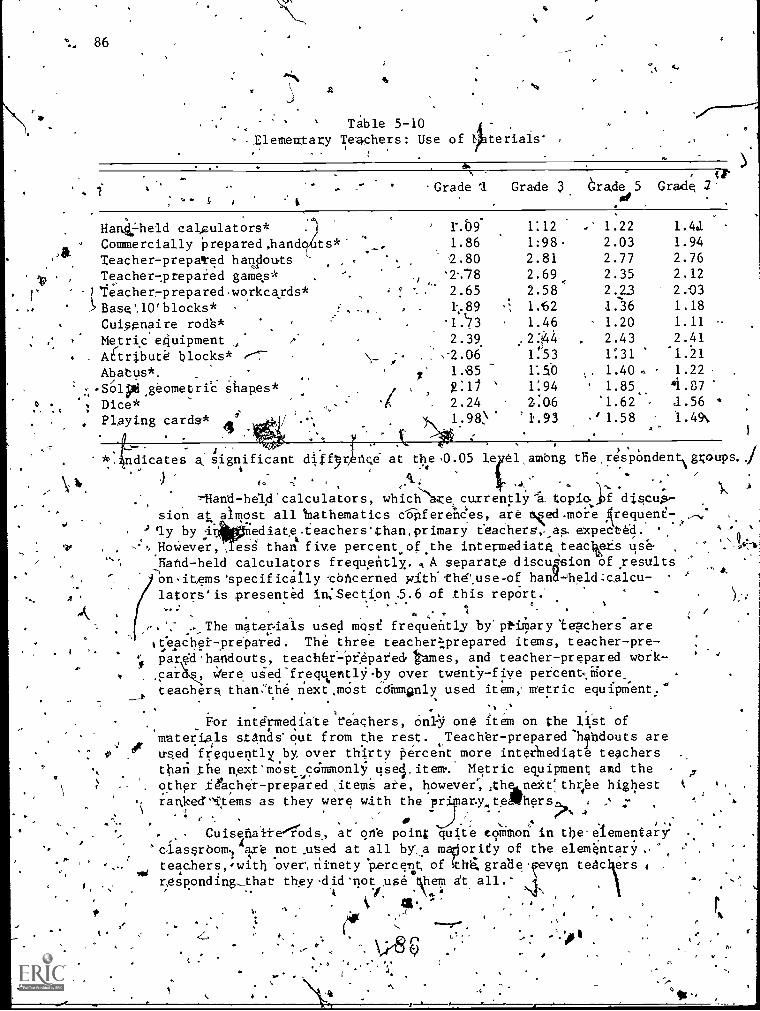
86
' Table 5-10- ,Elemegtaty Teachers: Use of 1 teriais
Am%
t.
Grade '1 Grade 3 Grade 5 Grade, Z '11-
HantLheld cal,aulators* r.b9 1:12 ,.° 1.22 1.41Commercially 'prepared ,hando, ts* 1.86 1:98 2.03 1.94Teacher - prepared handouts ' 2.80 2.81 2.77 2.76Teacher-prepated games* 2.78 2.69, 2.35 2.12teacher7preparedworkcayds* 2.65 2.58 2.23 2.03Base 'JO, blocks* 1.89 : 1.62 1.36 1.18Cuisenaire rod's* 1.'7,3 . 1.46 1.20 1.11Metric e4uipment 2.39. ;2:144 . 2.43 2.414k.t.ribute blocks* .-1- -2.06 1:-'53 1:31 1.21Abatus*. 1.85 1:50 1.40 . - 1.22
s6ipa Shapes* :1./ ' 1:94 , 1.85_ '1.87,geometrfdDice* 2.24 Z:06 '1.62 - d.56
0
Playing cards* Abe 1:98.,\ 1.93 ' 1.58 1.49\4,,
..- . r .
tes s significant diff,r,ence at the 0.315 le el among the ,resPOndent\ goups... :
E. -`.. ' . 4.41* ..i, .o.
/)N. .. .' ..,,Hand-held. calculators, which e currently a. topic). jpf discu,A,-,
..#sion at almost all mathematics conferences, are Ned more frequent--.
' 'ly by :i. ediatecteachers'than,primary teachers, as. expect61.o , - , HoWeven esS than f iv.e percent, of the intermediate teacleis use- ,, Nand-held calculators frequently.. tt A separate discuision of results
. -,4 ' on it,cms 'specif ically 'concerned with' the.use -of hana-theld .:calcu-A ' lators' is presented in; Section 5.6 of this report.'
.dik,... : , - . 4- , 4 . , ,
, : .. The mater.iSls used ITIQSe frequently by ptiriary 'teachers areteachei--prePared . The' three teacherizprepared items, teacher-pre-.
pare'd 'haridouts, teach6r-prepared, frames, and teacher-prepared work-i P
car s, here uied'frequ,ently over twenty-five peicent Jiore,teachers tharCthe next ,most cdinmiinly used item; metric equfpment;*_
. . . ,
itemFor intermediate, t`eachers, only' one item on the list of
, .materials stands' out from the rest. ,,Teacher-prepared .111.hdouts are
44 used frequentlx by, over thirty Percent more intermediate teachers. .
than the n,ext'mostcOmmonly used, item.. Metric equipment and the i1
; other leacher- prepared ,items are, however, sthiLneXt: thr4be highestt /
raRked"1,tems as they were with the pr ar.yteMhers.. , ,, .:- 4.
1 ,, , ?0,. .4t ,. . '. 010 / .,
.. Cuisefialte'r-ods ' at one point quite common in the' elementaryclassrbom, axe not used at all by-, .a maciorify of the elemkntary .teachers, with over, ninety p,ercenot, of hi; grebe yen teachers ,
lei 4
ar,esponding_thar they did %not use Vern at all
1 1,t A k 4111..
ti
. .
p
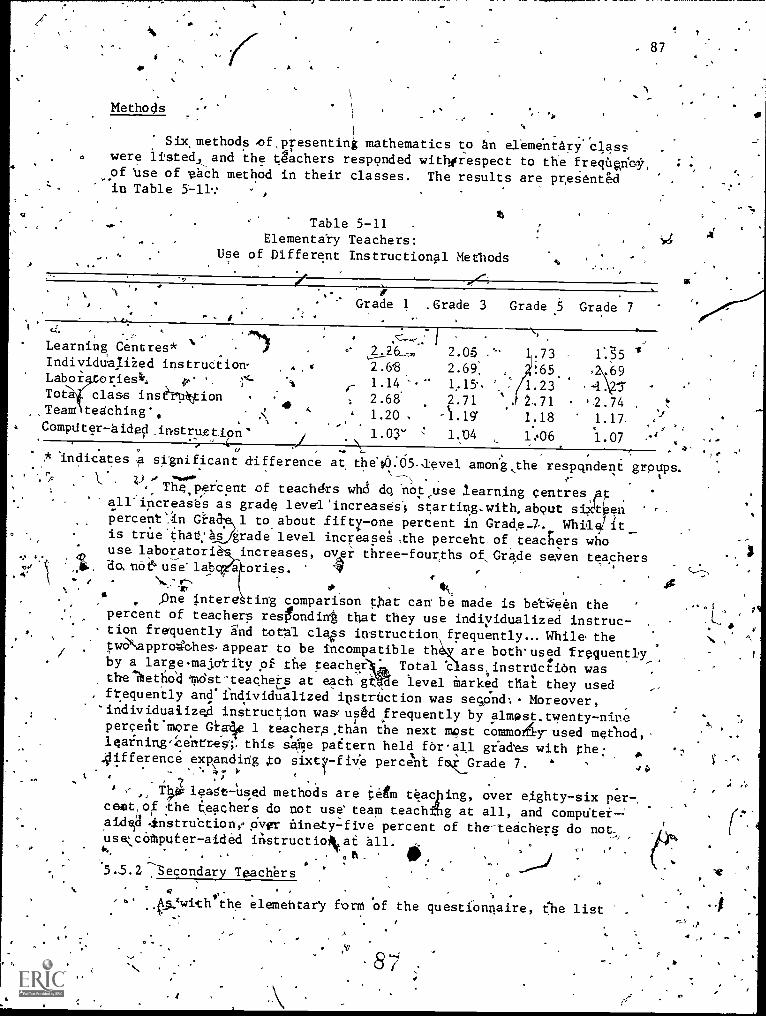
4'
Methods
87
Six. methods ,of,presentini mathematics to hn elementary.
class .
were Oand the achers responded withorespect to the frequent',of 'use of each method in their classes. The results are preiented
,
in Table 5-11%,
tTable 5-11 .
Elementary Teachers:Use of Different Instructional Methods
t.
Learning
; a. . .... , sLearning Centres* ' . ;
Individusliied instruction"Labor riesk s ,Tota class inst Lion
FGrade 1 .Grade 3
.. Team tedching',,':
S N
CompUter-Aided_instruetion'I
a* 'indicates a significant difference at. the'01:65-level amorig,the respqndeni groups.. f - \.,
percent,
.,,
, Thet of teachdrs wh3 dq not ,use learning centres .
all" increases as grade level' increases; starting.with,about s
'ct
e 2.26. 1 2.052.6'8 2.69,
1.14.'
2.68 2.711.20
1.03" 1.04
Grade 5 Grade 7
1.73 15t65 .69
1.23 I'
2 -.71 .2.74 , t
1.18 1.17 21
1:06 1.07 ."1
percent',1n Grsc 1 to about fifty-one percent in Grade_T. Whirlis trUe't:hat:as
use laboratoriedo, mi&use'lab
* j)ne inters
t
en
itgrade level increases the perceht.of,teachers whoincreases, over three-fourths of,,Grade semen teachersories.
4,
ting comparison tJat can be made is between the '
percent of teachers res$ondint that they use indiyidualized instruc-.
tion frequently and tottl clefs instruction frequently... While thetwappro4Chesappear to be incompatible th are both' used frequentlyby a largemajprily of the teacher Total .c ass,instractinn wasthe'Netho'ddst'teachers at each gi. e level marked that they used
, frequently and'isndividualized instruction was se.qOnd: Moreover,' individualized instruction was used frequently by almost_twenty-ninepercent-more Giaie 1 teachers,than the next mast commor1iy-used meehod,-leaining,:centres;. this sake pattern held for'all giSdes with the:
x;difference expanding to sixty-five percent flaGrade 7. ' ...
. 1. .,
1- ,- iloo; lesgt2used methods are deem teacling, over eighty-six per-
..
tett /o f t he
fteachersdo trot use team teachAg at all, and compUter
aid, .instruction,-, ovvr ninety-five-:
percent of the do not:,usecotputer-aided iii-structio4Lat all. , ,
k . .. W.. h , 0
5.5.2 7-econdary Teachers,
'44 ..Wwith the elements* form of the questionnaire, tie list
,3
,
.4
4
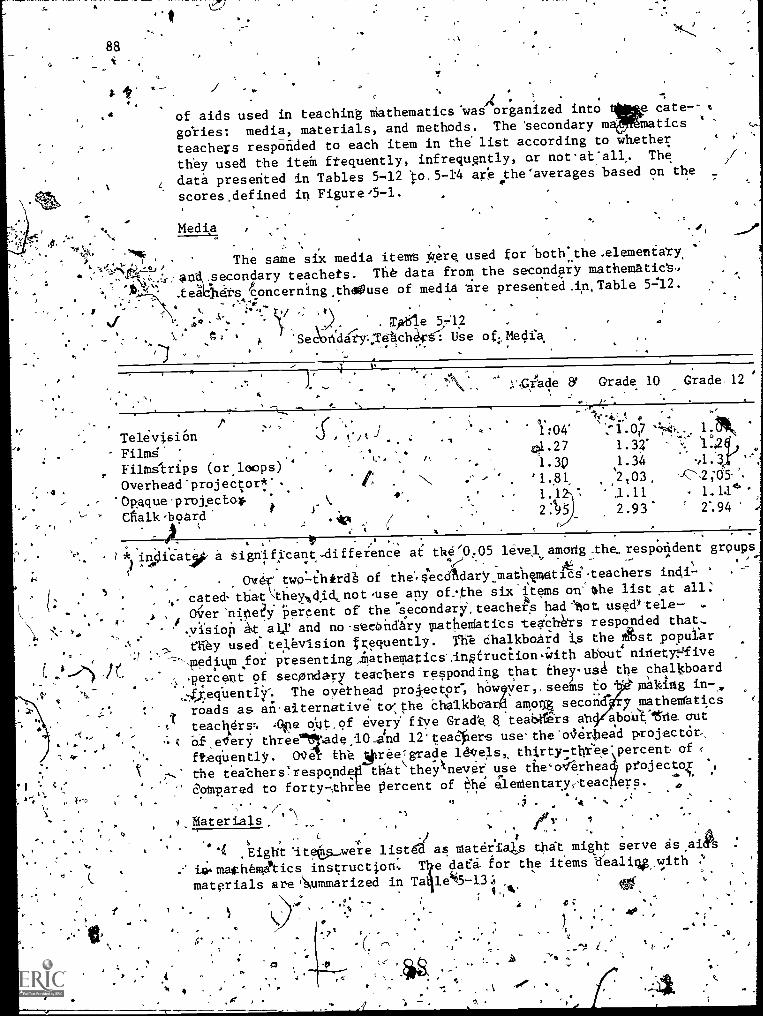
of aids used in teaching Mathematics 'was,4organized into cate--
gories: media, materials, and methods. The 'secondary m matics
teachels responded to each item in ehe list according to whether
they used the item ftequently, infrequgntly, or notat'all,. The
data presented in Tables 5-12 'to. 5 -14 are.the'averages based on the
scores ,defined in Figure/5-1.
Media
The same six media items Caere used for boththe-elementary,
.secondary teachets. The data from the secondary mathematict,
e:ts Lncerning.thause of media are -presented.in,Table 5=12.... ,...,-;
ha.t,' , 'SeOn'Clacy-Ttic- ,
: Use of;,Medra.
;'.Glade & Grade 10 Grade 12
-'
- /- -
1:04' .,- 1.0;7 '''.7:4.t... 1.
0.27 1.32' 1:2
1.3Q 1.34 ,1.'3
'1.81, ,s 2,03, ,2;165-
1.1 .1.11 1.1.142:95 2.93' 2'.94
s
TelevisionFilmsFilmstrips (or loops)
Overhead'projector*.OpAque.projecto#.Cfialk,board'
..,
tignificant-diffeience at the'O.OS level among _the_respOfident groupse .. . .. -
- ' Ove two-thirtth of tbe.AcAdary,.mae4matt-g-teachers indi- '
- .
s
v cated,that they%did,not,use any of: the six items on'tthe list at all:
.
0<er'ninai percent of the.secondari,teachePt had 'tot, used7tele-, ..
, ,
''..-.vision At a1,1' and no-secOndiry patheMatits teachets responded that-
, A' they used-used-television frequently. Th Chalkboard is s the ast popular
ft "gTledpofor presenting,iathematics,insfruciion.withabout ninety, -`five
) Tercent of secondary teachers responding that theyusA, the chalkboard
.4eqUently-. The oyethead proj-ector-, hOw9yer,,sedns to making in-,
roads as all'aiternativetcestheChaikboar4 amonB second' 7 mathematics
-0 teachers. 0ine o'ut,of every five Grade 8. teab&rs at aboa'tne out. of
). ..
..; elery threetlade.-10.4d 12'teaCliert use-the'olierbead projector-,
.
ftequently. 00A the .greet\ grade 144.7els,, thirty7thiee'percent ofk .
...' the teachers !respqn4 hoot they never use thecoVerhead) ptojecto ',
4,. '..' , $' compared to forty-thre percent of Oe aetentary,,teac,ers. '1
1.... '
- °
4
O
.
/ ' -
1,,rdaterials --
40!
c.
.
. ,.
,
,Eight '1,tea were listilas mater.r
t a4s that might serve saik.
1.
.-' iv;,..ma*.hemaitics instruction. T e deed for the items dealiwwith
ummarized in Ta le45-13materials are'.
i:e. . .0:
(s..
.k -
, '.- .
..) :
'. 71 1 . . . .,, ., . I
r (4 rnr
.. ,.
0 .er ,,.- 11) -'te .
.
S
0, r
.9,
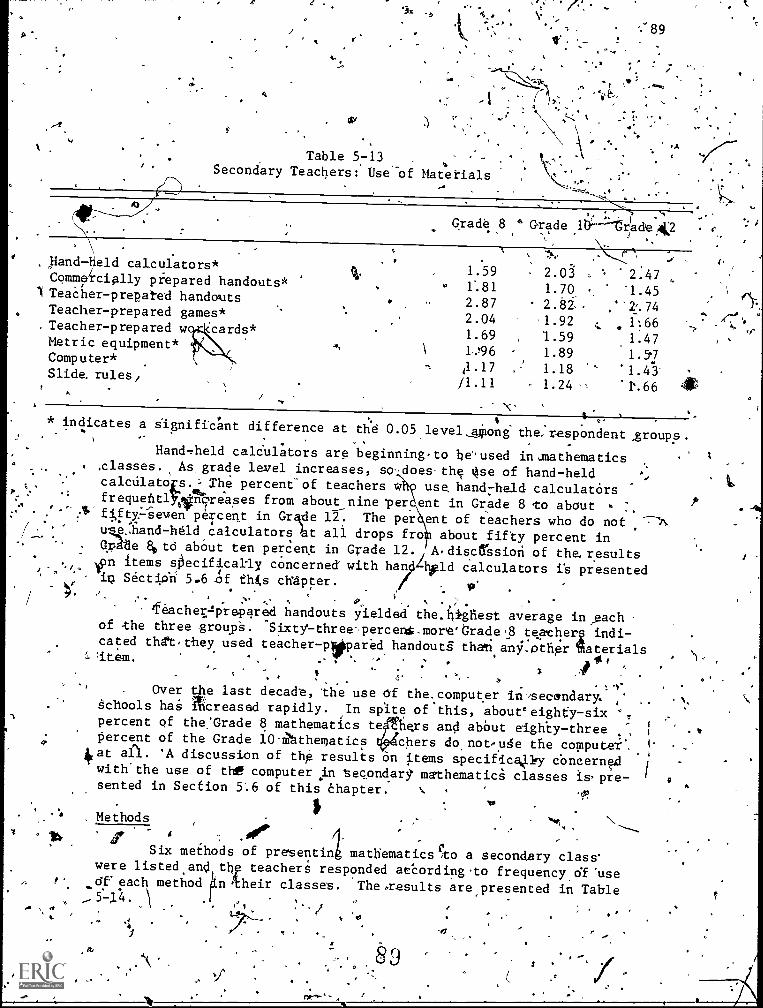
/lx
' 89
t.
4
co,;
.,
, .
1Table 5 -13,
..
, , -Secondary Teachers: Use of Materials
.
.
..C
'A
Grade 8 ' Grade 16-1-trade ,4(2 c
Hand -held calculators*
Comme4cially piepared handouts*Teacher-prepated handoutsTeacher-prepared games*
.Teacher-prepared w "cards*Metric equipment*Computer*Slide. rules/
A
ti
t",...
..-. ,
, .
1.59 2.0.3 , 2.47. . 1'.81 1.70 '1.45
2.87 2.82 . ,-2%742.04 1.92 , 1:661.69 '1.59 1.47
I 1.'96 1.89 1.5'741.17 1.18 '1.43/1.11 - 1.24 'D.66
N'.* indicates a Signiffclnt difference at the 0.05 levelgpong the, respondent groups.
Hand -held calc'ulators are beginningto he'used in mathematics.classes. As, grade level increases, so,:,does.the use of hand-heldcalculatofs.= The percent of teachers v./ use, hand -held calculatOrs
-
frequehtl 00nTreases from about nine per ent in Grade 8 to about.''''.-1.'4EtyAeven percent in GrVe 12. The per ent of teachers who do not Th
u eAtand-held calculators ht all drops fro about fifty percent inOp e 40td about ten percent in Grade 12. AdiscTssion of the, resultsipn items specifically concerned' with halLhpld calculators i's presented
.in SectIpli 5.6 x;f th(s ch4ter.
. '0
.4, ., . .p ;.
Teacher`prepared handouts yielded the.higtiest average in,eachof the three group's.
'Sixty-three,percenig.mort'Grade,8 tepeher2 indi-cated thatthey used teacher-pipared handoutg thainanY..ptherSaterials
s
s.,,* . 1
,
tem. °, ,
. .',
. - : -t-Over the last decade, 'the use of the, computer in'isecandary: ,' .N.Schools hag Thcreasad rapidly. In spite of this, about eighty-six ',percent of theGrade 8 mathematics to hers and abOut eighty-three i4 ..percent of the Grade 10'atthematics chers do, not,uge the computei', 1:
ilrat ail. 'A discussion of the results on items specific4ly cOneernedi
with'the use of the computer in tecondary mathematicg classes is.pre-' 6
sented in Section 56 of this chapter. ... , 11
IMethods
'''''; ,
\-....,_
rSix methods of presentin mathematics to a secondary class'were listed and t1 teachers responded aecordingto frequencyo'f'uset
...df each method 'n ?heir classes. The,results are presented in Tablee
-.5-14 . \el
.
.:0
It
3,
89

90
o
\;
, Table 5-14
Secondary Teachers:Use of Different Instructional Methods
tlY
Learning centredIndivivalized instructs ...
LaboratoriesTotal class s-Trigtruction
4 ream teachingCompTer-giaed instruction*
\...
1.23- 1.22 1.24
2.5Q' ' 2..50 .2.43
1.24 . 1.8 , 1.25
2.92 2.91 .2.98
1.09, 1.15): 1.14
1.10 1.11 1.29
Grades. 8 Grade 10 _Grade 12 -
* indicates a,significant difference at the 0.05f level among t'he respondent
groups..
Of the six Methods listed for presenting matheMatics to a
secondary class, four are not being used by any sizable'group of
secondary mathematics teachers.. Over seventy-ti.ye,)erCent of ,thftisecofid-Y
ary mathematiCs teaihers d9 not use learning centres or laboratories at
all. Over'ninety percent of the Grade teachers do not use team
teaching oi-oomputer-Aded instructpn'\ .all. AIT.9am teaching and ' ..
compuI4i-aided inStructip are not used ataIl ;57 eighty-seven,ker-*
.." -
tent and ,ninety percentrespeetivet.y,'of.thf Grade ,10 teachers and,.,
eighty-six ftrcent,--and seventy-three percent; respectively; of thet...
"'s Grade 12.
teachers. li, d
A o.
. A's discus'sed in4Ction .5.5.1 of thittchapter3
tc,.ta class! ).t. '
i
instruct'on and individualized instruction may appear to be incoMpat-. ---q.
,ible; but those are the two methods most'wide)y used by boththe elcm6 `-)
entary and secondary teachers,surveyed$, Unlike elementary EeacherS,
however secondary mathematics teachers make a' much fake ext,ens14e.1,,-
u of total class instruction. Total clasS instruction is'usea ....P
'':'
freque tly by over nin6tY percent of secondary. mathematics teaeflers:.;.
with almost ninety-eight percent of Grade 12-teachers responding -
,that they use it frequently. Though i dividualized,instruction was' -,
the second most Commonly used method nd-was used fequently-by aboLt-
forty -five to fifty-five pescentErmore secondary teachers than-the'
next most commonly used.method, it was still_ used freqdentlyhY, ,
Chan-
.thirty-fiveto ferty percent fewer,teachers an tOta3 cl,..ass instruc-,N---
lion.
././
, ,
4 A .0,
'S .,,... The only, major differences between elementary acid secondary,,
, teachers surveyed with respect to methods used ark that elementary
' teachers 'use learning centres/more frequently` and secondary teachers
make more use of total class'instruction. With respect to-.materials,,,
the secondary eachers make.more use of hand-held calculatarsthan' °
the elementary teachers and the elementary teachers make'Mort Use of
.
teacher-prepared-workcards than the secondary. techers. In- the yea
. of media elementary teachers make more use of film and'filmstrIps
4,_' . C.,- ,--^
SO

191
than secondar.y teachers, but neither,group uses them extensively.Secondary teachers make' more us'e*of the overhead projector thanelementary teachers. . ,
2 t-
Recommendation 5-3: Teachers of mathematics at all levels shouldvary their teaching approaches to include such techniques as theipa of learning centres and mathematics laboratory activities.
. Teacherfteducators should encourage their studentteachers to developfhe skals'required to use such techniques.
NJ'.-5.,6 Use of .Calculators an Computers
# -410
. ,
.' , s5.6.1 Elementary Teachers
.* i Since the price sf band-field calculators dropped to the point
. - .
at which p:-.4.01.e began buying the* for their personal use, there hasbeen much cncenn about the effect these computing devices would haveon Studtre , especially with respect to-their computational abilities.
\ FOUr it:ss concerned with the use of hand-held calculators in themathel:tics classes'in the elementary' schools Were included on theques ionnaire.
//The four questions dealt with whether the teachers
t3se hand-held calculators in- their wn rk, at what level the=teacher felt `students should be allowed 'to use hand-held ,calculators,in whic ways teachers allowed students to use hdnd-held calculators .
in their mathematicA:classes, al in which ways_ the teachers usedA ha -he caldulators in- their thematics classes. 4
0 ',Au- . .
4 ' The teachers'. responses to the quesenn "Do you use aghaftd-held calculatot an your own work?" are summarized in Table 5-15. . ,
.', Tale 5-45
,EleMentaVO TeaChers: , t .
, i Persoliel.q-
se of Calculators (Percent) ..1
t ,,
: t _
,... ...
\ .
Grade 1 Grade 3 -Grade 5. Grade 7
'Y
...L, .
----,-
p29.5 : 25.4 38:0
2.
., 55.0
, 1
* . ,.
,i
t 'indicates assignificant differenCe at,, the- 0.05 level among. the respondentogroups.. .,
-Elementary teachers were then asked to specify.at which levels.they ft4t4studants-should be pei.mitted to use hand-held calculators
their,,mathematics classes. .The first choice was "At no level".If 'teachers 'selected the first choice; they skipped the ripmainin*
070'quettons concerning the use*df hand-Theid calculators. These'-results are presented in Table 5-16:,

O
I
'92
V
Table 5-16
. Elementary Teachers:Levels at Which Students Should be Allowed to Use Hand-Held Ca cul tors
Grade 1 Grade 3
ts
Grade 5 e 7
At no leliel* 20.1 18.4 19.5 11.8
Primary p. 9.5 9.6 ,__.. 5.9 6.1
Interm diate* 20.1 18.2 4 22.5 30.5
Junior Secondary 38.3 39.3 '37:8 44.3
Senior Secondary* 60.6 62.7 .. 59.5 70.1
* indicates a.significantr>liffVence at the 0.05 level among respond
The chief'factor in the statistically significant
in.the data in rows 1 and 5 appears to be the responses
teachers. In row 1, tr lower percentage of Grade 7 teac
t he other three goups, feel that hand-held calcula
bgrEsed by studentsat any of the four levels listed.
reflected in row 5 where seventy percent of the Grad
sponded that senior secondary students should he al
held calculators. It row 3 the lowest percentage
is by the Grade 3 teachers, but again the Grade 7
°highest percent of positive response. All f ur
est response to the primary level, indicati g t
istudents should not be allowed to use hand- el
the senior secondary level students are th
a majority response that they should be all
calculators..
Only those teachers who felt `that
was appropriate for students to use hand
y the next two questions.
nt groups.
differences s.
of the Grade 7hers as comparedtots should notThat retult is
e 7- teachers re-lowed to Use hand-
of posittie response
.teacherslielded thegroups gave their low-
hat they felt primaryd calculators. In fact,
ly group that recei0edwe --to use `hand -held
one or more of tI?e four ltvels
-held calocullgtors responded to
- Ten different ways a student might use a hand7held calculator
in 4 mathematics class were listed, and the teachers, were asked to
.indicate which of the etn ways students were allowed to use hand -held
calcplators in their mathematics Classes...The results for.that item
are listed in Table5-17. Since tj teao1 s could respond to any
number of'theiteps:listed in Table 5,17, the sum of the columns may,
exceed 100%.
The major facto inttb
differences is'the responsecases the percent of Gradenifieantly'greAter than thpercent of Grade 7 teacheof hand-held calculators
ur of the eight statillApally significant
of the.Grade 7 teache In all fourteachers responding positively was sig-
e other three groups. OVerall, a greater
rs responded on eight of the nine applications
.The application they were not highest on
:
92'

4was allowing students unrestricted use. Gradeq7 teachers were thelowest on the first choice, students do not use hand-held calculatorsin my mathematids class.
Table '5- -17
Elementary Teachers:' Students' Use of Hand-I-161d Calculators (Percent)
93,
Grade 1 Grade 30 Grade 5 Grade 7
Students do not use han-held calculators /-\ -, :in my mathematiCs class* 77.5 #78.2,4 66.1 5.2.5
ti time and effort in /sorn computation me-an eori/1/0
.7 e 8.l'-'7:' 17.5 . 23.0
To hte
1.5 / 0.5
-
0.9
To check work* ..
Unrestricted use
class work* 0.5 0./.., /,,/4.5 11.1
To shorten computation time and effort on tests 0.0 K2 4 0.5 0.5
To shorten computation time and effort onon test assignmeAts* _ 0.2 ' 1.5 j 5.2
...--.....-
4 -.--....14:1
Tp shorten computation time and effort so
S that more concepts may be covered* 0.7 1.2 2.8 74i
e To shorten computation time and-eVtort so . r,,,that a concept may be covered in more depth* 1..5 1.0 4,.0 8.1_
To drill on-computation facts* . 1.5,- 4.4 5.7 , 6.9
To o'fferprichment'problems* 4.0,-r- 7.1 12.6 27.0
,/kadicates a ilgnificant difference at the 0.05 level,amcing 'respond of groups.
The ways in-which students are, not allowed to use hand-held
calc ators is quite clear. Students are not permitted unrestricted
use o hand-held calculatotrs, and they areinot.ailowed to use hand-
, held alculators c shortek computation -time and effort on tests.These were the oniy two items in Table 5-1T on which all four groupsagre x 1
e.By far the two most Common/uses of hand=held calculators are
to check work and to offer enrichment problema. The next two mostcommon uses are to shorten computation time and effort on non-test
assignments, and classk.,
On the next item/ teachers were presented with three ways inwhich an elementary teacher could make use of hand-held calculators
4n tkie mathematics' classroom-. The teachers were asked to selectfrom the list the ways 'they used hand-held calculators in their mathe-maq.cs Classes. The results of that item are presented in Table 5-18.
In each case as grade level increases, so does, the percent of,
positivig response. Grade 7 teachers not only have the greatest
1 93

1
94 N
positive response in every case, but the difference between the re-
sponses of Grade 5 and 7 teachers is the greatest difference between
two consecutive grade levels. The major factor in all three signifi-
cant differences is the response of the Grade 7 teachers.
Table 5-18Elementary Teachers:
Teacher Use of Hand-Held Calculators (Percent)
Grade 1 Grade 3 Grade 5 Grade 7
To do the computation so the concept can be . .. ..-
emphasized* 0.7 2.2 6.6 ',".
To do the comput4tion so many more examples,-----'
of a concept may be shown* 1.2 2.9 6.4
To show students how to use hand-held cal-.,,..
culators* 4,.0 .8.8 , 10.0
. 16.7
11.5
22.4
* indicates a significant-diflezence_at the 0.05 leveLamong respondent ups.
0
Interestingly, the major use of hand-held5calculators i all
three grades was not fo't mathematio4instruction, but for how to use
a hand -held calculator. i4i,,..m.,41 i %
......
..... -.....i::: ,--+ e +
5.6.2 Secondary Teachers X 1 '^'
Secondary teachers-re nded to the same four hand-held cal-.
culator questions as the ele ntafy teachers did. In addition, they
responded to two items concerneddwith the use of computers in second-
ary school Mathematics classes. The results for the hand-held cal-
culators will be discussed first.*
N,
Hand-Held Calculators
Teacherb were asked to respond to the question "Do you use a
hand-held calculator in. pour own work?" The results for this item
,afe presented in Table 5-19.
Table 5-19Secondary Teachers:
Personal Use of Hand-Held Calculators (Per
0' 0
Percent Responding:/
Grade 8 Grade 10 Grade 12
Yes 72.9 79.0 79.3
94 4

, .
4k
The percent' of secondary mathethatics teachers who responded, .
positively to this qUegtlo was more than double the percentage of,eelementary teachdrb.yho. resp ded positively to the same question.
The.ifeachers Wil3,:then asked to select from a lilt of four0:0
levels those at which student's should be allowed to use hand-heldcalcu tors in their mathematics classes. If the teachers felt that
s shgpld not-be used at any level, they were asked to omitinrgtivt'Tiesiions conarning the use_orhand-held
-11
Iv, ,
,,A Table 5-20
Secondary Teachers:Level at Which Students Should be Allowed to Use Hand-41eld Calculators
(percent) 16
At no levelPrimary -0-
IntermediateJunior SeCondary*Senidr Secondary*
M
t
95
IF Grade 8 Grade 1Q Grade 12
11.2 -; 6, 5.65.0 4$-,o80 5.610.2 10.9 10.141.3 53.8 , 3i.379.6 .t 88.0 89.9
'-* indicates a signifiCent difference at ,t4 0.05 level among respondent groups...'
,
../ -- r .
- ..,4
The three groups of secondaty'teachers are in agreement that'.3 vdents should prot_be;dlowed-tctlise hand-held calculators while in
elthentary ac,hdifil:21'hefliatistically significant difference at theJun 6r Seconday levell&ppears to to caused' by a greater percentage'Of Grade 10 teachers stating that the junior secondary level is anappropriate one for students to uel-,band-held calculators The .
statistically. significant difference at the senior secondary level14 due to a differendein strength of opinion rather than a differ-
. ence of opinion. The.significant.r'difference is caused by a lowe
,percentage of Grade 10 teachers responding positively; however,Ialmosteighty percent- of the Grade 10 teachers did respond positivelyii .\
',/ Coming the'resu46 presented in fables 5'16 and 5120, there
\\---,--/a.'n be little doubt-that the higher the grack level', the more approp-
riate teachers feel it Ascifor students to be allowed to use hand-heldcalculators in mathematics classes'. In all seven groups of teacherssurveyed, the higher the level the greater the percent responding thatstudents at the specified leV'el should be allowed to use hand-heldcalculators.
,-
j
Only those teachers who felt th4 one or more df the fourlevels listed in thisfitem "were approp iate for students to gse.haqd=,'
4ertr,
4**
:14.,

96
r
.
hel.d calculators responded to theknext two questions.
,-Ten-different ways in which a student might use Aandrhela
'calculator in a mathematics class were listed. SpeOndary teachers.
were askedtd'indicate in which Of the te'tt ways their students were
allowed to use hand-held calculators in mathematics classes. The
results for this item are summarized in Table 25-21.
Table 5-21
Secondary Teachers: Student Use of .Hand -Held Calculator's (Percent)
I
Grade 8. &ade 10 Grade 12
Students do'not use hand-held calculators in my
MathematicsUnrestricted use*
To check work*To shorten computation time and
To shorten comp ation time and
To shorten comp ation- time and
concepts may be covered*.44,..t.To shorten computation time and
concept maybe covered, in moreTo drill On computation factsTo offer enrichment problems*
effort ineffort on'
effort so
effort sodepth*
50.62.4
264.5 .
24..1-2/ ^ 1.27.8 - 11.9
477 41.7
class work* 28.2 50.0 85.7
tests* 5:9 , - 14.1 25.0
that more lb
that a
18.2
17.95.3
20.3
3574
32.0
54.82.4
33.3'
*'indi.:cates a significant difference at the 0.05 level'amollg respondent groups.
9
k
All but the first choice were used by those teachers who
\o actually alloT,ted stUdents to 'bss, hand-held calOulators in'class,, but
the percents in Tabile 5-21 are based upon all the teachers who re-
sponded. To edjust`the responses to include only 'those teachers who
actually allowed the use of hand-heldocalgulators.would mean ,th4
any percentage response exceeding 25% forhe Grade 8 teachers, 38%
for the Grade 10 teachers, and.49% for the Grade 12 teachers would' ,/
represent a majority o'f theteathers at that level.,
There ys only one row in Table 5-21, that does not Have a
F 3atistically4SignAicant gfference. ',None otT the three grOUps-Mke
If much use of hand-held calculators to drill on computation facts: It A
.also al5pears'that students are not*allowe4 unreSbricted us4, of hand-
held calculators,.one of the restrictions being the use,(of the
calculators by students ddring.tests ., .
.
,
141446.-
, "J------- 9. :...
The two most common uses Of calculators were-tdr-Shorteli.con
putational ti e and ?(fort in'class work, with, an ovefhll adjusted
percent reqponse of glacty-six perTenE, anct.noti-test-assIgnmants,-
'oveiall, adjuseed percent. respove of sixty -fiN.ke nercent. 'Ttle only .
.
.
.
. -..A,-
1 ' . ...--
4..) %
4

97
othex application to attain an overall adjusted percent responsegreater than fifty percent was that of checking work.
In comparing the results in Table 5-17 and 5-21, adjusted to'include only those teachers who allow their students to use hand --held calculators in mathematics class, several trends became evident.Elementary teachers and secondary teachers do not make much use ofhand-held calculators to drill on computation facts. Both elemen-tary and secondary teachers use hand-held calculators to offer enrich-'ment problems. Two of the uses listed,for hand -held calculators were 0
directly involved with the presentation of mathematics lessons.Those two uses were to shorten computation time and effort so that
. more concepts Could be covered or so that cqncepts could be coveredin more depth. On those two uses of hand-held calculators, the per-cent of secondary mathematics teachers' positive response was fourtimes that of elementary leachers.
Finally, secondary teachers were presented with'three ways inwhich secondary mathethatics teachers might use hand -held calculatorsin their classes. They were asked to select all of those options'which they used in their classes. The results are summarized inTable 5-22.
*' ' Table 5-22
Secondary Teachers: Teacher Use of-Hand-Held Calculators (percent)
Grade 8 '-/iQxade 10
/Grade 12
To do the computation so that the concept can ,
be emphasized* -___- 25.0 42.6 64.3To do the, computation so many-more examplesof a concept may be shown* -
. (21.5 38.7 '54.8
To show\students how to use hand-held calculators 25.9 31.3 31.0
* indicates a significant differCnce'at`the 0.05 level among the respondent groups.N
The two statistically significant differences were due to thepercent responses Of thelithree groups being well spaced. In bothinstances the percent responses increased with grade level.
rUn ike elementary teachers and. Grade 8 teachers, Grade 10 and
12 teach s gave the lowest percent to using hand-held calculatorsto show students how to use hand-held calculators. The Grade 10 andI. teachers use hand-held ,calculators to do computation so-that theconcepts to be presented can be emphasized and more examples of theconcepts Ca be given. All three uses receive equivalent percentresponses f om Grade 8 teachers.
.- -
9.74

98
I
Computers
,,.;C
;
The next questibnnaire item,cuncerned the ways comput= s areUsed in secondary schools for.instructional purp9seg. A seqUentitem dealt with how those teachers who make, use of the c pUter in
their mathematics Blass do so. The results,f9r the f st of thesetwo Items are presented in Table 5-23.
Table 5-23Secondary Teg6hers:
Computer Uses in Schools:4r Instru. onal Purposes .(Percent)
Grade 8 Grade 10 Grade.12
LA computer is NOT used,in -*, school*
.., -.4.
A computer is .used by a ,ceicputer club o,% otherextra-curricular .organiza;ion* -
A computer is used in some mathema 'cs classes*A computer 1. used' in Some eon- n. ematits clasSes*.A computer is used ,in a coiputr science ourseic/
73.9 72.0 `- 53.9
--10.7 7.3 16.917.8 17.8 33,,.7 ,
7.3 9.8 20.2i
14.4 16..8 37.1
, .- .4
* indicateg significant fferertce at the 0.05,-, level among the resppndent groups...' , -, ,
x Th e teachers responding to the-first choice did not responditO any the other choices nor did they respond to the next item;
4 To ad st the results in Table 5-23 to inc de onl those teacherswho esponded that their s6hool'd d use a c ut
IC 14%
for instructionalp poses means that any response eat than for Grade 8, 14or grade 10, and 24% for Grade 12 represents a majority of those
teachers for the specified grade level.°.The fact that for everystatistically significant difference on au item, listing a way thecomputer can be used in a schoolfor instructional purpqses the :.
Grade 12 teachers' response percent was highest, may be a result ofthe computer being housed in or more accessible to\set or secondary .- .
II.schools. .
i .. $
.'It is\interesting to note that of.thosg Schools making use of',
' 4the computer, most have begun using'the computer in both mathematicsand non-mathematics classes. Over sixty percent are even offeringcomputer science classes. In considering the results in this.section,however, it\should be remembered that over seventY`percent of the
L
secondary mathematics teachers surveyed responded that a computeris not being used in their schools.
Teachers were then asked to select from a list of severaloptions, those ways in which they Made use of computers in theirclasses. Therresults of this Question are presented in Table 5-24.
98

4.
1
Table .5 -24
Secondary Teachert:Computer Use in Secondary Mathematics Classes (Pere
99
1 Grade 8 Grade 10 Grade 12
Students do not use a computer in my mathematicsclass '59.0 59.7 48.8
Students take a /computer programming unit 25.0 16.9 9.8Students 'run' pre-written programs 13.0 ).3.0 7.3Students .4ss, the computer .to solve, problems
that are a parit of my mathematics. course* 10.0 19.5 29.3,Students do projects using the computer 13.0 15.6 22.0'
* indicates a significant difference at the 0.05 level along the respon ent roups..
.
Of the secondary mathefietics teachers responding to the uestion.----
re, over seventy,peilcent did not respond to this item becaus their `1,-1
chool did not use a c ter for instructional pqrpoties. Of the
/.--asproximately twenty-nip percent of the total respondents who did-respond, 'fifty -seven pe ent indicated' that they, did not use-S computer 4
in their mathematics classes. A percent're4onse greater than"21%far Grade8,. 21% for Grade 10, and 27% for Grade 12 would resresenta majority of those teachers responding` that they do use a computerin their mathematics classes. Only twof the responses in Table 5:19,represent majority responses. Interestingly, there is only one statist-ically significant difference among the responses of the three groups.Secondary teachers who use computers in their mathematics clapes seem,.to do so in similar fashion.
The most common 'use of the computer in secondary mathematAbs '
classes is to provide a programming unit in the course. The nexttwo most common uses are to use the computer to solve problems thatwere a part of the course and to do projects.
) 5.7 Evaluation Techniques
5.7.i Elementary Teachers'. -..,
Eight different evaluation techniques were presented On theelementary form of the questionnaire. Teachers were asked to markeach on a scale from 1 (Not Important) to 5 (Very Important) according
,,,
to the technique's impottance in their mathematics program. Theresults are presentedin Table 5-25. ,
. , .
Of the silt statistically .significant differences found in
Table 5-25, three are caused by intermediate teache eranking the
.99
4
As%

100
1)
items'significantly lower than primary teachers. 'One was caused by
intermediate teachers ranking the item significantly higher thanprimary teachers, and two were caused by Grade f teachets ranking the
item significantly lower than the other three groups 4id. In one of
these cases, the Grade 7 teachers ranked the technique significantlyhigher than the,other three groups.
13,
Table 5-25'Elementary Teachers: Ranking Evaluation Techniques
Grade 1 Grade 3 Gra
Standardized mathematics tests* 2.35 2.77"
Teacher - prepared tests* 4.22 -,4.51
Tests prepared at the school district' level
tc Tests prepared for use throughout yourschool
.Performance on day-to-day activities*Teacher observation of students' work*Teacher-prepared checklists*'Commercially prepared inventories*
3.08
Grade 7.
3.07
4p.59 r 4.73
2.44 2.55 2.51 ' 2,43
2.33 2.53 2.51 2:37
4.87 4.86 4,.70 4.57
4.93 44.89 4.32 . '4.59
4.34 4.26 3.96. 3.62
'1.63 dq.S9 1.87 , '1.94
( ,.d.
* indicates a significant difference at the 0.05 level among the respondent groups.
The eight' evaluation techniques may be divided into two groups,
teacher-prepared and other-prepared. It is clear that, the four teacher=prepared-techniques were ranked mucfi higher than the,other-prepared
ones. In fact, the overall average for the teacher-prepared itemswas 4.52, while the overall average for the other§cprepfied items was
2.39. In order of preference the teachers preferred teachei-observa-tions-of students' work, performance on day-to-day activities, teacher
e
-,
prepared tests, and teacher-prepared checklists.
The only technique to 14 ranked low inkmporeace, less than2.0, was the use of commercially produced inventoriestand,it was rankedlow by 'all four groups. A complaint often heard froin4dachers aboutall other-prepared material is that though the ffiaterial'maY' have a
sound statistical basis and be'very obj4ctive, it dbes,not exactlyfit the situation-that exists it the classioom.,
5.7.2 Secondary Teachers9
9 , ,
.4.' .
Secondary teachers were also presented alist,oflout,,,teacher2-,prepared evaluation techniques and four other-pr eWed'ikraluation,
techniques. Seven of the eight were identicatl to the ones presented
to the elementary teachers. The averages obtained oh the seondaryform of the questionnaire are presented in Table 5-26.
,
--,'

101
X Table 5-26Secondary Teachers: Ranking of Evaluation Techniques
Grade 8 Grade 10 Grade 12
Staidardized mathematics tests ..2.77 2.56 2.55.Teacher-vrepared tests 4.82 4.85 4.85Tests prepared at the school district level 2.08 1.$6 1.84'
Tests prepared for use throughout youf school 3.03 3.06 3.37Performance on assignments* 4.00 3.89 3.63Teacher observations of students' wo?k*. 3.95 3.73 3.63Teacher-prepared checklists* 2.74 2.51 2.007Commercially prepared inventories* 1.53 1.51 1.25,
I
* indicates significant difference at the 0.05 level among the respondent groups.
Three of the four statistically significant differences.appe.
to jib caused by the Grade 12 teachers rating the items lower than. theother two groups. On the fourth item yielding a statistically signifi-cant diMrence ; the'Grade 8 teachers 'rated the litem higher than theother two groups.
A11 three groups agreed that the use of teacher-prepared testswas the single most important evaluation technique,liseed. All threesgroups rated performance on assignments and teacher observatiOnt ofstudents' work as important. Although both techniquesAgere ratedasimportant, the groups' averages wee statistically 'different withGrade 8 teachers attaching the most importance and drade412 teachersthe least importance to both techniques.
All three groups gave the least importance to commerciallyprepared inventories. In aciption, the Grade 10 and 12 teachers gavelittle importance to tests prepared at the school distrigt,level. 'TheGrade 12 teachers' average for teacher-prepared checklists was exactly2.00.
vThe elementary teachers' average fOr all four teacher - prepared
items' were greater than 4.0. The secondary teachers yielded only oneaverage greater than 4.0: teacher-prepared tests had an average rank-ing of 4.84. The average for teacher-prepared tests was almost a fullpoint above the next highest average, .performance_on assignments at3.91. There is little doubt that among secondary mathematics teachersthe use of teacher-prepared tests Is the most important evaluationtechnique in the list. The greatest diff*ence in the average rankingOn aniitem between the elementary and secondary teachers was nearlyone and one -half points on a ,five -point scale for utilization of
teacher-prepared checklists. 1
oi
-J

4.,
102
5.8 Other Resources
5.8.1 Elementary Teachers
. ,
.There were three,additiqnal items on the questionnaire concern-ing resources 'helpful to classroom instruction. The three items wereintended gather .data concerning the existence of Learning AssistanceCentres for Mathematics, resource persons at the school or distridtlevel, and locally developed, mathematics programmes.
Table 5-27%Elekentary Teachers:
Existence of Learning Assistance Centre for Mathematics (percent)
Grade 1 Grade 3 trade 5 Grade'7
Yes* 36.8 40..4 47.6
.
* indicates a,significant difference At the 0.05 level among the respondent groups.
1.
t The statistically significant difference appears to oe causedby the higher positive response rateof the intermediate teachers. -.$Overall; nine percent more intermediate teaCkers than primary teachersresponded that they did have a Learning Assistance Centre in their. ".
school that offered assistance'in mathematics.
The differential response between the two levdis is not asimportant as the averall,response that only about forty-three percentof the elementary peachers said they had. mathematics assistance avail-table in their school from a Learning Assistance Centre. The situationbecoies even more important when the data 41 Table 5-7, Section 5.4.1.are considered. All four g oups of elementary teachers gave morelearning assistance sevi5e a high rating.
Recommendation 5-4.: Learning Assistance Centres for mathematicsshould'ke made more readily available in the schools of B.C.
( The next item.concerned the availability of resource personsfor Mathematics at both' the district and school levels. These re-sults are found in Table'5-28.,,
teralf,,,fifty-fourpercent of elementary teachers responded'that there was a resource person for mathematics at the districtlevel. Only twenty-two percent resppnded that therewas a resourceperson for mathematics at the schoolflevel.'
7 102°

Table 5-28Elementary-Teachers: ,
Availability of Resource Personnel (Percent)
103
Grade 1. Grade 3 Grade 5 Grade 7
District 56.2.' 55.47 ,53.9 . 50.1School* 16.0 20:5' 24.9 2.9
,0
* indicates a significant difference at theA.Q.05/ level among the respondent groups.
Yr The dataspresented in Table 5-28 give sOme,insight into thedata presented earlier in Table 5-5,'Section 5.3:1. The teachersranked fifteen resources according to usefulness of each in the plan-:ning of lessons or' units in mathematics. School district mathematicsspecialists, and district supervisors received the two rowest.ranksgiven by pe teachers. The low rank may be due not to lack of qualitywork, but simply to the lack of availability to the teachers whenneeded. Over three-fourths of the elementary teachers responded that .
a mathematics resource person was not available in their school andalmost half of the elementary teachers responded that a mathematicsresource person as not,available,in their school district.
"The final item in this secton,concerned the existencee-afmathemstics programs designed by the teachers in their, own schools toserve as a basis for.matheAW.cs iitslruction. The results for thisitem are found in Table'5-29.
Table 5 -29'
Elementary T c
Existence orf School Level thevtics Prog$ (Percent).
Grade ,1 Grade 3 GrsdeJ5 -Vrade 7.)
Yes / 15.8 15.1 14.7' 15.8 ,
...- , ..
: 1.1
f
The response rate.was si4lar for all four grades with acfpositive response rate overall of about fifteen percent- About threeelementary teachers out of'every twenty.responded that the teachersin their.school had developed a mathematics program to serve asthe,basis for mathema'ti'cs instruction in their school.
p
1 0.3
-

r.
104
5.8.2 Secondary Teachers
:Secondary teachers were asked to respond to the same threesitems as the elementary teachers concerning the existence of mathe-matics assistance from Learning Assistance Centres, resource personnel,and the existence of a school based mathematics program.
,Theofilst item'dealt with,the availability of mathematicsassistance through Learning Assistance Centres. The results are
presented in Table 5-30. .
Table 5-30Secondary Teachers:
Existence of Learning Assistance Centres for Mathematics (Pe'rcent)
Grade 8 Grade 10 Grade 12
Yes 52.8 50.9 4 40.2
The positive response rate for secondary mathemati6s teacherswas about fifty-one percent.) It is probably more important that mathe-matics assistance be available at the lower grades0and thia seems tobe the current'situation. As with the elementary teachers, however,about half of tbesGrade 8 teachers responded that mathematics assist-ance through
evenAssistance Centres is not available. The situa-
tion becomes even more important at the Grade 8 level when the datain Table 5-8, Section 5.4.2 are' considered. <The Grade 8 teachersgave Learning sistance services an above average rating on prior-ities based on he effect it has on their mathematics programs.
40The next item also dealt with the availabil1V of mathematics
assistance.` Secondary teachers of mathematics were asked to indicatewhether or not a resource person was available to them at eith r thedistrict or school level, The results are presented, in Table' -31.
Table 5-31Secondary Teachers:
/Availability of Resource Personnel (Percent)
* Grade 8" Grade 10-: Grade 12.,/
District*Schoo",
35.1 19.5
57.2 49.6
19.841.4
4c indicates a significant difference at the 0.d5 level among the respondent Iroups
1 ,
aim
-104

it
.105
4 '4
0The overall percent of positive response for secondary mettle-
matics teachers regarding availabitizy of resource persons at thedistrict level was about twenty-seven percent, and at the school levelabout fifty-two percent. This is the opposite pattern to,the elemen-tary teachers with fifty-four percent' positive response at the districtlevel and twenty-two percent at the school level. Combining both
levels, the Grade 12 teachers seem to have ,the least availability ofresource persons for Mathematics.
The data presented in Table 5-31 give eome.insight into thedata prdsented'In Table 5-6, Section 5.3.2. When asked toratefifteen'resources according to their usefulness in planning lessi<is or units
in mathematics, school district mathematics specialists and districtsupervisors were ranked lowest. The low rating may be due not to thelack of'quality work, but to the lack of availability to the teacherswhen needed. Almost three-fourths of the secondary mathematics teachersresponded that a mathematics resource perion wasnot available at the,district level and almost half the teachers that a mathe-
matics resource person was not available at 'the
Finally, secondary teachers of mathematics 'were asked to re-spond'to the question "Does your school have a mathematics programdesigned by the teachers, in your school as a basis for mathematicsinetruction?" The results far thig item are presented, in TaNe 5-32.
Table 5-32 Op
Secondary Teachgxs: .
Existence of a School Level Mathematics Program (Percent)
N.Grade 8 trade 10 Grade 12
Yes 57.2 64:6 61,8
No 42.8 35.4 38.2
ti
I
The response rate was similar for all three groups with.anoverall rate of positive response of about sixty percent. The positiveresponse rate for secondary mathematics teaEhers is four times the
rate for elementary teachers. The fact that more secondary mathematicsteachers develop their en programs to serve as a basis for mathematicsinstruction in their school than elementary teachers is as expected,since eldmentary teachers must cope with all the content areas, notonly mathematics. TliatsuCh a high percent of the secondary mathe-matics teachers expehd, the amount of time and effort it takes todevelop such ptograms is certainly a sign of strength in the profession.
.105

106ti
/
5.9 Homework in'SeconderfMAthematics
.
a The final questionnaire item to be covered in this chapter appearedon the secondary form of the questionnaire only. The item dealt with howmuch out -of- class time secondary mathematics teachers felt students.shouldspend on mathematics assignments. The results for the item are presentedin Table 5-33. .
Table a)-33.Secondary Teachers:
.Amount of Time Students Require for Out-of-Class Assignments (Percent)
Percent Responding: -
Time Grade 8 grade 10 Grade 12
,None
Less than 30 minutes per day30-60 minutes., per day
More than an hour per day
There is a definite shift, in opinion as grade level increases.
- 0.375.3
24.4
0.7
61.5.37.7
-0.0
4.
0.0
19.1
78.7
2.2
,.Grade 8 and 10 teaehers,feel that less than thirty minutes per day is theamount of out-of-class'time students should spend an mathematics assign-ments with Grade 8 teachers selecting, that choice in threeto one ratio 'over thirty to sixty minutes per day. About "seventy percent of the Grade8 students (See Table 4-7, Section 4.2.7 of the.last Results report0 re- '.,
sponded that they spend less than thirty minutes per, day of out-of-class.
time on mathematics assignments. However, about fifteen percent of. that '0'group of students said they spent no out-ofclass time at all on mathe-matics Sstignments.
".. ' dWhen the ade 8 students' eta were organized-by amount of time spent.on mathematics homework (See Section .4.6.6 of the Teat Results reports),_the. less-than-thirty-minutes group scored higher on all three domains.All-thr e groups of secondary mathematics teachers indicated that givingno ho work at all or assigning more ,phansn hour perwork are equally non-henefi ial. The test results for the Grade 8 students tend to support theteachers. The same pattern og achievement held when Grade 12,data wereorganizedrnized by_ oamount of time spent on-mathematics homework....
, , -
5.10 Summa y
.
Part IV of the Teacher Questionnaire contalped thirteen items on theelementary form and siAeeneitems on the secondary form dealing with man'facets of classroom instructional practices. .
Of the five, content areas listed, elementary teachers spent the moat
1 %.1
r
k

107
time on drill on-basic number facts and computation and the least time on 4 s
ggpmetry. Secondary matheiatiCs teachers spent the. most time on problem ,
solving and applications and algebraic concepts and the least time on
metric measurement. One otheritem on each form,of the questionnairegathered's:lite concerning a( specific content area, the metric system of
mea, sruement, 'With less than one calendar year left before the metricIt .
units are, to be the predominant units used in the schools in alLinsiruc- .,
tion,cit wal3,fo'und that a majority of teacherg areu"sing both the metric . t
and British units of measurement in their teaching).,
'RI
., ;,,0 ';
I 1
All seven groups of teachers surveyed were asked to rate each item
in a list ofresources according'to the usefulness of each in their,plan-
ning day-to 'daY' lessons or units in mathematics. ,All seven groups ofteachers agreedthat the.students' textbook was a useful resource and the-
elementary eachers felt that the accompanying teachers' guidebook was
useful. Al seven groups also agreed that the least useful resources were
..---school dist ictmathematicg 'specialists and supervigors.,
1 - a .../
In raniflpg sixteen factors purpRxted to affect mathematics instr4c-
tion, elementary teachers gave high, Priority to eight'of the factors.. The.
eight items Chnibe organized into the follOwing three groups: _teaching . \ -'-.
load -- reduction of class size, reduction of total pupil load, greater
releasetT6 ft lesson preparation; materials -- more mathematics mani-
- pulative mat ri is forindim4duak classrooms, textboOks more suited to
instructiona n eds, curriculum guides that outline content in specific
terms,'curri ulu guides that offer more assistance in the instructional
prqcess; tra nin -- more effective inservile and professional develop-Y
ment. the e con mathematics teachers gaVe high priorityto each of
the followin fo r factors: reduction of class size, textbooks more
,puited to in tru tional needs,- ability'grouping of students for classes,
and iduction of total pupil load.
.
Set,
Soffe very c ear patterns were idenNifiedfromthe data gathered con-
cerning t e frequ ncy of use of selected media,, materials, and methods in
the teach g of thematiCs. Elementary teachers make frequent use of
.the pverhead rojector is making some inroads, the chalkboard'id also fheonly one dit, the chalkboard, in presenting mathematics lessons. Though
most popular me um for,presenting secondary mathematics instruction...
Although elem teacherg tend to make requent use of many more differ-,
ent.materials, han secondary thematics teachers, teacher-prepared mater-
ials head the ,1 st fox all s en groups 'of teachers surveyea. Total class.
. instruction and indiVidualiz d instruction rank first andlsecond,in,fr¢.-
quency'of use of methods for presenting mathematics instival3171-for each
of the seven' cups of teachers surveyed. Those two methods were well
ahead of any other method listed. Learningetentres were used much more'
a .often by primaXy teachers than by any of the others. -,/
All seven groups, of teachers were in agreement that elemen-
tary 'students should not be allowed to use hand-held calculators and
senior secondary Students should be. Ifstudents are allowed to use hand-
107

"`
4
108
et
held calculators, regardless of the grade level of the students, they.shouldnot be allowed unrestricted useAe hd they should not be allowed to use hand-held calculators on tests. Stude*ts are allowed to use hand-held calculatorsto check work, to shorten computation time and effort in class work, andon non-test assignments. Hand-held calculators ars also used to offerenrichment problems. The main ugrtelergentary teachers make of hand-heldcalculatofs is to show their students how to; use hAnd-held,calculators.-Secondary mathematics teachers use hand-held calculators in their classesto'shorten computation so that concepts may be covered in mone,depth andmany more examples of the concept may be shown.
.Over seventy percent of the secondary mathematics teachers responded,that their school does not use a.computer-for thstruction.e. purposes.*
Another seventeen percent responded that their school uses a computer forinstructional purposes, but that they do not use a computer'it'their mathe- :matics class. 'Mg schools that,do use computers for instructional purposesmake use ofthe computer in many different classes. The teachers that usea computer in theiK mathematics 'clasaes seem, to use it in similar fashioit..
.
Teachers were asked Co rate eight evaluation techniques, four teacher-prepared and four other- prepared, according to the,..importance,they give toeach. The elementary teachers rated each of the four teach9r-preparedevalitatior techniques well above any of the other-prePhrd ones'. 'Thesecondary mathematics teachers rated teacher-prepared t44ts far above anyOther evaluation technique. Secondary mathematics,teaqiers also attachedimportance to evaluating.of performauce on. assignments and teaChei observ-ation of students' work.
4 4ii,
Among 'the sources of.mathematics assistance Iisted,,a majority of-the /elementary teachers'treported the availabilitymof only one, the mathematidsresource person at.the distritt level. Avery slight majority of the ,
secondary mathematics teachers reported the availability of mathematic'sassistance from Learning Assistance Centres thematic resource per-sonnel at toe school level.
With respect to the existence *-f a mathematics program designed by ,theteacher of a .schobl to serve as the basis fpr mathematics instruction forthat school, only about fifteen percent othe elementary teachers reportedthe existence of such programs. A majority of the secondary mathematics ,.
teachers reported-the existence of such programs.110
The Grade El and l3 teachers agreed that students should spend lessP'than thirty minutes per da of'out4f-class time on mathematics assignments,.The Grade 12 mathematicsleadhers feltIthe students should spend thirty tosixty minutes per day.
5b11 Summary of Recommendatious03
4Recommendation. 5-1: ,School districts should explore ways and means ofmakingepebialists' services more readily apailableandof more benefitto elementary teachers.
-4,
108
V.?109
Recommendation 5-2: School districts should explore ways' and &an's of
making specialists' services more.readilyavailable and of move benefit ,
to secondary teachers.
Recommendation 5-3: .Teachers of mathematics at alevels should vary
their teaching approaches to include such techniques as the use of learn-
ing centres and mathematics laboratory activities. Teacher educators
should encourage their student teachers to develop the skills required
to use such techniques.
ReaanriziPidition 5-4: Learning Assistance Centres for mathematics should
beOnade more readily available in the schools of ByC.
103I
A

CHAPTER 6
LEARNING OUTCOMES

113
, One of the most important facets of mathematics instr ction is whatthe teacher expects the students to be able to do once t instructional./.period is completed. Part II, of the questionnaire cont ined items con-cerning the leatning outcomes*expected by the teachers of mathematics. -/All teachers,_a*cept the Grade 12 teachers, 'were 1481t to9Onsider a Listof learning outcomes, for their specifiedrr,dd,leve and fib rate eachi e /item according to its importance in their S: ondary teachers werealso asked-to rate a list. of learning outcomes" in order to determine whichwere important for entering Grade & students. A seven groups of teachersreacted to a list of learning outcomes with res ect to their importancefor a student upon completion of se ondary sch 91.- .
64 Relative Importance of Selec ed.Curricu at Ob ectives
Teachers at the Grades 1, 5, 7, 8, and 10 levels were asked torate each of a number of curri lar objectives for their respective gradeson a scale from 1, Not Important, to 5, Very Important. The results foreach grade are discussed sepatately in the next six sub-sections.
Grade-12 teachers-did nbt respond to such a question for two reasons.First, Grade 12 Mathematics is optional so no one list of learning out-comes would suffice for the many different mathematics courses offered,and second, all the teacher4 responded to a list of learning Outcomes Arfor-Secondary school graduation.
6.1:1 Grade 1 Teachers
Seven possple learning outcomes for a,Grade 1 mathematicsprograM were presented 6 the Grade 1 teachers. The-results are inTable 6 -1.'
Table 6-1Grade One Learning Outcomes
Average Rating
Recall with reasonable speed and accuracythe addition, subtraction and multipli-
. cation facts to 10Solve simple problems involving additionand subtraction
Recognize the role of zero in additionGroup by tens and ones and relate this
to place valueUse the centimeter to measure andcompare lengths
Classify geometric shapesRelate multiplicat to repeated adds-'lion using'product to 10
4.53
4.404.29
4.14
3.57
3.52
3.10
1
11.E

1'14
The following four items had ratitigs higher than 4.0: recall
with reasonable speed and accuracy subtraction and multiplicationfacts to 10; solve simple problems involving AditiOn and subtraction;recognize the"role of zero in additio ; and group by tens and ones
and relate this to place value. The wo learning outcomes not re-
lated to computation received averag ratings of about 3.5.
6.1.2 Grade 3 Teachers
The list of possible learning outcomes for a Grade 3 mathe-
matics program contained sixteen items. The results are presented'
in Table 6-2.
Table 6-2Grad Three Learning Outcomes
.,/
Average Rating
Solve addition and subtraction exampleswith 2, 3, and 4 digit numerals, withand without regrouping '
4.82
Solve multiplication example for pro-
ducts to 50 4.71
Recall multiplication facts to 50 4.61
Understand'the place value of n erals
to 9999 0 4.54
Translate a word problem into ma he-matical symbols, and. solve using
appropriate operations 4.39
Ube expanded notation in renaming numbersto 9999 3.82
Read a thermometer in degrees Celsius 3.72
Estimate and measurer lehgth in metric.
units to kilometers 3.67
EstiMate and measure capacity inmillilitres a d litres. 3.43 '
Round off number to.the nearest,l0 or
100 3.41 -
Determine as by balancing in gramsand kilograms 3.27
Use graphs as a means of recording 3.23
Determine area by covering two dimen-,sional spaces with centimetersquares 5 3.06
Construct simple geometric models ofsolid and plane shapes 2.88
Recognize axis of symmetry-from exper-ience with concrete materials 2.63
Read and Write Roman numerals to 12 2.37
112 ,k

aA .115
The-Giade 3 teachers rated three items below 3.0 on the scale.These items, in descending order, were: construct simple geometricmodels of solid and plane shapes; recognize axis of symmetry frome erienCe with concrete materials; and read and write -Roman numerals
4. o 12..°The firstfour'afiphe five items with an average rating.
greater than 4.0 (the }.oweat was 4.39) were computation oriented.The five.items, in degpanding grder, were: solve addition and sub-traction examplesM4' 2, 3, and 4 digit numerals, with or withoutregrouping;tsolve mu igication examples for products to 50; recallmultiplicatiod fact 'to 50; understand the place value of numeralsto 9999; and'trans ate a word problem into mathematical symbols andsolve usineappro riate operations'.
.1Grade:3 teachers-gave high ratings to thecomputation oriented
learning outcomes as did Graff 1 teachers. Six/of the sixteen learn-ing outcomes *ere classified as computation oriented.A.When the out-comes are placed in descending order based upon their average ratings,five of'thefirst six are seen to be computation oriented. Thefirst six'are followed by three metric measurement outcomes and thefinal computation oriented learning outcome. The last six learningoutcomes consist of two on metric measurement, three on-geometry,and the one on Romannumerals.
6.1.3 Grade 5 TeachersA
,
Seventeen possible learning outcomes fora Grade 5 mathematics)0/.. program were rated by the Grade 5 teachers: The average rating for
each is presented 'in Table 6-3.
The G ade 5 teachers rated three of the seventeen items as`being below .0 in importance as learning outcomes for a Grade 5mathematics rogram. The three items were: perform experimentsinvolving translations, refleckons, rotations, and. flips; performinvestigations and arrive at conclusions related to tiling (tessel7lations); and identify the circle and its parts. They rated eightof the 'items above 4.0. The eight Items, in descending order, were:,recall basic number facts; indicate the place value of each digit
#of.a numeral in standard notation; use the division algorithm_ with.whole numbers; use the addition algorithm with whole numbers, commonfractions, and decimal fractions (to 100ths); use the subtractionalgorithm with whole numbers; common fractions, and decimal fractions(to 100ths); construct and solve word problems arising out'of in-vestigations; use the multiplication algorithm with whole numbers,common fiactions, and decimal fractions (to whole number X 1000ths);and use instruments to measure length, area, volume, capacity, mass,and temperature in metric units.
Following the same pattern set by the Grade 1 and 3 teachers,Grade 5 teachers gave the highest ratings to computation orientedlearning outcomes. When the list of outcomes is placed in descendingorder, as in Table 6-3, the top five items are computation oriented
4. 113

a
116
*and the last four are not.
Tabl- 6-3Fiv Lead g Outcomes
AverSge Rating
,
Recall basic number factsIndicate place value of each digit of a'numeral in standard notation
Use the division algorithm with wholenumbers ,
'41
Use thaddition algorithm with wholenumbers, common fractions, auddeci-,mal fractions (the 100thg-)
.0.
4.87
4.52'
4.51
,4.39Use the subtraction algorithewith'whole
numbers, common fractions, and deci-mal fractions (the 100ths) 4.37
66nstruct and solve word\problems
N.arising out of investigations 4.21 t
Use the multiplicatiOn algorithm with 'whole numbers, common fractions, anddecimal fractions(to_ whole' number X 1000ths) 4.16
Use instruments to measure length,area, volume, capacity, mass,,andtemperature in metric units
Regroup as required for algorithms 3.73Interpret graphs 3.71Expies6,a number as the prOduct of its
prime factors 3.54onstruct graphs 3.44
Write-numbers in expanded"form. 3.42Identify and list properties of common
three diMensional geometrical forms 3.06Identify the circle and its partsPerform experiments involving trans-lations, reflections, rotations,and flips 2.11
Perform investigations and_arri ve'at4
conclusions related to tiling(tessellations) 2.11
4
6.1.4 Grade.7 Teachers
The longest list A learning outcomes for the' elementlxii,!;:-.'grades was presented to the Giade 7 teachers and it contained twenty -one items to be rated according to each one's importance in a
Grade 7 mathematics program. The results are presented in Table 6-4.
114L__, 114?
1

117
Table. 6-4
Grade Seven Learning Outcomes
Average 'kiting
Perform the operations of addition, sub-traction, multiplication'and divisionwith whole numbers, common fractddns;and decimal fractions 4.88
Perform in the correct order, a calcu-lation involving more than one of thefour basic operations 4.50,
State the value represented by each digitin a mulliadigit decimal numeral 4.48
'Solve simple pen sentences 4.40
Test the appropriateness of an answerto a problem 4.38
Write a percent numeral for a fractionnumeral: or a decimal numeral 4.27
Solve problems involving percent 4.27
Write a decimal numeral for a fractionnumeral and vice versa 4.26
Use instruments to measure ).ength;
. area, volume, capacity, mass, andtemperature in metric units 4.25
Translate word problems into opensentences 4.22
Write sets of equivalent fractions- 3.98
Calculate perimeters of rectanglesand triangle% 3.84
3.64-Draw, or interpret scale diagramsCalculate the lowec.common multiple
(LCM) of two or more whOle numbersCalculate the greatest common factor
(GCF) of two or more whole numbersWrite a whole,number as a product of its
prime faptorsUse a compass and !straight- edge /to
copy an angleConstruct a flow chart to fit a verbal
description of an operation or pro-cedure
.
Write a decimal numeral in expanded formusing powers` 10 in exponent, form
Identify from a diagram, or dr.aw a .
diagram, illustrating acute,right and obtuse,angles
Use a compass and straight-,gdge tobisect an angle
3,59
3.53
3.40
3.27
.3.21
3.20
3.17
3.12
4.1
115,
i 18
4 a
The Grade teachers ranked ten of the, twenty -one learning
outcomes above 4.0, the%lowest of these being 4.22. The ten.learn-fngOutcothes, in descending order, were: perform the four-basicoperations with whole numbers,'fractions, and'decimals; perform, in
'the correct order,'a calculation involving more than one of the fourbasic operations; state the value represented by each digit in .amulti -digit decimal numeral; solve simple open sentences; test theappropriateness of an answer to a problem; solve problems involving
la percent; write a percent numeral for a fraction numeral or a deci-mal numeral; write a decimal numeral for.a fraction numeral andvice versa; use instruments to measure length, area; volume, cape-
, ,0.3)ty, mass, and temperature in metric units; and translate word .c
p oblems into open sentences. All twenty-one of the learning out-,`
comes listed for a Grade 7 mathematics program were also tbresented
to the secondary mathematics teachers. The secondary teachers wereasked to rank each item accord,ing to its importance for an enteringGrade 8 'student. those results are presented in Section 6.2.2.
6.1:5 Grade 8 Teachers
As with the elementary teachers, the Grade ,b-and 10 mathe-matics teachers were asked to respond to a list of learning outcomes
for their particular grade level. There were twenty-three learningoutcomes presented to the Grade 8 mathematics teachers. The dath
are summarized in Table 6-5.
The computational lear iAg outcomes tend *o be grouped into.
larger outcomes for tA Gr e.8 list. Of the twenty -three learning
outcomes listed for Grad 8, only threes deal specifically with per-
forming compPtation. All three,-however, were ranked among thetop
five learning outcomes. The,Grade 8 mathematics teachers ranked ten
of the learning outcomes higher than,4.0. The,ten outcomes, in deq-
cending order, were: perform the four basic operations with wholenumbers, common fractions, and decimal fractions; perform the fourbasic operations with integers; write a decimal numeral,'fractionnumeral and percent numeral for any number given in one of the threeforms; solve problems involving percent; perform, in conventionalorder, a cilculAtion inv4kving a series of operations;. state thevalue represented by each digit in ulti-digit decimal; solve open
sentences; test the appropriateness o in answer to a Problem; trend"-
late verbal problems into open sentenc s; and calculate perimetersand areas of circles, rectangles, and t iangles. Grade 8 is the low-
est grade level of thAesurVeyed that ranked a geometry 1 rning
outcome greater than 4.0.
41. /he use of set notation and constructing, flow chart to_fita verbal description. were the, only two learning outcomes that were
ranked below the mid-point on the scale.,
A
116

119
Table 6-5 rGrade Eight Learning OUtdomes-
Average/Rating
Perform the four basic operationswith whole numbers; common frc-tions, and decimal fractions"'
Perform the four basicoperations. .
with integersWrite a decimal numeral, fraction
numeral and percent numeral for anynumber given in one of the three forms
Solve problems involAring percentPerform, in conventional order, a cal-
culation involving a series of
operationsState the:value represented by each
digit in a MultiL.digit decimal
numeral 4 ;
Soliie simple open sentencesTest the appropriateness of an
answer to a problemTranslate verbal problems into open
sentencesCalculate peritileters and areas of
circles; rectangles, and trianglesRound a decimal numeral to a specified
place valueUse the Pythagorean Theorem to calcu-
late a side of a right triangleCalculate the LCM of two or more numbersCalculate the GCF of. two or more numbers
Write a whole number as a product of
wits prime factorsUse a compass and- straight-4-edge to bi- 4`
sect an angle and bisect a-kine segment
Use a table to find the *proximatesqualiik root of a numbegZ
Write decimal numerals in' ex nded form
using powers of ten in-exponent.formDraw or interpret scale drawings.
e a compass and straight-edge to con-
struct a perpendicular to a line from
a point not on the line and a parallel
to a line through a given point
Write decimal numerals in scientific
notationConstructa flow chart to fit a verbal
descriptionUse of set.notation
t.
4.93'
'4.72
4.564.44 °
4.43
4.39 itt
4.39 ,
'0.52
4.11
3.98
3. 60.
3.50 43.4.5,
3.41
3.36.
3.35
3.3U3.24
3.19
3.12
i 2.722.66.
117

120
1
e/. TIOf the twenty -one learning outcomes listed, for4a
G ra de 7 mathe,patics pt gram and the twenty-three listed for Grade 41/, fourteen werecommon to bothotrade,levels. The results on the common itemsTables 6-4 alid 64.5 reveal that the Grade 7 and 8teachers gav similarratings tothese learning outcomes. On ten of-the fourteen le rningoutcomes the two averages differ by 'one-tenth oca epint or less. Onthe other four, the Grade7 teachers ranked tub items higher and twoitems lower, than their Grade 8 counterparts.
'
6.1.6 Grade .10 Teachers
Grade 10 teachers were presented a list of-twenty-three learn-ing outcomes, but on.y three were taken from the Grade 8 list. Thedata for the Grade LO teachers are summarized-in Tab 6-6.
Grade 10 teachers rated nine of the twenty-three learning out-,comes higher than 4.0. ThOse=ntne learning outcomes, in-descendingorder, were: perform the foUr bas pperatfons with .whole. numbers,common fractions, and decimal fract ons; perform tiprflur basic opera-tions with ipitegers; write a dec numeral, fraWoenumeral'andpercent numeral for any number en in one of the three tOrms; solveword probleMs algebraically; ca culate one side of aright- angledtriangle given the other two si ; 'solve problems involving simpre,interest; add and multiply
uapolyn ials;.solve systems of'linear equa-
tions; given an eqtion iktwo N riahles, graph the equation inthe coordinate plane. Again, the computation learning outcomes areranked at the head of the list, but the nine highly vtnked'items in-
': Iclude two geometry learning outcomes and three algebia learning out-. comes. , The first three items in Table..6-6 were alsoisted as learn-
ing outcomes for Grade 8. The Grade 8 and 10 teachers; ranked allthree learning outcome4 very highly. The lowest rating obtaiged forany of the common items by either group was'4.48:
The Grade 10 teachebelow 3.0 On the scale: exelathe resultant vector for twouse elementary BASIC as a proand debug Simple programs.
anked three 'of
the nature oen vectors-b
amiing langua
118
4
o
the learning outcomesf annuities; calculatea, scale drawing; andto 'T.7rite, e2ecute,
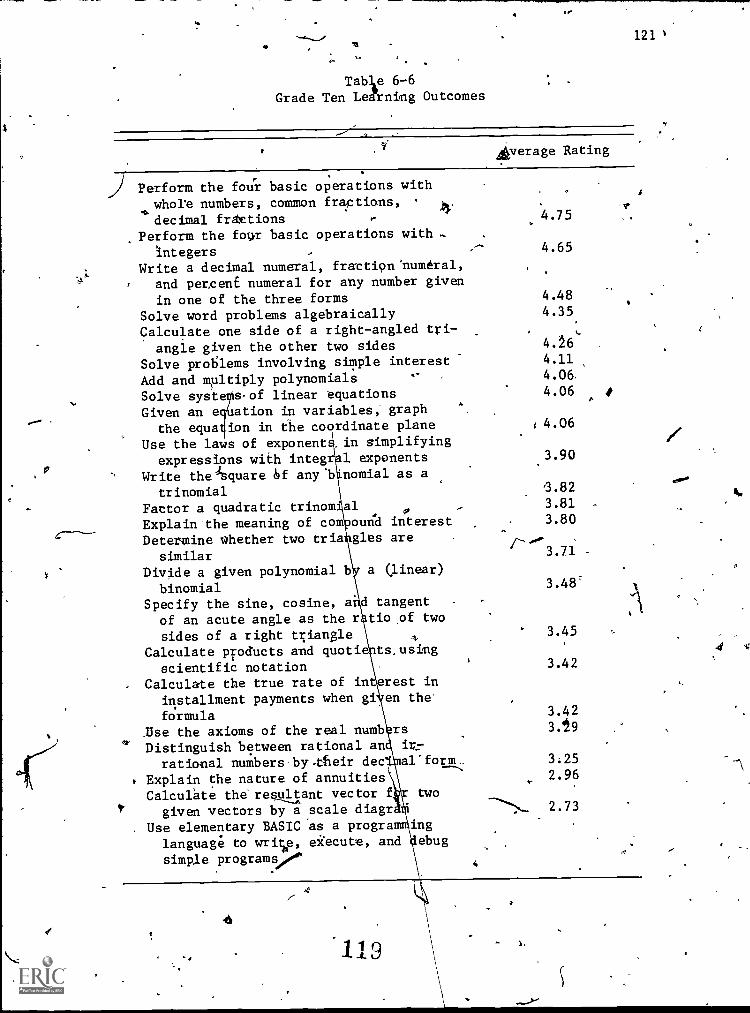
'"
'is
.
Tab]e 6-6Grade Ten Learning Outcomes
Average Rating
Perform the four basic operations withwhore numbers, common fraptions,decimal fralctions
Perform the four basic operations with »
integersWrite a decimal numeral, fraction 'numtral,
and percent numeral for any number given
in one of the three formsSolve word problems algebraicallyCalculate one side of a right-angled tri-
angle given the other two sidesSolve problems involving simple interest
Add and multiply polynomialsSolve systeMs.of linear equationsGiven an eollation in variables, graph
the equation in the coordinate planeUse the laws of exponent ,in simplifying
expressions with integ -1 exponentsWrite thAquare bf any 'b nomial as a
trinomialFactor a quadratic trinomial PExplain -the meaning of com ound interestDetermine whether two tria, gles are
similarDivide a given polynomial b (linear)
binomialSpecify the sine, cosine, a d tangent -
of an acute angle as the r tio,of two
sides of a right triangle 4
Calculate products and quotie ts.using
scientific notation
- Calculate the true rate of in -rest ininstallment payments when gi en the
formulaUse the axioms of the real numbersDistinguish between rational an' ir-
rational numbers by-their dec arm.,
Explain the nature of annuitiesCalculate the` resultant vector f two
given vectors by a scale diagr
.Use elementary BASIC 'as a progra ing
language to write, execute, and 'ebugsimple programs,'
4
119
4.75
4.65
4.484.35
4.644.114.06.
4.06A
/4.06
3.90
3.823.81
3.80
3.48'
3.45
3.42
3.423.19
3.252.96
-"\- 2.73
121
I
4

41.
142,
6.4' Minimal Objectives for Mathematics:
6.2.1 Secondary4chool Leaving Objectives
v A list of twelve learning outcomes for graduation from'second-ary school was ptesent;a to all seven groups of teachers. They were
$ asked to rank the Learning outcomes accOrding to their importance.The scale used for.the ranking had three points: 'Optional; Zmportant,but noAt essential; and Essential. The data for each group of teacherson each learning outcome are summarizedin this section. The averagerankings were computed using the weights shown in Figure 6-1.
Response
Optional ,
Important, but notessential
Essential
Response Scores
Weight
1
Figure 6-1: Weights for Ratings c Learning Onircomes
All seven groups were also a4ked at Ohich grade level theyfelt students should be required to take a mathematics course. The'percent of positive response for each grade level from eeoh grqup of. ,4%.teachers is also presented.
Elementary Teachers
The average rating for each of'the twelve learning Outcomesfrom thefour groups of elementary teachers is presented in Table 6-7.
Over nineti-eight percent of the elementary tethers thatit was essential that a secondary school graduate be able to accura-
. tely perform the four basic operations with whole numbers. Onlyabout sixty-three percent of them f t it wasessential that gradu-ates be able to compute with common actions, though about thirt-four perc nt more felt it was import t, but not essential(.' Aboutseventy -sgben percent of the elementary teachers felt that the abilityto compu with decimal fractions was essential. Substantially fewerheld thig opinion about computing with common fractions.
Three other learning outcomes were marked as essential by alarge majority of the elementary teachers. Ninety-three percent ofthe elementary teachers felt that graduates should be able to treethe metric units of measurement. The'elementary teachers also feltit essential that graduates should-be able to apply their mathematicalknowledge to-physical worid situations, Seventy -five percent, and to
120' )1

'
v,Table 6-7
, Elementary Teachers: Learning Outcomes,fok,.GraduatAonfrom Secondary School
. -
f
Grade 1 Grade 3' Grade 5 Grade 71-
Accurately perform the four basic opera-tions-with whole numbers '. 2.97 3.20 2.98 2.98
Accurately perform the four basic opera-tions with common fractions , ,
Accurately perform the four basic opera-.2.57 2.60 2.57 2.63
tions with decimal fractions *2.62 2.69 2.76 --' 2.89Use the "basic" formulas fof area andvolume *2.29 2.44 2.45 2.48
Use the Pythagorean Theorem 1.64 1.68 1.-69 1.61Solve linear, equations *1.99 2.10, 2.12 2.17Solve quadratic equations 1.68 1.72.. 1.70 1.69Use the metric units of measurementEvaluate the given lalgebraic ex-
2.91 2.92 2.93(
s2.93
pregsion *1.83 1.91 1:92 2.00Recogniie and name geometric, figures *2.37' 2.33 2.26 2.17Apply mathematical knowledge to
,- *physical world situations 2.71 ' 2.78 2,71 2.75
Apply mathematical knoWledge to con-sumer related situations 2.87 . 2.92 2.87 - 2.89
1
* indicates a significant difference at the 0.05 level among respondent groups.
,consumer related situations, ninety percent.
Forty-three percent of the elementary teachers felt that useof the Pythagorean Theorem should be an optional learning outcome andforty-one percent felt that solving quadratic equations should beoptional.
In Table 6-8 'the results for the'item,dealing with, the gradelevels at which students should be rewired to take either an academicor non - academic mathematics course are presented: The data in Table 6-8are the percent of the teachers giving a positive response to thespecified grade.
-
Currently in B.C., mathematics is requited in Grades a,.9, 10for gr!aduation, while mathematics in Grades 11 and 12 is optional.
Almost ninety7nineereent of the elementary teachers felt that a.mathematics course should continue to be required in Grades 8-10:.Over eighty-four percent of them felt that a mathematics course shouldbe required at the-Qiade 11 level and over seventy-three percent feltthat a mathematics course should be required in Grade 12. It is

a/
N
424
interesting to note that th re are no statistically'significantdifferences among they 'n,Table 6-8. 'All four roups had similaropiniJils regarding the requirement of a mathematics course at. each9f the grades listed.
Table 6-8- Elementary 'leachers: Grade Levels of Required
Mathematics Courses
Grade 1 Grade 3 Grade 5 Grade 74
Grade 8 100.0 . 99`8` 99.6 .
./
'100.0
Grade 9 99.S 99.1 99.1,
Grade 10 99.1 ' 96.8 97..1 97.3.
Grade 11 87.1 84.2 - 83.3 432.7af`
*Grade 12 76.1 73.2 71.3 71.9
Secondary Teachers
The average rankihg for each of the twelve learning ou5comesfrom the three groups of secondary mathematics peachers is'ISesented
i .
in Table 6-9..v
All but four of the 7.44secondary mathematics teachers re-sponding felt that it was essential that a. secondary school graduatebeableto, accurately perfOrm the four basic operations with.wholenulbers. This rate does not drop much for fractions and decimals.Over ninety-three Orcent *of the secondary'mathe'makes teachers felt'the ability to computetylth common fractions wa essential-gradu-ates; over ninety-seven perefrit.felt that'-th ability to compute
waswith decimal fractions was a so.essential.
--(.Eighty -nine percent of the teachers felt it was essentialfor graduates toAtse the metric units of measurement. Graduatesbeing able tojlse the "basic" formulas for area and voluie was feltto be essential t seventy-five pereent o ie respondents. The.teachers also fel that &t was et ential t'et graduates bi able toapply the mathemtical knowledge t physicalworldisituations,seventy -six percent, and consumer elated situations, eig14-se#611percent:.
Solving quadratic equations was the learning outcome withthe fowest.average. Almost thirty -filie perceht\of the secondarymathematics teachers responded that solving quadratic equations'should be an optional learning outcome.
. 4 .

, 125 ,
Table 6-9Secondary Teachers: Learning Outcomes for Graduation
from Secondary School
Grade 8 Grade 10 Grade 12
Accurately perform the four basic opera-.1tions with whole numbers *3.00 3.00 2.97
Accurately perform the four basic opera-tions with common fractions 2.92 ,2.94 2.93
Accurately perform the four basid opera-tions with decimal fractions 2.98 -s- 2.97 2.94
Use the "basic" formulas for `area andvolume -- 2.76 2.72 2.62
Use the Pythagorean Theorem 2.25 2.25 2.28Solve linear equations 2.37 2.25 2.39Solve quadratic equations 1.79 1.80 1.92Use the metric units of measurement *2.92 2,475 2.88Evaluate a given algebraic ex-pression 2.32 2.23 2.30
Recognize and name geometric figures 2.39 2.40 2.28Apply mathematical knowledge tophysical world situations 2.77 2.73 ,2.67
Apply mathematical knowledge to con-sumer related situations - *2.90 2.85 2.80
* indicates a signfficant difference at the 0.05 level among respondentgroups:
A comparison of the data in Tables-6-7 and 6-9 revealsseveral interesting patterns. Secondary mathematics teachers rankedten of the.twelve learning outcomes higher than did the elementaryteachers. All the groups were in agreement on computation withwhole numbers, use of the metric units of measurement, and bothsituations concerning application of mathematical knowledge. Thegreatest difference between the averages of the elementary teachersand secondary mathematics teachers was on the use of the PythagoreanTheorem. There were also sizeable differences, ranging from 0.31 to0.37 on the three-point scale, between the averages of the elementaryteachers and the secondary mathematics teachers on the importance ofgraduating with the ability to evaluate an algebraic expression, com-pute with common fractions, and use the basic formulas for area andvolume. .
In Table 6-10 the secondary mathematics teachers' results forthe item dealing with the, grade levels at which students should berequired to take either an academic or non-academic mathematicscourse are presented. The data in Table 6-8 are the percent of the
123

V
126
I
teathers giving a positive response for the specified grade.
Table 6-10
Secondary Teachers: Grade Levels of Required
'Mathematics Courses / .
'Grade 8 Grade 10 Grade 12
Grade 8 99.5 99.6 100.0
Grade 9 * 99.7 97.4 98.9 "
Grade 10 97.6 94.9 94.4
Grade 11 * 79.0 80.3 65.9
Grade 12 * 54.3 43.7 31.0
* indicates a significant difference at the 0.05
level among respondent groups.
Over ninety-eight percent of the secondary mathematics teachers
felt that a mathematics course should continue to be required in
Grades 8, 9, and.10. The level of positive response for Grade 11,
while lower, still represents about seventy-eight percent of the
secondary mathematics teachers.. Significantly fewer Grade 12 mathe-
matics teachers than'Grades 8 and 10 wanted to extend the required
mathematics courses into Grad* 11. The level of positive response
dropped below fifty percent for Grade 12. A majority of the secondary
mathematics teachers did not want a required mathematicscoUrse in
Grade 12. Two out of every three Grade 12 mathematiCs teachers
wanted the optional status of the mathematics courses in Grade 12. to
remain.r 4
A comparison of the data for elementary*teachers and secondary
mathematics teachers shows that on the first thr.ee grade itvels,both
groups feel very strongly that the requirement.of a mathematics
course should continue. About six percent more elementary teachers
than secondary mathematics teachers were in favour of a 'required°
mathematics course in Grade 11. The most significant difference,
however, occurs at the Grade 12 level with over twenty-five percent ;
more elementary teachers than secondary mathematics teachers wanting
a required mathematibs course at the Grade 12 level. The elementary
teachers were in favour of a required mathematics course at the
Grade 12 level by almost a three-to-one margin; a majority of the
secondary mathematics teachers did not want a required mathematics
course at the Grade 12 level.
6.2.2 Elementary School Leaving Objectives
ti
Just as the elementary teachers were asked to react to a list
124

127.
of learning outcomes for graduation from secondary school, secondarymatherptics teachers were asked to react to a list of learning out -'comes for completion of elementary school. They were asked to rankeach of twenty-one learning outcomes on a scale with three points:Optional; Important, but not essential; and Essential he averageratings, presented in Table 6-11, were computed using7e. w ightingscheme shown in Figure 6-1.
Of the eight statistically significant differences,. half werecaused by the Grade 8 teachers ranking the item significantly lower 4than the Grade 10 and 12 teachers.
Dividing up the three-point scale and looking at the data inTable 6-11 showlithat no learning outcomes had averageS between 1.0
and1.5,§ixvierebetweeill.5and2,0,eiihtwerebetween2.0 and2.5, and seven were between 2.5 and 3.0.
The following seven items, listed in descending order, had anoverall average greater than 2.5 on the three-point scale: performthe four basic operations with whole numbers, fractions, an decimals;state the value represented by each digit in a mul decimalnumeral; perform,in the correct order, a calculation involving morethan one of the four basic operations; write sets of equivalentfractions; write a decimal numeral for a fraction numeral and viceversa; test the appropriateness of an answer to a problem;.. and write'a percent numeral for a fraction numeral or decimal numeral.
Since there were no lgarningl6tcomes that averaged between1.0 and 1.5, it'cannot besaid that any of the learning outcomeshad averages that were very low. The lowest ranked learning outcome -construct a flow chart to fit a verbal description.- had an averageranking of,1.55.
The learning outcomes listed in Table 6-11 are identical tothose listed in Table674, which dealt with the possible learningoutcomes of a Gr,ade 7 mathematics program. The Grade 7 teachers,however, were ranking each learning outcome on a scale from 1, NotImportant, to 5, Very Important. The only comparison which can bemade of -the data in the two tables is. to compare those learning out-comes that were ranked relatively high in both tables. The Grade 7teachers ranked ten items greater than 4.0 on the five-point scale.Of the ten highest ranked items'by the secondary mathematics teachers,eight are in the Grade 7 teachers' top ten list. The two items thatappeared on the top ten list for the Grade 7 teachers, but not thesecondary mathematics teachers were ranked eleventh_and fourteenthby the secondary mathematics teachers. Analogously, the Grade 7teachers ranked items eOventh and twelfth that were on the secondarymathematics teachers' nip ten list. 'It appears that the Grad; 7teachers and the secondary mathematics teachers have similar opinionsconcerning the important learning outcomes for the elementary mathe-maticsyrogram.
125
e4

128Table 6-11
Secondary Teachers: Learning Outcomes for an Elementary
Mathematics Program
Grade 8 Grade 10. Grade 12
State the value represented by eachdigit in a multi-digit decimalnumeral
Write a decithal numeral in expandedLeorm using powers of 10 in
exponent form :ev
Perform in the` correct orde, a cal-culaticin involving more than one
\2 .88
*1.77
,
2.85
1.95
of the four basic operations . 2.65 '2.72
Perform the operations of addition,subtraction, multiplicatidn,' and
division with whole numbets,common fractions, and decimal fiactidns . 2.96 2.95
Write a whole number as a product of its
prime factors *2.01 2.30
Calculate the greatest common factor(GCF) of two or more,whole numbers *2.00 2.24
Calculate the least common multiple.(LCM) of two or more whole numbers *2.08 '2.30
Write sets of'equivalent fractions . 2.66 2.77,
Write a decimal numeral fora fractionnumeral and vice versa _
Write a percent numeral for a fraction
2.64,
.
2.72.
numeral or decimal numeral *2.49 2.62
Solve 'simple open 'sentences *2.10 2.25
Use a compass and straight-edge tocopy an angle ..,:*1.64 _. 1.86
Use a compass and straight-edge to '14060.40'
bisect an angle . .
*1.60 1.77
Identify from a diagram, or,draw adiagram illustrating,acute, right,and obtuse angles ,
1.80 1.91
Use instruments to measure length, area,volume, capacity, mass, and tempera-
ture in metric units 2.39 2.42
Translate word problemsintb opensentences ° 2.07 2.10
Construct a flow chart-to fit a verbal
description 41.56. 1.51
Test the appropriateness of'an answerto a problem 2.56 2:63
Draw or Interpret scalp diagrams 1.73 '1.79
Solve problems involving percents 2.30 2035 '
Calculate perimeters of rectangles
and trianglese
2.31
,
2.41 '
-42.80
2.01
2.76
2.97
2.35
2.15
-2.26
2.64
2.74
2.65S 2.38
1.74
1.65
1.94
2.42
2.21
1.61 -
-,2.65
1.88
2.49
2.49'
t
* indicates a s gnificant difference at the, 0.05 level among respondent groups.
de
126
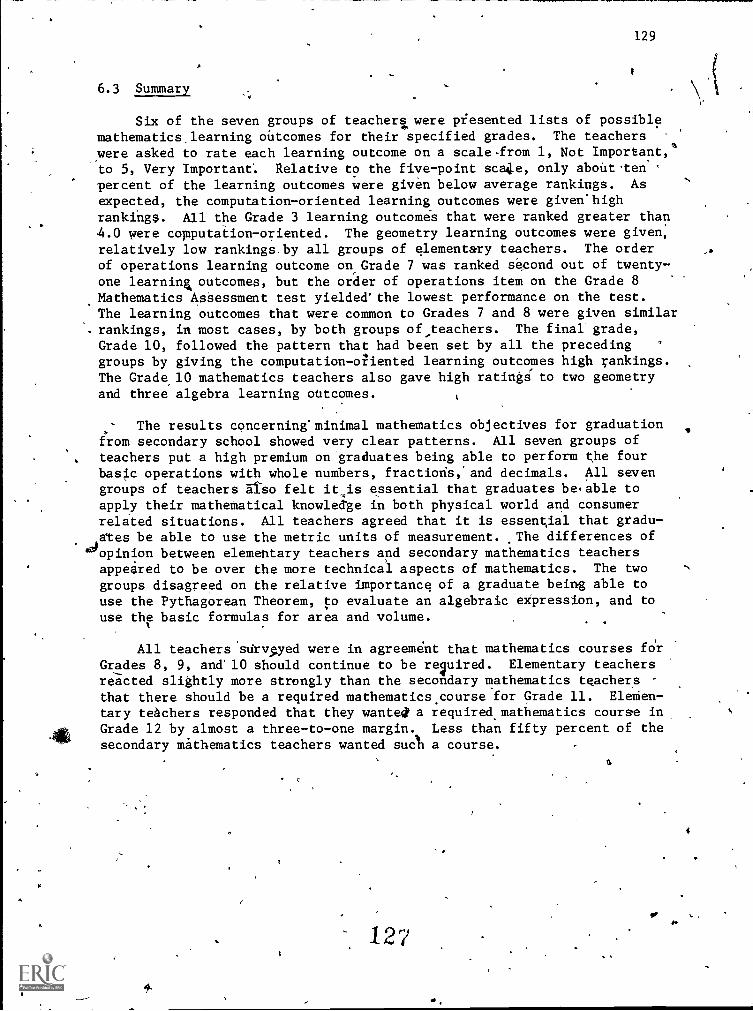
6.3 Summary
129
Six of the seven groups of teacher were piesented lists of possiblemathematics learning outcomes for their specified grades. The teacherswere asked to rate each learning outcome on a scale-from 1, Not Important,to 5, Very Important'. Relative to the five-point sca'e, only about tenpercent of the learning outcomes were given below average rankings. As
expected, the computation-oriented learning outcomes were given highrankings. All the Grade 3 learning outcomes that were ranked greater than4.0 were computation- oriented. The geometry learning outcomes were given,relatively low rankings by all groups of elementary teachers. The order
of operations learning outcome on Grade 7 was ranked second out of twenty-one learning outcomes, but the order of operations item on the Grade 8Mathematics Assessment test yielded'the lowest performance on the test.The learning outcomes that were common to Grades 7 and 8 were given similarrankings, in most cases, by both groups of,teachers. The final grade,Grade 10, followed the pattern that had been set by all the preceding '
groups by giving the computation-oftented learning outcomes high rankings.The Grade 10 mathematics teachers also gave high ratings to two geometryand three algebra learning outcomes.
The results concerning' minimal mathematics objectives for graduationfrom secondary school showed very clear patterns. All seven groups ofteachers put a high premium on graduates being able to perform the fourbasic operations with whole numbers, fractions:and decimals. All sevengroups of teachers Also felt it,is essential that graduates be,able toapply their mathematical knowledge in both physical world and consumerrelated situations. All teachers agreed that it is essential that gradu-ates be able to use the metric units of measurement. The differences of
'opinion between elementary teachers and secondary mathematics teachersappeired to be over the more technical aspects of mathematics. The twogroups disagreed on the relative importance of a graduate being able touse the Pythagorean Theorem, to evaluate an algebraic expression, and touse the basic formulas for area and volume.
All teachers surveyed were in agreement that mathematics courses fo'rGrades 8, 9, and'10 should continue to be required. Elementary teachersreacted slightly more strongly than the secondary mathematics teachersthat there should be a required mathematics, course for Grade 11. EleMen-tary teachers responded that they wanted a required_ mathematics course inGrade 12 by almost a three-to-one margin. Less than fifty percent of thesecondary mathematics teachers wanted sucl a course.
VS.
12 7
*\ -...-.
\.
I
ti
it
)
APPENDIX A
QUESTIONNAIRE FOR ELEMENTARY TEACHERS
...
.
,
128
.
,
09
c
,-"-,'-
l-L.--
.;--.,------
".
IP
1
2
If
. 1
1

ti
r
fi
BRITISH COLUMBIA LEARNING ASSESSMENT PROGRAM.
ELEMENTAgY MATHEMATICS.
A TEACHER QUESTIONNAIRE
(1) (2) (3) (4) (5)SCHOOL CODE
a
We appreciate the fact that school at the present time are so variedthat the questions posed here may not fit your school organization or philo-sophy. Where there is a lack of 'fit' between our questions and yourorganization or philosophy, please specify and. coment.i. Use the last pagefor more detailed comment. In general, we would ask tat you respond aslutly as you can.
IMPORTANT
ON THE LABEL ON THE-ENVELOPE IN WHICH YOU RECEIVEDTHIS QUESTIONNAIRE IS MARKED A GRADE/YEAR LEVELCORRESPONDING TO ONE OF THOSE BELOW. PLEASE .QHECK
THE)APPROPRIAT47 BOX AND RESPOND TO THE QUESTIONNAIREWITH THIS ONE GRADE LEVEL IN MIND, EVEN THOUGH YOUMAY ALSO TEACH OTHER LEVELS-
G!,:444/Year =1Grade/Year 3
* =2Grade/Year 5 =3Grade/Year 7 =4 (8)
ON SOME ITEMS, MORE MAN ONE CHOICE.MAY BE MARKED.SUCH ITEMS WILL BE PRECEDED BY '(MULTIPLE RESPONSEITEM)'.
129
133
0
4

9
134
r
PART I
BACKGROUND AND GENERAL INFORMATION
CHECK THE Al,PROPRIATE CATEGORY:
1. YEARS OF POST-SECONDARY EDUCATION AS CF JUNE, 1977:
1
2
4
5
6 or more
2. YEARS OF TEACHING EXPERIENCE AS OF JUNE; 1977:
1 or less
2 -5
6 9
10 - 13,
14 or more
3. (MULTIPLE RESPONSE ITtM) AT WHICH OF THE FOLLOWING LEVELS HAVE YOUTAUGHT?
Primary
Intermediate
Junior Secondary
.Senior Secondary
1
2
3
4
5
6
.1
2
3
4.
5
_ .
4. IN YOUR UNDERGRADUATE TRAINING, WAS/IS MATHEMATICS ONE OF YOUR OR SUBJECTAREAS?
Yes
No
130
111.1
1
2
PLEASE DO NOTUSE THIS SPACE
( 9 )
( 1 0)
(15)

5. .HAVE YOU COMPLETED Ai'LEAST ONE COURSE IN MATHEMATICS CONTENT BEYOND
SECONDARY GRADUATT
Yes
No
6. HAVE YOU COMPLETED AT LEAST ONE COURSE IN HOW TO TEACH MATHEMATICS .
(MATHEMATICS METHODS COURSE)?
Yesmore than 10 years ago
Yes, in the last 10 years
No
1
2
-7. (MULTIPLE RESPONSE ITEM) TO WHICH OF THE FOLLOWING ASSOCIATIONS DO YOU ',
CURRENTLY BELONG?
B,C. Association of Mathematics Teachers
Provincial Intermediate Teachers Association
B.C. Primary Teachers Association
National Councilof Teachers of Mthematics
Local MathematicsP.S.A.
71
8. HAVE YOU ATTENDED A MATHEMATICS SESSION AT A CONFERENCE'IN THE LAST
THREE YEARS?
Yes
No
11
9. HAVE YOU ATTENDED A WORKSHOP (OTHER THAN'AT A CONFERENCE) OR INSERVICE DAY
IN MATHEMATICS IN THE LAST THREE YEARS? co
Yes,
No
4.."
2
10. PLEASE MARK EACH OF THE FOLLOWING STATEMENTS ACCORDING TO HOW STRONGLY YOU
AGREE OR DISAGREE WITH EACH:
id..
StronglyAgree
a Stronglydisagree
a) Mathematics was one of my favouritesubjects as a student in College or
5 '4 3 2 1
University.
b) Mathematics is one of my favouritesubjects to teach.
5 4 3 2 1
C) Mathematics is one of the easiest subjectsfor me to teach.
5 4 3 2 1
131.
135'
(17)
(23)'
(24)
(25)
(26)
(27)
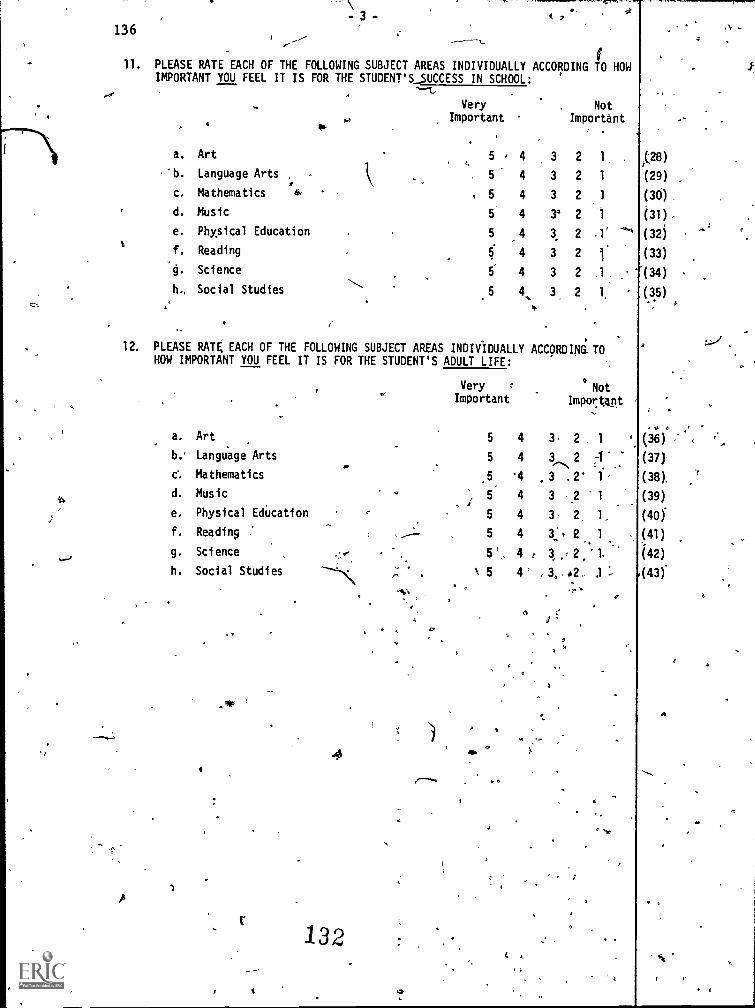
136
11. PLEASE RATE EACH OF THE FOLLOWING SUBJECT AREAS INDIVIDUALLY ACCORDING TO HOWIMPORTANT YOU FEEL IT IS FOR THE STUDENT'S_SUCCESS IN SCHOOL:
Very . NotImportant bnportapt
t
a. Art
'b. Language Arts . -
c. Mathematics '
d. Music
e. Physical Education
f. Reading
g. Science
h., Social Studies
5 4 3 24
5 4 3 2 1
5 4 3 2
5 4 34 2
5 4 3 2 .1'
4 3 2 1.
5 4 3 2 ,1 ,
5 4 3 2 1
12. PLEASE RATE. EACH OF THE FOLLOWING SUBJECT AREAS INDIVIDUALLY ACCORDING TOHOW IMPORTANT YOU FEEL IT IS FOR THE STUDENT'S ADULT LIFE:
Very : NotImportant Important
a. Art 5 4 3 2 1
b.' Language Arts 5 4 3_ 2 4"
c. Mathematics
d. Music
e. Physical Education
f. Reading :
g. Science1".
h. Social Studies
4
A
t
132
.5 '4 .3 .2' 1
5 4 3 2 1
5 4 3- 2 1,
5 4 3.2 1
5 I, 4 r 3 2,' 1.
k 5 4 , 3, .2, .1
a
o
tiC
-..A.11=WIIIINMPI.P441111.11.40.
/(;28)
(29)
(30) ,
(31)-
(32)
(33)
(34)
(35)p
(36)
(37)
(38),
(39)
(40)
(41)
(42)
(43)
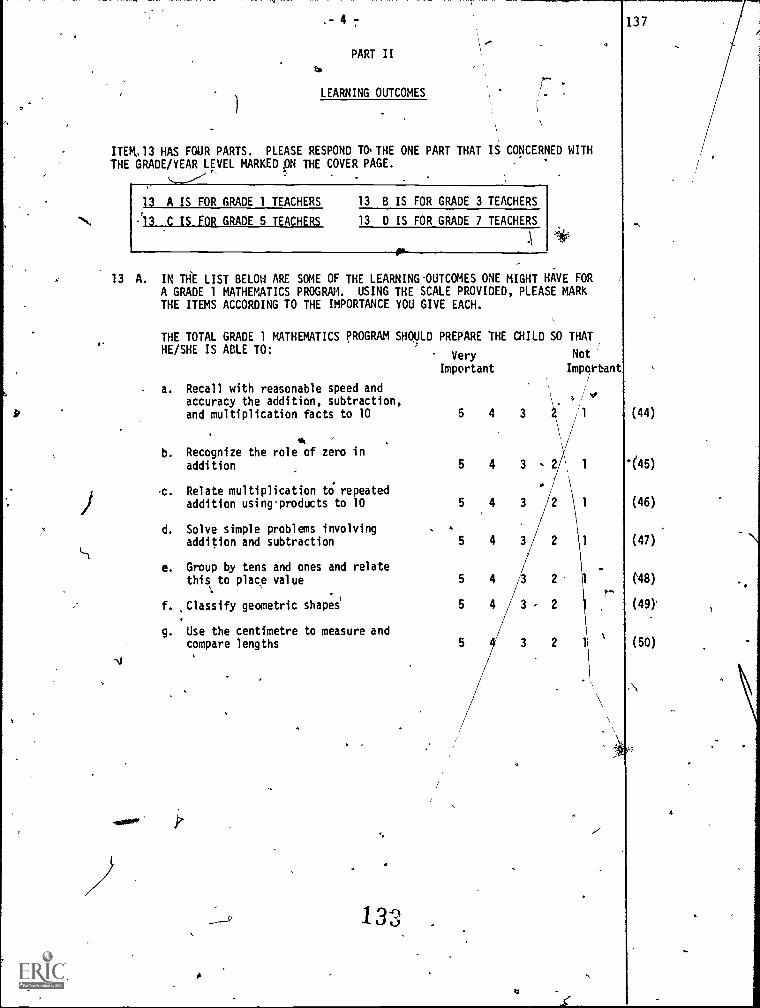
4
PART II
e.
LEARNING OUTCOMES
ITEM,13 HAS FOUR PARTS. PLEASE RESPOND TOTHE ONE PART THAT IS CONCERNED WITHTHE GRADE/YEAR LEVEL MARKED ON THE COVER PAGE.
13 A IS FOR GRADE 1 TEACHERS
-13 C IS_fOR GRADE 5 TEACHERS
13 B IS FOR GRADE 3 TEACHERS
13 D IS FOR GRADE 7 TEACHERS
A if.
13 A. IN THE LIST BELOW ARE SOME OF THE LEARNING OUTCOMES ONE MIGHT HAVE FORA GRADE 1 MATHEMATICS PROGRAt USING THE SCALE PROVIDED, PLEASE MARKTHE ITEMS ACCORDING TO THE IMPORTANCE YOU GIVE EACH.
ITHE TOTAL GRADE 1 MATHEMATICS PROGRAM SHOULD PREPARE THE CHILD SO THAT
NotHE/SHE IS ABLE TO:
a. Recall with reasonable speed andaccuracy the addition, subtraction,and multiplication facts to 10
b. Recognize the role of zero inaddition
c. Relate multiplication to repeatedaddition usingproducts to 10
d. Solve simple problems involvingaddition and subtraction
e. Group by tens and ones and relatethis to place value
f. ,Classify geometric shapes
g. Use the centimetre to measure andcompare lengths
133
Very
Important
\5 4 3
5 4 3
5 4 3
5 4 3
5 4 3
5 4 3
5 3
Important
,,, / .#
2 11
2 1
2
2
2 1
137
OS,
(44)
q45)
(46)
(47)
('48)
( 9
(50)
4

138
5
13 B. IN THE LIST BELOW ARE SOME OF THE LEARNING OUTCOMES ONE MIGHT HAVE FORA GRADE 3 MATHEMATICS PROGRAM. PLEASE MARK THE ITEMS ACCORDING TO THEIMPORTANCE YOU GIVE EACH.
THE TOTAL GRADE 3 MATHEMATICS PROGRAM SHOULD PREPARE THE CHILDSO THATHE/SHE IS ABLE TO:
to.
a. Use expanded notation in renamingnumbers to 9999
Very NotImportant Important
5 4 3 2 1
b. Round off numbers to the nearest10 or 100 5 4 3 2 1
c. Understand the place value ofnumerals to 9999
d. Read and write Roman numeralsto 12.
e. Solve addition and subtractionexamples With 2, 3 and 4 digitnumerals, with and without re,
grouping
f. Solve multipliCation examplesfor products to 50
9 Recall multiplication factsto 50
5 4 3 2 1
6: Construct simple, geometric models
of solid and plane shapes 5 4 3 2 1
i. Translate a word problem intomathematical symbols and soli/e using
appropriate operations : 5 4 3 2 1 /(59)
j. Recognize ax$A of symmetry fromexperience with concrete materials 5 4 3 2 1 (60)
k. Use graphs as a means of recording $ 4 3 2 1 (61)D I,
1., Estimate and measure capacityinmillilitresFand litres 5 4 3 2
,.. l(62)
m. Estimate and measure length in metric -0
units to kilometres'' 5 4 . 3 2/,
5 4 3 2 1
5 4 3 2 1
5 4 3 2
5 4 , 3 2 1
(53)
(54) /
(55)
(56)
(57
(58)
n. Determine mass by balancing in gramsand kilograms
0: Determine area by covering twodimensional spaces`with centimetresquares
p. Read a thermometrer in degrees Celsius
5 4 3 1
5 4
5
1
2 1
134
(63)
(64)
(65)
(66) .

. -6-
13'C. IN THE LIST BELOW ARE SOME OF THE LEARNING OUTCOMES ONE MIGHT HAVE FOR AGRADE 5 MATHEMATICS PROGRAM. PLEASE MARK THE ITEMS ACCORDING TO THEIMPORTANCE YOU GIVE EACH,
THE TOTAL GRADE 5 MATHEMATICS PROGRAM SHOULD PREPARE THE CHILD SO THATHE/SHE IS ABLE TO:
a. Re 11 basic number facts
Very
Important
5
b. Ina.cate place value of each digitof !a numeral in standard notation 5
5c. Write numbers in expanded notation
d. Regroup as required for algorithms)" 54
e. Express a number as the product of itsprime factors 5
f. Use the addition algorithm with whalenumbers, common fractions, and decim alfractions (to 100ths) 5
g. Use the subtraction algorithm withwhole numbers, common fractions anddecimal fractions (to 100ths) 5
h. Use the multiplication algorithm with4 whole numbers, common fractions and
decimal fractions (to whole number x1000ths)
i. Use the division algorithm withwhole numbers
j. Identify and list properties ofcommon three dimensional geo-metrical forms
k. Identify the circle and its parts
1. Perform experiments involvingtranslations, reflections, rotationsand flips
m. Perform imostigations and arrive atconclusions related to tiling(tessellations)
n. Use instruments to measure length,area, volume, capacity,-Mass and
5
.5
5
5
5
temperature in metric units 5
o. Construct and solve word problemsarising out of investigations
p. Ihterpret graphs
q. Construct graphs
135
5
5
5
,Not
Important
4 3 2 1
4 3 _ 2 ( 1
4 3 2 . 1
4 3 2 1
4 3 2 1
4 3 2 1
4 3 2 1
4 3 2 1
4 3 2 1
4 3 2 1
.00
4 3 2
4 3 2 1
4 3 2 '1
4 3 2 1
139
(`67)
(68)
(69)
(70)
(71)
(72)
(73)
(74)
(75)
(76)
(77).
(78)
(79)
(80)

- 7 -
140
13 0. IN THE LIST BELOW ARE SOME OF THE LEARNING OUTCOMES ONE MIGHT HAVE FORA GRADE
7 MATHEMATICS PROGRAM. PLEASE MARK THE JTEMS. ACCORDING TO THE IMPORTANCE YOU
GIVE EACH:
THE TOTALfGRADE 7 MATHEMATICS PROGRAM SHOULD PREPARE THE STUDENT SO THAT HE/5HE°'
.` _
"IS ABLE TO:Very Not
Important .Important
a. State the value _represented by each digit
in a multi-digit decimal numeral '5 4 3 2 1
b. Write a decimal numeral in expanded form usingpowiis of 101in exponeht form 5 4
c: Perform in the correct order, a calculation. involving more than one Of 4khe four basic
operations 5 4 3
d. Perform the operations of'addition,raction, multiplication and division-with
whole numbers,pcommon fractions and decimal
fractions
e. Write a whole number 8s a product of its prime
factors
3 2 1
f. Calculate the greatest common factor (GCF).
of two or more whole-turiorrs
g. Ca late the least common multiple (Q)of two more whole numbers.
h. Write sets f equivalent fractions
i. Write a'decimal numeral for a fraction numeral
and vice versa
5
5 -4
1-
lit
3 ; $ 1
3 4 .1
3
3 2 1
5 4 3 2 1
5 2
4.Write a perce(A numeral for a fraction numeral %
or a decimalenuffieFal 5 4 3 2 1 , '
k. Solve simple open sentence's
, .
1 Use a compass and straight-edge to copy an
P angle " A 4 3 2 1
m. Use a compass and straight-edge to,bisect an
-angle
n. Identify /from a diagram, or draw a diagfimillustrating acute, right and obtuse angles 5 4
5 4
o. -Use instrumepfs to measure length, area, volume,
capacity, mass and temperature in metric units 5 4 3
p. Translate word problems into open sentences 5 4 3
1
- r
q. Construct a flow chart to fit a verbaldescription of an operation or procedure 5 4 3
r. Test the appropriatentss of anzinswer to-a
problem .e. 5 4 3, --
s. Draw or interpret scale diagrams 5 4 3
t. Solve problems involving percent, 5 4 3
u. Calculate perimeters of rectangies and
triangles 1 f9
5'-- 4 3
136
2 1
2
2 1
2 '1
2) 1
-2 .1
-2' '1
(84)
(85)
(85) -1"/'
. -
(87). .°
(88)
(89)
(90)
(91) 4
(92)
(93) 2
(94)
'(95)"
N(96)
(97)
(98)
('09)
(100)^.,444. -
A

- 8 -
141
14. PLEASE CATEGORIZE EACH OF THE FOLLOWING LEARNING OUTCOMES ACCORDING TO THEIMPORTANCE YOU ATTAiH TO EACH:
STUDS HOULD BE ABLE TO:UPON plUATION FROM SECONDARY SCHOOL, EVERY
Important, but
Essential not'Essential Optional
a. Accurately perform the four basicoperations with whole numbers 3_ 2 1 (105)
b. Accurately perform the four basic...,
operations with common fractions 3 2 1 (106)
c. Accurately perform the four basicoperations, with decimal fractions 3 A 1 (107)
. 1.----
d. Use the 'basic' formulas for areaand volume 3 2
e. Use the Pythagorean theorem 3 Ci 2
f. Solve linear equations 3 2
g. Solve quadratic equations 3 2
h. Use the metric units of measurement 3 \ 2
i. Evaluate a given algebraic expression 3
. Recognize and name geometric figures
k. Apply mathethatical knowledge to
physical world situations , 3 1 )(115)
,,Nr-=malM9=wiTion
tot
2
1. Apply mathematical knowledge to
consumer relaEed situations 3 2
15. DO YOU FEEL STUDENTS SHOULD BE REQUIRED TO TAKE A MATHEMATICS COURSE (ACADEMICOR NON-ACADEMIC) IN:
k. YES . NO
a. Grade 8
b. Grade 9
c. Grade 10
d. Grade 11
e. Grade 12 .
137
2 (117)
2 (118)
2 (119)
2 (120)
2 (121)
4 , a

142
PART III
CLASSROOM ORGANIZATION
.16. HOW MANY STUDENTS DO YOU HAVE AT PRESENT IN YOUR MATHEMATICS CLASS? (122-123)
17. ON THE AVERAGE, HOW MUCH TIME DO YOU SPEND EACH DAY TEACHING MATHEMATICS?
F1Minutes
11
18. ON THEAVERAGE, ON HOW MANY DAYS A WEEK DO YOU TEACH MATHEMATICS?
One
Two
Three
Four
Five
II (124)
(1-3)
(4) °
19. ON THE AVERAGE, HOW MUCH TIME DO YOU SPEND EACH DAY ON MATHEMATICS LESSONSPREPARATION AND MARKING?
1--1E] Minutes
20. (MULTIPLE RESPONSE ITEM) WHICH OF THE FOLLOWING DESCRIBE(S) YOUR TEACHINGSITUATION?
Self-contained classroom
Team teaching
Open area (2 or more classes)
Shared workload (one teacher takes all the mathematics,
another takes all the language arts, etc.)
Other (please specify)
133:
(5-7)

- 10 -
,
21. (MULTIPLE RESPONSE ITEM) WHICH OF THE FOLLOWING DESCRIBE(S) THE, WAY INWHICH YOUR STUDENTS ARE ORGANIZED FOR MATHEMATICS INSTRUCTION?
Ability Groups
Indiv4dualized instruction
_Partially indivichlalized instruction
Total class instruction».Other (please specify)
143
22. GENERALLY SPEAKJNG, HOW FREQUENTLY DURING THEIR,MATHEMUICS INSTRUCTION
MEDOYOURgUDENTSENGAGEINEACHOFTHEFOLLOWINGAGTIVITIES.CIRCLETHE APPROPRIATE NUMERAL.
.
a. Oral work
b. Individual work
-c. Small group work
d. Solving textbobk exercises
e., Working on creative math-emetics projects
f. Teacher explanation/demonstration t
,
9. Working at activity centres
h. Drill on basic number facts
Very
Frequently Frequently
'----
.
Sometimes RarPjf
5 4 3 ;-,'.° 2
5 . 4 3.
2
5 4 3 ' 2
5 4 3 2
5 4 3 2
5 4 3 2
5 4 3 2
5 4 4 -..2
PART IV
CLASSROOM INSTRUCTION
4,-
Never
1 (18)
1 (19)
1 (20)
1 (21)
1 (22)
1 (23)
k ,(24)
1 (25)
; 23. Please rank the following five content areas of mathematics with respectto'the amount of time you spend on each in your mathematics class during.the school year:
Most timespent
a. Drill on basic number facts 5
b. Computaflon 5
c. Problem solving and applications 5 3
d. Geometry 5 4 3
e. Metric measurement 5 4 3
4
139
Least timespent
2'l
2 i
2 1
2 1
2 1
(26)
(28)
(29)
(30)

144
24. WHICH OF THE FOLLOWING BEST DESCRIBES YOUR USE OF UNITS OF MEASUREMENT IN
YOUR CLASSES OTHER THAN MATHEMATICS CLASS:
Use metric units only
Use both' metric and British units
Uses British units only.
I teach only mathematics classesa
-
25 A.
I
1
2
3
4
0 ,
PLEASE RATE THE FOLLOWING RESOURCES WITH RESPECT,TO THEIR 'USEFULNESS
IN YOUR PLANNING OF DAY-TO-DAY LESSONS OR UNITS IN MATHEMATICS:
Very Not
Useful fh, Usgful
rea. Last year's preparation 5 3 2 1
4
b. B.C. Mathematics. Curriculum Guide
c. B.C.T.F. Lesson Aids
5 3 2 1
5 4 3 2 1
d. Idea books, e.cr., Creative Mathematics,Workjobs, Activity-Oriented Mat ematics,
etc. 5 4 3 2 1
e. Ideas from in-service activities 5 4 3 2 1
f. Ideas from colleagues' 5 4 3 2 1
g. ,Ideas from university courses 5 4 3 2 1
h. Materials from your district Resource
Centre -5 4 3 2 1
1. Professional journals,.e,g,4 The B.C.
Teacher, The Arithmetic Teacher, TheThilTator, Vector, etc. 5 4 3 2 1
j. School district mathematics specialists '5 4 3 2 1
k. District supervisors 5 4 3 2 1
1. Student's mathematics-itextbook 5 4 3 2 1
m. Teachers' guidebooks accompanying the
different mathematics textbooks
n. Locklly developed curriculum guides
o. Materials obtained through broiising.iii'
teacher stores or other commercialestablishments
5 4 3 2 1
5 4 3 2 1
5 4 3 2 .3
25 B. PLEASE LIST BELOW ANY OTHER RESOURCES THAT YOU FIND PARTICULARLY USEFUL IN
YOUR PLANNING OF LESSONS.
(32)
(33)
C34)
(35)
(36)
(37)
(38)
(39)
(44)
145)
(46)

I
- 12 -,145
26. THE FOLLOWJAG, STATEMENTS REPRESENT A NUMBER OF FACTORS PURPORTED TO AFFECTMATHEMATICS INSTRUCTION. PLEASE RATE EACH FACTOR WITH THE PRIORITY YOUWOULD GIVE IT BASED ON THE.EFFECT IT HAS ON THE SUCCESS OF YOUR MATHEMATICSPROGRAM:
High kow
Priority Priority
a. Reduction -of class' size
b. Greater release time for lessonpreparation
c. More clerical assistance
d. Better library services
e. Reduction of total pupil load
5 4 3 2 1
5 4 3 2 I
5 4 3 2 1
5 4 3 2 1
0,54 3 2 1
f. Improvement of physical facilities 5 4 3 2' 1
g.' Textbooks more suited to instructionalneeds 5 . 4 3 2 1
W. Increasing time allotment for mathematics 5 4 3 72 1
i. More effective teacher education pre-service programs - 5 4 3 2 1.j More effective in-service and professionaldevelopment 5 4 3 2 1
k. More release time for in-service andprofessional development t 5 4. 3 2 1
1. Curriculum guides that offer moreassistance in the,instructional process 5 4 3 2 1
m. Ctirriculum guides that outline content inspecific terms 5 4 73 '2 1
i
n. re Learning Assistance Services
.o. ore mathematics manipulative materialsor individual classrooms
5 4' 3 2
Ability grouping of students for classes . *5
41.
I-
2 1
4 3 2 1
(47
(55'
(51,
(57:
(50
(60
(6'
(6

- 13 -
146
27. PLEASE CIRCLE THE NUMBER WHICH BEST INDICATES THE FREQUENCY WITH WHICH YOU USEEACH OF THE FOLLOWING IN YOUR MATHEMATICS CLASS:
if
Frequently
Media
Infrequently Not at all
a. Television 3 2 1
b. Films 3 2 1
c. Filmstrips (or loops) 3 2 1
d. Overhead projector 3 2
.....q
F.Opaque pr8jector 3 2
f. Chalk board 3 2
'Materials
g. Hand-held calculators 3
h. Commercially prepared handouts 3
i. Teacher-prepared handouts 3
j. Teacher-prepared games 3
k. Teacher-prepared work cards 3
1.' Base 10 blocks 3 \I
m. Cuisenaire rods 3
n. Metric equipment 3
0. Attribute blocks A 3
. p. Abacus' 3
q. Sold geometric shapes 3
r. Dice - 3
t.
(Playing cards 3
Other (please specify)
2
2
2-
2
2
2 ft
2
2
2
2
2
2
2
1
1
1
1
1
1
'1
1
Methods
u. Learning centres 2' 2 . 1
v. Individualized instruction . 3 2 1
w. Laboratories 3 2 1
x. Total class instruction 3 2 1
y. Team teaching...,-
3 2 1
z. Computer-aided instruction 3 . 2 1
28. DO YOU USE A'HAND-HELD CALCULATOR,IN YOUR OWN WORK?
Yes
No
.4
2
1
(63)
(64)
(65)
(66)
(67)
J68)
(69).
(70)
(71)
(72)
(73)
(74)
(75)
(76)
(77)
.(78)
'(79)
(80)
(81)
(82)
(83)
(84)
(85)
(86)
(87)
(88)

7. 14 -
147
29. (MULTIPLE RESPONSE ITEM) AT WHICH OF, HE FOLLOWING LEVELS DO.YOU FEEL STUDENTSSHOULD BE ALLOWED TO USE RAND-HELD CALCULATORS IN THEIR MATHEMATICS CLASSES?
At no level (Go to it 32)
Primary
Intermediate
,Junior Secondary
Senior Secondary'
*lop.
30. (MULTIPLE RESPONSE ITEM) IN WHICH OF THE FOLLOWING WAYS ARE STUDENTSALLOWED TO USE HAND-HELD CALCULATORS IN YOUR MATHEMATICS CLASS?
Students do not use hand-held calculators in my mathematicsclass
Unrestricted use
-TO check work
To shorten computation time and effort in class work
To shorten computation time and effort on tests
To shorten computation time and effort on non -testassignments
itTo shorten computation time and effort so that moreconcepts may be covered
shorten computation time and dffort so tha.t a concept maybe covered in more depth
To (kill on computation facts
To offer enrichmentlproblems
Other (please specif))
I
.[:::]
r---1
31. (MULTIPLE RESPONSE ITEM) IN WHICH OF THE FOLLOWING WAYS DO YOU MAKE USE OF'HAND -HELD CALCULATORS IN YOUR MATHEMATICS CLASS?
To do the computation so the concept can be emphasized El 1To do the computation so many more examples of a concept may
be shown ..,1To show students how to use hand -held calculatori
,
Other (please specify)
1
1
1
s 143
(89)
(90)
(91)
(92)
(93).
(94)
(95)
(96)
(97) /
(98)
(99)
(100)
(101)
(102)
(103).
(104)
(105)
(106)
(107)
(108)

148- 15 -
32A. PLEASE MARK THE FOLLOWING EVALUATION TECHNIQUES ACCORDING TO THE IMPORTANCEOF EACH IN YOUR MATHEMATICS PROGRAM:
a. Standardiied,mathematics tests
b. Teacher-prepared. tests
c. Tests prepared at. the school'astrictlevel 5 4 3 2 .1'
Very Not,
Important Important
5, ,4 3 2 1
5, 3 2 -1
CI. Tests prepared for use throughout yourscho 1 ,. 5 4 3 '2 1
e. Perfo ance on day-to-day activities 5 .4 3 2 1
f. -Teach r observations of students' work 5 4 3 2 1 vt
'. Teacher-prepared checklists 5 4 3 2 1
h. Commercially prepared inventories . 5 4 3 2 1
32B. PLEASCLIST BELOW ANY OTHER EVALUATION TECHNIQUES YOU THINK ARE IMPORTANT:
33. IS THERE A LEARNING ASSISTANCE CENTRE IN YOUR SCHOOL WHICH OFFERS ASSISTANCEIN MATHEMATICS:
Yes
No
IS THERE A RESOURCE PERSON FOR MATHEMATICS AVAILABLE TO YOU AT fHE:
a. District Level? Yes
No
b: School Level? Yes
No
111
2
2
2
'35. DOES YOUR SCHOOL HAVE A MATHEMATICS PROGRAM DESIGNED BY THE.TEACHERS IN YOURSCHOOL AS A BASIS FOR MATHEMATICS INSTRUCTION?
Yes
No
4
`144
(109)
(110)
Cr)
(118)
(120)

PART V
USE OF TEXTBOOKS
149
0A36. DO YOU USE AT LEAST ONE MATHEMATICS TEXTBOOK IN YOUR. MATHEMATICS CLASS?
Yes
No (go to last page) 2
37. WHICH ONE OF THE FOLLOWING BEST DESCRIBES YOUR USE OF TEXTBOOKS:
I use one basic textbook in my Mathemeics class
I use multiple textbooks in my mathematics class, but oneis predominantly in use
I use a.fairly even distribution of two'or more textbooksin my mathematics class
14I I
1
3
38. WHICH OF THE FOLLOWING STATEMENT,' BEST DESCRIBES WHAT YOU WOULD PREFER FORTEXTBOOK PRESCRIPTION:
There should be one prescribed mathematics textbookseries
There should be several recommended mathematics textbookseries to allow 9e teacher to choose freel 2
There should be no.prescribed mathematics textbook series t 3
I don't know 4
THERE SHOULD BE AN OUTLINE OF THE MINIMUM LEARNING OUTCOMES AT EACH-LEVELOR GRADE,T0 GUIDE THE TEACHER IN THE SELECTION OF MATHEMATICS TEXTBOOKS,MATERIALS, AND ACTIVITIES.
Agree
Disagree
I don't know
1*
2
3
40 A. (MULTIPLE RESPONSE ITEM) GRAQE 1,3 and 5 TEACHERS: IlHfCH TEXTBOOK(S)DO YOU'USE IN YOUR MATHEMATICS CLASS?
Investigating School Math irs
Project Mathematics
' Heath Elementary Mathematics
,Seeing Through Arithmetic
Other (please specify)
145
1
1
1
1
1
(121)
(122)
1123)
(124)

150-17-
40 B. (MULTIPLE RESPONSE ITEM) GRADE 7 TEACHERS:. WHICH TEXTBOOK(S) DO YOU
USE IN YOUR MATHEMATICS CLATS?
School Mathematics I
Mathematics I.
Essentials of Mathematics I
Contemporary Mathematics, Book I 1-
Other (please specify)
1
41. GENERALLY SPEAKING, HOW SATISFACTORY IS/ARE THE TEXTBOOK(S) YOU ARE USING?
Satisfactory
Not Satisfactory
Cannot say
h
42. GENERALLY SPEAKING, ABOUT HOW MUCH OF THE TEXTUAL MATERIAL -- APART
FROM THE EXERCISES -- DO YOUR STUDENTS ACTUALLY READ?
Less than 1 page out of every 5 1
1 - 2 pages out of every 5 2
°3 - 4 pages out of'every 5 3R
5 pages ouf-of every 5 44.
43. (MULTIPLE RESPONSE ITEM) WHICH OF THE FOLLOWING DESCRIBES) HOW YOU USE A,
TEXTBOOK IN YOUR MATHEMATICS CLASS?\ °
To develop anew concept-.
No1
-.eTo review concepts developed in 'Cl4ss ,, . 1
To provide exercises for drillq0 practice 1
/
Other (please speci y)i .... 1
a
o;4
44. %UCH ONE OF THE FOLLOWING BEST DESCRIBES THE AIN OF TEXTBOOK YOU PREFER:,
A TEXTBOOK WITH:
Great emphasis on skills /drill . 4
tfeater emphasis on skills/drill than cobcdoWprinciples-z-
Equal emphasis on-skills/drill and concepp/p napies
Greater emphasis on concepts/principles than 'Skills/drill
Grlat emphasis on' concepts /principles- --1-et
o t
a
146
3'
4°.
5
O
9
(10)
(11) ,
(12)
(17)

v."
d61
1.8-s
151
45 t. 'LEASE RATE THE FOLLOWING ACCORDING TO HOW IMPORTANT YOU FEEL IT IS FOR A,:'TEXTBOOK TO DO EACH:,. .
Ve0Y Not4%,..''A TEXTBOOK SHOULD ... Important Important
a ...develop concepts r-,_... 5 4 3 2 1 (18)
b. ...provide drill and practice 5 4 3 2/ 1 '(19)
c. ...provide enrichment material 5 4 3 2 1 (20)
d. ...motivate the student 5 4 3 2 1 (21,
e: ...provide remedial material 5 4 3 2 1 (22)
45 B. PLEASE LIST BELOW ANYTHING ELSE YOU FEEL A TEXTBOOK SHOULD DO:
46 A. PLEASE RATE THE FOLLOWING ACCORDING TO HOW IMPORTANT YOU FEEL IT IS FOR THETEACHERS' EDITION OF A MATHEMATICS TEXTBOOK TO PROVIDE EACH:
..s
THE TEACHERS' EDITION OF A MATHEMATICS TEXTBOOK SHOULD PROVIDE ...
Very Not
Important Important.
a. ...lesson objectivesor 5 4 3 2 1 (23)
b. ...suggested discussion for lesson 5 4 3 2 1 (24)
c. ...development of the lesson's mathematicscontent 5 4 3 2 1 (25)
d. ...exercise answers at end of text 5 4 3 2 1 ''', (26)
e. "...enrichment materials 4 5 4 3 2 .1 (27)
f. remediation materials 5 4 3 2 1 (28)(
g. ...follow-up activities 5 4 3 2 1 (29)
h. ...suggested resources 5 4 3 2 1 (30)
i. .-..achievement tests' 5 4 3 2 1 (31)
j. ...diagnostic tests° 5 4 3 2 ' 1 (32)
k. ...suggested teaching aids 5 4 3 2 1 (33)
1. ...suggested ime allocation for each topic 5 4 3 2 1 (34)
m: ...overprinted answers to exercises (printedthroughout the text) 5 4 3 2 1 (35)
46 B. PLEASE FIST BELOW ANYTHING ELSE YOU FEEL A TEACHERS' EDITION OF AMATHEMATICS TEXTBOOK SHOULD PROVIDE:
147

152
E 7 TEACHERS: GO TO ITEM 51*******************
47. GRADE 1, 3 AND 5 TEACHERS: PLEASE MARK EACH OF THE TEXTBOOKS LISTEDBELOWWITH RESPECT TO THE READING LEVEL OF THE TEXTBOOK.
Textbook
For my class, the reading level is:
I Don'tKnow Too High About Right- Too Low
a. Investigating SchoolMathematics 9 1 2 3
b. Project Mathematics 9 1 2 3
c.,
'Heath Elementary Mathematics 9 1 2 3
. *
48. GRADE 1, 3 AND 5 TEACHERS: PLEASE MARK EACH OF THE TEXTBOOKS LISTED BELOWWITH RESPECT TO THE TEXTBOOK'S SIRES
hON COMPUTATION WITH WHOLE NUMBERS.
e textbook stresses computation with' whole numbers:
I Don'tKnow Too Much About Right Too jLi ttl e
a. Investigating SchoolMathematics 9 1
b. Project Mathematics 9 1
c, Heath Elementary Mathematics 9 1
3
3
3
49. GRADE 1, 3 AND 5 TEACHERS: PLEASE MARK EACH OF THE TEXTBOOKS LISTED BELOW
WITH RESPECT TO THE TEXTBOOK'S STRESS ON PROBLEM SOLVING:
1
The textbook stresses or6lalem solving:
I Don'tKnow Too Much About Right Too Little
. a. Investigating School .
Mathematics 9
li7 Project Mathematics 9
-- c. Heath Elementary Mathematics 9
1
1
1
(36)
(37)
(38)
2 3 (42)
3 ' (43)
2 3 (44)
50. GRADE 1, 3 AND 5 TEACHERS: PLEASE MARK EACH OF THE TEXTBOOKS LISTED BELOWWITH RESPECT TO THE TEXTBOOK'S STRESS ON METRIC MEASUREMENT.
The textbook stresses \etric measurement:
I Don't
a., Investigating School.Mathematics
Know Too Much About Right Too Little
9 : 12 3
b. Project Mathematics 9 1 2 3
c. Heath Elementary Matfiematics 9 1 . 2 3
148
(45) -
(46)
(47)

-20-
153
51. GRADE 7 TEACHERS: PLEASE MARK EACH OF THE TEXTBOOKS LISTED BELOW WITH
RESPECT TO THE READING LEVEL OF THE TEXTBOOK.
For my class the reading level is:
.
I Don't
Know Too High About Right Too Low
$.
a. School mathematics I 9 1 2 3, (48)
b. Mathematics I 9 1 2 ' 3 (49)
c. Essentials of Mathematics I 9 1 2 3 (50)
52., GRADE 7 PLEASE MARK EACH OF THE TEXTBOOKS LISTED BELOW WITH.WIT
RESPECT T THE TEXTBOOK'S STRESS ON COMPUTATION WITH WHOLE NUMBERS.
The textbook stresses computation withwhole numbers:
I Don't
Know Too Much About Right Too Little
...
' -- a. SchoolMdthematics 1 9 1 2 3 (51)
b. Mathematics I 9 1 2, 3 (52)
e: Essentials of Mathematit5-T 9 1 2 3 (53)
11 53. GRADE 7 TEACHERS: PLEASE MARK EACH OF THE TEXTBOOKS LISTED BELOW WITH
RESPECT TO THE TEXTBOOK'S STRESS ON PROBLEM SOLVING. /-*The textbook stresseslproblentsolving:
I Don'tKnow
a. School Mathematics I 9
b. Mathematics I 9
c. Essentials of Mathematics I 9
Illbo Much About Right Too Little
1 . 2 3 (54)
1 2 3 (55)-
1 ' 2 3 (56)
..4
54. GRADE,7 TEACHERS: PLEASE MARK EACH OF THE TEXTBOOKS LISTED BELOW WITH 4
RESPECT TO THE TEXT-BOOK'S STRESS ON METRIC MEASUREMENT.`
The textbook stresses metric measurement:
I Don'tKnow Too Much About Right Too Little
a. School Mathematics I 9 1 2
b. Mathematics I 9 1 2
c. -Essentials of Mathematics- I '9 1 2
.149
3 (57
3 . ( (58)
3.. (59)
ac.

v--
4
1. 1454.
THANK YOU VERY MUCH for cooperating by giving the time and effor'tcomplete the questionnaire.
If you wish to provide further informat on concerning your aims, methods, orproblems not covered in this questionnaire, please use the 'space below:
1
necessary -to
er
COMMENT:
,3
O'
0
150
r
6
C
(C) Ministry of Education;. Province of Bntish Cblumbio

I
aDa
a
1
4..
APPENDIX B
QUESTIONNAIRE FOR SECONDARY TEACHERS
-.
r

r
I
(1) (2) .(3) (4) (5)
SCFIOOL CODE
BRITISH COLUMBIA LEARNING ASSESSMENT PROGRAM
SECONDARY MATHEMATICS
A TEACHER QUESTIONNAIRE
We appreciatethe fact that school programs at the present tint areso varied that the questions. posed here may not fit' your schoolorganization or philosophy. Where there is a lack,of ',fit' betweenour questions and your organization or philosophy, please specify andcomment. Use the last page for more detailed comment. In general, we
would ask hat you respond as fully as you can:._..
IMPORTANT
. ON THE LABEL ON THE ENVELOPE IN WHICH YOU RECEIVEDTHIS QUESTIONNAIRE IS MARKED A GRADE/YEAR I.EVELCORRESPONDING TO-ONE OF THOSE BELOW. PLEASE CHECKTHE APPROPRIATE' BOX AND RESPOND TO THE QUESTIONNAIREWITH MIS ONE LEVEL IN MIND, EVEN THOUGH YOU MAYALSO TEACH OTHER LEVELS.
Mathemftits-Gra6 1
Mathematits Grade 10 2
Mathematics Grade 12 3 (8)
ON SOME ITEMS, MORE THAN ONE CHOICE MAY BE MARKEDSUCH ITEMS WILL BE PRECEDED BY '(MULTIPLE RESPONSEITEM)'.
150
". 157
g.
°
p

158
PART I
BACKGROUND AND GENERAL INFORMATION
'PLEASE CHECK THE APPROPRIATE CATEGORY:
VI
1." YEARS OF POST-SECONDARY EDUCATION AS OF JUNE, 1977:
1
2
3
4
5
6 or more
2. YEARS OF TEACHING EXPERIENCE AS OF JUNE, 1977:
1 or less
2 -5
6 -9
10 - 13
14 or more
1
2
,4
5
6
1
2
3
4
5
3. (MULTIPLE RESPONSE ITEM) AT WHICH OF THE FOLLOWING LEVELSHAVE YOU TAUGHT?
Primary
Intermediate
Junior Secondary
Senior Secondary -#
1
4. IN YOUR UNDERGRADUATE TRAINING WAS MATHEMATICS ONE OF YOUR MAJOR SUBJECT
AREAS?
Yes (Go to item 6)
No
5. HAVE YOU COMPLETED AT LEAST ONE COURSE IN MATHEMATICS CONTENT BEYOND
SECONDARY GRADUATION?
Yes %11.***ft
INo
4
153.
1
1
PLEASE DOUSE THIS
(9)
( 1 0 )
(15)
(16)
L.

1-.
6. HAVE YOU COMPLETED AT LEAST ONE COURSE IN HOW TO TEACH MATHEMATICS(MATHEMATICS METHODS COURSE)?
Yes, more than 10 years ago
Yes, in the last 1Q years
No
r-.1
3 (17)
159
7. (MULTIPLE RESPONSE ITEM) TO WISH OF THE FOLLOWING ASSOCIATIONS DO YOUCURRENTLY BELONG?
B.C. Association of Mathematics Teachers
National Council of Teachers of Mathematics '
Local Mathematics .P.S.A.
1
1
8, HAVE YOU ATTENDED AliATHEMATICS SESSION AT A CONFERENCEIN THE LAST THREEYEARS?
Yes,
. No
1
2
9. HAVE YOU ATTENDED A WORKSHOP (OTHER.THAN AT A CONFERENCE) OR IN-SERVICEDAY IN MATHEMATICS IN THE LAST THREE YEARS?
Yes
No
.1111
2 (22)
(18).
(19)
(20)
(21)
THE FINAL FOUR ITEMS IN PART I ARE CONCERNED WITH MORE THAN THE GRADE/YEAR LEVELMATHEMATICS CLASS YOU MARKED ON THE COVER OF THISAESTIONNAIRE.
.
10. PLEASE MARK THE. SCALE BELOW ACCORDING TO HOW EASY OR DIFFICULT YOU FINDTEACHING MATHEMATICS AT EACH OF THE FOLLOWING GRADE LEVELS?
No Experience Easy to TeachAt This Level At This,Level
5 4a. Grade 8 9
b. Grade 9 9 5 4 3 2 1
c. Grade 10 9 5 4 3 2 1
d. Grade II 9 5 4 3 2 1
e. Grade 12 9 5 3' 2 1
Difficult toTeach at This
,3 1 Level
154
423)
(24)
(25)
(26)
(27)
PI°

I.
160
11.. PLEASE MARK Tl CALE BELOW ACCORDING TO WHETHER YOU ENJOY OR DO NOT ENJOY
TEACHING MATHEMATICS.AT EACH OF THE FOLLOWING GRADE LEVELS:
Do Not Enjoy
No Experience Enjoy Teaching Teaching At
At This Level , At This Level This Level
a. Grade 8 9 5 4 3 2 . 1
b. Grade 9 . 95.
4 3 2 1
c. Grade 30 9 5 4 3 2 1
d, Grade 11 9 5 4. 3 2 1
e. Grade 1.
9 * 5 4 3 2 1
4
12. PLEASE RATE EACH OF THE FOLLOWING SUBJECT AREAS INDIVIDUALLY CCORDING TO
HOW IMPORTANT YOU FEEL IT IS FORA STUDENT'S SUCCESS. IN SCHOO :
a. Business Education
.b. English
c. Fine Arts-1
4. Mathematics,
e. Music
f. Physical Education
g. Readirig
h. Science
I. Social Studbies,. .
j. Vocational-Tcation
-
Very Not
Important Important
5 4 3 2 1
'5 4 3 2 1
5 4 3 ,2 1
5 4 3 2 1
5. 4 45 3 2. 1
5 I 3 2 1
'5 4 3' ..f2 1
'5 4 2 1
5 4 3 .2 1
5 4 3 2 1
4 St
13. PLEASE RATE EACH OF THE FOLLOWING SUBJECT AREAS INDIVIDUALLY ACCORDING TO
HOW IMPORTANT YOU1EEL, II-IS FOR THE STUDENT'S ADULT LIFE: 0
Very Not,V Important Important
a. Business Ed cation
b., English
c. Fineshrts
d. Mathematics
e. Musit
,f. Physical Education
g. Reading
h. Science
i. Social Studies
Vocational Education
5'. C4 3 2 1
5 4e 3 2 1
5 4 a 2 1
5 4 3 2 1
5 4 3 2
5 4 3 2 1
5 4 3 ? V
5 4 3 2 1, .
5 4 3 2
-5 4 3 '2 ,
155
(28)
(24)
(30)
(31)
(32)
(33)
(34)
(39
(36)
(37)
(38)
(39)
(40)
(41)
(42)
(43)
(44)
(45)
(46)
(47)
(48)
(49)
(50)
(51)
(52)'

** * * * * * * * * * * * * * * * * * * * * * * ** *GRADE 12 TEACHERS: GO TO ITEM 15*************************t
ITEM 14 HAS TWO PARTS. PLEASE RESPOND TO THE ONE PART THAT IS CONCERNED WITH THE GRADE/YEAR LEVEL YOU MARKED ON THE COVER PAGE. (14A IS FOR GRADE 8 TEACHERS AND14B IS FOR
GRADy0 TEACHERS)
14 A. IN'THE LIST BELOW ARE SOME OF DE LEARNING OUTCOMES ONE MIGHT EXPECT OF A GRADE
8 MATHEMATICS PROGRAM. USING THE SCALE PROVIDED, PLEASE MARK THE ITEMS
ACCORDING TO THE IMPORTANCE YOU GIVE EACH.
- THE TOTAL GRADE 8MATHEMATICS PROGRAM SHOULD PREPARE EACH STUDENT SO THAT
HE/SHE IS ABLE TO:
a. Use set
Very Not
4- ImportantImpor,tant;
. 5
b. State the value represented by each digit in amulti-digit decimal numeral 5
c. Write decimal numerals in expanded form using
powers of ten in exponent form 5
d. Write decimal numerals ,in scientific notation 5
e., Perform the four basic operations with wholenumbers, common &Actions; and decimal fractions 5
f. Perform the four basic operations with integers 5.
g. Round a decimal numeral to a specified place value 5
°h. __Write a whole number as a product of its prime-factors 5
i. Calculate the GCF of two or more numbers 5
j. Calculate the LCM of two or more numbers 5
k. Write a decimal numeral, fraction numheral 1-andpercent numeral for any number given in one 'ofthe three forms 5
1. Use a table to find the approximate squareroot of a number 5
m. , Perform, in conventional order,'a calculationinvolving a series of operations 5
.1 n, Solve simple open sentences 5
o. Use a compass and straight-edge to bisect an/ angle art bisect a line segment 5
p., Use a compass and straight-edgelo constructa perpendicular to line from a point not on tileline and parallel to a line through a given point 5
q. Use the Pythagorean. theorem to calculate any -side a right triangle 5
r. Translate verbal problems into open'senlenes 5
s. Construct flow chart to fit a verbal'description
, 5
t. Test the appropriateness of an answer to aproblem 5
u. Draw.or interpret scale drawings
v. Solve,problems involving percent 5
w. Calculate perimeters and areas of circles,rectanglef and triangles 5
156
4
4
4
4
3
3
3
3
2
2
2
z.
/
1
1
1
4 3 2 1 J
4 3 2 l'
4 3 2 1
4 3 2 1
4 3 2 1
4 3 2 41
4 3 2 1
4 3 2
4 3 2 -1
4 3 2 1
4 3 2 ,1
4 3 2 1
4 3 2 1
4 3 2 1
4 3 2 '° 1
4 3 2 1
4 3 2 1
4 3 2 1
-4 3 2 . 1"
161
(53)
(54)
(55)
(56)
(57)
(58)
(59)
(60)
(61)
(62)
:07e'
(63)
(64)
(65) ,
(66)
(67) .0
(68)
(69)
(70)
('71)
(72)
(73)
(70
(75)

. 162
14 B. IN THE LIST'BECOW ARE SOME OF THE LEARNING OUTCOMES ONE MIGHT HAVE FOR A GRADE10 MATHEMATICS PROGRAM. PLEASE MARK THE ITEMS ACCORDING TO THE IMPORTANCE YOU
GIVE EACH:
THE TOTAL GRADE 10 MATHEMATICS PROGRAM SHOULD PREPARE THE STUDENT SO THATHE/SHE ABLE TO:
Very NotImportant Important
5 '4. 3 2 1 (76).
(77)
a. Perform the four basic operatiohs with wholenumbers, common fractions, decimal fractions
b. Perform the four basic operations with integers 5 4 3 2 1
c.'.Write a decimal numeral, fraction numeral, and4ercent numeral far any number given in one of nthe three forms 5 4 .-3 2 l' (78)
d. Distinguish between rational and irrational
...numbers by their decimal forms 5 4 '3 2 1 (19)
e. Calculate products and quotients usingscientific notation 5 4 3' 2 1 (80)
f. Use the axioms of the real numbers 5 , 4 3 2 1 (81)
g. Use the laws 'of exponents in simplifyingexpressions with integral expone 5' 4 3 2 1 (82)
,h. Add and multiply polynomials ,5 ' 4 3 2 1 (83)
i. Divide a given polynomial by (linear) binomial . 5 4 3 2 1 (84)
j. Write the sqUare of any binomial as a trinomial 5 4 3 2 1 (85
k. Factor quadratic trinomial 5' 4 3 2 1 (86)
ir .
l,
1. Solv systems of linear equations 5 4 3 12 1 (87)
m. Solve word problems algebraically 5 4 3 2 1 (88)
n. Given an equation .in two varjables, graph the
r equation in the coordinate plane
o. talculate ow side of a right:angled triangle::given the other two Odes
, 5 3 2 1 (90)
p. Determine whether two triangles are similar 5,_ 4' 3 "2: 1 (91)
q. Specify the sine, cosine,'and tangent of anacute angle as theratio of two sides of a righttriangle N-----
. 5 ,4 3 2 1 (92)
r. talculateCibe resultant vector for two given .
vettors by i scale diagram . 5 4. 3 2 1 (93).
5. Solve problems involving simple interest 5 4 3 2 .1 (94)
t. Explain the meaning of compound interest 5 4 3. 2 1 (95)
u. Explain the nature ofannuities 5 4 3 2 1 (96).
v: Calculate the true rate of interest in inst e t
payments when given the formula t 4 3 , 2 1 (97)
W. Use elementary BASIC as a programing language ---..
to write, execute, and debug simple programs , 5 4 3 2 1 ° (98)
*0
5* 4 3 2 1 (89)
157

- 6 -
15. IN THE LIST BELOW ARE SOME OF THE LEARNING OUTCOMES FOR THE ELEMENTARY SCHOOLMATHEMATICS PROGRAM ONE MIGHT WANT A STUDENT ENTERING GRADE 8 TO HAVE.ALL TEACHERS: PLEASE MARK THE ITEMS ACCORDING TO THE IMPORTANCE YOU GIVE EACH.
THE TOTAL ELEMENTARY SCHOOL MATHEMATICS PROGRAM SHOULD PREPARE THE STUDENT SOt THAT HE/SHE IS ABLE* TO:
Important, but
Essential not Essential Optional
a. State the value represented by each digit\in a multi-digit decimal numeral 3
b. Write a decimal numeral in expanded form 1
10 in expOnent form 3
cl Perform in he correct order., a Cale ationinvolving more than one of the four basic -
operations 3
d. Perform the operations of addition, sub-traction, multiplication and division with
' whole common fractions, and decimalnumbers,ractions 0
'3
e. White a whole number as a product of its'owprime factors 3
. ' .
f. Calculate thegreatest common factor (GCF)of two or more whole numbers 3
g. Calculate the least common multiple (LCM) oftwo or more whole numbers ' 3
h. Write sets of equivalent fractions 3
i. Writea decimal numeral for a fractionnumeral or vice versa . 3
j. Writea percent numeral fOr a fractionnumeral or a decimal numeral 3
k. Solve tiMple open sentences 32 at
1. Use a compass and's.traight-edge to copyan angle 3
nil. Use a compass.and Itra,ight-edge to bisectan angle .
n. Identifyfrom a diagram, or draw,a diagramillustrating acute, right and obtuseangles 3
o, Use instruments to measure length, area,volume, capacity, mass, and temperaturein metric units 3
q110,
p. Translate word problems into open sentences 3
q. COnstruct a flow chart to fit a verbaldescription , 3
r. Tett the appropriateness of an answer to i e/.1a problem 3
s. Draw or interpret scale diagrams 3. .
t. Solve problems involving percent 3
,
u. Calcblate perimeters of rectangles and, triang 144 .....t 3
158
2
2
2
..
2
,
2
2
2
'2
2 .
2 e
2
2
2I
2
2
2
2
2
2
2
1
1
1.
1
1
1
1
, 1
1
1
1
1
1
1
1
14
1 634
(102)
(103) .
.(104)
(105)
(106)
(107)'
(100'
(109)
<,
(110)
(111)
(112)
(113)
(114)
(115)
(119)

164
-1-
4,
16. ALL/ TEACHERS: PLEASE CATEGORIZE EACH OF THE FOLLOWING LEARNING OUTCOMESACCORDING TO THE IMPORTANCE YOU ATTACH TO EACH.
UPON GRADUATION FROM.SECONDARY SCHOOL: EVERY STUDENT SHOULD BE ABLE TO:
,Important, but
Essential not Essential Optional
a. Accurately perform the four basicoperations with whole numbers
b. Accurately perform the four basicoperations with common fractions`
3
3
2
2
1
1
c. Accurately perform the four basicoperations with decimal fractions
cr. Use the 'basic' formulas Nr.areaand volume
3
3
2
2
1
1
e. Use the Pythagorean theorem 3 2 1.
f. Solve linear equations 3 2 1
g. Solve quadratic equations 3--------N 2L
1
h. Use the metric units of measurement,
i. Evaluate a given algebraic expression
3
3
2,
2
1
1
j. Recognize and name geometric figures
k. Apply mathematical knowledgea physical world situations
3
3
2
2
1
. 1
1. Apply mathematical knowledgeto consumer related situations 3 2 1
17. DO YOU FEEL STUDENTS SHOULD BE REQUIRED TO TAKE A MATHEMATICS COURSE
9 (ACADEMIC OR NON-ACADEMIC) IN:YES NO
a. Grade 8 1 2
b. Grade 9 2
c. Grade 10 2 tit a
d. Grade 11 2 '
e. Grade 12 2
di 1.53
D
..
(123)
(1241:1](125)
(1)
(2)
(3)
(4)
(5)'
(6)
(7)

PART III:
CLASSROOM ORGANIZATION
18. ON THE AVERAGE, HOW MANY STUDENTS0910 YOU CURRENTLY HAVE IN THE MATHEMATICS ,
CLASS(ES) AT THE GRADE/YEAR LEVEL SPECIFIED EARLIER?
1
1.
1 Minutes
20. ON THE AVERAGE, HOW MUCH TIME DO YOUSPEND EACH DAY TEACHING NON-
MATHEMATICS COURSES
1 1Minutes
21. ON THE'AVERAGE, HOW MUCH TIME DO'YOi 1END EACH 0 ON MATHEMATICS LESSON
PREPARATION?
1 1 Minutes
`22. ON THE AVERAGE, ON HOW MANY DAYS A WEEK' MOM TEACH. MATHEMATICS?
,
One1
2
Three3
raur4
Five5
II1011.141.
23. ON THE AVERAGE, HOW MUCH TIME DO YOU:SPEND EACH DAY GRADING MATHEMATICS
ASSIGNMENTS?Minutes
24. ,(MULTIPLF-RESPONSE ITEM) ,WHICH OF THE FOLLOWING DESCRIBE(S) YOUR TEACHING. :,
SITUATION?,
Self-contained classroom
Team'teaching
Open area (two or more classes)
Other,(plqase specify)
160
166,
4
(1-5-17)
(21-23)
(24)
(25:-27)
(28)
(29)
(30)
(31)
fl

166 - 9 -
25. (MULTIPLE RESPONSOTEM) ,WHICH OF THE.FOLLOWING DESCRIBE(S) THE WAYIN WHICH OUR STUDENTS ARE ORGANIZED FOR MATHEMATICS INSTRUC10/0441,
Ability groups
Individualized instruction
Partially -individualized instruction
Total Class instruction
Other (please specify)
26. GENERALLY SPEAKI4p, HOW F.REQUERTLY WRING 71.1E MATHEMATICS INSTRUCTIONTIME DO YOUR STUDENTS ENGAGE IN EACWOF THE FOLLOWING ACTIVITIES?
Very
Frequently Frequently:
a. Oral work 5 4
b. Individual work 5 4
c. Small group work
d. Solving textbook ex-
5 4
ercises ,
e.' Working on creative
5 .4
mathematics projects
f. Teaciler explanation/
a
5 i 4.
4 demonstfhtion
V. Working at activity .
5
',4
centres
h. Drill on arithmetit
5 4
.computation .5 4
27. PLEASERANK THE FOLLOWINGTO THE AMOUNT OF TIME YOUTHE SCHOOL YEAR: .
Sometimes Rarely
3* 2
3 2
3 2
3 2
3. 2
3.
3
3
'2
2
2
PART IV
CLASSROOM INSTRUCTION
FIVE'CONTENT AREAS OF MATHEMATICS WITH.RESPECTSPEND ON EACH IN YOUR MATHEMATICS CLASS DURING
, Most TimeSpent
a. Drill on artthmetiit computation 5 4
b. Problem ,solving and applications«
5 4
GeometiY 5 4
d. Metric measuremenw 5. 4411.
e.,,Algebra.ic concepts 5 4
28. WNICH OF THE FOLLOWING BEST DESCRIBES YOUR USE OF UNITS OF MEASUREMENT INYOUR CLASSES?
.A
-I.
Use metric units only
Use both metric and Bri4ish unit
Use British unitsonly
Never
'Least TimeSpent'
3 .2 l-
3 2 1
3 2 1
3 2 1
3 2 1
t..
161
1
1
1
1
1
1
1
\(32)
`433)
(34)
(35)
(66)
4\
(37)
(38) \
(39) -
(40).
(41)
(42)
(43)
(44)
(45)
(46)
f47)
(48)
(49)
(50)

I- :
29 A. PLEASE RATE THE FOLLOWING RESOURCES WITH RESPECT TO THEIR USEFULNESSIN Y0.11 PLANNING OF DAY-TO-DAY LESSONS OR UNITS IN MOREMATICS:
a. Lastyear'spreparation
b. B.C. MathemalUseCurriculum Guide
c. B.C.T.F. Lesson Aids
d. The provincially adopted textbooks.fo"rthe students
e. The teachers' guidebook accompanyingthe provincially adopVd textbooks
f. Mathematim books which are notprovincially adopted
g. .Mathematics books which are nottextbooks
h. Ideas-from in-service program's
i. Ideas from universjtkcourses
j. Materials from your lqstrict ResourceCentre
k. Professional journals; e.jto
The B.C. Teacher, The MathematicsTeacher, Vector, etc.
1. School. district mathematics specialists
m. District supervisors
n. Locally developed curriculum guides.
o. 'Material obtained through browsing inteacher stores or other commercial
establishments
Very Not
Useful , Useful
5 . 4
5 4
5- 4
5' 4
5 ,4
3 2 1
3 2 1
3 2 1
-3 2 1,
3 2 1
3 2 1
4 3 2 t
4 3 2 1
5 4 3 2 1
5 4 3 -2 1
5 4 3 2 1
5 4 3 2
5 4 3 2 1
5 4 3 1' 1
5 3 2 1
29 B._ PLEASE LIST BELOW ANY OTHER RESOURCES YOU FIND USEFUL IN YOUR LESSON ,
PLANNING:
30. PLEASE CIRCLE THE. NUMBER wHip BEST INDICATES THE FREQUENCY WITH WHICH YOU USE 1EACWOF l'HE FOLLOWING IN YOUR MATHEMATICS CLASS:
Media
a.
-b.
e.
&e.7
f.
Frequently Infrequently Not At All
i 2 1
2 1
2 1
2 1
2 1
2 14.
Television 4 3
Films- 3
Filmstrips (or loops) 3
Overhead projector 3
Opaque protector 3
Chalk board 3
162
167
(51)
(52)
(53)
(54)
-(55)
(56)
(57)
(58)
(59)
(60)
(65)
(66)
(§7)
(188)
(69)
170)
(71)

30. Materials
,g. Hand-held calculators
h, Commercially i\repared handouts
i. Teacher-prepald handouts
J. Teacher-prepared games
k. Teacher-prepared. work cards
1. Metric' equipment'..
m. Computer
n.' Slide rules
o. Other (please specify)
Methods
P.
q.
r.
s.
t.
u.
Learning centres
Individualized-instruction
Laboratories
Total class instruction
Team teaching
Computer aided instruction
Frequently
3
3
3
3
3
, 3
3
3 ,
3
3
3
3
Infrequently
-22
2
2
2
2
2
2
2
.22
2
2
2
Not:At All
1
1
1
1
1
1
1
1
1
1
1
1
1
a
31: THE FOLLOWING STATEMENTS REPRESENTJA NUMBER OF FACTORS PURPORTED TO AFFECT
MATHEMATICS INSTRUCTION. PLEASE RATE EACH FACTOR WITH THE PRIORITY YOU WOULDGIVE IT BASED ON THE EFFECT IT HAS ON THE SUCCESS OF YOUR MATHEMATICS PROGRAM.
00.
a.
b.
c.
d.
e.
f.
9.
h.
Reduction of class size
Greater release time for lesson preparation
More clerical assistance
Better library services
Reduction of total pupil load
Impr&eMerit of physical facilities
Textbooks more suited to instructional needs
Increasing time allotment for mathematics
i. More effective teacher education pre- service
programs ( 5 4
Morereffective in-service and professional
development .
k. More release time for in-service and pro-fessional development 5 4
1. Curriculum guides that offer more assistance4in the instructional process, ... 5
m. Curriculum guides that outline content inspecific terms - 4 5 4
n. More Learning Assistan e services 5 4
o. More mathematics manipulative materials forindividual classrooms
p. Ability grouping of students for classes
HighPriority
5
5
5
5-
5
5
55
4
4
4
4
4
4
4
4
5 4 3
5 4
5 4
163
LowPriority
3 2
3 2
3 2
3 2
3 2
3 g
2
3 , 2
3 2 1
2 1 *
3 2 1
3 2 1
3 2 1
3 2 1
3 2 1
: 3 2 1
(72)
(73)
(14)
(75)
(76)
(77)
(78)
(79)
(80)
(81)
(82)
83),
(84)
(8E)
186)
(87)
(88)
(89)
(9a)
(91)
(92)
(93)
(94)
(95)
(96)
(98)
(99)
A-12-
L
32. (MULTIPLE RESPONSE ITEM) IN WHICH OF THE FOLLOWING WAYS IS A COMPUTERUSED'IN.YOURgHOOL.FOR INSTRUCTIONAL- PURPOSES?
A computer is NOT used in the school (Go to Item 34)
A computer is used by a confuter club or otlier extra-
cirricular organization 1
A computer is used in some mathematics classes 1
A computer is used in some non-mathematics classes* 1
A computer is used in a computer science course 1
Other (please specify 1
33. (MULTIPLE RESPONSE ITEM-) IN WHICH OF THE FOLLOWING WAYS DO YOU MA USE 1
OF THE COMPUTER IN YOUR MATHEMATICS CLASS?
Students do nop6;se-esomputerin my mathematics class -- r---1 1 Nr
Students take a computer programming unit in.my
mathematics course 1
Students 'run' pre-written programs "
Students,use the computer to solve problems that are
part of my mathematics course 1
Students do projects using the amp ter 1
Other (please specify) 1
'34. .D0 010U USE A HAND-HELD CALCULATOR IN YOUR OWN WORK?
Yes
No
.11.1.1
35. (MULTIRLE RESPONSE ITEM) AT WHICH OF THE FOLLOWING LEVELS DO YOU FEEL.
STUDENTS SHOULD BE ALLOWED TO USE HAND-HELD CALCULATORS IN THEIR
MATHEMATICS CLASSES?
At ro level (Go to Item 38)
Primary
Intermediate
Junior Secondary
Senior Secondary
-164,
cp
in
169
(10g)
'(103)
(105).
(106)
(107)
(108)
(109)
(110)
(114)
ta.

4
170
36. (MULTIPLE RESPONSE ITEM) IN WHICH OF,THE FOLLOWING WAYS ARE STUDENTSALLOWED TO USE HAND-HELD CALCULATORS IN YOUR MATIMATICS CLASS?
Students do not use Wand-held calculators in mymathematics class
"unrestMc'ted use
To check work
To shorten computation time and effort in class work -- --
To shorten computation time and effort on tests
To shorten computation time and effort on non-testassignment's
To shorten computation time and effort so that moreconcepts may be covered
ATo shorten computation time and effort so that a conceptmay,bk covered in more depth
To drill on computation facts
Tooffer enrichment problems
Other (please specify)
1
1
1
1
1
37. (MULTIPLE' RESPONSE ITEM) IN WHICH OF THE FOLLOWING WAYS DO YOU MAKEUSE OF HAND-HELQ CALCULATORS IN YOUR MATHEMATICS.CLASS?
) .
To do the computation so the concept can be emphasized--
To do the computation so many more examples of aconcept may be shown
To show students how to use hand -held calculators
Other (please specify)
E]
38.A. PLEASE MARK THE FOLLOWING EVALUATION TECHNIQUES ACCORDING TO THE IM-PORTANCE OF EACH IN YOUR MATHEMATICS PROGRAM:
Very NotImportant Important
a, Standardized mathematics tests 5 --,7.4_: 3 2 1
..4.4b. Teacher-prepared tests 's/6 4 3 ..2 1
c. Teits prepared at the school districtlevel 5 4 3 22 1
d. Tests prepared for use throughout your-school 5 ' 4 3
I
2 1
e. Performance on'assignments , 1 ' 5 .4 ' 3 2 1
f. Teacher observations of students' work 5 4 3 2 1s's
g. Teachenzprepared checklists , 5 4' a ' - '2 1
h. Commercially prepared inventpries 5 4 ,, 3 2 1
% A
38 a. PLEASE LIST BELOW ANY'OHER EVALUATION TECHNIQUES YOU FEEL ARE IMPORTANT:
165.
(120)
(121)
(122)
(123)
(124)
(125)
.(1)
(2)
(4)
'(4)
45)
(6)
(7)
(8)
(9)
(10)
(12)
,(13)
(14)
(15)
(16)
(17)
(18)
at

- 14 -
39. IS THERE A LEARNING ASSISTANCE CENTRE IN YOUR SASSISTANCE IN/MATHEMATICS?
Yes
No
OOL WHICH OFFERS
40. IS THERE'A RESOURCE PERSON FOR MATHEMATICS AVAILABLE TO YOU AT THE:
a. District.level? Yesex
1
- lo
b. School level? Yes 1
(- No .
I
2
41.
.
DOES YOUR SCHOOL WIVE A MATHEMATICS PROGRAM DESIGNED BY THE TEACHERSYOUR SCHOOL AS A BASIS FOR MATHEMATICS INSTRUCTION?
IN
Yes 1
No 2
42. ON THE AVERAGE, ABOUT HOW MUCH OUT-OF-CLASS TIME DO YOU FEEL YOUR STUDENTSSHOULD SPEND ON YOUR MATHEMATICS ASSIGNMENTS?
None at all.
1
Less than 30 minutes per day 2
30 - 60 minutes per day rr 3"'
More than, an hour per day 4
PART V
USE OF TEXTBOOK
43. DO YOU USE AT LEAST ONE1MOTHEMATICS TEXfBOOKIN YOUR MATHEMATICS CLASS?'
. Yes (Go to the final statement on the last page) r-
No
44..: (-------- ''' ,44. WHICH ONE OF THE FOLLOWING BEST DESCRIBES YOUR USt-,OF TEXTBOOKS:
r---Th.,I use one basic textbook In my mathematics,classfi
1.___1
I use multiple textbooks in my mathematics clasi,
vi.but one is predominantly in use
,Ej 2 k,
I use a fairfy even distribution of two dr more'textbooksEris ..11 ,
'in my mathematics'Ajass) LIlli 3
C).
45. WHICH OF THE FOLLOWING STATEMENTS BEST,DESCgIBES WHAT YOU WOULD ,
-PREFER FOR TEXTBOOK PRESCRIPTION: .
. leThereshoulabe-bne prescribed.matheriatics textbook -
series A -, ")T A E 1
Thereshould be several recommended mathemotics textbook .., .
Oseries to allow the teacher toiohoose freely
There should be no rescribeemathematics text4ok series.
I don't know
171
(19)
(20)
( 21 )
(22)
,(23)
(24)
0
. -
(25),
. t.
(26}
A
.
I
4,1
Es; rJ

- 15 -
172
46. THERE SHOULD BE AN OUTLINE OF THE MINIMUM LEARNING OUTCOMES AT EACH
LEVEL OR GRADE, TO GUIDE THE TEACHER IN THE SELECTION OF MATHEMATICS
TEXTBOOKS, MATERIALS AND.ACTIVITIES.
Agree
Disagree
I don't know
2
3
ITEM 47HAS 'THREE PARTS. PLEASE RESPOND TO THE ONE PART THAT IS CONCERNED WITH
THE GRADE LEVEL YOU MARKED ON THE COVER PAGE.
47 A is for GRADE 8 TEACHERS
47 B is for GRADE 10 TEACHERS
47 C is for GRADE.12 TEACHERS
47 A: .(MULTIPLE RESPONSE ITEMS) GRADE 8 TEACHERS: WHICH TEXTBOOK(S)°00
YOUR MATHEMATICS CLASS(ES)?
YOU USE IN
1. School Mathematics II 1
2. Mathematics II 1
3. Essentials of Mathemlitics II
4. Fundamental Concepts of Elementary Mathematics 1
5.' Other(please specify).1r
, - A7.8% (MULTIPLE RESPONSE ITEMS-) GRADE 10 TEACHERS: WHICH TEXTBOOK(S) DO YOU USE
A V ... IN puR MATHEMATICS CLASS(ES)?
. ;% 6.: Mathematics' for a Modern World, Boa 2.-
' 71; Geomgtiy N- ...
-' 8. ,Athemitics: A Moder<ApProach,
i . '1 V.. froublec-Shoing Mathematics Skills$,
, ..
10. '2ssentia sorMathemattcs 3 ,
11. Moder lgebra, Bodk I.-7Module4, 5, 6
12. Mathematical PutsLits Two.N...z.
_ 4b13. quiTneis.and Contumer Mathematics -- 1
li:, Cdreer Mathematics, Lndustry and Trade ,I,.
.F. -:
,A , 'N
15... Other -(please specify) ,
.
. , ,, 1
. & (-- .
, NZ
7,e.
if',
44
1
1
1
I
r
I
-A
a
t t
A
(27)
(28)
(29)
(m)
(31)
(32)
(33)
(34)
(35)
(36)
(37)
(38)
(19)
(46) 17',
01):(42) .

- 16 -
47 C. (MULTIPLE RESPONSE ITEMS) GRADE 12 TEACHERS: WHICH TEXTBOOK(S) DO YOU USE
IN YOUR MATHEMATICS CLASS(ES)?
' 16. Modern Algebra and Trigonometry, Book 2
17. Introductibn to Calculus
18. Mathematics for a Modern World 1112
19. Using Advanced Algebra
20. Pre-Calculus Mathematics
21. Other (please specify)
_
4
48. GENERALLY SPEAKING, HOW SATISFACTORY Is'/ARE THE TEXTBOOK(S) YOU ARE
USING?
Satisfactory
Not Satisfactory
Cannot tay
173
1 (43)
1 (44)
1 (45)
1 (46)
1 (47)
1 (48)
1
2 ,
3
49. GENERALLY SPEAKI4G,,ABOUT HOW MUCH OF THE TEXTUAL MATERIAL -- APART FROM:
THE EXERCISES -- DO YOUR STUDENTS ACTUALLY READ?
Less than 1 page out,of every 5
1 - 2 pages out of every 5
3 -4 pages out of every 5 T
5 pages out of every 5
tka 50. (MULTIPLE RESPONSE ITEM) WHICH OF THE FOLLOWING DESCRIBE(S) HOW YOU
A TEXTBOOK IN YOUR MATHEMATIqS'CLASS?,
USE
To develop a new concept 1
To review concepts developed in class 1
To provide exercises for drill and practice 1
Other (please specify) 1.
51. WHICH ONE OF THE FOLLOWING BEST DESCRIBES THE KIND OF TEXTBOOK YOU PREFER?
ti '
A TEXTBOOK WITH:
Great emphasis on skills/drill 1
Greater. emphasis on skills/drill than concepts/principles= 2
Equal emphasis on skills/drill and concepts /principles 3
Greater emphasis on concepts/principles than skills/drill 4
Great emphasis on concepts/principles 5
(49)
(50)
(51)
(52)
(53)
(54)
(55)

174ti
a
52 A. PLEASE RATE THE FOLLOWING ACCORDING TO HOW IMPORTANT YOU FEEL IT IS FORA TEXTBOOK TO DO EACH.
A TEXTBOOK SHOULD ...
a. Develop concepts
b. Reinforce skills4
c: 0 Providedrill and practice
d. Proyide evichment materials
e. Motivate the student
f. 'Provide remedial material
Important
5 4
5 4
5 4
5 4
5 4,
5
NotImObtani
3 2 1
3 2 1'
3 2 1
1
2 1
13
3
52 B. PLEASE LIST BELOW ANYTHING ELSE YOU THINK. A TEXTBOOK SHOULD DO:
PLEASE RATE THE FOLLOWING ACCORDING TOTHE TEACHERS". N'OF A MATHEMATICS
THE TEACHERS' EDITIaN OF A MATHEMATICSTEXTBOOK SHOULD PROVIDE ...
HOW IMPORTANT YOU FEEL IT IS FORTEXTBOOK TO PROVIDE EACH.
VeryImportant
a. Lesson objectives .
b., Suggesteddiscussion for lesson
c.. Development Of the lesson's mathematics)content
d. Exercise answers at the end of the text
.42Enrichment materials
f. Remediation. materials
Follow -up activities
Suggested resources
Achievement, tests
Diaannstic tests
g.
h.
i.
J.
k.
1.
,m.
O
Suggested.teachingaids
Suggested time allocation for each Vic,
Overprinted exercise answers (printedthroughout the text) "e.
at
NotImportant
5 4 3 2 1
5 3 2 1
5 4 3 2 1
5 4 3 2 1'
5 4 3 2 1
5 ,t 3 1
5 4)' 3 .2 1
5 4 3 2 1
5 4 3 2 1
5 .4 3 2 1
5 4 3 2 1
5 4 3 '2
5. 4 3 2 1
53 B. PLEASE LIST BELOW ANYTHING ELSE YOU FEEL A TEACHERS' EDITION OF kMATHEMATICS TEXTBOOK SHOULD PROVIDE.
ar
. 169.
(56)
(57)
(58)
(59)
(60)
(61)
(62)
(63)
'(64)
(65)
(66)*
(67)
(68)
(69)
(70)
(71)
(72)
(73)
(74)
ar

- 18 -
GRADE 8 TEACHERS PLEASE RESPOND TO ITEMS 54 - 57
GRADE 10 TEACHERS RESPOND TO ITEMS 58 - 61
GRADE 12 TEACHERS RESPOND TO ITEMS 62 - 65
54. GRADE 8 TEACHERS: PLEASE MARK EACH.OF THE TEXTBOOKS LISTED BELOW WITH'RESPECT TO THE READING LEVEL OF THE TEXTBOOK.
FOR MY CLASS, THE READING LEVEL IS:
Cannot.Say ibo High About Right Too Low
O
a. School Mathematics II 9 1 2 3
b. Mathematics II. 9.,
2 3
c. Essentials of MathematicsII
k.,9 1 2 3
55. GRADE 8 TEACHERS: PLEASE MARK EACH OF THE TEXTBOOKS LISTED BELOW WITHRESPECT TO THE TEXTBOOKS STRESS ON COMPUTATION.
THIS TEXTBOOK STRESSES COMPUTATION:
Cannot f
.., 'Say , Too Much About Right Too Little
i
a. School Mathematics II 9 1 1 2, 3
b. Mathematics-IIZ-.9 1 2 31
.,,.
. c. Essentials of MathematicsII 9
1
2
r
56. GRADE 8 TEACHERS: ,PLEASE MARK EACH OF THE TEXTBOOKS LISTED BELOW WITHRESPECT TO THE TEXTBOOK'S STRESS ON PROBLEM SOLVING.
..THIS'TEXTBOeSTRESSES PROBLEM SOLVING:
CannotSay Too Much About Might 'Too Little
a. School Mathematics II 9 1 2 . 3
b. Mathematics II 9 1 2 3
,c. Essentials of Mathematics(,
II 9 1 2 : 3
57. GRADE 8 TEACHERS: PLEASE MARK EACH.OF THE TEXTBOOKS LISTED BELOW WITHRESPECT TO THE TEXTBOOK'S STRESS ON ENRICHMENT. 4
THIS %TEXTBOOK STRESSES ENRICHMENT:
Too..t4ticni Right Too Little#
a. School Mathematics II 9
b. Mathematics II 9 1 2
Cannotjay
2
c. Essentials'of MathematicS
4% .
i 7 o
1 . 2
3'
3
3
tk 175
(75)
(76)
(77)
(78)
(79)
(80),
(81)
(82)
(83)
to
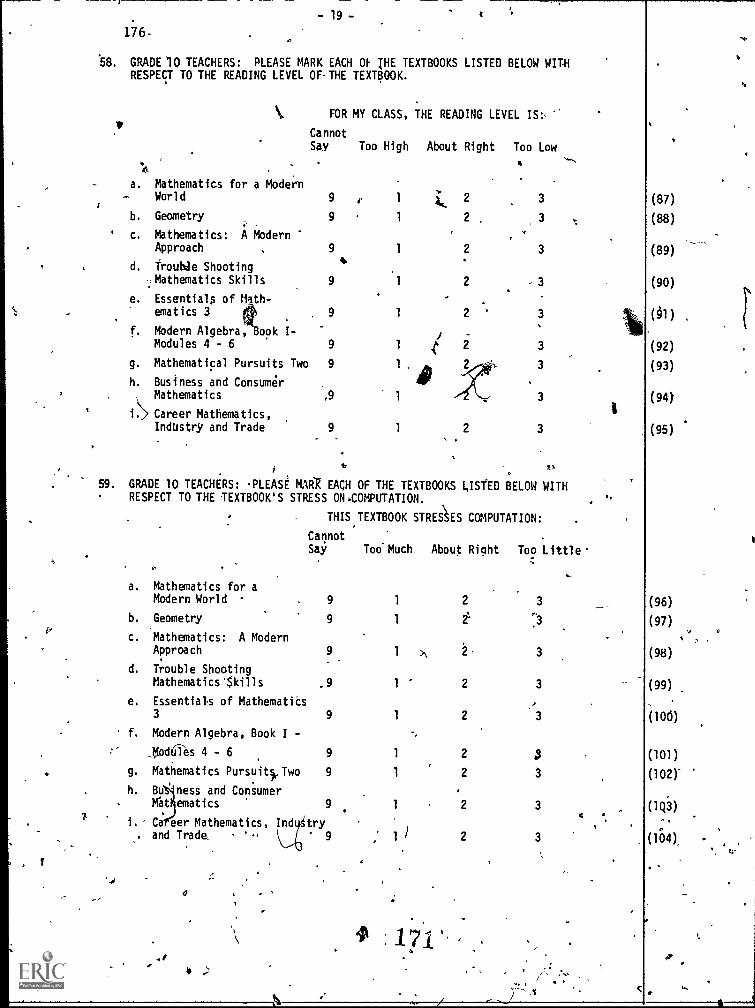
- 19 -
176-
1
8. GRADE 10 TEACHERS: PLEASE MARK EACH OF THE TEXTBOOKS LISTED BELOW WITHRESPECT TO THE READING LEVEL OFTHE TEXTBOOK.
FOR MY CLASS, THE READING LEVEL IS:
CannotSay Too High About Right Too Low
64
a. Mathematics for a ModernWorld 9
b. Geometry 9
' c. Mathematics: A ModernApproach 9
d. TroubJe Shooting,flathematics Skills 9
e. Essential$ of Math-ematics 3 9
f. Modern Algebra, ook I-Modules 4 - 6 9
g. Mathematical Pursuits Two 9
h. Business and ConsumerMathematics ,9
i> Career Mathematics,Industry and Trade 9 1 2 3
59. GRADE 10 TEACHERS: PLEASE MAR EACH OF THE TEXTBOOKS LISTED BELOW WITHRESPECT TO THE TEXTBOOK'S STRESS ON,COMPUTATION.
THIS TEXTBOOK STRESSES COMPUTATION:
I
a. Mathematics for a
CannotSay Too Much About Right Too Little.
16-
Modern World 9 1 2 3
b. Geometry
c. Mathematics: A Modern
9 1 2
Approach
d. Trouble Shooting
9.
1 >\ 2. 3
Mathematics'Skills
e. Essentials of Mathematis3
_9
9
1
1
2
2
3
f. Modern Algebra, Book I -
J016Us 4 - 6 9 1 2 $g. Mathematics Pursuit5Two
h. Bu ness and Consumer
9 1 2 3
Kat ematics 9 1 2 34
i. Ca eer Mathematics, Ind tryand Trade, 9 ; 1 1
2 3
: 171
c
(87)
(88)
(89)
(90)
(92)
(93)
(94J
(95)
(96)
(97)o
(98)
(99)
(106)
(101)
(102).
(1Q3)
(100.

- 20 -
60. GRADE '10 TEACHERS: PLEASE MARK EACH THE TEXTBOOKS LISTED BELOW WITHRESPECT TO THE TEXTBOOK'S STRESS ON PROBLEM SOLVING.
THIS TEXTBOOK STRESSES PROBLEM SOLVING:
Cannot ,
Say -Too Much bout Right Too Little
,I
a. Mathematics for a' Modern World
b. Geometry
c. Mathematics": A Modern
9
g
Approach
d. Trouble Shooting Math-
9
(.2= ematics Skills
e. Essentialt of
t....-
9
Mathematics 3
f. Modern Algebra I,Modules 4 - 6
g. Mathematical Pursuits
9
9
Two .
h. Business and Consumer
9
Mathematics
i. Career-Mathematics,Industry and Trade '
9
9
a
1 2 3
1 2 3
1 2 3
1 .2 3
1 2 3
1 2 3
1 0k 2 3
1 2 3
1 2 3
/2.
61. GRADE 10 TEACHERS: PLEASE MARK EACW, OF THE TEXTBOOKS LISTED BELOWWfTHRESPECT TO THE TEXTBOOK'S STRESS ON ENRICHMENT.
THIS'TEXTBOOK STRESSES ENRICHMENT:
CannotSay Too Much About Right Too Little
a. Mathematics for ModernWorld
b. Geometry
c. Mathematics: AModern Approach
d. Trouble Shooting,'Mathodatics Skills
e. Essentials of Mathematics3
,f. Modern Algebra I,Modules 4 1 6
g; Mathematical Pursuits, Tigo
.
h. Business and ConsumerMAhematics
,i. Career Mathematics,Industry and Trade
,
9
9) 1
9 .1
9 1
9
9
/ 33
2 3
2 3
2
.3
3
9 2 3
9 1 '2 . 3
172S.
4 ,
177
1
4

178
62. GRADE 12 TEACHERS: PLEASE MARK EACH OF THE TEXTBOOKS LISTED BELOW WITHRESPECT TO THE READING LEVEL OF THE TEXTBOOK.
F MY CLASS, THE READING LEVEL IS:
CannotSay Too High About Right Too Low
a. Modern Algebra and Trig-onometry II 9 1
b.
c.
Introduction to Calculus
Mathematics for a Modern
9 1
World 1112 1
d. Using Advanced Algebra 9 1
e. Pre-Calculus Mathematics, 9 -1
2 3
2 3
2 3
2 3
2 3
63. GRADE 12 TEACHERS: PLEASE MARK EACH OF THE TEXTBOOKS LISTED BELOW WITHRESPECT TO THE TE'XTBOOK'S STRESS ON COMPUTATION.
THE TEXTBOOK STRESSES COMPUTATION:,
CannotSay Too Much About Right Too Little
'a. Modern Algebra andTrigonometry II - 9 1 '2 3
b. Introduction to Calculus 9 1 2 . 3
c. ,Mathimatics for a Modern.,,
World 1112 7 9 1 2 3
d. sing Advanced Algebra 9 1 2 3'
6. e-Calculus Mathematics 9 1 2 3
0.
64: GRADE TEACHERS: PLEASE MARK EACH OF THE TEXTBOOKS LISTED BELOW WITHRESPECT TO THE TEXTBOOK'S STRESS-0N PROBLEM SOLVING.
THE TEXTBOOK STRESSES FROBLEM SOLVING:
CannotSay Too Much About Right Too Little
a. Modern ebrg andTrigonomet y II g 1 ' 2 ,3
b. Introducti to Calculus 9 1 2 3 °
c. Mathemktics or aModern, World% a 9 2 3
d., Using Advanced Algebra 9 1 2 3
e. Ore-Calculus Mathematics 9 1 2 3
173 0

r
-22-
65. GRADE 12 TEACHERS: PLEASE MARK EACH OF THE TEXTBOOKS LISTED BELOW WITH
RESPECT TO THE TEXTBOOK'S STRESS ON ENRICHMENT.
THE TEXTBOOK STRESSES ENRICHMENT:
CannotSay Too Much About Right Too Little
a. Modern Algebra andTrigonometry II?
b". "Introduction toCalculuS
Th
c. Mathematics for Ai:.Modern
World, 1
d. Using Advanced Algebra
e. Pre-Calculus Mathematics
9
9
9
9
1
1
1
1
1
2
2
2
e2,
3
3
,3
3
3
f
THANK YOU VERY MUCH for cooperating by giving the time and effort necessary to
complete the questionnaire.
If you wish to provide further information concerning your aims, methods,or problems not covered in this questionnaire, please use the space below.
COMMENTS:
CAXA W ST Ovstme tenons, vicronIA. 111113.1.1 COMMIS
1/4*ft
179
(14)
(15)
(16)
(17)
(18)