i appendix ii. - welcome to calfed bay-delta program · i appendix ii. this section coi ... azult...
TRANSCRIPT

i APPENDIX II.
THIS SECTION COI~AINS THE PLATES, FIGURES, ANDTABLES FEB~INENT TO PAE~S I, II, AND III OF TEETEXT.
C--0671 31(3-067131
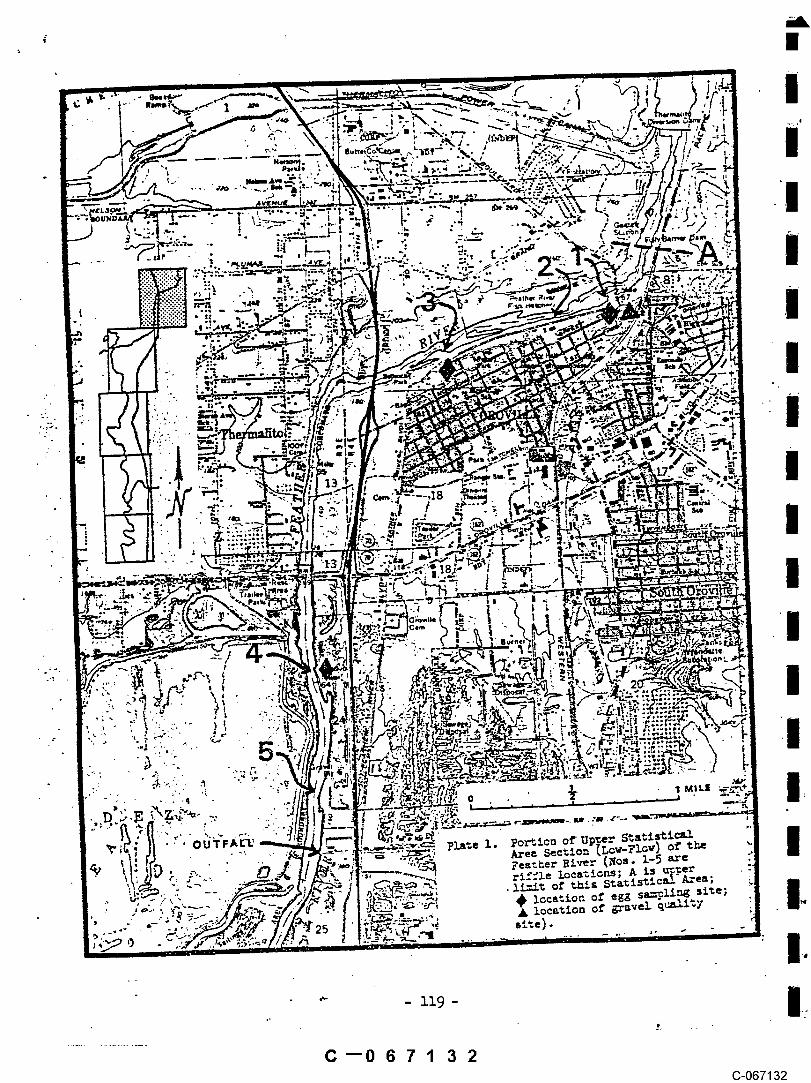
C--067132(3-067132

C--0671 35(3-067135

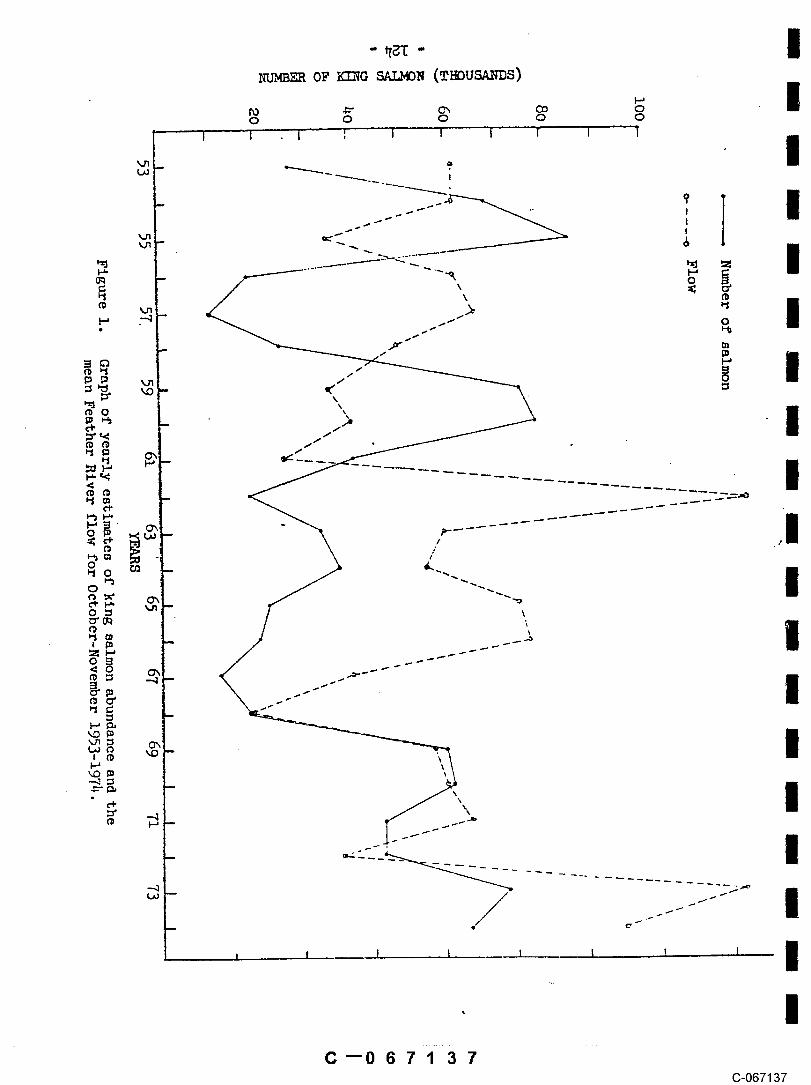
C--0671 37C-067137

-
;oo -
0 ~o-© "
°
0
~ ~o,- ..-
.
~ , 1 I I , ! I I I ! I
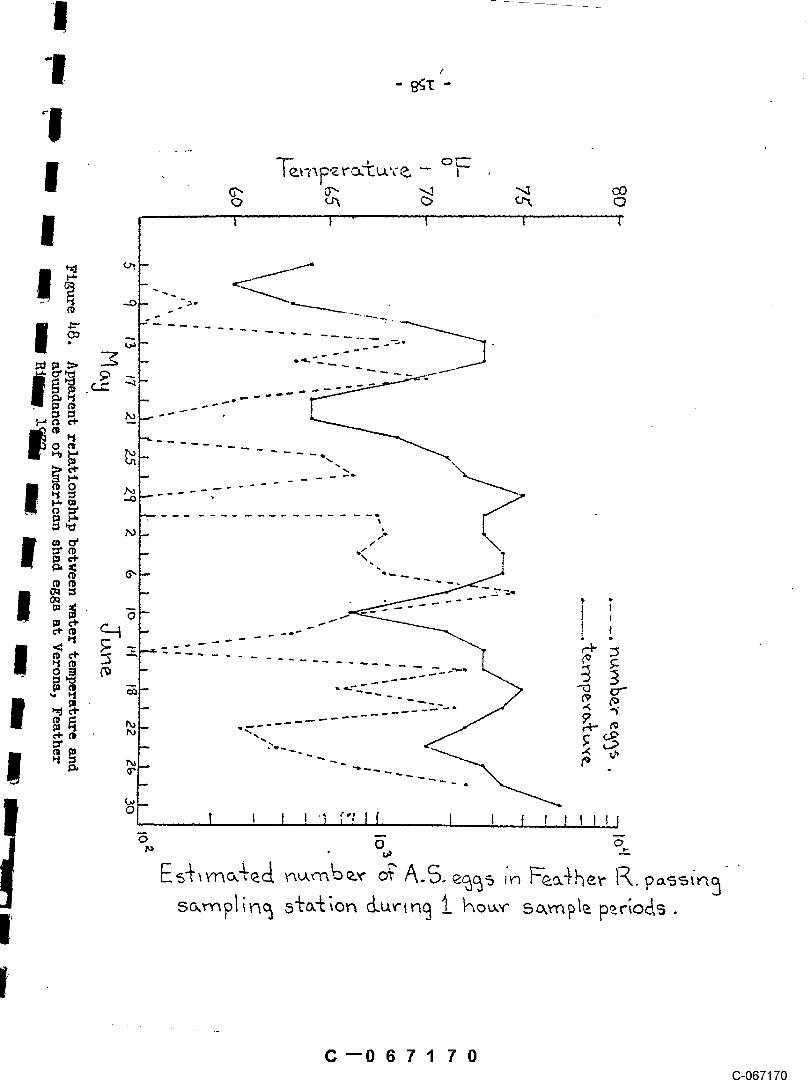
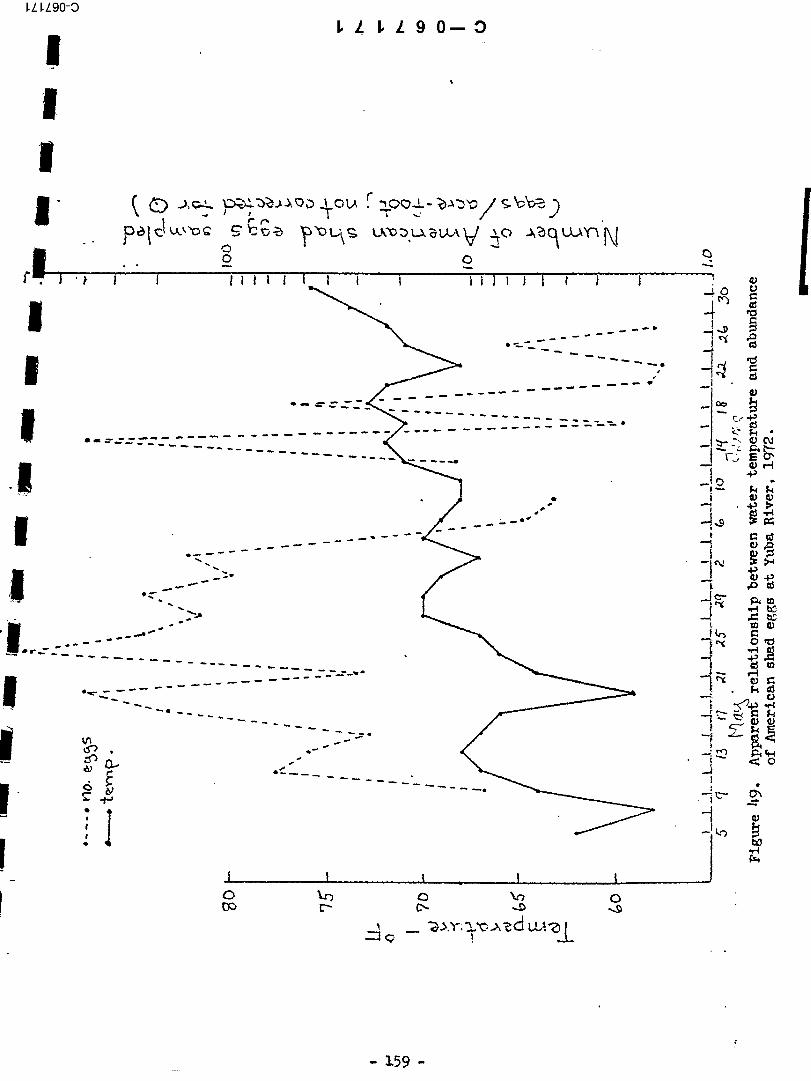
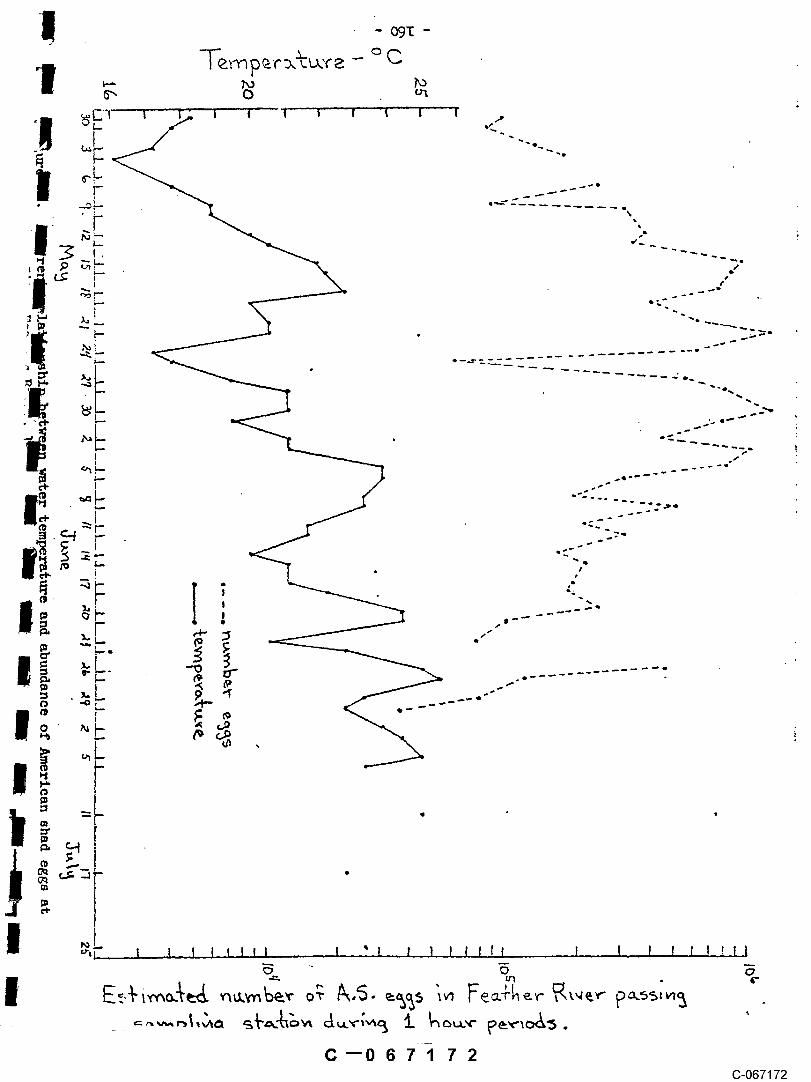
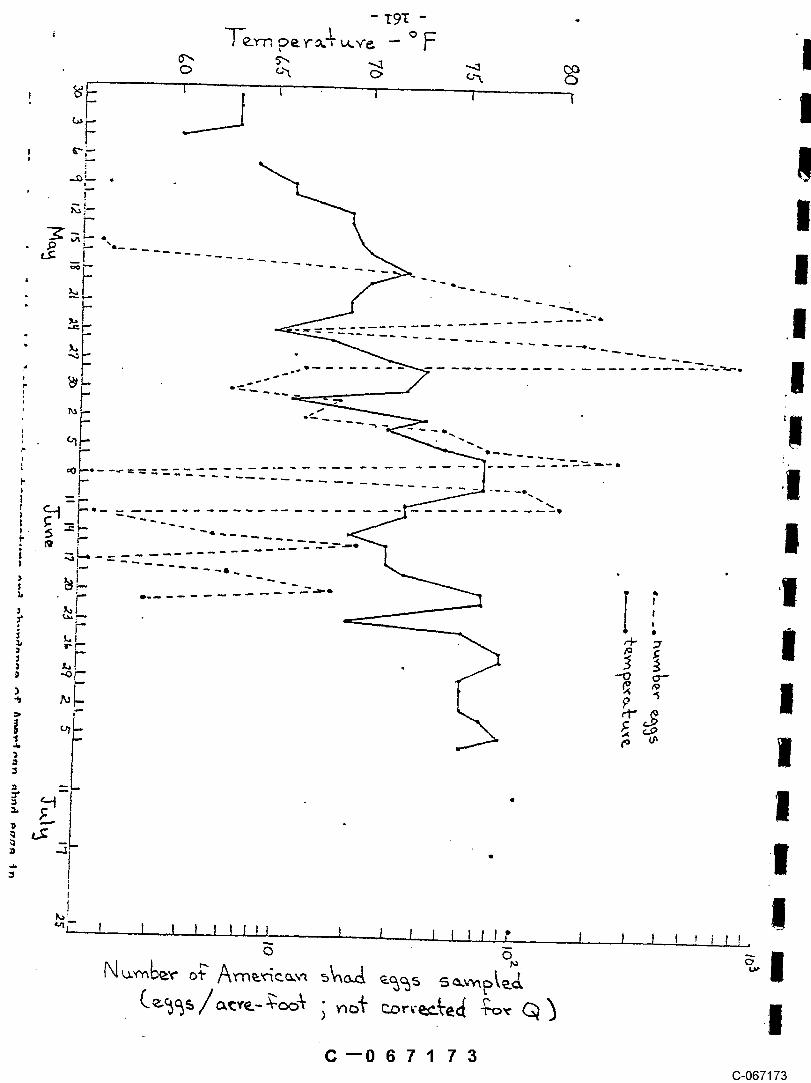
Fig~e 2. Ap~ent lack of relatlonsMpbetween flow and ab~dazce ofad~t ~ s~on.
- 125 - !~
C--0671 $8C-067138

C--0671 39(3-067139
II
II
| °
~o ~5 ~o ~5 3o 35
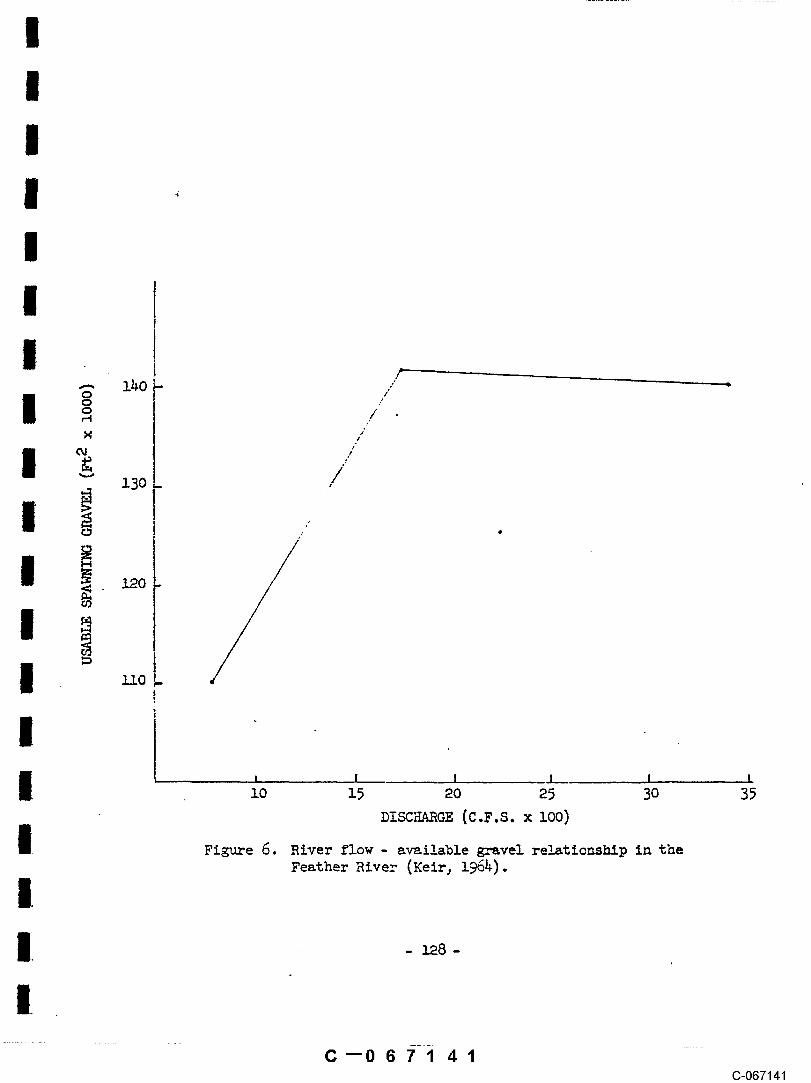
Fi~e 6. River flow - a~i!able ~vel re~tlons~p in theFeather River (Keir~
IC--067141
(3-067141


II
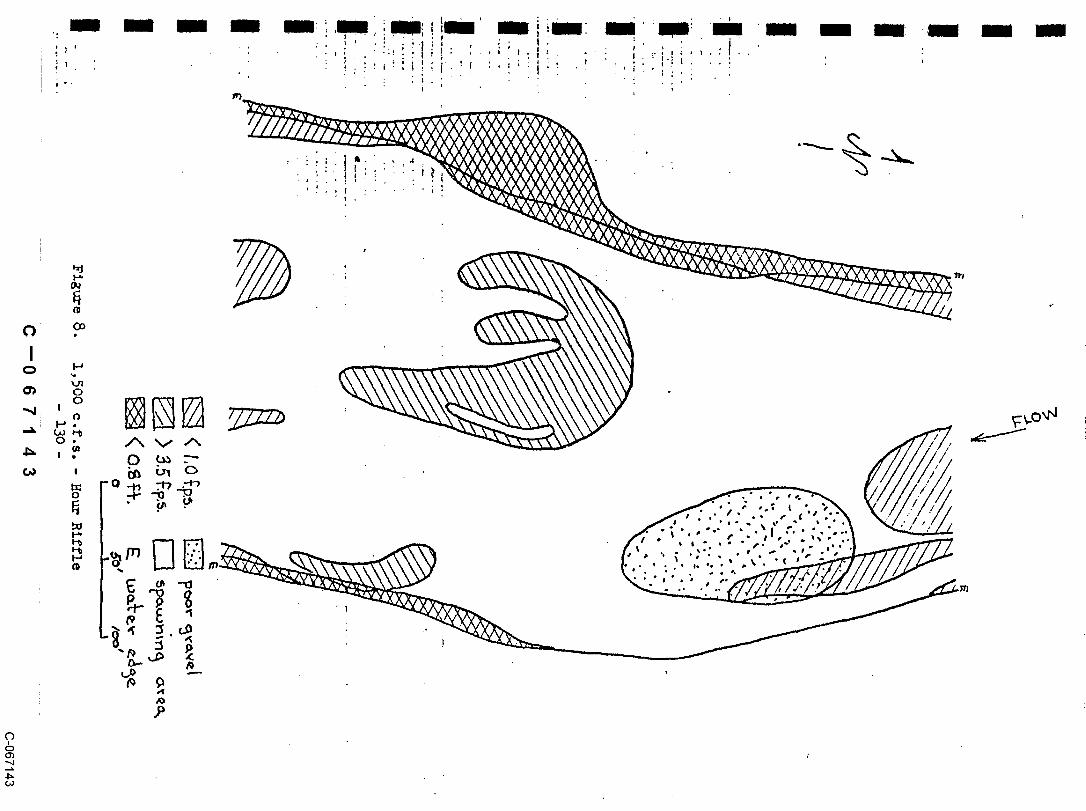
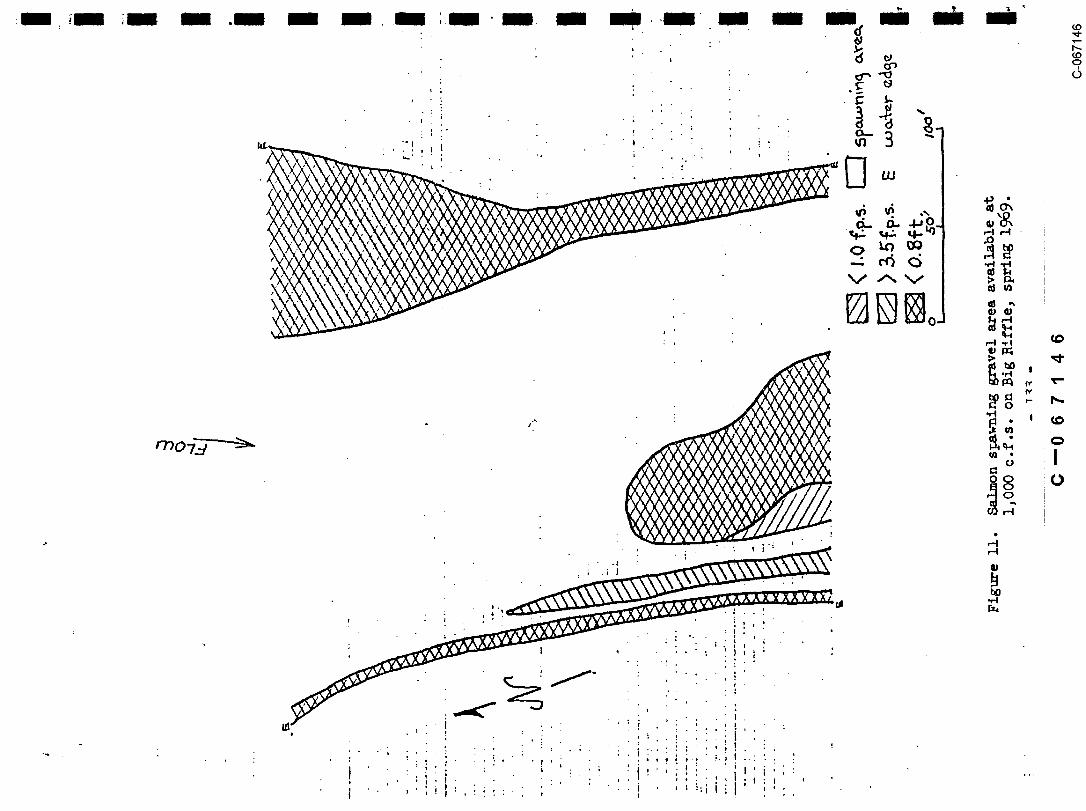
I Figure 12. 1,500 c.f.s. - Big Riffle
- 13~-
!C--0671 47
C-067147

i
c.f.s. - Big RiffleFig,~re i~. 2,OO0
C--0671 48C-067148
1| ~
ii
|- !~1 < o.s~,~:. , ~,o’ ,~’
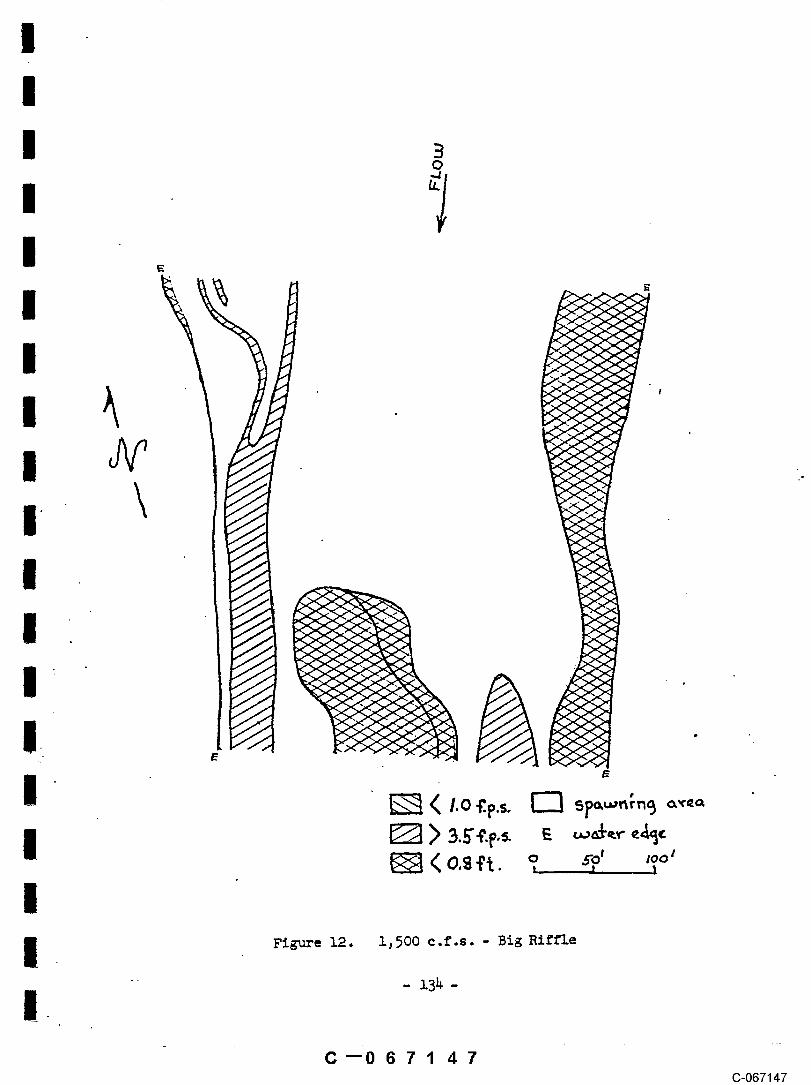
Ii Figure 14. 2,500 c.f.s. - Big Riffle
- ].36-
C--0671 49C-067149

I
[]
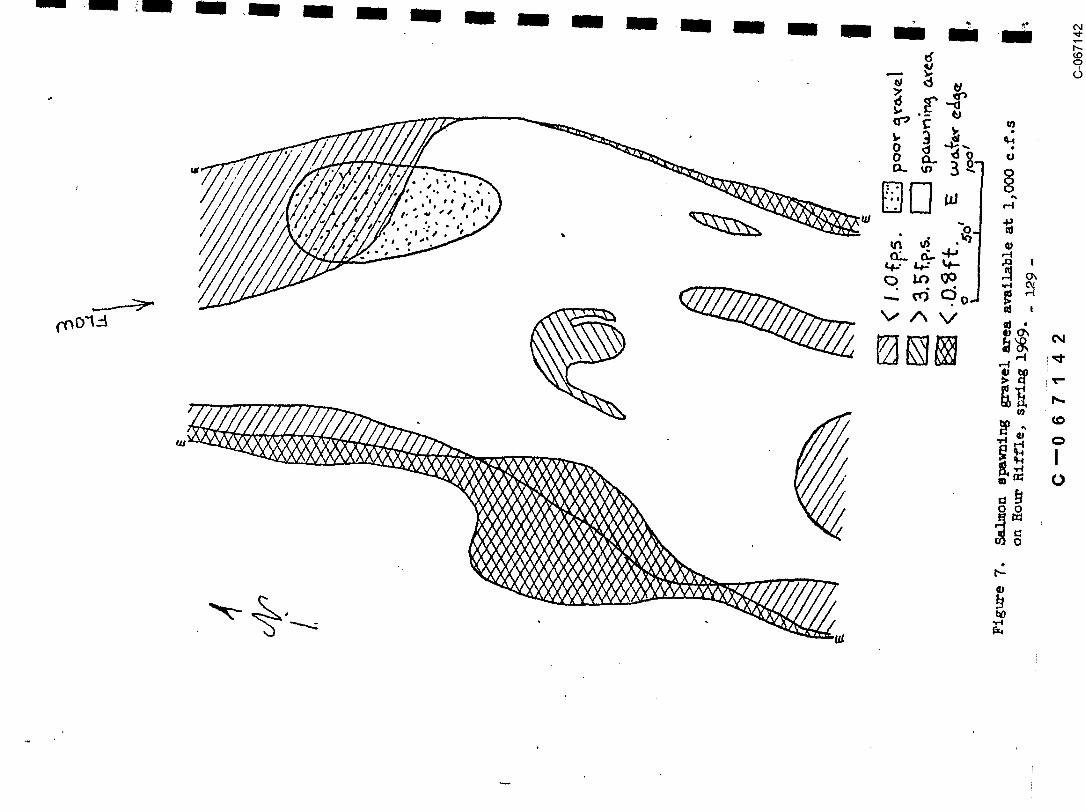
Figure 15. Salmon s~wning gravel area available at1,O00 c.f.s, on Herringer Riffle, spring 1969. I,.
C--0671 50C-067150

3. 5 ~p.~.
Fi~e 16. 1,500 c.f.s. - He~er Rifle
- 138 -
C--0671 51C-067151

"
¯ o ~o~ too~, _ , ,, l
Figure 17. 2,000 c.f.s. - Herrin~er Riffle
- 139 =
C--0671 52(3-067152
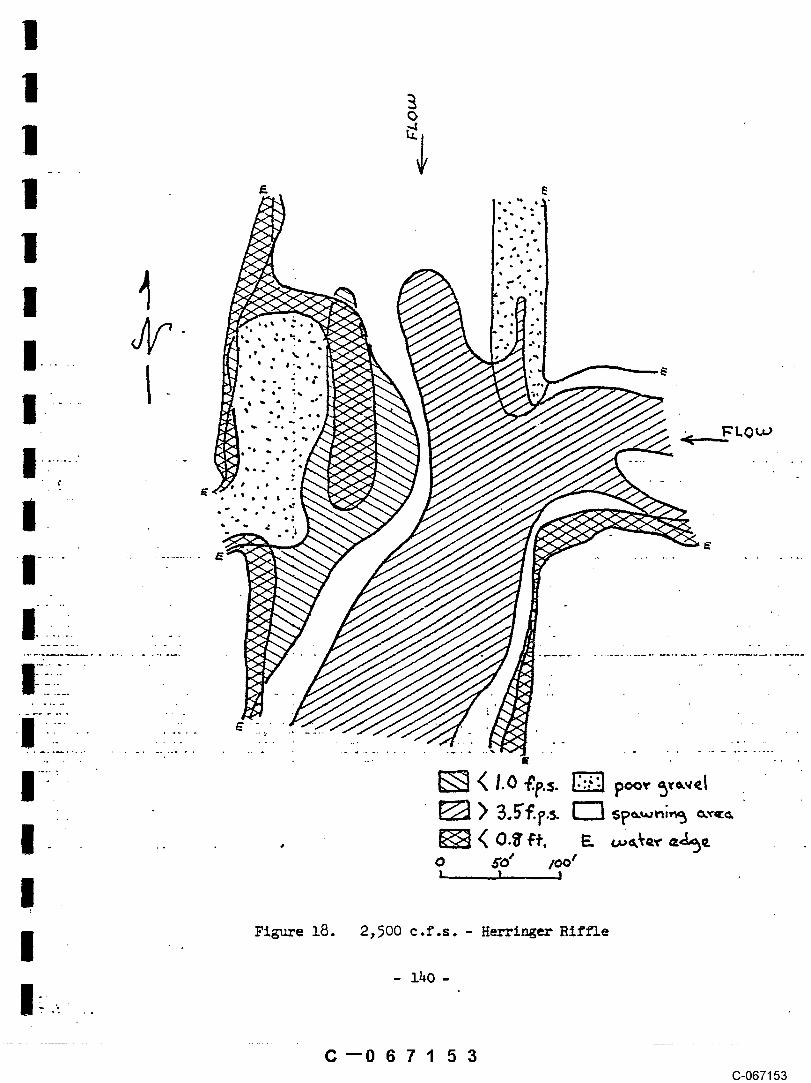
C--0671 53(3-067153

95"
iO00 1500 2DO0 2500
Figure i~ River- ~low a,ra!!able- gravel relations.hlp at ¯ti~ee riffles in the Feather River.
C--0671 54C-067154

Key ~or openingand closinq valve
.

!
~ \/ ;.-" /:,, ., , ....../../ ,.....~.’..... .,,/,.. ..~.,
!Figure 21. Cross-section of typica! redd showing
location where eggs ~re sampled.
I
I
-::’:-== I
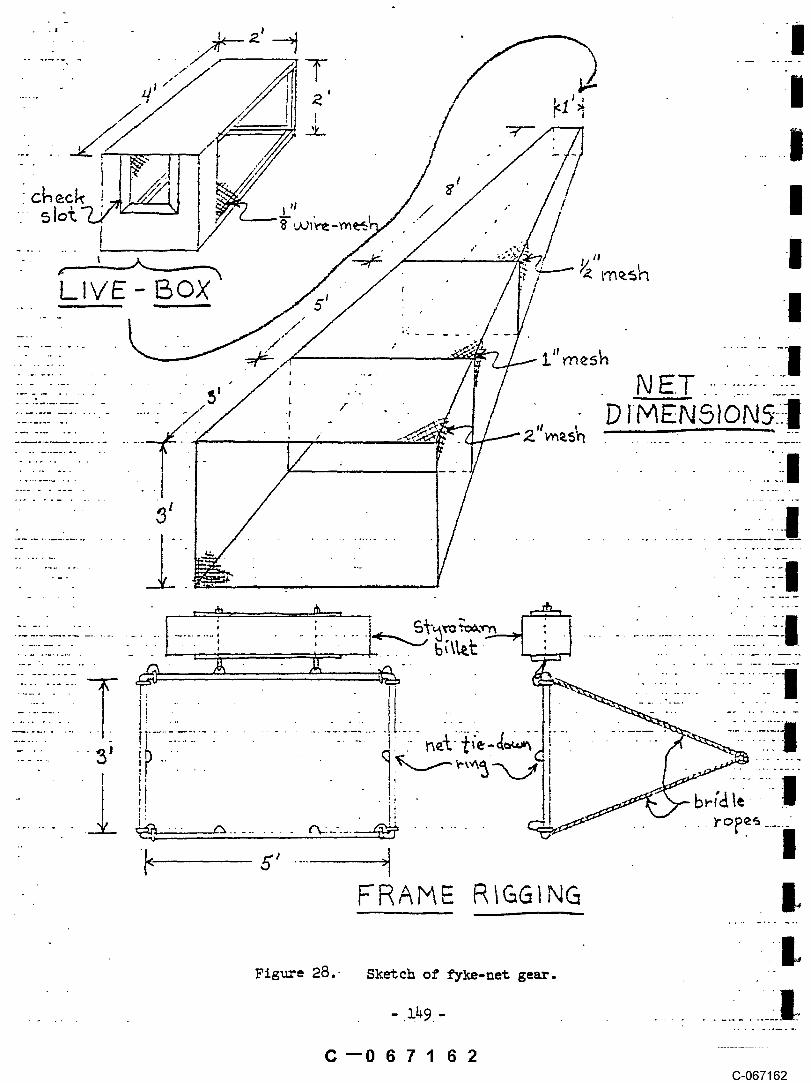
Fig~e 22. S~tca’~ " of s~eci~ egg collection net.
|
C--0671 56C-067156

I ¯III ZOO
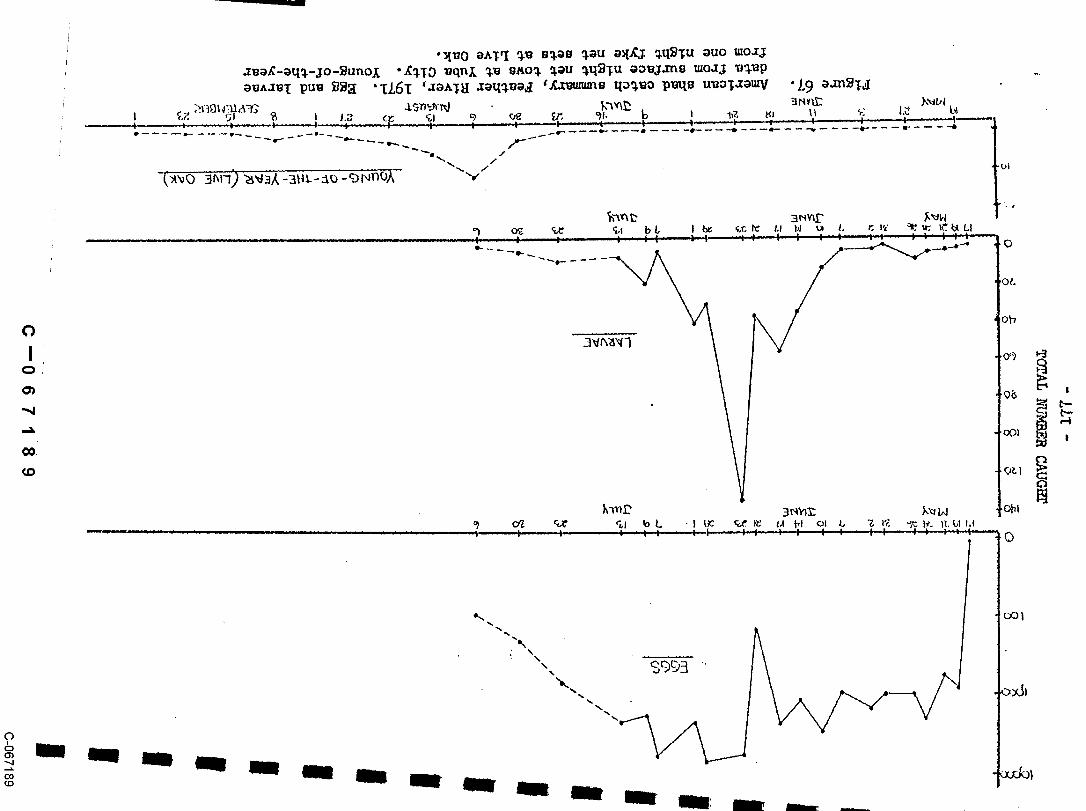
¯ (1969)
I ~-
i ¯ (!97o)
,i~~o_
60 _IiI ’I
of spawning king salmon in the lower river area.
II
- 144-
IC--O 6 7 1 57
C-067157

5 i0 15 ~0 2~ 30 35 ~0 ~AI~LT SA!2,DN (Thousa~nds)
!Figure 2~. Relationship between gross egg surviva! and number
of s.~awning king salmon in the middle river area.
I
C--0671 58C-067158
IIII lO0 -
i ,. (1968)\
~0 \,,., r : -0.833
I" \,, ¯ (1970)
¯ (19Ta)
3Q - ¯ (1969)
i 20 -
L ! I t ! !i 5 lO 15 25 302O
AZULT SALMO~ (Tho~anas)
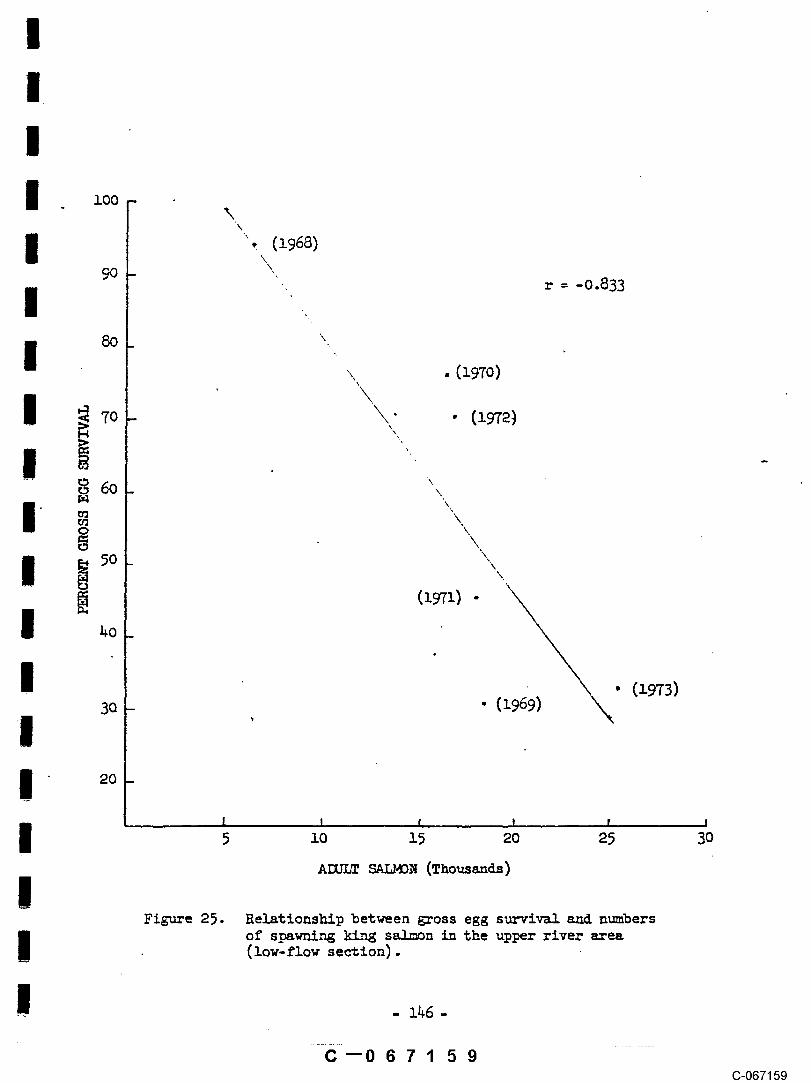
!Figure 25. Relationship betwmen ~oss egg s~i~ ~ n~bers
i of s~~ ~ s~n ~ the up~r river ~ea(low- flow se~ion).
C--0671 59C-067159

.
~ ¯o - l , ! 1 1 .~ I
26. River-Flow available ~avel relatlons~p IFtg~eat river-~l~ 55-5, ~-flo~ ~ea. I
- l&7- I
C--0671 60(3-067160

Fisure 27. Mean daily catch/net for the 1967 year class of kingsalmon outmi~rating p~st T.ive Oa~. Shown with riverflow. Catch not adjusted for river flow.
C--0671 62C-067162
.~ F~e 3~. ,
~ ~c-/ !~0 Year Class
Fi~e 3&. " ’., 1973 Ye~
....... .
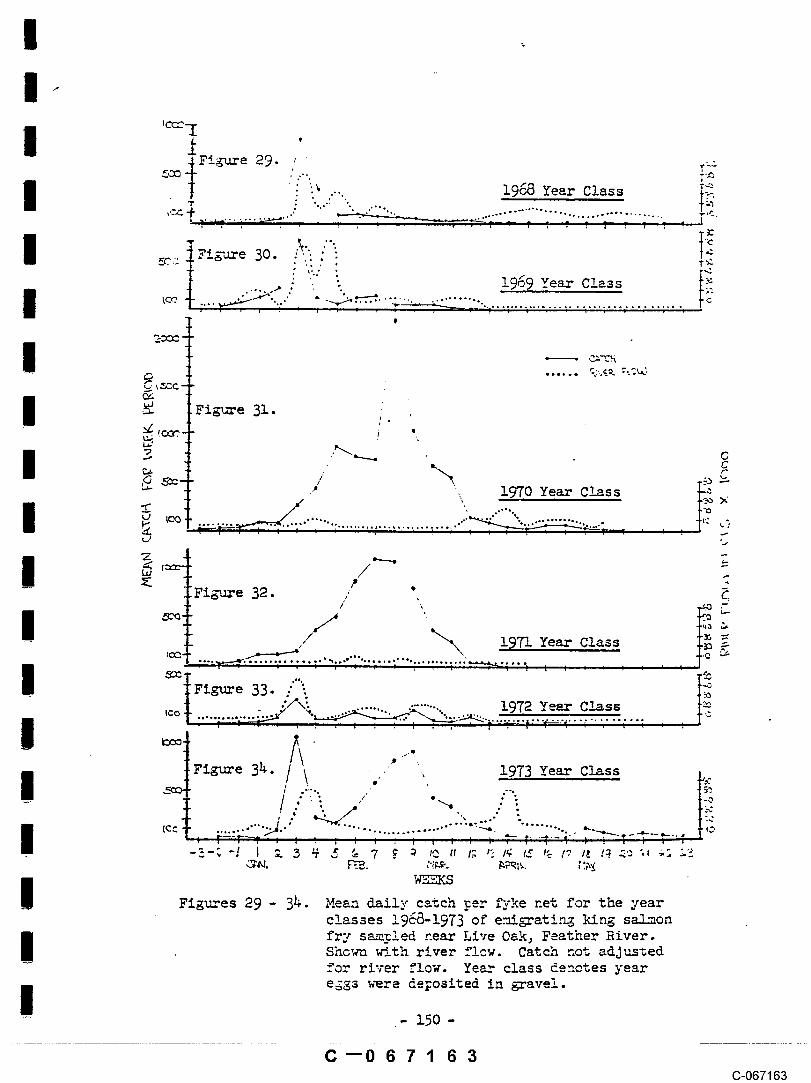
Fig~es 29 - 34. Mean ~ily catch ~er fyke net for the yearclasses 19~-1973 of e~ati~ ~ng s~onfry s~;led ne~ Live Oak, Feather River.Sho~m ~_th river flcw. Catch not adJ~medfor river flow. Ye~ class denctes yeare~gs ~mre deposited in ~avel.
- 15o-
C--06~163C-067163

1967 Year Class
’~ ~ ’ . ’. . _o.-,--o"f ’. -- ¯ .__,__,-
~[ ’ ~ l ..... T ’- . 2 - r T ,
_
~ ~ 3 _T T_ ’ Tr
,--.-----’-’--’--’-,--’--’--" .....
¯ ~’zg~e 6W. ’ ~ , -- -- ~-’~
~ =-,-4--~- ......- " ~-~--k-,--u-.--.’ = ’ ’ ....’ ,.__~- .I _ _ -~ ..... , . , . -- , . , , , , ~ , , , I I I
1971 ~e~ C~
~ r ~ , . _
~ Fi~e ~I. _ T -- -
T- ; T
1973 Ye~ C~ss - _ ¯ , -
~. ~. . . ~.
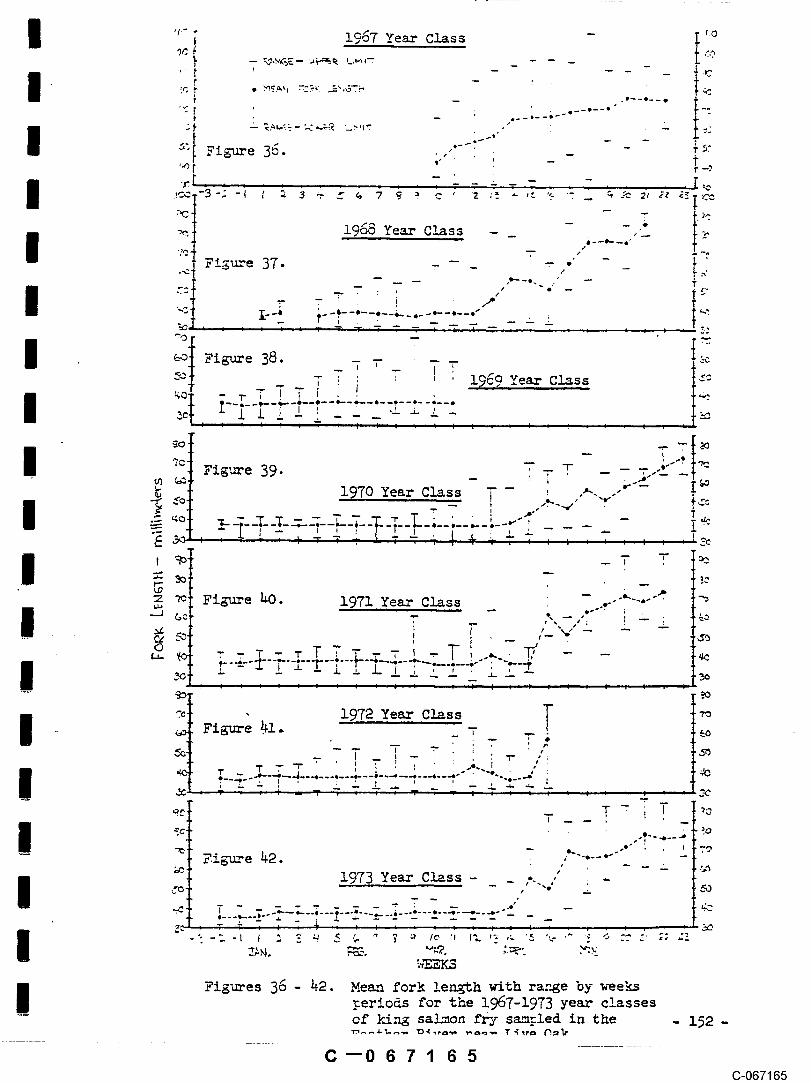
I Fig~es 36 - 42. Me~ fork le~h ~th rathe by wee~~eriods for the I~T-1973 ye~ classes
-- of ~ sa~on f~j s~led in the
C--067i 65

C--0671 66(3-067166

iI
C--0671 67(3-067167

I
i
C 067168(3-067168

I
I
C--0671 70C-067170
I, LI, L90-O
I. L I. L 9 0--0

0--0671 74C-067174

I I

n
, !I "~ .," .~. .
°’ ’ ’ ]/~!’,,’ " ~-~ !
I ! ~ ,,I
I
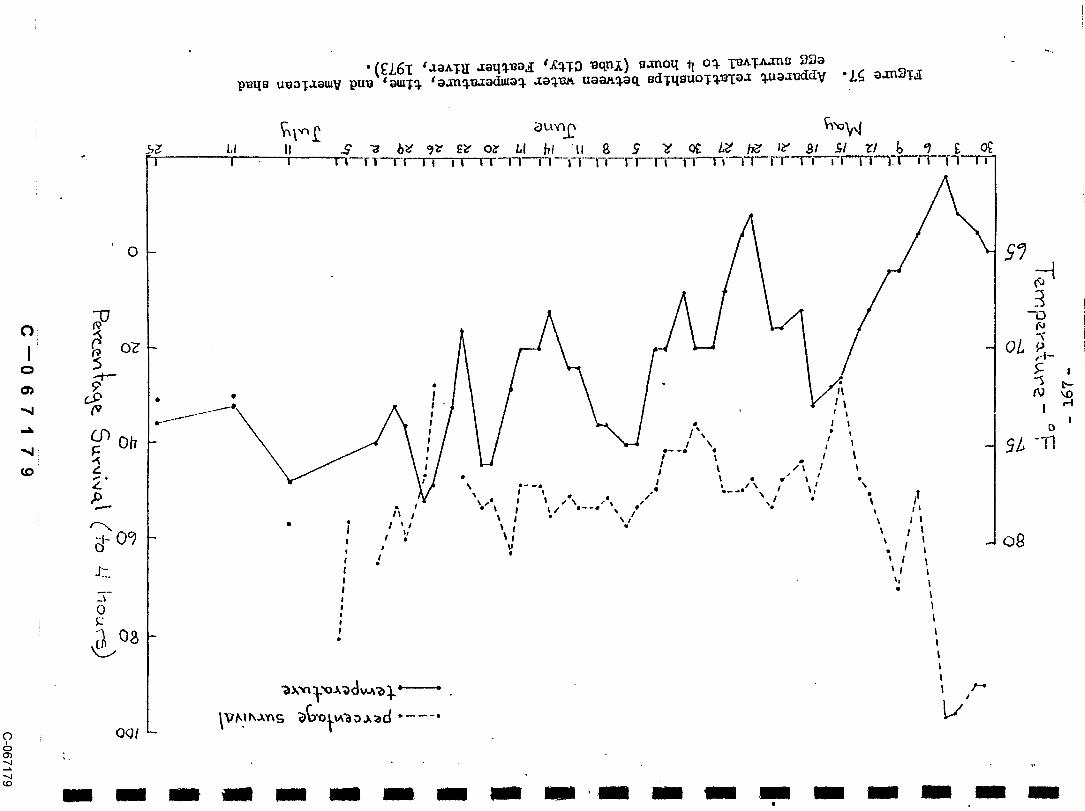
Fi~e 54. Ap~nt re~tions~ps ~tween ~ter te~t~e,t~e, and percentage s~~ to ~ ho~s of ~erlcans~d eggs (Yuba City~ Feather River~ 1972). --.
I.(;--067176
C-067176

¯ IC--0671 77
C-067177

!- 166-
C--0671 78C-067178
9Ogl -
0

............................ ll I I ~-|--’1 I I I i I I i ’ i’l I i i I I i- i1

CIO 6 7 1 8 1(3-067181

C--0671 82C-067182

C--0671 83C-067183

No. American Shad Laz~ae/acre foot
I 0 0 0 0 0 0 0 0 0 0 0
, , i’, 1" 1 | ! ! ~ ! ¯ ~.. . I t’ !
C--067184C-067184

0
5 i0 15 20 25 30 ~ 10 15 20 25 30 5 10 15
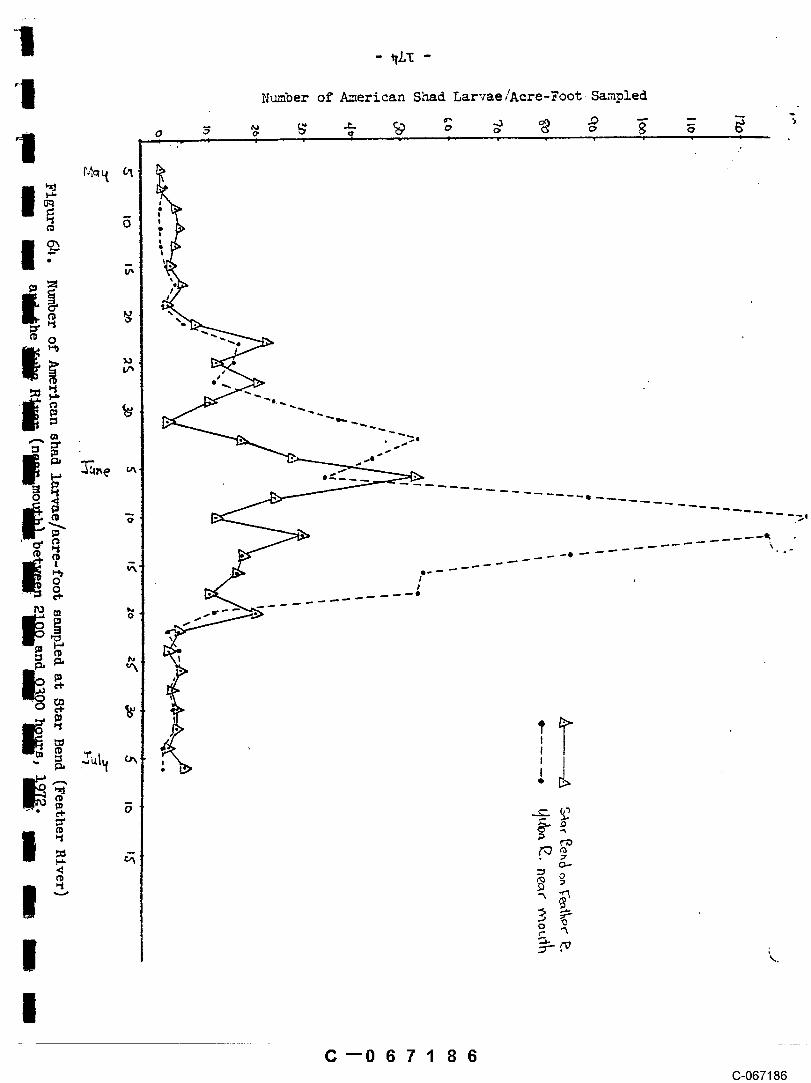
Figure 69 Number of American shad l~rvae/aere-foot saw~lel at Verona and Yuba City
’" from surface tows between 2100 and 0300 hours, 1972.
Number of American Shad Lar’~zae/Acre-Foot~ Smmpled
,
C--0671 86C-067186

C--0671 87C-067187

Nt~nber L~--:~e per Acre
C--067i 88C-067188


¯ -’--" m I
X
data from m~£ace night net tows at luba City. Youn~-of-the-yeardata f~m night fyke net sets at S~nghai Rapids.


Ii
| .:~ ~.o _-. ¯~ -0.5’ - Zq
| -_I 1 1 ~ I I ! I ~ ~ I I I I I |,I ~ ~ ~
~.5" 2.o.
Fig~e 71. Re~tlonship of a~ler catchrates of zd~t ~ric~ s~d~th the ~e Ind., 1971-197~.
C--0671 93C-067193

IO
0
0"
I
Fig~e 7~- Ni~ly catch of s~ yo~-of-the-ye~~eric~ s~d taken withLive 0~, Feather River.
- 1Be-
C--O~Z1940-0~7194

I Figure 73. Fyke-net catches of young-of-the-year
American shad taken near Shar~hai Bend,
I Feather Riyer, 1972-19T~.
I - ~83-
C--0671 95C-067195
. z86. I~
C--0671 96C-067196

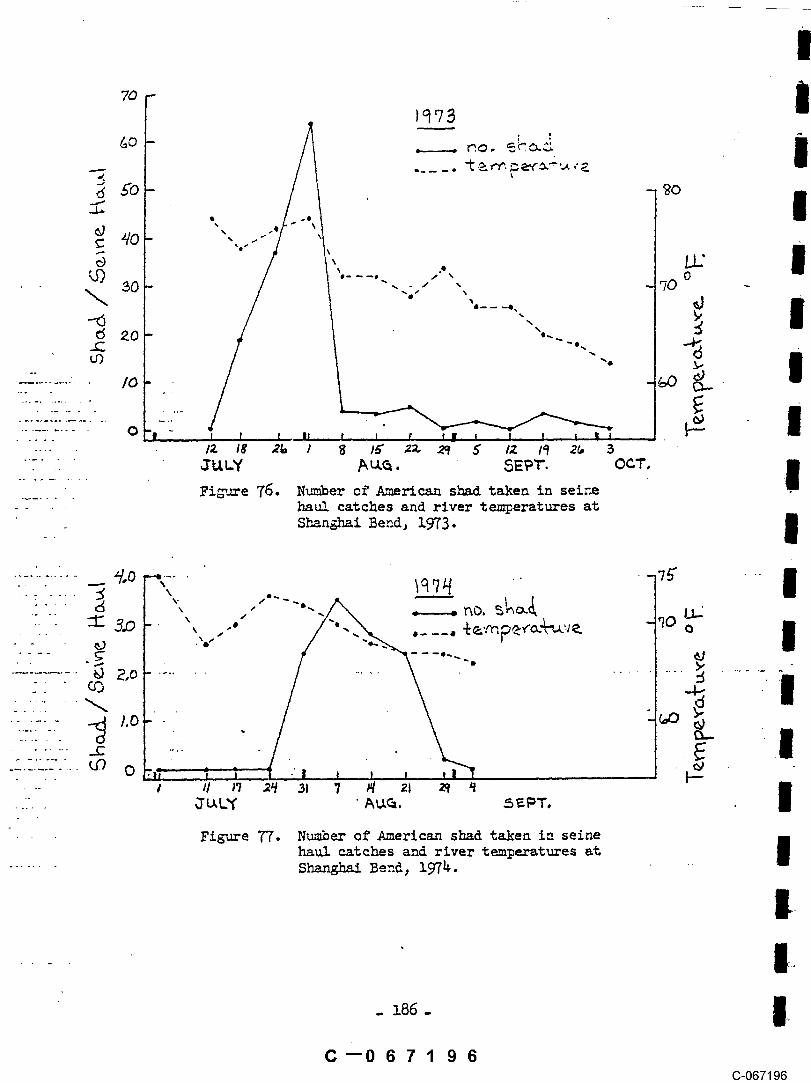
70- +|
-
I Figure 78. Mean maximum da~ly temperatures, by fiveday Interv~!s~ of the Feather River belowOroville and regression lines for all data
I (1958-196T, n = 240; 1969-1974~ n = 14~).
Ii - 187 -
C--0671 97C-067197

|Figure 79- Date when Feather River (near Oroville) m.
first reached 15.5°c (dots are pre-projectand circles post-~roject temperatures).J n.o
. ,88- mC--0671 98
C-067198

C--0671 99C-067199

Figure 81. Relationship of angler ~atch of shad tomean Feather River F!ow in May (A), tomean minimum river temperature (B), ariaof river flow to river temperature (C)
- 190-
C--067200(3-067200

o, offo
-
I
~ 0,I00 .......................
I
-
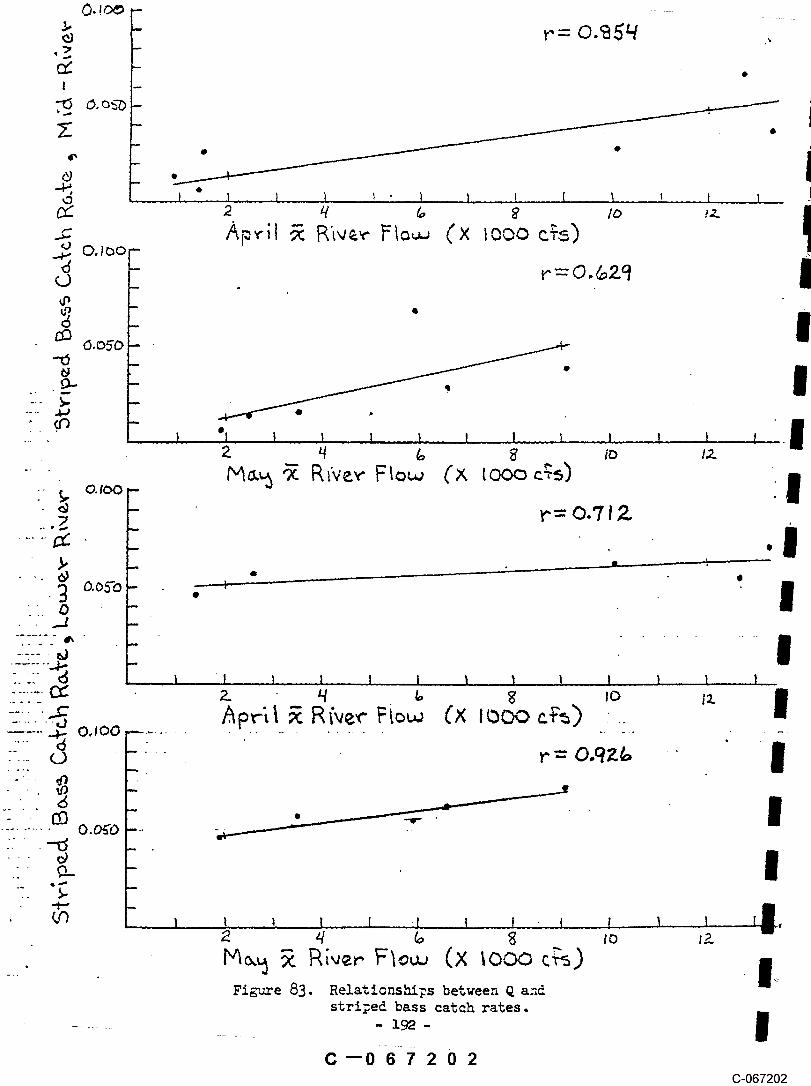
Fi~e 83. Relations~s betveen Q andstriped bass catch rates.
C-067202

..... 5o 52 .Sq on. 5~ ~o
So 52 5~ 5 b 5~ ~,0 t,:, 2
Figure 8~. Relationships between river tempe, rature an~ stri~ed bass catch r~tes.- 193- . .-
C--067203 ~C-067203

Figure 85. Fyke-net catches of selected fish ~ith river flo~ at ILive Oak~ Feather River. Fork lengths of fish sho~nI~~ere 150 milli?.eters or less.
_ - 19~-
ICI067204
C-067204
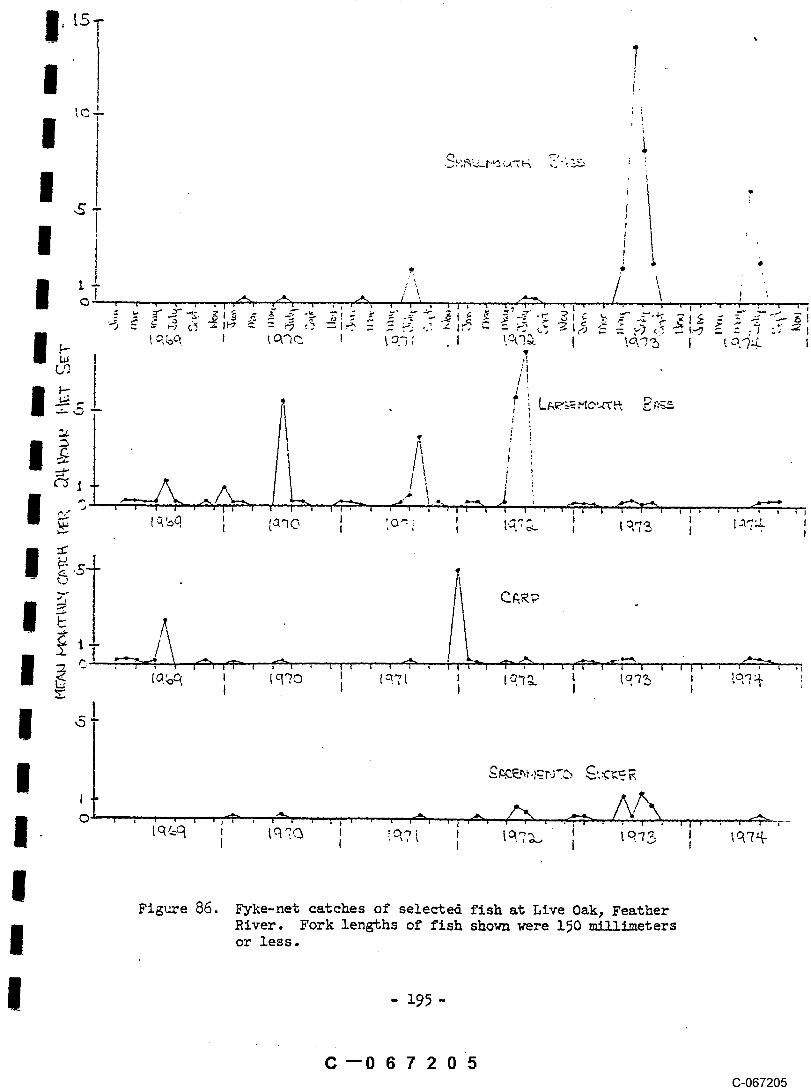
IFigure 86. Fyke-net catches of selected fish at Live Oak, Feather
River. Fork lengths of fish shown were 150 millimetersI or less.
I - 195-
C--067205C-067205
LO~L90-O
LOZL90--O

Figure 89. Relationship of river flow and the numberof pools that trap salmon (A = Big Holearea; B = Hour Riffle; C = Big Riffle).
C--067208(3-067208

C~c~ssesRecovered
No. Trips
CarcassesRecovered
No. Trips
~cassesRecovered
Estate
C~casses
c~casses
Estate
~casses
Pop~tion i
0-0~720~
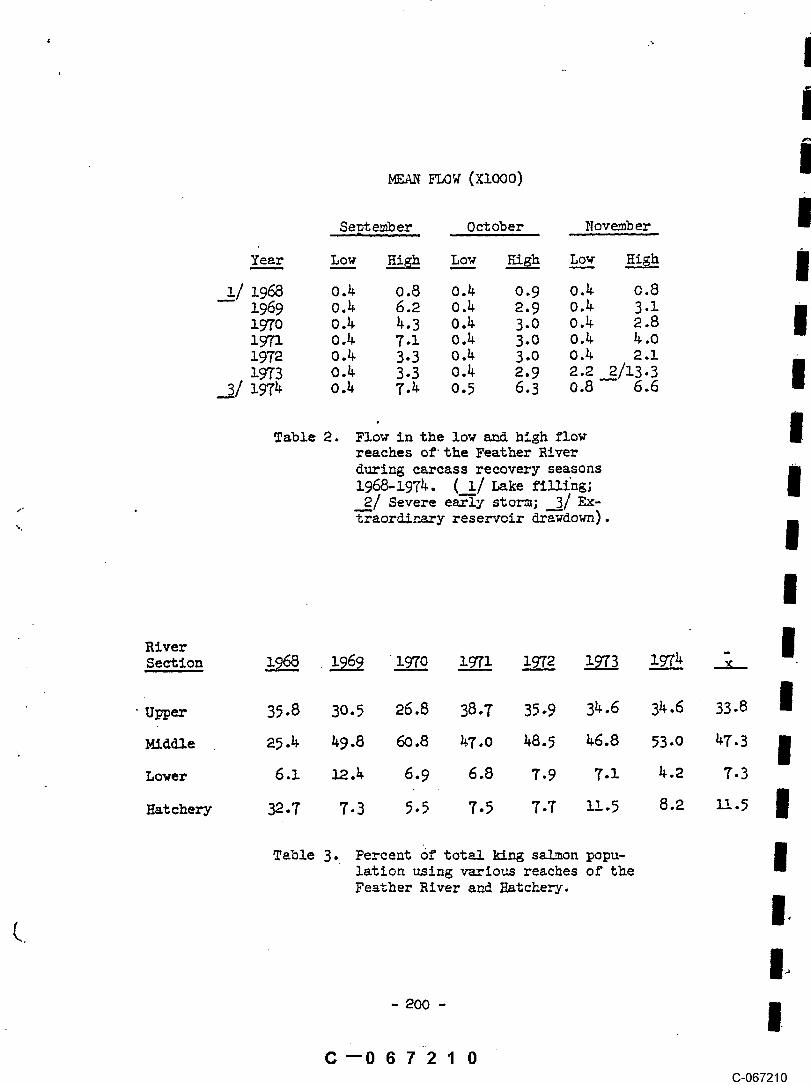
~ z~o~ (xlooo)
Se,ot ember 0 ct ob er November
Yea_~r Lo__w High Lo___.wKigh Lo__~w High
__l/ 1968 0.4 0.8 0.4 0.9 0.£ 0.81969 0.4 6.2 0.4 2.9 0.~ 3.1197o o.~ 4.3 o.~ 3.O o.~ e.8197~ o.~ 7.1 o.~ 3.o o.~ ~.o1972 0.4 3-3 0.4 3-0 o.4 2.1z973 o.4 3.3 o.4 2.9 2.2 _g~/13.3
_~3/ 1974 0.4 7.4 o.5 6.3 o.8 6.6
Table 2. Flow in %he low and high flowreaches of the Pea%her Riverdurlz~ carcass recovery seasons
1968-1974. (__i/ Lake filling;_~I Severe e=ly sto=; __~I ~-traordinary reservoir drawdown).¯
River -se~o= ~ ~96___~9~97o 1971
¯Upper 35.8 30.5 26.8 38.7 35-9 34.6 34.6 33.8
Mi~e ~5.4 49.8 60.8 ~T.o 48.5 46.8 53-o
Lower 6.1 12.4 6.9 6.8 7.9 7.1 I~ .2 7.3
Hatchery 32.7 7.3 5.5 7.5 7.7 i1.5 8.2 11.5
.. !Table 3- Percent of total king salmon popu-lation using v~rlous reaches of theFeather River and Hatchery.
C--06721 0(3-067210
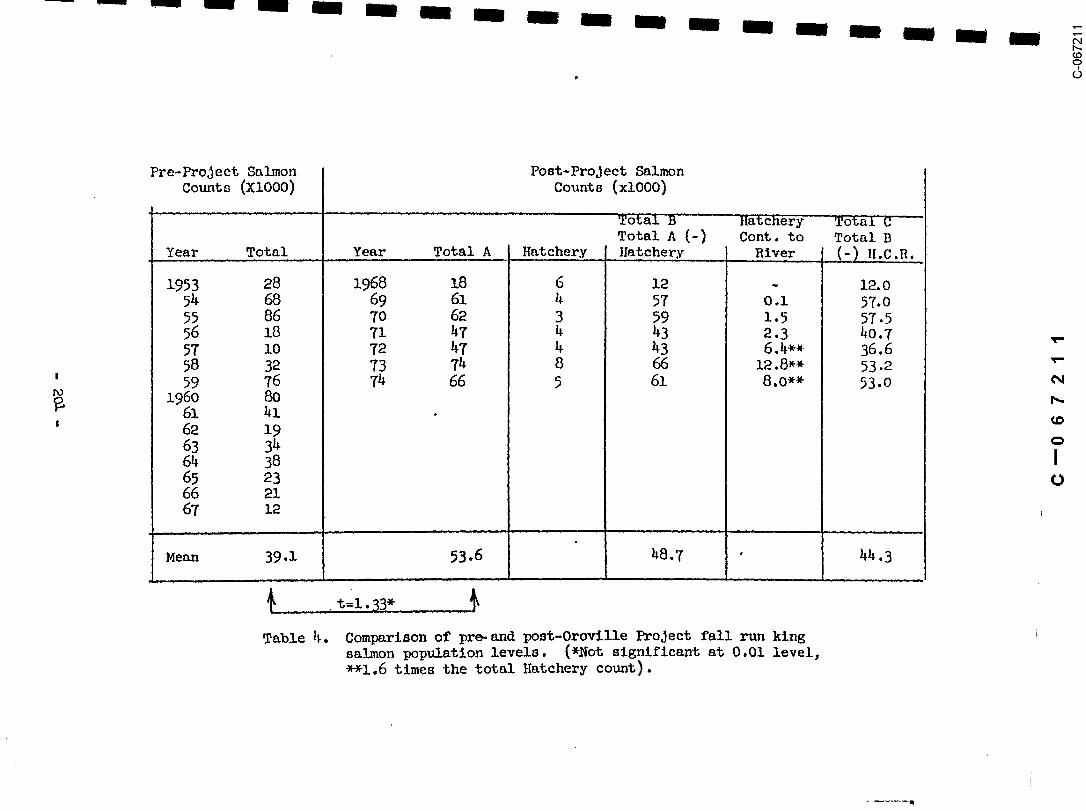
Pre-ProJ ect Salmon Post-Project SalmonCounts (XlO00) Counts (xlO00)
Total B Hatchery T’6tal CTotal A (-) Cont. to Total B
,Year .... T.otal,, , ,Y.ear Tqtal A Hat.cherY, ][atchery I ,, Rive.r, (-) H.C.R.
1953 28 1968 18 6 12 - 12.054 68 69 61 4 57 o .i 57.055 86 70 62 3 59 1.5 57.556 18 71 47 4 43 2.3 4o.757 i0 72 47 4 43 6.4** 36.658 32 73 74 8 66 I~_ .8** 53.259 76 74 66 5 61 8.0"* 53.0
1960 80
62 1963 3464 3865 236667
Mean 39.1 53.6 48.7 44.3
Table 4. Comparison of pre-and post-Oroville Project fall run kingsalmon population levels. (*Not significant at 0.01 level,~-~1.6 times the total Hatchery count).

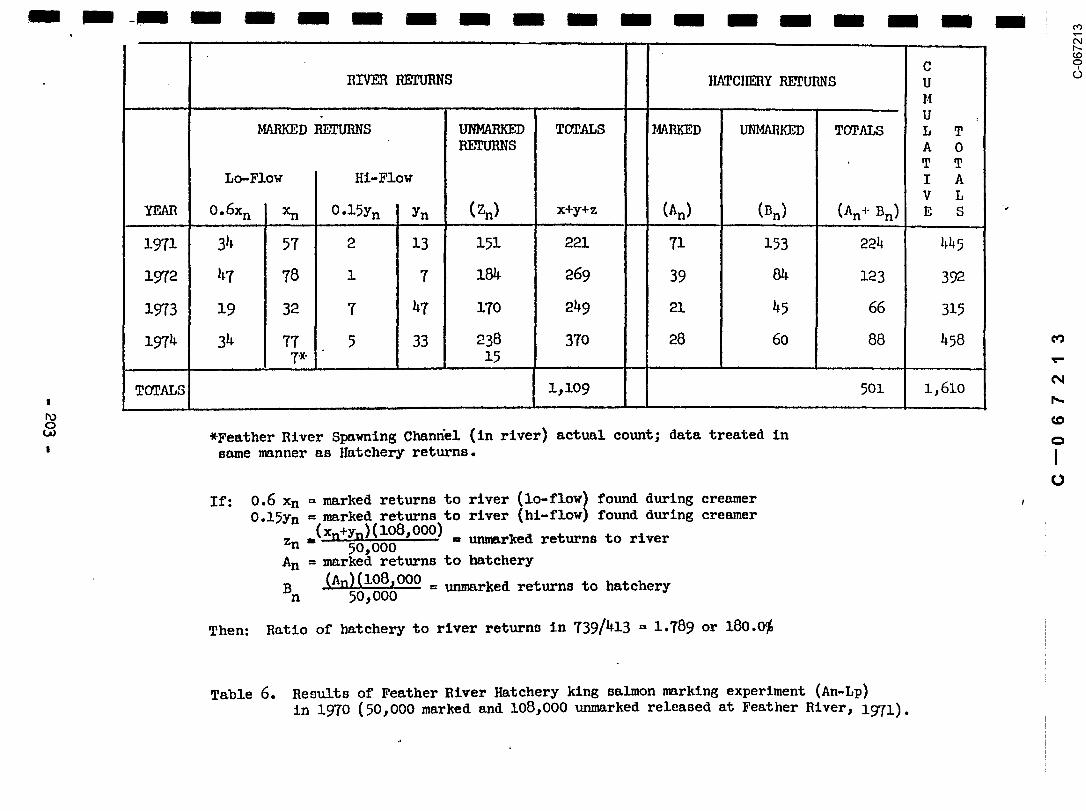
RIVER RETURNS HATCHERY RETURN8 U
UMARKED REFu~NS UNMARKED TOTALS ~MRKED ~4ARKED T~ALS L T
RETURNS A 0T T
Lo-Flow Hi-FlowV L
YEAR0.6xn
xn O.15Yn I yn (2n) x+y+z (An) (Bn) (A+B) E S
1969 8 13 0 o 62 75 35 166 2Ol- 276
197o 148 247 9 60 1454 1761 285 1351 1636 33~7
1971 206 344 5 33 1788 2165 134 635 769 2934
1972 5 8 3 20 133 161 7 33
o :ORALS 4162
Given: 0.6 Xn=merked returns to river (lo-flow) found durln~ creamerO.15Yn=marked returns to flyer (hl-flow) fom~d during creamer
Zn=Xn+yn z~~07UU0 ~~; or, zn = (Xn+Yn) (237,000) - unmarked in river
50, 000An= marked returns in hatchery
An = Bn (An)Bn: 0,~ ~; or, Bn= (237’O00)=unm~Red ~n hatchery50,000
Then: Ratio of hatchery to river r~turns is ~162/26~6 = 1.573 or 160.0~
T~ble 5. Results of Feather River Hatehery-]~ing salmon rearming experiment (Ad-Rp) in 1968. (50,000marked and 237,000 unmarked released at.Feather River, 1969.)
RIVER RETURNS }MTC]~RY RETURNS UM
MARKED RETURNS I@~4ARKED TOTALS ~RKED U~KED TOTALS L TRETURNS A 0
T TLo-Flow Hi-Flow I A
v LYFAR 0"6Xn I xn O’lSYn I Yn (Zn) X,+,y+z (An) (Bn) (An+ Bn) E S
1971 34 57 e 13 151 221 71 153 224 445
1972 I~7 78 1 7 184 269 39 84 123 392
1973 19 32 7 47 17o 249 21 45 66 315
1974 34 77 5 33 238 37o 28 6o 88 4587* 15
TOTALS 1,109 501 1,610
*Feather River Spawning Chan~el (in river) actual count; data treated insame manner as }~tchery returns.
If: 0.6 Xn = marked returns to river (lo-flow) found during creamer
O.15Yn = marked returns to river (hi-flow) found during creamer=(x.+yn)(lo8,ooo)
Zn ~0,000 ,,, = unmarked returns to riverAn = marked returns to hatchery
B(An)(108,000 = unmarked returns to hatchery
n 50,000
Then: Ratio of hatchery to river returns in 739/413 = 1.789 or 180.0~
Table 6. Results of Feather River Hatchery king salmon marking experiment (An-Lp)
in 19TO (50,000 marked and 108,000 unmarked released at Feather River, 1971).

M~rks Carcasses Carcasses Marks¯ Number Recovered Recovered Recovered Recovered
Sex Marked In Survey In Survey On Weir On Weir
Female 200 7 1,613 60 3
Male 142 4 1,183 ~2 0
Jacks 67 3 455 o7
Skeletons .... 194 12 0
~O9 i~ 3,4~5 179
Table 7- Summary of salmon marked and released, ~and of carcass recoveries, 1968.
H~tchery Total FishYear n t s N Total in Section
1969 9;2~ 1,267 757 15,472 4,378 19,85o
197o 9,07~ 753 .. 469 14,570 3,355 17,925
1971 10,o07 571 326 17,528 3,541 21,069
Table 8. Populmtlon estimates and parametersused in determining population levelsin section one of the Feather River.
C--06721 4C-067214

!Y~r n t s N
19To 6, ~o~ 730
Table 9. Population estimates andparameters used in de-termlning population levelsin sections two ~.nd threeof the Feather River.
River Number Number PercentSection Year Released Recovere~ Recovered
]- ~969 i,~67 7~7 59.7
197o 753 ~69 6~.3
19~. 573. 326 57.1
2 & 3 1969 ’ 558 78 l~.O
]-970 730 lO7 14.7
Table I0. Percent recovery of marked king salmoncarcasses by river section sr.d year.
- 2o5 -
C--06721 5C-067215
Number 106 whitel - ~ 280 orange Total released l_o6T2 20 - I 292 blue Total recovered ?573 32 105 - ~ 9_lOred Percemt recovered 59-74 i 72 n4 - I ]21 yellow
6 1 2 21 31 -’ [_ 80 orange7 5 9 ~0 31 " I 60 blue
ll ]2 14 - ~
Table ll. 1969 summary of marked carcasses released (mumber above stair-line) and. recovered in river section one.
IIII
Number 24 orange
i "-- ] ll4 blueTotal released 47563~.3~
I~ ~ ’’ ~ l!,6 red Total recovered
99 yellow Percent recovered43 "I ~3i 5~" ~ l~Swhite I
6 ]. 2 ].4 51 - I 8~ b~ue
8 1 2 21 23 - 1 2~, yelloOW
lO ., 7 7 24 ~ 8ii 1 0 2
1 6
Table 12. 1970 summary of marked carcasses released (number above stair-line~and recovered in river section one.
- 206-
C--06F24C-067216

ITrip Tot~l released 558
m Number 8 white Total recovere~ 78~ o~ orangei ~ ~ 187 bl~ - ~cent rec~er=
.... B ... ~ o o -
iI
. eoT-
C--06~2~ ~C-067217
TripNumber 2 orange
i - 1 23 blueTotal Released 730
2 0 " I 118 redTotal Recovered 107
3 0 0 " I 159 yellowPercent Recovered 14.7
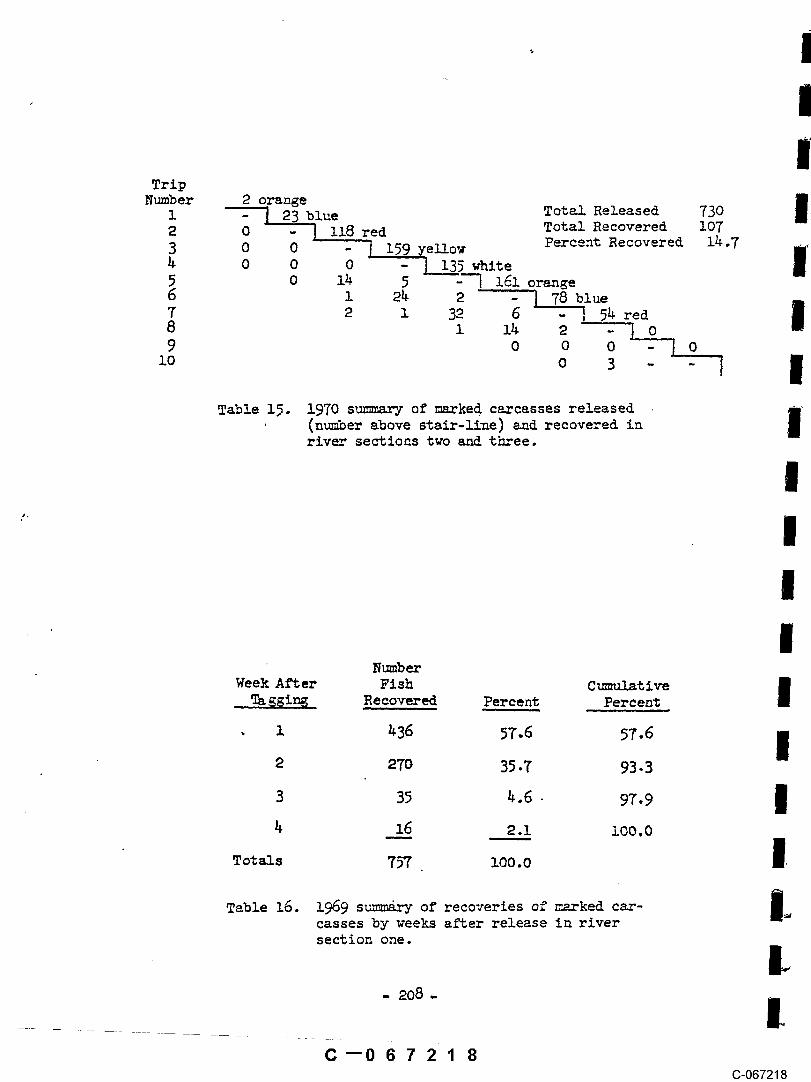
~- 0 0 0 - I~5.. white5 o 14 5 L"-] ].~l orange6 i 24 2 - 1 78 blue7 2 l 3_0 6 - I 54 red8 1 14 2 - ~ o9 0 o 0~ 0
Table 15. 1970 summary of marked carcasses released(number above stair-liue) and recovered inriver sections two and three.
Week After Fish CumulativeTa ggln~ Recovered Percent Percent
2 270 35.7 93.3
3 35 ~.6 . 97,9
4 16 ~.! 1oo.o
Totals 757 ZOO .0
Table 16. 1969 summiry of recoveries of r~-rked car- ¯casses by weeks after release in riverI~section one.
- 208-
¯ ~oG--O~/2i 8
C-067218
NumberWeek A~er Fish Cumulat ire
Ta~ing Recovered Percent Percent
i 281 59-9 59-9
2 153 ~.6 F~-5
3 27 5.8 98.3
4 7 1.5 99.8
5 i o.2 Ioo.o
Totals 469 !00.0
17. 1970 s.ummary recoveriesTable of of marked
carcasses by weeks after release inriver section one.
NumberWeek After Fish Cumulative
Ta.ggin$ Recovere~ Percent Percent
Z 2Z? 66.6 66.6
3 z6 ~.9 99.7
Totals 326 ’~ lO0,O
Table 18, 197]- s~ry of recoveries of ma~kedca.~casses by weeks after release inriver section one.
- 2o9-
C--06721 9C-067219

Week After Number C umulatlvmTag~in~ Fish Percent Percent
l 13 16.7 16.7
2 58 74.4 91 .i
3 2 2.6 93-7
Tot~ 78 i00 .!
Table 19. 1969 summary of recoveriesof marked carcasses by weeksafter release in river sections%wo and three.
Week After Number Cumulative
. Ta~glng Fish Percent Percent
~ 87 8~.3 9~.3
3 3 ~ .3 98 .i
Total i07 i00.0
Table 20. 1970 summary of recoveries of ¯marked carcass4s by weeks afterrelease in river sections twoand three.
C--067220C-067220

Riffle Number Percent ofBelow of TotalRe lease Fish Recoveries
o ~h.3 7~..~
l 48 14.7
2 26 8.o
3 3 o.9
~ 6 1.8
wotal= ~26 99.9
I Table 9_I. Summary of salmon carcassreturns by recovery riffle,1971.
I Riffle Below Number ofRelease Site Fish Recovered Percent
I o ]-~9 7~.o
.... 3 2 0.9
I Totals " ~ 99.9
22. Summary of female salmonTablecarcam~ rmturns by re-covery riffle, 1971.
C--067221(3-067221
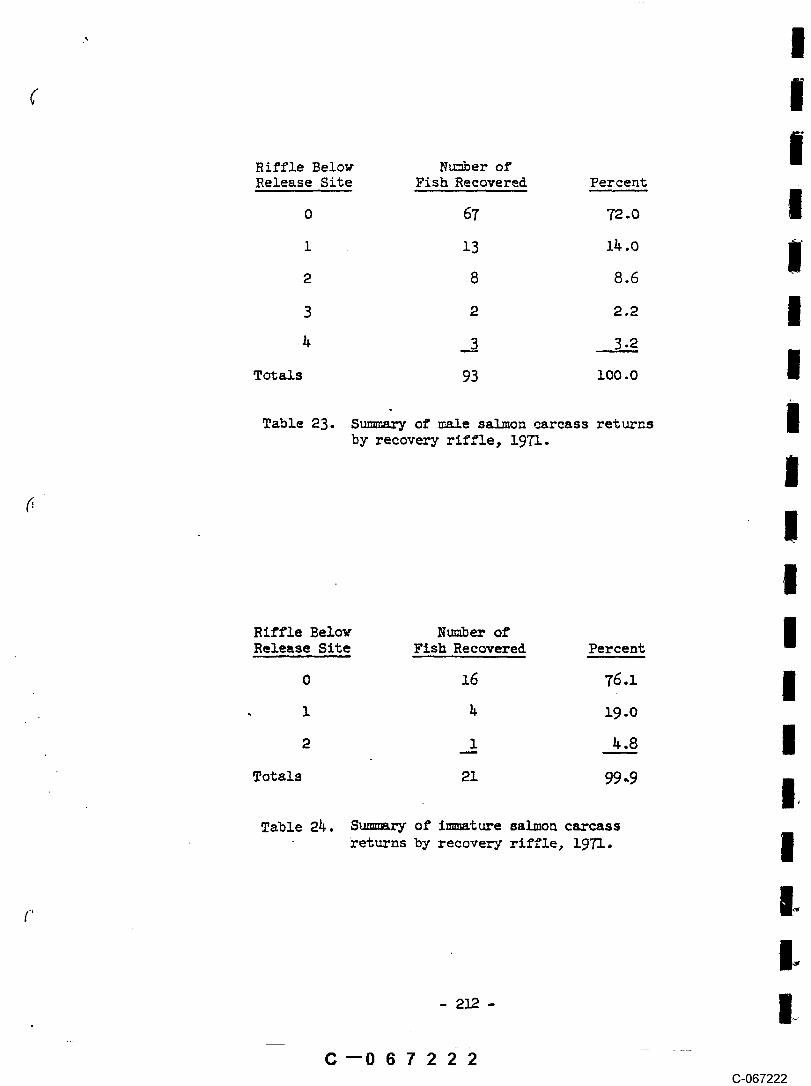
Riffle Below Number ofRelease Site Fish Recovered Percent
2 8 8.6
3 2 2.2
Totals 93 lO0.0
Table 23. Summary of male salmon carcass returnsby recovery riffle, 1971.
Riffle Below Number ofRelease Site Fish Recovered Percent
o ].6 76.1
, l ~ ]-9.o
Totals 21 99-9
Table P4. Summary of immature salmon carcassreturns by recovery riffle, 1971.
C--067222C-067222
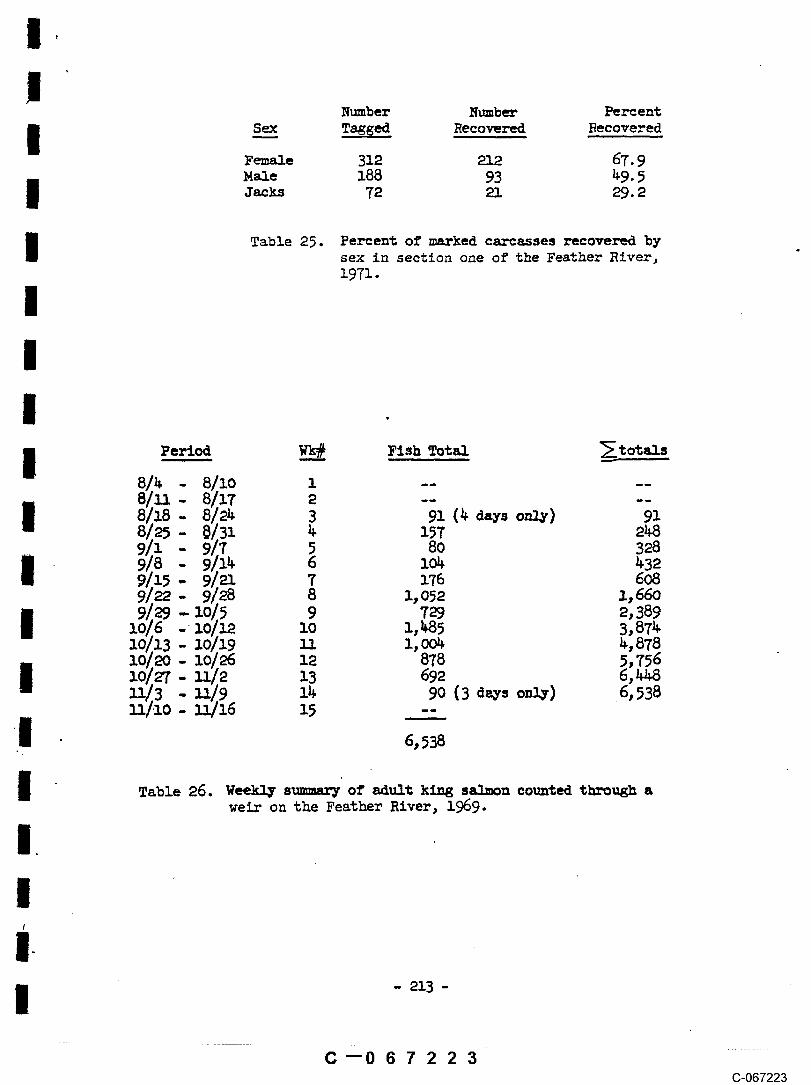
Number Number Percent
I S__~ Tagged Recovered Recovered
Female 312 212 6T. 9
I Table 25. Percent of marked carcasses recovered bysex in section one of the Feather River,19T1.
!
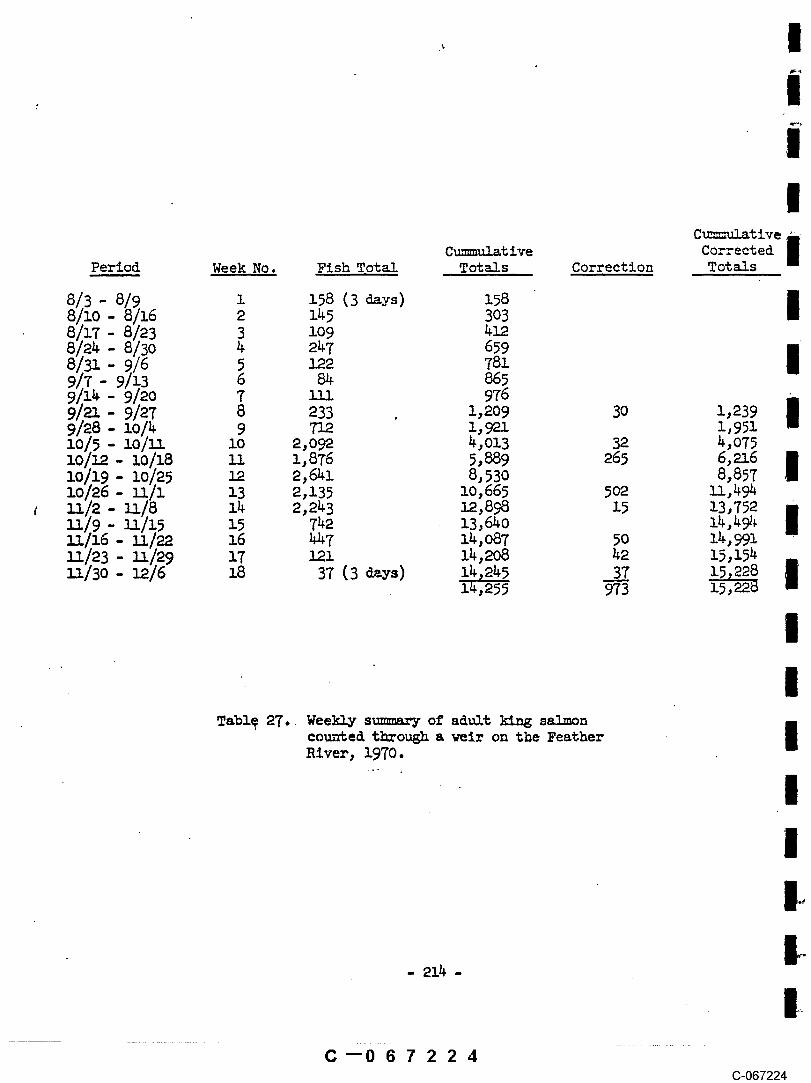
I Table 26. Weekly summary of adul% king salmon counted through a
weir on the Feather River, 1969.
C--067223C-067223
Ctu~uzlatlveCummulat ive Corrected
Period Week No. Fish Total Totals Correction Totals
8/3 - 8/98/10 - 8/16 2 145 3038/17 - 8/23 3 109 4128/24 - 8/30 4 247 6598/3! - 9/6 5 122 7819/7 - 9/13 6 84 8659/14 - 9/20 79/~1 - 9/27 8 233 . 1,209 30 1,2399/28 - 10/4 9 712 1,921 1,951i0/5 - lO/L% lO 2,092 4,013 32 ~,07510/12 - lO/18 ll 1,876 5,889 265 6,2_16zo/z9 - zo~25 ~. 2,6~ 8,53o 8,85710/26 - Ll/l 13 2,135 10,665 502 11,494ll/2 - ]_I/8
ll/16 - ll/~ 16 ~7 14,087 50 14,991
u./3o - 12/6
Tabl~ 27., Weekly summary of adult kLug salmoncounted through awmir on the FeatherRiver, 1970.
C--067224(3-067224

Cummulat l~e CorrectedPeriod Week No. Fish Total Totals Corrected Totals
8/23 8/29 4 2~
9/6- 9/]2 6 10T 9529/1:]- 9/.19 7 3209/20- 9/26 8 473 , 1,7k5 12 1,7579/27- 10/.3 9 1,06T 2,8]2 2,82kzo/~ - ZO/:LO 10 1,882 k, 69~ ~, 7O6ZO/~- 10/17 ~ 2,8~1 T,535 970 8,51T10/18- 10/24 12 1,885 9,420 357 10,759
zo/25.- lO/31 13 1,6o2kl/1 ll/7 lk l, 133ll/8- ll/lh 15 696 ]2,851 93 14,463ll/15 - ll/21 16 598 13,449 30 15,0913_I/22 - ii/28 17 379 13,828 30 15,500i1/29 - Z~./5 18 366 14,19~ 0 15,866]2/6 - ]2/13 19 85 z~_~279 o 15~ 951
Table 28. Weekly summary of adult king salmon.. counted through ~ ~elr on the Feather
River ~ 1971.
!- 215 -
C--067225C-067225

196___~9 ~9~o ~9~__!
Counter Totals(Adult K.S.) 6, 532 14,245 I~,279
Error Estimate (Ap~r.ox. 6,500)unknown 973 1,672
Total Adult K.S. 13,000 15,218 15,951
Percent PrecociousFish in Run (CorrectionFactor) 34.6 (0.65~) 27.9 (0.721) 33.2 (0.668)
Total AdultsTotal Run = Correction Facto~ 19,878 21,110 23,879
Table 29. S~mary of Electronic Fish Coumter data 1969-1971.
!Male Grilse Male Fem~l~ e Total Cummulat ive
Period Week No. K.S. K. S____:K.S. K.S. K.S. AS PSL
81~- Silo 1
8118- 8/24 3 6
9! i - 9/7 ’ 59J ~ - 9/14 6 o i o 1 i lO o
7 O 0 0 0 I 6 09/~- 9/28 8 3 o o 3 ~ ~2 o9/’a9- 10~5 9 3 0 0 3 7 7 zZo/6 - lOl~ ~o ~ ’ 3 3 ~o ~7 ~ o10/13- 10/19 ~ 32 6 12 50 67 2 0 :10/20 [ 10/26 ~ 145 61 k5 251 ~8 ~ 010/27 ~/~ 13 335 161 56 552 870 26 0
T~ 927 ~ l, 517 lO
Table 30. Wee~y s~ of c~casses of t~ee fish speciesfo~d on a ~ir across the Fearer River, 1~9.
- 216- ~
C--067226C-067226

~le Grilse Male Female Total CummulatlvePeriod Week No. K.S. K.S. K.S. K.S. K.S. AS PSL
8/3 - 8/9 18/10 - 8/16 2 59 3681~7- 81238/22 - 8/30 4 98 168/31 - 9/6 5 899/7 - 9/13 6 79 129[z4 - 9/2o T 3 o o 3 3 59 59/el- 9/27 8 0 ¯ 0 0 0 3 47 69/28 - zo/4 9 o o o o 310/5 - lO/ll lO 3 l 0 ~ 7 26 3zo/ze - lo/z8 ~ 28 zo 3 ~z ~8 50 olO/19 - lO/25 l~ 152 56 Ii 219 267 87 010/26 - ll/1 13 187 84 26 e97 564 9o o~/2 - ~18 ~ ~o2 :u.~ 4o 356 9~o ~ o~/9 - :u./~ ~ ~ 76 29 ~6 i,~6 ~ oll/16 - ll~2~ 16 llO 81 32 e23 1,369 4 0
:u.{23 - ~29 .~7 36 56 19 ~z ~,48o o o
12/7 - 19 0 0 0 0
Table 31. Weekly summary of carcasses of three fishspecies found on a weir across the FeatherRiver, 1970.
C--067227(3-067227

Male Grilse Male Female Total Cummulat ire_~er!od Week No. K.S. K. S___1.K.S. K. S. K.S. AS PSL
1819- 81~.~ ~ ~ ~ ~
8/23- 8/29 ~ ! 1 1 3 6 295 ~ 0 0 1 78/3o- 9/56 o o o o 7 17 89/6
9/13. 9/,19_ 7 2 0 1 3 lO 11 !09/2o 9126 8 ~ . i i 7 179/27- zo/3 9 6 o z 7 24 9 3
~o/.~- ~o/l7 ~ ~3 zo 20 83 ~_~ 2~ 8~o/18- ].o/2~ ¯ ~2 i~8 u2 13 2~3 364lO/a5- lO/~ 13 153 153 32 338 702 a9 3
~/8- ~/1% 15 57 ~ 2~ 150 1,134 0 1
~/22- ~/28 17 50 4a 14 l~ 1,381 0 1
48 29 12 89 l, 586 1 1
Table 32. Wee~y s~ of e~c~sses of t~e fishfo~d on a ~ a~oss the Feather Rive,19~ ¯
C--067228(3-067228
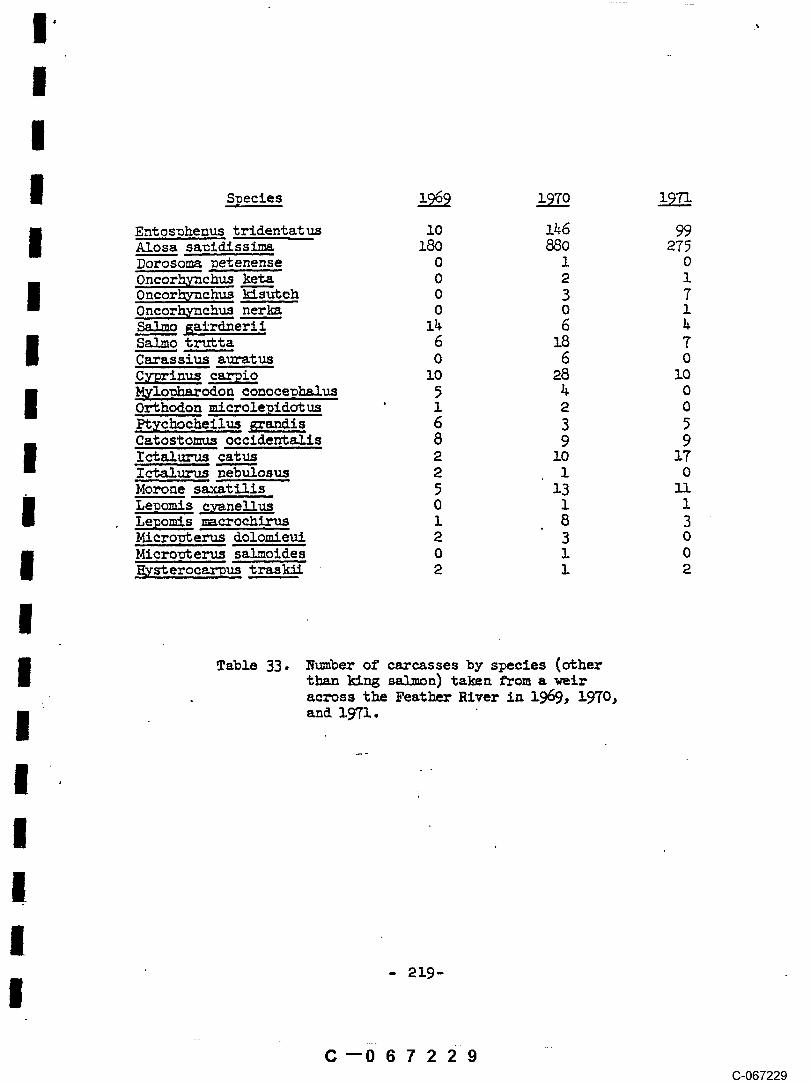
I Entos~h~us trid~ntat us I0 i~6 99Alosa sauldlsslma 180 880 275Dorosoma petenense 0 1 0Oncorhynchus keta 0 2 i
I Oncorhynchus kisuteh 0 3 7Oncorh~nchus nerk~ 0 0 1Salmo 6alrdnerl.i. 14 6 h
I Salmo trutta 6 18 TCarassius aurat us 0 6 0Cy~rlnus carpio lO 28 lO
I ,~H~l, opharodon cono~e.~balus 5 ~ 0Or~hodon microlepSdo~ us i 2 0PtTchocheilus ~randis 6 3 ~Catostomus occtde~ta!ts S 9 9Ictalurus catus 2 10 17I~alurus nebu!osus 2 1 0Morone s~tllfs 5 13 !1
i Lepomis c~ne!lus 0 1 1Le,~o~s mc~ochL-us 1 8 3Hicro~erus dolomieui 2 3 0Hicrov~erus salmoides 0 1 0,H~st erocar~us tras kil 2 i 2
I Table 33. Number of carcasses by species (otherthan king salmon) taken ~rom a weiracross the Feather River in 1969, 1970,
i and 1971.
I- 219-
IC--067229
C-067229
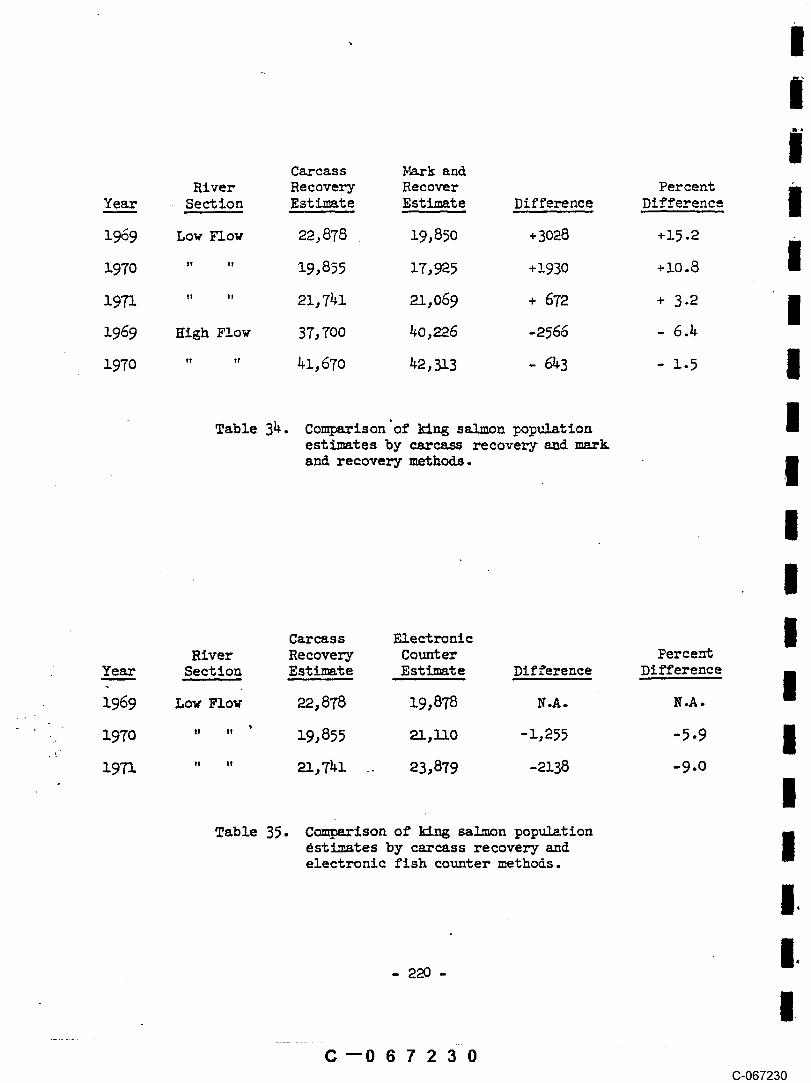
Carcass )~rk andRiver Recovery Recover Percent
Yea___~r Section Estimate Estimate Difference Difference
1969 Low Flow 22,878 !9,850 +3028 +15.2
1970 " " 19,855 17,~25 +1930 +10.8
1971 " " ~1,741 21,069 + 67~ + 3.2
1969 High Flow 37,700 40,226 -2566 - 6.4
1970 " " 41,670 42,313 - 6~3 - 1.5
Table 34. Comparison’of king salmon populationestimates by carcass recovery andmarkand recovery methods.
Carcass ElectronicRiver Recovery Counter Percent
Year Section Estimate Estimate Difference Difference
1969 Low Flow 22,878 19,878 N.A. N.A.
1970 " " 19,855 21,110 -1,255 -5-9
197"I " " 21,7~I .. 23,879 -2138 ’9.0
Table 35. Comparison of ~In~ salmon populationestimates by carcass recovery andelectronic fish counter methods.
!
C--067230C-067230
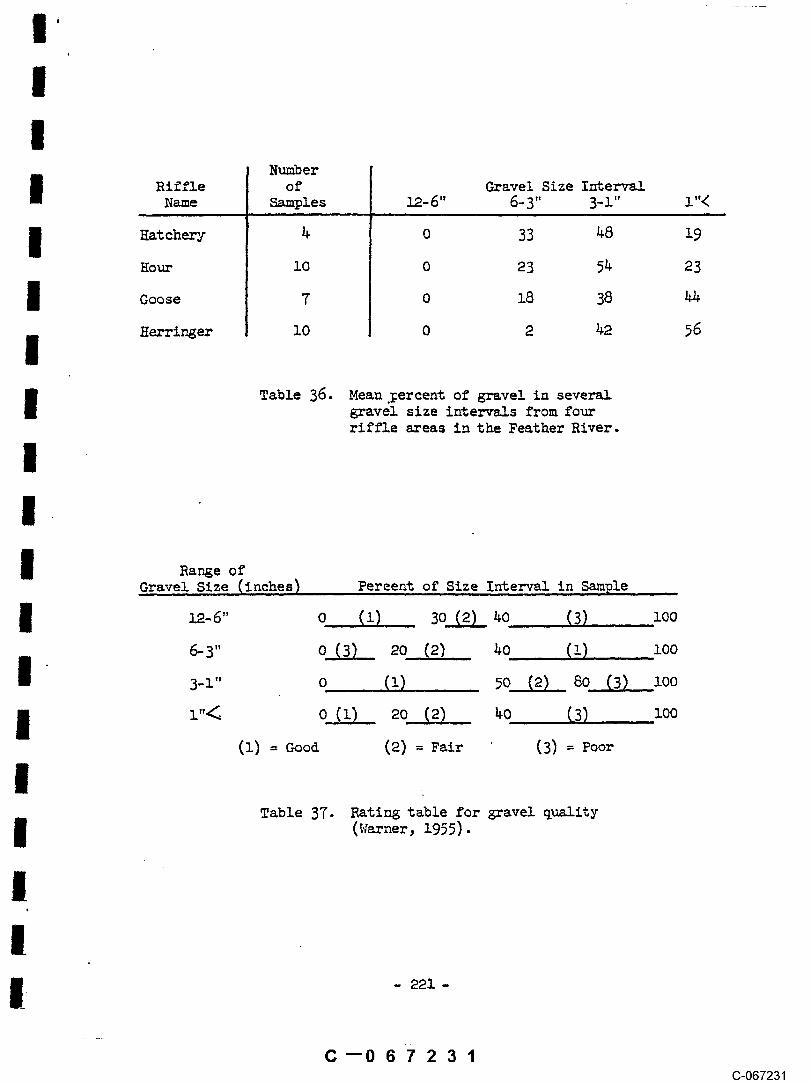
NumberRi£fle of Gravel Size Interval
Name Samples 12- 6" 6- 3" 3-i" i"<
Hat chaz-j
Hour lO 0 23 54
Goose
Herringer i0 0
Table 36. Mean lercent of grave! in severalgravel size intervals from fourriffle areas in the Feather River.
Range ofGravel Size (inches) Percent of Size Interval in Sample
~2-6" o , (1) .,. 3o!Ah 4o (3) lO0
~3" o (3) 2o (2) ~o (z) 1oo3-1" o (~.) ~o (~), 8o (~) ~oo
~"< q. (Z) ,, ~ .. (~) ~o (,~), ~oo
Table 37- Eating table for ~vel q~ity(~¢~ner, 1955).
C--067231(3-067231

Riffle Gravel SizeName 12-6" 6-3" 3-1" I"< Total Mean Rating
Hatchery (1) (2) (1) (1) 5 1.25 Good
~o= (1) (2) (2) (2) 7 1.7~ FaX
Goose (1) (3) (I) (3) 8 2.oo~errlnger (1) (3) (1) (3) 8 2.oo Fair
Table 38. Grave! size rating of four rifflesin the Feather River ((1) = Good,(2) = Fa~, (3) = Poor).
¯Mean Surface Mean Surface Mean
Number Intergravel Water Intergravel Water SeepageRiffle Date Standpipes Oxygen Oxygen Te~. Temp. Velocity
Hatchery 10/4/68 l0 10.8 ppm ll.15 ppm
Eour !o/! 3 8.7 9.3 18.7 18.9 1.64,, lO~2 6 9.o 8.9 17.8 !7.8 2.65" lO<17 9 lO.1 9.6 14.7 15.4 2.93’0 ~/25 8 ~1.2 10.9 ll.7 1!.4 3.28
Goose 10/7 4 8.7 i0.0 17.4 17.3 3.32" 10/9 9 10.4 10.3 16.2 15.7 2.34,’ Io/!8 9 ~1.5 lO.i 15.6 14.8 2.74,, ll/19 19 9.4 11.~
Herrlnger 9/11 ., 6 8.3 9.6 22.1 22.0 I.~7" " 9/13 3 8.7 9.2 ~i.0 21.0 0.94,’ ,, I0/16 ~ 9.6 10.3 14.8 i~.7 2.06" " lOll9 2 9-3 10.2 15.5 15.4 2.5~,, - 10~20 3 7.7 9.9 15.1 15.2 --,, ,, u/22 9 8.4 u.o ~.7
Table 39. Mean-intergravel oxygen concentrations, temper-atures, and seepage velocities taken from ~ters~mples out of stzndpl;es buried in Feather Rivergravels. Surface water oxygen concentrations andw~ter temperatures are included.

GrossNo. Redds Sac Fr-f Liv.__~e Dea___~d Survival
Upper Area1968 5 i00 596 51 93.21969 24 26 528 1,200 30 -51970 36 586 I, 356 583 76.91971 48 63~,201 1,444 46.81972 56 1,277 70.21973 24 i, I01 2,228 33. i
"1974 60 531 3,4~8 2,~hO 62.0
Upper( in-ri~r
1974 20 136 689
~d~e ~ea1968 19 167 144 47 86.91969~97o ~o e e37 5~ 8~.6l~l 25 1 ~5 50 71.61972
~9~3 ..........
Lower ~ea19~ 18 5 ~9 22 95.15i~69 i~ ~ 60 i 98.7¯ 9Vo ~ V8 ~5 ~8 8~.6
~z~ ..........
~3~9~ ..........
~Not s~!ed- high ~ter t~o~o~ seaso~¯ Not enoch redds fo~d to s~ple - ~ fo~d ~d NO eggs (false redds?)
Table 40. Sunmma7 of redds sampled by area,and’ cumulative totals of eggs andfry found.
C--067233(3-067233

|Ye~ Upper River Middle River Lower River U
1968 93.2 86.9 95.2 II
1969 3o.5 81.4 99.o!970 76.9 81.6 83.6 I19Tl 46.8 71.6 --
1972 70.2 97-3 -- ~
1973 33.1 .... ~1974 62.0 ....
!Table 41. Summary of mea~ percent gross king salmon eggsuryiv~l from selected riffle areas. I
!Yea___~r Upper River Middle River Lower River Hatchery Tota___~!
1968 6,500 4,600 i,i00 5,900 18,100
1969 18,500 30~200 7,500 4,400 60,600
1970 16,500 37,400 4,300 3,400 61,500
1971 18,200 22,000 3,200 3,500 47,000
1972 16,800 22,700 3,700 3,635 46,835
1973 25,500 34,400 5,200 8,477 73,577
1974 22,818 34,900 2,800 5,428 65, 946
Table 42. Estimate number of king salmon s;awning info’~ areas of the Feather River.
C--067234C-067234

III E__6g A~e in Weeks~ 6
--- 50
Upper ~6 ---(Emt chery Biffle) 71 66 -"I 86 61 ---~da~e 37(Big ~ff~e) 86
86 88I Lower
I~e ~ turtea ts~s of e~gs in t~ee r~v~ ~eas, ~970.
Co~ison of p~cent ~oss egg s~1 from
i (~ ~ercent s~~ is ~aer~nea~-
II
.225 -
IC--067235
C-067235

II|
Given Q (c.f.s.) 400 800
Assumed Eggs/~ 5,000 5,000
Observed Survival to Hatching 45% 6~%
Expected Number Fry that Hatch 2,250 3,100
Theoretical Survival Fry to Adult 0.2% 0.2%
F~xpected Number Adults Produced 4.5 6.2
Assumed Escapememt Ratio l: 3 l: 3
Calculated Number Adults Returnedto River (per 5,000 eggs) 1.12 1.55
Calculated Number Adults Capturedin Commercial and Sport Catch 3.38 4.65
Potential Percent Increase in Salmon -- 37.6
Table 45. Production of adult salmon at tYo f!owsin the low flow reach of the FeatherRiver.
C--067236(3-067236
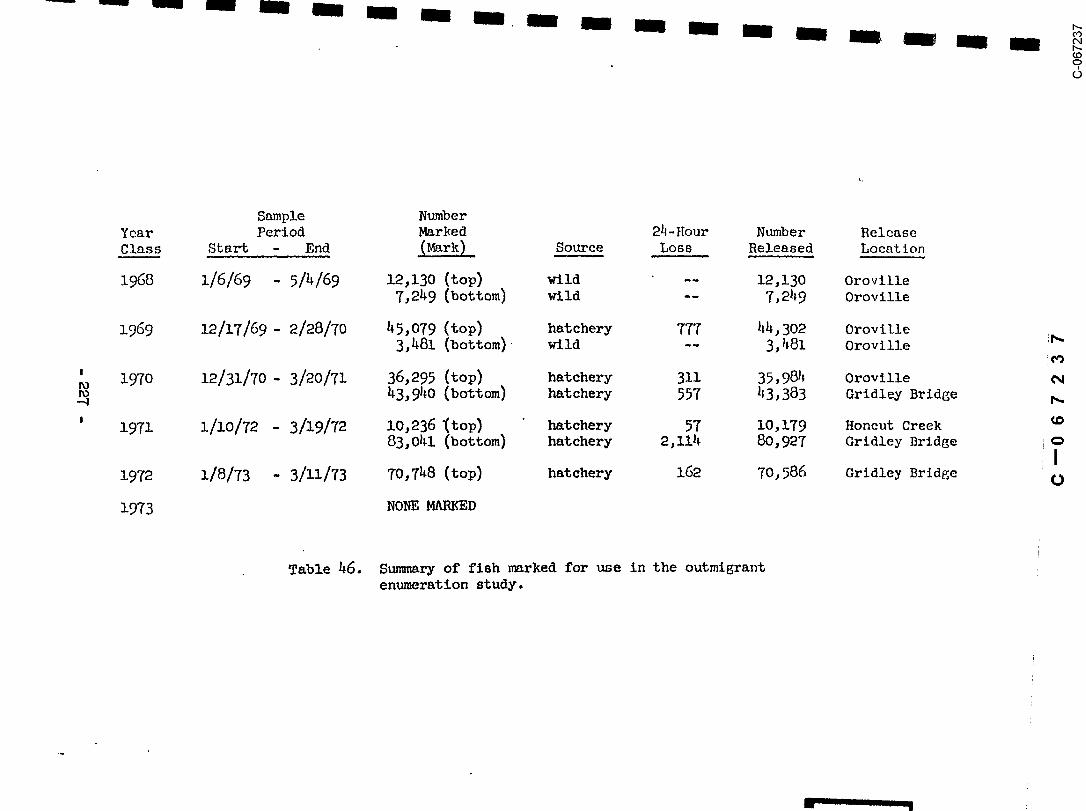
Sample NumberYear Period Marked 2~- }Tour Number ReleaseClass Stal~t - End (Ma[k) Source Loss Released Loeatlon
196S 1/6/69 - 5/4/69 12,130 (top) wild -- 12,130 Orovi[le7,2h9 (bottom) wild -- 7,2~9 Oroville
1969 12/17/69 - 2/28/70 45,079 (top) hatchery 777 ~,4,302 Oroville3,481 (bottom)- wild -" 3, I|81 Oroville
1970 12/31/70 - 3/20/71 36,295 (top) hatchery 311 35,9~ Orovllle43,940 (bottom) hatchery 557 ~3,383 Gridley Bridge
1971 1/10/72 - 3/19/72 10,236 ~top) hatchery 57 10,179 Honcut Creek83,0151.(bottom) hatchery 2,11~ 80,927 Gridley Bridge
1972 1/8/73 - 3/11/73 70,7~8 (top) hatchery 162 70,586 Gridlcy Bridge
1973 ~ONEMARKED
Table 46. Summary of fish marked for use in the outmigrantenumeration study.

Number Number Number 95%Y.ear Marks Marks Wild Fz-f Po.~ulation ConfidenceClas____~s Released Recovered Ca,~-tured Estimate Interval
1968 19, 379 20 ll, 300 iO, 9~9,135 6-17 million
1969 hT, 783 42 18,h56 21,338,651 15-29 million
1970 79, 367 365 " 199,750 40,965,000 36-hh million
1971 80,927 140 83,684 *24,500,000 N.A.
1972 70,586 67 14,405 15,176,000 11.7-18.9
1973 None Marked
*Estimate by ratio not standard formula (excessive predation)o
Table 47. Summary of mark and recove~/ programfor enumeration of king salmon fryoutmigratlons, 1969-1973.
Mean Monthly Flow
Adult Return3 Years Later 0.141 -0.248 0.266 0.127 0.258 0.435 0.171 0.429 0.282
Adult Return& Years Later 0.245 0.332 0.46_____9 0.224 -O.156 0.052 O.317 0.172 -0.240
Table 48. Correlation coefficients bet-~en meanFeather River flows and adult salmonreturns 3 and 4 years later for theyears 19~9 to 1973 (underlined coeffi-cients significant at the .05 percentlevel).
- 228-
C--0 6 7 2-3 8C-0~7238

Period 196~ l~ ~ 197~ 197~ 1973 197~
~ 8/2~ e33 187
~/~- 5 o o o o -- o~o . 3 o o o 83 o o~-~ ~ 0 0 0 0 0 0~eo 3~ o o o o eo oe~-e~ ~ ~ o y o ~o o~3o 6o 38 o ~ 83 8~ o
*(i) ~dde~ o~e~ ~ ye~.(~) ,, ,, ,,(3) ~dde~ o~e~e~ 8/13.(~) " ,, 8/~o.
.(6) " "(7) " " 9/3.
Table ~9- S~ of ~ s~oz t~t enteredFeather River ~tche~ d~ing ~of the 1~1974.ye~s
In
Year Cour~
I 1963 600 (Estimate)
l~ 3,362I 1965 1,189
I1967 Begin Hatchery Operation
ITable 50. Spring run salmon interim fish
facility counts at Fish Diversion
I Dam near Oroville.
n_ 229-
IC--067239
(3-067239

No. K.S. No. Livm Total RunNo. Trips Carcasses Salmon Seen (HatcherZ Count)
~8 ~l ¯ ~3
z~o 8 z z ~35
z97~ 9 4 ~T
1973 8 ~ 19 ~05
~ Z97~ 9 8 ~
~N~ incl~ed ~e 3R K.S. ass~ed s~i~-~ f~f~ carcass s~ey. .
¯ Weir p~cea l~ ~Zes above The~to A. O~f~.
Table 51. Summary of spring salmon carcass recovery program.
June July August Sept.
Ra..n~e , Mean Ran,~e Mean Ra,n~e Mean Range " Mean
z968 67- 54 62 67- 57 63 65- 57 6z 62- 52 57
i969 6o- 54 57 62- 57 6o 63- 53 60 56- 52 54
z97o 6l- 56 59 62- 59 60 63- 55 6z 58- 5l
1971 59- 52 55 63- 58 6o 63- 55 6o 57- 5z 54
1972 63-55 58 63-56 6o 63-53 6o 57-5o 53
1973 6o- 55 58 63- 56 6o 62- 5~" 59 ST- 5o 53
1974 61- 53 57 63- 59 61 63- 5k. 59 5~ 52 55
Table 52. Monthly mean and range of Feather River watertemperatures near Oroville.
- 230-
c-0- -7 4 oC-067240
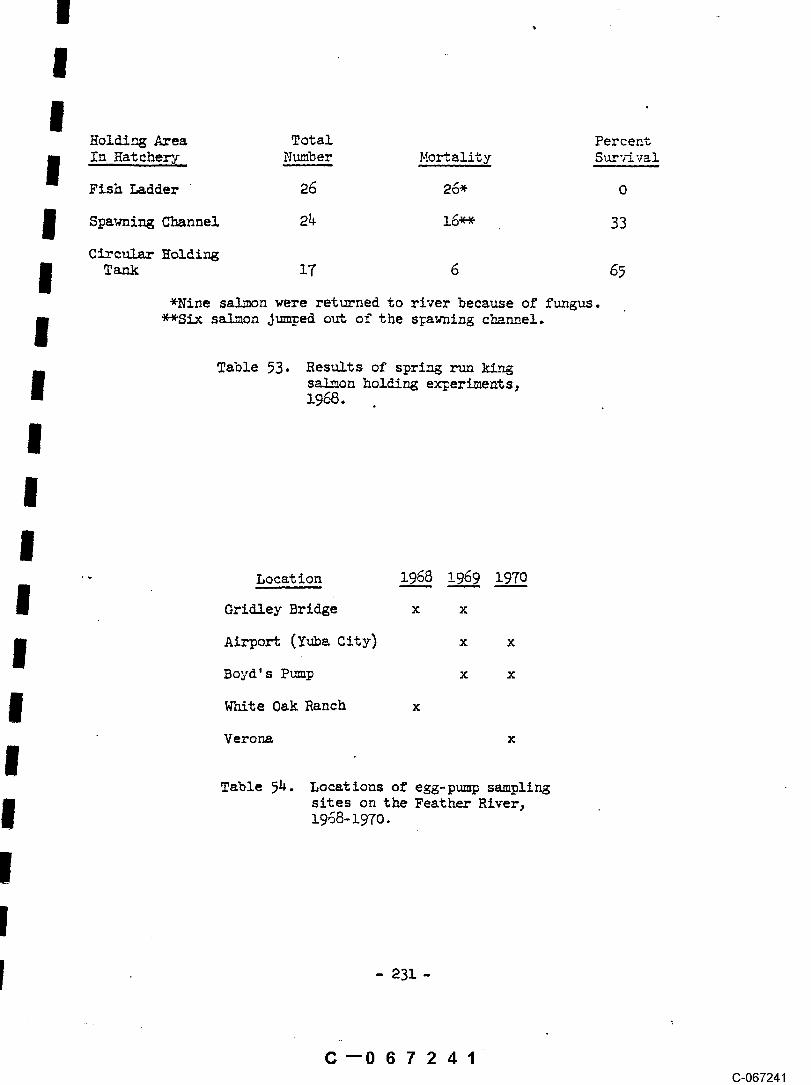
Holding Arma Total PercentIn Hatchery Number Mort~ality Sur’zival
Fish Ladder 26 26* 0
Spawning Channel 24 16-* 33
Circular HoldingTa~ 17 6 6~
*Nine sa .lmon were returned to river because of fungus.**Six salmon Jum;_ed o~ of the s~awning channel.
Table 53. Results of spring run ki_ngsalmon holding experiments,1968.
Location 1968 196_9 197___~0
Gridley Bridge x x
Airport (Yuba City) x x
Boyd’ s Pump x x
White Oak Ranch x
Verona x
Table ~. Locations of egg-pump samplingsites on the Feather River,1968-1970.
C--067241(3-067241

l, iGRIDLEY BRIDGE WHITE O.~X ~ZET TOW
~Shad #S. Bass Water #S-had ,~. Bass WaKerChecked E_~ Eggs Temp. Eggs Eggs Tem~___~: Boyd Gridley
9 Installed 1lO 0 0 Installedii O 0 64 0 0 6112 o o 62
15 O 0 61 0 0 5916 0 ~ 59 I1
~T o o ~8 118 O o 57 0 0 56
20 0 0 57 o o 552122 0 0 0 0
~ o o o o water was shut off I~ 0 0 0 0
28 0 0 60 0 0 63
~? o o ~i o o ~ ~ ~. .2 0 0 61 0 0 63 1 SB~3 o o 60 o o ~2 3 As~ o o o o o~ Pump taken out
0 0 , O O
lO 0 0 0 0
12 0 0 61 0 0 1
114 0 0 59 ll AS 0
~l[ll~0 0 61 0 0
il~ o o 62 o o1920 0 " 0 0 0 I
122 0 0 0 0
~ o o ~ o~ o o o o I~ o o o o I
Table 55- Numbers of eggs collected at several e~g-pumpsites in 1968.sampling
- 232-
¢--0672420-067242
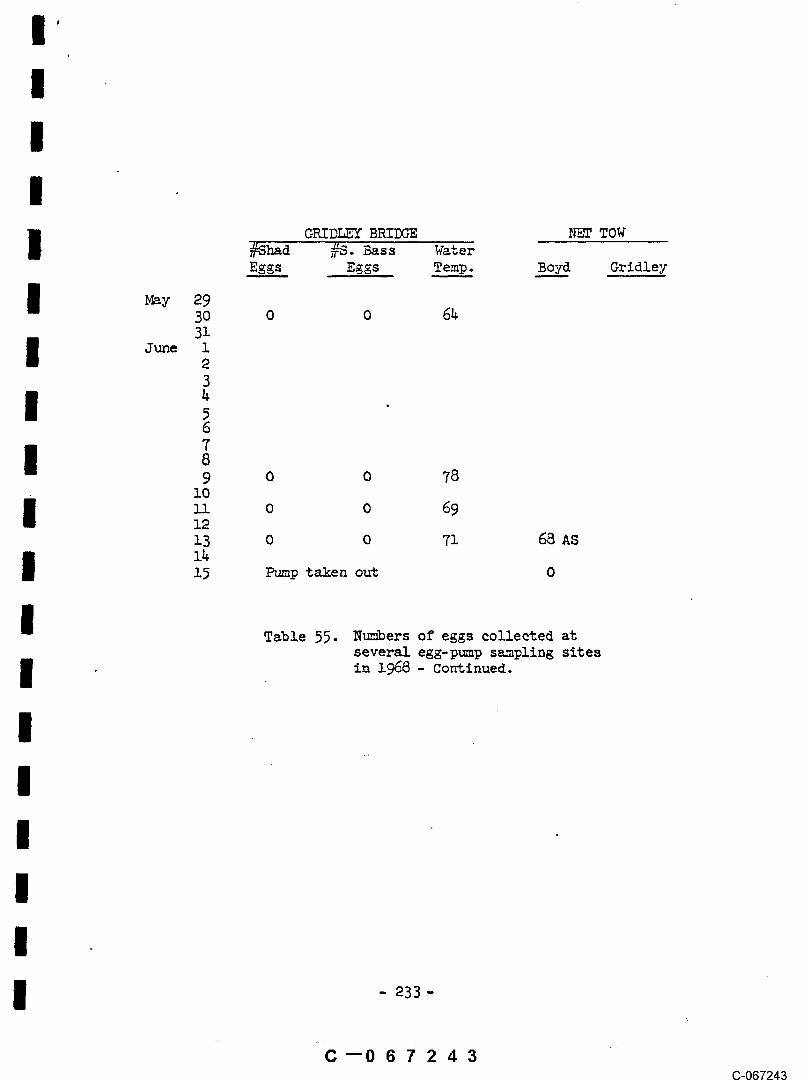
GEIDLEY BRIDGE ~ TOW~Shad ~,7~- Bass WaterEggs Eggs Temp. Boy____.d Gridley
May 2930 O O 64
June 1
3
9 o o 78lOii o 0 691213 o o 71 68 AS
15 Pump taken out O
Table 55. Numbers of eggs collected atseveral egg-pump sampling sitesin 1968 - Continued.
233-
C--067243(3-067243

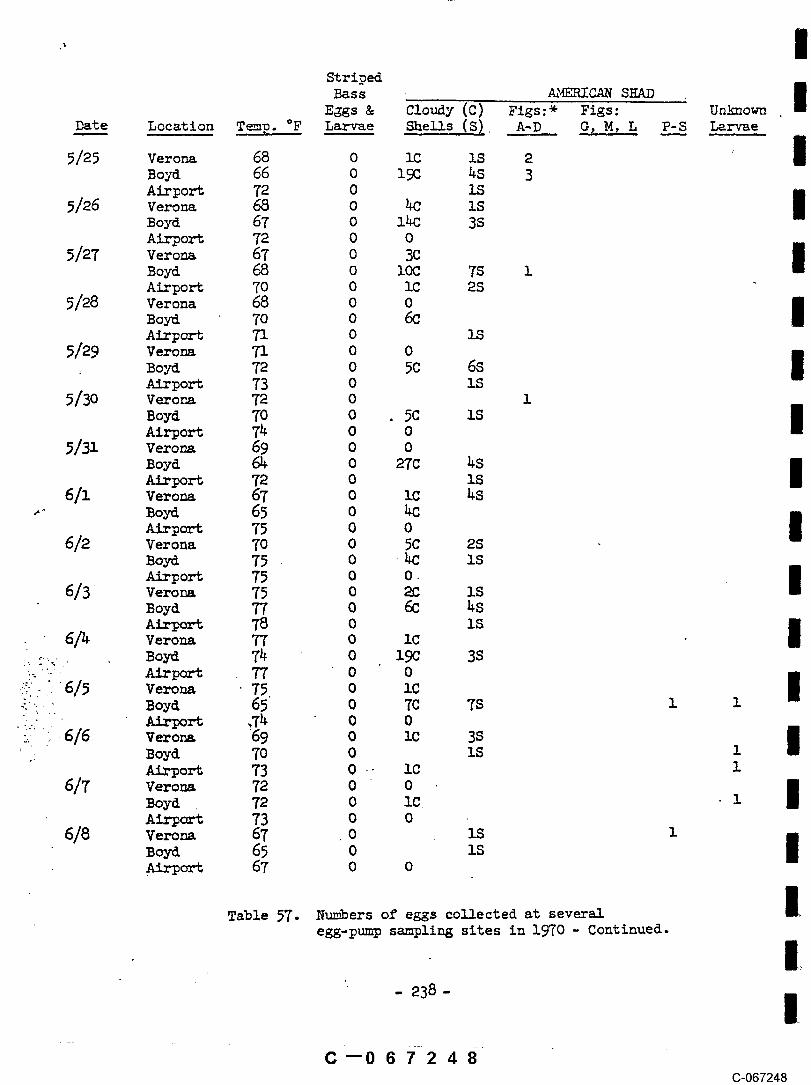
m,ZRIC~2~ SHADStri~ed Cloudv (C) Figs: * Fiss: Ur~nown
Dat__~e Location Temp. °F Bass Shells (S) A-D G, M, L P-__S Larvae
518169 Boyd 60.0Airport 61.0Grldley 61.5
Airport - ICGrldley Sample Not Taken None
5/14/69 Boyd 67.5 3S 3Airport 59.0 2CGridley None
5/16/69 Boyd 57.0ASrport 59.0 7C 1Gridley -
5/17/69 Boyd 60 5C 3S 1 1 1ALvport 61 3C 3s oGridley 60 None
5/19/69 Boyd 58 29C 2Airport 61 hC 0Gridley 63 None 0
5/9-I/69 Boyd 58 29C 1Airport 61 8C 0Grid!ey 61 IC 3S
5/~3/69 Boyd 57 53C 28S 6Airport 61 5C 4S 0
~ Gridley 61 IS5/2h/69 Boyd 58 ~OC llS 3 i 4
Airport 61 5C 12S O 1Grldley 62 2S
5/26/69 Boyd 59 67C 29S 8 1Airport 62 4C 1 1Grldley - -
5/27/69 Boyd 59 53C 18SAirport 62 5C 0 1
.... ¯ . Grldley 62 --~. 5/29/69 Boyd 61 107C hOS 19 1
Airport 61" llC 2hS 0 ¯Gridley 60 -
./ 5/31/69 Boyd "62 2h3C lOOS ~5 1Airport 66 15C 3S 3Grldley
6/~/69 Boyd 6~ 325C NC 72 5Airport 67 26C 0 ¯Gridley 67 o
6/~/69 Boyd 63 326C NC 75 1 1Airport 66 18 IGrldley 65 0 0
F̄rom Leach (1925)
Table 56. Numbers of eggs collected at several I~egg-pump sampling sites, 1969.
C--067244(3-067244
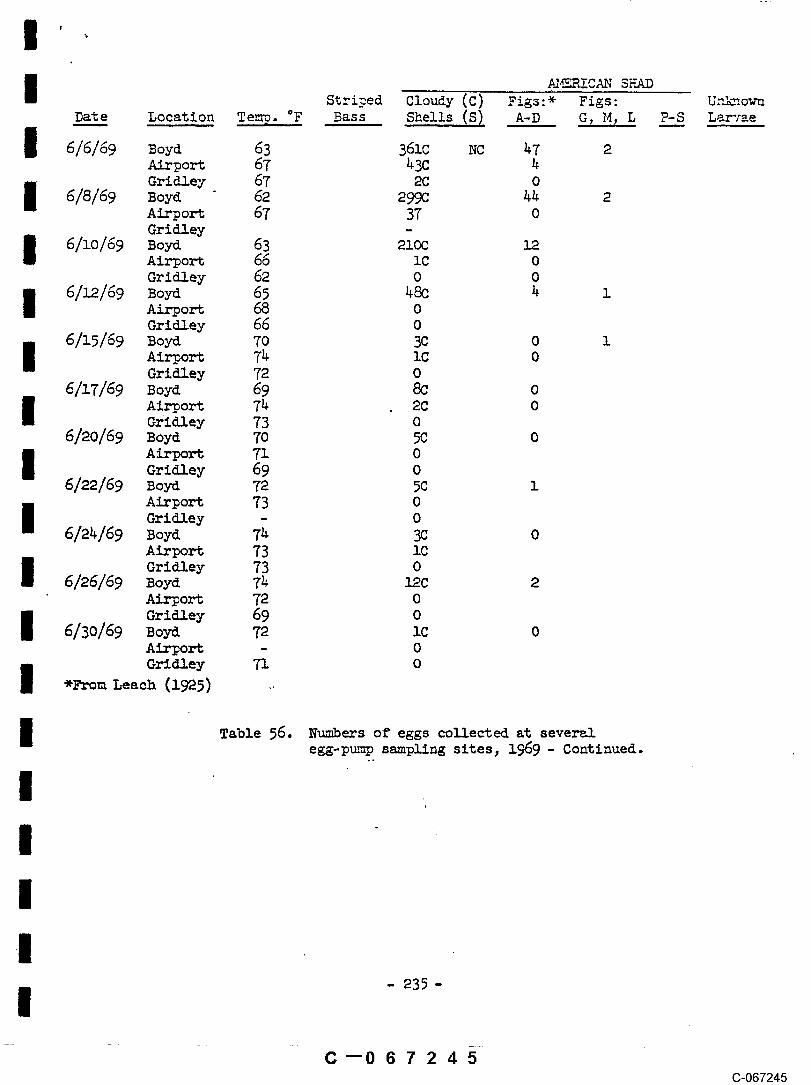
~KRICAN SHADStri.~ed Cloudy (C) Figs:* Figs: Ur.k~ o’~n
Dat.__~e Location Temp.. °F Bass Shells (.S) A-D G~ M~ L P-~ Larvae
6/6/69 Boyd 63 361C NC~po~ 67Gri~ey 67 2C 0
6/8/69A~po~ 67 37 0Gri~ey -
6/10/69 Bo~ 63 21~Ai~o~ 66 1C 0Gri~ey 62 0 0
6/~/69 Boyd 65 4~ 4 1Ai~o~ ~ 0Gri~ey 66 0
6/15/69 Boyd 70 3C 0 174 1C 0Ai~o~
Gri~ey 72 06/17/69 Boyd 69
Ai~o~ 74 2C 0Gri~ey 73 0
6/20/69 Boyd 70 5C 0A~ 71 0Gri~ey 69 0
6/22/69 Bo~ 72 5C 1A~po~ 73 0Gri~ey - 0
6/2~/69 Boyd 7h ~ 0Air~ 73 1CGri~ey 73 0
6/26/69 Boyd
Gri~ey 69 06/30/69 Bo~ 72 1C 0
A~ - 0
*~m Leach (1~5) ..
Table 56. Numbers of eggs collected at severalegg-p~mp sampling sites, 1969- Continued.
i- ~35-
C--067245(3-067245

StripedBass AME ICAN SHAD
Eggs & Cloudy (C) Figs:* Figs:Date Location Temp. °F Larvae Shells (S) A-D G, M, L P-S Lar:~_e
4/23 Airport 59 0 0Boyd 59 0 0
4/24 Airport 59 0 0Bo~a 59 o o
4/25 Air~o~ 59 O 03o~ 59 o o
4/26 Airport 59 0 0Bo~ 59 o o
Boyd 58 0 0~/a8 Ai~o~ 58 0 0
Bo~ 59 o o~/e9 A~o~ 60 0 0
~o~ 59 o ~c4/30 A~o~ 6a 0 0
~o~ 59 o ~c~/~ A~o~ 63.5 0 . 0
~o~ 59 oVero~ No ~ple
~/a A~o~ ~ o oBoyd 59 o 3cVero~ No S~le
5/3 A~o~ 66 0 0~o~ 58 o 3cVero~ No ~le
5/~ A~o~ 67 0 0Bo~ 6o o 3c 4Vero~ No ~ple
5/~ ~~ o oBoTd 58 0 aC 3 I
ve~ ~o ~e I~/~ A~ 62 0 0 I
Bo~a 5T o 3cVero~ No ~le I
~/7 A~m~ ~ o o IBo~ , ,58 o o
’ Ve~ No ~ple5/8 ~~ 6~ .o o I
Bo~ 56 0 .. 1CVero~ No ~ple
~/9 Ai~o~ 62 0 0Boyd 61 0 iC 1Vero~ No
*~om Leach (i~5)
Table 57. N~ers of eggs collected at severale~-p~p s~mpli~ sites in l~0.
- 236-I.
C--067246C-067246

!i ’
StripedBass A~4ERICAN SHAD
Eggs & Cloudy (C) Figs:* Figs:
I Dat_.._~e Location Temp.~. °F Laz-~ae Shells (S) A-D G~ P-S Lar-rae
~/lO ~o~ 62 0 lS
~ Bo~ 6z oV~or~- ~ No S~ple
5/~ A~ 63 O OBo~ 56 o ZTC 7sVero~ 63 No ~le
5/~ Verona No S~plemo~ ~5 o ~ 3sA~ 62 0 0
5/1S Vero~ No ~pleBoyd 5T 0 1S 1Ai~o~ 63 o 0
5/14 Vero~ 60 o 0Boyd 58 0 IC iSA~t 66 0 IS 1
5/15 Vero~ 62 0 0Bo~ NoA~o~ 67 0 0
5/16 Vero~ 6~ 0 0Boyd NoA~ 69 0 0
5/17 Vero~ 66 0 2CBoya 6~ 0 0A~o~ 71 0 0
~5/18 V~o~ 63 0 IC 2S62 0Bo~
A~ 69 0 05/19 V:o: 63 o 3s
Boya 6Z 0 l~ 5S iA~ 66 0 iC iS
5/20 VeroB 6~ 0 ~ ZS iBoyd 6Z 0 ~C 2S 3A~ 66 0 1O IS
5/~ Vero~ 6~ 0 ZCB~ 63 0 ~ 6S
69 0 ZCA~~/~ Vero~ 66 0
Bo~ ~ 0 i~ ~S iA~ 70 0 ¯ 0 0 Z Z66
5/23 Verona 69 0 30 iBo~ 65 0 ~7C 3SA~ ~ 0 lS
5/e~ Vero~ 69 0 3CBoza 65 o 35c 7sAi~o~ 70 0 0
Table 57. N~ers of e~s collected at sever~e~-p~ s~pli~ sites in i~0- Continued.
C--067247C-067247
StripedBass ~ML~ICAN SHAD ¯
Eggs & Cloudy (C) Flgs:* Figs: UnknowuDat___~e Location Temp. °F Larvae Shells (S)~ A-D G, M, L P-S Larvae
5/25 Verona 68 0 1C 1S 2 " mBoyd 66 0 19C 4S 3Airport 72 0 1S
5/26 Verona 68 0 4C ISBoya 67 o 14c 3sAirport 72 0 0
5/27 Verona 67 0 3CBoyd 68 0 10C 7SAirport 70 0 1C 2S
5/28 Verona 68 0 0 ¯Bo~ 7o o 6cAirport 71 0 1S
5/29 Verona 71 0 0 m
Airport 73 0 iS5/3o Ve~or~ 72 0 1
BoyC 7O 0 . 5C ISAirport 74 0 0
5/31 Verona 69 0 0Boyd 6~ 0 27C 4S ¯A~rport 72 0 1S
6/i Verona 67 0 1C ~S
Airport 75 o o6/2 Verona 70 0 5C 2S
~o~a 75 o ¯ ~c isAirport 75 0 0. ¯
6/3 Verona 75 0 2C ISBoyd 77 0 6CALl, oft 78 0 IS ¯
6/~ Verona 77 0 IC
" 6/5 v~ona 75 o zcBoyd 65’ 0 7C 7SAirport ,Tk 0 0
6/6 Verona 69 0 1C 3SBoyd 70 0 1S 1Airport 73 0 .- 1C 1
6/7 Verona 72 0 0Boyd 72 0 lC. 1
Airport 73 0 06/8 Verona 67 0 lS 1 mm
~ort 67 o om
- 23~- m
C-067248
StripedBass AMERICAN
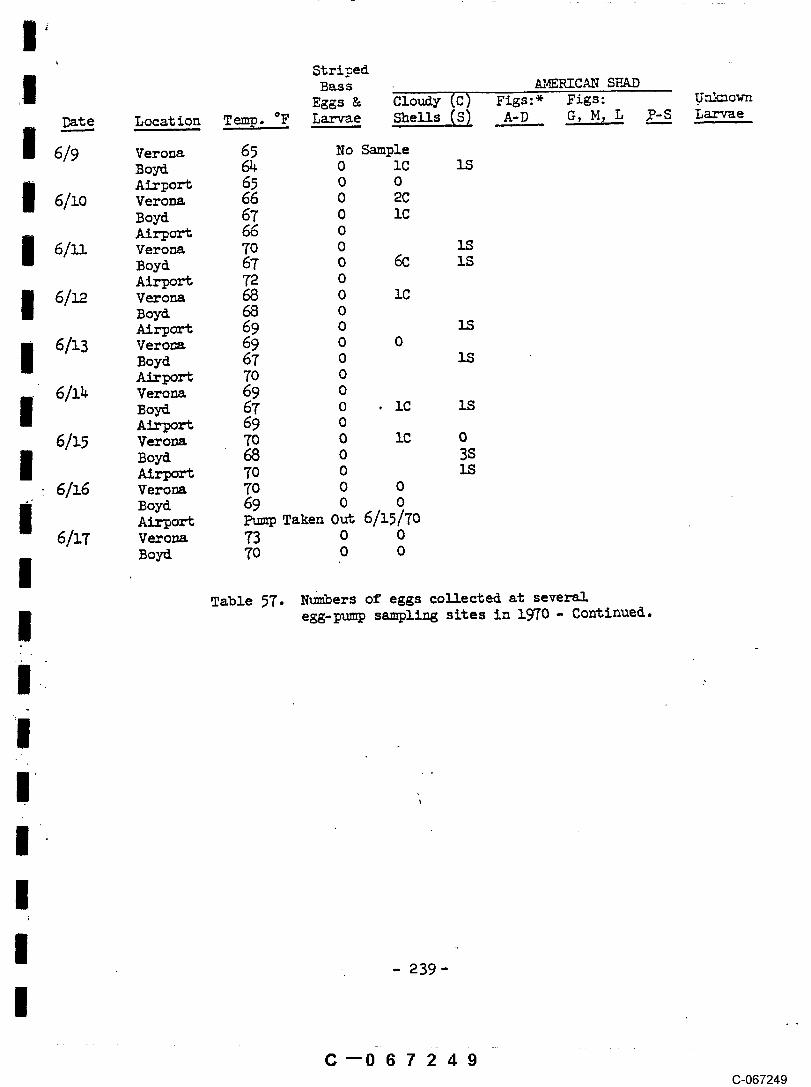
Eggs & Clou~ly (C) Figs:* Figs: .UnknownDat___~e Location T~. ~F L~a~ Shens (S) A-D G, M~ L ~-~ L~e
6/9 Verona 65 No ~ple
Bo~ ~ 0 IC ISA~po~ 65 0 0
6/10 Vero~ 66 0 eCBo~ 67 0 lCAi~ 66 0
6/~ Vero~ 70 0Boyd 67 0 ~ lSAi~ 72 0
o
~~ 69 o6/13 vero~ 69 o o
Boyd 67 oA~ 70 0
6/1~ Verona 69 0Bo~ 67 0 ¯ iC ISA~ 69 0
6/15 Vero~ 70 0 IC 0Bo~ ~ 0 3s~~ 7o o
6/16 Veyo~ 70 0 0Boy~ 69 o o~~ ~ Taken O~ 6/15/70
6/~7 v~o~ 73 o oBo~ 7o o o
Table ~7- N~e~s of eggs eo~ected ate~-p~ s~li~ sites in i~0 - Continued.
C--067249(3-067249

Locat ion 1970 1971 1972 1973 197&
Live Oak X
Yuba City X X X X X
Yuba River X X X
Boyd’ s Pump X
Star Bend X
Verona X X X
Table 58. Location of net-to~sampling sites, 1~70-1974.
Number of Larvae SampledYear Weighted by Flow Index Value
19Tl 97.4 x 10⁵ 1.oo
19T2 ~o.8 x lO5 o.62
1973 69.4 x 10⁵ 0.71
Table 59. .American shad "Index of ISpawning Abundance" com-puted from data from YubaCity-Marysville Site, I
Feather River, 1971-1974.
!C--067250
C-067250

I1
.L.ocation 19~_____9 197_____0 i~ 197____2 ~ i~
I Live Oak~ X X X X X X
Verona X X X
Shanghai Riffle X X X
I Yuba RiverX
Table 60. Fyke-net locations used forsampling young-of-the-year
i American shad, 1969-1974.
III
Shanghai Riffle X X XIVerona X
T~ole 61. Locations of beach seine sites usedfor sampling young-of-the-yearAmerican shad, 1972-1974.
I
C--067251(3-067251
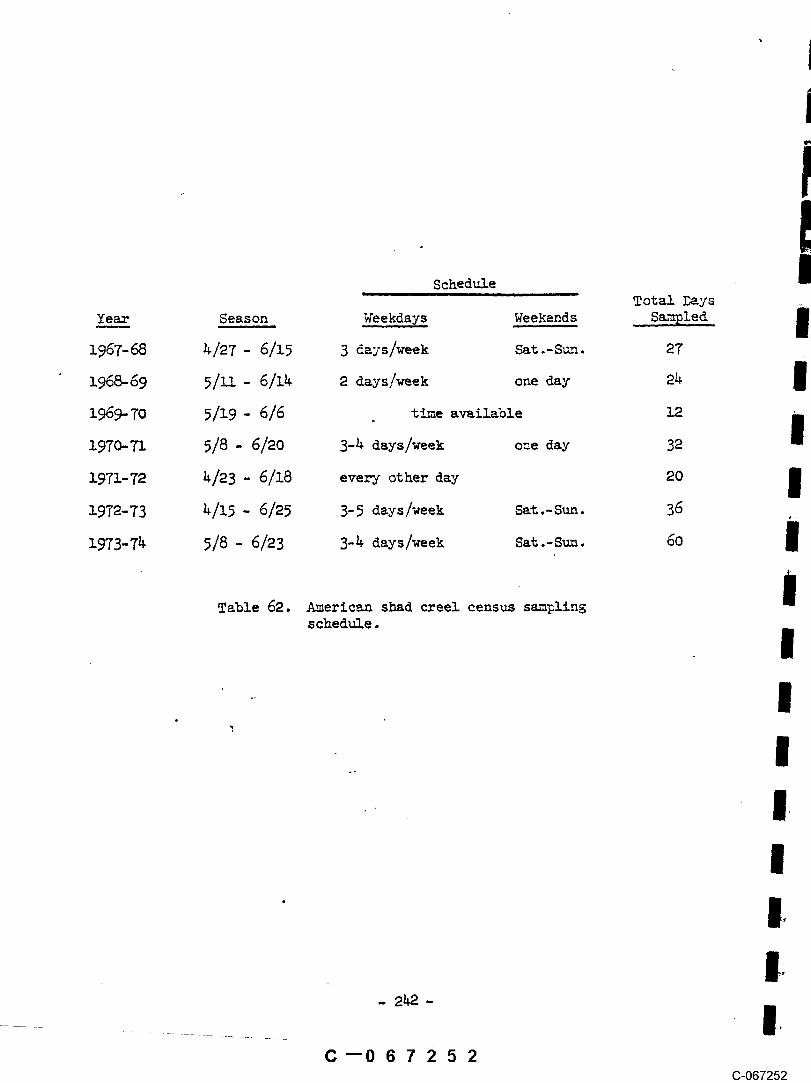
ScheduleTotal Days
Ye..__~ Season Weekdays Weekends Smmpled
1967-68 b,/27 - 6/15 3 days/week Sat.-Stun. fit
1968-69 5/ll - 6/14 a days!week one day 24
1%9-70 5/19 - 6/6 time available 12
1970-71 5/8 - 6/eO 3-~ days/week one day
1971-72 ~/23 - 6/18 every other day 20
1972-73 ~/15 - 6/25 3-5 days/week Sat.-Sun. 36
1973-74 5/8 - 6/23 3-4 days/week Sat.-Sun. 60
Table 62. American shad creel census samplingschedule.
C--067252(3-067252
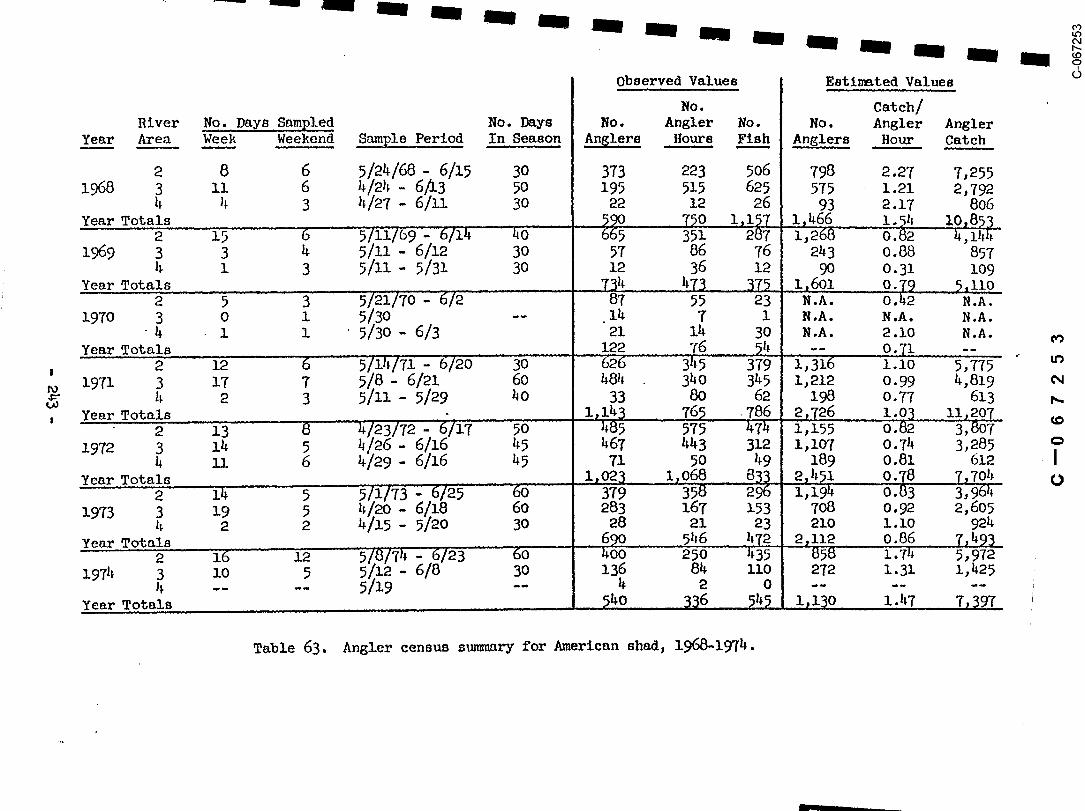
Observed Values Estimted Values
No. Catch/River No. Days. Sampled No. Days No. Angler No. No. Angler Angler
Year Are___~ Weel___.j~Weekend Snmple Period In Season Anglers Hours Fls.__~h.A, nglers~ Ho~ Catch
2 8 6 5/24/68- 6A5 30 373 ~23 506 798 2.27 7,255i~8 3 ii 6 4/2~- 6~3 50 195 515 625 575 1.21 2,792
~ 4 3 I~/27- 6/11 30 22 12 26 93 2.17 806Year Totals 5~ 750 1,157 1,466 i..54 I0,8~3
2 15 6 5~i/69"-]"6/14 40 665 351 287 "1,2~8 ’ 0.82 ..... 4,141~1969 3 3 k 5/.11- 6/12 30 57 86 76 243 0.88 857
4 i 3 5/11- 5/31 30 12 36 12 ~ 0.31 109Year Totals 734 ~73 _ 375 I.,6QI 0.79 5,110
2 5 3 5~21/70 6/2 87 55 23 N.A. 0 .I~2 N .A.1970 3 o 1 5/3o -- . lh 7 1 N.A. N.A. N.A.
4 1 1 5/30 - 6/3 21 lh 30 N.A. 2.10 N.A.Year Totals 122 76 ~4 --
O.71’ --
2 12 6 5/’~/71- 6/~6 30 626 31~-5 379 ~i,~i6’ i.i0 ’ 5,7751971 3 17 7 5/8- 6/21 60 ~ 340 345 1,212 0.99 4,819
~ 2 3 5/11- 5/29 40 33 ~ 62 i~ o.77 613Year Totals i,i~3 _ 765 : 786 2,726 1.03 I!,.~Q7
2 13 8 ’~/23/72-’~/17 50 I~85 " 575 474 1,155 ...... 0.82 3,8071972 3 I~ 5 4/26- 6/16 45 467 4~3 312 1,107 0.74 3,~85
& ~ 6 4/29- 6/16 ~5 71 50 49 189 0.81 61~Year To~Za .. X,oe3 . ~,068 _ 83~ e,i~ .T,7o~,
2 I~ 9 5/1/73 : 6/25 60 379 398 2~ 1,19 O. 3 3,9~41973 3 19 5 I~20 - 6~18 60 283 167 153 708 o.92 e, 605
4 2 2 ~/15- ~/2o 3o 28 21 e3 21o l.ZO 924Year Totals 6~ 546 *,72 2,112 0.86 ..
~9Y4 3 ~o ~ 5~ -~ 3o 136 8~ ~o ~Ya ~.3~
~e~ ~o~ ~0 .... 336 , ~1~ ’, 1~1~0 1.1J
Table 63. Angler census stmmmry for American shad, 1968-197~.
I
1i
Observations Sign A ~T = Sign ~ Egg Abundance A~reement
36 ~ 5B.3
35 eo 57.~
I
14 -~ 78.6
6 ~ 66.7
2 2 i00.0
e ~ i00.0
Table ~. S~ry of ~ired obse~tlons of,.c~nges in ~ter tem;er~t~e and I
associated c~es in ~rican s~d Iegg abidance.
II
IC--067254
(3-067254

A~NALYSIS OF COVARYAuNCE TABLE (COMMON LLNE)
So~r ce S. S. d. f. M. S.
Total (ST) 7,684 3~-2 = 382Within Lines (S.E) . 5,870 384-~ = 380 17.26Bet-~en Lines (ST-SE) 1,814 2(2-1) = 2 906
F = MST’E = 90___~_6 = 52.49 (Reject ~Hyp.)~ z7.26
ANALYSTS OF COVA~CN TABLE (C0~ ~)
So~ce S. S~ d. f~ M. S~
Tot~ from Both ~,051 3~-~-1 = 381Recession Line~ (Ss) 5~870 3~-~ = 380 17.26Within ~ch Line (~) 5,309 i 5,309~e to Co~n Slope (Ss-~)
=17.~
~Y~S oF cov~~ T~ (~ = O)
So~ c e S. S~ d. f~ M. S~
WitCh( ~e~es slon Disreg~ea) (~) a4,8~Within and Abo~ Each Line (~) 5,870 3~4 = 3~ 17.~6~e to Regression (~-~) 19,~9 ~ 9,514.5
F = = = 551.R5 (Reject ~.)~O-E 9,514.5
Table 65. ~ysis of co~riance tables for pre and ~o~Orovllle ~oJeet river temperat~es in thespring months,
C--067255(3-067255

Sampling Frequency Total Number of
Year Periods Stri~ed Bass Eggs~ Stri~ed Bass Eggs
~9TO 57 o o
1972 32 b 0
1973 5]- 1 5
197~ ~9 7 5,408
Table 66. Presence of striped bass
eggs in tow net s~ples.
C--067256C-067256

Observed Values Estimated Values
No. Catch/River No. Days Sampled No. Days No. Angler No. Percent No. Angler No.
Year Section Week Weekend S~m~,!e Period In Season Angler, s ~ Hours Fish Catch Anglers Hour Fish
2 No Data1968 3 19 lO 4/18/68- 6/11 60 lo 45.5 504 o.olh 28
I~ 12 3 5/8- 6/7 30 65 89 12 54.5 129 0.135 70Year Totals , 309 , 781 22 633 0.028 98
2 No Data1969 3 19 i0 4/16/69- 6/22 60 489 1,368 53 32.3 l,Olh 0.039 158I~ ~ 19 i0 4/16 - 6/22 60 601 i, 569 Iii 67.7 1,206 0.071 31~2
Year Totals i~090 .... .~,937 164 2.,229 ii10"056 5002
197o 3 NOT SAMPLED
Year Totals2 No Data
1971 3 14 8 3/30/71 - 5/29 60 722 1,692 49 23.1 I, 968 0.029 2284 ll~ 8 3/30 - 5/2960 719 2,641 163 76.8 1,962 0.062 487
2 13 -6’ 3/6/72 ’ 5/9 ~6 " ~22 "’ 350 1 2.3 ~oo 0.003 61972 3 13 6 3/6- 5/9 40 181 309 2 h.5 380 0.006 9
1~ 13 6 3/6- 5/9 40 395 899 ~I 93.2 832 0.0~6 153Year Totals 798 I~ 558 ;~ it680 ’0.028 168
2 11 ~ 3/lS/7’3’-~ 6/3 6o~ 72 92 ~ 7 " 2°(0 0.d873 26 . 15 3/26 - 6/17 75 420 784 12 iO.5 765 0.O151973 4
13 6 3/26- 5/31 60 615 1,637 94 82.5 1,944 O.057Year Totals 1,107_. 2,513 114 2,. 979 0.045 583
2 4 ...... 6 ’~/12/74 -~ 6/19 60 46 121 0 0 " 276 ....197~ 3 33 14 4/11 - 6/23 60 2,003 5,746 395 72.3 2,557 0.069 703
4 ii 8 4/11- 6/4 50 695 2,764 151 27.7 1,830 0.055 bOOYear Totals __ 2,~44 8,631 546 4,663 0.063 i~i03.
Table 67. Angler census summary for striped bass, 1968-1974.

River Apri! ~ May ~ ~
Section April Q ~ Minimum °T Minimu~ °T
Mid-River 0.854. 0.629 -O.815- -0.649i
Lower River 0.712 O~ 9R~* - 0.584 - O. 649
Table 68. Coefficients of correlation (r)for catch rates and river dischargeand catch rates and river tempera- Hture in two reaches of the FeatherRiver (*significant at the 5 per-
cent level), j~
!
C--067258C-067258
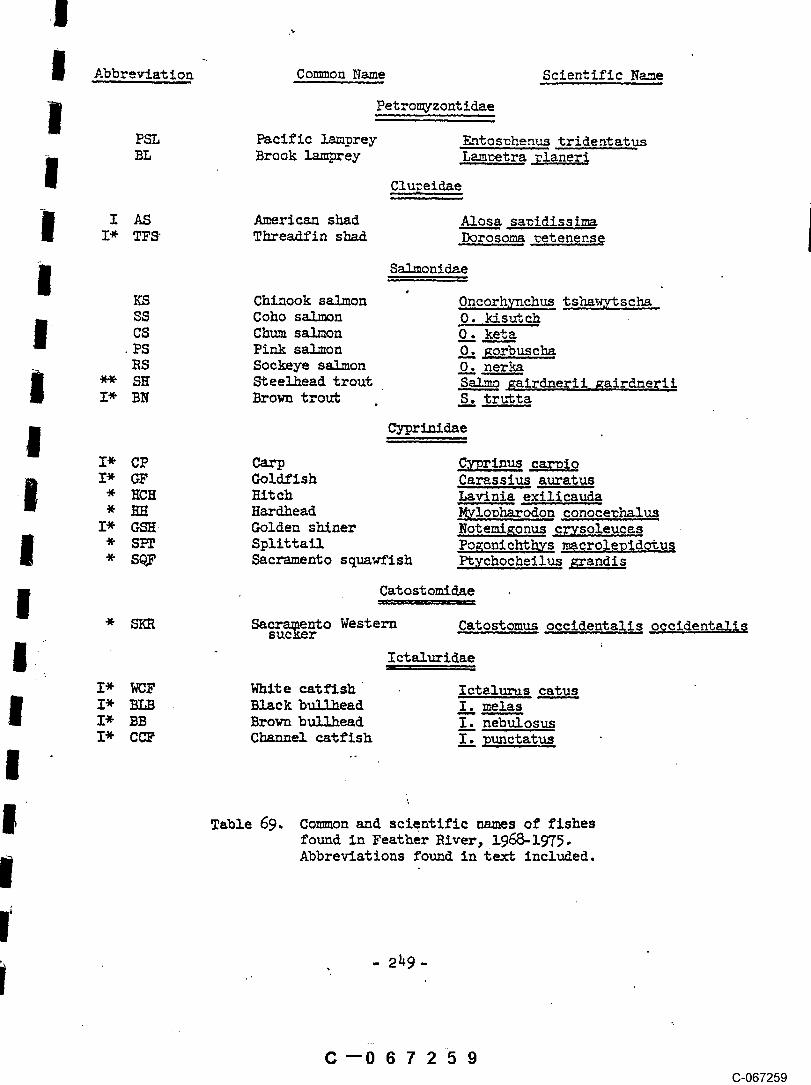
Abbreviation Common Name Scientific Name
Petromyzontidam
PSL Pacific lamprey F~utosmhenus tridentatusBL Brook lamprey Lamwetra pla, ner,,~
Clu.~eldae
I AS American shad Alosa sawidissimaI* TFS Threadfin shad -~-orosoma wetenense
ST°nidae
cS~Chinook salmon Oncorhynchus tsha..~tschaCoho salmon O. kisut’chChum salmon 0 keta
P̄S Pink salon ~. ~r~uschaRS Sockeye salmon ~. ~erka
~* SH SteeLhead trout ~-alm’-~-~airdmerli ~airdnerilI* BN Brown trout ¯ S__-~ru~cta -
Cyprlnidae
I* CP Carp Cy~rinus caroloI* GF Goldfish Carassius auratus* HCH Hitch Lavinia ex~a* EH HardheaC
I*GSH¯ Golden shiner Notemi~0nus crysole~as* SP~ Spllttail Po.gonichthys m@,c,r~lep~dotus* SQF Sacramento squawfish ’Ptychocheilus ~randis
Catostomldae
* SKR Sacramento Western Catostomus occidentalis o¢cidentali~.sucker~ctaluridae
I* WCF White catflsh~ . Ictalurus catusI* BLB Black bullhead I. melasI* BB Brown bullhead ~. ~osusI* CCF Channel catfish ~.
Table 69. Common and scientific names of fishesfound in Feather River, ~1968-1975.Abbreviations found in text included.
C--067259C-067259

Abbreviat ion Common Name Scientific Name
Centrarchidae
I* GSF Green sunfish Lepomis �:FanellusI* WB Warmouth bass Chaenobr~ct.us gulosusI* BG Bluegill Le~omis macrochirusI* SMB Sma!funouth bass Micropterus dolomieuiI* LMB Largemouth bass Microwterus salmoidesI* BCR Black crappie Pomoxis ni~omaculatus
Percidae
I* LP Logperch Perclna camrodes
Embiotocidae
TP Tule perch Hysterocarwus traskil
Cottidae
* RSCP Riffle sculpim Cottus gulosus
Poecillidae
I* GAM Mosquitofish Gambusia affinls
Serranidae
I** SB Striped bass Morone s~xatills
Ac!.D, ens eridae ¯
WST White sturgeon AciPenser transmontanus
Introduced to" CaliforniaResident speciesNormally migratory - but found in river all year
Table 69. Common and scientific names of fishesfound in Feather River, 1968-1975.Abbreviations found in text included -Continued.
\
C’O 6 7 2 6 0~-C-067260

Fish Species___~ ~sc__~ c~ ~ ~c__~ s_~_~ ___~ ___~
i~8 .0755 1.~Ol 1.636 .155 .091 .136 i.~07 .078 Catch per~nute of
1~4 .047 7.109 £.641 .lhl .672 0 3.703 .016 electric~field
Calc~te~ t .~46 1.608 1.832 .~4 ~.~7 .~ 2.966 -5~ ~ d~tion
¯ 05 2.23 2.20 2.20 ~.20 2.20 2.20 2.20 2.20
D.F. I0 ~ ~ ~ ~ ~ ~ ~
Species Co~ed: 1969 vs. 1974, ~ = 1.73 where ~ .05 = 14.07 at 7 D.F.
Table 70. Comparison of electro-fishing catch for theyears 1968 and 197~. Sample area is from theOroville Fish Barrier Dam to Highway 162Bridge, Feather River.. Catch per minute ofelectric field duration and results of Student’st test are shown.
.
!
C--067261C-067261

Net, ~ *FI&~! SPECIESDat__.~e ~ A__S TF___S SMBL____~ BGWBRSCPGAM CP GFSKR S,~ ]IHGSHHCHSTT SB PWPSLAMMO BLLPTPWCFCCFBLBB~ BCR GSF
Year:1969
e~Yg~-. 30
Jan. 5
I 2 2 iJan.6-12 6 43 2 o 5 i~ 3 1 1
Jan 27-Feb. 2 6 47 1 6 4 1 1 1
3-9 13 1 193 1 ~ l~ lO 9 1 1 1 i
Feb. ~4-~rch 2 i~ i0 5 8 2 8
3-9 16 34 - 5 " 20 T 2 ¯
17-23 ~ i~ 2 59 3 74~;~- 30 12 ~ 19 Ii~ 8 1
March 31-
7-13 16 3 16 97 1
2o-22 2 i 5 3227-29. 2 3 39
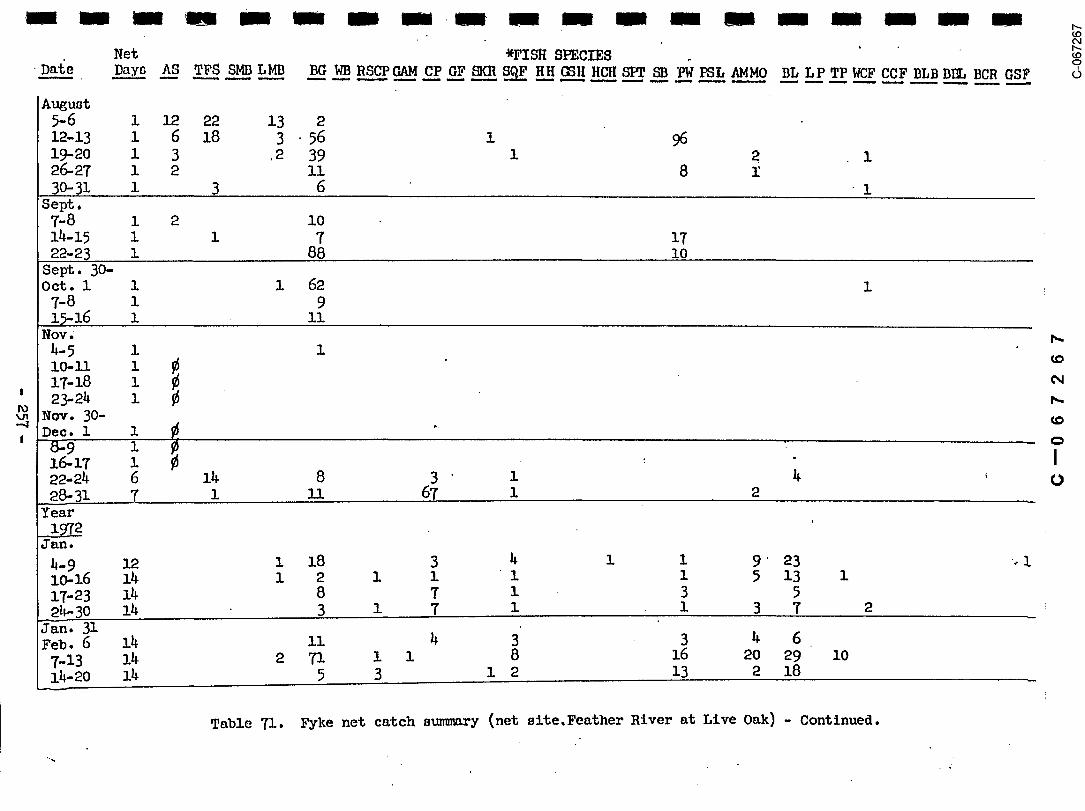
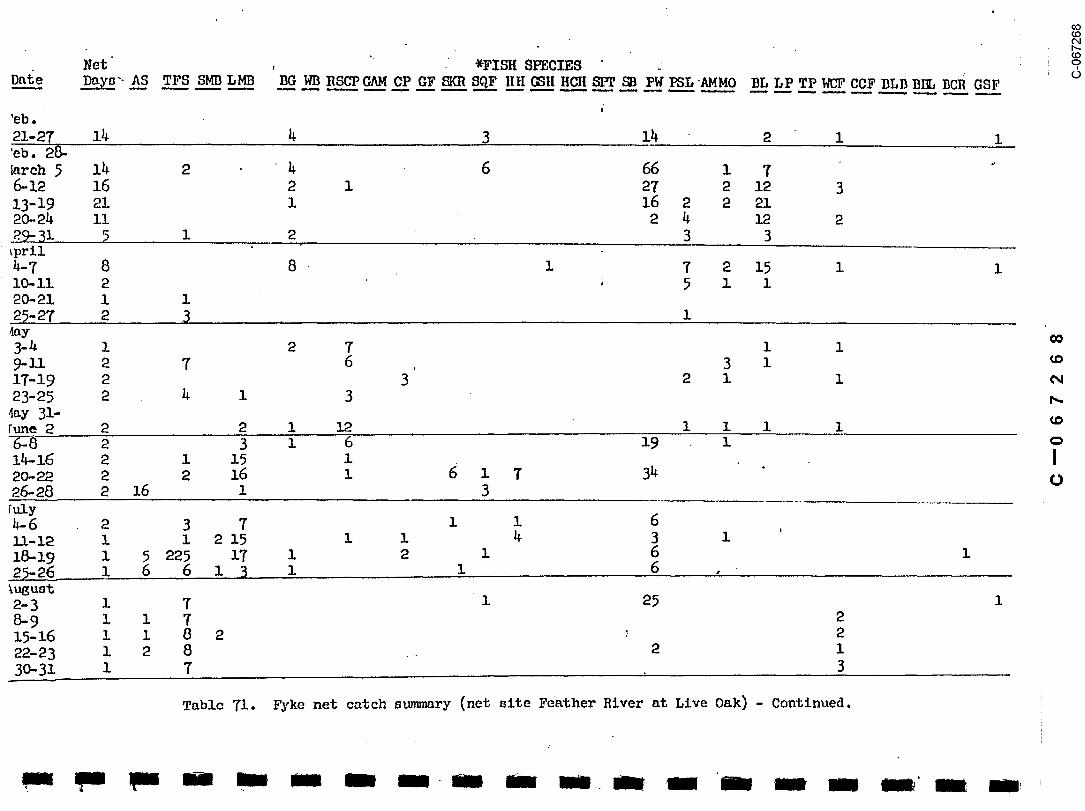
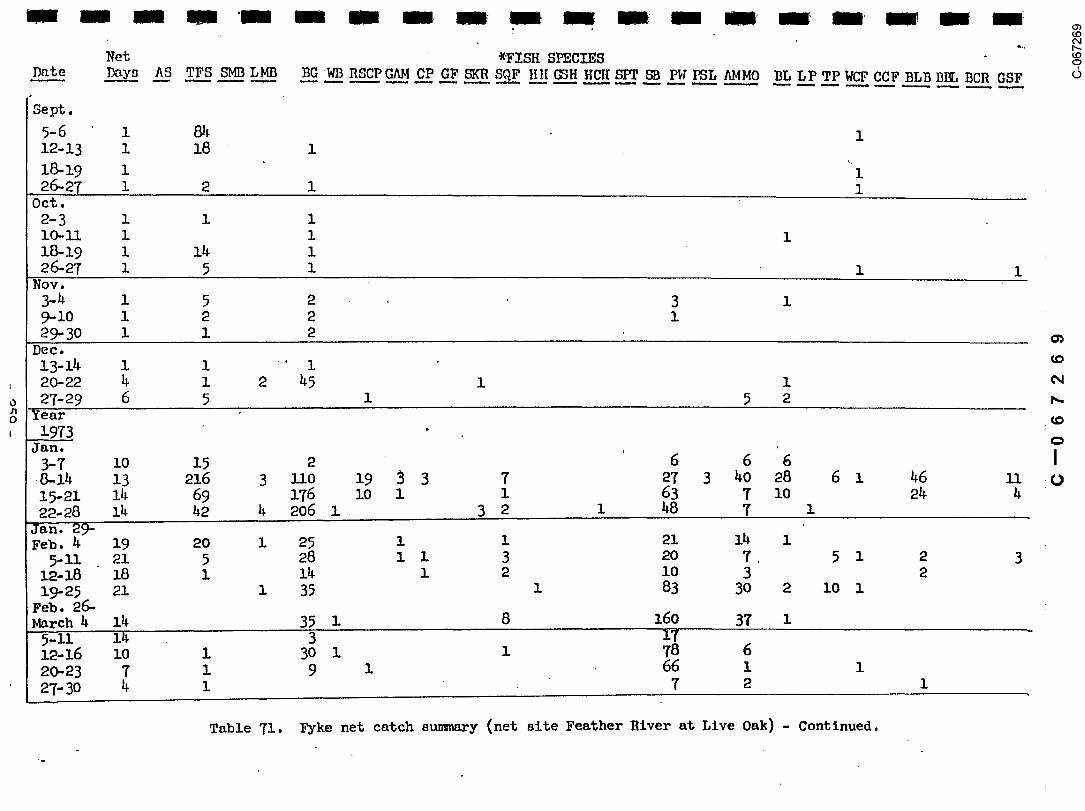
Table 71. Fyke net catch summary (net site F~ather River at Live Oak).
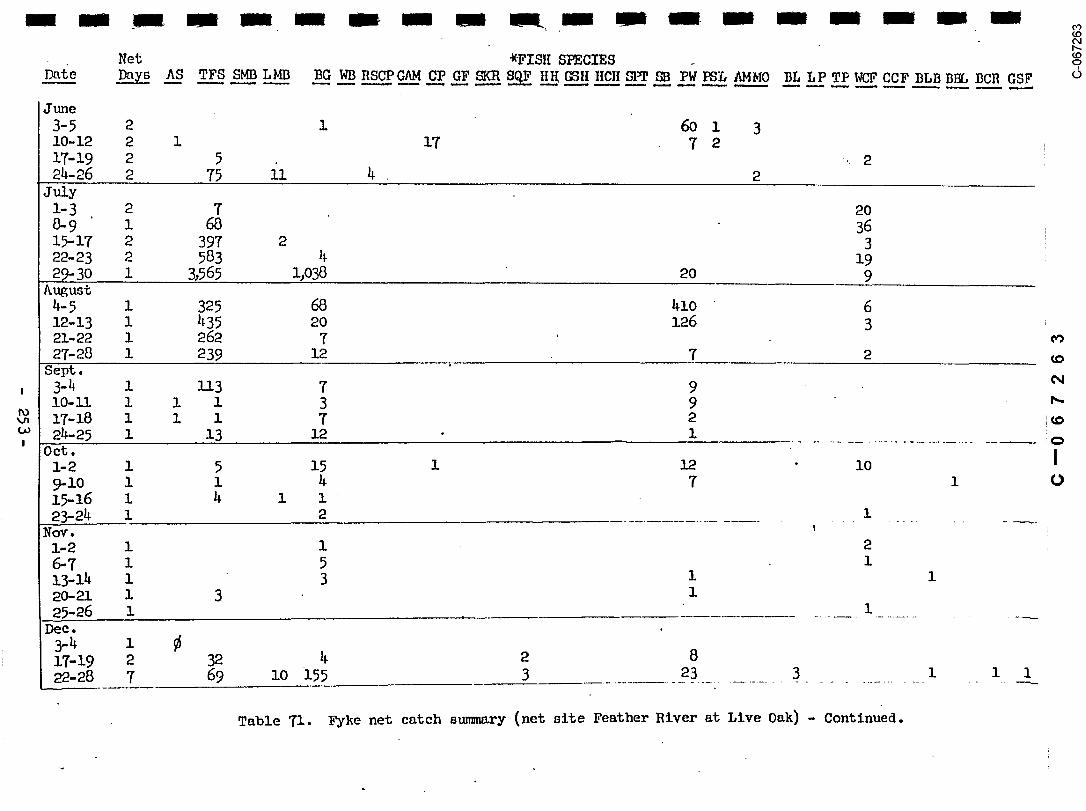
Table 71. Fyke net catch summary (net site Feather River at Live Oak) - Continued.

Net *FISIt SPECIESDa~_~e D~s
Year197o
Dec. 291969-
Jan.
5-8 ~0 l, 5~ ~ 544 3 5 199 5 ~ 3 1 3~-z8 ~ 35 ~ ZOT z z ~ 8 57 39 ~ 4
Jan. 2~Feb. 1 14 lO 41 2 1 ~0 1
2-8 13 105 ~ 131 3 36 8 1 1~15 i~ 494 1 3 ~ ~ 49 1 3 ii~2 14 67 39 3 41 123-27 i0 32 18 1 1 16 1 I 3
~rch2-6 8 9 32 35~z3 8 7z~o 8~3-27 8
M~ch 3~April 3 8 15 ~6 ~6 l ~ o
~zoZ3-Z7 8~24
April~y z
5-7 ~ z9 ? 4
l~el e 31 e lO 3~e8 2 2
~z~ e z 45 2 30. ,z~z82~-25 2 1 2 1 ~ 19
J~e 3~J~y 2 2 26 1 1 12 T9
Table 71. Fyke net catch summary (net site Feather River at Live Oak) - Continued.
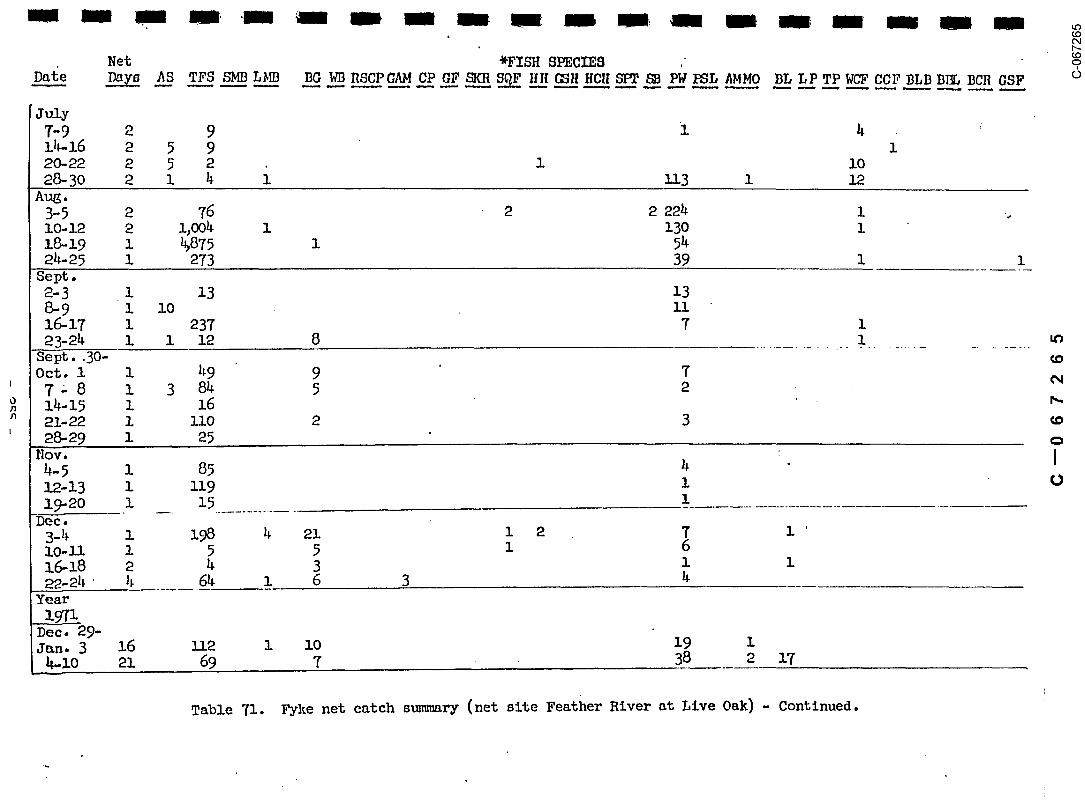
Table 71. Fyke net catch summary (net site Feather River at Live Oak) - Continued.

Net , *FISH SPECIES)aZe D~s\. AS TFS SMB LMB BG WB RSCPGAM CP OF ~ ~ HII ~H IICH ~ ~ PW
fan.
~-~7 ~9 6 6 ~ ~ ~ ~o
eS- 3~ 23 e 7~ ~3 7o ~6 8~b’.~-7 ~8 3 1 3~3 13 263 9 8~ ~8 ~0 ~ ~9 ~ 2 ~ 1
22-28 ~ ~ ~ 7 6 1~eb. 2~4~rch 7 28 1 36 7~lk 24 ~ 22 ~9 3 2 115-21 16 ~ 16 54 6 2 15 1 122-2~ 12 4 6 4 3~reh 3~[pril 2 8 1 2’ 6~8 6 6 z z 23i~-15 2 121-22 2 32~29 1 1 ~ 6 "
I~-5 1 2 3
z~z9 $ 2 ~ 3o26-27 Z ¯ ~6
2-~ 1 1 1 2 2010-~ 1 117-18 1 1 1 .23-25 1 1 ~:~e 3~
~9 z 2 4I~16 122-23 z 5 6 2 2 32~30 1 3 1 2 1 1 10
Table 71. Fyke net catch summary (net. site Feather River at Live Oak) - Continued.
Net *FISH SPECIES
A~ust5-6 1 12 22 13~-~3 ~ 6 ~8 3 56 ~19-~o 1 3 . e 39 1 e 1e~7 1 e Ii 830-31 1 3 6
Sept.7-8 ~ e14-15 1 1 7 1722-23 1 88 io
Sept. 30-oct. i 1 1 62 1
7-8 1 9
Nov.
17-18 1 ~
~. 30-Dec. i 1 ~~9 1 ~
¯
22-24 6 14 8 3 12~ 3~ 7 ~ ~ 6T 1
Year
4l--9 12 1 18 3 h 1 1 9" 23 - 1i~16 14 1 2 1 i 1 i ~ 13 1
17-23 ~ 8 ? 1 3e~3o I~ 3 1 ? I 1 3 ?
Jan. 31Feb. 6 i~ ii ~ 3 3 ~ 6
7-~3 ~ ~ 7~ ~ ~ 8 ~6 20 e9 ~0i~-20 ~ ~ 3 1 e 13
Table 71. Fyke net catch summary (net site,Feather River at Live Oak) - Continued.
*FISH SPECIES ’~D~e
’eb,
’cb. 2~~arch 5~12 16 2 i 27 2 1213-192~2~ ii 2 ~ 12 2
~prll8 8
2~21 1 1
~Y
17-1923-25 2
~ay[~e 2 2 2 i ~ i i i i
a~2~a~8 ~ ~6 ~ 3[~y~6 ~ 3 7 1 1 6
9~-~6~ust2-3 1 7 1 25
15-16 i 1 8 ~ ~ 2
22-23 i 2 8 ~ i
3@3~ ~ 7 3
Table 71. Fyke net catch s~ary (net site Feather River at Live Oak) - Continued.
Net *FISH SPECIESDat_____e Da_ys AS TFS SMB LMB BG WB RSCP GAM OP GF SKR S_~ HH ~H HCH STT SB PW PSL AMMO BL LP TP WCF CCF BLB
Sep%.
5-6 1 ~ 112-13 1 1818-19 1 126-27 1 2 1 1
Oct.2-3 1 1iO-ll 1 1 118-19 1 14 1
NOV ¯3-4 1 5 2 3 19-1o I 2 2 I29- 30 i I 2 o~
Dec.13-14 i i ~ " i20-22 4 I 2 45 i i27-29 6 5 1 5
Year197_~3 "
Jan. ,
15-21 14 69 176 io I i 632e-28 ].~ 42 4 206 i 3 2 1 48
Jail. 29-Feb. ~ 19 20 I 25 i i 21 14 i
5-11 21 5 28 I i 3 2012-18 18 i 14 i 2 I0 3 2
19..25 2,, 1 35 1 83 30Feb. 26-March 4 14 35 1 8 160 37-- 5-]-]- 1~ 3
12-16 1o 1 30 i 1 78 62O-23 T l 9 1 66 1 l
Table 71. Fyke net catch summary (net site Feather River at Live Oak) - Continued.

Net *FISH SPECIES
April
25-27 2 1 , 1 16 h 3 1Aprll 3~ ,~y 6 6 2 1 ll8 2 2
7-13 7 18 ZOz~-~o ? 3 ~ 6 ~921-27 ? ~2 6 1 3 lO 6 1 1 298 2 Z 1
May 2~
zz-z7 4 5o z 3i~24 6 1 2 ~6 2
J~e 25-J~y 1 T 1 160 2 2
2-6 5 1 39 1 1 1 1 13ll-l~ 1 59 35 16 5 lZ?-Z8 Z ~Z Zo ~ 3 Z~5-~6 1 5 I lO 2 1
J~y 31-A~ust 8 l 3 l? 9 l l ~ 9 i lO
7-8 1 8 15 11~15 1 9 3 1 1 e lO 121-22 i I 8 i 2 1 ~ ~ 2
Sept ¯
iI-~ 1 1 19 1 1
~5n~6 z 166 1 1 1Oct.
~ ~I~ ~ple No good
Table 71. Fyke net catch summary (net site Feather River at Live Oak) - Continued.
1,

Net ~FIS~ SPECIESDat__~e D~s AS TFS SMB LMB BG WB RSCP GAM CP GF SKR S_~ HH G~]! HCH
Dec.:2o-~ ~ 3 -.
~ 27-28 i 6 I i i iYear
1974Jan.
3-~ 1 ~6i~ii I 4i~17 i 2 1 .2 12 4 6 I2~25 1 1 i 2
Feb ~7-8 ~ 9 I 2 i~-13 2 i 621-22 2 3 2 i I
Feb" 2~~rch i 2 3 3
7~8 2 6 i 4 i Ii~15 2 i i i21-22 2 i i
_ 2~29 2 2 iiApril
~-5 i i 8 i
May2-3 i i 2 i i ’ i~i0 i i I 23 2 ii~-16 I 19 1 i21-22 i 5 13 2
J~e
ii-12 i 8 27 i2~21 i 6 252~2T i ~ i 36 i
Table 71. Fyke net catch summary (net site Feather River at Live Oak) - Continued.

Net
July:
9-1o 1 2 8 2 1 4617-18 1 2 1 523-24 1 29 1
30-31 1 236 1Aug.
6-7 1 116 1 1 1
28-29 1 ll9 1 1
3-h 1 7 111-12 1 7
*See Table 69 for abbreviations to names of fishes; king salmon catch dat~ not included;PW = polliwog, or aquntlc larvae of toad and frogs.
Table ~I. Fyke net catch~summary (net site Feather River at Live Oak) - Continued.
Observed EstimatedNo. No. Catch/
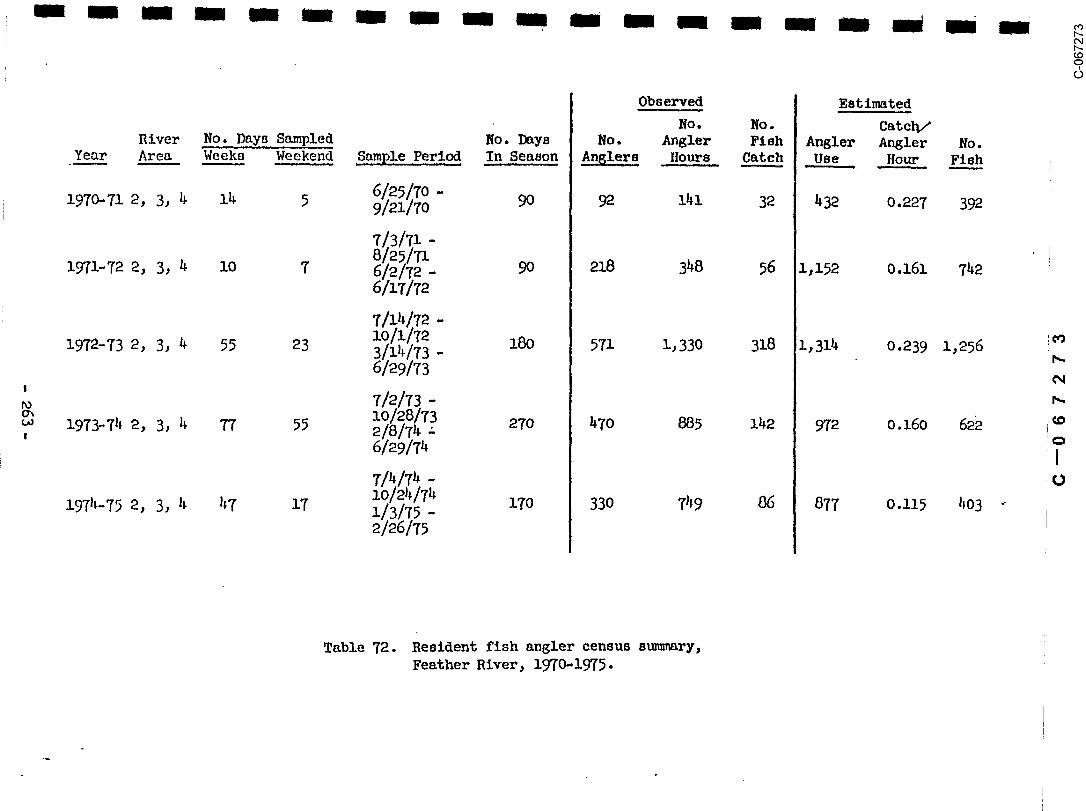
River No ¯ Days Sampled No. Days No. Angler Fish Angler Angler No..Yea___~r Area Weeks Weekend _Sample Period In Season Anglers. Hours. Catc_~h Use Hour Fis___~h
~I~I~o -1970--71 2, 3, 4 14 5 9/21/70 90 9"2 141 32 432 0.227 392
~131~l -812~I~
19~i-72 2, 3, 4 I0 7 6/2/72 - 90 218 348 56 1,152 0.161 7b,26/~-~/~,2
lolll’m1972-?3 2, 3, 4 55 23 3/iI~/T3- 180 57l 1,330 318 1,314 0.239 1,256 :6/29/?3
1973-74 2, 3, 4 77 55 2/8/74 : 270 ~70 885 142 972 0.160 622
6/29/74
71~17~- -i0/24/7~ 17o 330 7~9 86 877 o .i15 ~o3197~-75 2, 3, ~ ~7 17 I/3/75 -
Table 72. Resident fish angler census summary,Feather River, 1970-19?5.

, No. Catch/""Sample No. Angler Catch Angler Fish Catch by Species
Seaso_____~n Date ~ Hours Tota___~lH°ur. L. SB WCF CC_~FI~ SMB BG ST_~HGSF Total
1970-71 6/25/70 - 9"2 14l 32 o.227 2 ~ 2 9 4 9 29/21/7o 32Percent of Tot~ Catch 6.3 ~.5 6.e eS.l le.5 ~8.2 6.e i00~R~t~ted Season Catch 25 49 24 ~0 49 111 24 392
1971-7~ 7/3/71 - 218 3~8 56 o.161 5 ~7 z z e 56
6/2/72 - Percent of Total Catch 8.9 83.9 1.8 1.8 3.6 i0~6/17/72 Esti~ted Season Catch ~ 623 13 13 e7 742
1972- 73 7/14~7~ - 571 i, 330 318 O. ~39 I0 246 3 19 3 37 318~o/~/Te3/14/73 - Percent of Total Catch 3.1 77.4 0.9 6.0 1.0 11.6 i00%
6/29/73 Est~ted Season Catch 39 ~e ii 75 13 146 1,256
i~3-74 7/2/7~ - 470 ~5 14~ 0.160 8 105 2 1 7 17 2 142
~o/~8/732/8/7~- Percent of Total ~tch 5.6 73.9 1.4 0.7 4.9 i~.0-i~5 i0~
6/~9/74 Esti~ted Season Catch 35 4~ 9 4 30 7~ 9 622
i~4-75 7/4/7~ - 330 7~9 ~ 0 .i15 32 25 6 9 12 i i 86
1/3/75- Percent of Total Catch 37.2 29.1 7.0 i0.4 13.9 1.2 1.2 i0~2/26/75" Estimated Season Catch 149 ~8 28 42 56 5 5 403
Table 73. Resident Fish Angler CatchSummary for portions of theyears 1970-1~5~ FeatherRiver.

SEASONAL VALUES OBSERVED ESTIMATEDNo. Days Effective No. No.
No ¯ Days In Sample Fishing No. Angler Fish Catch/River S~mpled Season Season Anglers flours Caught Angler Total Total
Year AreaS~,m~,le~ Periqd
(Wk/Wknd) (W~/Wknd) ~(Wk/Wknd) (Wk/Wknd) (Wk/Wknd) (Wk!Wknd) Hour Anglers Catch
2 9/3- i0/17 5/2 32/13 64/26 II~6/25 bI~./66 5/4 O. 019 2,1941970 3 9/11- 9/21 2/1 6/4 53/22 26/27 80/86 2/1 O. 018 i, 283 93
,,,2 9/.6-10/21 9/2 33/ie 6~/26 206/98 508/329 17/7 0.029 2,740 318
i~71 3 9/18-Iq/7 I/i 13/6 54/21 28/23 i16/112 2/0 0.009 1,995 71
Total 316/128 i~086/472 31/7 - 0.--76~ 5,373
2 8/18-10/19 17/7 44/18 64/26 274/344 407/859 9/64 0.058 2,307 5351972 3 8/19-i0/12 10/4 38/16 ~/21 50/28 109/70 5/e 0.039 417 66
Total 398/377 722/939 __,__ 0.0~3 3, Ii0
2 8/1-11/1 13/12 6~/2.6 6~/26 83/534 ~28/1,393 13/70 0.05P~ X, 967 3261973 3 7/ll-ll/l 15/9 53/22 ~3/ee 269/93~ 898/3,o22 hO/l19 o.o41 3,2~2 531
Not S~mpled
2 7/.12-1o/14 18/10 46/19 64/26 ~34/750 l, 387#,O18 81/91 0.051 3,851 785
~ NoZ ~pled
Table 74. Angler census summ~ry for king salmon in the FeatherRiver, 1970-197~ (angler day assumed to be four hours)

Riffle Riffle Number of CarcassesNumber Name 1971 1972 197~3 1974 Total Percent
1 Hatchery 785 580 917 269 2,751 6.642 Auditorium 1,979 l, 527 2,115 952 6,593 15.913 Bedrock 2,474 2,293 3,917 2,199 11,083 26.744 " Matthews l, 7]-I 1,637 2,723 1,543 7,614 18.375 A!lex 746 920 1,433 983 4,082 9.856 Great Western 349 682 759 4527 Robinson 648 542 781 512 2, h83 5 -998 Steep 256 253 388 5k5 1,2~2 3.489 Weir 992 545 553 521 2,611 6.30
l0 Gateway 126 165 ]28 ]21 540 1.3____~0Totals 10,066 9,364 13,714 8,297 41,241 100%
Table 75. Distribution of f ]a!l-run kingsalmon carcasses in the low-flowreach of the Feather River,
!Area Area Number of Carcasses
Number Name 1971 ~ ~ 1974 Total Percent
Sutter Butte 209 247 229 ~57 1,142 7.5312 Conveyor Belt 394 391 392 780 i, 957 12.903 Hour Riffle 981 ~ 1,268 1,095 1,311 4,655 30.694 Kister and Goose 452 607 ~24 1,102 2,585 17.045 Big 518 689 757 552 2,516 16.596 Korse Shoe 56__3 6.___~ 37.~3746 2,3!4,. 15.25
Total " 3,117 3,83~ 3,270 ~,948 15.,169 I00.00
Table 76. Distribution of f-~ll-run kingsalmon carcasses from ThermalltoRiver Outlet to Grldley Bridge,
266
C--067276(3-067276

Ar~a Area N~mber of CarcassesNumber Name 1973 197___~4 Tota! Percent1971
i Grldley Bridge 233 287 228 174 922 4~o26
2 ; Duck Pond 165 271 208 154 7~ 38.31
3 Herri~ger 71 9__! 9__~5 i0_~6 363 17. £ 3Total 469 649 531 43~ 2,083 100.O0
Table 77. Distribution of fall-run kimgsalmom carcasses from Grldley
to Honcut 1971-197~ ¯Bridge Creek,
Number Redds Eggs GrossLocation .. Sampled Sac Fry Liv__..~eDe__ad Survival
Dewatered Redds i0 I0 200 58 78.4
Submerged Redds 13 46 26 2 97.3
Table 78. King salmon egg and sac frysurvival in dewatered andsubmerged redds from BigRiffle December 7, 1972.
C--067277C-067277

No. Yearlings No. Yearlings No. Fry No. Yearlings No. EmptyDate Location Sampled ~ith K.S. Fry Found with Insects Stomachs
.i/21 Gridley Bridge l0 8 23 0 2I/21 Live Oak II 2 5 9 2I/2~ Grldley Bridge 9 4 4 9 OI f24 Live Oak ii 6 ll I0 0i f25 Live Oak i0 7 27 6 0i ~27 Live Oak i0 7 13 i0 0i ~28 Live Oak 6 3 4 6 0i ~29 Live Oak i0 5 8 7 !1/30 Live Oak i0 5 12 5 i1/31 Gridley Bridge i0 5 9 3 !2/3 Live Oak i0 6 9 9 02/4 Live Oak l0 5 7 8 02/9 Gridley Bridge i0 7 13 T 02/11 Live Oak l0 9 24 l0 02/13 Live Oak l0 5 18 9 1
Totals 157 91 209 ll8 ~
Mean 1.3 fry/stomach
Table 79- Stomch analysis of yearlingking salmon, 1972.
No. Marked Total No.Yearlings Yearllugs
Month Planted Planted , Location--November 1971 49,000 368,850 Vance Ave.
December 1971 - 103,250 Vance Ave.
January 1972 - - -
February 1972 59,520 59, 520 Vance Ave.
Totals 108,520 531,620
Table 80. Yearling king salmon releasedinto the Feather River nearOroville - winter !971-72.
- 268-
C--067278C-067278

No. Marked No. Fmrked No. Unmarked EstimatedNo. Days Fry Released Fry Returns Fry Taken at Number
Yea____r Sampled at Gridle~ at Live Oak Live Oak Wild r’Ty
1971 42 43,383 314 - 41.0 million
1972 42 42,767 ll9 - 24.5 million
Table 81. Program summary of marked kingsalmon fry released near GridleyBridge, 1971 and 1972.
Facility EstimatedFish Fish Released Angler Estimated
Facility Year Count From Hatchery Catch Total Run
1963 416 Not in. Operation -416 832196~ 914 " " -914 1,828
Interim1965 434 " " *434 8681966 563 " " *563 1,126-1967 i, 005 None Planted *i, 005 2,0101968 48~ " " -48~ 9681~9 211 " " -~]_l 422
Hatchery 1970 78 403, 5oo *78 1561971 288 1,o57,75o *288 5761972 i, ooo 952, 855 i, 184 2,1841973 712 1,136,369 1,474 2,186
1974 747 414, 9oo 2,858 3, 6o 5
*Angler catch assumed eqtm.l facility count.to collection
Table 82. Summary of adult steelhead counts,hatchery releases of steelhead trout,and angler and total adult fish popu-lation estimates in the Feather River,1963-197~.
269-
C--067279C-067279
0
SEASONAL VALUES OBSERVED ESTIMATEDNo. Days Effective Number Number
No. Days In Sample Fishing Number Angler Fish Catch/"River Sampled Season Season Anglers }[ours Caught Angler Total Total
Yca.~r A~’ea S.am~le,Perlod .(W1~!Wknd) (Wk/Wknd) (Wk/Wknd) (Wk/Wknd) _(~k/Wknd)(Wk/Wknd) Hour Angle.r.s, Catch
1972 1 1/2-4/17/73 12/15 60/30 88/3.2 94/273 209/606 17/23 0.050 i, 269 253to
2 8/19/72-3/24/73 27/i1 147/63 194/76 147/140 282/315 22/35 0.095 2,022 7683 9/2-10/12/.72 10/3 29/12 106/44 51/21 129/67 24/5 0.048 571 1631973 4 9/20-10/4/72 5/0 11/4 44/17 23/O 93/0 35/0 0.376 N.A. N .A.
Totals 0.095 ~ i,~
1973 i 1/2-4/20/73 , . 9/10 77/31 86/34 57/134 99/303 2/12 0.035 997 140to 2 8/26/73-4/20/74 19/17 168/68 192/.78 131/229 292/481 15/40 0.071 2,378 675
1974 3 8/26-10/28/73 9/10 45/19 106/44 63/117 209/380 14/63 0.131 ~ 6594 NOT SAMPLED --
~
Totals O.083 ~, 542 l, 47h
1974 1 1/3-2/26/75. 10/5 16/8 86/34 67/55 110/75 6/11 0.092 950 350to 2 8/2/74-2/26/75 22/1~ 138/68 192/78 162/338 368/870 32/122 0.12~ 3,297 1,635
3 8/7-10/24/74 8/8 54/27 106/44 5~/121 165/476 23/78 0.158 ~ 8731975 4 ~ ~~ --Totals 0.132 5,627 2,858
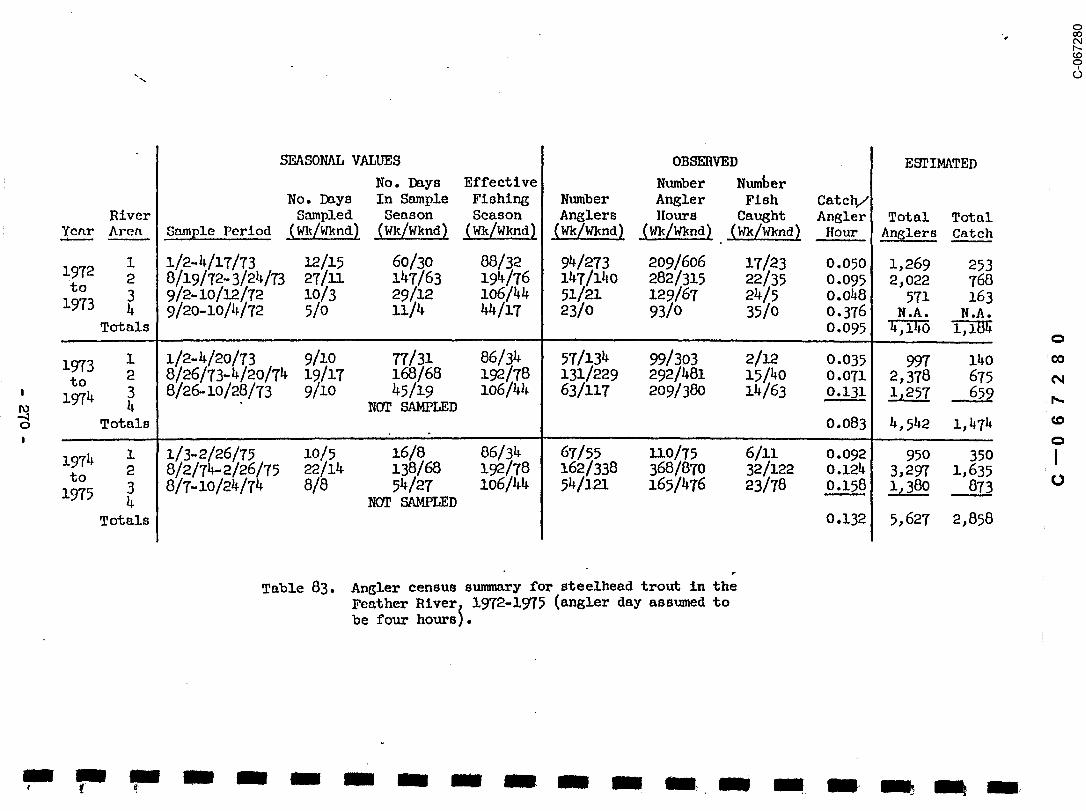
Table 83. Angler census summmry for steelhead trout in the
Feather River~ 1972-1975 (angler day assumed tobe four hours).
Briggs, John C. 1953. The Behavior and Reproduction of SalmonidFishes in a Small Coastal Stream. Calif. Fish stud Game,Fish Bull. 9~, pp. i-6~.
Harol~ and Richard Gakkala. 1960. AA., G. ComparativeStudy of Unstable and Stable (Artiflcal Channel) SpawningStreams for Incubating King Salmon at Mill Creek. Calif.Dept. Fish G e,
Kier, Wm. 196£. The Stream Flow Requirements of Salmon inLower FeaZhe~ River, BuZte CountM, California Dept. ofFish and Game, WaZer Pro~. Br. Offlee Rep~., pp. 17.
Leach, Glen C. 19~. A~ifical propa~atlon of shad. RepZ. U.S.Comm. Fish. 19~4:4~9-~86.
Le~geZt, W. C.~ and R. P. WhltneM. 1972. Water Tempe~ture and %heM~atlons of American S~ad. Fisher~ Bull. Fish. Wildl.Serv. U.S. 70 (3): 65~670.
McNeil, W.J. 196~. A Method of Me~surlng MortalltM of PinkSalmo~ E~s ~d I~we. U.S.F.W.S., Fish. Bull., 63(3):
Meekin, T. K. 1965. Observ~tlons of Exposed F~ll Chinook ReddsBelow Chief Joseph Imm Du~in~ Periods of Low Flow. Wash.Dep%. Fish. l~rocessed RepZ., p. 25.
MoMle, Peter B., F~ W. Fisher, ~nd H. W. Li. 197~. MississippiSilversides ~nd Lo~perch in the Sa~smento-San JoaqulnRiver SMstem. Calif. Fish and Game, 60 (3): 1~£-i~9.
Silliman, R. P. 1950. Fluc~uatlons in Abundamce of ColumbiaRiver Chlaook Salmon, O~corhyachus tshaw~sc.h~, 1935-19~5. U.S. Fish 8.nd Wildl. Set., Fish Bull., 51: 363-383.
SMkes, J. E., sad B. A. Lehman. 195Y. Past and Present DelawareRiver Shad Fisher,j and Co~slde~atlons for its Future.U. S. Fish and Wildl. Set., Res. RepZ. No. ~6, pp.
Wsmner, George H. 1955. The Relationship Between Flow andAvailable Sa!m~n Sl~Wnlng Gravel on %he Feather RiverBelow Surfer Butte Dam. Calif. Dept. Fish and Game,M~r. Fish. Br. Office Rept.
C--067281C-067281

Warner, George. 1955. Studies on the Downstream Migration ofYoung Salmon in the Feather River. Dept. of Fish andGame, Mimeo. Rept. p. 5 plus appendices.
Walburg, C. H.~ and P. R. Nichols. 196?. Biology and Management
of the American Shad and Status of the Fisheries, Atlan-~ tic Coast of the United States, 1960. U.S. Fish Wildl.
Ser., Spec. Sci. Rep. Fish 550, 105p.
!
- ~T~ - I
I
C-067282